Attached files
| file | filename |
|---|---|
| 8-K/A - 8-K/A - CIMPRESS plc | d720343d8ka.htm |
| EX-99.3 - EX-99.3 - CIMPRESS plc | d720343dex993.htm |
 Q3
Fiscal Year 2014 Earnings Presentation, Commentary
& Financial Results Supplement
April 29, 2014
Exhibit 99.2 |
 Safe
Harbor Statement 2
This presentation and the accompanying notes contain statements about our future
expectations, plans and prospects of our business that constitute
forward-looking statements for purposes of the safe harbor provisions under the Private
Securities Litigation Reform Act of 1995, including but not limited to our
financial guidance, outlook, expectations, and investment areas for the
fiscal year 2014; the anticipated effects on our business of our strategy, including our pricing
strategy, and investments; and the anticipated development of our business,
markets, and financial results in fiscal 2014 and beyond, including the
performance of the businesses we acquire or invest in. Forward-looking projections and
expectations are inherently uncertain, are based on assumptions and judgments by
management, and may turn out to be wrong. Our actual results may differ
materially from those indicated by these forward-looking statements as a result of
various important factors, including but not limited to flaws in
the assumptions and judgments upon which our projections
and guidance are based; our failure to execute our strategy; our
failure to make the investments in our business that we
plan to make or the failure of those investments to have the effects that we
expect; our failure to identify and address the causes of our revenue
weakness; our failure to acquire new customers and enter new markets, retain our current
customers, and sell more products to current and new customers; our failure to
manage the growth, changes, and complexity of our business and expand our
operations; costs and disruptions caused by acquisitions and strategic
investments; the failure of the businesses we acquire or invest in to perform as
expected; the willingness of purchasers of marketing services and products
to shop online; currency fluctuations that affect our revenues and costs, including the
impact of our currency hedging strategies; unanticipated changes
in our market, customers or business; our failure to
promote and strengthen our brand; the failure of our current and
new marketing channels to attract customers;
competitive pressures; our failure to maintain compliance with the financial
covenants in our revolving credit facility or to pay our debts when due;
costs and judgments resulting from litigation; changes in the laws and regulations or in the
interpretations of laws or regulations to which we are subject, including tax laws,
or the institution of new laws or regulations that affect our business; and
general economic conditions. You can also find other factors described in our
Form
10-Q for the fiscal quarter ended December 31, 2013 and the other documents we
periodically file with the U.S. Securities and Exchange Commission.
|
 Presentation Organization & Call Details
3
Presentation Organization:
•
Q3 FY14 overview
•
Q3 FY14 operating and
financial results
•
FY14 outlook
•
Supplementary information
•
Reconciliation of GAAP to
Non-GAAP results
Live Q&A Session:
•
5:15 p.m. Eastern
•
Link from the IR section of
www.vistaprint.com
•
Hosted by:
Robert Keane
President & CEO
Ernst Teunissen
EVP & CFO |
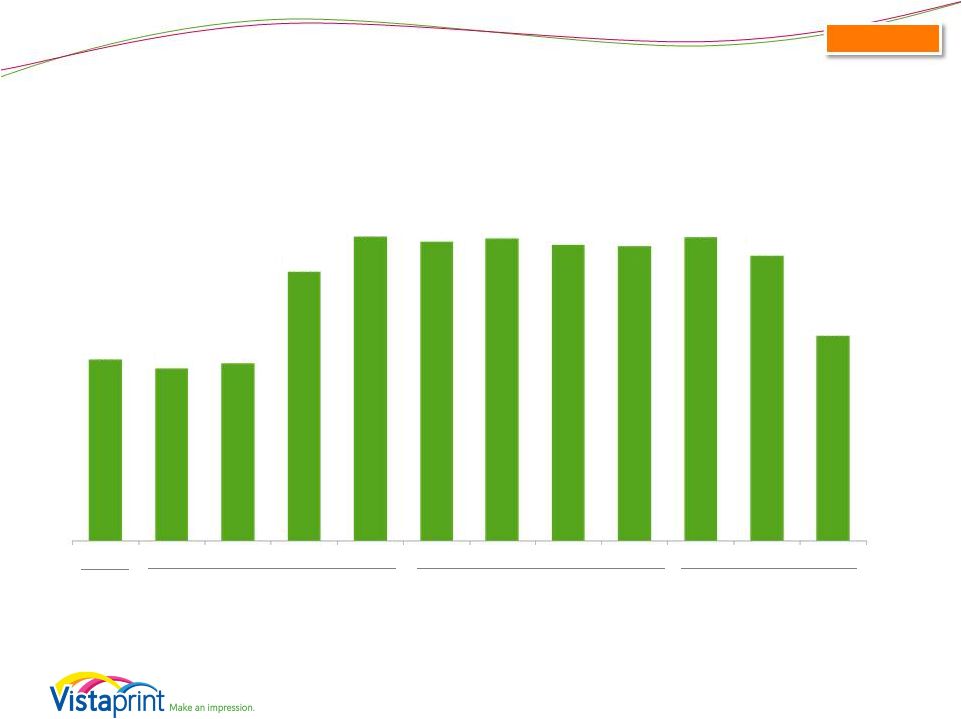
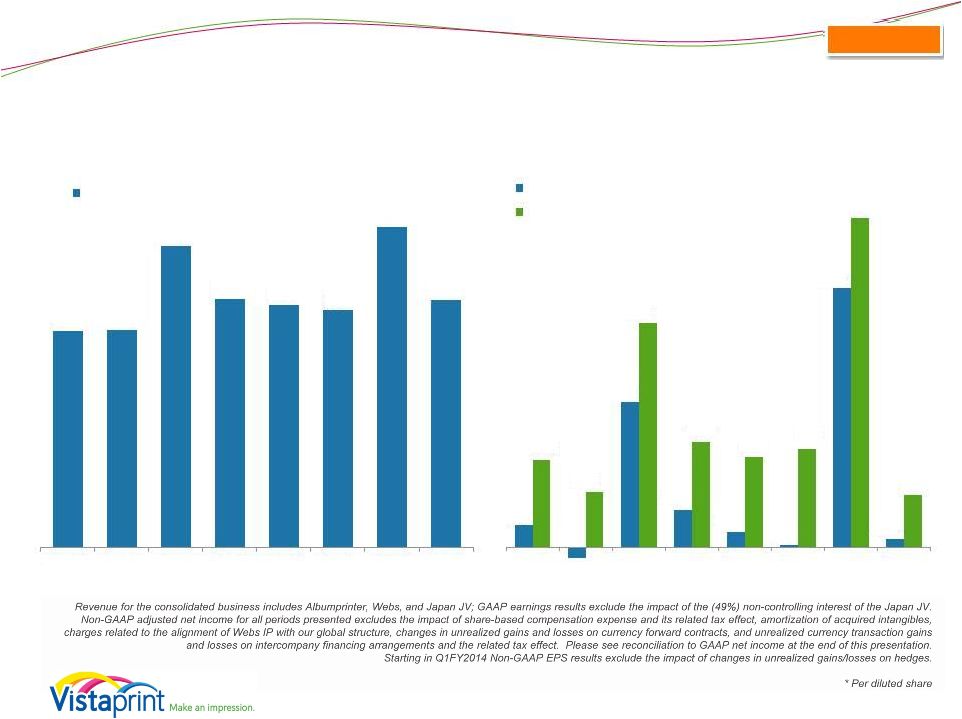 Quarterly Financial Results
$250
$251
$348
$288
$280
$275
$371
$286
Q4 FY12
Q1 FY13
Q2 FY13
Q3 FY13
Q4 FY13
Q1 FY14
Q2 FY14
Q3 FY14
Consolidated Revenue
$0.10
$(0.05)
$0.66
$0.17
$0.07
$0.01
$1.18
$0.04
$0.40
$0.25
$1.02
$0.48
$0.41
$0.45
$1.50
$0.24
Q4 FY12
Q1 FY13
Q2 FY13
Q3 FY13
Q4 FY13
Q1 FY14
Q2 FY14
Q3 FY14
GAAP EPS*
Consolidated
4
Non-GAAP EPS* |
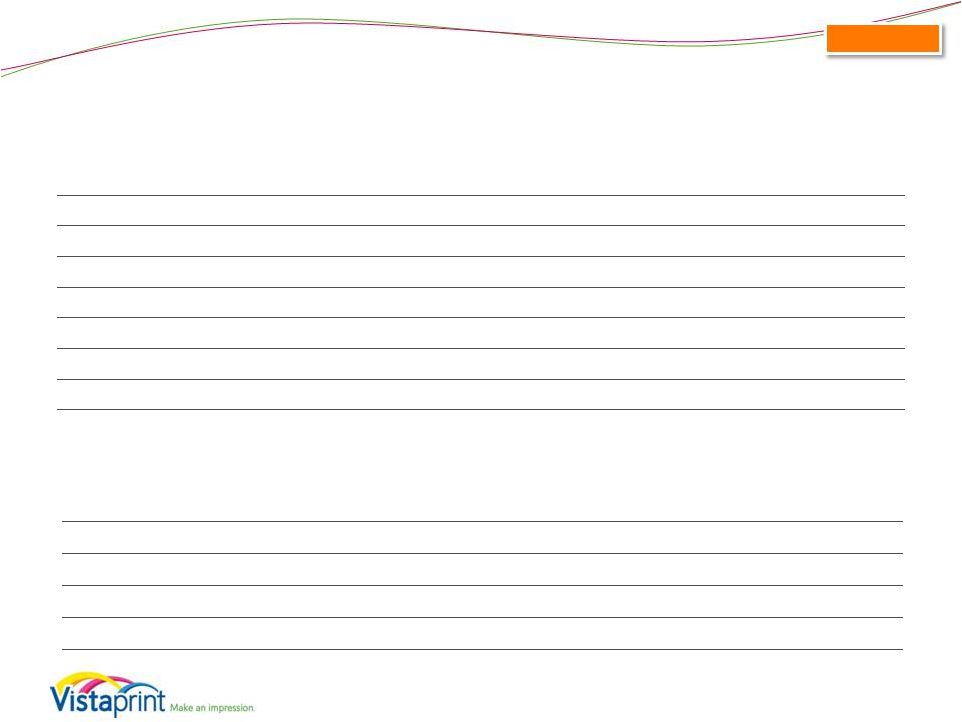
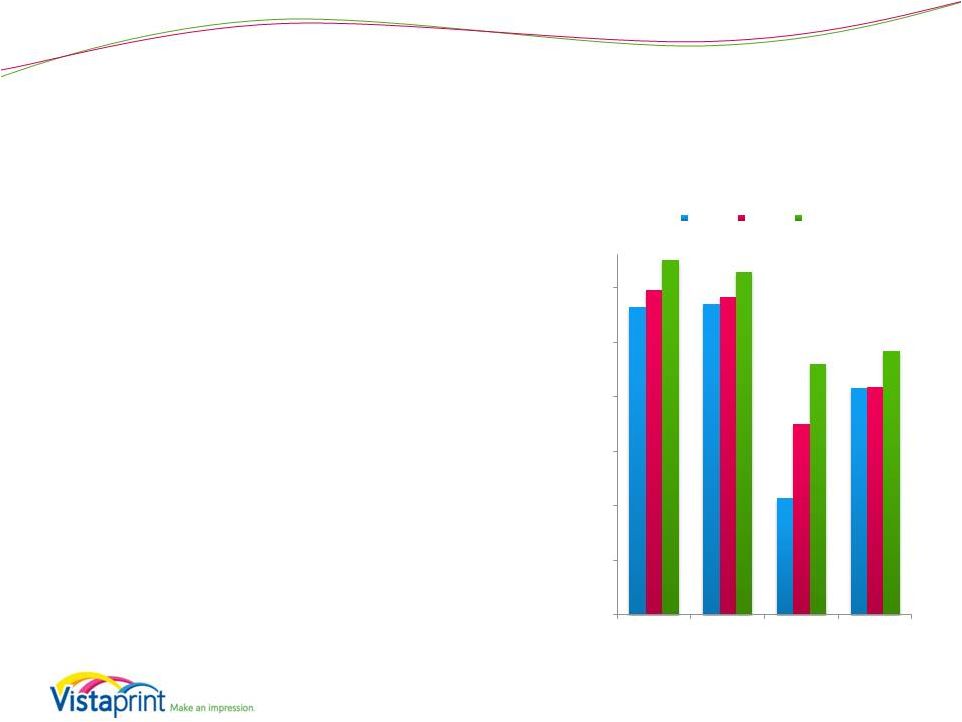 Performance Commentary
5
•
Continue to roll out significant
changes to offers and pricing:
o
US and Germany overhaul
launched early in the quarter
•
Impact was deeper than expected,
particularly in the US
o
Very weak first month, improved
trends in subsequent months
•
Achieving strong NPS improvements
o
Believe this will support a stronger
brand longer term
0%
10%
20%
30%
40%
50%
60%
Canada
USA
Germany
UK
Q3 Net Promoter Score
FY12
FY13
FY14 |
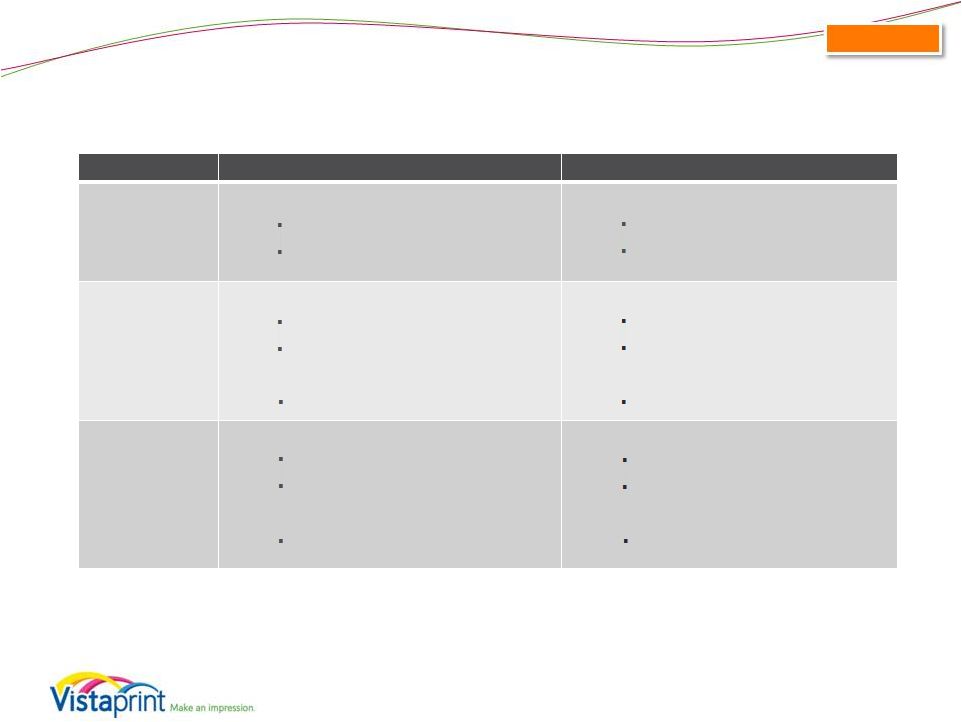
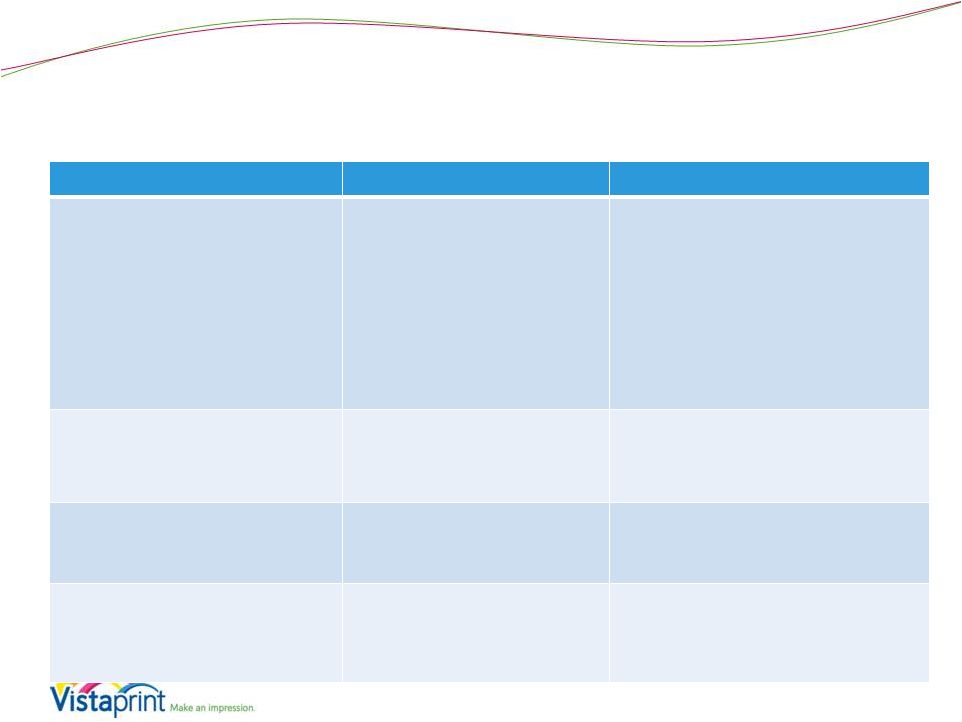 Pricing & Channel Coordination Actions
6
Action
Why do it?
Short-Term Impact
Lower list prices while lowering
discounting
•
Meet higher expectations
desire for consistent
pricing
•
Makes sales and
promotions more
authentic when they do
happen
•
Drives lower engagement in
long-standing discount
channels: users are no longer
enticed by slashed prices or
constant flash sales
•
Attracts fewer new customers
albeit with higher potential LTV
•
Higher percentage of revenue
attributable to base product
Lower and more transparent
shipping prices
•
Clarity for customers
•
Brings practices inline
with e-commerce norms
•
Lower percentage of revenue
attributable to shipping
Elimination of many fees and
upsells (e.g. uploads, proofs)
•
Reduces customer
frustration
•
Lower revenue of high margin
items
More consistent promotions
•
More consistent
experience across
channels and customer
touch points
•
Lower revenues from those
channels where deep discounts
drove volume |
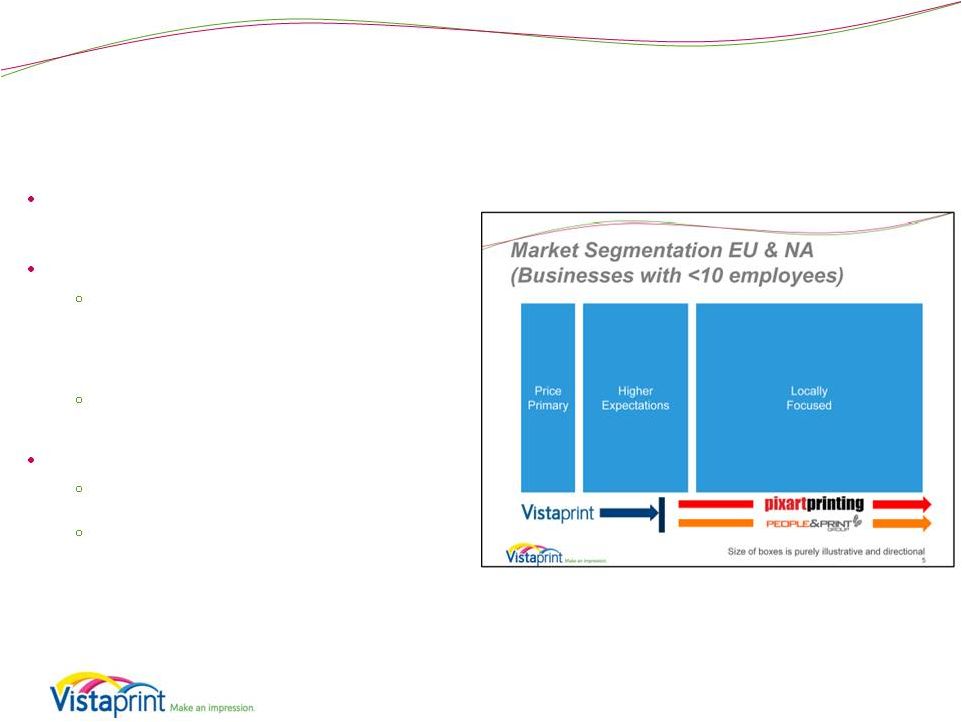 Recent Acquisitions
People & Print Group, Pixartprinting
7
Attractive standalone cash flow return
projections
Distinct front end brands
Target: graphic professionals and local
printers who in turn serve small
businesses via high touch, locally
focused service offering
Will keep customer value proposition
differentiated vs. the Vistaprint brand
Shared back-end advantages
Large scale in small quantities
Anticipate long-term cash flow
improvements due to integration into a
common, software-driven, high-
efficiency manufacturing & supply
chain system |
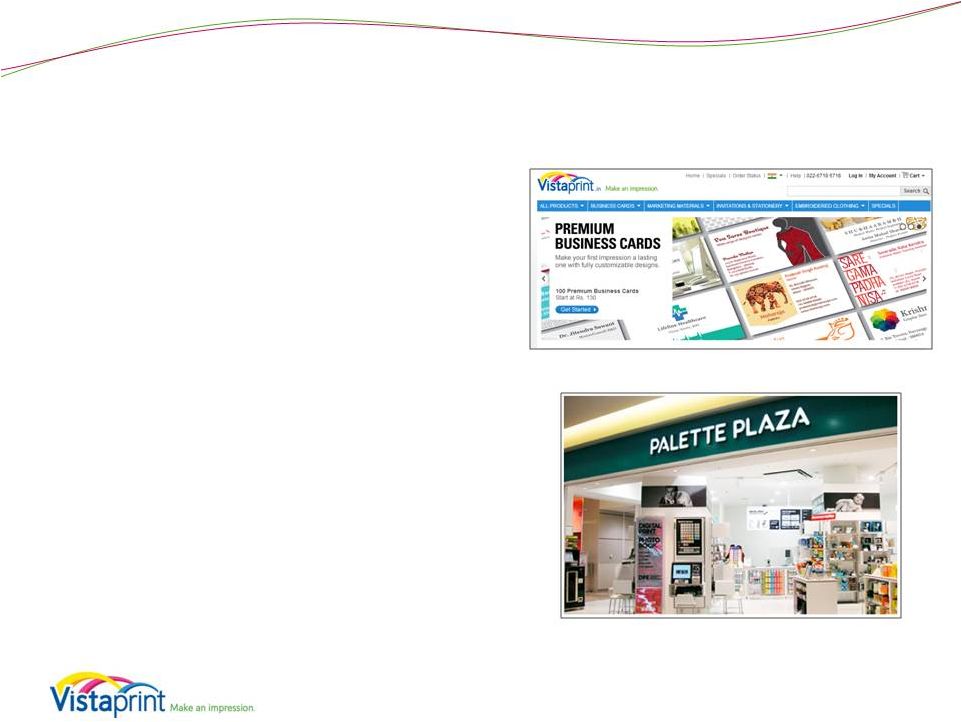 Geographic Expansion: Asia
8
India
•
Strong development and growth
Japan
•
Finalized joint venture
•
Own 51% of venture
o
Plus approximately 17% of the equity of
our partner Plaza Create
•
China
•
Remain committed to the market
•
o
Q4 charge of up to $14M write down of
equity investment
Next 18 months will be focused on building
local manufacturing, service and value
proposition
However, decided to dispose of our
minority investment |
 Q3
FY 2014 Financial and Operating Metrics
9 |
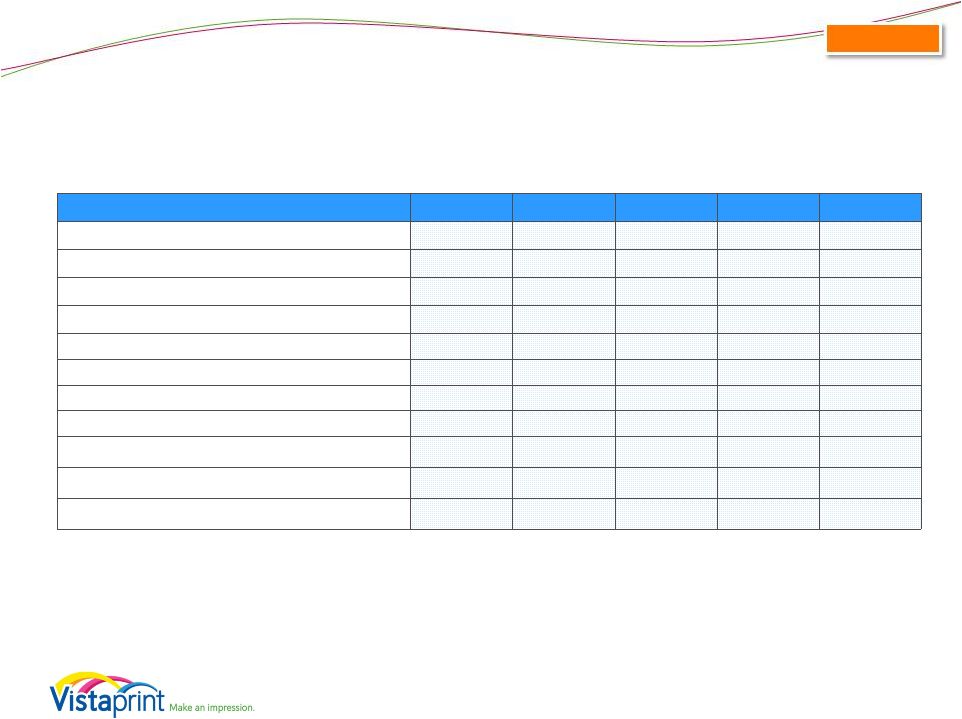
 Q3
FY 2014: Key Financial Metrics 10
*
**
Quarter Ended 03/31/2014
Nine Months Ended 03/31/2014
Revenue
•
$286.2 million
-1% y/y growth
-1% y/y constant currency growth
•
$932.1 million
5% y/y growth
5% y/y constant currency growth
GAAP Net
Income*
•
$1.4 million
•
$0.04 Diluted EPS
decrease of 77% y/y
•
$42.6 million
4.6% net margin vs. 3.1% last year
increase of 57% y/y
•
$1.24 Diluted EPS
increase of 59% y/y
Non-GAAP
Adjusted Net
Income**
•
$8.3 million
•
$0.24 Non-GAAP Diluted EPS
decrease of 50% y/y
•
$77.0 million
8.3% net margin vs. 7.0% last year
increase of 25% y/y
•
$2.20 Non-GAAP Diluted EPS
increase of 26% y/y
Consolidated
0.5% net margin vs. 2.0% last year
decrease of 77% y/y
2.9% net margin vs. 5.9% last year
decrease of 51% y/y
GAAP net income attributable to Vistaprint N.V.
Non-GAAP adjusted net income and non-GAAP adjusted EPS exclude share-based compensation
expense and its related tax effect, amortization of acquired intangible assets, charges
related to the alignment of Webs IP with our global operations, changes in unrealized gains
and losses on currency forward contracts, and unrealized currency transaction gains and losses on intercompany
financing arrangements and the related tax effect. Please see reconciliation to GAAP net income
(loss) and EPS at the end of this presentation.
|
 Cash Flow & ROIC Highlights
Quarterly cash flows and investments (in millions)
Q3FY14
Q3FY13
YTD FY14
YTD FY13
Cash flow from operations
$3.1
$8.1
$98.0
$103.3
Free cash flow*
$(11.7)
$(5.5)
$36.5
$30.8
Capital expenditures
$11.8
$11.2
$54.0M
$66.5
as % of revenue
4.1%
3.9%
5.8%
7.5%
Trailing Twelve Month Return on Invested Capital** (GAAP)
14%
8%
NA
NA
Trailing Twelve Month Return on Invested Capital** (Non-GAAP)
23%
18%
NA
NA
*
**
ROIC = NOPAT / (Debt + Equity –
Excess Cash)
Net operating profit after taxes (NOPAT)
Excess cash is cash and investments of 5% of last twelve month revenues
Operating leases have not been converted to debt
Non-GAAP TTM ROIC excludes share-based compensation expense and its
related tax effect, amortization of acquired intangibles, charges related to
the alignment of Webs IP with our global operations, changes in unrealized gains
and losses on currency forward contracts, and unrealized currency
transaction gains and losses on intercompany financing arrangements and the
related tax effect Excess cash definition updated in period ending
03/31/2013 and for prior periods. 11
Consolidated
Balance sheet (in millions, as of March 31, 2014)
Cash and cash equivalents
$46.5
FCF = Cash Flow from Operations – Capital Expenditures – Purchases of Intangible assets not
related to acquisitions – Capitalized Software Expenses |
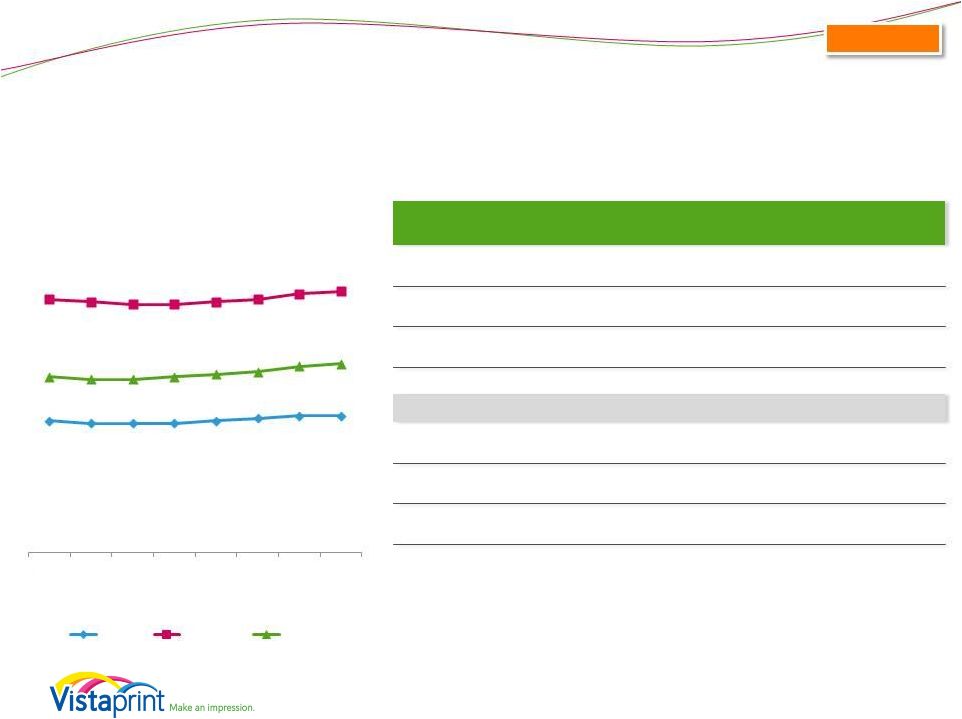
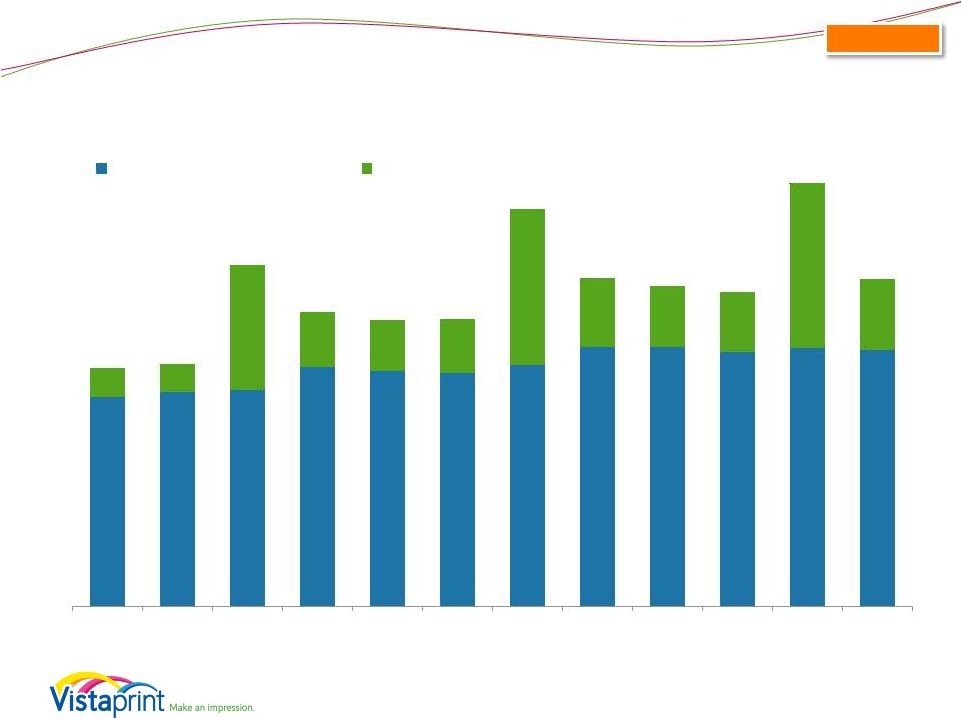
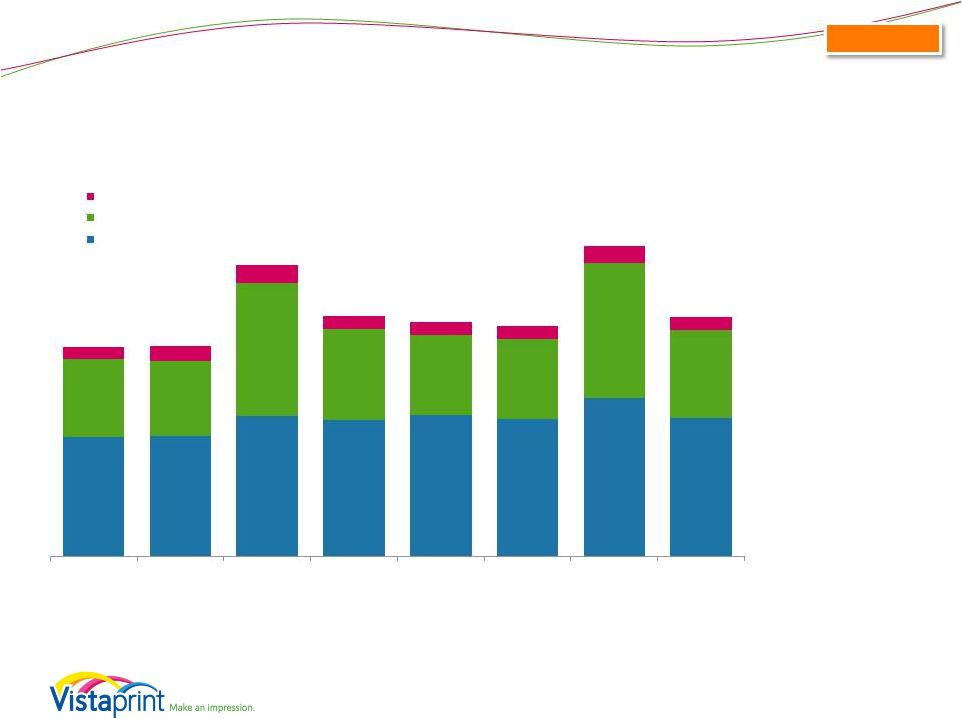 Geographic Segment Revenue -
Quarterly
(millions)
North America:
58% of total revenue
2% y/y growth
3% y/y constant currency
growth
Europe:
36% of total revenue
-4% y/y growth
-7% y/y constant currency
growth
Asia Pacific:
6% of total revenue
-3% y/y growth
10% y/y constant currency
growth
Q3 FY2014
12
Consolidated
$143.4
$144.2
$167.5
$163.0
$169.6
$164.8
$189.4
$166.1
$92.0
$89.7
$159.3
$108.3
$94.9
$94.7
$161.0
$104.2
$15.1
$17.5
$21.5
$16.4
$15.6
$15.6
$20.3
$15.9
Q4 FY12
Q1 FY13
Q2 FY13
Q3 FY13
Q4 FY13
Q1 FY14
Q2 FY14
Q3 FY14
Asia
-Pacific
Europe
North America
Revenue results for the consolidated business, including Albumprinter and Webs results since
respective acquisition dates. All Albumprinter revenue included in European segment. All
Webs revenue included in North American segment. All Japan JV revenue included in Asia-Pacific.
Constant-currency revenue growth is estimated by translating all non-U.S. dollar denominated
revenue generated in the current period using the prior year period’s average exchange
rate for each currency to the U.S. dollar and excludes the impact of gains and losses on effective currency hedges
recognized in revenue for applicable periods.
Please see reconciliation to reported revenue growth rates at the end of this presentation.
|
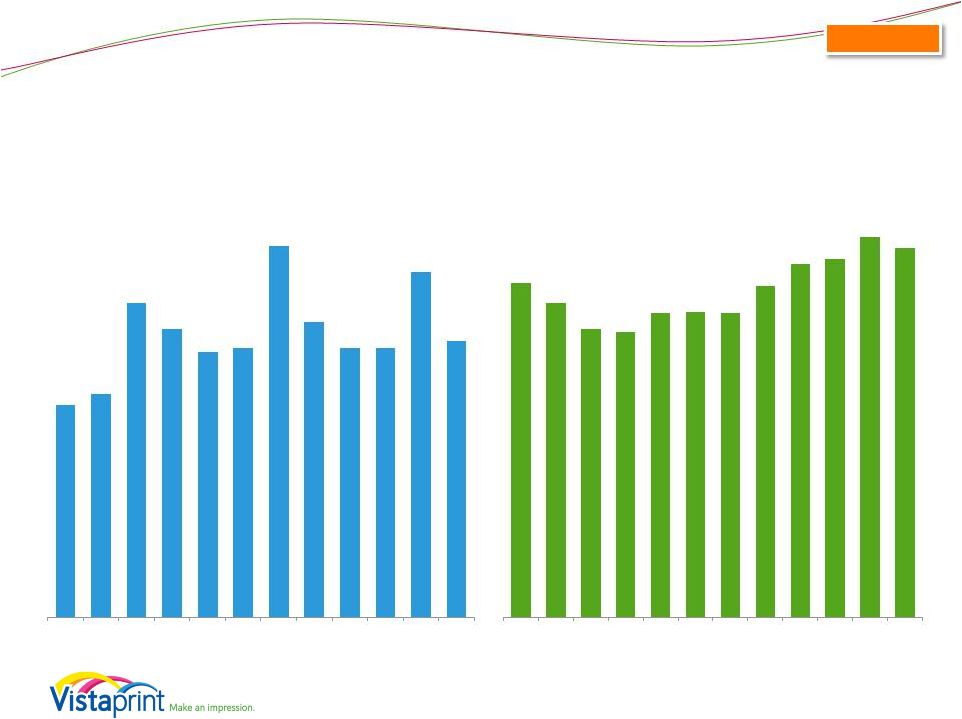 Operational Metrics
(Includes Albumprinter and Webs)
13
Consolidated
*Albumprinter and Webs included starting Q3FY12
Also starting in the same period, a minor calculation methodology change was made
in order to accommodate the consolidation of metrics.
5.6
5.9
8.3
7.6
7.0
7.1
9.8
7.8
7.1
7.1
9.1
7.3
Orders (M)
Q4
FY11
Q1
FY12
Q2
FY12
Q3
FY12*
Q4
FY12
Q1
FY13
Q2
FY13
Q3
FY13
Q4
FY13
Q1
FY14
Q2
FY14
Q3
FY14
$37.75
$36.38
$34.61
$34.43
$35.69
$35.79
$35.72
$37.56
$39.08
$39.40
$40.92
$40.14
Q4
FY11
Q1
FY12
Q2
FY12
Q3
FY12*
Q4
FY12
Q1
FY13
Q2
FY13
Q3
FY13
Q4
FY13
Q1
FY14
Q2
FY14
Q3
FY14
Average Order Value |
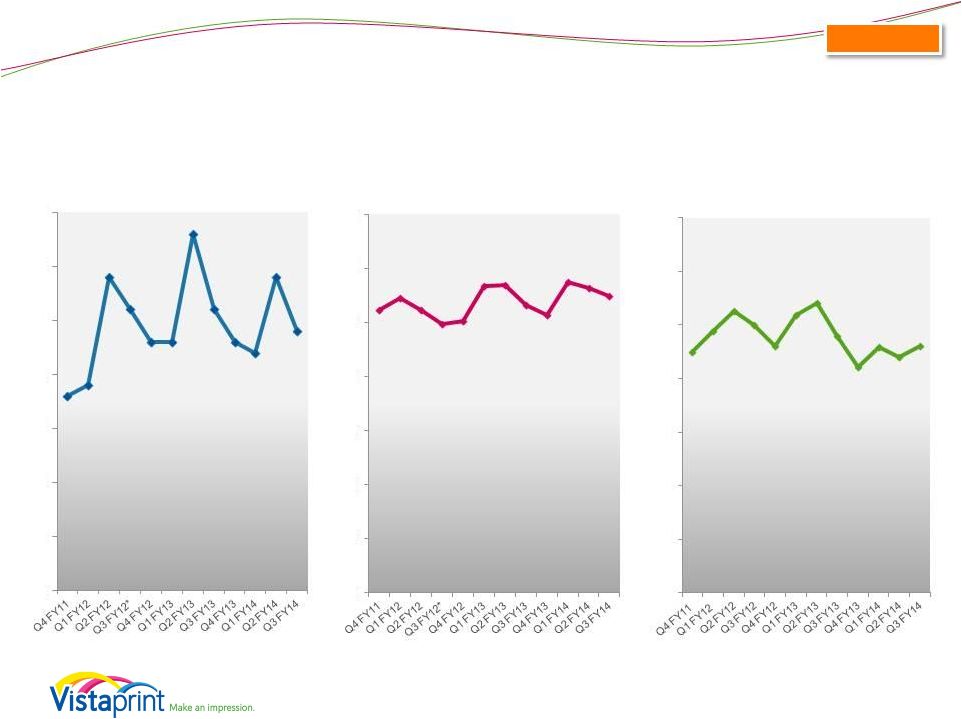 Operational Metrics
(Includes Albumprinter and Webs)
14
*Albumprinter and Webs included starting Q3FY12
Also starting in the same period, a minor calculation methodology change was made
in order to accommodate the consolidation of metrics.
New Customers
(million)
Implied COCA
Advertising as
% of Revenue
1.8
1.9
2.9
2.6
2.3
2.3
3.3
2.6
2.3
2.2
2.9
2.4
0.0
0.5
1.0
1.5
2.0
2.5
3.0
3.5
$26
$27
$26
$25
$25
$28
$28
$27
$26
$29
$28
$27
0 $
5 $
10 $
15 $
20 $
25 $
30 $
35 $
23%
24%
26%
25%
23%
26%
27%
24%
21%
23%
22%
23%
0%
5%
10%
15%
20%
25%
30%
35%
Consolidated |
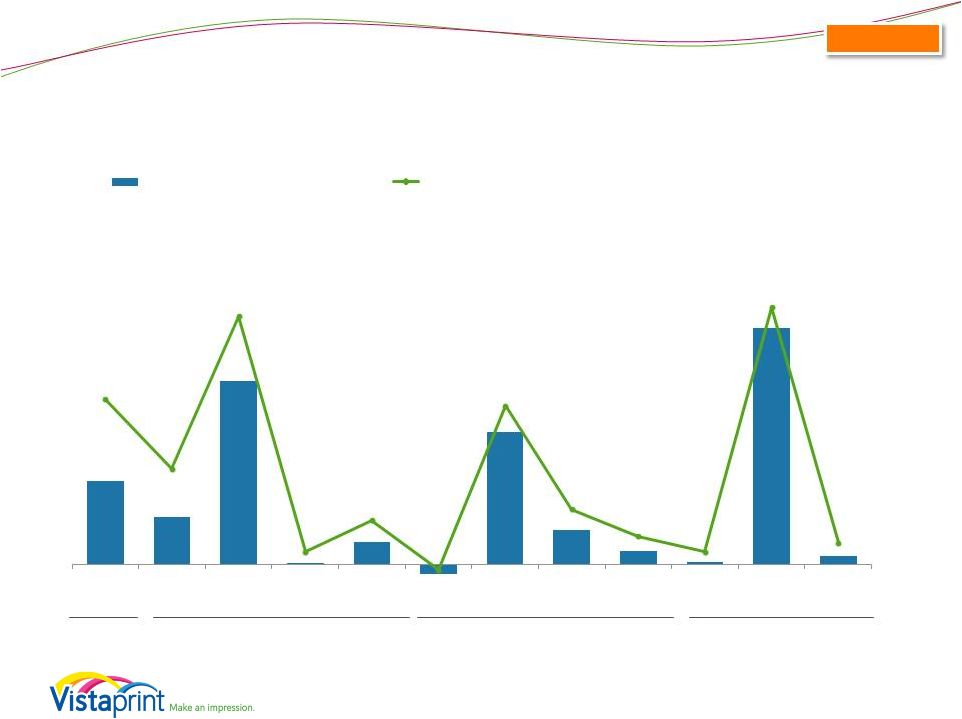
 Historical Revenue Driver Metrics
(Includes Albumprinter and Webs)
15
16.9
*trailing twelve month at period end
16.8
15.0
15.8
16.6
17.0
17.1
16.9
5.4
5.7
6.1
6.4
6.5
6.7
6.9
7.0
9.6
10.1
10.5
10.5
10.5
10.4
10.0
9.8
Q4
FY12
Q1
FY13
Q2
FY13
Q3
FY13
Q4
FY13
Q1
FY14
Q2
FY14
Q3
FY14
TTM* Unique Customers (M)
New Customers Aquired in Period
Customers Repeating from Prior Periods
Q4
FY12
Q1
FY13
Q2
FY13
Q3
FY13
Q4
FY13
Q1
FY14
Q2
FY14
Q3
FY14
TTM Unique Customers (M)
15.0
15.8
16.6
16.9
17.0
17.1
16.9
16.8
TTM New
Customers (M)
9.6
10.1
10.5
10.5
10.5
10.4
10.0
9.8
TTM Repeating Customers (M)
5.4
5.7
6.1
6.4
6.5
6.7
6.9
7.0
As % of Unique Customers
TTM New Customers
64%
64%
63%
62%
62%
61%
59%
58%
TTM Repeating Customers
36%
36%
37%
38%
38%
39%
41%
42%
Y/Y
Growth
TTM Unique Customers
32%
33%
29%
19%
13%
8%
2%
-1%
TTM New
Customers
30%
31%
25%
15%
9%
3%
-5%
-7%
TTM Repeating Customers
34%
35%
37%
25%
20%
18%
13%
9%
Implied
Retention**
47%
48%
48%
45%
43%
42%
42%
41%
**TTM repeating customers as % of year-ago unique customers
Starting in
Q3
FY12, impact of Albumprinter and Webs has been included.
Consolidated |
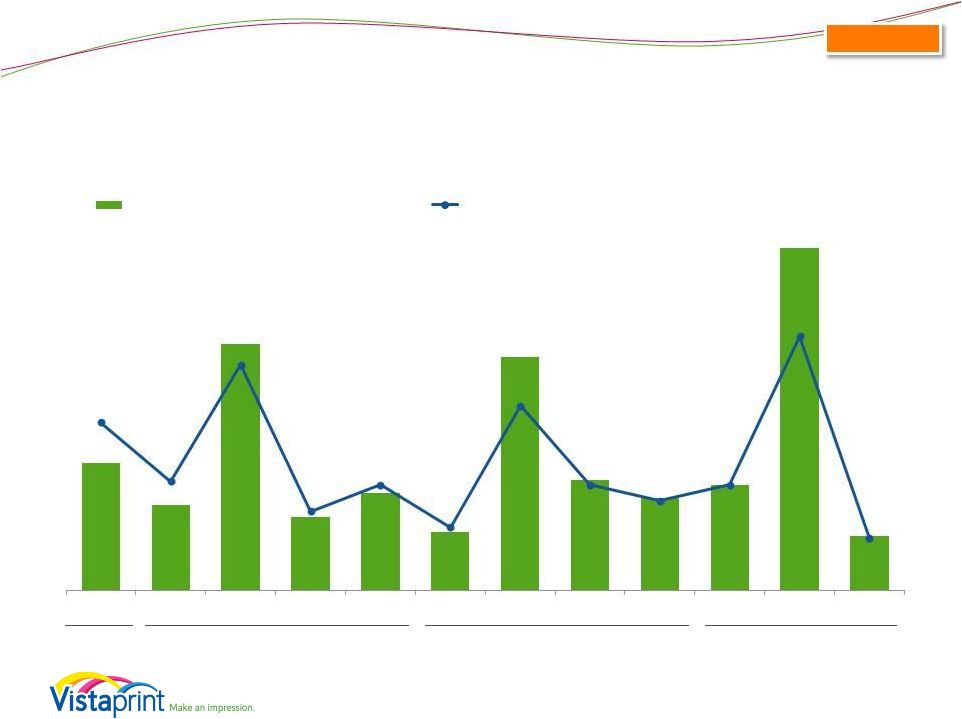
 Historical Revenue Driver Metrics
(Includes Albumprinter and Webs)
16
Average Customer Bookings:
*trailing twelve month at period end
$51
$50
$50
$50
$51
$52
$53
$53
$98
$97
$96
$96
$97
$98
$100
$101
$68
$67
$67
$68
$69
$70
$72
$73
Q4
FY12
Q1
FY13
Q2
FY13
Q3
FY13
Q4
FY13
Q1
FY14
Q2
FY14
Q3
FY14
Average TTM* Bookings Per Unique
Customer (USD)
New
Repeat
Total
Q4
FY12
Q1
FY13
Q2
FY13
Q3
FY13
Q4
FY13
Q1
FY14
Q2
FY14
Q3
FY14
Average
TTM Bookings per
Unique Customer
$68
$67
$67
$68
$69
$70
$72
$73
Average TTM Bookings per
New Customer
$51
$50
$50
$50
$51
$52
$53
$53
Average TTM Bookings per
Repeat
Customer
$98
$97
$96
$96
$97
$98
$100
$101
Y/Y
Growth
Average
TTM Bookings per
Unique
Customer
-6%
-8%
-6%
-1%
1%
4%
7%
7%
Average TTM Bookings per
New Customer
-7%
-9%
-6%
-2%
0%
4%
6%
6%
Average TTM Bookings per
Repeat Customer
-2%
-5%
-4%
-3%
-1%
1%
4%
5%
Starting in
Q3
FY12, impact of Albumprinter and Webs has been included.
Consolidated |
 Looking Ahead
17 |
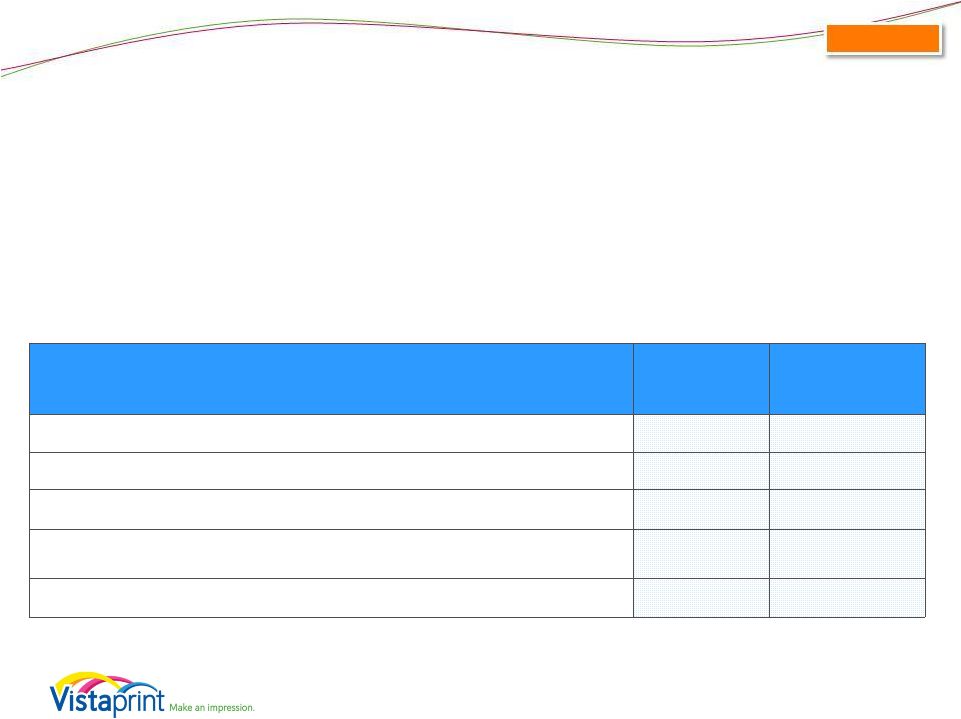
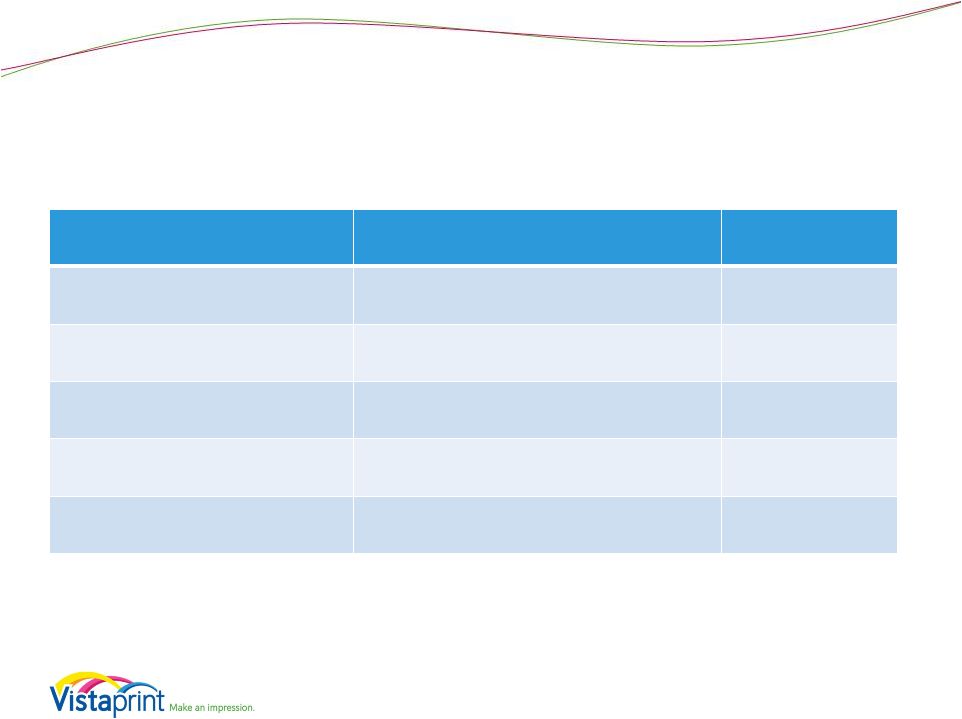 FY
2014 Outlook Commentary (Revenue) 18
Revenue
Reason for Change
Amount
Prior Guidance Midpoint
-
$1250M
Operational outlook lowered
~($27)M +/-
Currency impact
negligible
Revenue from acquisitions
~$37M +/-
New Guidance Midpoint
$1260M |
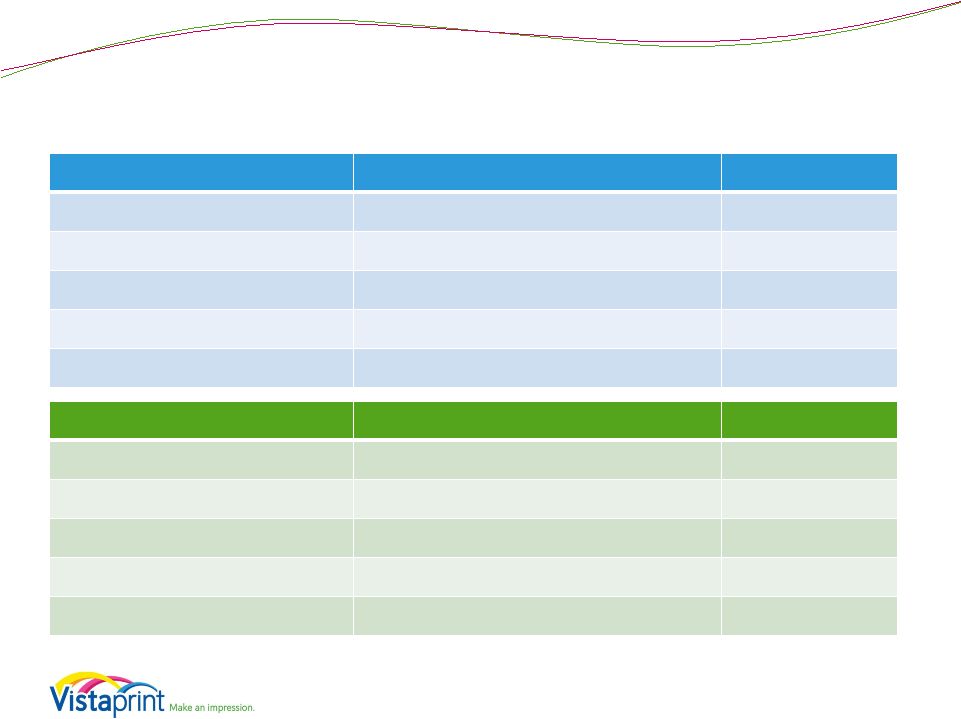 FY
2014 Outlook Commentary (EPS) 19
GAAP EPS
Reason for Change
Amount
Prior Guidance Midpoint
-
$1.68
Operational outlook change
~($0.03) +/-
Dilution from acquisitions
~($0.16) +/-
Write-off of minority investment
~($0.41) +/-
New Guidance Midpoint
$1.08
Non-GAAP EPS
Reason for Change
Amount
Prior Guidance Midpoint
-
$2.81
Operational outlook change
~($0.03) +/-
Dilution from acquisitions
negligible
Write-off of minority investment
excluded
New Guidance Midpoint
$2.78 |
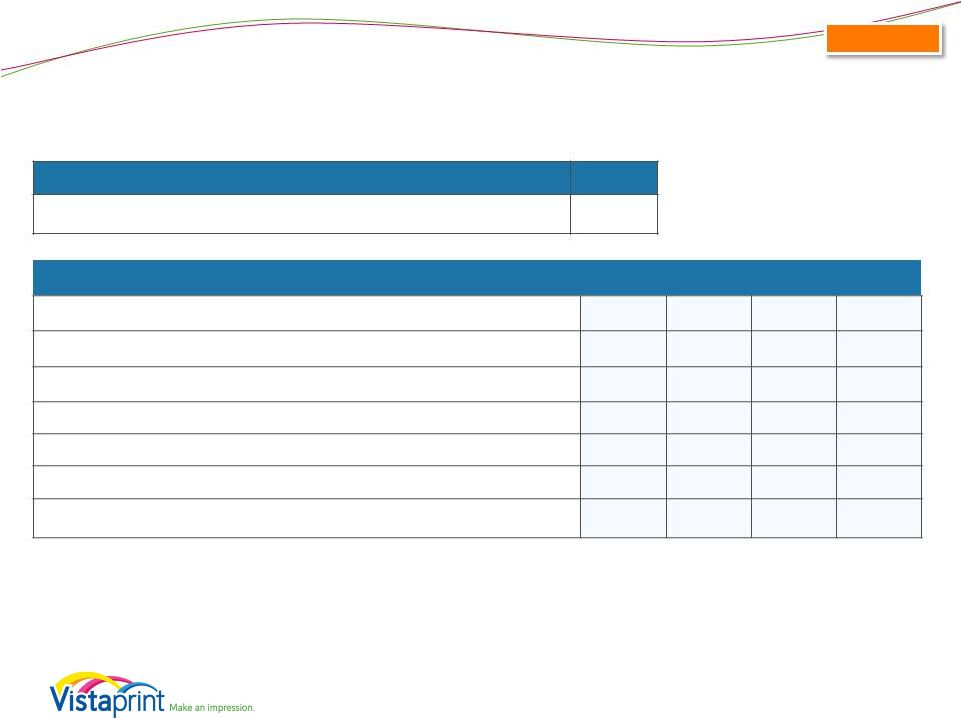
 Revenue and EPS Guidance*
(as of January 29, 2014)
FY14
ending 06/30/2014
Revenue
$1,250 -
$1,270
Revenue growth from FY 2013 period
7% -
9%
Constant currency revenue growth estimate
7% -
9%
Constant currency revenue growth estimate excluding acquisitions
4% -
6%
GAAP EPS
$1.00 -
$1.15
EPS growth from FY 2013 period
18% -
35%
GAAP share count
34.5 million
FY14
ending 06/30/2014
Non-GAAP adjusted EPS
$2.70 -
$2.85
EPS growth from FY 2013 period
26% –
33%
Non-GAAP share count
35.0 million
Non-GAAP exclusions
$59.4
* Millions, except share and per share amounts and as noted
20
Consolidated
The Company is providing the following assumptions to facilitate non-GAAP adjusted net income per
diluted share comparisons that exclude share-based compensation related expenses,
amortization of acquired intangible assets, tax charges related to the alignment of IP with our global operations, changes in
unrealized gains and losses on currency forward contracts, unrealized currency transaction gains and
losses on intercompany financing arrangements, and the expected charge for the disposal of our
minority investment in China: |
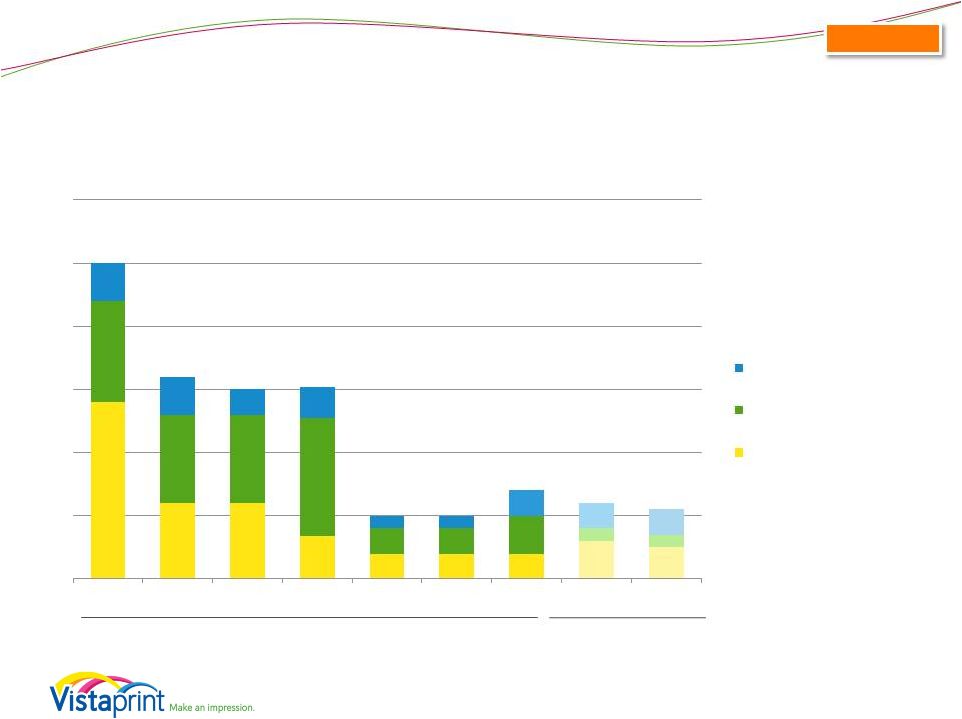 Capital Expenditures Guidance
(as of April 29, 2014)
Expressed as percent of revenue
FY 2014 Guidance:
•
$70M -
$80M
•
Actuals
Guidance
21
Consolidated
$63M
$63M
$76M
$80M
$70M
$101M
$37M
$46M
$79M
14%
6%
6%
3%
2%
2%
2%
3%
3%
8%
7%
7%
9%
2%
2%
3%
1%
1%
3%
3%
2%
3%
1%
1%
2%
2%
2%
FY 07
FY 08
FY 09
FY 10
FY 11
FY 12
FY 13
FY 14-High
FY 14-Low
25%
16%
15%
5%
6%
15%
5%
6%
7%
Other
Land and Facilities
Manufacturing &
Automation Equipment
~6% of revenue
guidance midpoint |
 Summary
•
Focus: strategic initiatives and operational implementation
•
Patient with our slower revenue growth
•
Commitment to:
o
Cash flow return-based investment decisions
o
Investing for long term competitive advantage
o
Belief in the opportunity for
•
Organic growth of revenue
•
Cash flow per share
22 |
 Q&A Session
Please go to the
Investor Relations section of www.vistaprint.com
for the live Q&A call at
5:15 pm EDT on April 29, 2014 |
 Q3
Fiscal Year 2014 Financial and Operating Results Supplement
|
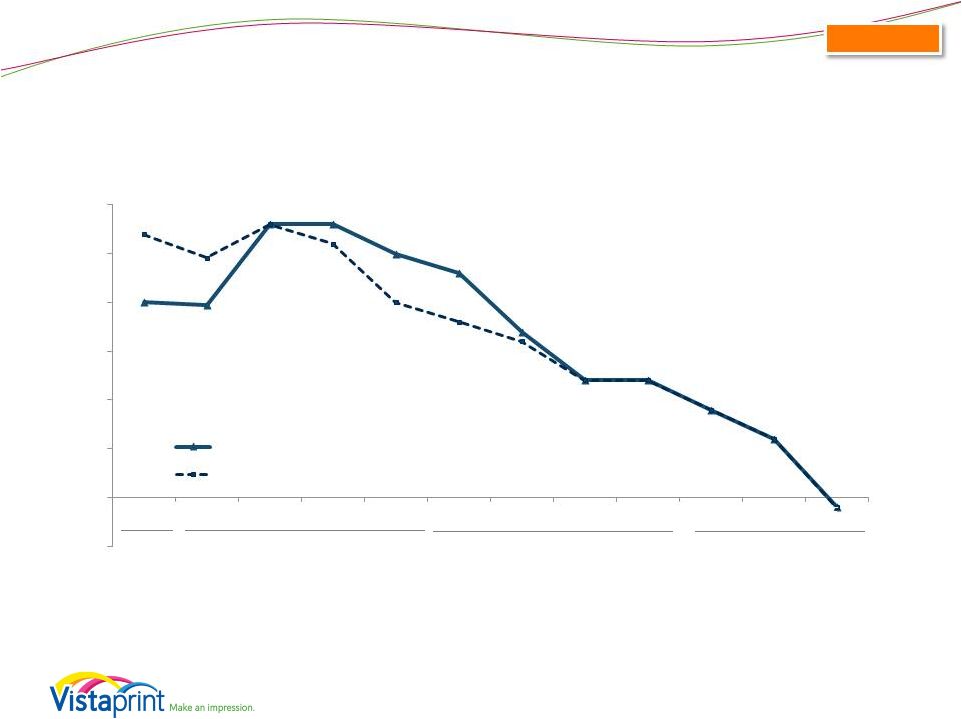 Total Company Growth Rates*
*Starting in Q2FY2012, revenue from acquired companies included.
Please see reconciliation to reported revenue growth rates at the end of this
presentation. -1%
reported
-1%
constant-
currency
25
22% constant-
currency growth
FY11
FY12
25% constant-currency growth
FY13
16% constant-currency growth
Consolidated
YTD FY14
5% constant-currency growth
-5%
0%
5%
10%
15%
20%
25%
30%
Q4 FY11
Q1 FY12
Q2 FY12*
Q3 FY12
Q4 FY12
Q1 FY13
Q2 FY13
Q3 FY13
Q4 FY13
Q1 FY14
Q2 FY14
Q3 FY14
Constant-Currency
Reported
Note: Constant-currency revenue growth is estimated by translating all non-U.S. dollar
denominated revenue generated in the current period using the prior year period’s average
exchange rate for each currency to the U.S. dollar and excludes the impact of gains and losses
on effective currency hedges recognized in revenue for applicable periods. |
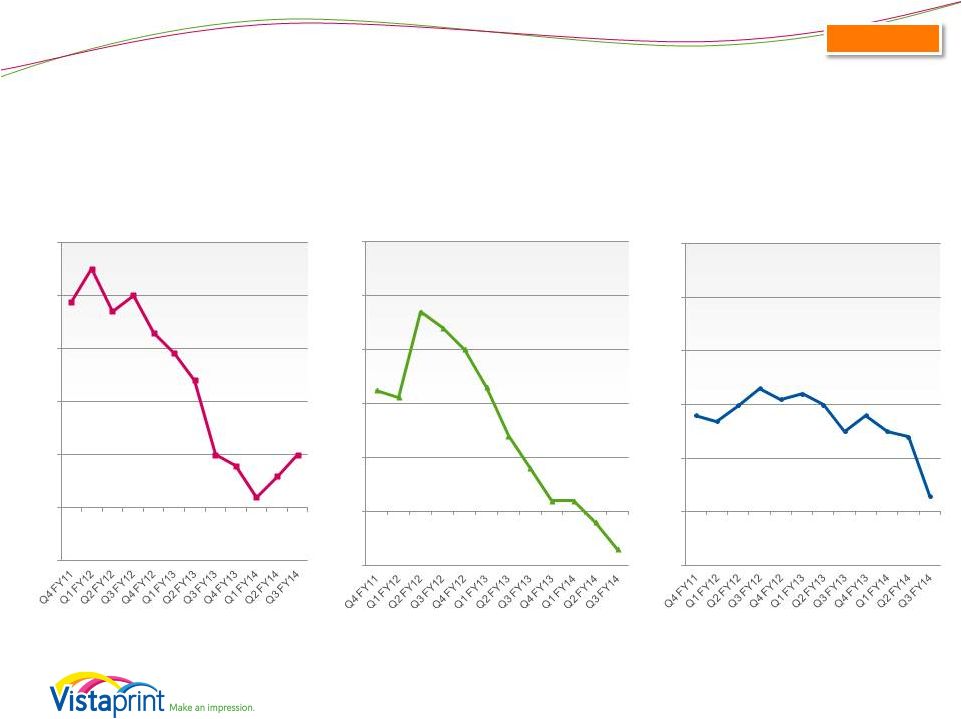 Segment Revenue Growth Rates*
Constant Currency
26
*Starting in Q2FY2012, revenue from acquired companies included.
Please see reconciliation to reported revenue growth rates at the end of this
presentation. Consolidated
Note: Constant-currency revenue growth is estimated by translating all non-U.S. dollar
denominated revenue generated in the current period using the prior year period’s
average exchange rate for each currency to the U.S. dollar and excludes the impact of gains and
losses on effective currency hedges recognized in revenue for applicable periods. 39%
45%
37%
40%
33%
29%
24%
10%
8%
2%
6%
10%
-10%
0%
10%
20%
30%
40%
50%
APAC
22%
21%
37%
34%
30%
23%
14%
8%
2%
2%
-2%
-7%
-10%
0%
10%
20%
30%
40%
50%
Europe
18%
17%
20%
23%
21%
22%
20%
15%
18%
15%
14%
3%
-10%
0%
10%
20%
30%
40%
50%
North America |
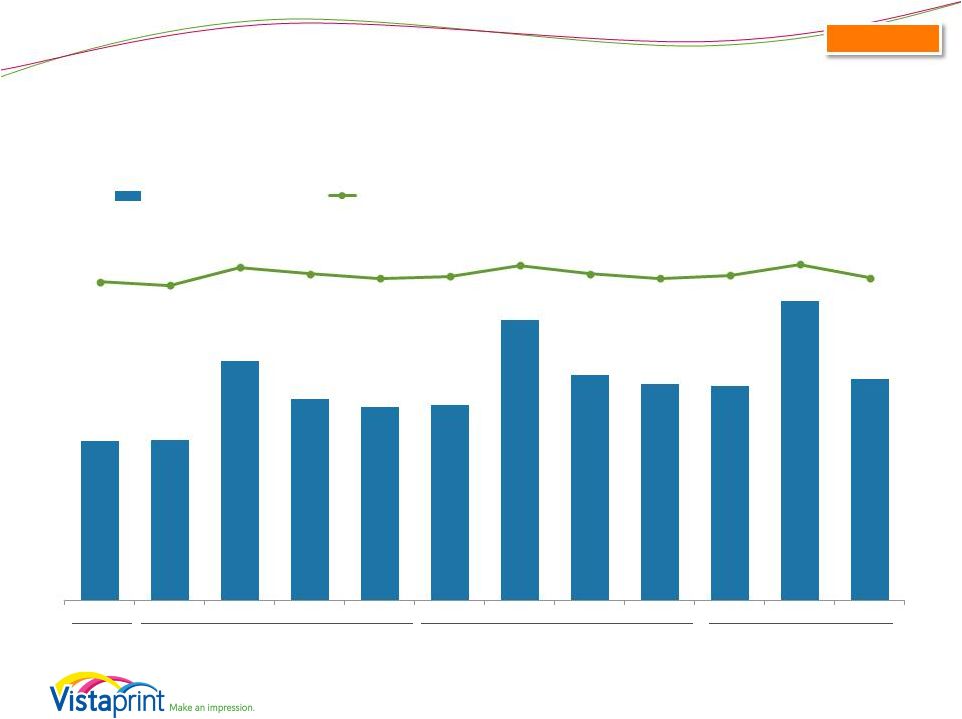 Gross Margin and Gross Profit
27
FY11 64.8%
FY12 65.2%
Consolidated
FY13 65.7%
YTD FY14 65.9%
$133
$134
$200
$169
$162
$163
$234
$189
$181
$179
$250
$185
63.9%
63.2%
66.8%
65.5%
64.6%
65.0%
67.2%
65.5%
64.6%
65.2%
67.4%
64.7%
Q4 FY11
Q1 FY12
Q2 FY12
Q3 FY12
Q4 FY12
Q1 FY13
Q2 FY13
Q3 FY13
Q4 FY13
Q1 FY14
Q2 FY14
Q3 FY14
Gross Profit (millions)
GM % |
 GAAP Net Income (Loss) and Net Margin
28
FY12 $44
Consolidated
FY13 $29
YTD FY14 $43
FY11 $82
$14
$8
$32
$(2)
$23
$6
3.8%
10.6%
0.1%
1.5%
-0.7%
6.6%
2.0%
0.8%
0.1%
11.0%
0.5%
-
Q4 FY11
Q1 FY12
Q2 FY12
Q3 FY12
Q1 FY13
Q2 FY13
Q3 FY13
Q1 FY14
Q2 FY14
GAAP Net Income (loss), in millions
GAAP Net Margin
6.9%
$41
$4
$1
$0
$2
$0
Q4 FY12
Q4 FY13
Q3 FY14 |
 Non-GAAP Adjusted Net Income*
and Non-GAAP Adjusted Net Margin
*Non-GAAP adjusted net income for all periods presented excludes the impact of
share-based compensation expense and its related tax effect,
amortization of acquired intangibles, charges related to the alignment of Webs IP with our global structure,
changes in unrealized gains and losses on currency forward contracts, and
unrealized currency transaction gains and losses on intercompany financing
arrangements and the related tax effect. Please see reconciliation to GAAP net income at the end of this
presentation.
29
FY11 $105
FY12 $77
FY13 $76
YTD FY14 $77
$20
$13
$38
$11
$15
$9
$36
$17
$14
$16
$53
$8
9.4%
6.1%
12.6%
4.4%
5.9%
3.5%
10.3%
5.9%
5.9%
14.2%
2.9%
Q4 FY11
Q1 FY12
Q2 FY12
Q3 FY12
Q4 FY12
Q1 FY13
Q2 FY13
Q3 FY13
Q4 FY13
Q1 FY14
Q2 FY14
Q3 FY14
Non-GAAP Adjusted Net Income (millions)
Non-GAAP Adjusted Net Margin
5.0%
Consolidated |
 Q3
Income Statement Comparison to Prior Year (as a percentage of revenue)
30
Consolidated
1.8%
3.4%
10.0%
9.0%
14.8%
14.9%
38.1%
38.2%
35.3%
34.5%
Q3 FY2014
Q3 FY2013
Cost of revenue
Marketing and selling
Technology and development
General and administrative
Income from operations |
 Q3
Income Statement Comparison to Prior Quarter (as a percentage of
revenue) 31
Consolidated
1.8%
14.2%
10.0%
8.2%
14.8%
11.5%
38.1%
33.5%
35.3%
32.6%
Q3 FY2014
Q2 FY2014
Cost of revenue
Marketing and selling
Technology and development
General and administrative
Income from operations |
 Share-Based Compensation* (millions)
* Share-based compensation (SBC) expense includes SBC-related tax
adjustment. 32
FY11 $22.4
FY12 $26.1
Consolidated
FY13 $33.7
YTD FY14 $22.5
$5.1
$4.9
$5.0
$7.6
$8.6
$8.4
$8.5
$8.4
$8.3
$8.6
$8.1
$5.8
Q4 FY11
Q1 FY12
Q2 FY12
Q3 FY12
Q4 FY12
Q1 FY13
Q2 FY13
Q3 FY13
Q4 FY13
Q1 FY14
Q2 FY14
Q3 FY14 |
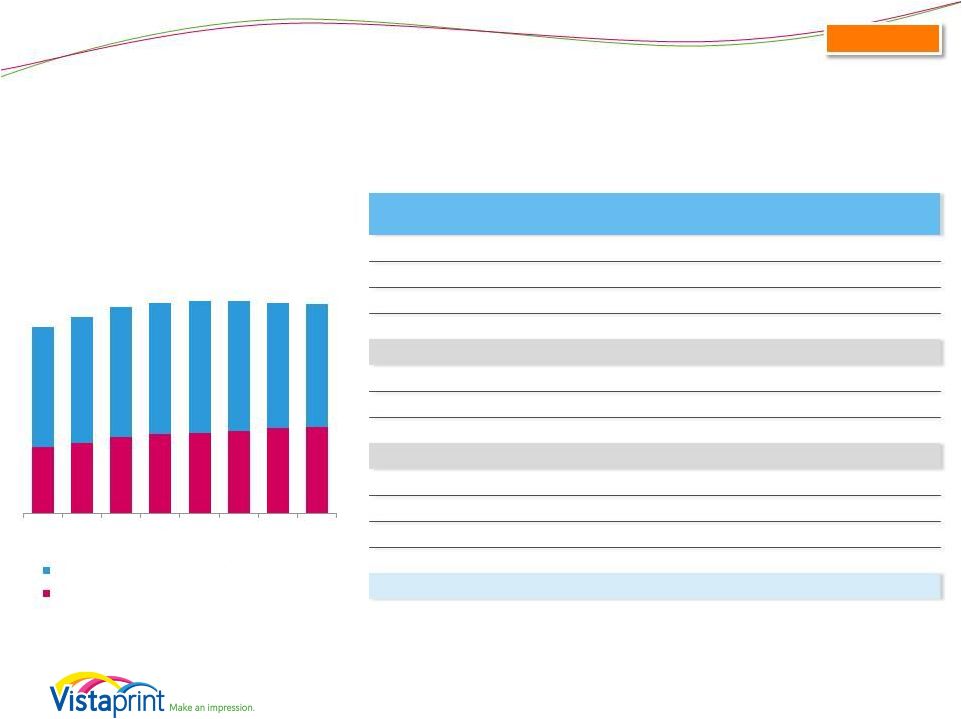
 Revenue Seasonality
(Includes Albumprinter and Webs as of the dates of acquisition)
* Home and family revenue is calculated using a product format-based approach;
all Albumprinter revenue is included in home and family and all Webs
revenue is included in Small business marketing 33
Consolidated
$209
$212
$300
$258
$250
$251
$348
$288
$280
$275
$371
$286
Q4 FY11
Q1 FY12
Q2 FY12
Q3 FY12
Q4 FY12
Q1 FY13
Q2 FY13
Q3 FY13
Q4 FY13
Q1 FY14
Q2 FY14
Q3 FY14
Small Business Marketing*
Home and Family* |
 Balance Sheet Highlights
Balance Sheet highlights, in millions, at period end
03/31/2014
12/31/13
09/30/2013
06/30/13
03/31/13
Total assets
$672.0
$674.6
$638.7
$601.6
$616.4
Cash and cash equivalents
$46.5
$62.3
$64.7
$50.1
$51.3
Total current assets
$126.0
$135.5
$121.8
$100.2
$104.4
Goodwill and intangible assets
$169.2
$171.6
$171.5
$171.2
$174.3
Total liabilities
$393.9
$414.4
$432.0
$412.0
$414.7
Current liabilities
$177.4
$197.9
$144.3
$155.0
$154.0
Long-term debt
$185.6
$189.3
$262.5
$230.0
$229.0
Shareholders’
Equity
$272.4
$260.3
$206.7
$189.6
$201.7
Treasury shares (in millions)
10.8
10.9
11.0
11.3
10.9
34
Consolidated |
 Total Debt as of March 31, 2014
Availability under our credit facility ($ millions)*
03/31/14
Pro Forma for
Acquisitions
(approximate)
Aggregate loan commitments
798.0
798.0
Outstanding borrowings
(202.0)
(434.8)
Remaining amount
596.0
363.2
Limitations to borrowing due to debt covenants and other
obligations*
(294.6)
(213.2)
Amount available for borrowing as of March 31, 2014
301.4
150.0
35
* Our borrowing ability can be limited by our debt covenants each quarter. These
covenants may limit our borrowing capacity depending on our leverage, other
indebtedness, such as installment obligations and letters of credit, and other factors that are outlined in our credit
agreement filed as an exhibit in our Form 8-Ks filed on February 13, 2013 and
January 22, 2014. Consolidated
•
Aggregate loan commitments of $798.0M •
Interest rate of LIBOR plus 1.50% - 2.0%, depending on leverage •
Currently in compliance with all covenants. Key financial covenants are: o Total leverage ratio not to exceed 3.25x TTM EBITDA (reducing
to 3.0x on 3/31/15).
o
Interest coverage ratio of at least 3.0x TTM EBITDA.
•
Purchases of our ordinary shares, payments of dividends, and mergers and acquisitions are subject to
more restrictive consolidated leverage ratio thresholds than those listed above when calculated
on a proforma basis in certain scenarios. Also our credit agreement limits the amount of
purchases of our ordinary shares, payments of dividends, mergers and acquisitions, investments
in joint ventures or minority interests, and consolidated capital expenditures that we may make.
These limitations can include annual limits that vary from year-to-year and aggregate limits
over the term of the credit facility. Therefore, our ability to make desired investments may be
limited during the term of our revolving credit facility.
|
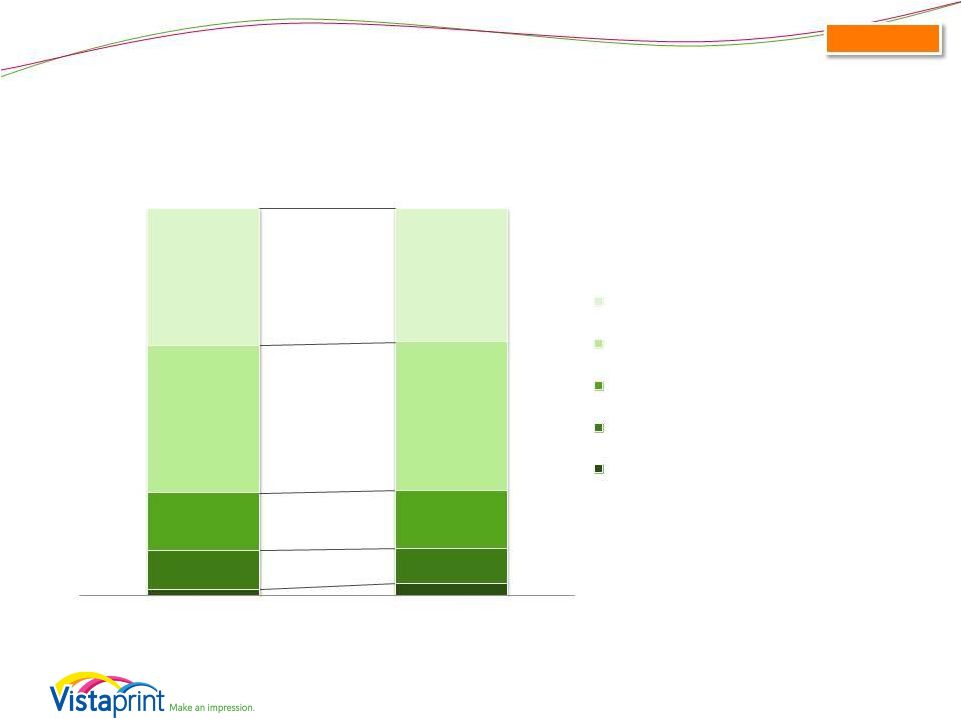
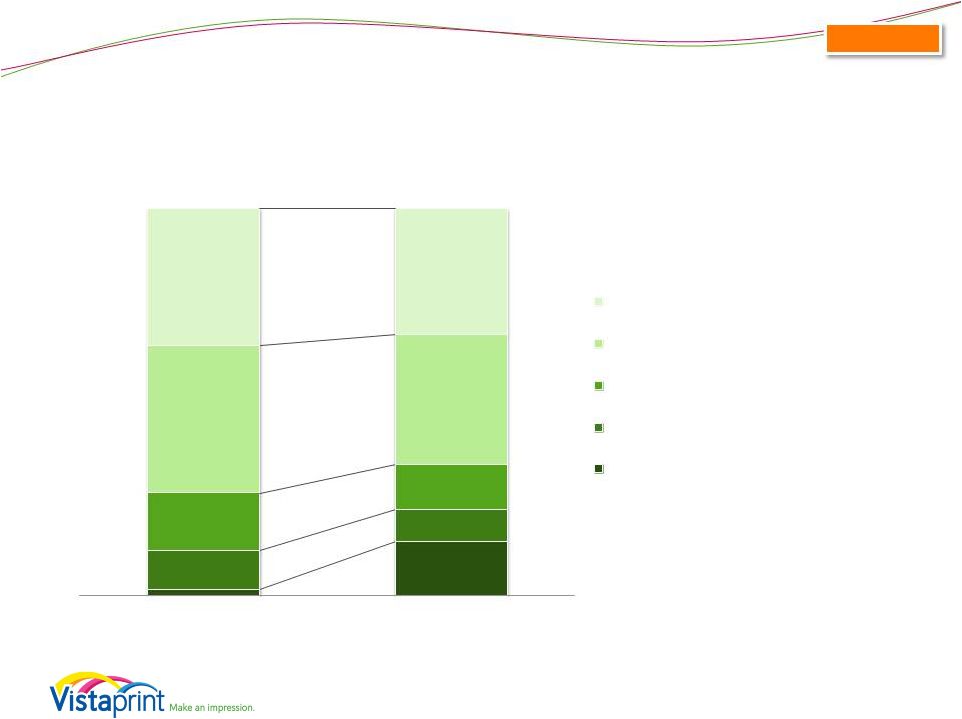
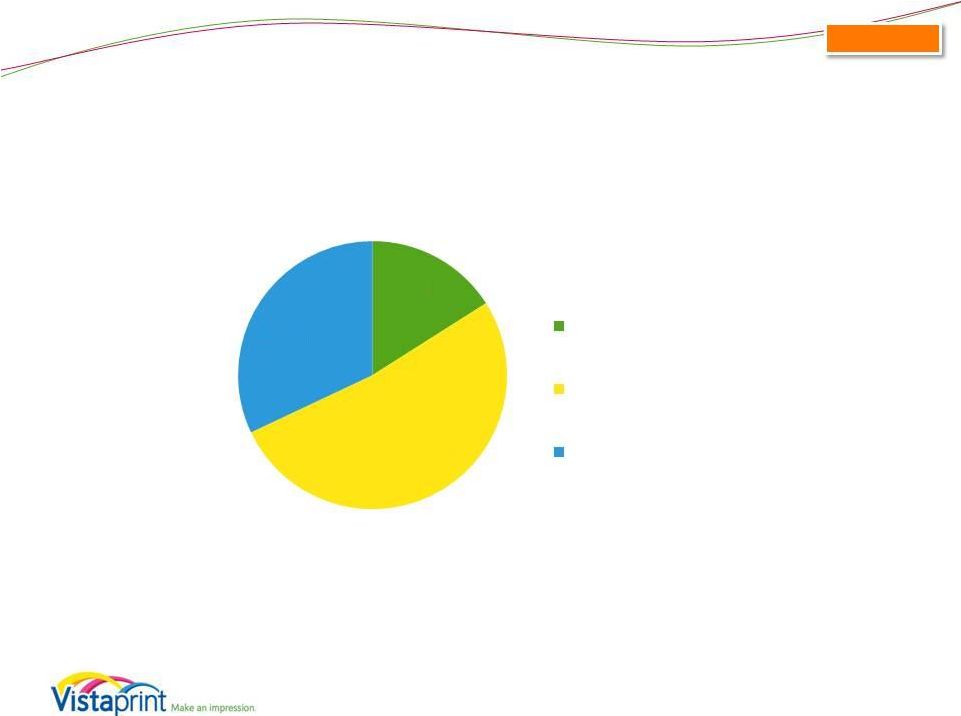 Q3
FY14 Capital Expenditure Breakdown 36
Q3 FY14 CapEx: $11.8M
16%
52%
32%
Land/Facilities
Mfg & Automation
Equipment
Other
1
2
3
Consolidated
1
2
3
Land, building and construction, leasehold improvements, and furniture and fixtures
All manufacturing and automation equipment, including offset and digital print lines, other
printing equipment, pre-press and post-press equipment such as cutters, and
automation equipment IT infrastructure, software and office equipment |
 Appendix
Including a Reconciliation of
GAAP to Non-GAAP Financial
Measures |
 About
non-GAAP financial measures
To supplement Vistaprint’s consolidated financial statements presented in
accordance with U.S. generally accepted
accounting principles, or GAAP, Vistaprint has used the following measures defined
as non-GAAP financial measures by Securities and Exchange Commission, or
SEC, rules: non-GAAP adjusted net income, non-GAAP adjusted net income
per diluted share, free cash flow and constant-currency revenue growth. The
items excluded from the non-GAAP adjusted net income measurements are
share-based compensation expense and its related tax effect, amortization of
acquisition-related intangibles, tax charges related to the alignment of
acquisition-related intellectual property with global operations,
changes in unrealized gains and losses on currency forward contracts, unrealized currency transaction gains
and losses on intercompany financing arrangements and the related tax effect, and
the expected charge for the disposal of our minority investment in
China. Free cash flow is defined as net cash provided by operating activities less
purchases of property, plant and equipment, purchases of intangible assets not
related to acquisitions, and capitalization of software and website
development costs. Constant-currency revenue growth is estimated by translating all non-U.S.
dollar denominated revenue generated in the current period using
the prior year period’s average exchange rate for each
currency to the U.S. dollar and excludes the impact of gains and
losses on effective currency hedges recognized in
revenue in the prior year periods.
The presentation of non-GAAP financial information is not intended to be
considered in isolation or as a substitute for the financial information
prepared and presented in accordance with GAAP. For more information on these non-GAAP
financial
measures,
please
see
the
tables
captioned
“Reconciliations
of
Non-GAAP
Financial
Measures”
included
at
the
end of this release. The tables have more details on the GAAP financial measures
that are most directly comparable to non-GAAP financial measures and the
related reconciliation between these financial measures. Vistaprint’s
management believes that these non-GAAP financial measures provide meaningful supplemental
information in assessing our performance and liquidity by excluding certain items
that may not be indicative of our recurring core business operating results,
which could be non-cash charges or discrete cash charges that are infrequent
in nature. These non-GAAP financial measures also have facilitated
management’s internal comparisons to Vistaprint’s historical
performance and our competitors’ operating results.
38 |
 Reconciliation: GAAP to Non-GAAP Results
FY 2003
FY 2004
FY 2005*
FY 2006
FY 2007
FY 2008
FY 2009
FY2010
FY2011
FY2012
FY2013
GAAP Net Income
$473
$3,440
($16,218)
$19,234
$27,143
$39,831
$55,686
$67,741
$82,109
$43,994
$29,435
Share-based
compensation and
related tax effect
$0
$0
$0
$4,850
$8,765
$15,275
$20,177
$23,156
$22,400
$26,060
$33,662
Amortization of
acquired intangible
assets
-
-
-
-
-
-
-
-
-
$5,754
$10,361
Tax Impact of Webs
IP transfer
-
-
-
-
-
-
-
-
-
$1,235
$2,387
Non-GAAP
Adjusted Net Income
$473
$3,440
$4,782
$23,146
$35,908
$55,106
$75,863
$90,897
$104,509
$77,043
$75,845
Net Income (Loss) –
Annual
($ in thousands)
*Fiscal 2005 non-GAAP results exclude a contract termination payment of
$21mm 39 |
 Reconciliation: GAAP to Non-GAAP Results
($ in thousands)
.
Fiscal
Year 2011
Fiscal Year 2012
Fiscal Year 2013
FY2014
Q4
Q1
Q2
Q3
Q4
Q1
Q2
Q3
Q4
Q1
Q2
Q3
GAAP Net Income*
$14,397
$8,172
$31,697
$274
$3,851
$(1,696)
$22,960
$5,866
$2,305
$412
$40,875
$1,376
Share-based
compensation and
related tax effect
$5,129
$4,876
$5,021
$7,566
$8,596
$8,445
$8,540
$8,353
$8,324
$8,576
$8,062
$5,773
Amortization of
acquired intangible
assets
-
-
$1,148
$2,381
$2,225
$2,178
$2,243
$2,275
$3,665
$2,200
$2,249
$2,228
Tax Impact of
Webs IP Transfer
-
-
-
$1,017
$218
-
$2,164
$431
($208)
$63
$1,468
$312
Changes in
unrealized (gain)
loss on currency
forward contracts
included in net
income
$4,856
$(1,155)
$(1,131)
Unrealized
currency
transaction loss
(gain) on
intercompany loan
and the related tax
effect
-
$1,163
$(283)
Non-GAAP
Adjusted Net
Income
$19,526
$13,048
$37,866
$11,238
$14,890
$8,927
$35,907
$16,925
$14,086
$16,107
$52,662
$8,274
40
* GAAP net income attributable to Vistaprint N.V.
Net Income (Loss) – Quarterly
|
 Reconciliation: GAAP to Non-GAAP Results
Diluted
Earnings
Per
Share
-
Annual
41
FY 2006
FY 2007
FY 2008
FY 2009
FY2010
FY2011
FY2012
FY2013
GAAP Net Income per share
$0.45
$0.60
$0.87
$1.25
$1.49
$1.83
$1.13
$0.85
Share-based Compensation and
related tax effect per share
$0.09
$0.18
$0.31
$0.43
$0.49
$0.47
$0.65
$0.95
Amortization of acquired
intangible assets per share
-
-
-
-
-
-
$0.14
$0.29
Tax Impact of Webs IP Transfer
per share
-
-
-
-
-
-
$0.03
$0.06
Non-GAAP Adjusted Net
Income per share
$0.54
$0.78
$1.18
$1.68
$1.98
$2.30
$1.95
$2.15
Weighted average shares used
in computing Non-
GAAP EPS
42.651
45.825
46.780
45.099
45.989
45.448
39.426
35.201
(millions) |
 Reconciliation: GAAP to Non-GAAP Results
Earnings
Per
Diluted
Share
-
Quarterly
.
Fiscal
Year 2011
Fiscal Year 2012
Fiscal Year 2013
FY2014
Q4
Q1
Q2
Q3
Q4
Q1
Q2
Q3
Q4
Q1
Q2
Q3
GAAP Net Income per
share
$0.32
$0.19
$0.82
$0.01
$0.10
$(0.05)
$0.66
$0.17
$0.07
$0.01
$1.18
$0.04
Share-based Compensation
and related tax effect per
share
$0.11
$0.12
$0.12
$0.20
$0.23
$0.24
$0.24
$0.24
$0.24
$0.25
$0.22
$0.17
Amortization of acquired
intangible assets per share
-
-
$0.03
$0.06
$0.06
$0.06
$0.06
$0.06
$0.11
$0.06
$0.06
$0.06
Tax impact of Webs IP
Transfer per share
-
-
-
$0.02
$0.01
-
$0.06
$0.01
$(0.01)
$0.00
$0.04
$0.01
Changes in unrealized
(gain) loss on currency
forward contracts included
in net income per share
$0.13
$(0.03)
$(0.03)
Unrealized currency
transaction loss (gain) on
intercompany loan and the
related tax effect per share
$0.00
$0.03
$(0.01)
Non-GAAP Adjusted Net
Income per share
$0.43
$0.31
$0.97
$0.29
$0.40
$0.25
$1.02
$0.48
$0.41
$0.45
$1.50
$0.24
Weighted average shares
used in computing Non-
GAAP EPS
(millions)
45.156
42.569
39.041
38.346
37.620
35.793
35.156
35.217
34.633
35.005
35.118
34.857
42 |
 Reconciliation: Free Cash Flow
(in thousands)
43
Three Months Ended
Nine Months Ended
March 31,
March 31,
2014
2013
2014
2013
Net cash provided by operating activities
$ 3,142
$ 8,135
$ 98,046
$ 103,318
Purchases of property, plant and
equipment
(11,830)
(11,155)
(53,999)
(66,523)
Purchases of intangibles assets
(83)
(82)
(202)
(452)
Capitalization of software and website
development costs
(2,920)
(2,439)
(7,339)
(5,579)
Free cash flow
$ (11,691)
$ (5,541)
$
36,506
$ 30,764
|
 Reconciliation:
Constant-Currency Revenue Growth Rates
Quarterly
44
ASIA-PACIFIC
Q4 FY11
Q1 FY12
Q2 FY12
Q3 FY12
Q4 FY12
Q1 FY13
Q2 FY13
Q3 FY13
Q4 FY13
Q1 FY14
Q2 FY14
Q3 FY14
Reported revenue growth
65%
67%
41%
47%
28%
28%
26%
6%
4%
(11%)
(5%)
(3%)
Currency impact
(26%)
(22%)
(4%)
(7%)
5%
2%
(3%)
4%
4%
13%
11%
13%
Revenue growth in constant
currency
39%
45%
37%
40%
33%
29%
24%
10%
8%
2%
6%
10%
Note: Constant-currency revenue growth is estimated by translating all
non-U.S. dollar denominated revenue generated in the current period using the prior year period’s
average exchange rate for each currency to the U.S. dollar and excludes the impact
of gains and losses on effective currency hedges recognized in revenue for applicable
periods.
EUROPE
Q4 FY11
Q1 FY12
Q2 FY12
Q3 FY12
Q4 FY12
Q1 FY13
Q2 FY13
Q3 FY13
Q4 FY13
Q1 FY14
Q2 FY14
Q3 FY14
Reported revenue growth
38%
31%
36%
29%
18%
12%
11%
8%
3%
6%
1%
(4%)
Currency impact
(15%)
(10%)
1%
5%
12%
11%
2%
0%
(1%)
(4%)
(3%)
(3%)
Revenue growth in constant
currency
22%
21%
37%
34%
30%
23%
14%
8%
2%
2%
(2%)
(7%) |
 Reconciliation:
Constant-Currency Revenue Growth Rates
Quarterly
45
NORTH AMERICA
Q4 FY11
Q1 FY12
Q2 FY12
Q3 FY12
Q4 FY12
Q1 FY13
Q2 FY13
Q3 FY13
Q4 FY13
Q1 FY14
Q2 FY14
Q3 FY14
Reported revenue growth
18%
17%
20%
23%
20%
22%
20%
15%
18%
14%
13%
2%
Currency impact
0%
0%
0%
0%
0%
0%
0%
0%
0%
1%
1%
1%
Revenue growth in constant
currency
18%
17%
20%
23%
21%
22%
20%
15%
18%
15%
14%
3%
Note: Constant-currency revenue growth is estimated by translating all
non-U.S. dollar denominated revenue generated in the current period using the prior year period’s
average exchange rate for each currency to the U.S. dollar and excludes the impact
of gains and losses on effective currency hedges recognized in revenue for applicable
periods.
TOTAL COMPANY
Q4 FY11
Q1 FY12
Q2 FY12
Q3 FY12
Q4 FY12
Q1 FY13
Q2 FY13
Q3 FY13
Q4 FY13
Q1 FY14
Q2 FY14
Q3 FY14
Reported revenue growth
27%
25%
28%
26%
20%
18%
16%
12%
12%
9%
6%
(1%)
Currency impact
(7%)
(5%)
0%
2%
5%
5%
1%
0%
0%
0%
0%
0%
Revenue growth in constant
currency
20%
20%
28%
28%
25%
23%
17%
12%
12%
9%
6%
(1%) |