Attached files
| file | filename |
|---|---|
| 8-K - FORM 8-K DATED 4-30-14 - Piedmont Office Realty Trust, Inc. | pdm331148kq12014erandsupps.htm |
| EX-99.1 - Q1 2014 EARNINGS RELEASE - Piedmont Office Realty Trust, Inc. | pdm33114ex991q12014earning.htm |
EXHIBIT 99.2

Quarterly Supplemental Information
March 31, 2014
Corporate Headquarters | Institutional Analyst Contact | Investor Relations |
11695 Johns Creek Parkway, Suite 350 | Telephone: 770.418.8592 | Telephone: 866.354.3485 |
Johns Creek, GA 30097 | research.analysts@piedmontreit.com | investor.services@piedmontreit.com |
Telephone: 770.418.8800 | www.piedmontreit.com | |
Piedmont Office Realty Trust, Inc.
Quarterly Supplemental Information
Index
Page | Page | |||
Introduction | Other Investments | |||
Corporate Data | Other Investments Detail | |||
Investor Information | Supporting Information | |||
Financial Highlights | Definitions | |||
Key Performance Indicators | Research Coverage | |||
Financials | Non-GAAP Reconciliations & Other Detail | |||
Balance Sheets | Property Detail | |||
Income Statements | Risks, Uncertainties and Limitations | |||
Funds From Operations / Adjusted Funds From Operations | ||||
Same Store Analysis | ||||
Capitalization Analysis | ||||
Debt Summary | ||||
Debt Detail | ||||
Debt Analysis | ||||
Operational & Portfolio Information - Office Investments | ||||
Tenant Diversification | ||||
Tenant Credit Rating & Lease Distribution Information | ||||
Leased Percentage Information | ||||
Rental Rate Roll Up / Roll Down Analysis | ||||
Lease Expiration Schedule | ||||
Quarterly Lease Expirations | ||||
Annual Lease Expirations | ||||
Capital Expenditures & Commitments | ||||
Contractual Tenant Improvements & Leasing Commissions | ||||
Geographic Diversification | ||||
Geographic Diversification by Location Type | ||||
Industry Diversification | ||||
Property Investment Activity | ||||
Value-Add Activity | ||||
Notice to Readers: |
Please refer to page 48 for a discussion of important risks related to the business of Piedmont Office Realty Trust, Inc., as well as an investment in its securities, including risks that could cause actual results and events to differ materially from results and events referred to in the forward-looking information. Considering these risks, uncertainties, assumptions, and limitations, the forward-looking statements about leasing, financial operations, leasing prospects, etc. contained in this quarterly supplemental information package might not occur. |
Certain prior period amounts have been reclassified to conform to the current period financial statement presentation. In addition, many of the schedules herein contain rounding to the nearest thousands or millions and, therefore, the schedules may not total due to this rounding convention. When the Company sells properties, it restates historical income statements with the financial results of the sold assets presented in discontinued operations. |
Piedmont Office Realty Trust, Inc.
Corporate Data
Piedmont Office Realty Trust, Inc. (also referred to herein as "Piedmont" or the "Company") (NYSE: PDM) is a fully-integrated and self-managed real estate investment trust (“REIT”) specializing in the acquisition, ownership, management, development and disposition of primarily high-quality Class A office buildings located primarily in ten of the largest U.S. office markets, including Atlanta, Boston, Chicago, Dallas, Houston, Los Angeles, Minneapolis, New York, Central Florida and Washington, D.C. Approximately 60% of the Company's tenants are investment grade-rated or governmental tenants, and many others are blue chip or nationally-recognized companies not requiring investment ratings. Piedmont is headquartered in Atlanta, GA, with local management offices in each of its major markets. Investment grade-rated by Standard & Poor's and Moody's, the Company has maintained a relatively low leverage strategy throughout its fifteen year operating history.
This data supplements the information provided in our reports filed with the Securities and Exchange Commission and should be reviewed in conjunction with such filings.
As of | As of | ||||
March 31, 2014 | December 31, 2013 | ||||
Number of consolidated office properties (1) | 75 | 78 | |||
Rentable square footage (in thousands) (1) | 21,107 | 21,490 | |||
Percent leased (2) | 86.7 | % | 87.2 | % | |
Percent leased - stabilized portfolio (3) | 88.8 | % | 89.7 | % | |
Capitalization (in thousands): | |||||
Total debt - principal amount outstanding | $2,034,525 | $2,003,525 | |||
Equity market capitalization | $2,645,866 | $2,601,254 | |||
Total market capitalization | $4,680,391 | $4,604,779 | |||
Total debt / Total market capitalization | 43.5 | % | 43.5 | % | |
Total debt / Total gross assets | 35.8 | % | 35.0 | % | |
Common stock data | |||||
High closing price during quarter | $17.28 | $18.90 | |||
Low closing price during quarter | $16.09 | $15.96 | |||
Closing price of common stock at period end | $17.15 | $16.52 | |||
Weighted average fully diluted shares outstanding during quarter (in thousands) | 155,025 | 160,450 | |||
Shares of common stock issued and outstanding (in thousands) | 154,278 | 157,461 | |||
Rating / outlook | |||||
Standard & Poor's | BBB / Stable | BBB / Stable | |||
Moody's | Baa2 / Stable | Baa2 / Stable | |||
Employees | 120 | 121 | |||
(1) | As of March 31, 2014, our consolidated office portfolio consisted of 75 properties (exclusive of our equity interests in two properties owned through unconsolidated joint ventures and one out of service property, 3100 Clarendon Boulevard). During the first quarter of 2014, we sold 11107 and 11109 Sunset Hills Boulevard, two office properties comprised of 142,000 square feet, located in Reston, VA. For additional detail on asset transactions, please refer to page 36. |
(2) | Calculated as leased square footage plus square footage associated with executed new leases for currently vacant spaces divided by total rentable square footage, all as of the relevant date, expressed as a percentage. This measure is presented for our consolidated office properties and excludes unconsolidated joint venture properties and one out of service property. Please refer to page 26 for additional analyses regarding Piedmont's leased percentage. |
(3) | Please refer to page 37 for information regarding value-add properties, data for which is removed from stabilized portfolio totals. |
3
Piedmont Office Realty Trust, Inc.
Investor Information
Corporate |
11695 Johns Creek Parkway, Suite 350 |
Johns Creek, Georgia 30097 |
770.418.8800 |
www.piedmontreit.com |
Executive Management | |||
Donald A. Miller, CFA | Robert E. Bowers | Laura P. Moon | |
Chief Executive Officer, President | Chief Financial Officer, Executive | Chief Accounting Officer and | |
and Director | Vice President, and Treasurer | Senior Vice President | |
Raymond L. Owens | Joseph H. Pangburn | Carroll A. Reddic, IV | Robert K. Wiberg |
Executive Vice President, | Executive Vice President, | Executive Vice President, | Executive Vice President, |
Capital Markets | Southwest Region | Real Estate Operations and Assistant | Mid-Atlantic Region and |
Secretary | Head of Development | ||
Board of Directors | |||
W. Wayne Woody | Michael R. Buchanan | Wesley E. Cantrell | William H. Keogler, Jr. |
Director, Chairman of the Board of | Director | Director | Director |
Directors and Chairman of | |||
Governance Committee | |||
Frank C. McDowell | Donald A. Miller, CFA | Raymond G. Milnes, Jr. | Donald S. Moss |
Director, Vice Chairman of the | Chief Executive Officer, President | Director and Chairman of | Director |
Board of Directors and Chairman | and Director | Audit Committee | |
of Compensation Committee | |||
Jeffery L. Swope | |||
Director and Chairman of | |||
Capital Committee | |||
Transfer Agent | Corporate Counsel |
Computershare | King & Spalding |
P.O. Box 30170 | 1180 Peachtree Street, NE |
College Station, TX 77842-3170 | Atlanta, GA 30309 |
Phone: 866.354.3485 | Phone: 404.572.4600 |
4
Piedmont Office Realty Trust, Inc.
Financial Highlights
As of March 31, 2014
Financial Results (1)
Funds from operations (FFO) for the quarter ended March 31, 2014 was $58.0 million, or $0.37 per share (diluted), compared to $60.2 million, or $0.36 per share (diluted), for the same quarter in 2013. The decrease in dollar amount of FFO for the three months ended March 31, 2014 as compared to the same period in 2013 was principally related to the following factors: 1) decreased operating income contributions from One Independence Square in Washington, DC; 3100 Clarendon Boulevard in Arlington, VA; Aon Center in Chicago, IL; and 6021 Connection Drive in Irving, TX, related primarily to tenant transitions and lease expirations, 2) increased interest expense in 2014 related to the higher average amount of debt outstanding during the first quarter of 2014 when compared to the same period in 2013 due primarily to $452.4 million in net property and stock acquisitions in 2013, and 3) decreased operating income attributable to properties sold since the beginning of 2013, all of which were offset somewhat by 4) operating income contributions from newly acquired properties and 5) net insurance reimbursements amounting to $3.0 million in the first quarter of 2014 compared to net related expenses of $0.2 million in the first quarter of 2013. The increase in per share FFO for the three months ended March 31, 2014 as compared to the same period in 2013 was related to reduced weighted average shares outstanding in 2014 as a result of the Company's stock repurchase program.
Core funds from operations (Core FFO) for the quarter ended March 31, 2014 was $55.1 million, or $0.36 per share (diluted), compared to $61.6 million, or $0.37 per share (diluted), for the same quarter in 2013. The decrease in Core FFO for the three months ended March 31, 2014 as compared to the same period in 2013 was principally related to the items described above for changes in FFO, with the exception of the net insurance reimbursements and net related expenses, which were removed from Core FFO since they are considered to be non-recurring. An additional contributor to the difference in Core FFO for the three months ended March 31, 2014 as compared to the same period in 2013 was the add back of acquisition costs in each period; acquisition costs were higher during the three months ended March 31, 2013 than during the same period in 2014 attributable to the greater amount of acquisition activity in 2013.
Adjusted funds from operations (AFFO) for the quarter ended March 31, 2014 was $32.0 million, or $0.21 per share (diluted), compared to $36.6 million, or $0.22 per share (diluted), for the same quarter in 2013. The decrease in AFFO for the three months ended March 31, 2014 as compared to the same period in 2013 was primarily related to the items described above for changes in FFO and Core FFO, offset somewhat by the net effect of reduced non-incremental capital expenditures and increased rental abatement concessions recognized in 2014 when compared to those incurred during the same time period in 2013.
Operations & Leasing
On a square footage leased basis, our total office portfolio was 86.7% leased as of March 31, 2014, as compared to 86.0% a year earlier. Please refer to page 26 for additional leased percentage information.
The weighted average remaining lease term of our portfolio was 7.3 years(2) as of March 31, 2014 as compared to 7.1 years at December 31, 2013.
As previously disclosed, Piedmont commenced the redevelopment of its 3100 Clarendon Boulevard property, a 250,000 square foot office and retail property located in Arlington, VA, during the first quarter of 2014. The building's existing retail tenants will remain in occupancy during the redevelopment. Therefore, from an accounting standpoint, the office component of the building will be out of service and the retail portion of the building, comprised of approximately 28,000 square feet, will remain in service during the redevelopment. However, for the purposes of statistical reporting throughout this supplemental report, the entire building has been removed from Piedmont's operating portfolio. For additional information regarding the redevelopment of 3100 Clarendon Boulevard, please see the Financing and Capital Activity section below.
During the three months ended March 31, 2014, the Company completed 415,000 square feet of total leasing. Of the total leasing activity during the quarter, we signed renewal leases for 118,000 square feet and new tenant leases for 297,000 square feet. The average committed capital cost for all leases signed during the three months ended March 31, 2014 at our consolidated office properties was $5.33 per square foot per year of lease term. Average committed capital cost per square foot per year of lease term for renewal leases signed during the three months ended March 31, 2014 was $4.05 and average committed capital cost per square foot per year of lease term for new leases signed during the same time period was $5.53 (see page 32).
(1) | |
(2) | Remaining lease term (after taking into account leases for vacant spaces which had been executed but not commenced as of March 31, 2014) is weighted based on Annualized Lease Revenue, as defined on page 39. |
5
During the three months ended March 31, 2014, we executed six leases greater than 20,000 square feet at our consolidated office properties. Please see information on those leases listed below.
Tenant | Property | Property Location | Square Feet Leased | Expiration Year | Lease Type | |
Preferred Apartment Advisors | The Medici | Atlanta, GA | 62,145 | 2025 | New | |
Amneal Pharmaceuticals | 400 Bridgewater Crossing | Bridgewater, NJ | 40,110 | 2024 | New | |
Harding Loevner | 400 Bridgewater Crossing | Bridgewater, NJ | 39,685 | 2022 | Renewal / Expansion | |
R-T Specialty | 500 West Monroe Street | Chicago, IL | 26,966 | 2029 | New | |
Children's Hospital Los Angeles | 800 North Brand Boulevard | Glendale, CA | 22,638 | 2021 | Renewal | |
JL Buchanan | US Bancorp Center | Minneapolis, MN | 20,244 | 2025 | New | |
As of March 31, 2014, there were no tenants whose leases were scheduled to expire at or during the eighteen month period following the end of the first quarter of 2014 which individually contributed greater than 1% in net Annualized Lease Revenue (ALR) expiring over the next eighteen months. Subsequent to quarter end, the lease renewal with the United States of America (National Park Service or "NPS") was executed; therefore, for the purposes of this report, that lease is no longer considered to be in holdover status and the lease expiration schedules as presented herein were adjusted to account for the signed renewal. The expiration of the majority of the renewed NPS lease is reflected in the third quarter of 2017, with the expiration of contraction space reflected in the second quarter of 2015.
Piedmont focuses its marketing efforts on large corporate office space users. The average size of lease in the Company's portfolio is approximately 30,000 square feet. Due to the large size and length of term of new leases, Piedmont typically signs leases several months in advance of their anticipated lease commencement dates. Presented below is a schedule of uncommenced leases greater than 50,000 square feet and their anticipated commencement dates. Lease renewals are excluded from this schedule.
Tenant | Property | Property Location | Square Feet Leased | Space Status | Estimated Commencement Date | New / Expansion |
Integrys Business Support | Aon Center | Chicago, IL | 180,876 | Vacant | Q2 2014 | New |
Piper Jaffray & Co. | US Bancorp Center | Minneapolis, MN | 123,882 | Not Vacant | Q2 2014 | New |
Epsilon Data Management | 6021 Connection Drive | Irving, TX | 221,898 | Vacant (1) | Q3 2014 | New |
Preferred Apartment Advisors | The Medici | Atlanta, GA | 62,145 | Vacant | Q4 2014 | New |
Catamaran | Windy Point II | Schaumburg, IL | 50,686 | Vacant | Q1 2015 | New |
Occupancy versus NOI Analysis
Piedmont had been in a period of high lease rollover from 2010 to 2013. This rollover and the overall economic slowdown during this period have resulted in a decrease in leased percentage, some rental rate rolldowns, and an even larger decrease in economic leased percentage due to the rental abatement concessions provided under many of the new leases and lease renewals. In turn, these abatements and lower rental rates have resulted in a lower cash basis Same Store NOI than might otherwise be anticipated given the overall leased percentage and the historical relationship between leased percentage and Same Store NOI. As of March 31, 2014, our overall leased percentage was 86.7% and our economic leased percentage was 74.0%. The difference between overall leased percentage and economic leased percentage is attributable to two factors:
1. | leases which have been contractually entered into for currently vacant space which have not commenced (amounting to approximately 757,000 square feet of leases as of March 31, 2014, or 3.6% of the office portfolio); and |
2. | leases which have commenced but the tenants have not commenced paying full rent due to rental abatements (amounting to 2.2 million square feet of leases as of March 31, 2014, or a 9.1% impact to leased percentage on an economic basis). Please see the chart below for a listing of major contributors to this factor. |
As the executed but not commenced leases begin and the rental abatement periods expire, there will be greater Same Store NOI growth than might otherwise be expected based on changes in overall leased percentage alone during that time period.
(1) | Nokia's lease for the space terminated on December 31, 2013. The replacement lease with Epsilon Data Management will commence at the beginning of the third quarter of 2014. |
6
Due to the current economic environment, many recently negotiated leases provide for rental abatement concessions to tenants. Those rental abatements typically occur at the beginning of each new lease's term. Since 2010, Piedmont has signed approximately 12.8 million square feet of leases within its consolidated office portfolio. Due to the large number of new leases in the Company's portfolio, abatements provided under those new leases have impacted the Company's current cash net operating income and AFFO. Presented below is a schedule of leases greater than 50,000 square feet that are currently under some form of rent abatement. The leases presented below are for a total of 1.8 million square feet of the 2.2 million square feet currently in some form of rent abatement. The abatements on the remaining leases, which are of sizes less than 50,000 square feet and comprise approximately 0.4 million square feet in total, have an average abatement expiration date in the third quarter of 2014.
Tenant | Property | Property Location | Square Feet Leased | Abatement Structure | Abatement Expiration |
Thoughtworks | Aon Center | Chicago, IL | 52,529 | Gross Rent | Q1 2014 |
Aon | Aon Center | Chicago, IL | 382,076 | Gross Rent | Q2 2014 |
GE Capital | 500 West Monroe Street | Chicago, IL | 291,935 | Gross Rent | Q2 2014 |
Gemini | 2 Gatehall Drive | Parsippany, NJ | 204,515 | Base Rent | Q2 2014 |
Miller Canfield Paddock Stone | 150 West Jefferson | Detroit, MI | 109,261 | Base Rent | Q2 2014 |
General Electric Company | 500 West Monroe Street | Chicago, IL | 53,972 | Gross Rent | Q2 2014 |
Federal Home Loan Bank | Aon Center | Chicago, IL | 79,054 | Gross Rent (on 15,652 square feet) | Q3 2014 |
Catamaran | Windy Point II | Schaumburg, IL | 250,000 | Gross Rent | Q4 2014 |
TMW Systems | Eastpoint I | Mayfield Heights, OH | 59,804 | Base Rent | Q4 2014 |
GE Capital | 500 West Monroe Street | Chicago, IL | 52,845 | Gross Rent | Q4 2014 |
Union Bank | 800 North Brand Boulevard | Glendale, CA | 51,706 | Base Rent | Q4 2014 |
Federal Home Loan Bank | Aon Center | Chicago, IL | 16,051 | Gross Rent | Q4 2014 |
Aon | Aon Center | Chicago, IL | 31,702 | Gross Rent | Q1 2015 |
DDB Needham Chicago | Aon Center | Chicago, IL | 187,000 | $4.00 PSF off of Base Rent | Q2 2015 |
Subtotal | 1,822,450 | ||||
Financing and Capital Activity
As of March 31, 2014, our ratio of debt to total gross assets was 35.8%. This debt ratio is based on total principal amount outstanding for our various loans at March 31, 2014.
On February 5, 2014, the Board of Directors of Piedmont declared dividends for the first quarter of 2014 in the amount of $0.20 per common share outstanding to stockholders of record as of the close of business on February 28, 2014. The dividends were paid on March 21, 2014. The Company's dividend payout percentage for the three months ended March 31, 2014 was 56% of Core FFO and 96% of AFFO.
Dispositions
On March 19, 2014, Piedmont sold two buildings, 11107 Sunset Hills Road and 11109 Sunset Hills Road, for a combined $22.6 million, or $159 per square foot. The properties, located in Reston, VA, are comprised of 101,000 and 41,000 square feet, respectively, and were built in 1985 and 1984, respectively. At the time of sale, the buildings were 100% and 0% leased, respectively. The sale of the buildings allowed the Company to divest dated, non-core properties, consistent with its long-term strategic objectives for location and building quality. Piedmont recorded a $0.1 million loss on the sale of the assets. The operating income for the properties is presented in discontinued operations.
On March 24, 2014, Piedmont entered into a binding contract to sell 4685 Investment Drive and 1441 West Long Lake Road, both of which are located in Troy, MI. The properties are comprised of 77,000 and 108,000 square feet, respectively, and were built in 2000 and 1999, respectively. The sale of the buildings will permit the Company to divest non-strategic properties located in a non-core market, allowing the Company to make further progress on one of its strategic objectives of narrowing the markets within which it operates. Subsequent to quarter end, Piedmont completed the sale of the properties for a combined $19.4 million, or $104 per square foot. For additional information, please refer to page 36.
7
Acquisitions
The Company did not complete any acquisitions during the first quarter of 2014. The company has made the following acquisitions since January 1, 2013:
Property | Location | Rentable Square Footage | |
Arlington Gateway | Arlington, VA | 334,000 | |
5 & 15 Wayside Road | Burlington, MA | 271,000 | |
Royal Lane Land | Irving, TX | N/A | |
5301 Maryland Way | Brentwood, TN | 201,000 | |
4685 Investment Drive | Troy, MI | 77,000 | |
2020 West 89th Street | Leawood, KS | 68,000 | |
6565 North MacArthur Boulevard | Irving, TX | 260,000 | |
One Lincoln Park | Dallas, TX | 262,000 | |
161 Corporate Center | Irving, TX | 105,000 | |
Development
During the first quarter of 2014, Piedmont commenced the redevelopment of its 3100 Clarendon Boulevard property, a 250,000 square foot office and retail property located in Arlington, VA. Until the end of 2013, the property, which is located directly above the Clarendon Metro Station and affords tenants direct building entry from the station, had been predominantly leased to the U.S. Government (Defense Intelligence Agency) for the previous 15+ years. The expiration of the U.S. Government's lease afforded Piedmont the opportunity to upgrade and reposition the property in order to attract private sector tenants and to capture the incremental value potential for the location - attributable primarily to the depth of nearby amenities desirable to tenants, including housing, retail, and transportation. The Company anticipates that the redevelopment will take the entirety of the 2014 calendar year to complete. During the redevelopment, the office component of the building will be out of service and the retail portion of the building, comprised of approximately 28,000 square feet, will remain in service. However, for the purposes of statistical reporting on the Company's assets in this supplemental report, the entire building will be removed from Piedmont's operating portfolio. It is anticipated that the costs to redevelop the building will be approximately $25 million to $30 million. Following the completion of the redevelopment of the asset, the Company anticipates spending approximately $20 million in re-leasing costs.
During the fourth quarter of 2013, Piedmont announced the development of Enclave Place, a 301,000 square foot office building located in Houston, TX. The 11-story building will be constructed on Piedmont's 4.7 acre development site adjacent to its 1430 Enclave Parkway property and located within a deed-restricted and architecturally-controlled office park in Houston's Energy Corridor. Ground was broken subsequent to quarter end in April 2014, and physical construction is targeted to be completed during the third quarter of 2015. The incremental development costs are anticipated to be approximately $80 million to $85 million, inclusive of leasing costs. The development of Enclave Place follows Piedmont's recent success in buying the near-vacant 1200 Enclave Parkway for approximately $124 per square foot, leasing it to stabilization, and then selling it for approximately $326 per square foot two years after acquisition.
Stock Repurchase Program
During the first quarter of 2014, the Company repurchased approximately 3.2 million shares of common stock under its share repurchase program at an average price of $16.54 per share. Since the stock repurchase program began in December 2011, the Company has repurchased a total of 18.9 million shares at an average price of $16.92 per share, or approximately $319.5 million in aggregate (before consideration of transaction costs). As of quarter end, Board-approved capacity remaining for additional repurchases totaled approximately $37.2 million under the stock repurchase plan.
Finance
On December 18, 2013, Piedmont closed on a new $300 million, five-year unsecured term loan with a delayed draw feature. As of the date of closing, no loan funds were drawn. On January 30, 2014, Piedmont drew the entire $300 million available under the term loan. The proceeds were used to repay two maturing loans totaling $225 million which were secured by Aon Center; the remainder of the proceeds were used to reduce the balance outstanding under the Company's revolving line of credit. The loan has a stated variable interest rate. In an effort to reduce the Company's exposure to changes in interest rates, during the first quarter of 2014, Piedmont entered into four five-year interest rate swaps in order to fix the interest rate for a portion of the new $300 million term loan through the loan's maturity date of January 31, 2019. The swaps have a combined notional amount of $200 million and a blended rate of 1.59%, resulting in an effective fixed rate of 2.79% on $200 million of the term loan after the credit spread is added. The interest rate on the remaining $100 million of the term loan will continue to be variable.
On March 6, 2014, Piedmont completed a ten-year bond offering for $400 million in aggregate principal amount. The 4.45% senior unsecured notes are due March 15, 2024 and were offered at 99.791% of the principal amount. Beginning in late 2012, considering the historically low interest rate environment and the Company's plans to issue unsecured debt to replace maturing secured debt, Piedmont entered into a forward starting swap hedging program to partially protect the Company against rising interest rates and to lock a portion of the interest rate for its future replacement debt. Over the course of approximately a year and a half, the Company entered into five different forward-starting swaps. At the time of the pricing of the $400
8
million in bonds, Piedmont unwound the swaps and received net proceeds from its counterparties of approximately $15.0 million due to the higher level of interest rates. After consideration of the swap settlement proceeds, the effective cost of the financing is approximately 4.10% (excluding transaction costs). The funds received from the bond offering were primarily used to repay a maturing $350 million mortgage debt facility secured by nine properties; the remaining proceeds were used to reduce the balance outstanding under the Company's revolving line of credit.
There are several benefits that Piedmont has realized with the completion of the two financings and debt repayments mentioned above. The benefits are:
▪ | Interest expense reduction: The replacement debt is at a lower interest rate than the debt repaid; the weighted average effective interest rate on $700 million of debt was reduced by over 0.9%; |
▪ | Increased unsecured debt: Piedmont replaced $575 million of secured debt with unsecured debt; unsecured debt as a percentage of total debt increased to approximately 80% from 51%; |
▪ | Increased unencumbered NOI: Piedmont unencumbered the NOI from several large assets; unencumbered NOI as a percentage of total NOI increased to approximately 85% from 57%; |
▪ | No additional 2014 maturities: Piedmont has no additional 2014 debt maturities; the next debt maturity is a $105 million mortgage in the second quarter of 2015; |
▪ | Debt maturity laddering: The maturities for the replacement debt are in 2019 and 2024, years in which the Company has no other maturing debt; and |
▪ | Corporate credit enhancement: Due to the increase in the amount of unencumbered NOI, we believe the corporate credit profile has been strengthened; there is more income available to support general corporate liabilities. |
Subsequent Events
In April 2014, Piedmont completed a lease renewal with the National Park Service at 1201 Eye Street in Washington, D.C. The lease was extended for five years from the original lease expiration date, extending the expiration date to the third quarter of 2017 from the third quarter of 2012. The renewal consists of 219,750 square feet; however, the tenant will contract by 45,476 square feet during the second quarter of 2015.
On April 30, 2014, the Board of Directors of Piedmont declared dividends for the second quarter of 2014 in the amount of $0.20 per common share outstanding to stockholders of record as of the close of business on May 30, 2014. The dividends are to be paid on June 20, 2014.
Guidance for 2014
The Company is adjusting its financial guidance for calendar year 2014. This guidance is based upon management's expectations at this time. The revised financial guidance is as follows:
Low | High | ||
Core Funds from Operations | $226 million | $240 million | |
Core Funds from Operations per diluted share | $1.42 | $1.50 | |
These estimates reflect management’s view of current market conditions and incorporate certain economic and operational assumptions and projections. Actual results could differ from these estimates. Note that individual quarters may fluctuate on both a cash basis and an accrual basis due to the timing of lease commencements and expirations, repairs and maintenance, capital expenditures, capital markets activities and one-time revenue or expense events. In addition, the Company’s guidance is based on information available to management as of the date of this supplemental report.
9
Piedmont Office Realty Trust, Inc.
Key Performance Indicators
Unaudited (in thousands except for per share data)
This section of our supplemental report includes non-GAAP financial measures, including, but not limited to, Core Earnings Before Interest, Taxes, Depreciation, and Amortization (Core EBITDA), Funds from Operations (FFO), Core Funds from Operations (Core FFO), and Adjusted Funds from Operations (AFFO). Definitions of these non-GAAP measures are provided on page 39 and reconciliations are provided beginning on page 41. |
Three Months Ended | ||||||||||||||
3/31/2014 | 12/31/2013 | 9/30/2013 | 6/30/2013 | 3/31/2013 | ||||||||||
Selected Operating Data | ||||||||||||||
Percent leased (1) | 86.7 | % | 87.2 | % | 86.7 | % | 86.4 | % | 86.0 | % | ||||
Percent leased - stabilized portfolio (1) (2) | 88.8 | % | 89.7 | % | 89.5 | % | 89.3 | % | 88.9 | % | ||||
Rental income | $110,904 | $113,929 | $115,170 | $107,951 | $106,055 | |||||||||
Total revenues | $136,320 | $141,504 | $143,389 | $132,565 | $132,151 | |||||||||
Total operating expenses | $111,043 | $106,353 | $107,966 | $99,872 | $94,537 | |||||||||
Real estate operating income | $25,277 | $35,151 | $35,423 | $32,693 | $37,614 | |||||||||
Core EBITDA | $74,098 | $79,627 | $80,556 | $76,256 | $78,039 | |||||||||
Core FFO | $55,054 | $59,866 | $61,124 | $57,919 | $61,564 | |||||||||
Core FFO per share - diluted | $0.36 | $0.37 | $0.37 | $0.35 | $0.37 | |||||||||
AFFO | $32,038 | $12,752 | $34,046 | $33,631 | $36,589 | |||||||||
AFFO per share - diluted | $0.21 | $0.08 | $0.21 | $0.20 | $0.22 | |||||||||
Gross dividends | $30,858 | $32,158 | $32,880 | $33,540 | $33,511 | |||||||||
Dividends per share | $0.200 | $0.200 | $0.200 | $0.200 | $0.200 | |||||||||
Selected Balance Sheet Data | ||||||||||||||
Total real estate assets | $3,924,352 | $3,951,983 | $3,872,952 | $3,821,727 | $3,850,989 | |||||||||
Total gross real estate assets | $4,998,289 | $5,003,737 | $4,905,913 | $4,823,983 | $4,822,454 | |||||||||
Total assets | $4,611,945 | $4,666,088 | $4,576,553 | $4,523,302 | $4,538,661 | |||||||||
Net debt (3) | $2,024,503 | $1,996,158 | $1,808,168 | $1,699,633 | $1,681,267 | |||||||||
Total liabilities | $2,232,987 | $2,204,929 | $2,055,870 | $1,893,342 | $1,916,041 | |||||||||
Ratios | ||||||||||||||
Core EBITDA margin (4) | 53.8 | % | 55.5 | % | 55.3 | % | 56.4 | % | 57.6 | % | ||||
Fixed charge coverage ratio (5) | 3.8 x | 4.0 x | 4.2 x | 4.2 x | 4.8 x | |||||||||
Average net debt to Core EBITDA (6) | 6.9 x | 5.9 x | 5.4 x | 5.5 x | 4.7 x | |||||||||
(1) | Please refer to page 26 for additional leased percentage information. |
(2) | Please refer to page 37 for additional information on value-add properties, data for which is removed from stabilized portfolio totals. |
(3) | Net debt is calculated as the total principal amount of debt outstanding minus cash and cash equivalents and escrow deposits and restricted cash. The increase in net debt over the last year is primarily attributable to three property acquisitions completed during the fourth quarter of 2013, as well as capital expenditures and stock repurchases, all of which were largely funded with debt. |
(4) | Core EBITDA margin is calculated as Core EBITDA divided by total revenues (including revenues associated with discontinued operations). |
(5) | The fixed charge coverage ratio is calculated as Core EBITDA divided by the sum of interest expense, principal amortization, capitalized interest and preferred dividends. The Company had no principal amortization or preferred dividends during any of the periods presented; the Company had capitalized interest of $384,843 for the quarter ended March 31, 2014, and $31,486 for the quarter ended December 31, 2013. The fixed charge coverage ratios for the second, third and fourth quarters of 2013 and the first quarter of 2014 are lower than our historical performance on this measure primarily as a result of increased interest expense related to five property acquisitions completed during 2013 as well as capital expenditures and stock repurchases, all of which were largely funded with debt. |
(6) | Core EBITDA is annualized for the purposes of this calculation. The average net debt to Core EBITDA ratios for the second, third and fourth quarters of 2013 and the first quarter of 2014 are higher than our historical performance on this measure primarily as a result of increased net debt attributable to five property acquisitions completed during 2013, as well as capital expenditures and stock repurchases, all of which were largely funded with debt. This measure has also been impacted by downtime associated with recent re-tenanting efforts, as well as rent roll downs. For the purposes of this calculation, we use the average daily balance of debt outstanding during the period, less cash and cash equivalents and escrow deposits and restricted cash as of the end of the period. |
10
Piedmont Office Realty Trust, Inc.
Consolidated Balance Sheets
Unaudited (in thousands)
March 31, 2014 | December 31, 2013 | September 30, 2013 | June 30, 2013 | March 31, 2013 | |||||||||||||||
Assets: | |||||||||||||||||||
Real estate, at cost: | |||||||||||||||||||
Land assets | $ | 682,429 | $ | 686,359 | $ | 675,064 | $ | 665,267 | $ | 668,737 | |||||||||
Buildings and improvements | 4,127,343 | 4,126,532 | 4,010,691 | 3,990,758 | 3,973,593 | ||||||||||||||
Buildings and improvements, accumulated depreciation | (997,350 | ) | (972,531 | ) | (955,007 | ) | (926,130 | ) | (897,230 | ) | |||||||||
Intangible lease asset | 139,141 | 144,947 | 136,364 | 135,748 | 138,085 | ||||||||||||||
Intangible lease asset, accumulated amortization | (69,997 | ) | (71,588 | ) | (70,651 | ) | (69,089 | ) | (67,333 | ) | |||||||||
Construction in progress | 28,847 | 24,269 | 62,359 | 19,816 | 29,826 | ||||||||||||||
Real estate assets held for sale, gross | 20,529 | 21,630 | 21,435 | 12,394 | 12,213 | ||||||||||||||
Real estate assets held for sale, accumulated depreciation & amortization | (6,590 | ) | (7,635 | ) | (7,303 | ) | (7,037 | ) | (6,902 | ) | |||||||||
Total real estate assets | 3,924,352 | 3,951,983 | 3,872,952 | 3,821,727 | 3,850,989 | ||||||||||||||
Investment in unconsolidated joint ventures | 13,855 | 14,122 | 18,668 | 37,631 | 37,835 | ||||||||||||||
Cash and cash equivalents | 9,271 | 6,973 | 15,972 | 10,500 | 17,575 | ||||||||||||||
Tenant receivables, net of allowance for doubtful accounts | 22,196 | 31,145 | 31,006 | 28,618 | 29,237 | ||||||||||||||
Straight line rent receivable | 147,360 | 138,293 | 135,555 | 129,853 | 126,374 | ||||||||||||||
Due from unconsolidated joint ventures | — | 266 | — | 472 | 458 | ||||||||||||||
Escrow deposits and restricted cash | 751 | 394 | 385 | 392 | 683 | ||||||||||||||
Prepaid expenses and other assets | 28,154 | 24,771 | 28,725 | 26,341 | 21,436 | ||||||||||||||
Goodwill | 180,097 | 180,097 | 180,097 | 180,097 | 180,097 | ||||||||||||||
Interest rate swap | 464 | 24,176 | 19,192 | 19,600 | 1,712 | ||||||||||||||
Deferred financing costs, less accumulated amortization | 8,545 | 8,759 | 7,990 | 8,624 | 5,908 | ||||||||||||||
Deferred lease costs, less accumulated amortization | 273,709 | 281,790 | 263,699 | 258,357 | 265,263 | ||||||||||||||
Other assets held for sale | 3,191 | 3,319 | 2,312 | 1,090 | 1,094 | ||||||||||||||
Total assets | $ | 4,611,945 | $ | 4,666,088 | $ | 4,576,553 | $ | 4,523,302 | $ | 4,538,661 | |||||||||
Liabilities: | |||||||||||||||||||
Unsecured debt | $ | 1,617,297 | $ | 1,014,680 | $ | 835,650 | $ | 721,621 | $ | 712,000 | |||||||||
Secured debt | 412,525 | 987,525 | 987,525 | 987,525 | 987,525 | ||||||||||||||
Accounts payable, accrued expenses, and accrued capital expenditures | 130,530 | 128,818 | 159,675 | 118,076 | 139,273 | ||||||||||||||
Deferred income | 23,042 | 22,267 | 26,575 | 18,693 | 23,585 | ||||||||||||||
Intangible lease liabilities, less accumulated amortization | 45,227 | 47,113 | 41,435 | 43,410 | 45,215 | ||||||||||||||
Interest rate swaps | 4,366 | 4,526 | 5,010 | 4,017 | 8,443 | ||||||||||||||
Total liabilities | 2,232,987 | 2,204,929 | 2,055,870 | 1,893,342 | 1,916,041 | ||||||||||||||
Stockholders' equity: | |||||||||||||||||||
Common stock | 1,543 | 1,575 | 1,613 | 1,667 | 1,676 | ||||||||||||||
Additional paid in capital | 3,669,561 | 3,668,906 | 3,668,424 | 3,667,973 | 3,667,614 | ||||||||||||||
Cumulative distributions in excess of earnings | (1,305,321 | ) | (1,231,209 | ) | (1,165,794 | ) | (1,057,534 | ) | (1,041,552 | ) | |||||||||
Other comprehensive loss | 11,562 | 20,278 | 14,827 | 16,245 | (6,731 | ) | |||||||||||||
Piedmont stockholders' equity | 2,377,345 | 2,459,550 | 2,519,070 | 2,628,351 | 2,621,007 | ||||||||||||||
Non-controlling interest | 1,613 | 1,609 | 1,613 | 1,609 | 1,613 | ||||||||||||||
Total stockholders' equity | 2,378,958 | 2,461,159 | 2,520,683 | 2,629,960 | 2,622,620 | ||||||||||||||
Total liabilities, redeemable common stock and stockholders' equity | $ | 4,611,945 | $ | 4,666,088 | $ | 4,576,553 | $ | 4,523,302 | $ | 4,538,661 | |||||||||
Common stock outstanding at end of period | 154,278 | 157,461 | 161,271 | 166,681 | 167,555 | ||||||||||||||
11
Piedmont Office Realty Trust, Inc.
Consolidated Statements of Income
Unaudited (in thousands except for per share data)
Three Months Ended | ||||||||||||||||||||
3/31/2014 | 12/31/2013 | 9/30/2013 | 6/30/2013 | 3/31/2013 | ||||||||||||||||
Revenues: | ||||||||||||||||||||
Rental income | $ | 110,904 | $ | 113,929 | $ | 115,170 | $ | 107,951 | $ | 106,055 | ||||||||||
Tenant reimbursements | 24,929 | 27,358 | 27,329 | 24,101 | 25,465 | |||||||||||||||
Property management fee revenue | 487 | 217 | 890 | 513 | 631 | |||||||||||||||
136,320 | 141,504 | 143,389 | 132,565 | 132,151 | ||||||||||||||||
Expenses: | ||||||||||||||||||||
Property operating costs | 58,271 | 58,263 | 58,137 | 52,223 | 52,155 | |||||||||||||||
Depreciation | 33,644 | 31,691 | 30,295 | 30,169 | 28,825 | |||||||||||||||
Amortization | 14,573 | 11,195 | 13,685 | 11,201 | 9,009 | |||||||||||||||
General and administrative | 4,555 | 5,204 | 5,849 | 6,279 | 4,548 | |||||||||||||||
111,043 | 106,353 | 107,966 | 99,872 | 94,537 | ||||||||||||||||
Real estate operating income | 25,277 | 35,151 | 35,423 | 32,693 | 37,614 | |||||||||||||||
Other income / (expense): | ||||||||||||||||||||
Interest expense | (18,926 | ) | (19,651 | ) | (19,331 | ) | (18,228 | ) | (16,373 | ) | ||||||||||
Other income / (expense) | (90 | ) | (392 | ) | (596 | ) | (72 | ) | (1,277 | ) | ||||||||||
Net recoveries / (loss) from casualty events and litigation settlements (1) | 3,042 | 4,500 | 3,919 | 3,553 | (161 | ) | ||||||||||||||
Equity in income of unconsolidated joint ventures (2) | (266 | ) | (4,280 | ) | 46 | 163 | 395 | |||||||||||||
Gain / (loss) on consolidation | — | — | (898 | ) | — | — | ||||||||||||||
(16,240 | ) | (19,823 | ) | (16,860 | ) | (14,584 | ) | (17,416 | ) | |||||||||||
Income from continuing operations | 9,037 | 15,328 | 18,563 | 18,109 | 20,198 | |||||||||||||||
Discontinued operations: | ||||||||||||||||||||
Operating income, excluding impairment loss | 466 | 506 | 537 | 995 | 859 | |||||||||||||||
Impairment loss | — | (1,242 | ) | — | — | (6,402 | ) | |||||||||||||
Gain / (loss) on sale of properties | (106 | ) | 15,034 | — | 16,258 | — | ||||||||||||||
Income / (loss) from discontinued operations (3) | 360 | 14,298 | 537 | 17,253 | (5,543 | ) | ||||||||||||||
Net income | 9,397 | 29,626 | 19,100 | 35,362 | 14,655 | |||||||||||||||
Less: Net income attributable to noncontrolling interest | (4 | ) | (3 | ) | (4 | ) | (4 | ) | (4 | ) | ||||||||||
Net income attributable to Piedmont | $ | 9,393 | $ | 29,623 | $ | 19,096 | $ | 35,358 | $ | 14,651 | ||||||||||
Weighted average common shares outstanding - diluted | 155,025 | 160,450 | 164,796 | 167,714 | 167,810 | |||||||||||||||
Net income per share available to common stockholders - diluted | $ | 0.06 | $ | 0.18 | $ | 0.12 | $ | 0.21 | $ | 0.09 | ||||||||||
(1) | Presented on this line are net expenses and insurance reimbursements related to 1) two class action lawsuits settled in 2013 and 2) damage caused by Hurricane Sandy in October 2012. |
(2) | During the fourth quarter of 2013, Piedmont recorded an impairment charge of $4.4 million related to its equity ownership interest in Two Park Center in Hoffman Estates, IL. Please refer to page 38 for additional information about Piedmont's unconsolidated joint venture interests. |
(3) | Reflects operating results for 1111 Durham Avenue in South Plainfield, NJ, which was sold on March 28, 2013; 1200 Enclave Parkway in Houston, TX, which was sold on May 1, 2013; 350 Spectrum Loop in Colorado Springs, CO, which was sold on November 1, 2013; 8700 South Price Road in Tempe, AZ, which was sold on December 30, 2013; and 11107 and 11109 Sunset Hills Road in Reston, VA, which were sold on March 19, 2014. |
12
Piedmont Office Realty Trust, Inc.
Consolidated Statements of Income
Unaudited (in thousands except for per share data)
Three Months Ended | ||||||||||||
3/31/2014 | 3/31/2013 | Change ($) | Change (%) | |||||||||
Revenues: | ||||||||||||
Rental income | $ | 110,904 | $ | 106,055 | $ | 4,849 | 4.6 | % | ||||
Tenant reimbursements | 24,929 | 25,465 | (536 | ) | (2.1 | )% | ||||||
Property management fee revenue | 487 | 631 | (144 | ) | (22.8 | )% | ||||||
136,320 | 132,151 | 4,169 | 3.2 | % | ||||||||
Expenses: | ||||||||||||
Property operating costs | 58,271 | 52,155 | (6,116 | ) | (11.7 | )% | ||||||
Depreciation | 33,644 | 28,825 | (4,819 | ) | (16.7 | )% | ||||||
Amortization | 14,573 | 9,009 | (5,564 | ) | (61.8 | )% | ||||||
General and administrative | 4,555 | 4,548 | (7 | ) | (0.2 | )% | ||||||
111,043 | 94,537 | (16,506 | ) | (17.5 | )% | |||||||
Real estate operating income | 25,277 | 37,614 | (12,337 | ) | (32.8 | )% | ||||||
Other income / (expense): | ||||||||||||
Interest expense | (18,926 | ) | (16,373 | ) | (2,553 | ) | (15.6 | )% | ||||
Other income / (expense) | (90 | ) | (1,277 | ) | 1,187 | 93.0 | % | |||||
Net recoveries / (loss) from casualty events and litigation settlements (1) | 3,042 | (161 | ) | 3,203 | 1,989.4 | % | ||||||
Equity in income of unconsolidated joint ventures | (266 | ) | 395 | (661 | ) | (167.3 | )% | |||||
(16,240 | ) | (17,416 | ) | 1,176 | 6.8 | % | ||||||
Income from continuing operations | 9,037 | 20,198 | (11,161 | ) | (55.3 | )% | ||||||
Discontinued operations: | ||||||||||||
Operating income, excluding impairment loss | 466 | 859 | (393 | ) | (45.8 | )% | ||||||
Impairment loss | — | (6,402 | ) | 6,402 | 100.0 | % | ||||||
Gain / (loss) on sale of properties | (106 | ) | — | (106 | ) | — | % | |||||
Income / (loss) from discontinued operations (2) | 360 | (5,543 | ) | 5,903 | 106.5 | % | ||||||
Net income | 9,397 | 14,655 | (5,258 | ) | (35.9 | )% | ||||||
Less: Net income attributable to noncontrolling interest | (4 | ) | (4 | ) | — | — | % | |||||
Net income attributable to Piedmont | $ | 9,393 | $ | 14,651 | $ | (5,258 | ) | (35.9 | )% | |||
Weighted average common shares outstanding - diluted | 155,025 | 167,810 | ||||||||||
Net income per share available to common stockholders - diluted | $ | 0.06 | $ | 0.09 | ||||||||
(1) | Presented on this line are net expenses and insurance reimbursements related to 1) two class action lawsuits settled in 2013 and 2) damage caused by Hurricane Sandy in October 2012. |
(2) | Reflects operating results for 1111 Durham Avenue in South Plainfield, NJ, which was sold on March 28, 2013; 1200 Enclave Parkway in Houston, TX, which was sold on May 1, 2013; 350 Spectrum Loop in Colorado Springs, CO, which was sold on November 1, 2013; 8700 South Price Road in Tempe, AZ, which was sold on December 30, 2013; and 11107 and 11109 Sunset Hills Road in Reston, VA, which were sold on March 19, 2014. |
13
Piedmont Office Realty Trust, Inc.
Funds From Operations, Core Funds From Operations and Adjusted Funds From Operations
Unaudited (in thousands except for per share data)
Three Months Ended | ||||||||
3/31/2014 | 3/31/2013 | |||||||
Net income attributable to Piedmont | $ | 9,393 | $ | 14,651 | ||||
Depreciation (1) (2) | 33,727 | 29,886 | ||||||
Amortization (1) | 14,804 | 9,220 | ||||||
Impairment loss (1) | — | 6,402 | ||||||
Loss / (gain) on sale of properties (1) | 106 | — | ||||||
Funds from operations | 58,030 | 60,159 | ||||||
Adjustments: | ||||||||
Acquisition costs | 66 | 1,244 | ||||||
Net (recoveries) / loss from casualty events and litigation settlements (1) | (3,042 | ) | 161 | |||||
Core funds from operations | 55,054 | 61,564 | ||||||
Adjustments: | ||||||||
Deferred financing cost amortization | 863 | 594 | ||||||
Amortization of discount on senior notes | 34 | — | ||||||
Depreciation of non real estate assets | 114 | 98 | ||||||
Straight-line effects of lease revenue (1) | (9,412 | ) | (4,032 | ) | ||||
Stock-based and other non-cash compensation expense | 636 | 594 | ||||||
Amortization of lease-related intangibles (1) | (1,364 | ) | (1,065 | ) | ||||
Acquisition costs | (66 | ) | (1,244 | ) | ||||
Non-incremental capital expenditures (3) | (13,821 | ) | (19,920 | ) | ||||
Adjusted funds from operations | $ | 32,038 | $ | 36,589 | ||||
Weighted average common shares outstanding - diluted | 155,025 | 167,810 | ||||||
Funds from operations per share (diluted) | $ | 0.37 | $ | 0.36 | ||||
Core funds from operations per share (diluted) | $ | 0.36 | $ | 0.37 | ||||
Adjusted funds from operations per share (diluted) | $ | 0.21 | $ | 0.22 | ||||
(1) | Includes adjustments for consolidated properties, including discontinued operations, and for our proportionate share of amounts attributable to unconsolidated joint ventures. |
(2) | Excludes depreciation of non real estate assets. |
(3) | Non-incremental capital expenditures are defined on page 39. |
14
Piedmont Office Realty Trust, Inc.
Same Store Net Operating Income (Cash Basis)
Unaudited (in thousands)
Three Months Ended | |||||||
3/31/2014 | 3/31/2013 | ||||||
Net income attributable to Piedmont | $ | 9,393 | $ | 14,651 | |||
Net income attributable to noncontrolling interest | 4 | 4 | |||||
Interest expense (1) | 18,926 | 16,373 | |||||
Depreciation (1) | 33,841 | 29,984 | |||||
Amortization (1) | 14,804 | 9,220 | |||||
Acquisition costs | 66 | 1,244 | |||||
Impairment loss (1) | — | 6,402 | |||||
Net (recoveries) / loss from casualty events and litigation settlements (1) | (3,042 | ) | 161 | ||||
Loss / (gain) on sale of properties (1) | 106 | — | |||||
Core EBITDA | 74,098 | 78,039 | |||||
General & administrative expenses (1) | 4,582 | 4,609 | |||||
Management fee revenue (2) | (259 | ) | (356 | ) | |||
Other (income) / expense (1) | 30 | 21 | |||||
Straight-line effects of lease revenue (1) | (9,412 | ) | (4,032 | ) | |||
Amortization of lease-related intangibles (1) | (1,364 | ) | (1,065 | ) | |||
Property net operating income (cash basis) | 67,675 | 77,216 | |||||
Deduct net operating (income) / loss from: | |||||||
Acquisitions (3) | (5,798 | ) | (860 | ) | |||
Dispositions (4) | (364 | ) | (1,022 | ) | |||
Other investments (5) | 382 | (2,704 | ) | ||||
Same store net operating income (cash basis) | $ | 61,895 | $ | 72,630 | |||
Change period over period | (14.8 | )% | * | N/A | |||
* Explanation for Change in Same Store Net Operating Income | ||||||
Property | Location | Amount | Explanation | |||
Aon Center | Chicago, IL | $ | (7,472 | ) | Expiration of the BP lease in December 2013; income from BP recognized the entirety of the first quarter of 2013; replacement leases covering 97% of the former BP space are in rental abatement periods or have not yet commenced. | |
One Independence Square | Washington, D.C. | (2,975 | ) | Expiration of the Office of the Comptroller of the Currency lease at the beginning of March 2013. | ||
1901 Market Street | Philadelphia, PA | (2,557 | ) | Restructuring of the Independence Blue Cross lease such that the large annual lump sum payment is no longer made during the first quarter of every year; rental installments are now paid evenly on a monthly basis throughout a lease year with annual 2.25% steps. | ||
6021 Connection Drive | Irving, TX | (1,307 | ) | Expiration of the Nokia lease in December 2013; income from Nokia recognized the entirety of the first quarter of 2013; replacement lease with Epsilon Data Management will commence at the beginning of the third quarter of 2014. | ||
Subtotal | $ | (14,311 | ) | |||
Amount of Variance Explained | 133 | % | Greater than 100% explained; difference represents net operating income growth at other assets within the portfolio. | |||
15
Same Store Net Operating Income | |||||||||||
Top Seven Markets | Three Months Ended | ||||||||||
3/31/2014 | 3/31/2013 | ||||||||||
$ | % | $ | % | ||||||||
New York | $ | 12,116 | 19.6 | $ | 12,086 | 16.6 | |||||
Washington, D.C. (6) | 11,118 | 18.0 | 16,189 | 22.3 | |||||||
Minneapolis | 5,524 | 8.9 | 5,653 | 7.8 | |||||||
Boston | 4,919 | 7.9 | 4,722 | 6.5 | |||||||
Chicago (7) (8) | 3,635 | 5.9 | 8,594 | 11.8 | |||||||
Los Angeles | 3,583 | 5.8 | 3,347 | 4.6 | |||||||
Dallas (9) | 3,396 | 5.5 | 3,629 | 5.0 | |||||||
Other (10) | 17,604 | 28.4 | 18,410 | 25.4 | |||||||
Total | $ | 61,895 | 100.0 | $ | 72,630 | 100.0 | |||||
(1) | Includes amounts attributable to consolidated properties, including discontinued operations, and our proportionate share of amounts attributable to unconsolidated joint ventures. |
(2) | Presented net of related operating expenses incurred to earn the revenue; therefore, the information presented on this line will not tie to the data presented on the income statements. |
(3) | Acquisitions consist of Arlington Gateway in Arlington, VA, purchased on March 4, 2013; 5 & 15 Wayside Road in Burlington, MA, purchased on March 22, 2013; Royal Lane Land in Irving, TX, purchased on August 1, 2013; 5301 Maryland Way in Brentwood, TN, 4685 Investment Drive in Troy, MI, and 2020 West 89th Street in Leawood, KS, the remaining equity interests in which were purchased on August 12, 2013; 6565 North MacArthur Boulevard in Irving, TX, purchased on December 5, 2013; One Lincoln Park in Dallas, TX, purchased on December 20, 2013; and 161 Corporate Center in Irving, TX, purchased on December 30, 2013. |
(4) | Dispositions consist of 1111 Durham Avenue in South Plainfield, NJ, sold on March 28, 2013; 1200 Enclave Parkway in Houston, TX, sold on May 1, 2013; 350 Spectrum Loop in Colorado Springs, CO, sold on November 1, 2013; 8700 South Price Road in Tempe, AZ, sold on December 30, 2013; and 11107 and 11109 Sunset Hills Road in Reston, VA, sold on March 19, 2014. |
(5) | Other investments consist of operating results from our investments in unconsolidated joint ventures and our redevelopment projects. Additional information on our unconsolidated joint ventures and redevelopment projects can be found on page 38. The operating results from both the office and retail portions of 3100 Clarendon Boulevard in Arlington, VA, are included in this line item, consisting of a ($256,000) net operating loss and $1,960,000 in net operating income, for the periods ending March 31, 2014 and March 31, 2013, respectively. |
(6) | The decrease in Washington, D.C. Same Store Net Operating Income for the three months ended March 31, 2014 as compared to the same period in 2013 was primarily attributable to the expiration of the Office of the Comptroller of the Currency lease at One Independence Square in Washington, D.C., as well as the expiration of the NCS Pearson and Vangent leases at 4250 North Fairfax Drive in Arlington, VA. |
(7) | The decrease in Chicago Same Store Net Operating Income for the three months ended March 31, 2014 as compared to the same period in 2013 was primarily related to tenant transitions and rental abatements at Aon Center in Chicago, IL. Specifically, several new leases replacing the expired BP lease, including those of Aon and Thoughtworks, along with a portion of that for Federal Home Loan Bank of Chicago, provide the new tenants with gross rental abatements. Additionally, there will be approximately five months of downtime between the expiration of the BP lease and the commencement of one of the replacement leases with Integrys. |
(8) | The percentage contribution from Chicago to our total Same Store Net Operating Income is smaller than our geographic concentration percentage in Chicago, which is presented on an ALR basis (see page 33), primarily because of the large number of leases with gross rent abatements and a number of leases yet to commence for currently vacant spaces (the projected gross rent for which is included in our ALR calculation). As the gross rent abatements burn off and as executed but not commenced leases begin, the Same Store Net Operating Income percentage contribution from Chicago should increase and should be more closely aligned with our Chicago concentration percentage as presented on page 33. |
(9) | The decrease in Dallas Same Store Net Operating Income for the three months ended March 31, 2014 as compared to the same period in 2013 was primarily related to a tenant transition at 6021 Connection Drive in Irving, TX. Specifically, the decrease in net operating income is predominantly related to the downtime between the expiration of the Nokia lease at the end of 2013 and the commencement of the Epsilon lease, which is projected to be at the beginning of the third quarter of 2014. |
(10) | The decrease in Other Same Store Net Operating Income for the three months ended March 31, 2014 as compared to the same period in 2013 was primarily related to the restructured Independence Blue Cross lease at 1901 Market Street in Philadelphia, PA. Before the restructuring of the Independence Blue Cross lease, the tenant made a large lump sum payment during the first quarter of the year; under the restructured lease, rental payments have been spread evenly throughout any particular lease year. |
16
Piedmont Office Realty Trust, Inc.
Same Store Net Operating Income (Accrual Basis)
Unaudited (in thousands)
Three Months Ended | |||||||
3/31/2014 | 3/31/2013 | ||||||
Net income attributable to Piedmont | $ | 9,393 | $ | 14,651 | |||
Net income attributable to noncontrolling interest | 4 | 4 | |||||
Interest expense (1) | 18,926 | 16,373 | |||||
Depreciation (1) | 33,841 | 29,984 | |||||
Amortization (1) | 14,804 | 9,220 | |||||
Acquisition costs | 66 | 1,244 | |||||
Impairment loss (1) | — | 6,402 | |||||
Net (recoveries) / loss from casualty events and litigation settlements (1) | (3,042 | ) | 161 | ||||
Loss / (gain) on sale of properties (1) | 106 | — | |||||
Core EBITDA | 74,098 | 78,039 | |||||
General & administrative expenses (1) | 4,582 | 4,609 | |||||
Management fee revenue (2) | (259 | ) | (356 | ) | |||
Other (income) / expense (1) | 30 | 21 | |||||
Property net operating income (accrual basis) | 78,451 | 82,313 | |||||
Deduct net operating (income) / loss from: | |||||||
Acquisitions (3) | (6,682 | ) | (911 | ) | |||
Dispositions (4) | (355 | ) | (1,608 | ) | |||
Other investments (5) | 372 | (2,743 | ) | ||||
Same store net operating income (accrual basis) | $ | 71,786 | $ | 77,051 | |||
Change period over period | (6.8 | )% | * | N/A | |||
* Explanation for Change in Same Store Net Operating Income | ||||||
Property | Location | Amount | Explanation | |||
Aon Center | Chicago, IL | $ | (4,503 | ) | Expiration of the BP lease in December 2013; income from BP recognized the entirety of the first quarter of 2013; replacement leases covering 97% of the former BP space are in operating expense recovery abatement periods or have not yet commenced. | |
One Independence Square | Washington, D.C. | (2,953 | ) | Expiration of the Office of the Comptroller of the Currency lease at the beginning of March 2013. | ||
6021 Connection Drive | Irving, TX | (1,406 | ) | Expiration of the Nokia lease in December 2013; income from Nokia recognized the entirety of the first quarter of 2013; replacement lease with Epsilon Data Management will commence at the beginning of the third quarter of 2014. | ||
Subtotal | $ | (8,862 | ) | |||
Amount of Variance Explained | 168 | % | Greater than 100% explained; difference represents net operating income growth at other assets within the portfolio. | |||
17
Same Store Net Operating Income | |||||||||||
Top Seven Markets | Three Months Ended | ||||||||||
3/31/2014 | 3/31/2013 | ||||||||||
$ | % | $ | % | ||||||||
New York | $ | 13,438 | 18.7 | $ | 13,284 | 17.2 | |||||
Washington, D.C. (6) | 11,208 | 15.6 | 16,487 | 21.4 | |||||||
Chicago (7) (8) | 8,759 | 12.2 | 12,083 | 15.7 | |||||||
Minneapolis | 5,971 | 8.3 | 5,987 | 7.8 | |||||||
Boston | 4,957 | 6.9 | 5,006 | 6.5 | |||||||
Los Angeles (9) | 4,142 | 5.8 | 3,323 | 4.3 | |||||||
Dallas (10) | 3,389 | 4.7 | 3,748 | 4.9 | |||||||
Other (11) | 19,922 | 27.8 | 17,133 | 22.2 | |||||||
Total | $ | 71,786 | 100.0 | $ | 77,051 | 100.0 | |||||
(1) | Includes amounts attributable to consolidated properties, including discontinued operations, and our proportionate share of amounts attributable to unconsolidated joint ventures. |
(2) | Presented net of related operating expenses incurred to earn the revenue; therefore, the information presented on this line will not tie to the data presented on the income statements. |
(3) | Acquisitions consist of Arlington Gateway in Arlington, VA, purchased on March 4, 2013; 5 & 15 Wayside Road in Burlington, MA, purchased on March 22, 2013; Royal Lane Land in Irving, TX, purchased on August 1, 2013; 5301 Maryland Way in Brentwood, TN, 4685 Investment Drive in Troy, MI, and 2020 West 89th Street in Leawood, KS, the remaining equity interests in which were purchased on August 12, 2013; 6565 North MacArthur Boulevard in Irving, TX, purchased on December 5, 2013; One Lincoln Park in Dallas, TX, purchased on December 20, 2013; and 161 Corporate Center in Irving, TX, purchased on December 30, 2013. |
(4) | Dispositions consist of 1111 Durham Avenue in South Plainfield, NJ, sold on March 28, 2013; 1200 Enclave Parkway in Houston, TX, sold on May 1, 2013; 350 Spectrum Loop in Colorado Springs, CO, sold on November 1, 2013; 8700 South Price Road in Tempe, AZ, sold on December 30, 2013; and 11107 and 11109 Sunset Hills Road in Reston, VA, sold on March 19, 2014. |
(5) | Other investments consist of operating results from our investments in unconsolidated joint ventures and our redevelopment projects. Additional information on our unconsolidated joint ventures and redevelopment projects can be found on page 38. The operating results from both the office and retail portions of 3100 Clarendon Boulevard in Arlington, VA, are included in this line item, consisting of a ($252,000) net operating loss and $1,947,000 in net operating income, for the periods ending March 31, 2014 and March 31, 2013, respectively. |
(6) | The decrease in Washington, D.C. Same Store Net Operating Income for the three months ended March 31, 2014 as compared to the same period in 2013 was primarily attributable to the expiration of the Office of the Comptroller of the Currency lease at One Independence Square in Washington, D.C., as well as the expiration of the NCS Pearson and Vangent leases at 4250 North Fairfax Drive in Arlington, VA. |
(7) | The decrease in Chicago Same Store Net Operating Income for the three months ended March 31, 2014 as compared to the same period in 2013 was primarily related to tenant transitions at Aon Center in Chicago, IL. The main contributors to the decrease in net operating income contribution from Aon Center were: 1) downtime between the expiration of the BP lease and the commencement of one of the replacement leases with Integrys, 2) operating expense recovery abatements (which abatements are not included in straight line rent adjustments) associated with several of the replacement leases for the space formerly occupied by BP, and 3) rental rate roll downs associated with several new leases replacing the expired BP lease. |
(8) | The percentage contribution from Chicago to our total Same Store Net Operating Income is smaller than our geographic concentration percentage in Chicago, which is presented on an ALR basis (see page 33), primarily because of the large number of leases with operating expense recovery abatements (which abatements are not included in straight line rent adjustments) and a number of leases yet to commence for currently vacant spaces (the projected gross rents for which are included in our ALR calculation). As operating expense recovery abatements burn off and as executed but not commenced leases begin, the Same Store Net Operating Income percentage contribution from Chicago should increase and should be more closely aligned with our Chicago concentration percentage as presented on page 33. |
(9) | The increase in Los Angeles Same Store Net Operating Income for the three months ended March 31, 2014 as compared to the same period in 2013 was primarily related to increased rental income associated with the new lease with Guidance Software at 1055 East Colorado Boulevard in Pasadena, CA, which commenced in mid-2013, along with increased rental income associated with new leases with Union Bank and Front Porch Communities at 800 North Brand Boulevard in Glendale, CA, both of which commenced in early 2014. |
(10) | The decrease in Dallas Same Store Net Operating Income for the three months ended March 31, 2014 as compared to the same period in 2013 was primarily related to a tenant transition at 6021 Connection Drive in Irving, TX. Specifically, the decrease in net operating income is predominantly related to the downtime between the expiration of the Nokia lease at the end of 2013 and the commencement of the Epsilon lease, which is projected to be at the beginning of the third quarter of 2014. |
(11) | The increase in Other Same Store Net Operating Income for the three months ended March 31, 2014 as compared to the same period in 2013 was primarily related to 1) increased rental income under the restructured Independence Blue Cross lease at 1901 Market Street in Philadelphia, PA, 2) increased rental income at Glenridge Highlands Two in Atlanta, GA, attributable the several new leases commencing in 2013 and 2014, and 3) increased rental income at Eastpoint I in Mayfield Heights, OH, related to the commencement of a new lease with TMW Systems in early 2014. |
18
Piedmont Office Realty Trust, Inc.
Capitalization Analysis
Unaudited (in thousands except for per share data)
As of | As of | |||||||
March 31, 2014 | December 31, 2013 | |||||||
Common stock price (1) | $ | 17.15 | $ | 16.52 | ||||
Total shares outstanding | 154,278 | 157,461 | ||||||
Equity market capitalization (1) | $ | 2,645,866 | $ | 2,601,254 | ||||
Total debt - principal amount outstanding | $ | 2,034,525 | $ | 2,003,525 | ||||
Total market capitalization (1) | $ | 4,680,391 | $ | 4,604,779 | ||||
Total debt / Total market capitalization | 43.5 | % | 43.5 | % | ||||
Total gross real estate assets | $ | 4,998,289 | $ | 5,003,737 | ||||
Total debt / Total gross real estate assets (2) | 40.7 | % | 40.0 | % | ||||
Total debt / Total gross assets (3) | 35.8 | % | 35.0 | % | ||||
(1) | Reflects common stock closing price as of the end of the reporting period. |
(2) | Gross real estate assets is defined as total real estate assets with the add back of accumulated depreciation and accumulated amortization related to real estate assets. |
(3) | Gross assets is defined as total assets with the add back of accumulated depreciation and accumulated amortization related to real estate assets. |
19
Piedmont Office Realty Trust, Inc.
Debt Summary
As of March 31, 2014
Unaudited ($ in thousands)
Floating Rate & Fixed Rate Debt
Debt (1) | Principal Amount Outstanding | Weighted Average Stated Interest Rate | Weighted Average Maturity | ||
Floating Rate | $372,000 | (2) | 1.34% | 45.4 months | |
Fixed Rate | 1,662,525 | 3.99% | 71.7 months | ||
Total | $2,034,525 | 3.50% | 66.9 months | ||

Unsecured & Secured Debt
Debt (1) | Principal Amount Outstanding | Weighted Average Stated Interest Rate | Weighted Average Maturity | |||
Unsecured | $1,622,000 | 2.98% | (3) | 76.7 months | ||
Secured | 412,525 | 5.56% | 28.5 months | |||
Total | $2,034,525 | 3.50% | 66.9 months | |||

Debt Maturities
Maturity Year | Secured Debt - Principal Amount Outstanding (1) | Unsecured Debt - Principal Amount Outstanding (1) | Weighted Average Stated Interest Rate | Percentage of Total | |
2014 | $— | $— | N/A | —% | |
2015 | 105,000 | — | 5.29% | 5.2% | |
2016 | 167,525 | 300,000 | 3.71% | 23.0% | |
2017 | 140,000 | 272,000 | (4) | 2.84% | 20.2% |
2018 | — | — | N/A | —% | |
2019 + | — | 1,050,000 | 3.49% | 51.6% | |
Total | $412,525 | $1,622,000 | 3.50% | 100.0% | |
(1) | All of Piedmont's outstanding debt as of March 31, 2014 was interest-only debt. |
(2) | Amount represents the outstanding balance as of March 31, 2014, on the $500 million unsecured revolving credit facility and $100 million of the $300 million unsecured term loan that closed during the fourth quarter of 2013 that remains unhedged. Both the $300 million unsecured term loan that closed in 2011 and the $300 million unsecured term loan that closed in 2013 have stated variable rates; however, Piedmont entered into $300 million in notional amount of interest rate swap agreements which effectively fix the interest rate on the 2011 unsecured term loan at 2.69% through its maturity date of November 22, 2016, assuming no credit rating change for the Company, and $200 million in notional amount of interest rate swap agreements which effectively fix the interest rate on $200 million of the 2013 unsecured term loan at 2.79% through its maturity date of January 31, 2019, assuming no credit rating change for the Company. The 2011 unsecured term loan and $200 million of the 2013 unsecured term loan, therefore, are reflected as fixed rate debt. |
(3) | The weighted average interest rate is a weighted average rate for amounts outstanding under our $500 million unsecured revolving credit facility, our unsecured senior notes and our unsecured term loans. As presented herein, the weighted average stated interest rate is calculated based upon the principal amounts outstanding. |
(4) | The initial maturity date of the $500 million unsecured revolving credit facility is August 19, 2016; however, there are two, six-month extension options available under the facility providing for a final extended maturity date of August 21, 2017. For the purposes of this schedule, we reflect the maturity date of the facility as the final extended maturity date of August 2017. |
20
Piedmont Office Realty Trust, Inc.
Debt Detail
Unaudited ($ in thousands)
Facility | Property | Stated Rate (1) | Maturity | Principal Amount Outstanding as of March 31, 2014 | |||
Secured | |||||||
$105.0 Million Fixed-Rate Loan | US Bancorp Center | 5.29 | % | 5/11/2015 | $105,000 | ||
$125.0 Million Fixed-Rate Loan | Four Property Collateralized Pool (2) | 5.50 | % | 4/1/2016 | 125,000 | ||
$42.5 Million Fixed-Rate Loan | Las Colinas Corporate Center I & II | 5.70 | % | 10/11/2016 | 42,525 | ||
$140.0 Million WDC Fixed-Rate Loans | 1201 & 1225 Eye Street | 5.76 | % | 11/1/2017 | 140,000 | ||
Subtotal / Weighted Average (3) | 5.56 | % | $412,525 | ||||
Unsecured | |||||||
$500.0 Million Unsecured Line of Credit (4) | N/A | 1.34 | % | (5) | 8/21/2017 | $272,000 | |
$350.0 Million Unsecured Senior Notes (6) | N/A | 3.40 | % | 6/1/2023 | 350,000 | ||
$400.0 Million Unsecured Senior Notes (7) | N/A | 4.45 | % | 3/15/2024 | 400,000 | ||
$300.0 Million Unsecured 2011 Term Loan | N/A | 2.69 | % | (8) | 11/22/2016 | 300,000 | |
$300.0 Million Unsecured 2013 Term Loan | N/A | 2.31 | % | (9) | 1/31/2019 | 300,000 | |
Subtotal / Weighted Average (3) | 2.98 | % | $1,622,000 | ||||
Total Debt - Principal Amount Outstanding / Weighted Average Stated Rate (3) | 3.50 | % | $2,034,525 | ||||
GAAP Accounting Adjustments (10) | (4,703 | ) | |||||
Total Debt - GAAP Amount Outstanding | $2,029,822 | ||||||
(1) | All of Piedmont’s outstanding debt as of March 31, 2014, was interest-only debt. |
(2) | The four property collateralized pool includes 1430 Enclave Parkway, Windy Point I and II, and 1055 East Colorado Boulevard. |
(3) | Weighted average is based on the total balance outstanding and interest rate at March 31, 2014. |
(4) | All of Piedmont’s outstanding debt as of March 31, 2014, was term debt with the exception of $272 million outstanding on our unsecured revolving credit facility. The $500 million unsecured revolving credit facility has an initial maturity date of August 19, 2016; however, there are two, six-month extension options available under the facility providing for a total extension of up to one year to August 21, 2017. The final extended maturity date is presented on this schedule. |
(5) | The interest rate presented for the $500 million unsecured revolving credit facility is the weighted average interest rate for all outstanding draws as of March 31, 2014. Piedmont may select from multiple interest rate options with each draw under this facility, including the prime rate and various length LIBOR locks. All LIBOR selections are subject to an additional spread (1.175% as of March 31, 2014) over the selected rate based on Piedmont’s current credit rating. |
(6) | The $350 million unsecured senior notes were offered for sale at 99.601% of the principal amount. The resulting effective cost of the financing is approximately 3.45% before the consideration of transaction costs and proceeds from interest rate hedges. After the application of proceeds from interest rate hedges, the effective cost of the financing is approximately 3.43%. |
(7) | The $400 million unsecured senior notes were offered for sale at 99.791% of the principal amount. The resulting effective cost of the financing is approximately 4.48% before the consideration of transaction costs and proceeds from interest rate hedges. After the application of proceeds from interest rate hedges, the effective cost of the financing is approximately 4.10%. |
(8) | The $300 million unsecured term loan that closed in 2011 has a stated variable rate; however, Piedmont entered into interest rate swap agreements which effectively fix the interest rate on this loan at 2.69% through its maturity date of November 22, 2016, assuming no credit rating change for the Company. |
(9) | Piedmont may select from multiple interest rate options under this facility, including the prime rate and various length LIBOR locks. All LIBOR selections are subject to an additional spread (1.20% as of March 31, 2014) over the selected rate based on Piedmont’s current credit rating. Piedmont entered into interest rate swap agreements which effectively fix the interest rate on $200 million of this loan at 2.79% through its maturity date of January 31, 2019, assuming no credit rating change for the Company. The interest rate presented is the weighted average interest rate comprised of the fixed rate portion and the floating rate portion. |
(10) | The GAAP accounting adjustments relate to the original issue discounts and fees associated with the $350 million unsecured senior notes and the $400 million unsecured senior notes. The original issue discounts and fees will be amortized to interest expense over the contractual term of the related debt issuance. |
21
Piedmont Office Realty Trust, Inc.
Debt Analysis
As of March 31, 2014
Unaudited
Bank Debt Covenant Compliance (1) | Required | Actual |
Maximum Leverage Ratio | 0.60 | 0.36 |
Minimum Fixed Charge Coverage Ratio (2) | 1.50 | 3.77 |
Maximum Secured Indebtedness Ratio | 0.40 | 0.07 |
Minimum Unencumbered Leverage Ratio | 1.60 | 2.98 |
Minimum Unencumbered Interest Coverage Ratio (3) | 1.75 | 8.92 |
Bond Covenant Compliance (4) | Required | Actual |
Total Debt to Total Assets | 60% or less | 40.0% |
Secured Debt to Total Assets | 40% or less | 8.0% |
Ratio of Consolidated EBITDA to Interest Expense | 1.50 or greater | 4.20 |
Unencumbered Assets to Unsecured Debt | 150% or greater | 328% |
Three Months Ended | Three Months Ended | Year Ended | |
Other Debt Coverage Ratios | March 31, 2014 | March 31, 2014 | December 31, 2013 |
Average net debt to core EBITDA (5) | 6.9 x | 5.4 x | |
Fixed charge coverage ratio (6) | 3.8 x | 4.3 x | |
Interest coverage ratio (7) | 3.8 x | 4.3 x | |
(1) | Debt covenant compliance calculations relate to specific calculations detailed in the relevant credit agreements. |
(2) | Defined as EBITDA for the trailing four quarters (including the Company's share of EBITDA from unconsolidated interests), less one-time or non-recurring gains or losses, less a $0.15 per square foot capital reserve, and excluding the impact of straight line rent leveling adjustments and amortization of intangibles divided by the Company's share of fixed charges, as more particularly described in the credit agreements. This definition of fixed charge coverage ratio as prescribed by our credit agreements is different from the fixed charge coverage ratio definition employed elsewhere within this report. |
(3) | Defined as net operating income for the trailing four quarters for unencumbered assets (including the Company's share of net operating income from partially-owned entities and subsidiaries that are deemed to be unencumbered) less a $0.15 per square foot capital reserve divided by the Company's share of interest expense associated with unsecured financings only, as more particularly described in the credit agreements. |
(4) | Please refer to the Indenture dated May 9, 2013 and the Indenture and the Supplemental Indenture dated March 6, 2014, for additional information on the relevant calculations. |
(5) | For the purposes of this calculation, we use the average daily balance of debt outstanding during the period, less cash and cash equivalents and escrow deposits and restricted cash as of the end of the period. |
(6) | Fixed charge coverage is calculated as Core EBITDA divided by the sum of interest expense, principal amortization, capitalized interest and preferred dividends. The Company had no principal amortization or preferred dividends during the periods ended March 31, 2014 and December 31, 2013. The Company had capitalized interest of $384,843 for the quarter ended March 31, 2014, and $31,486 for the year ended December 31, 2013. |
(7) | Interest coverage ratio is calculated as Core EBITDA divided by the sum of interest expense and capitalized interest. The Company had capitalized interest of $384,843 for the quarter ended March 31, 2014, and $31,486 for the year ended December 31, 2013. |
22
Piedmont Office Realty Trust, Inc.
Tenant Diversification (1)
As of March 31, 2014
(in thousands except for number of properties)
Tenant | Credit Rating (2) | Number of Properties | Lease Expiration (3) | Annualized Lease Revenue | Percentage of Annualized Lease Revenue (%) | Leased Square Footage | Percentage of Leased Square Footage (%) | |
U.S. Government | AA+ / Aaa | 7 | (4) | $45,543 | 8.2 | 1,013 | 5.5 | |
US Bancorp | A+ / A1 | 3 | 2014 / 2023 / 2024 | (5) | 29,366 | 5.3 | 973 | 5.3 |
State of New York | AA / Aa2 | 1 | 2019 | 20,767 | 3.7 | 481 | 2.6 | |
Independence Blue Cross | No rating available | 1 | 2033 | 15,780 | 2.8 | 801 | 4.4 | |
GE | AA+ / Aa3 | 2 | 2027 | 15,158 | 2.7 | 453 | 2.5 | |
Aon | A- / Baa2 | 1 | 2028 | 13,915 | 2.5 | 428 | 2.3 | |
Nestle | AA / Aa2 | 1 | 2021 | 11,898 | 2.1 | 401 | 2.2 | |
Shaw | BBB+ | 1 | 2018 | 10,563 | 1.9 | 313 | 1.7 | |
City of New York | AA / Aa2 | 1 | 2020 | 9,785 | 1.8 | 313 | 1.7 | |
KPMG | No rating available | 2 | 2027 | 9,039 | 1.6 | 279 | 1.5 | |
Gallagher | No rating available | 1 | 2018 | 8,539 | 1.5 | 307 | 1.7 | |
DDB Needham | BBB+ / Baa1 | 1 | 2018 | 7,662 | 1.4 | 213 | 1.2 | |
Caterpillar Financial | A / A2 | 1 | 2022 | 7,643 | 1.4 | 312 | 1.7 | |
Catamaran | BB+ / Ba2 | 1 | 2025 | 7,394 | 1.3 | 301 | 1.6 | |
Harvard University | AAA / Aaa | 2 | 2017 | 7,145 | 1.3 | 110 | 0.6 | |
Gemini | A / A2 | 1 | 2021 | 6,544 | 1.2 | 205 | 1.1 | |
Edelman | No rating available | 1 | 2024 | 6,489 | 1.2 | 184 | 1.0 | |
KeyBank | A- / A3 | 2 | 2016 | 6,418 | 1.2 | 210 | 1.1 | |
Harcourt | BBB+ | 1 | 2016 | 6,350 | 1.1 | 195 | 1.1 | |
Raytheon | A- / A3 | 2 | 2019 | 6,271 | 1.1 | 440 | 2.4 | |
Epsilon Data Management | No rating available | 2 | 2026 | 6,056 | 1.1 | 250 | 1.4 | |
First Data Corporation | B / B3 | 1 | 2020 | 6,008 | 1.1 | 195 | 1.1 | |
Jones Lang LaSalle | BBB- / Baa2 | 1 | 2017 | 5,966 | 1.1 | 165 | 0.9 | |
Ralph Lauren | A / A3 | 1 | 2019 | 5,805 | 1.0 | 178 | 1.0 | |
Integrys | A- / Baa1 | 1 | 2029 | 5,768 | 1.0 | 181 | 1.0 | |
Archon Group | A- / Baa1 | 2 | 2018 | 5,735 | 1.0 | 235 | 1.3 | |
Henry M. Jackson | No rating available | 2 | 2022 | 5,450 | 1.0 | 145 | 0.8 | |
Towers Watson | No rating available | 1 | 2017 | 5,416 | 1.0 | 123 | 0.7 | |
Other | Various | 258,460 | 46.4 | 8,905 | 48.6 | |||
Total | $556,933 | 100.0 | 18,309 | 100.0 | ||||
23
Tenant Diversification
March 31, 2014 as compared to December 31, 2013
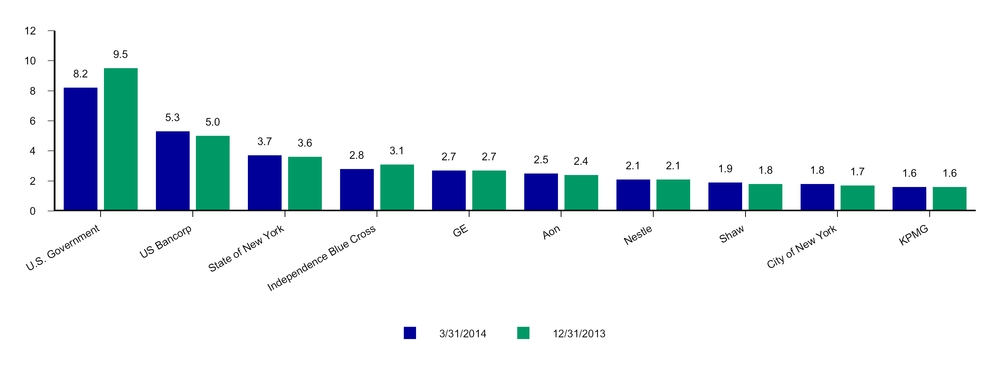
(1) | This schedule presents all tenants contributing 1.0% or more to Annualized Lease Revenue. |
(2) | Credit rating may reflect the credit rating of the parent or a guarantor. When available, both the Standard & Poor's credit rating and the Moody's credit rating are provided. |
(3) | Unless otherwise indicated, Lease Expiration represents the expiration year of the majority of the square footage leased by the tenant. |
(4) | There are several leases with several different agencies of the U.S. Government with expiration years ranging from 2014 to 2027. |
(5) | US Bank's lease at One & Two Meridian Crossings, representing approximately 337,000 square feet and $9.8 million of Annualized Lease Revenue, expires in 2023. Of the space leased at US Bancorp Center, US Bancorp renewed on 395,000 square feet, representing $11.3 million of Annualized Lease Revenue, through 2024; Piper Jaffray, a current subtenant, leased 124,000 square feet, representing $3.8 million of Annualized Lease Revenue, through 2025; and two additional companies leased a total of 28,000 square feet, representing $0.8 million of Annualized Lease Revenue. Approximately 92,000 square feet and $3.6 million of Annualized Lease Revenue will expire in 2014. |
24
Piedmont Office Realty Trust, Inc.
Tenant Credit Rating & Lease Distribution Information
As of March 31, 2014
Tenant Credit Rating (1)
Annualized Lease Revenue (in thousands) | Percentage of Annualized Lease Revenue (%) | |||
AAA / Aaa | $52,549 | 9.5 | ||
AA / Aa | 81,171 | 14.6 | ||
A / A | 124,464 | 22.3 | ||
BBB / Baa | 50,079 | 9.0 | ||
BB / Ba | 32,296 | 5.8 | ||
B / B | 24,632 | 4.4 | ||
Below | — | 0.0 | ||
Not rated (2) | 191,742 | 34.4 | ||
Total | $556,933 | 100.0 | ||
Lease Distribution
Number of Leases | Percentage of Leases (%) | Annualized Lease Revenue (in thousands) | Percentage of Annualized Lease Revenue (%) | Leased Square Footage (in thousands) | Percentage of Leased Square Footage (%) | ||||
2,500 or Less | 204 | 31.8 | $21,484 | 3.9 | 187 | 1.0 | |||
2,501 - 10,000 | 190 | 29.6 | 32,888 | 5.9 | 1,043 | 5.7 | |||
10,001 - 20,000 | 85 | 13.2 | 34,737 | 6.2 | 1,212 | 6.6 | |||
20,001 - 40,000 | 65 | 10.1 | 55,456 | 9.9 | 1,847 | 10.1 | |||
40,001 - 100,000 | 48 | 7.5 | 83,375 | 15.0 | 2,803 | 15.3 | |||
Greater than 100,000 | 50 | 7.8 | 328,993 | 59.1 | 11,217 | 61.3 | |||
Total | 642 | 100.0 | $556,933 | 100.0 | 18,309 | 100.0 | |||
(1) | Credit rating may reflect the credit rating of the parent or a guarantor. Where differences exist between the Standard & Poor's credit rating for a tenant and the Moody's credit rating for a tenant, the higher credit rating is selected for this analysis. |
(2) | The classification of a tenant as "not rated" does not indicate that the tenant is of poor credit quality, but can indicate that the tenant or the tenant's debt, if any, has not been rated. Included in this category are such tenants as Independence Blue Cross, McKinsey & Company and KPMG. |
25
Piedmont Office Realty Trust, Inc.
Leased Percentage Information
(in thousands)
Impact of Strategic Transactions on Leased Percentage
The Company’s stated long-term growth strategy includes the recycling of capital from certain stabilized or non-core assets into office properties located in focused concentration and opportunistic markets. Some of the recently acquired properties are value-add properties which are defined as low-occupancy properties acquired at attractive bases with earnings growth and value appreciation potential achievable through leasing up such assets to a stabilized occupancy. Because the value-add properties have large vacancies, they negatively affect Piedmont’s overall leased percentage. In order to identify the effect they have on Piedmont’s overall leased percentage, the following information is being provided. The analysis below: 1) removes the impact of the value-add properties from Piedmont’s overall office portfolio total under the heading “Stabilized Portfolio Analysis”; 2) provides a year-over-year comparison of leased percentage on the same subset of properties under the heading “Same Store Analysis”; and 3) provides a year-over-year comparison of leased percentage on the same subset of stabilized properties under the heading "Same Store Stabilized Analysis".
Three Months Ended | Three Months Ended | ||||||||||||||
March 31, 2014 | March 31, 2013 | ||||||||||||||
Leased Square Footage | Rentable Square Footage | Percent Leased (1) | Leased Square Footage | Rentable Square Footage | Percent Leased (1) | ||||||||||
As of December 31, 20xx | 18,737 | 21,490 | 87.2 | % | 17,935 | 20,500 | 87.5 | % | |||||||
New leases | 1,007 | 517 | |||||||||||||
Expired leases | (1,088 | ) | (943 | ) | |||||||||||
Other (2) | (246 | ) | (241 | ) | 1 | (4 | ) | ||||||||
Subtotal | 18,410 | 21,249 | 86.6 | % | 17,510 | 20,496 | 85.4 | % | |||||||
Acquisitions during period | — | — | 578 | 594 | |||||||||||
Dispositions during period | (101 | ) | (142 | ) | (145 | ) | (237 | ) | |||||||
As of March 31, 20xx (3) (4) | 18,309 | 21,107 | 86.7 | % | 17,943 | 20,853 | 86.0 | % | |||||||
Stabilized Portfolio Analysis | |||||||||||||||
Less value-add properties (5) | (1,016 | ) | (1,639 | ) | 62.0 | % | (689 | ) | (1,436 | ) | 48.0 | % | |||
Stabilized Total (3) (4) | 17,293 | 19,468 | 88.8 | % | 17,254 | 19,417 | 88.9 | % | |||||||
Same Store Analysis | |||||||||||||||
Less acquisitions / dispositions after March 31, 2013 (5) (6) | (896 | ) | (973 | ) | 92.1 | % | (539 | ) | (580 | ) | 92.9 | % | |||
Same Store Total (3) (4) (7) | 17,413 | 20,134 | 86.5 | % | 17,404 | 20,273 | 85.8 | % | |||||||
Same Store Stabilized Analysis | |||||||||||||||
Less value-add same store properties (5) | (815 | ) | (1,438 | ) | 56.7 | % | (689 | ) | (1,436 | ) | 48.0 | % | |||
Same Store Stabilized Total (3) (4) | 16,598 | 18,696 | 88.8 | % | 16,715 | 18,837 | 88.7 | % | |||||||
(1) | Calculated as leased square footage as of period end with the addition of square footage associated with uncommenced leases for spaces vacant as of period end, divided by total rentable square footage as of period end, expressed as a percentage. |
(2) | Effective January 1, 2014, 3100 Clarendon Boulevard was taken out of service due to the redevelopment of the property. The adjustments to square footage presented on this line in 2014 primarily relate to the removal of 3100 Clarendon Boulevard from our operating portfolio. For additional information regarding the redevelopment of 3100 Clarendon Boulevard, please refer to the Financing and Capital Activity section of Financial Highlights. |
(3) | The square footage associated with leases with end of period expiration dates is included in the end of the period leased square footage. |
(4) | End of period leased square footage for 2013 and 2014 includes short-term space leased on behalf of NASA in accordance with requirements stipulated under its lease to allow it to restructure its space at Two Independence Square in Washington, D.C. As of March 31, 2014, the total short-term space amounts to approximately 63,000 square feet and it will be occupied until an estimated date of July 31, 2014. |
(5) | |
(6) | Dispositions completed during the previous twelve months are deducted from the previous period data and acquisitions completed during the previous twelve months are deducted from the current period data. |
(7) | Excluding executed but not commenced leases for currently vacant spaces, comprising approximately 746,000 square feet for same store properties for the current period and 384,000 square feet for same store properties for the prior period, Piedmont's same store commenced leased percentage was 82.8% and 84.0% for the current and prior periods, respectively. |
26
Piedmont Office Realty Trust, Inc.
Rental Rate Roll Up / Roll Down Analysis (1)
(in thousands)
Three Months Ended | ||||||
March 31, 2014 | ||||||
Square Feet | % of Total Signed During Period | % of Rentable Square Footage | % Change Cash Rents (2) | % Change Accrual Rents (3) (4) | ||
Leases executed for spaces vacant one year or less | 211 | 50.9% | 1.0% | (6.4)% | (1.2)% | |
Leases executed for spaces excluded from analysis (5) | 204 | 49.1% | ||||
(1) | The population analyzed consists of consolidated office leases executed during the period with lease terms greater than one year. Retail leases, as well as leases associated with storage spaces, management offices, and unconsolidated joint venture assets, were excluded from this analysis. |
(2) | For the purposes of this analysis, the cash rents last in effect for the previous leases were compared to the initial cash rents of the new leases in order to calculate the percentage change. |
(3) | For the purposes of this analysis, the accrual basis rents for the previous leases were compared to the accrual basis rents of the new leases in order to calculate the percentage change. For newly signed leases which have variations in accrual basis rents, whether because of known future expansions, contractions, lease expense recovery structure changes, or other similar reasons, the weighted average of such accrual basis rents is used for the purposes of this analysis. |
(4) | For leases under which a tenant may use, at its discretion, a portion of its tenant improvement allowance for expenses other than those related to improvements to its space, an assumption is made that the tenant elects to use any such portion of its tenant improvement allowance for improvements to its space prior to the commencement of its lease, unless the Company is notified otherwise by the tenant. This assumption is made based upon the historical tenant improvement allowance usage patterns of the Company's tenants. |
(5) | Represents leases signed at our consolidated office assets that do not qualify for inclusion in the analysis primarily because the spaces for which the new leases were signed had been vacant for greater than one year. |
27
Piedmont Office Realty Trust, Inc.
Lease Expiration Schedule
As of March 31, 2014
(in thousands)
OFFICE PORTFOLIO | GOVERNMENTAL ENTITIES | ||||||||
Annualized Lease Revenue (1) | Percentage of Annualized Lease Revenue (%) | Rentable Square Footage | Percentage of Rentable Square Footage (%) | Annualized Lease Revenue (1) | Percentage of Annualized Lease Revenue (%) | Percentage of Current Year Total Annualized Lease Revenue Expiring (%) | |||
Vacant | $— | — | 2,797 | 13.2 | $— | — | N/A | ||
2014 (2) | 18,641 | 3.3 | 539 | 2.6 | 3,589 | 0.6 | 19.3 | ||
2015 (3) | 25,302 | 4.5 | 882 | 4.2 | 1,816 | 0.3 | 7.2 | ||
2016 | 31,127 | 5.6 | 1,114 | 5.3 | 1,453 | 0.3 | 4.7 | ||
2017 (4) | 62,873 | 11.3 | 1,546 | 7.3 | 9,999 | 1.8 | 15.9 | ||
2018 | 57,591 | 10.3 | 1,925 | 9.1 | — | — | — | ||
2019 | 63,206 | 11.4 | 2,309 | 10.9 | 20,767 | 3.7 | 32.9 | ||
2020 | 38,338 | 6.9 | 1,412 | 6.7 | 9,785 | 1.8 | 25.5 | ||
2021 | 32,047 | 5.8 | 1,056 | 5.0 | — | — | — | ||
2022 | 26,136 | 4.7 | 853 | 4.0 | — | — | — | ||
2023 | 30,448 | 5.5 | 1,131 | 5.4 | — | — | — | ||
2024 | 45,756 | 8.2 | 1,512 | 7.2 | — | — | — | ||
2025 | 20,869 | 3.7 | 787 | 3.7 | — | — | — | ||
2026 | 12,682 | 2.3 | 507 | 2.4 | — | — | — | ||
2027 | 52,517 | 9.4 | 1,240 | 5.9 | 29,032 | 5.2 | 55.3 | ||
Thereafter | 39,400 | 7.1 | 1,497 | 7.1 | — | — | — | ||
Total / Weighted Average | $556,933 | 100.0 | 21,107 | 100.0 | $76,441 | 13.7 | |||
Average Lease Term Remaining | |
3/31/2014 | 7.3 years |
12/31/2013 | 7.1 years |
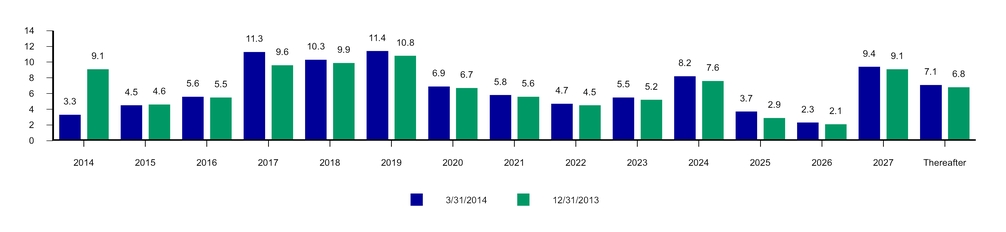
(1) | Annualized rental income associated with newly executed leases for currently occupied space is incorporated herein only at the expiration date for the current lease. Annualized rental income associated with such new leases is removed from the expiry year of the current lease and added to the expiry year of the new lease. These adjustments effectively incorporate known roll ups and roll downs into the expiration schedule. |
(2) | Includes leases with an expiration date of March 31, 2014 aggregating 39,000 square feet and Annualized Lease Revenue of $1.2 million. |
(3) | Leases and other revenue-producing agreements on a month-to-month basis, aggregating 7,000 square feet and Annualized Lease Revenue of $0.3 million, are assigned a lease expiration date of a year and a day beyond the period end date. Includes an approximate 45,000 square foot contraction of the National Park Service lease at 1201 Eye Street in Washington, D.C., the renewal of which was signed subsequent to the end of the first quarter of 2014. |
(4) | Includes the expiration of the National Park Service lease, net of the contraction noted in footnote (3) above, at 1201 Eye Street in Washington, D.C. The lease renewal was signed subsequent to the end of the first quarter of 2014. |
28
Piedmont Office Realty Trust, Inc.
Lease Expirations by Quarter
As of March 31, 2014
(in thousands)
Q2 2014 (1) | Q3 2014 | Q4 2014 | Q1 2015 | |||||||||
Expiring Square Footage | Expiring Lease Revenue (2) | Expiring Square Footage | Expiring Lease Revenue (2) | Expiring Square Footage | Expiring Lease Revenue (2) | Expiring Square Footage | Expiring Lease Revenue (2) | |||||
Atlanta | — | $57 | — | $— | — | $— | 29 | $535 | ||||
Austin | — | — | — | — | — | — | — | — | ||||
Boston | — | — | — | — | — | 50 | 2 | 117 | ||||
Central & South Florida | — | — | — | — | — | — | 19 | 451 | ||||
Chicago | 19 | 490 | — | — | 19 | 305 | 15 | 365 | ||||
Dallas | 11 | 310 | 4 | 97 | 3 | 65 | 35 | 930 | ||||
Detroit | — | — | 6 | 136 | 2 | 12 | — | — | ||||
Houston | — | — | — | — | — | — | — | — | ||||
Los Angeles | — | 840 | — | — | — | — | — | — | ||||
Minneapolis | 92 | 3,352 | — | 11 | 18 | 502 | 2 | 102 | ||||
Nashville | — | — | — | — | — | — | — | — | ||||
New York | 50 | 1,721 | — | 27 | 36 | 1,851 | 2 | 101 | ||||
Philadelphia | — | — | — | — | — | — | — | — | ||||
Phoenix | — | — | — | — | — | — | — | — | ||||
Washington, D.C. | 69 | 3,651 | 187 | 4,263 | 20 | 995 | 8 | 349 | ||||
Other | 3 | 41 | — | 1 | — | — | — | — | ||||
Total / Weighted Average (3) | 244 | $10,462 | 197 | $4,535 | 98 | $3,780 | 112 | $2,950 | ||||
(1) | Includes leases with an expiration date of March 31, 2014 aggregating 39,000 square feet and expiring lease revenue of $1.4 million. No such adjustments are made to other periods presented. |
(2) | Expiring lease revenue is calculated as expiring square footage multiplied by the gross rent per square foot of the tenant currently leasing the space. |
(3) | Total expiring lease revenue in any given year will not tie to the expiring Annualized Lease Revenue presented on the Lease Expiration Schedule on the previous page as the Lease Expiration Schedule accounts for the revenue effects of newly signed leases. Reflected herein are expiring revenues based on in-place rental rates. |
29
Piedmont Office Realty Trust, Inc.
Lease Expirations by Year
As of March 31, 2014
(in thousands)
12/31/2014 (1) | 12/31/2015 | 12/31/2016 | 12/31/2017 | 12/31/2018 | ||||||||||
Expiring Square Footage | Expiring Lease Revenue (2) | Expiring Square Footage | Expiring Lease Revenue (2) | Expiring Square Footage | Expiring Lease Revenue (2) | Expiring Square Footage | Expiring Lease Revenue (2) | Expiring Square Footage | Expiring Lease Revenue (2) | |||||
Atlanta | — | $57 | 29 | $535 | 18 | $368 | 45 | $1,077 | 107 | $2,220 | ||||
Austin | — | — | — | — | 195 | 6,355 | — | 1 | — | — | ||||
Boston | — | 50 | 128 | 2,610 | 3 | 193 | 66 | 5,325 | 145 | 6,180 | ||||
Central & South Florida | — | — | 30 | 719 | 71 | 1,821 | 161 | 3,931 | 40 | 977 | ||||
Chicago | 38 | 794 | 196 | 5,709 | 82 | 2,501 | 296 | 16,410 | 623 | 20,206 | ||||
Dallas | 18 | 472 | 98 | 2,509 | 61 | 1,480 | 228 | 5,670 | 379 | 9,138 | ||||
Detroit | 7 | 149 | 61 | 442 | 28 | 682 | 78 | 1,533 | 29 | 543 | ||||
Houston | — | — | — | — | — | — | — | 2 | 313 | 10,581 | ||||
Los Angeles | — | 840 | 21 | 686 | 91 | 2,870 | 46 | 1,631 | 15 | 366 | ||||
Minneapolis | 110 | 3,865 | 84 | 3,126 | 33 | 1,105 | 48 | 1,607 | 35 | 1,167 | ||||
Nashville | — | — | — | — | 201 | 2,579 | — | — | — | — | ||||
New York | 87 | 3,598 | 68 | 2,551 | 280 | 9,111 | 70 | 2,283 | 91 | 2,264 | ||||
Philadelphia | — | — | — | — | — | — | — | — | — | — | ||||
Phoenix | — | — | — | — | — | — | — | — | 63 | 1,517 | ||||
Washington, D.C. (3) | 276 | 8,911 | 151 | 6,920 | 38 | 1,763 | 494 | 23,965 | 26 | 1,228 | ||||
Other | 3 | 41 | 16 | 240 | 13 | 300 | 14 | 352 | 59 | 1,197 | ||||
Total / Weighted Average (4) | 539 | $18,777 | 882 | $26,047 | 1,114 | $31,128 | 1,546 | $63,787 | 1,925 | $57,584 | ||||
(1) | Includes leases with an expiration date of March 31, 2014 aggregating 39,000 square feet and expiring lease revenue of $1.4 million. No such adjustments are made to other periods presented. |
(2) | Expiring lease revenue is calculated as expiring square footage multiplied by the gross rent per square foot of the tenant currently leasing the space. |
(3) | The lease renewal with the National Park Service at 1201 Eye Street in Washington, D.C., was signed subsequent to the end of the first quarter of 2014. The expiration of the lease is reflected in 2015 and 2017. The expiration in 2015 consists of an approximate 45,000 square foot contraction; the remaining approximately 174,000 square feet are reflected as an expiration in 2017. |
(4) | Total expiring lease revenue in any given year will not tie to the expiring Annualized Lease Revenue presented on the Lease Expiration Schedule on page 28 as the Lease Expiration Schedule accounts for the revenue effects of newly signed leases. Reflected herein are expiring revenues based on in-place rental rates. |
30
Piedmont Office Realty Trust, Inc.
Capital Expenditures & Commitments
For the quarter ended March 31, 2014
Unaudited (in thousands)
For the Three Months Ended | |||||||||||||||||||
3/31/2014 | 12/31/2013 | 9/30/2013 | 6/30/2013 | 3/31/2013 | |||||||||||||||
Non-incremental | |||||||||||||||||||
Building / construction / development | $ | 720 | $ | 11,372 | $ | 1,465 | $ | 2,056 | $ | 930 | |||||||||
Tenant improvements | 11,531 | 24,798 | 11,854 | 11,292 | 13,744 | ||||||||||||||
Leasing costs | 1,570 | 6,815 | 8,386 | 5,019 | 5,246 | ||||||||||||||
Total non-incremental | 13,821 | 42,985 | 21,705 | 18,367 | 19,920 | ||||||||||||||
Incremental | |||||||||||||||||||
Building / construction / development | 6,776 | 8,418 | 4,826 | 8,291 | 6,712 | ||||||||||||||
Tenant improvements | 7,627 | 10,181 | 9,780 | 29,262 | 14,068 | ||||||||||||||
Leasing costs | 2,386 | 2,747 | 2,043 | 1,119 | 1,642 | ||||||||||||||
Total incremental | 16,789 | 21,346 | 16,649 | 38,672 | 22,422 | ||||||||||||||
Total capital expenditures | $ | 30,610 | $ | 64,331 | $ | 38,354 | $ | 57,039 | $ | 42,342 | |||||||||
Non-incremental tenant improvement commitments (1) | ||||||
Non-incremental tenant improvement commitments outstanding as of December 31, 2013 | $85,140 | |||||
New non-incremental tenant improvement commitments related to leases executed during period | 3,627 | |||||
Non-incremental tenant improvement expenditures | (11,531 | ) | ||||
Less: Tenant improvement expenditures fulfilled through accrued liabilities already presented on Piedmont's balance sheet, expired commitments or other adjustments | (5,235 | ) | ||||
Non-incremental tenant improvement commitments fulfilled, expired or other adjustments | (16,766 | ) | ||||
Total as of March 31, 2014 | $72,001 | |||||
NOTE: | The information presented on this page is for all consolidated assets. |
(1) | Commitments are unexpired contractual non-incremental tenant improvement obligations for leases executed in current and prior periods that have not yet been incurred and have not otherwise been presented on Piedmont's financial statements. The four largest commitments total approximately $34.0 million, or 47% of the total outstanding commitments. |
31
Piedmont Office Realty Trust, Inc.
Contractual Tenant Improvements and Leasing Commissions
For the Three Months Ended March 31, 2014 | For the Year Ended | ||||||
2013 | 2012 | 2011 | |||||
Renewal Leases | |||||||
Number of leases | 16 | 56 | 45 | 48 | |||
Square feet | 117,634 | 2,376,177 | 1,150,934 | 2,280,329 | |||
Tenant improvements per square foot (1) | $9.40 | $14.24 | $19.12 | $33.29 | |||
Leasing commissions per square foot | $5.82 | $4.66 | $6.64 | $9.97 | |||
Total per square foot | $15.22 | $18.90 | $25.76 | $43.26 | |||
Tenant improvements per square foot per year of lease term | $2.50 | $1.88 | $2.90 | $3.93 | |||
Leasing commissions per square foot per year of lease term | $1.55 | $0.62 | $1.01 | $1.18 | |||
Total per square foot per year of lease term | $4.05 | $2.50 | $3.91 | (2) | $5.11 | (2) | |
New Leases (3) | |||||||
Number of leases | 29 | 87 | 92 | 76 | |||
Square feet | 295,646 | 1,050,428 | 1,765,510 | 1,588,271 | |||
Tenant improvements per square foot (1) | $37.21 | $35.74 | $47.64 | $41.21 | |||
Leasing commissions per square foot | $16.42 | $12.94 | $18.49 | $15.38 | |||
Total per square foot | $53.63 | $48.68 | $66.13 | $56.59 | |||
Tenant improvements per square foot per year of lease term | $3.84 | $4.17 | $4.30 | $4.19 | |||
Leasing commissions per square foot per year of lease term | $1.69 | $1.51 | $1.67 | $1.57 | |||
Total per square foot per year of lease term | $5.53 | $5.68 | $5.97 | $5.76 | |||
Total | |||||||
Number of leases | 45 | 143 | 137 | 124 | |||
Square feet | 413,280 | 3,426,605 | 2,916,444 | 3,868,600 | |||
Tenant improvements per square foot (1) | $29.29 | $20.83 | $36.39 | $36.54 | |||
Leasing commissions per square foot | $13.40 | $7.20 | $13.81 | $12.19 | |||
Total per square foot | $42.69 | $28.03 | $50.20 | $48.73 | |||
Tenant improvements per square foot per year of lease term | $3.66 | $2.64 | $3.91 | $4.05 | |||
Leasing commissions per square foot per year of lease term | $1.67 | $0.91 | $1.48 | $1.35 | |||
Total per square foot per year of lease term | $5.33 | $3.55 | $5.39 | $5.40 | |||
NOTE: | This information is presented for our consolidated office assets only and excludes activity associated with storage and licensed spaces. |
(1) | For leases under which a tenant may use, at its discretion, a portion of its tenant improvement allowance for expenses other than those related to improvements to its space, an assumption is made that the tenant elects to use any such portion of its tenant improvement allowance for improvements to its space prior to the commencement of its lease, unless the Company is notified otherwise by the tenant. This assumption is made based upon the historical tenant improvement allowance usage patterns of the Company's tenants. |
(2) | During 2011, we completed two large, 15-year lease renewals with significant capital commitments: NASA at Two Independence Square in Washington, D.C. and GE at 500 West Monroe Street in Chicago, IL. If the costs associated with these renewals were to be removed from the average committed capital cost calculation, the average committed capital cost per square foot per year of lease term for renewal leases in 2011 would be $2.80. During 2012, we completed one large, long-term lease renewal with an above-average capital commitment with US Bancorp at US Bancorp Center in Minneapolis, MN. If the costs associated with this renewal were to be removed from the average committed capital cost calculation, the average committed capital cost per square foot per year of lease term for renewal leases in 2012 would be $2.73. |
(3) | Since 2010, Piedmont has selectively employed a value-add strategy for new property acquisitions. Piedmont defines value-add properties as those acquired with low occupancies at attractive bases with earnings growth and value appreciation potential achievable through leasing up such assets to stabilized occupancies. Because the value-add properties have large vacancies, many of which have not previously been leased (first generation spaces), the leasing of those vacancies negatively affects Piedmont’s contractual tenant improvements on a per foot and a per foot per year basis for new leases. |
32
Piedmont Office Realty Trust, Inc.
Geographic Diversification
As of March 31, 2014
($ and square footage in thousands)
Location | Number of Properties | Annualized Lease Revenue | Percentage of Annualized Lease Revenue (%) | Rentable Square Footage | Percentage of Rentable Square Footage (%) | Leased Square Footage | Percent Leased (%) |
Chicago | 6 | $127,562 | 22.9 | 4,821 | 22.8 | 3,814 | 79.1 |
Washington, D.C. | 12 | 94,388 | 17.0 | 2,989 | 14.2 | 2,137 | 71.5 |
New York | 6 | 81,076 | 14.6 | 2,432 | 11.5 | 2,387 | 98.1 |
Minneapolis | 4 | 46,450 | 8.3 | 1,613 | 7.6 | 1,485 | 92.1 |
Dallas | 10 | 42,516 | 7.6 | 1,906 | 9.0 | 1,832 | 96.1 |
Boston | 7 | 34,504 | 6.2 | 1,294 | 6.1 | 1,294 | 100.0 |
Los Angeles | 4 | 29,074 | 5.2 | 1,010 | 4.8 | 966 | 95.6 |
Atlanta | 6 | 19,419 | 3.5 | 1,066 | 5.1 | 786 | 73.7 |
Detroit | 5 | 19,026 | 3.4 | 1,008 | 4.8 | 863 | 85.6 |
Philadelphia | 1 | 15,780 | 2.8 | 801 | 3.8 | 801 | 100.0 |
Houston | 1 | 10,583 | 1.9 | 313 | 1.5 | 313 | 100.0 |
Nashville | 2 | 10,222 | 1.8 | 513 | 2.4 | 513 | 100.0 |
Central & South Florida | 4 | 8,894 | 1.6 | 476 | 2.3 | 376 | 79.0 |
Phoenix | 3 | 7,130 | 1.3 | 432 | 2.1 | 345 | 79.9 |
Austin | 1 | 6,355 | 1.2 | 195 | 0.9 | 195 | 100.0 |
Other | 3 | 3,954 | 0.7 | 238 | 1.1 | 202 | 84.9 |
Total / Weighted Average | 75 | $556,933 | 100.0 | 21,107 | 100.0 | 18,309 | 86.7 |

33
Piedmont Office Realty Trust, Inc.
Geographic Diversification by Location Type
As of March 31, 2014
(square footage in thousands)
CBD / URBAN INFILL | SUBURBAN | TOTAL | ||||||||||||||
Location | State | Number of Properties | Percentage of Annualized Lease Revenue (%) | Rentable Square Footage | Percentage of Rentable Square Footage (%) | Number of Properties | Percentage of Annualized Lease Revenue (%) | Rentable Square Footage | Percentage of Rentable Square Footage (%) | Number of Properties | Percentage of Annualized Lease Revenue (%) | Rentable Square Footage | Percentage of Rentable Square Footage (%) | |||
Chicago | IL | 2 | 18.1 | 3,695 | 17.5 | 4 | 4.8 | 1,126 | 5.3 | 6 | 22.9 | 4,821 | 22.8 | |||
Washington, D.C. | DC, VA, MD | 9 | 15.9 | 2,650 | 12.6 | 3 | 1.1 | 339 | 1.6 | 12 | 17.0 | 2,989 | 14.2 | |||
New York | NY, NJ | 1 | 7.3 | 1,027 | 4.9 | 5 | 7.3 | 1,405 | 6.6 | 6 | 14.6 | 2,432 | 11.5 | |||
Minneapolis | MN | 1 | 5.2 | 928 | 4.4 | 3 | 3.1 | 685 | 3.2 | 4 | 8.3 | 1,613 | 7.6 | |||
Dallas | TX | 1 | 1.0 | 262 | 1.2 | 9 | 6.6 | 1,644 | 7.8 | 10 | 7.6 | 1,906 | 9.0 | |||
Boston | MA | 2 | 2.3 | 173 | 0.8 | 5 | 3.9 | 1,121 | 5.3 | 7 | 6.2 | 1,294 | 6.1 | |||
Los Angeles | CA | 3 | 4.5 | 876 | 4.2 | 1 | 0.7 | 134 | 0.6 | 4 | 5.2 | 1,010 | 4.8 | |||
Atlanta | GA | 2 | 2.4 | 581 | 2.8 | 4 | 1.1 | 485 | 2.3 | 6 | 3.5 | 1,066 | 5.1 | |||
Detroit | MI | 1 | 1.8 | 493 | 2.3 | 4 | 1.6 | 515 | 2.5 | 5 | 3.4 | 1,008 | 4.8 | |||
Philadelphia | PA | 1 | 2.8 | 801 | 3.8 | — | — | — | — | 1 | 2.8 | 801 | 3.8 | |||
Houston | TX | — | — | — | — | 1 | 1.9 | 313 | 1.5 | 1 | 1.9 | 313 | 1.5 | |||
Nashville | TN | 1 | 1.3 | 312 | 1.4 | 1 | 0.5 | 201 | 1.0 | 2 | 1.8 | 513 | 2.4 | |||
Central & South Florida | FL | — | — | — | — | 4 | 1.6 | 476 | 2.3 | 4 | 1.6 | 476 | 2.3 | |||
Phoenix | AZ | — | — | — | — | 3 | 1.3 | 432 | 2.1 | 3 | 1.3 | 432 | 2.1 | |||
Austin | TX | — | — | — | — | 1 | 1.2 | 195 | 0.9 | 1 | 1.2 | 195 | 0.9 | |||
Other | — | — | — | — | 3 | 0.7 | 238 | 1.1 | 3 | 0.7 | 238 | 1.1 | ||||
Total / Weighted Average | 24 | 62.6 | 11,798 | 55.9 | 51 | 37.4 | 9,309 | 44.1 | 75 | 100.0 | 21,107 | 100.0 | ||||
34
Piedmont Office Realty Trust, Inc.
Industry Diversification
As of March 31, 2014
($ and square footage in thousands)
Percentage of | ||||||
Number of | Percentage of Total | Annualized Lease | Annualized Lease | Leased Square | Percentage of Leased | |
Industry | Tenants | Tenants (%) | Revenue | Revenue (%) | Footage | Square Footage (%) |
Governmental Entity | 5 | 1.0 | $76,441 | 13.7 | 1,816 | 9.9 |
Business Services | 86 | 16.9 | 60,427 | 10.7 | 2,277 | 12.4 |
Depository Institutions | 17 | 3.3 | 54,135 | 9.7 | 1,858 | 10.2 |
Engineering, Accounting, Research, Management & Related Services | 38 | 7.4 | 42,643 | 7.7 | 1,191 | 6.5 |
Nondepository Credit Institutions | 16 | 3.1 | 36,103 | 6.5 | 1,226 | 6.7 |
Insurance Agents, Brokers & Services | 15 | 2.9 | 34,342 | 6.2 | 1,202 | 6.6 |
Insurance Carriers | 27 | 5.3 | 31,715 | 5.7 | 1,367 | 7.5 |
Communications | 33 | 6.5 | 18,428 | 3.3 | 574 | 3.1 |
Security & Commodity Brokers, Dealers, Exchanges & Services | 30 | 5.9 | 18,199 | 3.3 | 655 | 3.6 |
Automotive Repair, Services & Parking | 6 | 1.2 | 14,265 | 2.6 | 49 | 0.3 |
Fabricated Metal Products, Except Machinery & Transportation Equipment | 4 | 0.8 | 13,234 | 2.4 | 423 | 2.3 |
Real Estate | 18 | 3.5 | 12,559 | 2.3 | 404 | 2.2 |
Educational Services | 7 | 1.4 | 12,206 | 2.2 | 320 | 1.7 |
Food & Kindred Products | 3 | 0.6 | 12,124 | 2.2 | 408 | 2.2 |
Electronic & Other Electrical Equipment & Components, Except Computer | 10 | 2.0 | 11,904 | 2.1 | 428 | 2.3 |
Other | 195 | 38.2 | 108,208 | 19.4 | 4,111 | 22.5 |
Total | 510 | 100.0 | $556,933 | 100.0 | 18,309 | 100.0 |
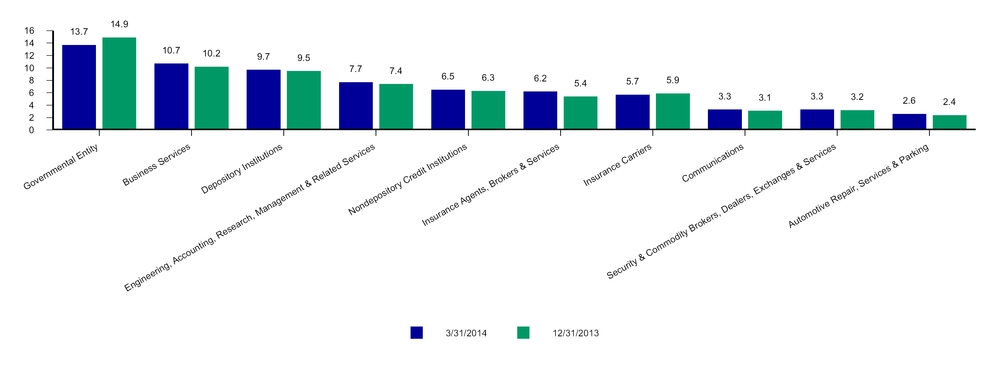
35
Piedmont Office Realty Trust, Inc.
Property Investment Activity
As of March 31, 2014
($ and square footage in thousands)
Acquisitions Over Previous Eighteen Months
Property | Location | Acquisition Date | Percent Ownership (%) | Year Built | Purchase Price | Rentable Square Footage | Percent Leased at Acquisition (%) | |
Glenridge Highlands III Land | Atlanta, GA | 10/15/2012 | 100 | N/A | $1,725 | N/A | N/A | |
Arlington Gateway | (1) | Arlington, VA | 3/4/2013 | 100 | 2005 | 175,552 | 334 | 99 |
5 & 15 Wayside Road | Burlington, MA | 3/22/2013 | 100 | 1999 / 2001 | 69,321 | 271 | 95 | |
Royal Lane Land | Irving, TX | 8/1/2013 | 100 | N/A | 2,600 | N/A | N/A | |
5301 Maryland Way | (2) | Brentwood, TN | 8/12/2013 | 100 | 1989 | 18,500 | 201 | 100 |
4685 Investment Drive | (2) | Troy, MI | 8/12/2013 | 100 | 2000 | 10,000 | 77 | 100 |
2020 West 89th Street | (2) | Leawood, KS | 8/12/2013 | 100 | 1992 | 4,250 | 68 | 85 |
6565 North MacArthur Boulevard | Irving, TX | 12/5/2013 | 100 | 1998 | 46,600 | 260 | 93 | |
One Lincoln Park | Dallas, TX | 12/20/2013 | 100 | 1999 | 56,654 | 262 | 79 | |
161 Corporate Center | Irving, TX | 12/30/2013 | 100 | 1998 | 16,000 | 105 | 91 | |
$401,202 | 1,578 | 93 | ||||||
Dispositions Over Previous Eighteen Months
Property | Location | Disposition Date | Percent Ownership (%) | Year Built | Sale Price | Rentable Square Footage | Percent Leased at Disposition (%) | |
1111 Durham Avenue | (3) | South Plainfield, NJ | 3/28/2013 | 100 | 1975 | $4,000 | N/A | N/A |
1200 Enclave Parkway | Houston, TX | 5/1/2013 | 100 | 1999 | 48,750 | 150 | 100 | |
350 Spectrum Loop | Colorado Springs, CO | 11/1/2013 | 100 | 2001 | 30,050 | 156 | 100 | |
8700 South Price Road | Tempe, AZ | 12/30/2013 | 100 | 2000 | 21,500 | 132 | 100 | |
11107 Sunset Hills Road | Reston, VA | 3/19/2014 | 100 | 1985 | 20,000 | 101 | 100 | |
11109 Sunset Hills Road | Reston, VA | 3/19/2014 | 100 | 1984 | 2,600 | 41 | 0 | |
$126,900 | 580 | 93 | ||||||
Dispositions Subsequent to Quarter End
Property | Location | Disposition Date | Percent Ownership (%) | Year Built | Sale Price | Rentable Square Footage | Percent Leased at Disposition (%) | |
1441 West Long Lake Road | Troy, MI | 4/30/2014 | 100 | 1999 | $7,850 | 108 | 88 | |
4685 Investment Drive | Troy, MI | 4/30/2014 | 100 | 2000 | 11,500 | 77 | 100 | |
(1) | The property consists of approximately 334,000 square feet; however, due to the square footages referenced in several leases, the rentable square footage is currently 323,000 square feet. As the existing leases expire, the affected spaces will be re-leased to the correct square footages. |
(2) | Piedmont purchased its joint venture partner's equity interest in the asset. The gross value of the asset agreed upon by the partners for the buyout is presented on this schedule as the purchase price. The additional capital invested across the three assets included in the buyout transaction amounted to $14.7 million. |
(3) | The lease for the building expired at the beginning of 2013. The building was outdated; the property was, therefore, sold for land value shortly after the expiration of the lease. |
36
Piedmont Office Realty Trust, Inc.
Value-Add Activity
As of March 31, 2014
($ and square footage in thousands)
Presented below are properties that were acquired employing a value-add strategy. Once a property acquired under a value-add strategy reaches 80% leased, it is deemed stabilized for the purposes of supplemental reporting and will be removed from the value-add classification.
Value-Add Properties
Property | Location | Acquisition Date | Percent Ownership (%) | Year Built | Purchase Price | Rentable Square Footage | Current Percent Leased (%) | Percent Leased at Acquisition (%) | Real Estate Gross Book Value | Estimated Cost to Stabilize (per VACANT square foot) | |
Suwanee Gateway One | Suwanee, GA | 9/28/2010 | 100 | 2008 | $7,875 | 142 | — | — | $7,953 | $40 - 60 | |
500 West Monroe Street | (1) | Chicago, IL | 3/31/2011 | 100 | 1991 | 227,500 | 966 | 64 | 49 | 228,575 | $60 - 90 |
The Medici | (2) | Atlanta, GA | 6/7/2011 | 100 | 2008 | 13,210 | 154 | 75 | 12 | 13,952 | $35 - 60 |
400 TownPark | Lake Mary, FL | 11/10/2011 | 100 | 2008 | 23,865 | 176 | 49 | 19 | 23,748 | $35 - 50 | |
5301 Maryland Way | (3) | Brentwood, TN | 8/12/2013 | 100 | 1989 | 18,500 | 201 | 100 | 100 | 15,457 | $50 - 75 |
$290,950 | 1,639 | 62 | 44 | $289,685 | |||||||
(1) | The investment in this property was converted from a structured finance investment to an owned real estate asset through a UCC foreclosure of an equity ownership interest on March 31, 2011. The purchase price presented represents the estimated fair value of the real estate assets comprising the property as of the date of the transaction. The percent leased at acquisition reflects the space leased by Marsh USA as vacant, as the tenant had already announced plans to vacate prior to Piedmont's assumption of ownership of the asset. |
(2) | The percent leased at acquisition reflects the space leased by BV Card Assets as vacant, as the tenant had already announced plans to vacate prior to Piedmont's acquisition of the property. |
(3) | While the property was 100% leased at acquisition, it is anticipated that the single-tenant building will become vacant at the end of the current lease term and the building will have to be re-leased on a multi-tenant basis. For this reason, the building was acquired as a value-add property. Piedmont purchased its joint venture partner's equity interest in the asset. The gross value of the asset agreed upon by the partners for the buyout is presented on this schedule as the purchase price. |
37
Piedmont Office Realty Trust, Inc.
Other Investments
As of March 31, 2014
($ and square footage in thousands)
Unconsolidated Joint Venture Properties
Property | Location | Percent Ownership (%) | Year Built | Piedmont Share of Real Estate Net Book Value | Real Estate Net Book Value | Rentable Square Footage | Percent Leased (%) |
8560 Upland Drive | Parker, CO | 72 | 2001 | $7,348 | $10,222 | 148.2 | 63 |
Two Park Center | Hoffman Estates, IL | 72 | 1999 | 6,214 | 8,644 | 193.7 | — |
$13,562 | $18,866 | 341.9 | 27 | ||||
Land Parcels
Property | Location | Adjacent Piedmont Property | Acres | Approximate Current Value |
Gavitello | Atlanta, GA | The Medici | 2.0 | $2,500 |
Glenridge Highlands III | Atlanta, GA | Glenridge Highlands Two | 3.0 | 1,725 |
State Highway 161 | Irving, TX | Las Colinas Corporate Center II | 4.5 | 1,200 |
Royal Lane | Irving, TX | 6011, 6021 and 6031 Connection Drive | 10.6 | 2,600 |
20.1 | $8,025 | |||
Development and Redevelopment
Property | Location | Adjacent Piedmont Property | Construction Type | Targeted Completion Date | Anticipated Stabilization Date | Percent Leased (%) | Square Feet | Current Basis | Estimated Additional Capital Required |
Enclave Place | Houston, TX | 1430 Enclave Parkway | Development | Q3 2015 | Q2 2016 | N/A | 300.9 | $3,254 | $80 to 85 million |
3100 Clarendon Boulevard (1) | Arlington, VA | Not Applicable | Redevelopment | Q4 2014 | Q1 2016 | 10 | 249.5 | 56,457 | $45 to 50 million |
550.4 | $59,711 | $125 to 135 million | |||||||
(1) | The Current Basis presented is that of the office portion of the property only. The retail portion of the property remains in service and retail tenants will remain in occupancy during the redevelopment. |
38
Piedmont Office Realty Trust, Inc.
Supplemental Definitions
Included in this section are management's statements regarding certain non-GAAP financial measures provided in this supplemental report and reasons why management believes that these measures provide useful information to investors about the Company's financial condition and results of operations. Reconciliations of these non-GAAP measures are included beginning on page 41. |
Adjusted Funds From Operations ("AFFO"): AFFO is calculated by deducting from Core FFO non-incremental capital expenditures and acquisition-related costs and adding back non-cash items including non-real estate depreciation, straight lined rents and fair value lease revenue, non-cash components of interest expense and compensation expense, and by making similar adjustments for unconsolidated partnerships and joint ventures. Although AFFO may not be comparable to that of other REITs, we believe it provides a meaningful indicator of our ability to fund cash needs and to make cash distributions to equity owners. AFFO is a non-GAAP financial measure and should not be viewed as an alternative measurement of our operating performance to net income, as an alternative to net cash flows from operating activities or as a measure of our liquidity. |
Annualized Lease Revenue ("ALR"): ALR is calculated by multiplying (i) rental payments (defined as base rent plus operating expense reimbursements, if payable by the tenant on a monthly basis under the terms of a lease that has been executed, but excluding a) rental abatements and b) rental payments related to executed but not commenced leases for space that was covered by an existing lease), by (ii) 12. In instances in which contractual rents or operating expense reimbursements are collected on an annual, semi-annual, or quarterly basis, such amounts are multiplied by a factor of 1, 2, or 4, respectively, to calculate the annualized figure. For leases that have been executed but not commenced relating to un-leased space, ALR is calculated by multiplying (i) the monthly base rental payment (excluding abatements) plus any operating expense reimbursements for the initial month of the lease term, by (ii) 12. Unless stated otherwise, this measure excludes our unconsolidated joint venture interests. |
Core EBITDA: Core EBITDA is defined as net income before interest, taxes, depreciation and amortization and incrementally removing any impairment losses, gains or losses from sales of property, or other significant non-recurring items. We do not include impairment losses in this measure because we feel these types of losses create volatility in our earnings and make it difficult to determine the earnings generated by our ongoing business. We believe Core EBITDA is a reasonable measure of our liquidity. Core EBITDA is a non-GAAP financial measure and should not be viewed as an alternative measurement of cash flows from operating activities or other GAAP basis liquidity measures. Other REITs may calculate Core EBITDA differently and our calculation should not be compared to that of other REITs. |
Core Funds From Operations ("Core FFO"): We calculate Core FFO by starting with FFO, as defined by NAREIT, and adjusting for certain non-recurring items such as gains or losses on the early extinguishment of debt, acquisition-related costs and other significant non-recurring items. Such items create significant earnings volatility. We believe Core FFO provides a meaningful measure of our operating performance and more predictability regarding future earnings potential. Core FFO is a non-GAAP financial measure and should not be viewed as an alternative measurement of our operating performance to net income; therefore, it should not be compared to other REITs' equivalent to Core FFO. |
EBITDA: EBITDA is defined as net income before interest, taxes, depreciation and amortization. We believe EBITDA is an appropriate measure of our ability to incur and service debt. EBITDA should not be considered as an alternative to cash flows from operating activities, as a measure of our liquidity or as an alternative to net income as an indicator of our operating activities. Other REITs may calculate EBITDA differently and our calculation should not be compared to that of other REITs. |
Funds From Operations ("FFO"): FFO is calculated in accordance with the current National Association of Real Estate Investment Trusts ("NAREIT") definition. NAREIT currently defines FFO as net income (computed in accordance with GAAP), excluding gains or losses from sales of property, impairment losses, and gains or losses on consolidation, adding back depreciation and amortization on real estate assets, and after the same adjustments for unconsolidated partnerships and joint ventures. These adjustments can vary among owners of identical assets in similar conditions based on historical cost accounting and useful-life estimates. FFO may provide valuable comparisons of operating performance between periods and with other REITs. FFO is a non-GAAP financial measure and should not be viewed as an alternative measurement of our operating performance to net income. We believe that FFO is a beneficial indicator of the performance of an equity REIT. However, other REITs may not define FFO in accordance with the NAREIT definition, or may interpret the current NAREIT definition differently than we do; therefore, our computation of FFO may not be comparable to that of such other REITs. |
Gross Assets: Gross assets is defined as total assets with the add back of accumulated depreciation and accumulated amortization related to real estate assets. |
Gross Real Estate Assets: Gross real estate assets is defined as total real estate assets with the add back of accumulated depreciation and accumulated amortization related to real estate assets. |
Incremental Capital Expenditures: Incremental Capital Expenditures are defined as capital expenditures of a non-recurring nature that incrementally enhance the underlying assets' income generating capacity. Tenant improvements, leasing commissions, building capital and deferred lease incentives ("Leasing Costs") incurred to lease space that was vacant at acquisition, Leasing Costs for spaces vacant for greater than one year, Leasing Costs for spaces at newly acquired properties for which in-place leases expire shortly after acquisition, improvements associated with the expansion of a building and renovations that change the underlying classification of a building are included in this measure. |
NOI from Unconsolidated Joint Ventures: NOI from Unconsolidated Joint Ventures is defined as Property NOI attributable to our interests in properties owned through unconsolidated partnerships. We present this measure on an accrual basis and a cash basis, which eliminates the effects of straight lined rents and fair value lease revenue. NOI from Unconsolidated Joint Ventures is a non-GAAP measure and therefore may not be comparable to similarly defined data provided by other REITs. |
Non-Incremental Capital Expenditures: Non-Incremental Capital Expenditures are defined as capital expenditures of a recurring nature related to tenant improvements and leasing commissions that do not incrementally enhance the underlying assets' income generating capacity. We exclude first generation tenant improvements and leasing commissions from this measure, in addition to other capital expenditures that qualify as Incremental Capital Expenditures, as defined above. |
Property Net Operating Income ("Property NOI"): Property NOI is defined as real estate operating income with the add-back of corporate general and administrative expense, depreciation and amortization, and impairment losses and the deduction of net operating income associated with property management performed by Piedmont for other organizations. We may present this measure on an accrual basis or a cash basis. When presented on a cash basis, the effects of straight lined rents and fair value lease revenue are eliminated. The Company uses this measure to assess its operating results and believes it is important in assessing operating performance. Property NOI is a non-GAAP measure which does not have any standard meaning prescribed by GAAP and therefore may not be comparable to similar measures presented by other companies. |
Same Store Net Operating Income ("Same Store NOI"): Same Store NOI is calculated as the Property NOI attributable to the properties owned or placed in service during the entire span of the current and prior year reporting periods. Same Store NOI excludes amounts attributable to unconsolidated joint venture assets. We may present this measure on an accrual basis or a cash basis. When presented on a cash basis, the effects of straight lined rents and fair value lease revenue are eliminated. We believe Same Store NOI is an important measure of comparison of our properties' operating performance from one period to another. Other REITs may calculate Same Store NOI differently and our calculation should not be compared to that of other REITs. |
Same Store Properties: Same Store Properties is defined as properties owned or placed in service during the entire span of the current and prior year reporting periods. Same Store Properties excludes unconsolidated joint venture assets. We believe Same Store Properties is an important measure of comparison of our stabilized portfolio performance. |
39
Piedmont Office Realty Trust, Inc.
Research Coverage
Equity Research Coverage
Paul E. Adornato, CFA | Michael Knott, CFA | Vance H. Edelson |
BMO Capital Markets | Jed Reagan | Morgan Stanley |
3 Times Square, 26th Floor | Green Street Advisors | 1585 Broadway, 38th Floor |
New York, NY 10036 | 660 Newport Center Drive, Suite 800 | New York, NY 10036 |
Phone: (212) 885-4170 | Newport Beach, CA 92660 | Phone: (212) 761-0078 |
Phone: (949) 640-8780 | ||
Brendan Maiorana | John W. Guinee, III | Michael J. Salinsky |
Wells Fargo | Erin Aslakson | RBC Capital Markets |
7 St. Paul Street | Stifel, Nicolaus & Company | Arbor Court |
MAC R1230-011 | One South Street | 30575 Bainbridge Road, Suite 250 |
Baltimore, MD 21202 | 16th Floor | Solon, OH 44139 |
Phone: (443) 263-6516 | Baltimore, MD 21202 | Phone: (440) 715-2648 |
Phone: (443) 224-1307 | ||
Anthony Paolone, CFA | David Rodgers, CFA | Steve Manaker, CFA |
JP Morgan | Robert W. Baird & Co. | Oppenheimer & Co. |
383 Madison Avenue | 200 Public Square | 85 Broad Street |
34th Floor | Suite 1650 | New York, NY 10004 |
New York, NY 10179 | Cleveland, OH 44139 | Phone: (212) 667-5950 |
Phone: (212) 622-6682 | Phone: (216) 737-7341 | |
Fixed Income Research Coverage
Mark S. Streeter, CFA | ||
JP Morgan | ||
383 Madison Avenue | ||
3rd Floor | ||
New York, NY 10179 | ||
Phone: (212) 834-5086 | ||
40
Piedmont Office Realty Trust, Inc.
Funds From Operations, Core Funds From Operations, and Adjusted Funds From Operations Reconciliations
Unaudited (in thousands)
Three Months Ended | |||||||||||||||||||
3/31/2014 | 12/31/2013 | 9/30/2013 | 6/30/2013 | 3/31/2013 | |||||||||||||||
Net income attributable to Piedmont | $ | 9,393 | $ | 29,623 | $ | 19,096 | $ | 35,358 | $ | 14,651 | |||||||||
Depreciation | 33,727 | 32,233 | 31,050 | 30,969 | 29,886 | ||||||||||||||
Amortization | 14,804 | 11,511 | 13,939 | 11,350 | 9,220 | ||||||||||||||
Impairment loss | — | 5,644 | — | — | 6,402 | ||||||||||||||
Loss / (gain) on sale of properties | 106 | (15,034 | ) | — | (16,258 | ) | — | ||||||||||||
Loss / (gain) on consolidation | — | — | 898 | — | — | ||||||||||||||
Funds from operations | 58,030 | 63,977 | 64,983 | 61,419 | 60,159 | ||||||||||||||
Adjustments: | |||||||||||||||||||
Acquisition costs | 66 | 389 | 60 | 70 | 1,244 | ||||||||||||||
Net (recoveries) / loss from casualty events and litigation settlements | (3,042 | ) | (4,500 | ) | (3,919 | ) | (3,570 | ) | 161 | ||||||||||
Core funds from operations | 55,054 | 59,866 | 61,124 | 57,919 | 61,564 | ||||||||||||||
Adjustments: | |||||||||||||||||||
Deferred financing cost amortization | 863 | 676 | 674 | 643 | 594 | ||||||||||||||
Amortization of discount on senior notes | 34 | 30 | 30 | 17 | — | ||||||||||||||
Depreciation of non real estate assets | 114 | 106 | 97 | 105 | 98 | ||||||||||||||
Straight-line effects of lease revenue | (9,412 | ) | (3,442 | ) | (5,076 | ) | (5,547 | ) | (4,032 | ) | |||||||||
Stock-based and other non-cash compensation expense | 636 | 101 | 719 | 176 | 594 | ||||||||||||||
Amortization of lease-related intangibles | (1,364 | ) | (1,211 | ) | (1,757 | ) | (1,245 | ) | (1,065 | ) | |||||||||
Acquisition costs | (66 | ) | (389 | ) | (60 | ) | (70 | ) | (1,244 | ) | |||||||||
Non-incremental capital expenditures | (13,821 | ) | (42,985 | ) | (21,705 | ) | (18,367 | ) | (19,920 | ) | |||||||||
Adjusted funds from operations | $ | 32,038 | $ | 12,752 | $ | 34,046 | $ | 33,631 | $ | 36,589 | |||||||||
41
Piedmont Office Realty Trust, Inc.
Same Store Net Operating Income (Cash Basis)
Unaudited (in thousands)
Three Months Ended | |||||||||||||||||||
3/31/2014 | 12/31/2013 | 9/30/2013 | 6/30/2013 | 3/31/2013 | |||||||||||||||
Net income attributable to Piedmont | $ | 9,393 | $ | 29,623 | $ | 19,096 | $ | 35,358 | $ | 14,651 | |||||||||
Net income attributable to noncontrolling interest | 4 | 3 | 4 | 4 | 4 | ||||||||||||||
Interest expense | 18,926 | 19,651 | 19,331 | 18,228 | 16,373 | ||||||||||||||
Depreciation | 33,841 | 32,340 | 31,147 | 31,074 | 29,984 | ||||||||||||||
Amortization | 14,804 | 11,511 | 13,939 | 11,350 | 9,220 | ||||||||||||||
Acquisition costs | 66 | 389 | 60 | 70 | 1,244 | ||||||||||||||
Impairment loss | — | 5,644 | — | — | 6,402 | ||||||||||||||
Net (recoveries) / loss from casualty events and litigation settlements | (3,042 | ) | (4,500 | ) | (3,919 | ) | (3,570 | ) | 161 | ||||||||||
Loss / (gain) on sale of properties | 106 | (15,034 | ) | — | (16,258 | ) | — | ||||||||||||
Loss / (gain) on consolidation | — | — | 898 | — | — | ||||||||||||||
Core EBITDA | 74,098 | 79,627 | 80,556 | 76,256 | 78,039 | ||||||||||||||
General & administrative expenses | 4,582 | 5,076 | 5,921 | 6,410 | 4,609 | ||||||||||||||
Management fee revenue | (259 | ) | 17 | (636 | ) | (256 | ) | (356 | ) | ||||||||||
Other (income) / expense | 30 | 3 | 550 | (12 | ) | 21 | |||||||||||||
Straight-line effects of lease revenue | (9,412 | ) | (3,442 | ) | (5,076 | ) | (5,547 | ) | (4,032 | ) | |||||||||
Amortization of lease-related intangibles | (1,364 | ) | (1,211 | ) | (1,757 | ) | (1,245 | ) | (1,065 | ) | |||||||||
Property net operating income (cash basis) | 67,675 | 80,070 | 79,558 | 75,606 | 77,216 | ||||||||||||||
Deduct net operating (income) / loss from: | |||||||||||||||||||
Acquisitions | (5,798 | ) | (4,321 | ) | (6,176 | ) | (3,705 | ) | (860 | ) | |||||||||
Dispositions | (364 | ) | (879 | ) | (1,053 | ) | (1,282 | ) | (1,022 | ) | |||||||||
Other investments | 382 | (2,251 | ) | (2,328 | ) | (2,507 | ) | (2,704 | ) | ||||||||||
Same store net operating income (cash basis) | $ | 61,895 | $ | 72,619 | $ | 70,001 | $ | 68,112 | $ | 72,630 | |||||||||
42
Piedmont Office Realty Trust, Inc.
Unconsolidated Joint Venture Net Operating Income Reconciliations
Pro rata and unaudited (in thousands)
Three Months Ended | |||||||||||||||||||
3/31/2014 | 12/31/2013 | 9/30/2013 | 6/30/2013 | 3/31/2013 | |||||||||||||||
Equity in income of unconsolidated joint ventures | $ | (266 | ) | $ | (4,280 | ) | $ | 46 | $ | 163 | $ | 395 | |||||||
Interest expense | — | — | — | — | — | ||||||||||||||
Depreciation | 114 | 150 | 220 | 309 | 300 | ||||||||||||||
Amortization | 8 | 34 | 40 | 45 | 41 | ||||||||||||||
Impairment loss | — | 4,402 | — | — | — | ||||||||||||||
Loss / (gain) on sale of properties | — | — | — | — | — | ||||||||||||||
Core EBITDA | (144 | ) | 306 | 306 | 517 | 736 | |||||||||||||
General and administrative expenses | 24 | (128 | ) | 79 | 120 | 60 | |||||||||||||
Other (income) / expense | — | — | — | — | — | ||||||||||||||
Property net operating income (accrual basis) | (120 | ) | 178 | 385 | 637 | 796 | |||||||||||||
Straight-line effects of lease revenue | (6 | ) | (3 | ) | (9 | ) | (40 | ) | (52 | ) | |||||||||
Amortization of lease-related intangibles | — | — | — | — | — | ||||||||||||||
Property net operating income (cash basis) | $ | (126 | ) | $ | 175 | $ | 376 | $ | 597 | $ | 744 | ||||||||
43
Piedmont Office Realty Trust, Inc.
Discontinued Operations
Unaudited (in thousands)
Three Months Ended | |||||||||||||||||||
3/31/2014 | 12/31/2013 | 9/30/2013 | 6/30/2013 | 3/31/2013 | |||||||||||||||
Revenues: | |||||||||||||||||||
Rental income | $ | 1,174 | $ | 1,888 | $ | 2,155 | $ | 2,289 | $ | 2,928 | |||||||||
Tenant reimbursements | 112 | 146 | 181 | 308 | 434 | ||||||||||||||
Other rental income | — | — | — | — | — | ||||||||||||||
1,286 | 2,034 | 2,336 | 2,597 | 3,362 | |||||||||||||||
Expenses: | |||||||||||||||||||
Property operating costs | 505 | 748 | 945 | 921 | 1,486 | ||||||||||||||
Depreciation | 83 | 498 | 632 | 596 | 859 | ||||||||||||||
Amortization | 223 | 281 | 215 | 105 | 169 | ||||||||||||||
General and administrative | 3 | 1 | (8 | ) | 10 | 1 | |||||||||||||
814 | 1,528 | 1,784 | 1,632 | 2,515 | |||||||||||||||
Other income / (expense): | |||||||||||||||||||
Interest expense | — | — | — | — | — | ||||||||||||||
Other income / (expense) | (6 | ) | — | (15 | ) | 13 | 12 | ||||||||||||
Net recoveries / (loss) from casualty events and litigation settlements | — | — | — | 17 | — | ||||||||||||||
Net income attributable to noncontrolling interest | — | — | — | — | — | ||||||||||||||
(6 | ) | — | (15 | ) | 30 | 12 | |||||||||||||
Operating income, excluding impairment loss and gain / (loss) on sale | 466 | 506 | 537 | 995 | 859 | ||||||||||||||
Impairment loss | — | (1,242 | ) | — | — | (6,402 | ) | ||||||||||||
Gain / (loss) on sale of properties | (106 | ) | 15,034 | — | 16,258 | — | |||||||||||||
Income from discontinued operations | $ | 360 | $ | 14,298 | $ | 537 | $ | 17,253 | $ | (5,543 | ) | ||||||||
44
Piedmont Office Realty Trust, Inc.
Property Detail
As of March 31, 2014
(in thousands)
Property | City | State | Percent Ownership | Year Built | Rentable Square Footage Owned | Leased Percentage | Commenced Leased Percentage | Economic Leased Percentage (1) | |||
Atlanta | |||||||||||
11695 Johns Creek Parkway | Johns Creek | GA | 100.0% | 2001 | 101 | 85.1 | % | 85.1 | % | 66.3 | % |
3750 Brookside Parkway | Alpharetta | GA | 100.0% | 2001 | 104 | 80.8 | % | 80.8 | % | 59.6 | % |
Glenridge Highlands Two | Atlanta | GA | 100.0% | 2000 | 427 | 86.2 | % | 86.2 | % | 79.6 | % |
Suwanee Gateway One | Suwanee | GA | 100.0% | 2008 | 142 | 0.0% | 0.0% | 0.0% | |||
The Dupree | Atlanta | GA | 100.0% | 1997 | 138 | 95.7 | % | 95.7 | % | 82.6 | % |
The Medici | Atlanta | GA | 100.0% | 2008 | 154 | 75.3 | % | 31.8 | % | 31.8 | % |
Metropolitan Area Subtotal / Weighted Average | 1,066 | 73.7 | % | 67.4 | % | 59.3 | % | ||||
Austin | |||||||||||
Braker Pointe III | Austin | TX | 100.0% | 2001 | 195 | 100.0 | % | 100.0 | % | 100.0 | % |
Metropolitan Area Subtotal / Weighted Average | 195 | 100.0 | % | 100.0 | % | 100.0 | % | ||||
Boston | |||||||||||
1200 Crown Colony Drive | Quincy | MA | 100.0% | 1990 | 235 | 100.0 | % | 100.0 | % | 100.0 | % |
90 Central Street | Boxborough | MA | 100.0% | 2001 | 175 | 100.0 | % | 94.9 | % | 94.9 | % |
1414 Massachusetts Avenue | Cambridge | MA | 100.0% | 1873 | 78 | 100.0 | % | 100.0 | % | 100.0 | % |
One Brattle Square | Cambridge | MA | 100.0% | 1991 | 95 | 100.0 | % | 100.0 | % | 94.7 | % |
225 Presidential Way | Woburn | MA | 100.0% | 2001 | 202 | 100.0 | % | 100.0 | % | 100.0 | % |
235 Presidential Way | Woburn | MA | 100.0% | 2000 | 238 | 100.0 | % | 100.0 | % | 100.0 | % |
5 & 15 Wayside Road | Burlington | MA | 100.0% | 1999 / 2001 | 271 | 100.0 | % | 100.0 | % | 98.2 | % |
Metropolitan Area Subtotal / Weighted Average | 1,294 | 100.0 | % | 99.3 | % | 98.5 | % | ||||
Chicago | |||||||||||
Windy Point I | Schaumburg | IL | 100.0% | 1999 | 187 | 100.0 | % | 100.0 | % | 100.0 | % |
Windy Point II | Schaumburg | IL | 100.0% | 2001 | 301 | 100.0 | % | 83.1 | % | — | % |
Aon Center | Chicago | IL | 100.0% | 1972 | 2,729 | 79.3 | % | 72.6 | % | 52.1 | % |
Two Pierce Place | Itasca | IL | 100.0% | 1991 | 486 | 88.5 | % | 84.4 | % | 80.0 | % |
2300 Cabot Drive | Lisle | IL | 100.0% | 1998 | 152 | 78.9 | % | 72.4 | % | 69.7 | % |
500 West Monroe Street | Chicago | IL | 100.0% | 1991 | 966 | 63.5 | % | 56.2 | % | 11.0 | % |
Metropolitan Area Subtotal / Weighted Average | 4,821 | 79.1 | % | 72.2 | % | 45.9 | % | ||||
Cleveland | |||||||||||
Eastpoint I | Mayfield Heights | OH | 100.0% | 2000 | 85 | 70.6 | % | 70.6 | % | 1.2 | % |
Eastpoint II | Mayfield Heights | OH | 100.0% | 2000 | 85 | 95.3 | % | 95.3 | % | 95.3 | % |
Metropolitan Area Subtotal / Weighted Average | 170 | 82.9 | % | 82.9 | % | 48.2 | % | ||||
45
Property | City | State | Percent Ownership | Year Built | Rentable Square Footage Owned | Leased Percentage | Commenced Leased Percentage | Economic Leased Percentage (1) | |||
Dallas | |||||||||||
3900 Dallas Parkway | Plano | TX | 100.0% | 1999 | 120 | 100.0 | % | 100.0 | % | 93.3 | % |
5601 Headquarters Drive | Plano | TX | 100.0% | 2001 | 166 | 100.0 | % | 100.0 | % | 100.0 | % |
6031 Connection Drive | Irving | TX | 100.0% | 1999 | 232 | 100.0 | % | 100.0 | % | 100.0 | % |
6021 Connection Drive | Irving | TX | 100.0% | 2000 | 222 | 100.0 | % | — | % | — | % |
6011 Connection Drive | Irving | TX | 100.0% | 1999 | 152 | 100.0 | % | 100.0 | % | 100.0 | % |
Las Colinas Corporate Center I | Irving | TX | 100.0% | 1998 | 159 | 99.4 | % | 99.4 | % | 99.4 | % |
Las Colinas Corporate Center II | Irving | TX | 100.0% | 1998 | 228 | 98.7 | % | 96.9 | % | 74.1 | % |
6565 North MacArthur Boulevard | Irving | TX | 100.0% | 1998 | 260 | 93.5 | % | 93.5 | % | 86.9 | % |
One Lincoln Park | Dallas | TX | 100.0% | 1999 | 262 | 80.2 | % | 79.4 | % | 73.7 | % |
161 Corporate Center | Irving | TX | 100.0% | 1998 | 105 | 99.0 | % | 90.5 | % | 90.5 | % |
Metropolitan Area Subtotal / Weighted Average | 1,906 | 96.1 | % | 83.7 | % | 78.9 | % | ||||
Detroit | |||||||||||
1441 West Long Lake Road | Troy | MI | 100.0% | 1999 | 108 | 88.0 | % | 88.0 | % | 84.3 | % |
150 West Jefferson | Detroit | MI | 100.0% | 1989 | 493 | 73.2 | % | 69.4 | % | 56.4 | % |
Auburn Hills Corporate Center | Auburn Hills | MI | 100.0% | 2001 | 120 | 100.0 | % | 100.0 | % | 100.0 | % |
1075 West Entrance Drive | Auburn Hills | MI | 100.0% | 2001 | 210 | 100.0 | % | 100.0 | % | 100.0 | % |
4685 Investment Drive | Troy | MI | 100.0% | 2000 | 77 | 100.0 | % | 100.0 | % | 100.0 | % |
Metropolitan Area Subtotal / Weighted Average | 1,008 | 85.6 | % | 83.7 | % | 77.0 | % | ||||
Central & South Florida | |||||||||||
Sarasota Commerce Center II | Sarasota | FL | 100.0% | 1999 | 152 | 93.4 | % | 93.4 | % | 93.4 | % |
5601 Hiatus Road | Tamarac | FL | 100.0% | 2001 | 100 | 100.0 | % | 100.0 | % | 100.0 | % |
2001 NW 64th Street | Ft. Lauderdale | FL | 100.0% | 2001 | 48 | 100.0 | % | 100.0 | % | 100.0 | % |
400 TownPark | Lake Mary | FL | 100.0% | 2008 | 176 | 48.9 | % | 48.9 | % | 45.5 | % |
Metropolitan Area Subtotal / Weighted Average | 476 | 79.0 | % | 79.0 | % | 77.7 | % | ||||
Houston | |||||||||||
1430 Enclave Parkway | Houston | TX | 100.0% | 1994 | 313 | 100.0 | % | 100.0 | % | 100.0 | % |
Metropolitan Area Subtotal / Weighted Average | 313 | 100.0 | % | 100.0 | % | 100.0 | % | ||||
Kansas City | |||||||||||
2020 West 89th Street | Leawood | KS | 100.0% | 1992 | 68 | 89.7 | % | 89.7 | % | 89.7 | % |
Metropolitan Area Subtotal / Weighted Average | 68 | 89.7 | % | 89.7 | % | 89.7 | % | ||||
Los Angeles | |||||||||||
800 North Brand Boulevard | Glendale | CA | 100.0% | 1990 | 527 | 95.4 | % | 95.4 | % | 80.6 | % |
1055 East Colorado Boulevard | Pasadena | CA | 100.0% | 2001 | 176 | 96.0 | % | 96.0 | % | 96.0 | % |
Fairway Center II | Brea | CA | 100.0% | 2002 | 134 | 100.0 | % | 97.8 | % | 97.8 | % |
1901 Main Street | Irvine | CA | 100.0% | 2001 | 173 | 92.5 | % | 92.5 | % | 92.5 | % |
Metropolitan Area Subtotal / Weighted Average | 1,010 | 95.6 | % | 95.3 | % | 87.6 | % | ||||
Minneapolis | |||||||||||
Crescent Ridge II | Minnetonka | MN | 100.0% | 2000 | 301 | 76.4 | % | 75.7 | % | 68.8 | % |
US Bancorp Center | Minneapolis | MN | 100.0% | 2000 | 928 | 95.2 | % | 94.5 | % | 92.8 | % |
One Meridian Crossings | Richfield | MN | 100.0% | 1997 | 195 | 100.0 | % | 100.0 | % | 100.0 | % |
Two Meridian Crossings | Richfield | MN | 100.0% | 1998 | 189 | 93.7 | % | 92.6 | % | 91.0 | % |
Metropolitan Area Subtotal / Weighted Average | 1,613 | 92.1 | % | 91.4 | % | 89.0 | % | ||||
46
Property | City | State | Percent Ownership | Year Built | Rentable Square Footage Owned | Leased Percentage | Commenced Leased Percentage | Economic Leased Percentage (1) | |||
Nashville | |||||||||||
2120 West End Avenue | Nashville | TN | 100.0% | 2000 | 312 | 100.0 | % | 100.0 | % | 100.0 | % |
5301 Maryland Way | Brentwood | TN | 100.0% | 1989 | 201 | 100.0 | % | 100.0 | % | 100.0 | % |
Metropolitan Area Subtotal / Weighted Average | 513 | 100.0 | % | 100.0 | % | 100.0 | % | ||||
New York | |||||||||||
2 Gatehall Drive | Parsippany | NJ | 100.0% | 1985 | 405 | 100.0 | % | 100.0 | % | 49.4 | % |
200 Bridgewater Crossing | Bridgewater | NJ | 100.0% | 2002 | 309 | 93.9 | % | 88.0 | % | 88.0 | % |
Copper Ridge Center | Lyndhurst | NJ | 100.0% | 1989 | 268 | 94.4 | % | 94.4 | % | 94.4 | % |
60 Broad Street | New York | NY | 100.0% | 1962 | 1,027 | 98.9 | % | 96.9 | % | 96.9 | % |
600 Corporate Drive | Lebanon | NJ | 100.0% | 2005 | 125 | 100.0 | % | 100.0 | % | 100.0 | % |
400 Bridgewater Crossing | Bridgewater | NJ | 100.0% | 2002 | 298 | 100.0 | % | 86.6 | % | 86.6 | % |
Metropolitan Area Subtotal / Weighted Average | 2,432 | 98.1 | % | 94.9 | % | 86.5 | % | ||||
Philadelphia | |||||||||||
1901 Market Street | Philadelphia | PA | 100.0% | 1987 | 801 | 100.0 | % | 100.0 | % | 100.0 | % |
Metropolitan Area Subtotal / Weighted Average | 801 | 100.0 | % | 100.0 | % | 100.0 | % | ||||
Phoenix | |||||||||||
River Corporate Center | Tempe | AZ | 100.0% | 1998 | 133 | 100.0 | % | 100.0 | % | 100.0 | % |
Desert Canyon 300 | Phoenix | AZ | 100.0% | 2001 | 149 | 100.0 | % | 100.0 | % | 100.0 | % |
Chandler Forum | Chandler | AZ | 100.0% | 2003 | 150 | 42.0 | % | 42.0 | % | 42.0 | % |
Metropolitan Area Subtotal / Weighted Average | 432 | 79.9 | % | 79.9 | % | 79.9 | % | ||||
Washington, D.C. | |||||||||||
1201 Eye Street | Washington | DC | 49.5% (2) | 2001 | 269 | 100.0 | % | 100.0 | % | 100.0 | % |
1225 Eye Street | Washington | DC | 49.5% (2) | 1986 | 225 | 77.8 | % | 76.4 | % | 75.6 | % |
400 Virginia Avenue | Washington | DC | 100.0% | 1985 | 224 | 87.1 | % | 87.1 | % | 84.8 | % |
4250 North Fairfax Drive | Arlington | VA | 100.0% | 1998 | 305 | 54.8 | % | 54.8 | % | 54.8 | % |
9211 Corporate Boulevard | Rockville | MD | 100.0% | 1989 | 115 | — | % | — | % | — | % |
9221 Corporate Boulevard | Rockville | MD | 100.0% | 1989 | 115 | 100.0 | % | 100.0 | % | 100.0 | % |
One Independence Square | Washington | DC | 100.0% | 1991 | 334 | 0.3 | % | 0.3 | % | 0.3 | % |
9200 Corporate Boulevard | Rockville | MD | 100.0% | 1982 | 109 | 100.0 | % | 100.0 | % | 100.0 | % |
Two Independence Square | Washington | DC | 100.0% | 1991 | 561 | 100.0 | % | 100.0 | % | 100.0 | % |
Piedmont Pointe I | Bethesda | MD | 100.0% | 2007 | 186 | 68.8 | % | 68.8 | % | 68.8 | % |
Piedmont Pointe II | Bethesda | MD | 100.0% | 2008 | 223 | 54.7 | % | 54.7 | % | 51.6 | % |
Arlington Gateway (3) | Arlington | VA | 100.0% | 2005 | 323 | 91.3 | % | 91.3 | % | 91.3 | % |
Metropolitan Area Subtotal / Weighted Average | 2,989 | 71.5 | % | 71.4 | % | 70.9 | % | ||||
Grand Total | 21,107 | 86.7 | % | 83.1 | % | 74.0 | % | ||||
(1) | Economic leased percentage excludes the square footage associated with executed but not commenced leases for currently vacant spaces and the square footage associated with tenants receiving rental abatements (after proportional adjustments for tenants receiving only partial rental abatements). |
(2) | Although Piedmont owns 49.5% of the asset, it is entitled to 100% of the cash flows under the terms of the property ownership entity's joint venture agreement. |
(3) | The property consists of approximately 334,000 square feet; however, due to the square footages referenced in several leases, the rentable square footage is currently 323,000 square feet. As the existing leases expire, the affected spaces will be re-leased to the correct square footages. |
47
Piedmont Office Realty Trust, Inc.
Supplemental Operating & Financial Data
Risks, Uncertainties and Limitations
Certain statements contained in this supplemental package constitute forward-looking statements within the meaning of Section 27A of the Securities Act of 1933, as amended (the “Securities Act”) and Section 21E of the Securities Exchange Act of 1934, as amended (the “Exchange Act”). We intend for all such forward-looking statements to be covered by the safe-harbor provisions for forward-looking statements contained in Section 27A of the Securities Act and Section 21E of the Exchange Act, as applicable. Such information is subject to certain risks and uncertainties, as well as known and unknown risks, which could cause actual results to differ materially from those projected or anticipated. Therefore, such statements are not intended to be a guarantee of our performance in future periods. Such forward-looking statements can generally be identified by our use of forward-looking terminology such as “may,” “will,” “expect,” “intend,” “anticipate,” “believe,” “continue” or similar words or phrases that are predictions of future events or trends and which do not relate solely to historical matters.
The following are some of the factors that could cause our actual results and expectations to differ materially from those described in our forward-looking statements: market and economic conditions remain challenging in some markets we operate in and the demand for office space, rental rates and property values may continue to lag the general economic recovery causing our business, results of operations, cash flows, financial condition and access to capital to be adversely affected or otherwise impact performance, including the potential recognition of impairment charges; the success of our real estate strategies and investment objectives, including our ability to identify and consummate suitable acquisitions; acquisitions of properties may have unknown risks and other liabilities at the time of acquisition; lease terminations or lease defaults, particularly by one of our large lead tenants; the impact of competition on our efforts to renew existing leases or re-let space on terms similar to existing leases; changes in the economies and other conditions of the office market in general and of the specific markets in which we operate; economic and regulatory changes, including accounting standards, that impact the real estate market generally; additional risks and costs associated with directly managing properties occupied by government tenants; adverse market and economic conditions may continue to adversely affect us and could cause us to recognize impairment charges or otherwise impact our performance; availability of financing and our lending banks' ability to honor existing line of credit commitments; we have significant indebtedness and may not be able to meet our debt service obligations; costs of complying with governmental laws and regulations; uncertainties associated with environmental and other regulatory matters; potential changes in political environment and reduction in federal and/or state funding of our governmental tenants; we may be subject to litigation, which could have a material adverse effect on our financial condition; changes in tax laws impacting real estate investment trusts and real estate in general, as well as our ability to continue to qualify as a real estate investment trust under the Internal Revenue Code; and other factors detailed in our most recent Annual Report on Form 10-K and other documents we file with the Securities and Exchange Commission.
Readers are cautioned not to place undue reliance on these forward-looking statements, which speak only as of the date of this supplemental report. We cannot guarantee the accuracy of any such forward-looking statements contained in this supplemental report, and we do not intend to publicly update or revise any forward-looking statements, whether as a result of new information, future events, or otherwise.
48