Attached files
| file | filename |
|---|---|
| EX-31 - ConnectOne Bancorp, Inc. | c77393_ex31.htm |
| EX-21 - ConnectOne Bancorp, Inc. | c77393_ex21.htm |
| EX-32 - ConnectOne Bancorp, Inc. | c77393_ex32.htm |
| EX-23.1 - ConnectOne Bancorp, Inc. | c77393_ex23-1.htm |
U.S.
SECURITIES AND EXCHANGE COMMISSION
WASHINGTON, D. C. 20549
FORM 10-K/A
(Amendment No. 2)
S ANNUAL REPORT PURSUANT TO SECTION 13 OR 15 (d) OF THE SECURITIES EXCHANGE ACT OF 1934
For the fiscal year ended December 31, 2013
or
£ TRANSITION REPORT PURSUANT TO SECTION 13 OR 15 (d) OF THE SECURITIES EXCHANGE ACT OF 1934
For the transition period from ________ to _________
Commission File Number 001-35812

ConnectOne Bancorp, Inc.
(Exact name of registrant as specified in its charter)
| New Jersey (State of other jurisdiction of incorporation or organization) |
26-1998619 (I. R. S. Employer Identification No.) | |
| 301 Sylvan Avenue, Englewood Cliffs, NJ (Address of principal executive offices) |
07632 (Zip Code) |
(201)
816-8900
(Registrants’ telephone number including area code)
Securities registered under Section 12(b) of the Exchange Act:
| Title of each class | Name of each exchange on which registered | |
| Common Stock, no par value | Nasdaq |
Securities registered under Section 12(g) of the Exchange Act: None
Indicate by check mark if the registrant is a well-known seasoned issuer, as defined in Rule 405 of the Securities Act. Yes £ No S
Indicate by check mark if the registrant
is not required to file reports pursuant to Section 13 or 15(d) of the Act.
Yes £ No S
Check whether the registrant (1) has filed all reports required to be filed by Section 13 or 15(d) of the Securities and Exchange Act of 1934 during the preceding 12 months (or for such shorter period that the registrant was required to file such reports), and (2) has been subject to such filing requirements for the past 90 days. Yes SNo £
Indicate by check mark whether the registrant has submitted electronically and posted on its corporate Web site, if any, every Interactive Data File required to be submitted and posted pursuant to Rule 405 of Regulation S-T during the preceding 12 months (or for such shorter period that the registrant was required to submit and post such files). Yes S No £
Check if there is no disclosure of delinquent filers pursuant to Item 405 of Regulation S-K contained herein, and will not be contained, to the best of registrant’s knowledge, in definitive proxy or information statements incorporated by referenced in Part III of this Form 10-K or any amendment to this Form 10-K. S
Indicate by check mark whether the registrant is a large accelerated filer, an accelerated filer, or a non-accelerated filer or a smaller reporting company. See definitions of “large accelerated filer”, “accelerated filer” and “small reporting company” in Rule 12b-2 of the Exchange Act. (check one) : Large accelerated filer £ Accelerated filer £ Non-accelerated filer S Smaller reporting company £
(Do not check if a smaller reporting company)
Indicate by check mark whether the registrant is a shell company (as defined in Rule 12b-2 of the Exchange Act). Yes £ No S
The aggregate market value of the voting and non-voting common equity held by non-affiliates computed by reference to the price at which the common equity was last sold or the average bid and ask price of such common equity, as of the last business day of the registrant’s most recently completed second fiscal quarter—$137.7 million.
As of March 3, 2014 there were 5,121,769, shares of common stock, no par value per share outstanding.
|
|
EXPLANATORY NOTE
This Amendment No. 2 on Form 10-K/A (this “Amendment No. 2”) amends and restates the Annual Report on Form 10-K for the fiscal year ended December 31, 2013 of ConnectOne Bancorp, Inc. filed with the Securities and Exchange Commission (the “SEC”) on March 5, 2014 (the “Annual Report”), as previously amended by Amendment No. 1 on Form 10-K/A filed with the SEC on April 14, 2014 (“Amendment No. 1”). For purposes of this Amendment No. 2, the Annual Report, as amended by Amendment No. 1, is referred to as the “Original Filing.”
This Amendment No. 2 is being filed solely to include the information required by Item 10 — “Directors, Executive Officers and Corporate Governance”, Item 11 — “Executive Compensation”, Item 12 — “Security Ownership of Certain Beneficial Owners and Management and Related Stockholder Matters”, Item 13 — “Certain Relationships and Related Transactions, and Director Independence” and Item 14 — “Principal Accounting Fees and Services” of Part III of Form 10-K. Items 10, 11, 12, 13 and 14 of Part III of the Original Filing are amended and restated in their entirety as set forth in this Amendment No. 2. In addition, pursuant to Rule 13a-14(a) of the Securities Exchange Act of 1934, as amended, the Company is including with this Amendment No. 2 certain currently dated certifications.
Except as described above, no other amendments are being made to the Original Filing. This Amendment No. 2 does not reflect events occurring after the March 5, 2014 filing of the Company’s Annual Report or modify or update the disclosure contained in the Original Filing in any way other than as required to reflect the amendments discussed above and reflected below. Accordingly, this Amendment No. 2 should be read in conjunction with the Registrant’s other filings with the SEC.
i
|
|
PART I
Item 1. Business.
General
ConnectOne Bancorp, Inc. (“we”, “us” our”, the “Company” or “ConnectOne”) is a New Jersey corporation formed in 2008 to become the holding company for ConnectOne Bank (the “Bank”). Our sole activity currently is ownership and control of the Bank. The Bank operates as a locally headquartered, community- oriented bank serving customers throughout New Jersey from offices in Bergen, Hudson, and Monmouth Counties, New Jersey.
We offer a broad range of deposit and loan products and services to the general public and, in particular, to small and mid-sized businesses, local professionals and individuals residing, working and shopping in our trade area.
Historically, we have concentrated on organic growth, through opening new branches and offering new technology and product delivery channels to acquire new customers. While we expect to take an opportunistic approach to acquisitions, considering opportunities to purchase whole institutions, branches or lines of business that complement our existing strategy, we expect the bulk of our growth to continue to be organic. Our goal is to open new offices in the counties contained in our broader trade area discussed above. However, we do not believe that we need to establish a physical location in each market that we serve. We believe that advances in technology have created new delivery channels which allow us to service customers and maintain business relationships without a physical presence, and that these customers can also be serviced through a regional office. We believe the key to customer acquisition and retention is establishing quality teams of lenders and business relationship officers who will frequently go to the customer, rather than having the customer come into the branch.
We emphasize superior customer service and relationship banking. The Bank offers high-quality service by minimizing personnel turnover and by providing more direct, personal attention than the Bank believes is offered by competing financial institutions, the majority of which are branch offices of banks headquartered outside the Bank’s primary trade area. By emphasizing the need for a professional, responsive and knowledgeable staff, the Bank offers a superior level of service to our customers. As a result of senior management’s availability for consultation on a daily basis, the Bank believes it offers customers a quicker response on loan applications and other banking transactions, as well as greater certainty that these transactions will actually close, than competitors, whose decisions may be made in distant headquarters. We believe that this response time and certainty to close result in a pricing advantage to us, in that we frequently may exceed competitors’ loan pricing and still win customers. We also provide state-of-the-art banking technology, including remote deposit capture, internet banking and mobile banking, to provide our customers with the most choices and maximum flexibility. We believe that this combination of quick, responsive and personal service and advanced technology provides the Bank’s customers with a superior banking experience.
On January 20, 2014, the Company, entered into an Agreement and Plan of Merger (the “Merger Agreement”) with Center Bancorp, Inc. (NASDAQ: “CNBC”) (“Center Bancorp”). The Merger Agreement provides that, upon the terms and subject to the conditions set forth therein, the Company will merge with and into Center Bancorp, with Center Bancorp continuing as the surviving entity (the “Merger”). The Merger Agreement also provides that, immediately following the consummation of the Merger, Union Center National Bank, a commercial bank chartered pursuant to the laws of the United States (“Union Center”) and a wholly-owned subsidiary of Center Bancorp, will merge with and into the Bank, with the Bank continuing as the surviving bank. Upon completion of the Merger, each share of common stock of the Company will be converted into and become the right to receive 2.6 shares of common stock, no par value per share, of Center Bancorp. Immediately after consummation of the transaction, the directors of the resulting corporation and the resulting bank shall consist of six individuals who previously served as Center Bancorp Directors and six Directors who previously served as Directors of the Company, each to hold office in accordance with the Amended and Restated Certificate of Incorporation and the by-laws of the surviving corporation until their respective successors are duly elected or appointed and qualified.
1
The officers of the surviving corporation shall consist of (i) Frank S. Sorrentino III as Chairman, President and Chief Executive Officer; (ii) William S. Burns, Chief Financial Officer; and (iii) Anthony Weagley, current President and Chief Executive Officer of Center Bancorp, as Chief Operating Officer. Completion of the Merger is subject to various conditions, including, among others, (i) approval by shareholders of Center Bancorp and the Company of the Merger Agreement and the transactions contemplated thereby, (ii) the receipt of all necessary approvals and consents of governmental entities
required to consummate the transactions contemplated by the Merger Agreement, (iii) the absence of any order or proceeding which prohibits the Merger or the Bank Merger and (iv) the receipt by each of Center Bancorp and ConnectOne Bancorp of an opinion to the effect that the Merger will be
treated as a reorganization qualifying under Section 368(a) of the Internal Revenue Code of 1986, as amended. Each party’s obligation to consummate the Merger is also subject to certain customary conditions, including (i) subject to certain exceptions, the accuracy of the representations and warranties of
the other party, (ii) performance in all material respects of its agreements, covenants and obligations and (iii) the delivery of certain certificates and other documents. The Company expects the Merger to be completed in either the second or third quarter of 2014. Our Market Area Our banking offices are located in Bergen, Hudson and Monmouth Counties in New Jersey, which include some of the most affluent markets in the United States. We also attract business and customers from a broader region, primarily defined as the northeastern quarter of the state of New Jersey,
from Route 195 to the south and Route 287 to the west to the New York state border on the north. Products and Services We derive substantially all of our income from our net interest income (i.e. the difference between the interest we receive on our loans and securities and the interest we pay on deposits and other borrowings.) The Bank offers a broad range of deposit and loan products. In addition, to attract the
business of consumer and business customers, we also provide a broad array of other banking services. Products and services provided include personal and business checking accounts, retirement accounts, money market accounts, time and savings accounts, credit cards, wire transfers, access to automated
teller services, internet banking, Treasury Direct, ACH origination, lockbox services and mobile banking by phone. In addition, the Bank offers safe deposit boxes. The Bank also offers remote deposit capture banking for both retail and business customers, providing the ability to electronically scan and
transmit checks for deposit, reducing time and cost. Checking consists of both retail and business demand deposit products. Retail products include Totally Free checking and, for businesses, both interest-bearing accounts, which require a minimum balance, and non-interest bearing accounts. NOW accounts consist of both retail and business interest-
bearing transaction accounts that have minimum balance requirements. Money market accounts consist of products that provide a market rate of interest to depositors but have limited check writing capabilities. Our savings accounts consist of both passbook and statement type accounts. Time deposits
consist of certificates of deposit, including those held in IRA accounts, generally with initial maturities ranging from 7 days to 60 months and brokered certificates of deposit, which the Company uses for asset liability management purposes and to supplement other sources of funding. Deposits serve as the primary source of funding for the Bank’s interest-earning assets, but also generate non-interest revenue through insufficient funds fees, stop payment fees, safe deposit rental fees, card income, including foreign ATM fees and credit and debit card interchange, gift card fees, and
other miscellaneous fees. In addition, the Bank generates additional non-interest revenue associated with residential loan origination and sale, loan servicing, late fees and merchant services. 2
The Bank offers personal and commercial business loans on a secured and unsecured basis, revolving lines of credit, commercial mortgage loans, and residential mortgages on both primary and secondary residences, home equity loans, bridge loans and other personal purpose loans. However, the Bank
is not and has not been a participant in the sub-prime lending market. Commercial loans are loans made for business purposes and are primarily secured by collateral such as cash balances with the Bank, marketable securities held by or under the control of the Bank, business assets including accounts receivable, taxi medallions, inventory and equipment, and liens on
commercial and residential real estate. Commercial construction loans are loans to finance the construction of commercial or residential properties secured by first liens on such properties. Commercial real estate loans include loans secured by first liens on completed commercial properties, including multi-
family properties, to purchase or refinance such properties. Residential mortgages include loans secured by first liens on residential real estate, and are generally made to existing customers of the Bank to purchase or refinance primary and secondary residences. Home equity loans and lines of credit
include loans secured by first or second liens on residential real estate for primary or secondary residences. Consumer loans are made to individuals who qualify for auto loans, cash reserve, credit cards and installment loans. The Board of Directors has approved a loan policy granting designated lending authorities to members of the Senior Lending Group, which is comprised of the Chief Executive Officer, Chief Lending Officer and Chief Credit Officer. Combined authorities allow the group to approve loans up to the
Bank’s legal lending limit (currently $21.9 million as of December 31, 2013 for most loans), provided that (i) the credit does not involve an exception to policy, and (ii) the credit does not exceed a certain dollar amount threshold set forth in our policy, which varies by loan type. The Board Loan
Committee (which includes the Chief Executive Officer and four other Board members) approves credits that are both exceptions to policy and are above prescribed amounts related to loan type and collateral. The Bank’s lending policies generally provide for lending inside of our primary trade area. However, the Bank will make loans to persons outside of our primary trade area when the Bank deems it prudent to do so. In an effort to promote a high degree of asset quality, the Bank focuses primarily
upon offering secured loans. However, the Bank is willing to make short-term unsecured loans to borrowers with high net worth and income profiles. The Bank generally requires loan customers to maintain deposit accounts with the Bank. In addition, the bank generally provides for a minimum required
rate of interest in its variable rate loans. We believe that having senior management on-site allows for an enhanced local presence and rapid decision-making that attracts borrowers. The Bank’s legal lending limit to any one borrower is 15% of the Banks’s capital base (defined as tangible equity plus the
allowance for loan losses) for most loans ($21.9 million) and 25% of the capital base for loans secured by readily marketable collateral ($36.5 million). At December 31, 2013, the Bank’s largest borrower had an aggregate borrowing outstanding of $20.4 million. The largest single loan outstanding at the
Bank at December 31, 2013 was $16.5 million. Our business model includes using industry best practices for community banks, including personalized service, state-of-the-art technology and extended hours. We believe that this will generate deposit accounts with somewhat larger average balances than are found at many other financial institutions.
We also use pricing techniques in our efforts to attract banking relationships having larger than average balances. Competition The banking business is highly competitive. We face substantial immediate competition and potential future competition both in attracting deposits and in originating loans. We compete with numerous commercial banks, savings banks and savings and loan associations, many of which have assets,
capital and lending limits larger than those that we have. Other competitors include money market mutual funds, mortgage bankers, insurance companies, stock brokerage firms, regulated small loan companies, credit unions and issuers of commercial paper and other securities. Our larger competitors have greater financial resources to finance wide-ranging advertising campaigns. 3
Additionally, we endeavor to compete for business by providing high quality, personal service to customers, customer access to our decision-makers and competitive interest rates and fees. We seek to hire and retain quality employees who desire greater responsibility than may be available working
for a larger employer. Additionally, the local real estate and other business activities of our Directors help us develop business relationships by increasing our profile in our communities. In the financial services industry in recent years, intense market demands, technological and regulatory changes and economic pressures have eroded industry classifications that were once clearly defined. As a result of increased competition, existing banks have been forced to diversify their services,
increase rates paid on deposits and become more cost effective. Corresponding changes in the regulatory framework have resulted in increasing homogeneity in the financial services offered by financial institutions. Some of the results of those market dynamics in the financial services industry include an
increase in the number of new bank and non-bank competitors and increased customer awareness of product and service differences among competitors. Those results may be expected to affect our business prospects. Employees As of December 31, 2013, we had 100 full-time and 3 part-time employees. None of our employees are subject to a collective bargaining agreement. SUPERVISION AND REGULATION We are a bank holding company within the meaning of the BHCA. As a bank holding company, we are subject to regulation and examination by the Board of Governors of the Federal Reserve System (the “Federal Reserve”). In addition, the Bank is subject to examination and supervision by the
FDIC, as the insurer of our deposits, and the New Jersey Department of Banking and Insurance, as the chartering entity of the Bank. Recently Enacted Regulatory Reform On July 21, 2010, the President signed into law the Dodd-Frank Wall Street Reform and Consumer Protection Act (the “Dodd-Frank Act”), which imposes new restrictions and an expanded framework of regulatory oversight for financial institutions, including depository institutions. Although the
Dodd-Frank Act is primarily aimed at the activities of investment banks and large, national commercial banks, many of the provisions of the Dodd-Frank Act will impact the operations of community banks like the Bank. The following discussion summarizes significant aspects of the new law that may
affect the Bank and the Company. Many regulations implementing these changes have not been promulgated, so we cannot determine the full impact on our business and operations at this time. The following aspects of the financial reform and consumer protection act are related to the operations of the Bank:
•
A new independent consumer financial protection bureau was established within the Federal Reserve, empowered to exercise broad regulatory, supervisory and enforcement authority with respect to both new and existing consumer financial protection laws. However, smaller financial institutions, like
the Bank, are subject to the supervision and enforcement of their primary federal banking regulator with respect to the federal consumer financial protection laws. • The act also imposes new obligations on originators of residential mortgage loans, such as the Bank. Among other things, originators must make a reasonable and good faith determination based on documented information that a borrower has a reasonable ability to repay a particular mortgage loan
over the long term. If the originator cannot meet this standard, the loan may be unenforceable in foreclosure proceedings. The act contains an exception from this ability to repay rule for “qualified mortgages”, which are deemed to satisfy the rule, but does not define the term, and left authority to
the Consumer Financial Protection Bureau (“CFPB”) to adopt a definition. A rule issued by the CFPB in January 2013, and effective 4
January 10, 2014, sets forth specific underwriting criteria for a loan to qualify as a Qualified Mortgage Loan. The criteria generally exclude loans that are interest-only, have excessive upfront points or fees, have negative amortization features or balloon payments, or have terms in excess of 30 years.
The underwriting criteria also impose a maximum debt to income ratio of 43%. If a loan meets these criteria and is not a “higher priced loan” as defined in Federal Reserve regulations, the CFPB rule establishes a safe harbor preventing a consumer from asserting as a defense to foreclosure the
failure of the originator to establish the consumer’s ability to repay. However, this defense will be available to a consumer for all other residential mortgage loans. Although the majority of residential mortgages historically originated by the Bank would qualify as Qualified Mortgage Loans, the
Bank has also made, and may continue to make in the future, residential mortgage loans that will not qualify as Qualified Mortgage Loans. These loans may expose the Bank to greater losses, loan repurchase obligations, or litigation related expenses and delays in taking title to collateral real estate,
if these loans do not perform and borrowers challenge whether the Bank satisfied the ability to repay rule on originating the loan. • Tier 1 capital treatment for “hybrid” capital items like trust preferred securities is eliminated subject to various grandfathering and transition rules. • The prohibition on payment of interest on demand deposits was repealed, effective July 21, 2011. • Deposit insurance is permanently increased to $250,000. • The deposit insurance assessment base calculation now equals the depository institution’s total assets minus the sum of its average tangible equity during the assessment period. • The minimum reserve ratio of the Deposit Insurance Fund increased to 1.35 percent of estimated annual insured deposits or assessment base; however, the FDIC is directed to “offset the effect” of the increased reserve ratio for insured depository institutions with total consolidated assets of less
than $10 billion. Holding Company Supervision and Regulation General As a bank holding company registered under the Bank Holding Company Act (the “BHCA”), the Company is subject to the regulation and supervision applicable to bank holding companies by the Federal Reserve. The Company is required to file with the Federal Reserve annual reports and other
information regarding its business operations and those of its subsidiaries. The BHCA requires, among other things, the prior approval of the Federal Reserve in any case where a bank holding company proposes to (i) acquire all or substantially all of the assets of any other bank, (ii) acquire direct or indirect ownership or control of more than 5% of the outstanding voting
stock of any bank (unless it owns a majority of such company’s voting shares), or (iii) merge or consolidate with any other bank holding company. The Federal Reserve will not approve any acquisition, merger, or consolidation that would have a substantially anti-competitive effect, unless the anti-
competitive impact of the proposed transaction is clearly outweighed by a greater public interest in meeting the convenience and needs of the community to be served. The Federal Reserve also considers capital adequacy and other financial and managerial resources and future prospects of the companies
and the banks concerned, together with the convenience and needs of the community to be served, when reviewing acquisitions or mergers. Among other things, the BHCA requires regulatory filings by a stockholder or other party that seeks to acquire direct or indirect “control” of an FDIC-insured depository institution. The determination whether an investor “controls” a depository institution is based on all of the facts and
circumstances surrounding the investment. As a general matter, a party is deemed to control a depository institution or other company if the party owns or controls 25% or more of any class of voting stock. A party may be presumed to control a depository institution or other company if the investor
owns or controls 10% or more of any class of voting stock. Ownership by affiliated parties, 5
or parties acting in concert, is typically aggregated for these purposes. If a party’s ownership of the Company were to exceed certain thresholds, the investor could be deemed to “control” the Company for regulatory purposes. This could subject the investor to regulatory filings or other regulatory
consequences. The Bank Holding Company Act generally prohibits a bank holding company, with certain limited exceptions, from (i) acquiring or retaining direct or indirect ownership or control of more than 5% of the outstanding voting stock of any company which is not a bank or bank holding company, or (ii)
engaging directly or indirectly in activities other than those of banking, managing or controlling banks, or performing services for its subsidiaries, unless such non-banking business is determined by the Federal Reserve to be so closely related to banking or managing or controlling banks as to be properly
incident thereto. The Bank Holding Company Act was substantially amended through the Gramm-Leach Bliley Financial Modernization Act of 1999 (“Financial Modernization Act”). The Financial Modernization Act permits bank holding companies and banks, which meet certain capital, management and Community
Reinvestment Act standards to engage in a broader range of non-banking activities. In addition, bank holding companies that elect to become financial holding companies may engage in certain banking and non-banking activities without prior Federal Reserve approval. Finally, the Financial Modernization
Act imposes certain privacy requirements on all financial institutions and their treatment of consumer information. At this time, the Company has elected not to become a financial holding company, as it does not engage in any activities that are not permissible for banks. There are a number of obligations and restrictions imposed on bank holding companies and their depository institution subsidiaries by law and regulatory policy that are designed to minimize potential loss to the depositors of such depository institutions and the FDIC insurance fund in the event the
depository institution becomes in danger of default. Under provisions of the Bank Holding Company Act, a bank holding company is required to serve as a source of financial strength to its subsidiary depository institutions and to commit resources to support such institutions in circumstances where it
might not do so absent such requirement. The Federal Reserve also has the authority under the Bank Holding Company Act to require a bank holding company to terminate any activity or to relinquish control of a non-bank subsidiary upon the Federal Reserve’s determination that such activity or
control constitutes a serious risk to the financial soundness and stability of any bank subsidiary of the bank holding company. Capital Adequacy Guidelines for Bank Holding Companies The Federal Reserve has adopted risk-based capital guidelines for bank holding companies. The risk-based capital guidelines are designed to make regulatory capital requirements more sensitive to differences in risk profile among banks and bank holding companies to account for off-balance sheet
exposure, and to minimize disincentives for holding liquid assets. Under these guidelines, assets and off-balance sheet items are assigned to broad risk categories, each with appropriate weights. The resulting capital ratios represent capital as a percentage of total risk-weighted assets and off-balance sheet
items. The Federal Reserve’s risk-based capital guidelines for bank holding companies are substantially the same as the requirements of the FDIC for insured depository institutions. See “Supervision and Regulation of the Bank—Capital Adequacy Guidelines.” These requirements apply on a consolidated basis to bank holding companies with consolidated assets of $500 million or more and to certain bank holding companies with less than $500 million in consolidated assets if they are engaged in substantial non-banking activities or meet certain other
criteria. In addition to the risk-based capital guidelines, the Federal Reserve has adopted a minimum Tier I capital (leverage) ratio, under which a bank holding company must maintain a minimum level of Tier I capital to average total consolidated assets of at least 3% in the case of a bank holding company
that has the highest regulatory examination rating and is not contemplating significant growth or expansion. All other bank holding companies are expected to maintain a leverage ratio of at least 100 to 200 basis points above the stated minimum. 6
The capital requirements applicable to the Company and the Bank are subject to change as the banking regulators in the United States adopt regulations implementing the Basel III accord. See “Supervision and Regulation of the Bank—Capital Adequacy Guidelines.” Payment of Dividends The Federal Reserve has issued a policy statement regarding the payment of dividends by bank holding companies. In general, the Federal Reserve’s policies provide that dividends should be paid only out of current earnings and only if the prospective rate of earnings retention by the bank holding
company appears consistent with the organization’s capital needs, asset quality and overall financial condition. Federal Reserve regulations also require that a bank holding company serve as a source of financial strength to its subsidiary banks by standing ready to use available resources to provide
adequate capital funds to those banks during periods of financial stress or adversity and by maintaining the financial flexibility and capital-raising capacity to obtain additional resources for assisting its subsidiary banks where necessary. Under the prompt corrective action laws, the ability of a bank holding
company to pay dividends may be restricted if a subsidiary bank becomes undercapitalized, and under regulations implementing the Basel III accord, a bank holding company’s ability to pay cash dividends may be impaired if it fails to satisfy certain capital buffer requirements. These regulatory policies
could affect the ability of the Company to pay dividends or otherwise engage in capital distributions. Sarbanes-Oxley Act of 2002 The Sarbanes-Oxley Act of 2002 generally established a comprehensive framework to modernize and reform the oversight of public company auditing, improve the quality and transparency of financial reporting by those companies and strengthen the independence of auditors. Among other things, the
legislation (i) created a public company accounting oversight board which is empowered to set auditing, quality control and ethics standards, to inspect registered public accounting firms, to conduct investigations and to take disciplinary actions, subject to SEC oversight and review; (ii) strengthened auditor
independence from corporate management by, among other things, limiting the scope of consulting services that auditors can offer their public company audit clients; (iii) heightened the responsibility of public company directors and senior managers for the quality of the financial reporting and disclosure
made by their companies; (iv) adopted a number of provisions to deter wrongdoing by corporate management; (v) imposed a number of new corporate disclosure requirements; (vi) adopted provisions which generally seek to limit and expose to public view possible conflicts of interest affecting securities
analysts; and (vii) imposed a range of new criminal penalties for fraud and other wrongful acts, as well as extended the period during which certain types of lawsuits can be brought against a company or its insiders. Supervision and Regulation of the Bank As a New Jersey-chartered commercial bank, the Bank is subject to the regulation, supervision, and control of the New Jersey Department of Banking and Insurance (the “Banking Department”). As an FDIC-insured institution, the Bank is subject to regulation, supervision and control of the FDIC,
an agency of the federal government. The regulations of the FDIC and the Banking Department affect virtually all of the Bank’s activities, including the minimum level of capital, the ability to pay dividends, the ability to expand through new branches or acquisitions and various other matters. Insurance of Deposits The deposits of the Bank are insured by the Deposit Insurance Fund, which is administered by the FDIC. The Dodd-Frank Act permanently increased deposit insurance on most accounts to $250,000. The FDIC’s risk-based premium system provides for quarterly assessments. Each insured institution is placed in one of four risk categories depending on supervisory and capital 7
considerations. Within its risk category, an institution is assigned to an initial base assessment rate which is then adjusted to determine its final assessment rate based on its brokered deposits, secured liabilities and unsecured debt. The FDIC has revised its deposit insurance regulations (1) to change the assessment base for insurance from domestic deposits to average assets minus average tangible equity and (2) to lower overall assessment rates. The revised assessments rates are 2.5 to 9 basis points for banks in the lowest risk
category and between 30 to 45 basis points for banks in the highest risk category. The revisions reduced the Bank’s insurance premium expense. In addition, all institutions with deposits insured by the FDIC are required to pay assessments to fund interest payments on bonds issued by the Financing Corporation, a mixed-ownership government corporation established to recapitalize a predecessor to the Deposit Insurance Fund. The assessment
rate for the fourth quarter of fiscal 2012 was .00165% of insured deposits and is adjusted quarterly. These assessments will continue until the Financing Corporation bonds mature in 2019. The FDIC may terminate the deposit insurance of any insured depository institution, including the Bank, if it determines after a hearing that the institution has engaged or is engaging in unsafe or unsound practices, is in an unsafe or unsound condition to continue operations, or has violated any
applicable law, regulation, order or any condition imposed by an agreement with the FDIC. It also may suspend deposit insurance temporarily during the hearing process for the permanent termination of insurance, if the institution has no tangible capital. If insurance of accounts is terminated, the
accounts at the institution at the time of the termination, less subsequent withdrawals, shall continue to be insured for a period of six months to two years, as determined by the FDIC. Management is aware of no existing circumstances that would result in termination of the Bank’s deposit insurance. Interstate Acquisitions The Interstate Banking Act allows federal regulators to approve mergers between adequately capitalized banks from different states regardless of whether the transaction is prohibited under any state law, unless one of the banks’ home states has enacted a law expressly prohibiting out-of-state mergers
before June 1997. This act also allows a state to permit out-of-state banks to establish and operate new branches in that state. The State of New Jersey has not “opted out” of this interstate merger provision. Therefore, the federal provision permitting interstate acquisitions applies to banks chartered in
New Jersey. New Jersey law, however, retained the requirement that an acquisition of a New Jersey institution by a New Jersey or a non-New Jersey based holding company must be approved by the Banking Department. The Interstate Banking Act also allows a state to permit out-of-state banks to
establish and operate new branches in this state. New Jersey law permits an out of state banking institution to establish additional branch offices in New Jersey if the out of state banking institution has at least one existing branch office location in New Jersey and complies with certain other requirements. Dividend Rights Under the New Jersey Corporation Act, we are permitted to pay cash dividends provided that the payment does not leave us insolvent. As a bank holding company under the BHCA, we would be prohibited from paying cash dividends if we are not in compliance with any capital requirements
applicable to it. However, as a practical matter, for so long as our major operations consist of ownership of the Bank, the Bank will remain our source of dividend payments, and our ability to pay dividends will be subject to any restrictions applicable to the Bank. Under the New Jersey Banking Act of 1948, as amended, dividends may be paid by the Bank only if, after the payment of the dividend, the capital stock of the Bank will be unimpaired and either the Bank will have a surplus of not less than 50% of its capital stock or the payment of the dividend
will not reduce the Bank’s surplus. The payment of dividends is also dependent upon the Bank’s ability to maintain adequate capital ratios pursuant to applicable regulatory requirements. 8
Capital Adequacy Guidelines The FDIC has promulgated risk-based capital guidelines that are designed to make regulatory capital requirements more sensitive to differences in risk profile among banks, to account for off-balance sheet exposure, and to minimize disincentives for holding liquid assets. Under those guidelines, assets
and off-balance sheet items are assigned to broad risk categories, each with appropriate weights. The resulting capital ratios represent capital as a percentage of total risk-weighted assets and off-balance sheet items. Bank assets are given risk-weights of 0%, 20%, 50% and 100%. In addition, certain off-balance sheet items are given similar credit conversion factors to convert them to asset equivalent amounts to which an appropriate risk-weight will apply. Those computations result in the total risk-weighted
assets. Most loans are assigned to the 100% risk category, except for performing first mortgage loans fully secured by residential property, which carry a 50% risk weighting. Most investment securities (including, primarily, general obligation claims of states or other political subdivisions of the United
States) are assigned to the 20% category, except for municipal or state revenue bonds, which have a 50% risk-weight, and direct obligations of the U.S. Treasury or obligations backed by the full faith and credit of the U.S. Government, which have a 0% risk-weight. In converting off-balance sheet items,
direct credit substitutes, including general guarantees and standby letters of credit backing financial obligations, are given a 100% risk weighting. Transaction-related contingencies such as bid bonds, standby letters of credit backing nonfinancial obligations, and undrawn commitments (including commercial
credit lines with an initial maturity of more than one year), have a 50% risk weighting. Short-term commercial letters of credit have a 20% risk weighting, and certain short-term unconditionally cancelable commitments have a 0% risk weighting. The minimum ratio of total capital to risk-weighted assets required by FDIC regulations (including certain off-balance sheet activities, such as standby letters of credit) is 8%. At least 4% of the total capital is required to be “Tier 1 Capital,” consisting of common stockholders’ equity and qualifying
preferred stock or hybrid instruments, less certain goodwill items and other intangible assets. The remainder (“Tier 2 Capital”) may consist of (a) the allowance for loan losses of up to 1.25% of risk weighted assets, (b) excess of qualifying preferred stock, (c) hybrid capital instruments, (d) perpetual debt,
(e) mandatory convertible securities, and (f) qualifying subordinated debt and intermediate-term preferred stock up to 50% of Tier 1 Capital. Total capital is the sum of Tier 1 and Tier 2 Capital less reciprocal holdings of other banking organizations’ capital instruments, investments in unconsolidated
subsidiaries and any other deductions as determined by the FDIC (determined on a case-by-case basis or as a matter of policy after formal rules-making). In addition to the risk-based capital guidelines, the FDIC has adopted a minimum Tier 1 Capital (leverage) ratio, under which a bank must maintain a minimum level of Tier 1 Capital to average total consolidated assets of at least 3% in the case of a bank that has the highest regulatory examination
rating and is not contemplating significant growth or expansion. All other banks are expected to maintain a leverage ratio of at least 100 to 200 basis points above the stated minimum. The Group of Governors and Heads of Supervision, the oversight body of the Basel Committee on Banking Supervision, adopted Basel III in September 2010, which constitutes a set of capital reform measures designed to strengthen the regulation, supervision and risk management of banking
organizations worldwide. In order to implement Basel III and certain additional capital changes required by the Dodd-Frank Act, on July 9, 2013, the Federal banking agencies, including the FDIC the Federal Reserve and the Office of the Comptroller of the Currency, approved, as an interim final rule,
the regulatory capital requirements for U.S. insured depository institutions and their holding companies. The interim final rule includes new risk-based capital and leverage ratios that will be phased-in from 2015 to 2019. The rule includes a new common equity Tier 1 capital to risk-weighted assets ratio of 4.5% and a common equity Tier 1 capital conservation buffer of 2.5% of risk-weighted assets,
which is in addition to the Tier 1 and Total risk-based capital requirements. The interim final rule also raises the minimum ratio of Tier 1 capital to risk-weighted assets from 4.0% to 6.0% and requires a minimum leverage ratio of 4.0%. The required minimum ratio of total capital to risk-weighted assets
will remain 8.0%. The new risk-based capital requirements (except for the capital 9
conservation buffer) will become effective on January 1, 2015. The capital conservation buffer will be phased in over four years beginning on January 1, 2016, with a maximum buffer of 0.625% of risk-weighted assets for 2016, 1.25% for 2017, 1.875% for 2018, and 2.5% for 2019 and thereafter. Failure to
maintain the required capital conservation buffer will result in limitations on capital distributions and on discretionary bonuses to executive officers. The following chart compares the risk-based capital required under existing rules to those prescribed under the interim final rule under the phase-in period described above:
Common Equity Tier 1
Current Rules
Final Rules Capital Conservation Buffer
—
2.5
% Tier 2
4.0
%
2.0
% Additional Tier 1
—
1.5
% Tier 1
4.0
%
— Common Equity Tier 1
—
4.5
% The interim final rule also implements revisions and clarifications consistent with Basel III regarding the various components of Tier 1 capital, including common equity, unrealized gains and losses and instruments that will no longer qualify as Tier 1 capital. The interim final rule also sets forth certain
changes for the calculation of risk-weighted assets that we will be required to implement beginning January 1, 2015. Management is currently evaluating the provisions of the interim final rule and its expected impact. Based on our current capital composition and levels, management does not presently
anticipate that the interim final rule presents a material risk to our financial condition or results of operations. These provisions, as well as any other aspects of current or proposed regulatory or legislative changes to laws applicable to the financial industry, may impact the profitability of our business activities and may change certain of our business practices, including the ability to offer new products, obtain
financing, attract deposits, make loans, and achieve satisfactory interest spreads, and could expose us to additional costs, including increased compliance costs. These changes also may require us to invest significant management attention and resources to make any necessary changes to operations in order
to comply, and could therefore also materially and adversely affect our business, financial condition and results of operations. Community Reinvestment Act All insured depository institutions have a responsibility under the Community Reinvestment Act and related regulations to help meet the credit needs of their communities, including low- and moderate-income neighborhoods. An institution’s failure to comply with the provisions of the Community
Reinvestment Act could result in restrictions on its activities. The Bank received a “satisfactory” Community Reinvestment Act rating in its most recently completed examination. Privacy Requirements of the Gramm-Leach-Bliley Act Federal law places limitations on financial institutions like the Bank regarding the sharing of consumer financial information with unaffiliated third parties. Specifically, these provisions require all financial institutions offering financial products or services to retail customers to provide such customers
with the financial institution’s privacy policy and provide such customers the opportunity to “opt out” of the sharing of personal financial information with unaffiliated third parties. The Bank currently has a privacy protection policy in place and believes such policy is in compliance with the regulations. Anti-Money Laundering Federal anti-money laundering rules impose various requirements on financial institutions intended to prevent the use of the U.S. financial system to fund terrorist activities. These provisions include a requirement that financial institutions operating in the United States have anti-money laundering
compliance programs, due diligence policies and controls to ensure the detection and reporting of money laundering. Such compliance programs supplement existing compliance 10
requirements, also applicable to financial institutions, under the Bank Secrecy Act and the Office of Foreign Assets Control Regulations. The Bank has established policies and procedures to ensure compliance with the federal anti-laundering provisions. Item 1A. Risk Factors. Risks Applicable to Our Business: Nationwide economic weakness may adversely affect our business by reducing real estate values in our trade area and stressing the ability of our customers to repay their loans. Our trade area, like the rest of the United States, is currently experiencing weak economic conditions. In addition, the financial services industry is a major employer in our trade area. The financial services industry has been adversely affected by current economic and regulatory factors. As a result,
many companies have experienced reduced revenues and have laid off employees. These factors have stressed the ability of both commercial and consumer customers to repay their loans, and may result in higher levels of non-accrual loans. In addition, real estate values have declined in our trade area.
Since the number of our loans secured by real estate represents a material segment of our overall loan portfolio, declines in the market value of real estate impact the value of the collateral securing our loans, and could lead to greater losses in the event of defaults on loans secured by real estate. Our recent growth has substantially increased our expenses and impacted our results of operations. As a strategy, we have focused on growth by aggressively pursuing business development opportunities, and we have grown rapidly since our incorporation. Our assets have grown from $179.8 million at December 31, 2006, to $1.2 billion at December 31, 2013, representing a compound annual growth
rate in excess of 32%. During that time, we have opened four new offices. Although we believe that our growth strategy will support our long term profitability and franchise value, the expense associated with our growth, including compensation expense for the employees needed to support this growth
and leasehold and other expenses associated with our locations, has and may continue to negatively affect our results. In addition, in order for our most recently opened branches to contribute to our long-term profitability, we will need to be successful in attracting and maintaining cost efficient deposits at
these locations. In order to successfully manage our growth, we need to adopt and effectively implement policies, procedures and controls to maintain our credit quality and oversee our operations. We can give you no assurance that we will be successful in this strategy. Our growth-oriented business strategy could be adversely affected if we are not able to attract and retain skilled employees. We may not be able to successfully manage our business as a result of the strain on our management and operations that may result from growth. Our ability to manage growth will depend upon our ability to continue to attract, hire and retain skilled employees. Our success will also depend on the
ability of our officers and key employees to continue to implement and improve our operational and other systems, to manage multiple, concurrent customer relationships and to hire, train and manage our employees. We may need to raise additional capital to execute our growth oriented business strategy. In order to continue our historic rate of growth, we will be required to maintain our regulatory capital ratios at levels higher than the minimum ratios set by our regulators. In light of current economic conditions, our regulators have been seeking higher capital bases for insured depository institutions
experiencing strong growth. In addition, the implementation of certain new regulatory requirements, such as the Basel III accord and the Dodd-Frank Wall Street Reform and Consumer Protection Act (the “Dodd-Frank Act”), may establish higher tangible capital requirements for financial institutions.
These developments may require us to raise additional capital in the future. 11
We can offer you no assurances that we will be able to raise capital in the future, or that the terms of any such capital will be beneficial to our existing security holders. In the event we are unable to raise capital in the future, we may not be able to continue our growth strategy. We have a significant concentration in commercial real estate loans and commercial business loans. Our loan portfolio is made up largely of commercial real estate loans and commercial business loans. These types of loans generally expose a lender to a higher degree of credit risk of non-payment and loss than do residential mortgage loans because of several factors, including dependence on the
successful operation of a business or a project for repayment, the collateral securing these loans may not be sold as easily as residential real estate, and loan terms with a balloon payment rather than full amortization over the loan term. In addition, commercial real estate and commercial loans typically
involve larger loan balances to single borrowers or groups of related borrowers compared to one-to four-family residential mortgage loans. Underwriting and portfolio management activities cannot completely eliminate all risks related to these loans. Any significant failure to pay on time by our customers
or a significant default by our customers would materially and adversely affect us. At December 31, 2013, we had $769.1 million of commercial real estate loans, which represented 66.7% of our total loan portfolio. Our commercial real estate loans include loans secured by multi-family, owner occupied and non-owner occupied properties for commercial uses. In addition, we make
both secured and unsecured commercial and industrial loans. At December 31, 2013, we had $203.7 million of commercial business loans, which represented 17.7% of our total loan portfolio. Unsecured loans generally involve a higher degree of risk of loss than do secured loans because, without collateral,
repayment is wholly dependent upon the success of the borrowers’ businesses. Secured commercial and industrial loans are generally collateralized by accounts receivable, inventory, equipment or other assets owned by the borrower and typically include a personal guaranty of the business owner.
Compared to real estate, that type of collateral is more difficult to monitor, its value is harder to ascertain, it may depreciate more rapidly and it may not be as readily saleable if repossessed. Loans secured by owner-occupied real estate and commercial and industrial loans are both reliant on the operating businesses to provide cash flow to meet debt service obligations, and as a result they are more susceptible to the general impact on the economic environment affecting those operating
companies as well as the real estate. Although the economy in our market area generally, and the real estate market in particular, is improving slowly, we can give you no assurance that it will continue to grow or that the rate of growth will accelerate to historical levels. Many factors, including continuing European economic difficulties
could reduce or halt growth in our local economy and real estate market. Accordingly, it may be more difficult for commercial real estate borrowers to repay their loans in a timely manner in the current economic climate, as commercial real estate borrowers’ ability to repay their loans frequently
depends on the successful development of their properties. The deterioration of one or a few of our commercial real estate loans could cause a material increase in our level of nonperforming loans, which would result in a loss of revenue from these loans and could result in an increase in the provision
for loan losses and/or an increase in charge-offs, all of which could have a material adverse impact on our net income. We also may incur losses on commercial real estate loans due to declines in occupancy rates and rental rates, which may decrease property values and may decrease the likelihood that a
borrower may find permanent financing alternatives. Given the continued weaknesses in the commercial real estate market in general, there may be loans where the value of our collateral has been negatively impacted. Any weakening of the commercial real estate market may increase the likelihood of
default of these loans, which could negatively impact our loan portfolio’s performance and asset quality. If we are required to liquidate the collateral securing a loan to satisfy the debt during a period of reduced real estate values, we could incur material losses. Any of these events could increase our
costs, require management time and attention, and materially and adversely affect us. 12
Federal banking agencies have issued guidance regarding high concentrations of commercial real estate loans within bank loan portfolios. The guidance requires financial institutions that exceed certain levels of commercial real estate lending compared with their total capital to maintain heightened
risk management practices that address the following key elements: board and management oversight and strategic planning, portfolio management, development of underwriting standards, risk assessment and monitoring through market analysis and stress testing, and maintenance of increased capital levels
as needed to support the level of commercial real estate lending. If there is any deterioration in our commercial real estate portfolio or if our regulators conclude that we have not implemented appropriate risk management practices, it could adversely affect our business, and could result in the
requirement to maintain increased capital levels. Such capital may not be available at that time, and may result in our regulators requiring us to reduce our concentration in commercial real estate loans. The nature and growth rate of our commercial loan portfolio may expose us to increased lending risks. Given the significant growth in our loan portfolio, many of our commercial real estate loans are unseasoned, meaning that they were originated relatively recently. As of December 31, 2013, we had $769.1 million in commercial real estate loans outstanding. Approximately eighty-two percent (82%) of
the loans, or $630.2 million, had been originated in the past three years. Our limited experience with these loans does not provide us with a significant payment history pattern with which to judge future collectability. As a result, it may be difficult to predict the future performance of our loan portfolio.
These loans may have delinquency or charge-off levels above our expectations, which could negatively affect our performance. The small to medium-sized businesses that the Bank lends to may have fewer resources to weather a downturn in the economy, which may impair a borrower’s ability to repay a loan to the Bank that could materially harm our operating results. The Bank targets its business development and marketing strategy primarily to serve the banking and financial services needs of small to medium-sized businesses. These small to medium-sized businesses frequently have smaller market share than their competition, may be more vulnerable to
economic downturns, often need substantial additional capital to expand or compete and may experience significant volatility in operating results. Any one or more of these factors may impair the borrower’s ability to repay a loan. In addition, the success of a small to medium-sized business often depends
on the management talents and efforts of one or two persons or a small group of persons, and the death, disability or resignation of one or more of these persons could have a material adverse impact on the business and its ability to repay a loan. Economic downturns and other events that negatively
impact our market areas could cause the Bank to incur substantial credit losses that could negatively affect our results of operations and financial condition. Regulatory changes allowing the payment of interest on commercial accounts may negatively impact our core deposit strategy and our net interest income. Our current core deposit strategy includes continuing to increase our noninterest-bearing commercial accounts in order to lower our cost of funds. Recent changes effected by the Dodd-Frank Act, however, permit the payment of interest on such accounts, which was previously prohibited. If our
competitors begin paying interest on commercial accounts, this may increase competition from other financial institutions for these deposits and negatively affect our ability to continue to increase commercial deposit accounts, may require us to consider paying interest on such accounts, or may otherwise
require us to revise our core deposit strategy, any of which could increase our interest expense and therefore our cost of funds and, as a result, decrease our net interest income which would adversely impact our results of operations. 13
The loss of our Chairman and Chief Executive Officer could hurt our operations. We rely heavily on our Chairman and Chief Executive Officer, Frank Sorrentino III. Mr. Sorrentino has served as Chief Executive Officer of the Bank for five years. It was Mr. Sorrentino who originally conceived of the business idea of organizing ConnectOne Bank, and he spearheaded the efforts
to organize the Bank in 2005. The loss of Mr. Sorrentino could have a material adverse effect on us, as he is central to virtually all aspects of our business operations and management. In addition, as a community bank, we have fewer management-level personnel who are in position to succeed and
assume the responsibilities of Mr. Sorrentino. Our lending limit may restrict our growth. We are limited in the amount we can loan to a single borrower by the amount of our capital. Generally, under current law, we may lend up to 15% of our unimpaired capital and surplus to any one borrower. Based upon our current capital levels, the amount we may lend is significantly less than
that of many of our competitors and may discourage potential borrowers who have credit needs in excess of our lending limit from doing business with us. We accommodate larger loans by selling participations in those loans to other financial institutions, but his strategy may not always be available. We are a community bank and our ability to maintain our reputation is critical to the success of our business and the failure to do so may materially adversely affect our performance. We are a community bank, and our reputation is one of the most valuable components of our business. As such, we strive to conduct our business in a manner that enhances our reputation. This is done, in part, by recruiting, hiring and retaining employees who share our core values of being an
integral part of the communities we serve, delivering superior service to our customers and caring about our customers and associates. If our reputation is negatively affected, by the actions of our employees or otherwise, our business and, therefore, our operating results may be materially adversely
affected. Historically low interest rates may adversely affect our net interest income and profitability. During the last five years it has been the policy of the Board of Governors of the Federal Reserve System (the “Federal Reserve”) to maintain interest rates at historically low levels through its targeted federal funds rate and the purchase of mortgage-backed securities. As a result, yields on securities
we have purchased, and to a lesser extent, market rates on the loans we have originated, have been at levels lower than were available prior to 2008. Consequently, the average yield on our interest-earning assets has decreased during the recent low interest rate environment. As a general matter, our
interest-bearing liabilities re-price or mature more quickly than our interest-earning assets, which have contributed to increases in net interest income (the difference between interest income earned on assets and interest expense paid on liabilities) in the short term. However, our ability to lower our
interest expense is limited at these interest rate levels, while the average yield on our interest-earning assets may continue to decrease. The Federal Reserve has indicated its intention to maintain low interest rates for the foreseeable future. Accordingly, our net interest income may decrease, which may
have an adverse effect on our profitability. For information with respect to changes in interest rates, see “Risk Factors—Changes in interest rates may adversely affect or our earnings and financial condition.” Anti-takeover provisions in our corporate documents and in New Jersey corporate law may make it difficult and expensive to remove current management. Anti-takeover provisions in our corporate documents and in New Jersey law may render the removal of our existing board of directors and management more difficult. Consequently, it may be difficult and expensive for our stockholders to remove current management, even if current management is
not performing adequately. 14
Competition from other financial institutions in originating loans and attracting deposits may adversely affect our profitability. We face substantial competition in originating loans. This competition comes principally from other banks, savings institutions, mortgage banking companies, credit unions and other lenders. Many of our competitors enjoy advantages, including greater financial resources and higher lending limits, a
wider geographic presence, more accessible branch office locations, the ability to offer a wider array of services or more favorable pricing alternatives, as well as lower origination and operating costs. This competition could reduce our net income by decreasing the number and size of loans that we
originate and the interest rates we may charge on these loans. In attracting deposits, we face substantial competition from other insured depository institutions such as banks, savings institutions and credit unions, as well as institutions offering uninsured investment alternatives, including money market funds. Many of our competitors enjoy advantages, including
greater financial resources, more aggressive marketing campaigns, better brand recognition and more branch locations. These competitors may offer higher interest rates than we do, which could decrease the deposits that we attract or require us to increase our rates to retain existing deposits or attract new deposits. Increased deposit competition could adversely affect our ability to generate the funds necessary for
lending operations, which may increase our cost of funds. We also compete with non-bank providers of financial services, such as brokerage firms, consumer finance companies, insurance companies and governmental organizations, which may offer more favorable terms. Some of our non-bank competitors are not subject to the same extensive regulations that
govern our operations. As a result, such non-bank competitors may have advantages over us in providing certain products and services. This competition may reduce or limit our margins on banking services, reduce our market share and adversely affect our earnings and financial condition. Hurricanes or other adverse weather events could negatively affect our local economies or disrupt our operations, which would have an adverse effect on our business or results of operations. Hurricanes and other weather events can disrupt our operations, result in damage to our properties and negatively affect the local economies in which we operate. In addition, these weather events may result in a decline in value or destruction of properties securing our loans and an increase in
delinquencies, foreclosures and loan losses. We do not expect to pay cash dividends on shares of our common stock. We have not paid cash dividends on our common stock since the formation of the Bank in 2005, and expect that we will continue to retain earnings to augment our capital base and finance future growth. Therefore, investors should not purchase shares of common stock with a view for a current
return on their investment in the form of cash dividends. Risks Applicable to the Banking Industry Generally: The financial services industry is undergoing a period of great volatility and disruption. Beginning in mid-2007, there has been significant turmoil and volatility in global financial markets. Nationally, economic factors including inflation, recession, a rise in unemployment, a weakened US dollar, dislocation and volatility in the credit markets, and rising consumer costs persist. Recent
market uncertainty regarding the financial sector has increased. In addition to the impact on the economy generally, changes in interest rates, in the shape of the yield curve, or in valuations in the debt or equity markets or disruptions in the liquidity or other functioning of financial markets, all of which
have been seen recently, could directly impact us in one or more of the following ways:
•
Net interest income, the difference between interest earned on our interest earning assets and interest paid on interest bearing liabilities, represents a significant portion of our earnings. 15
Both increases and decreases in the interest rate environment may reduce our profits. We expect that we will continue to realize income from the spread between the interest we earn on loans, securities and other interest-earning assets, and the interest we pay on deposits, borrowings and other
interest-bearing liabilities. The net interest spread is affected by the differences between the maturity and repricing characteristics of our interest-earning assets and interest-bearing liabilities. Our interest-earning assets may not reprice as slowly or rapidly as our interest-bearing liabilities. • The market value of our securities portfolio may decline and result in other than temporary impairment charges. The value of securities in our portfolio is affected by factors that impact the U.S. securities market in general as well as specific financial sector factors and entities. Recent uncertainty in
the market regarding the financial sector has negatively impacted the value of securities within our portfolio. Further declines in these sectors may result in future other than temporary impairment charges. • Asset quality may deteriorate as borrowers become unable to repay their loans. Our allowance for loan losses may not be adequate to cover actual losses. Like all financial institutions, we maintain an allowance for loan losses to provide for loan defaults and nonperformance. The process for determining the amount of the allowance is critical to our financial results and condition. It requires difficult, subjective and complex judgments about the future,
including the impact of national and regional economic conditions on the ability of our borrowers to repay their loans. If our judgment proves to be incorrect, our allowance for loan losses may not be sufficient to cover losses inherent in our loan portfolio. Further, state and federal regulatory agencies, as
an integral part of their examination process, review our loans and allowance for loan losses and may require an increase in our allowance for loan losses. At December 31, 2013, our allowance for loan losses as a percentage of total loans was 1.39% and as a percentage of total non-accrual loans was 174.2%. Although we believe that our allowance for loan losses is adequate to cover known and probable incurred losses included in the portfolio, we
cannot assure you that we will not further increase the allowance for loan losses or that our regulators will not require us to increase this allowance. Either of these occurrences could adversely affect our earnings. Changes in interest rates may adversely affect our earnings and financial condition. Our net income depends primarily upon our net interest income. Net interest income is the difference between interest income earned on loans, investments and other interest-earning assets and the interest expense incurred on deposits and borrowed funds. The level of net interest income is primarily
a function of the average balance of our interest-earning assets, the average balance of our interest-bearing liabilities, and the spread between the yield on such assets and the cost of such liabilities. These factors are influenced by both the pricing and mix of our interest-earning assets and our interest-
bearing liabilities which, in turn, are impacted by such external factors as the local economy, competition for loans and deposits, the monetary policy of the Federal Open Market Committee of the Federal Reserve Board of Governors (the “FOMC”), and market interest rates. A sustained increase in market interest rates could adversely affect our earnings if our cost of funds increases more rapidly than our yield on our earning assets, and compresses our net interest margin. In addition, the economic value of portfolio equity would decline if interest rates increase. For
example, we estimate that as of December 31, 2013, a 200 basis point increase in interest rates would have resulted in our economic value of portfolio equity declining by approximately $31.8 million or 20.6%. See “Management’s Discussion and Analysis of Financial Condition and Results of
Operations—Interest Rate Sensitivity Analysis.” Different types of assets and liabilities may react differently, and at different times, to changes in market interest rates. We expect that we will periodically experience gaps in the interest rate sensitivities of our assets and liabilities. That means either our interest-bearing liabilities will be more
sensitive to changes in market interest rates than our interest-earning assets, or vice versa. 16
When interest-bearing liabilities mature or re-price more quickly than interest-earning assets, an increase in market rates of interest could reduce our net interest income. Likewise, when interest-earning assets mature or re-price more quickly than interest-bearing liabilities, falling interest rates could
reduce our net interest income. We are unable to predict changes in market interest rates, which are affected by many factors beyond our control, including inflation, deflation, recession, unemployment, money supply, domestic and international events and changes in the United States and other financial
markets. We also attempt to manage risk from changes in market interest rates, in part, by controlling the mix of interest rate sensitive assets and interest rate sensitive liabilities. However, interest rate risk management techniques are not exact. A rapid increase or decrease in interest rates could adversely
affect our results of operations and financial performance. The banking business is subject to significant government regulations. We are subject to extensive governmental supervision, regulation and control. These laws and regulations are subject to change, and may require substantial modifications to our operations or may cause us to incur substantial additional compliance costs. In addition, future legislation and government
policy could adversely affect the commercial banking industry and our operations. Such governing laws can be anticipated to continue to be the subject of future modification. Our management cannot predict what effect any such future modifications will have on our operations. In addition, the primary
focus of Federal and state banking regulation is the protection of depositors and not the shareholders of the regulated institutions. For example, the Dodd-Frank Act may result in substantial new compliance costs. The Dodd-Frank Act was signed into law on July 21, 2010. Generally, the Dodd-Frank Act is effective the day after it was signed into law, but different effective dates apply to specific sections of the law, many of
which will not become effective until various Federal regulatory agencies have promulgated rules implementing the statutory provisions. Uncertainty remains as to the ultimate impact of the Dodd-Frank Act, which could have a material adverse impact either on the financial services industry as a whole,
or on our business, results of operations and financial condition. The following aspects of the financial reform and consumer protection act are related to the operations of the Bank:
•
A new independent consumer financial protection bureau was established within the Federal Reserve, empowered to exercise broad regulatory, supervisory and enforcement authority with respect to both new and existing consumer financial protection laws. However, smaller financial institutions, like
the Bank, are subject to the supervision and enforcement of their primary federal banking regulator with respect to the federal consumer financial protection laws. • The act also imposes new obligations on originators of residential mortgage loans, such as the Bank. Among other things, originators must make a reasonable and good faith determination based on documented information that a borrower has a reasonable ability to repay a particular mortgage loan
over the long term. If the originator cannot meet this standard, the loan may be unenforceable in foreclosure proceedings. The act contains an exception from this ability to repay rule for “qualified mortgages”, which are deemed to satisfy the rule, but does not define the term, and left authority to
the Consumer Financial Protection Bureau (“CFPB”) to adopt a definition. A rule issued by the CFPB in January 2013, and effective January 10, 2014, sets forth specific underwriting criteria for a loan to qualify as a Qualified Mortgage Loan. The criteria generally exclude loans that are interest-
only, have excessive upfront points or fees, have negative amortization features or balloon payments, or have terms in excess of 30 years. The underwriting criteria also impose a maximum debt to income ratio of 43%. If a loan meets these criteria and is not a “higher priced loan” as defined in
Federal Reserve regulations, the CFPB rule establishes a safe harbor preventing a consumer from asserting as a defense to foreclosure the failure of the originator to establish the consumer’s ability to repay. However, this defense will be available to a consumer for all other residential mortgage
loans. Although the majority of residential mortgages historically 17
originated by the Bank would qualify as Qualified Mortgage Loans, the Bank has also made, and may continue to make in the future, residential mortgage loans that will not qualify as Qualified Mortgage Loans. These loans may expose the Bank to greater losses, loan repurchase obligations, or
litigation related expenses and delays in taking title to collateral real estate, if these loans do not perform and borrowers challenge whether Sullivan satisfied the ability to repay rule on originating the loan.
•
Tier 1 capital treatment for “hybrid” capital items like trust preferred securities is eliminated subject to various grandfathering and transition rules. • The prohibition on payment of interest on demand deposits was repealed, effective July 21, 2011. • Deposit insurance is permanently increased to $250,000. • The deposit insurance assessment base calculation now equals the depository institution’s total assets minus the sum of its average tangible equity during the assessment period. • The minimum reserve ratio of the Deposit Insurance Fund increased to 1.35 percent of estimated annual insured deposits or assessment base; however, the FDIC is directed to “offset the effect” of the increased reserve ratio for insured depository institutions with total consolidated assets of less
than $10 billion. In addition, in order to implement Basel III and certain additional capital changes required by the Dodd-Frank Act, on July 9, 2013, the Federal banking agencies, including the FDIC, the Federal Reserve and the Office of the Comptroller of the Currency, approved, as an interim final rule, the
regulatory capital requirements for U.S. insured depository institutions and their holding companies. This regulation will require financial institutions to maintain higher capital levels and more equity capital. These provisions, as well as any other aspects of current or proposed regulatory or legislative changes to laws applicable to the financial industry, may impact the profitability of our business activities and may change certain of our business practices, including the ability to offer new products, obtain
financing, attract deposits, make loans, and achieve satisfactory interest spreads, and could expose us to additional costs, including increased compliance costs. These changes also may require us to invest significant management attention and resources to make any necessary changes to operations in order
to comply, and could therefore also materially and adversely affect our business, financial condition and results of operations. Our management is actively reviewing the provisions of the Dodd-Frank Act and Basel III, many of which are to be phased-in over the next several months and years, and assessing the probable impact on our operations. However, the ultimate effect of these changes on the financial services industry
in general, and us in particular, is uncertain at this time. See “Supervision and Regulation.” The laws that regulate our operations are designed for the protection of depositors and the public, not our shareholders. The federal and state laws and regulations applicable to our operations give regulatory authorities extensive discretion in connection with their supervisory and enforcement responsibilities, and generally have been promulgated to protect depositors and the Deposit Insurance Fund and not for the
purpose of protecting shareholders. These laws and regulations can materially affect our future business. Laws and regulations now affecting us may be changed at any time, and the interpretation of such laws and regulations by bank regulatory authorities is also subject to change. We can give no assurance that future changes in laws and regulations or changes in their interpretation will not adversely affect our business. Legislative and regulatory changes may increase our cost of doing business or otherwise adversely affect us and create competitive advantages for non-bank
competitors. 18
The potential impact of changes in monetary policy and interest rates may negatively affect our operations. Our operating results may be significantly affected (favorably or unfavorably) by market rates of interest that, in turn, are affected by prevailing economic conditions, by the fiscal and monetary policies of the United States government and by the policies of various regulatory agencies. Our earnings
will depend significantly upon our interest rate spread (i.e., the difference between the interest rate earned on our loans and investments and the interest raid paid on our deposits and borrowings). Like many financial institutions, we may be subject to the risk of fluctuations in interest rates, which, if
significant, may have a material adverse effect on our operations. We cannot predict how changes in technology will impact our business; increased use of technology may expose us to service interruptions or breaches in security. The financial services market, including banking services, is increasingly affected by advances in technology, including developments in:
•
Telecommunications; • Data processing; • Automation; • Internet-based banking, including personal computers, mobile phones and tablets; • Telephone banking; • Debit cards and so-called “smart cards”; and • Remote deposit capture. Our ability to compete successfully in the future will depend, to a certain extent, on whether we can anticipate and respond to technological changes. We offer electronic banking services for our consumer and business customers via our website, www.cnob.com, including Internet banking and
electronic bill payment, as well as mobile banking by phone. We also offer check cards, ATM cards, credit cards, and automatic and ACH transfers. The successful operation and further development of these and other new technologies will likely require additional capital investments in the future. In
addition, increased use of electronic banking creates opportunities for interruptions in service or security breaches, which could expose us to claims by customers or other third parties. We cannot assure you that we will have sufficient resources or access to the necessary proprietary technology to remain
competitive in the future, or that we will be able to maintain a secure electronic environment. Item 1B. Unresolved Staff Comments. There are no unresolved staff comments Item 2. Properties. Bank Premises The Bank leases its main office and seven branch locations. The Bank’s headquarters and main branch is a three story brick and glass building located on Sylvan Avenue in Englewood Cliffs, in the heart of Englewood Cliffs’ commercial business district, easily accessible from major highways
including Route 80, the New Jersey Turnpike and the Palisades Parkway. In addition, Sylvan Avenue is a major north-south corridor and approach to the George Washington Bridge.
• 19
The Lemoine Avenue, Fort Lee office is located at 1620 Lemoine Avenue in a strip mall on a major north south through way in the center of town. The strip mall has seven parking spaces, two of which are dedicated to the Bank. The bank is in the process of closing this branch and consolidating
it with the Palisades Ave., Fort Lee branch. The expected close date is sometime in April 2014.
• The Palisades Avenue, Fort Lee office is located at 899 Palisades Avenue on the corner of Palisades Avenue and Columbia Avenue which is right on the border with Cliffside Park. This location features a drive-through and on-site parking. This branch was a former Bridgeview Bank branch
location and is familiar to many of our customers who had banked there in the past. • The Cresskill office is located at One Union Avenue in Cresskill, a prominent corner location on Piermont and Union Avenues in the heart of Cresskill. The facility has a drive-through and on-site parking. • The Hackensack office is located at the intersection of Essex Street and Railroad Avenue, a high visibility location between the County Courthouse and Hackensack University Medical Center. This facility has a two-lane drive-through and plenty of parking. It is convenient to all the major
highways, and especially to the legal and medical professions in the area. • The West New York office is located at the intersection of Park Avenue and 60th Street. The facility has a drive-through and onsite parking, a rarity in the Hudson County Market. • The Ridgewood office is located on Ridgewood Avenue. The facility is located in a highly visible position between the Post Office and Starbucks in downtown Ridgewood. This branch was formerly a branch of Citizens Community Bank; we acquired it from FDIC receivership in May 2009 when we
entered into a purchase and assumption agreement with the FDIC to acquire certain assets and assume certain liabilities of the failed bank. • The Holmdel office is located at 963 Holmdel Road. The facility is located one block from Main St., has a two-lane drive-through and shares a location with a prominent local realtor. • The Bank executed a lease agreement with Romar Urban Renewal Corp., with respect to certain premises located at 217 Chestnut Street; Newark, New Jersey. The Bank anticipates that the branch will open sometime in March 2014. Item 3. Legal Proceedings. On January 27, 2014, a complaint was filed against the Company and the members of its Board of Directors in the Superior Court of New Jersey, Bergen County, seeking class action status and asserting that the Company and the members of its Board had violated their duties to the Company’s
shareholders in connection with the proposed merger with Center Bancorp, Inc. Subsequently, several additional complaints also seeking class action status and raising substantially the same allegations, were filed in the Superior Court of New Jersey, Bergen County. The plaintiffs propose to consolidate
these cases. The litigation is in its very early stages, and the Company’s time to answer has not yet run. The Company believes these complaints are without merit, and intends to vigorously defend these complaints. From time to time we are a party to various litigation matters incidental to the conduct of our business. Other than as described above, we are not presently party to any such legal proceeding the resolution of which we believe would have a material adverse effect on our business, operating results,
financial condition or cash flow. Item 4. Mine Safety Disclosures. Not applicable 20
PART II Item 5. Market for Registrant’s
Common Equity, Related Stockholder Matters and Issuer Purchases of Equity Securities. Market Information for Common Stock Our common stock has been listed
on the NASDAQ Global Market under the symbol “CNOB” since February 12, 2013. Prior to that time, there was no public
market for our stock. We have not paid cash dividends on our common stock since the formation of the Bank in 2005. The following
table sets forth for the periods indicated the high and low reported sale prices as reported on the NASDAQ. Holders of Record As of February 7, 2014, there were
371 stockholders of record of our common stock. Because many of our shares of common stock are held by brokers and other institutions
on behalf of stockholders, we are unable to estimate the total number of stockholders represented by these record holders. Equity Compensation Plan Information The following table presents certain information regarding
our equity compensation plans as of December 31, 2013. 21
2013
Sales Price
High
Low
First Quarter
$
31.25
$
29.10
Second Quarter
$
30.74
$
28.75
Third Quarter
$
35.14
$
29.82
Fourth Quarter
$
41.01
$
33.84
Plan category
Number of Securities
To Be Issued Upon
Exercise of
Outstanding
Options,
Warrants and Rights
Weighted Average
Exercise Price of
Outstanding Options,
Warrants and Rights
Number of Securities
Remaining Available
for Future Issuance
Under Equity
Compensation Plans
Equity compensation plans approved by security holders
300,438
$
12.32
106,985
Equity compensation plans not approved by security holders
—
—
—
Total
300,438
$
12.32
106,985
Performance Graph The following
graph compares the cumulative total return on a hypothetical $100 investment made on February 11, 2013, the day of the Company’s
initial public offering, of: (a) the Company’s common stock; (b) the NASDAQ Index; and (c) the Keefe, Bruyette &
Woods’ KBW Bank Index. The graph is calculated assuming that all dividends are reinvested during the relevant periods. The
graph shows how a $100 investment would increase or decrease in value over time based on dividends (stock or cash) and increases
or decreases in the market price of the stock. 22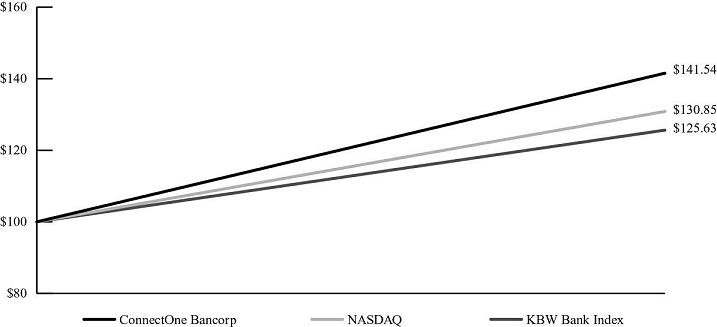
2/11/13
12/31/13
ConnectOne Bancorp
$
100.00
$
141.54
NASDAQ
100.00
130.85
KBW Bank Index
100.00
125.63
Item 6. Selected Financial Data. Set forth below is selected historical financial data of the Company. This information is derived in part from and should be read in conjunction with the consolidated financial statements and notes thereto presented elsewhere in this Annual Report on Form 10-K.
Year Ended December 31,
2013
2012
2011 SELECTED BALANCE SHEET DATA Total assets
$
1,243,228
$
929,926
$
729,741 Gross loans
1,153,100
849,269
629,459 Allowance for loan losses
15,979
13,246
9,617 Securities available for sale
27,589
19,252
27,435 Goodwill and other intangible assets
260
260
260 Borrowings
137,558
79,568
55,556 Deposits
965,807
769,318
609,421 Tangible common stockholders’ equity(1)
129,868
72,102
40,093 Total stockholders’ equity
130,128
72,362
56,857 Average total assets
1,066,876
831,451
665,292 Average common stockholders’ equity
114,635
55,894
37,468 SELECTED INCOME STATEMENT DATA Interest income
$
47,303
$
40,787
$
33,676 Interest expense
6,476
6,319
6,207 Net interest income
40,827
34,468
27,469 Provision for loan losses
4,575
3,990
2,355 Net interest income after provision for loan losses
36,252
30,478
25,114 Non-interest income
1,202
1,142
1,113 Non-interest expense
20,651
17,488
15,057 Income tax expense
6,533
5,711
4,504 Net income
10,270
8,421
6,666 Dividends on preferred shares
—
354
600 Net income available to common stockholders
$
10,270
$
8,067
$
6,066
(1)
These measures are not measures recognized under generally accepted accounting principles in the United States (“GAAP”), and are therefore considered to be non-GAAP financial measures. See—“Non-GAAP Financial Measures” for a reconciliation of these measurers to their most comparable GAAP
measures. 23
At or for the Year Ended
2013
2012
2011 PER COMMON SHARE DATA Basic earnings per share
$
2.15
$
2.99
$
2.71 Diluted earnings per share
2.09
2.63
2.18 Book value per common share
25.48
22.86
17.99 Tangible book value per common share(1)
25.43
22.77
17.87 Basic weighted average common shares
4,773,954
2,700,772
2,242,085 Diluted weighted average common shares
4,919,384
3,196,558
3,063,076 SELECTED PERFORMANCE RATIOS Return on average assets
0.96
%
1.01
%
1.00
% Return on average common stockholders’ equity
8.96
%
14.43
%
16.19
% Net interest margin
3.87
%
4.20
%
4.21
% Efficiency ratio(1)(2)
49.1
%
49.1
%
52.9
% SELECTED ASSET QUALITY RATIOS Nonaccrual loans to loans receivable
0.80
%
0.93
%
1.02
% Nonaccrual loans and loans past due 90 days and still accruing to total loans
0.80
%
0.93
%
1.02
% Nonperforming assets(3) to total assets
0.84
%
0.90
%
0.88
% Allowance for loan losses to loans receivable
1.39
%
1.56
%
1.53
% Allowance for loan losses to non-accrual loans
174.2
%
166.8
%
149.4
% Net loan charge-offs to average loans
0.19
%
0.05
%
0.03
% CAPITAL RATIOS (Consolidated) Leverage ratio
10.74
%
7.84
%
7.76
% Risk-based Tier 1 capital ratio
11.68
%
9.26
%
9.90
% Risk-based total capital ratio
12.91
%
10.52
%
11.15
% Tangible common equity to tangible assets(1)
10.45
%
7.76
%
5.50
%
(1)
These measures are not measures recognized under generally accepted accounting principles in the United States (“GAAP”), and are therefore considered to be non-GAAP financial measures. See—“Non-GAAP Financial Measures” for a reconciliation of these measurers to their most comparable GAAP
measures. (2) Efficiency ratio is total non-interest expenses divided by the sum of net interest income and total other income. (excluding securities gains/(losses)). (3) Non-performing assets are defined as nonaccrual loans plus other real estate owned. 24
December 31,
Non-GAAP Financial Measures.
For the Year Ended
2013
2012
2011
(Dollars in thousands, Efficiency Ratio Non-interest expense (numerator)
$
20,651
$
17,488
$
15,057 Net interest income
40,827
34,468
27,469 Non-interest income
1,202
1,142
1,113 Less: gains on sales of securities
—
—
(96
) Adjusted operating revenue (denominator)
$
42,029
$
35,610
$
28,486 Efficiency Ratio
49.1
%
49.1
%
52.9
% Tangible Common Equity and Tangible Common Common equity
$
130,128
$
72,362
$
40,353 Less: intangible assets
(260
)
(260
)
(260
) Tangible common equity
$
129,868
$
72,102
$
40,093 Total assets
$
1,242,673
$
929,926
$
729,741 Less: Intangible assets
(260
)
(260
)
(260
) Tangible assets
$
1,242,413
$
929,666
$
729,481 Tangible Common Equity/Tangible Assets
10.45
%
7.76
%
5.50
% Tangible Book Value per Common Share Book Value Per Common Share
$
25.48
$
22.86
$
17.99 Less: Effects of intangible assets
(0.05
)
(0.09
)
(0.12
) Tangible Book Value per Common Share
$
25.43
$
22.77
$
17.87 25
December 31,
except per share data)
Equity/Tangible Assets
Item 7. Management’s Discussion and Analysis of Financial Condition and Results of Operations. MANAGEMENT’S DISCUSSION AND ANALYSIS OF FINANCIAL CONDITION AND SPECIAL NOTE REGARDING FORWARD-LOOKING STATEMENTS Some of the statements in this document discuss future expectations, contain projections or results of operations or financial conditions or state other “forward-looking” information. Those statements are subject to known and unknown risk; uncertainties and other factors that could cause the actual
results to differ materially from those contemplated by the statements. We based the forward-looking statements on various factors and using numerous assumptions. Important factors that may cause actual results to differ from those contemplated by forward-looking statements include those disclosed
under Item 1A—Risk Factors as well as the following factors:
•
the success or failure of our efforts to implement our business strategy; • the effect of changing economic conditions and, in particular, changes in interest rates; • changes in government regulations, tax rates and similar matters; • our ability to attract and retain quality employees; and • other risks which may be described in our future filings with the SEC We do not promise to update forward-looking information to reflect actual results or changes in assumptions or other factors that could affect those statements. Critical Accounting Policies and Estimates “Management’s Discussion and Analysis of Financial Condition and Results of Operations,” is based upon our consolidated financial statements, which have been prepared in accordance with U.S. generally accepted accounting principles. The preparation of these financial statements requires us to
make estimates and judgments that affect the reported amounts of assets, liabilities, revenues and expenses. Note 1 to our audited consolidated financial statements contains a summary of our significant accounting policies. Management believes our policy with respect to the methodology for the
determination of the allowance for loan losses involves a higher degree of complexity and requires management to make difficult and subjective judgments which often require assumptions or estimates about highly uncertain matters. Changes in these judgments, assumptions or estimates could materially
impact results of operations. This critical policy and its application are periodically reviewed with the Audit Committee and our Board of Directors. The allowance for loan losses is based upon management’s evaluation of the adequacy of the allowance, including an assessment of known and probable incurred losses included in the portfolio, including giving consideration to the size and composition of the loan portfolio, actual loan loss experience,
level of delinquencies, detailed analysis of individual loans for which full collectability may not be assured, the existence and estimated net realizable value of any underlying collateral and guarantees securing the loans, and current economic and market conditions. Although management uses the best
information available, the level of the allowance for loan losses remains an estimate which is subject to significant judgment and short-term change. Various regulatory agencies, as an integral part of their examination process, periodically review our allowance for loan losses. Such agencies may require us
to make additional provisions for loan losses based upon information available to them at the time of their examination. Furthermore, the majority of our loans are secured by real estate in the State of New Jersey. Accordingly, the collectability of a substantial portion of the carrying value of our loan
portfolio is susceptible to changes in local market conditions and may be adversely affected by declines in real estate values, or if the Central or Northern areas of New Jersey experience an adverse economic shock. Future adjustments to the allowance for loan losses may be necessary due to economic,
operating, regulatory and other conditions beyond our control. 26
RESULTS OF OPERATIONS
Overview and Strategy We serve as a holding company for the Bank, which is our primary asset and only operating subsidiary. We follow a business plan that emphasizes the delivery of customized banking services in our market area to customers who desire a high level of personalized service and responsiveness. The
Bank conducts a traditional banking business, making commercial loans, consumer loans and residential and commercial real estate loans. In addition, the Bank offers various non-deposit products through non-proprietary relationships with third party vendors. The Bank relies upon deposits as the primary
funding source for its assets. The Bank offers traditional deposit products. Many of our customer relationships start with referrals from existing customers. We then seek to cross sell our products to customers to grow the customer relationship. For example, we will frequently offer an interest rate concession on credit products for customers that maintain a non-interest
bearing deposit account at the Bank. This strategy has lowered our funding costs and helped slow the growth of our interest expense even as we have substantially increased our total deposits. It has also helped fuel our significant loan growth. We believe that the Bank’s significant growth and increasing
profitability demonstrate the need for and success of our brand of banking. Our results of operations depend primarily on our net interest income, which is the difference between the interest earned on our interest-earning assets and the interest paid on funds borrowed to support those assets, primarily deposits. Net interest margin is the difference between the weighted
average rate received on interest-earning assets and the weighted average rate paid to fund those interest-earning assets, which is also affected by the average level of interest-earning assets as compared with that of interest-bearing liabilities. Net income is also affected by the amount of non-interest
income and non-interest expenses. Operating Results Overview Net income for the year ended December 31, 2013 was $10.3 million, an increase of $1.8 million, or 22.0%, compared to net income of $8.4 million for 2012. Net income available to common shareholders for the year ended December 31, 2013 was $10.3 million, an increase of $2.2 million, or 27.3%,
compared to net income available to common shareholders of $8.1 million for 2012. Diluted earnings per share were $2.09 for 2013, a 20.5% decrease from $2.63 for 2012. Diluted earnings per share for 2013 reflect the Company’s February 2013 initial public offering and issuance of 1.8 million shares of
common stock. Diluted earnings per share for 2012 reflect preferred dividends of $0.4 million. All shares of preferred were converted into common in 2012 and had no impact on 2013 results. The increase in net income from 2012 to 2013 was primarily attributable to significant increases in net interest income due to the Company’s rapid growth in loans and deposits, and in its customer base. Partially offsetting the revenue increases were higher noninterest expenses, largely staff-related,
commensurate with the Company’s growing infrastructure. Credit costs have kept pace with both loan growth and a changing mix in the loan portfolio, while benefitting from overall sound credit quality. Net income for the year ended December 31, 2012 was $8.4 million, an increase of $1.7 million, or 26.3%, compared to net income of $6.7 million for 2011. Net income available to common shareholders for the year ended December 31, 2012 was $8.1 million, an increase of $2.0 million, or 33.0%,
compared to net income available to common shareholders of $6.1 million for 2011. Diluted earnings per share were $2.63 for 2012, a 20.6% increase from $2.18 for 2011. Net income available to common shareholders and diluted earnings per share for 2012 were impacted by three series of convertible
preferred stock issued at various times between 2009 and 2012. During 2012, all three series of preferred stock were converted into common shares and, as of December 31, 2012, stockholders’ equity was comprised solely of common equity. The increases in net income, net income available to common shareholders, and diluted earnings per share from 2011 to 2012 was primarily attributable to significant increases in net interest income due to the Company’s rapid growth in loans and deposits, and in its customer base. Partially offsetting
the revenue increases were higher noninterest expenses, largely staff-related, commensurate 27
with the Company’s growing infrastructure. Credit costs have kept pace with both loan growth and a changing mix in the loan portfolio, while benefitting from overall sound credit quality. Net Interest Income Fully taxable equivalent net interest income for 2013 totaled $40.8 million, an increase of $6.3 million, or 18.4%, from 2012. The increase in net interest income was primarily due to an increase in average interest-earning assets, which grew by 28.6% to $1.1 billion, and was partially offset by a 33
basis points contraction in the net interest margin, from 4.20% in 2012 to 3.87% in 2013. Average total loans increased by 31.2% to $1.0 billion in 2013 from $743.2 million in 2012. Management expects net interest income to continue to expand as a result of continued strong loan growth, and margin
compression to moderate throughout 2014 as our loan portfolio fully re-prices. Fully taxable equivalent net interest income for 2012 totaled $34.5 million, an increase of $7.0 million, or 25.5%, from 2011. The increase in net interest income was primarily due to an increase in average interest-earning assets, principally loans, which increased by 29.6% to $743.2 million in 2012
from $573.6 million in 2011. The net interest margin remained relatively stable at 4.20% in 2012 as compared to 4.21% for the prior year period, as reduced yields on our loan portfolio resulting from the persistently low interest rate environment were offset by a lower cost of funds and a higher level of
loan prepayment fees. 28
Average Balance Sheets The following table sets forth certain information relating to our average assets and liabilities for the years ended December 31, 2013, 2012 and 2011 and reflect the average yield on assets and average cost of liabilities for the periods indicated. Such yields are derived by dividing income or expense
by the average balance of assets or liabilities, respectively, for the periods shown.
For the Years Ended December 31,
2013
2012
2011
Average
Interest
Average
Average
Interest
Average
Average
Interest
Average
(dollars in thousands) Interest earning assets: Investment securities(1)(2)
$
28,425
$
811
2.85
%
$
31,009
$
1,079
3.48
%
$
43,980
$
1,505
3.42
% Loans receivable(3)(4)
975,217
46,405
4.76
%
743,178
39,625
5.33
%
573,648
32,113
5.60
% Federal funds sold and interest-earning deposits with banks
51,894
103
0.20
%
46,902
83
0.18
%
35,339
58
0.16
% Total interest-earning assets
1,055,536
47,319
4.48
%
821,089
40,787
4.97
%
652,967
33,676
5.16
% Allowance for loan losses
(14,267
)
(11,196
)
(8,651
) Non-interest earning assets
25,607
21,558
20,976 Total assets
$
1,066,876
$
831,451
$
665,292 Interest-bearing liabilities: Savings, NOW, Money Market, Interest Checking
$
332,513
987
0.30
%
$
313,475
1,397
0.45
%
$
270,374
2,356
0.87
% Time deposits
329,765
3,811
1.16
%
229,150
3,380
1.48
%
160,580
2,532
1.58
% Total interest-bearing deposits
662,278
4,798
0.72
%
542,625
4,777
0.88
%
430,954
4,888
1.13
% Borrowings
91,949
1,489
1.62
%
77,473
1,349
1.74
%
68,217
1,121
1.64
% Capital lease obligation
3,150
189
6.00
%
3,224
193
5.99
%
3,293
198
6.01
% Total interest-bearing liabilities
757,377
6,476
0.86
%
623,322
6,319
1.01
%
502,464
6,207
1.24
% Noninterest-bearing deposits
191,233
138,155
106,174 Other liabilities
3,631
4,345
2,970 Stockholders’ equity
114,635
65,629
53,684 Total liabilities and stockholders’ equity
$
1,066,876
$
831,451
$
665,292 Net interest income/interest rate spread(5)
$
40,843
3.63
%
$
34,468
3.95
%
$
27,469
3.92
% Tax equivalent effect
(16
)
—
— Net interest income as reported
$
40,827
$
34,468
$
27,469 Net interest margin(6)
3.87
%
4.20
%
4.21
%
(1)
Average balances are calculated on amortized cost. (2) Interest income is presented on a tax equivalent basis using 35 percent federal tax rate. (3) Includes loan fee income. (4) Loans receivable include non-accrual loans. (5) Represents difference between the average yield on interest earning assets and the average cost of interest bearing liabilities and is presented on a fully tax equivalent basis. (6) Represents net interest income on a fully taxable equivalent basis divided by average total interest-earning assets. 29
Balance
Rate
Balance
Rate
Balance
Rate
Rate/Volume Analysis The following table presents, by category, the major factors that contributed to the changes in net interest income. Changes due to both volume and rate have been allocated in proportion to the relationship of the dollar amount change in each.
For the Year Ended
For the Year Ended
Increase (Decrease)
Increase (Decrease)
Volume
Rate
Net
Volume
Rate
Net Interest Income: Investment securities
$
(85
)
$
(183
)
$
(268
)
$
(452
)
$
26
$
(426
) Loan receivable
10,342
(3,562
)
6,780
8,953
(1,441
)
7,512 Federal funds sold and interest-
—
—
—
—
—
— earning deposits with banks
9
11
20
20
5
25 Total interest income
$
10,266
$
(3,734
)
$
6,532
$
8,521
$
(1,410
)
$
7,111 Interest Expense: Savings, NOW, Money Market, Interest Checking
$
91
$
(501
)
$
(410
)
$
464
$
(1,423
)
$
(959
) Time deposits
850
(419
)
431
999
(151
)
848 Borrowings
224
(84
)
140
158
70
228 Capital lease obligation
(4
)
0
(4
)
(4
)
(1
)
(5
) Total interest expense
$
1,161
$
(1,004
)
$
157
$
1,617
$
(1,505
)
$
112 Net interest income
$
9,105
$
(2,730
)
$
6,375
$
6,904
$
95
$
6,999 Provision for Loan Losses In determining the provision for loan losses, management considers national and local economic trends and conditions; trends in the portfolio including orientation to specific loan types or industries; experience, ability and depth of lending management in relation to the complexity of the portfolio;
effects of changes in lending policies, trends in volume and terms of loans; levels and trends in delinquencies, impaired loans and net charge-offs and the results of independent third party loan and lease review. For the year ended December 31, 2013, the provision for loan losses was $4.6 million, an increase of $0.6 million, compared to the provision for loan losses of $4.0 million for the same period in 2012. The increase is substantially attributable to the increased loan growth in 2013 versus 2012. For the year ended December 31, 2012, the provision for loan losses was $4.0 million, an increase of $1.6 million, compared to the provision for loan losses of $2.4 million for the same period in 2011. The increase is substantially attributable to the increased loan growth in 2012 versus 2011. Non-Interest Income The Company’s non-interest income consists primarily of service charges on deposit accounts, gains on sale of residential mortgages, card (ATM, credit and debit cards) income, fees from a title insurance agency in which the Bank is a 49% owner and income in bank owned life insurance (BOLI). Non-interest income represents a relatively small portion of the Bank’s total revenue as management has historically made a strategic decision to de-emphasize fee income, focusing instead on customer growth and retention. Non-interest income totaled $1.2 million for the year ended December 31,
2013, versus $1.1 million for the year ended December 31, 2012. The increase in non-interest income is attributable to BOLI income in 2013, while growth in service and card-related fees were essentially offset by declines in gains on sale of residential mortgage loans. Non-interest income 30
December 31, 2013 versus 2012
December 31, 2012 versus 2011
Due to Change in Average
Due to Change in Average
amounted to $1.1 for 2011. Card income grew by approximately $80,000 in 2012 versus 2011, while 2011 included $96,000 in securities gains. Non-Interest Expense Non-interest expense for the full-year 2013 increased by $3.2 million, or 18.1%, to $20.7 million from $17.5 million in 2012. The largest factor contributing to the increases in total non-interest expense was salaries and employee benefits expense, which increased by $1.9 million to $10.3 million for the
full year 2013 from $8.4 million in 2012. The increases were primarily due an increase in the number of full-time equivalent employees and higher incentive-based compensation. Also contributing to higher non-interest expenses were increased costs associated with being a publicly traded entity, higher
legal fees, and a general increase in other operating expenses related to a significantly increased volume of business. Non-interest expense for the full-year 2012 increased by $2.4 million, or 16.1%, to $17.5 million from $15.1 million in 2011. The largest factor contributing to the year-over-year increase was salaries and employee benefits expense, which increased by $1.4 million to $8.4 million in 2012 from $6.9
million in 2011; this increase was primarily a result of increased staffing levels, particularly at the executive and senior management level. Also contributing to the increase were data processing expenses ($260,000), advertising and promotion expenses ($133,000) and other expenses ($574,000). The increases
in these categories were all primarily related to the Company’s increased volume of business. Management continues to focus efforts on supporting growth primarily by adding to staff, investing in technology, and by enhancing risk controls. At the same time, management seeks to contain costs whenever prudent. Our success in this regard is evident in our continued low efficiency ratio, a
widely-followed metric in the banking industry which measures operating expenses as a percentage of net revenue. The ratio is computed by dividing total noninterest expense by the sum of net interest income and noninterest income less securities gains/(losses). The Company’s efficiency ratio was 49.1%
for 2013 and 2012. The Company’s efficiency ratio was 52.9% in 2011. Income Taxes Income tax expense was $6.5 million for the full-year 2013 versus $5.7 million for the full-year 2012. The effective tax rates were 38.9% for the full-year of 2013, versus 40.4% full-year of 2012. Effective tax rates for 2013 reflect a reorganized operating structure effective October 1, 2013. The
Company’s effective tax rate is projected to be approximately 36% in future periods, although is likely to fluctuate depending upon future levels of taxable and non-taxable revenue. Income tax expense was $5.7 million for the full-year 2012 versus $4.5 million for the full-year 2011. The effective tax rate was approximately 40% for all periods presented representing the combined federal and state statutory tax rates for a New Jersey corporation, and reflecting no tax-advantaged
investments such as municipal securities or bank owned life insurance. Financial Condition Overview At December 31, 2013, total assets were $1.2 billion, a $313.3 million increase from December 31, 2012. The increase in total assets was due primarily to a $303.0 million increase, to $1.2 billion, in loans receivable. The growth in assets was funded by a $196.5 million increase in deposits, a $58.0
million increase in Federal Home Loan Bank borrowings, $10.3 million in retained earnings, and $47.7 million in net proceeds from the Company’s first quarter 2013 initial public equity offering. Loan Portfolio The Bank’s lending activities are generally oriented to small-to-medium sized businesses, high net worth individuals, professional practices and consumer and retail customers living and working in the Bank’s market area of Hudson, Bergen and Monmouth Counties, New Jersey. The Bank has not
made loans to borrowers outside of the United States. The Bank believes that its strategy of high- 31
quality customer service, competitive rate structures and selective marketing have enabled it to gain market entry. Commercial loans are loans made for business purposes and are primarily secured by collateral such as cash balances with the Bank, marketable securities held by or under the control of the Bank, business assets including accounts receivable, taxi medallions, inventory and equipment and liens on
commercial and residential real estate. Commercial construction loans are loans to finance the construction of commercial or residential properties secured by first liens on such properties. Commercial real estate loans include loans secured by first liens on completed commercial properties, including multi-
family properties, to purchase or refinance such properties. Residential mortgages include loans secured by first liens on residential real estate, and are generally made to existing customers of the Bank to purchase or refinance primary and secondary residences. Home equity loans and lines of credit
include loans secured by first or second liens on residential real estate for primary or secondary residences. Consumer loans are made to individuals who qualify for auto loans, cash reserve, credit cards and installment loans. During 2013 and 2012, loan portfolio growth was positively impacted in several ways including (i) an increase in demand for small business lines of credit, and business term loans as economic conditions have stabilized and begun to improve, (ii) industry consolidation and lending restrictions involving
larger competitors allowing the Bank to gain market share, (iii) an increase in refinancing strategies employed by borrowers during the current low rate environment, and (iv) the Bank’s success in attracting highly experienced commercial loan officers with substantial local market knowledge. Gross loans at December 31, 2013 totaled $1,153.1 million, an increase of $303.8 million, or 35.8%, over gross loans at December 31, 2012 of $829.3 million. The biggest component of our loan portfolio at December 31, 2013 and December 31, 2012 was commercial real estate loans. Our commercial real
estate loans at December 31, 2013 were $769.1 million, an increase of $219.9 million, or 40.0%, over commercial real estate loans at December 31, 2012 of $549.2 million. Our commercial loans were $203.7 million at December 31, 2013, an increase of $56.2 million, or 38.1%, over commercial loans at
December 31, 2012 of $203.7 million. Our commercial construction loans at December 31, 2013 were $59.8 million, an increase of $23.0 million, or 62.3%, over commercial construction loans at December 31, 2012 of $36.9 million. Our residential real estate loans were $85.6 million at December 31, 2013, an
increase of $2.7 million, or 3.2%, over residential real estate loans at December 31, 2012 of $83.0 million. Our home equity loans were $32.5 million at December 31, 2013, an increase of $1.5 million, or 5.0%, over home equity loans of $31.0 million at December 31, 2012. Our consumer loans at December 31,
2013 were $2.3 million, an increase of $0.5 million, 29.9%, over consumer loans of $1.8 million at December 31, 2012. The growth in our loan portfolio reflects the success of our business strategy, in particular emphasizing high-quality customer service strategy, which has led to continued customer referrals. The following table sets forth the classification of our gross loans held for investment by loan portfolio class as of December 31, 2013, 2012, 2011, 2010 and 2009: 32
As of December 31,
2013
2012
2011
2010
2009
Amount
Percent
Amount
Percent
Amount
Percent
Amount
Percent
Amount
Percent
(dollars in thousands) Commercial
$
203,690
17.7
%
$
147,455
17.4
%
$
108,066
17.2
%
$
106,544
21.6
%
$
78,217
19.6
% Commercial real estate
769,121
66.7
%
549,218
64.7
%
375,719
59.7
%
259,694
52.5
%
230,324
57.8
% Commercial construction
59,877
5.2
%
36,872
4.3
%
28,543
4.5
%
37,065
7.5
%
24,111
6.1
% Residential real estate
85,568
7.4
%
82,962
9.8
%
88,666
14.1
%
64,648
13.1
%
39,764
10.0
% Home equity
32,504
2.8
%
30,961
3.6
%
27,575
4.4
%
25,056
5.1
%
25,000
6.3
% Consumer
2,340
0.2
%
1,801
0.2
%
890
0.1
%
1,179
0.2
%
870
0.2
% Total gross loans
$
1,153,100
100.0
%
$
849,269
100.0
%
$
629,459
100.0
%
$
494,186
100.0
%
$
398,286
100.0
% The following table sets forth the classification of our gross loans held for investment by loan portfolio class and by fixed and adjustable rate loans as of December 31, 2013 and 2012 in term of contractual maturity.
As of December 31, 2013
As of December 31, 2012
Due Under
Due 1-5
Due More than
Due Under
Due 1-5
Due More than
(dollars in thousands) Commercial
$
71,975
$
103,982
$
27,733
$
54,601
$
81,619
$
11,235 Commercial real estate
38,044
78,795
652,282
20,139
43,101
485,978 Commercial construction
39,891
19,986
—
32,513
4,359
— Residential real estate
1,263
13,054
71,251
1,437
12,955
68,570 Home equity
617
17,330
14,557
—
3,141
27,820 Consumer
1,216
1,105
19
623
1,128
50 Total gross loans
$
153,006
$
234,252
$
765,842
$
109,313
$
146,303
$
593,653 By Interest Rate Type: Adjustable
$
107,689
$
67,605
$
495,458
$
60,678
$
123,008
$
573,509 Fixed
45,317
166,647
270,384
48,635
23,295
20,144 Total gross loans
$
153,006
$
234,252
$
765,842
$
109,313
$
146,303
$
593,653 Asset Quality General. One of our key objectives is to maintain a high level of asset quality. When a borrower fails to make a scheduled payment, we attempt to cure the deficiency by making personal contact with the borrower. Initial contacts typically are made 15 days after the date the payment is due, and late
notices are sent approximately 15 days after the date the payment is due. In most cases, deficiencies are promptly resolved. If the delinquency continues, late charges are assessed and additional efforts are made to collect the deficiency. All loans which are delinquent 30 days or more are reported to the
board of directors of the Bank on a monthly basis. On loans where the collection of principal or interest payments is doubtful, the accrual of interest income ceases (“non-accrual” loans). Except for loans that are well secured and in the process of collection, it is our policy to discontinue accruing additional interest and reverse any interest accrued on
any loan which is 90 days or more past due. On occasion, this action may be taken earlier if the financial condition of the borrower raises significant concern with regard to his/her ability to service the debt in accordance with the terms of the loan agreement. Interest income is not accrued on these loans
until the borrower’s financial condition and payment record demonstrate an ability to service the debt. 33
of Total
of Total
of Total
of Total
of Total
One Year
Years
Five Years
One Year
Years
Five Years
Real estate acquired as a result of foreclosure is classified as OREO until sold. OREO is recorded at the lower of cost or fair value less estimated selling costs. Costs associated with acquiring and improving a foreclosed property is usually capitalized to the extent that the carrying value does not
exceed fair value less estimated selling costs. Holding costs are charged to expense. Gains and losses on the sale of OREO are charged to operations, as incurred. We account for our impaired loans in accordance with GAAP. An impaired loan generally is one for which it is probable, based on current information, that the lender will not collect all the amounts due under the contractual terms of the loan. Large groups of smaller balance, homogeneous loans
are collectively evaluated for impairment. Loans collectively evaluated for impairment include smaller balance residential real estate loans and consumer loans. These loans are evaluated as a group because they have similar characteristics and performance experience. Larger commercial and construction
loans are individually evaluated for impairment. The recorded investments of impaired loans amounted to $16.0 million at December 31, 2013, compared to $12.0 million at December 31, 2012. In limited situations we will modify or restructure a borrower’s existing loan terms and conditions. A restructured loan is considered a troubled debt restructuring (“TDR”) when, for economic or legal reasons related to a borrower’s financial difficulties, we grant a concession to the borrower in
modifying or renewing a loan that the institution would not otherwise consider. We had four TDRs totaling $2.9 million, which, as of December 31, 2013, were currently performing under their restructured terms. We had five TDRs totaling $3.0 million, which, as of December 31, 2012, were currently
performing under their restructured terms. Asset Classification. Federal regulations and our policies require that we utilize an internal asset classification system as a means of reporting problem and potential problem assets. We have incorporated an internal asset classification system, substantially consistent with Federal banking regulations, as
a part of our credit monitoring system. Federal banking regulations set forth a classification scheme for problem and potential problem assets as “substandard,” “doubtful” or “loss” assets. An asset is considered “substandard” if it is inadequately protected by the current net worth and paying capacity of
the obligor or of the collateral pledged, if any. “Substandard” assets include those characterized by the “distinct possibility” that the insured institution will sustain “some loss” if the deficiencies are not corrected. Assets classified as “doubtful” have all of the weaknesses inherent in those classified
“substandard” with the added characteristic that the weaknesses present make “collection or liquidation in full,” on the basis of currently existing facts, conditions, and values, “highly questionable and improbable.” Assets classified as “loss” are those considered “uncollectible” and of such little value that
their continuance as assets without the establishment of a specific loss reserve is not warranted. Assets which do not currently expose the insured institution to sufficient risk to warrant classification in one of the aforementioned categories but possess weaknesses are required to be designated “special
mention.” When an insured institution classifies one or more assets, or portions thereof, as “substandard” or “doubtful,” it is required that a general valuation allowance for loan losses be established for loan losses in an amount deemed prudent by management. General valuation allowances represent loss
allowances which have been established to recognize the inherent losses associated with lending activities, but which, unlike specific allowances, have not been allocated to particular problem assets. When an insured institution classifies one or more assets, or portions thereof, as “loss,” it is required either
to establish a specific allowance for losses equal to 100% of the amount of the asset so classified or to charge off such amount. A bank’s determination as to the classification of its assets and the amount of its valuation allowances is subject to review by Federal bank regulators which can order the establishment of additional general or specific loss allowances. The Federal banking agencies have adopted an interagency policy
statement on the allowance for loan and lease losses. The policy statement provides guidance for financial institutions on both the responsibilities of management for the assessment and establishment of allowances and guidance for banking agency examiners to use in determining the adequacy of general
valuation guidelines. Generally, the policy statement recommends that institutions have effective systems and controls to identify, monitor and address 34
asset quality problems; that management analyze all significant factors that affect the collectability of the portfolio in a reasonable manner; and that management establish acceptable allowance evaluation processes that meet the objectives set forth in the policy statement. Our management believes that,
based on information currently available, our allowance for loan losses is maintained at a level which covers all known and probable incurred losses in the portfolio at each reporting date. However, actual losses are dependent upon future events and, as such; further additions to the level of allowances for
loan losses may become necessary. The table below sets forth information on our classified assets and assets designated special mention at the dates indicated.
As of
2013
2012
(dollars in thousands) Classified Assets: Substandard
$
15,101
$
17,885 Doubtful
—
— Loss
—
— Total classified assets
15,101
17,885 Special mention assets
17,836
18,335 Total classified and special mention assets
$
32,937
$
36,220 Delinquent Loans. The following tables show the delinquencies in our loan portfolio as of the dates indicated.
At December 31, 2013 Loans Delinquent For:
At December 31, 2013
30-89 Days
90 Days and Greater
Total Delinquent Loans
Number
Amount
% of Total
Number
Amount
% of Total
Number
Amount
% of Total
(dollars in thousands) Commercial
—
$
—
0.0
%
3
$
634
14.2
%
3
$
634
13.0
% Commercial real estate
—
—
0.0
%
1
1,394
31.4
%
1
1,394
28.5
% Commercial construction
—
—
0.0
%
—
—
0.0
%
—
—
0.0
% Residential real estate
1
431
95.8
%
1
1,763
39.7
%
2
2,194
44.8
% Home equity
—
—
0.0
%
2
653
14.7
%
2
653
13.3
% Consumer
1
19
4.2
%
—
—
0.0
%
1
19
0.4
% Total
2
$
450
100.0
%
7
$
4,444
100.0
%
9
$
4,894
100.0
%
At December 31, 2012 Loans Delinquent For:
At December 31, 2012
30-89 Days
90 Days and Greater
Total Delinquent Loans
Number
Amount
% of Total
Number
Amount
% of Total
Number
Amount
% of Total
(dollars in thousands) Commercial
—
$
—
0.0
%
1
$
273
5.4
%
1
$
273
3.9
% Commercial real estate
1
142
7.3
%
2
2,446
48.1
%
3
2,588
36.8
% Commercial construction
—
—
0.0
%
—
—
0.0
%
—
—
0.0
% Residential real estate
1
1,769
90.9
%
1
2,369
46.5
%
2
4,138
58.8
% Home equity
1
35
1.8
%
—
—
0.0
%
1
35
0.5
% Consumer
—
—
0.0
%
—
—
0.0
%
—
—
0.0
% Total
3
$
1,946
100.0
%
4
$
5,088
100.0
%
7
$
7,034
100.0
% 35
December 31,
Delinquent
Loans 30-
89 Days
Delinquent
Loans
Greater
than 90 Days
Delinquent
Loans
Delinquent
Loans 30-
89 Days
Delinquent
Loans
Greater
than 90 Days
Delinquent
Loans
Non-Performing Assets, TDRs, and Loans 90 Days Past Due and Accruing. The following table sets forth information concerning our non-performing assets, TDRs, and past-due accruing loans as of the dates indicated:
As of December 31,
2013
2012
2011
2010
2009
(dollars in thousands) Nonaccrual loans: Commercial
$
3,582
$
3,124
$
388
$
—
$
— Commercial real estate
2,445
2,446
6,049
2,538
— Commercial construction
—
—
—
—
— Residential real estate
2,381
2,369
—
1,511
2,197 Home equity
767
—
—
—
— Consumer
—
—
—
—
— Total nonaccrual loans
9,175
7,939
6,437
4,049
2,197 Other real estate owned
1,303
433
—
—
— Total non-performing assets
$
10,478
$
8,372
$
6,437
$
4,049
$
2,197 Loans past due 90 days and still accruing
$
—
$
—
$
—
$
723
$
— Performing troubled debt restructured loans
$
2,934
$
2,996
$
4,831
$
—
$
— Nonaccrual loans to total loans
0.80
%
0.93
%
1.02
%
0.82
%
0.55
% Nonaccrual loans and loans past due 90 days and still accruing to total loans
0.80
%
0.93
%
1.02
%
0.97
%
0.55
% Nonperforming assets to total assets
0.84
%
0.90
%
0.88
%
0.67
%
0.43
% Allowance for Loan Losses The allowance for loan losses is a reserve established through charges to earnings in the form of a provision for loan losses. We maintain an allowance for loan losses at a level considered adequate to provide for all known and probable incurred losses in the portfolio. The level of the allowance is
based on management’s evaluation of estimated losses in the portfolio, after consideration of risk characteristics of the loans and prevailing and anticipated economic conditions. Loan charge-offs (i.e., loans judged to be uncollectible) are charged against the reserve and any subsequent recovery is credited.
Our officers analyze risks within the loan portfolio on a continuous basis and through an external independent loan review function, and the results of the loan review function are also reviewed by our Audit Committee. A risk system, consisting of multiple grading categories for each portfolio class, is
utilized as an analytical tool to assess risk and appropriate reserves. In addition to the risk system, management further evaluates risk characteristics of the loan portfolio under current and anticipated economic conditions and considers such factors as the financial condition of the borrower, past and
expected loss experience, and other factors which management feels deserve recognition in establishing an appropriate reserve. These estimates are reviewed at least quarterly and, as adjustments become necessary, they are recognized in the periods in which they become known. Although management
strives to maintain an allowance it deems adequate, future economic changes, deterioration of borrowers’ creditworthiness, and the impact of examinations by regulatory agencies all could cause changes to our allowance for loan losses. At December 31, 2013, the allowance for loan losses was $16.0 million, an increase of $2.7 million or 20.6%, from $13.2 million for the year ended December 31, 2012. Net charge-offs totaled $1.8 million during 2013 and $0.4 million for 2012. The allowance for loan losses as a percentage of loans
receivable was 1.39% at December 31, 2013 and 1.56% at December 31, 2012. 36
The following is a summary of the reconciliation of the allowance for loan losses for the periods indicated:
For the Year Ended December 31,
2013
2012
2011
2010
2009
(dollars in thousands) Balance at beginning of period
$
13,246
$
9,617
$
7,414
$
4,759
$
3,316 Provision charged to operating expenses
4,575
3,990
2,355
2,930
1,455 Recoveries of loans previously charged-off: Commercial
—
—
—
18
1 Consumer
—
32
—
—
— Residential real estate
—
—
—
—
— Total recoveries
—
32
—
18
1 Loans charged-off: Commercial
(1,058
)
(240
)
—
(293
)
(13
) Consumer
(190
)
—
(62
)
—
— Residential real estate
(594
)
(153
)
(90
)
—
— Total charge-offs
(1,842
)
(393
)
(152
)
(293
)
(13
) Net charge-offs
(1,842
)
(361
)
(152
)
(275
)
(12
) Balance at end of period
$
15,979
$
13,246
$
9,617
$
7,414
$
4,759 Net charge-offs to average loans outstanding
0.19
%
0.05
%
0.03
%
0.06
%
0.00
% Allowance for loan losses to total loans
1.39
%
1.56
%
1.53
%
1.50
%
1.19
% The following table sets forth, by loan portfolio class, the amount and percentage of our allowance for loan losses attributable to such class, and the percentage of total loans represented by such class, as of the dates indicated:
As of December 31, 2013
As of December 31, 2012
As of December 31, 2011
Amount
% of
% of
Amount
% of
% of
Amount
% of
% of
(dollars in thousands) Commercial
$
4,438
27.8
%
17.7
%
$
2,402
18.1
%
17.4
%
$
653
6.8
%
17.2
% Commercial real estate
8,744
54.7
%
66.7
%
7,718
58.3
%
64.7
%
5,658
58.8
%
59.7
% Commercial construction
639
4.0
%
5.2
%
660
5.0
%
4.3
%
447
4.6
%
4.5
% Residential real estate
1,248
7.8
%
7.4
%
1,542
11.6
%
9.8
%
2,517
26.3
%
14.1
% Home equity
698
4.4
%
2.8
%
617
4.7
%
3.6
%
339
3.5
%
4.4
% Consumer
52
0.3
%
0.2
%
41
0.3
%
0.2
%
3
0.0
%
0.1
% Unallocated
160
1.0
%
0.0
%
266
2.0
%
0.0
%
—
0.0
%
0.0
% Total
$
15,979
100.0
%
100.0
%
$
13,246
100.0
%
100.0
%
$
9,617
100.0
%
100.0
% As of December 31, 2010 As of December 31, 2009 Amount % of % of Amount % of % of (dollars in thousands) Commercial
$
634
8.6
%
21.6
%
$
407
8.6
%
19.6
% Commercial real estate
2,902
39.1
%
52.5
%
1,863
39.1
%
57.8
% Commercial construction
808
10.9
%
7.5
%
519
10.9
%
6.1
% Residential real estate
2,773
37.4
%
13.1
%
1,780
37.4
%
10.0
% Home equity
292
3.9
%
5.1
%
187
3.9
%
6.3
% Consumer
5
0.1
%
0.2
%
3
0.1
%
0.2
% Unallocated
—
0.0
%
0.0
%
—
0.0
%
0.0
% Total
$
7,414
100.0
%
100.0
%
$
4,759
100.0
%
100.0
% Investment Securities Our investment portfolio remains modest in size relative to our total assets and loan portfolio. Nevertheless, the investment portfolio provides and additional source of interest income and 37
ALL
Total Loans
ALL
Total Loans
ALL
Total Loans
ALL
Total Loans
ALL
Total Loans
liquidity. The portfolio is composed of obligations of U.S. Government Agencies, mortgage-backed securities and Community Reinvestment Act (“CRA”) related investments. Securities are classified as “held-to-maturity” (HTM), “available for sale” (AFS), or “trading” at time of purchase. Securities are classified as HTM based upon management’s intent and our ability to hold them to maturity. Such securities are stated at cost, adjusted for unamortized purchase premiums
and discounts. Securities, which are bought and held principally for resale in the near term, are classified as trading securities, which are carried at market value. Realized gains and losses as well as gains and losses from marking the portfolio to market value are included in trading revenue. We have no
trading securities. Securities not classified as HTM or trading securities are classified as AFS and are stated at fair value. Unrealized gains and losses on AFS securities are excluded from results of operations, and are reported as a component of accumulated other comprehensive (loss) income, net of
taxes, which is included in stockholders’ equity. Securities classified as AFS include securities that may be sold in response to changes in interest rates, changes in prepayment risks, the need to increase regulatory capital, or other similar requirements. Management determines the appropriate classification of securities, whether AFS or HTM, at the time of purchase. The carrying value of our AFS investment securities portfolio at December 31, 2013 was $27.6 million, an increase of $8.3 million, or 43.3%, from December 31, 2012 of $19.3 million.
The carrying value of our HTM investment securities portfolio at December 31, 2012 was $1.0 million, a decrease of $1.0 million, or 48.3%, from $2.0 million at December 31, 2012. The decreases in both AFS and HTM portfolios were primarily due to paydowns of mortgage-backed securities and the
calls of two securities in our AFS portfolio, and application of the proceeds to fund new loan demand. The following table summarizes the fair value of our non-equity AFS investment securities portfolio for the dates presented:
December 31,
2013
2012
2011
(dollars in thousands) U.S. Government agency
$
—
$
1,005
$
4,036 U.S. Treasury securities
1,803
—
— Mortgage backed-securities
9,657
12,029
17,226 Other asset-backed securities
5,939
—
— State and political subdivisions
4,335
—
— CRA investment fund
5,855
6,218
6,173 Total available for sale
$
27,589
$
19,252
$
27,435 The following table sets the maturity distribution of our non-equity AFS investment securities portfolio for the periods presented:
December 31, 2013
Due < 1 Year
Due 1-5 Years
> 5 Years
Amount
Yield
Amount
Yield
Amount
Yield
(dollars in thousands) U.S. Treasury securities
$
—
—
$
—
—
$
1,803
2.13
% Other asset-backed securities
—
—
—
—
5,939
1.32
% State and political subdivisions
1,003
0.60
%
—
—
3,332
1.07
% Mortgage backed-securities
—
—
—
—
9,657
3.22
% Total
$
1,003
0.60
%
$
—
—
$
20,731
2.24
% 38
December 31, 2012
Due Under 1 Year
Due 1-5 Years
> 5 Years
Amount
Yield
Amount
Yield
Amount
Yield
(dollars in thousands) U.S. Treasury securities
$
1,005
1.78
%
$
—
—
$
—
— Mortgage backed-securities
—
—
—
—
12,029
3.84
% Total
$
1,005
1.78
%
$
—
—
$
12,029
3.84
% Refer to Note 2-Securities in the consolidated financial statements for more information regarding our AFS and HTM securities. Deposits Deposits are our primary source of funds. Average total deposits increased $172.7 million, or 25.4%, to $853.5 million in 2013 from $680.8 million in 2012. Transaction and non-transaction (time) deposits have grown as the Bank’s customer base has expanded. The following table sets forth the average amount of various types of deposits for each of the periods indicated:
December 31,
2013 Average
2012 Average
2011 Average
Balance
Rate
Balance
Rate
Balance
Rate
(dollars in thousands) Demand, non-interest bearing
$
191,233
—
$
138,155
—
$
106,174
— Demand, interest bearing & NOW
64,352
0.15
%
57,818
0.25
%
25,813
0.79
% Money market accounts
197,486
0.36
%
177,180
0.51
%
163,561
0.83
% Savings
70,675
0.26
%
78,477
0.44
%
81,000
0.99
% Time
329,765
1.16
%
229,150
1.48
%
160,580
1.58
% Total Deposits
$
853,511
0.56
%
$
680,780
0.70
%
$
537,128
0.91
% The following table summarizes the maturity distribution of time deposits in denominations of $100,000 or more:
December 31,
December 31,
(dollars in thousands) 3 months or less
$
40,197
$
33,033 3 to 6 months
45,196
47,758 6 to 12 months
78,728
58,517 Over 12 months
55,181
55,780 Total
$
219,302
$
195,088 Borrowings Borrowings consist of long and short term advances from the Federal Home Loan Bank. These advances are secured, under the terms of a blanket collateral agreement, by commercial mortgage loans. As of December 31, 2013 and December 31, 2012, the Company had $137.6 million in notes
outstanding at a weighted average interest rate of 1.7% and $55.6 million in notes outstanding at a weighted average interest rate of 2.1%, respectively. Federal Funds Purchased and Repurchasing Agreements The following table summarizes short-term borrowings, (borrowings with maturities of one year or less) which consist of federal funds purchased, repurchase agreements and weighted average interest rates paid: 39
2013
2012
Year Ended
December 31, 2013
December 31, 2012
December 31, 2011
(dollars in thousands) Average daily amount of short-term borrowings outstanding during the period
$
—
$
—
$
19,263 Weighted average interest rate on average daily short-term borrowings
—
—
0.35
% Maximum outstanding short-term borrowings outstanding at any month-end
$
—
$
—
$
28,860 Short-term borrowings outstanding at period end
$
—
$
—
$
— Weighted average interest rate on short-term borrowings at period end
—
—
— Liquidity Liquidity is a measure of a bank’s ability to fund loans, withdrawals or maturities of deposits, and other cash outflows in a cost-effective manner. Our principal sources of funds are deposits, scheduled amortization and prepayments of loan principal, maturities of investment securities, and funds
provided by operations. While scheduled loan payments and maturing investments are relatively predictable sources of funds, deposit flow and loan prepayments are greatly influenced by general interest rates, economic conditions and competition. At December 31, 2013, the amount of liquid assets remained at a level management deemed adequate to ensure that, on a short- and long-term basis, contractual liabilities, depositors’ withdrawal requirements, and other operational and customer credit needs could be satisfied. As of December 31,
2013, liquid assets (cash and due from banks, interest-bearing deposits with banks and unencumbered investment securities) were $65.7 million, which represented 5.3% of total assets and 6.8% of total deposits and borrowings, compared to $71.5 million at December 31, 2012, which represented 7.7% of
total assets and 9.3% of total deposits and borrowings on such date. The Bank is a member of the Federal Home Loan Bank of New York and, based on available qualified collateral as of December 31, 2013, had the ability to borrow $488.5 million. In addition, at December 31, 2013, the Bank had in place additional borrowing capacity of $18.0 million through
correspondent banks. The Bank also has a credit facility established with the Federal Reserve Bank of New York for direct discount window borrowings, although no collateral was pledged at year-end 2013. At December 31, 2013, the Bank had aggregate available and unused credit of $368.9 million,
which represents the aforementioned facilities totaling $506.5 million net of $137.6 million in outstanding borrowings. At December 31, 2013, outstanding commitments for the Bank to extend credit were $280.9 million. Cash and cash equivalents decreased by $16.3 million or 32.1%, from $50.6 million at December 31, 2012 to $34.4 million at December 31, 2013. The decrease was primarily due to a $333.0 million increase in investing activities, largely an increase in loans receivable, partially offset by $302.1 million
in financing activities, including an increase in deposits and a net increase in FHLB borrowings, and by $14.7 million from operating activities. Off-Balance Sheet Arrangements We are a party to financial instruments with off-balance-sheet risk in the normal course of business to meet the financing needs of our customers. These financial instruments include commitments to extend credit and standby letters of credit. Those instruments involve, to varying degrees, elements of
credit and interest rate risk in excess of the amount recognized in the consolidated statements of financial condition. Our exposure to credit loss in the event of non-performance by the other party to the financial instrument for commitments to extend credit and standby letters of credit is represented by
the contractual amount of those instruments. We use the same credit analyses in making commitments and conditional obligations as we do for on-balance-sheet instruments. Commitments under standby letters of credit, both financial and performance do 40
not necessarily represent future cash requirements, in that these commitments often expire without being drawn upon. Further discussion of these commitments is included in Note 12 to the consolidated financial statements. Contractual Obligations The following table shows our contractual obligations by expected payment period, as of December 31, 2013 and December 31, 2012. Further discussion of these commitments is included in Notes 4, 5 and 7 to the Consolidated Financial Statements.
Contractual Obligation
December 31, 2013
December 31, 2012
Total
2014-2016
2017-2018
2019
Total
2013-2015
2016-2017
2018
(dollars in thousands) Operating Lease Obligations
$
4,379
$
2,885
$
1,000
$
494
$
4,256
$
2,579
$
993
$
684 Capital Lease Obligations
4,800
874
586
3,340
5,069
851
584
3,634 Federal Home Loan Bank Borrowings
137,557
86,557
51,000
—
79,568
54,568
10,000
15,000 Time Deposits
415,711
359,045
56,666
—
275,472
229,472
16,702
29,298 Operating leases represent obligations entered into by us for the use of land, premises and equipment. The leases generally have escalation terms based upon certain defined indexes. Interest Rate Sensitivity Analysis The principal objective of our asset and liability management function is to evaluate the interest-rate risk included in certain balance sheet accounts; determine the level of risk appropriate given our business focus, operating environment, and capital and liquidity requirements; establish prudent asset
concentration guidelines; and manage the risk consistent with Board approved guidelines. We seek to reduce the vulnerability of our operations to changes in interest rates, and actions in this regard are taken under the guidance of the Bank’s Asset Liability Committee (the “ALCO”). The ALCO
generally reviews our liquidity, cash flow needs, maturities of investments, deposits and borrowings, and current market conditions and interest rates. We currently utilize net interest income simulation and economic value of portfolio equity (“EVPE”) models to measure the potential impact to the Bank of future changes in interest rates. As of December 31, 2013 and December 31, 2012 the results of the models were within guidelines prescribed
by our Board of Directors. If model results were to fall outside prescribed ranges, action, including additional monitoring and reporting to the Board, would be required by the ALCO and Bank’s management. The net interest income simulation model attempts to measure the change in net interest income over the next one-year period, and the next three-year period on a cumulative basis, assuming certain changes in the general level of interest rates. In our model, which was run as of December 31, 2013, we estimated that, over the next one-year period, a 200 basis-point increase in the general level of interest rates will decrease our net interest income by 3.5%, while a 100 basis-point decrease in interest rates will decrease net interest income by
1.9%. As of December 31, 2012, we estimated that, over the next one-year period, a 200 basis-point increase in the general level of interest rates will decrease our net interest income by 1.6%, while a 100 basis-point decrease in the general level of interest rates will decrease our net interest income by
0.5%. In our model, which was run as of December 31, 2013, we estimated that, over the next three years on a cumulative basis, a 200 basis-point increase in the general level of interest rates will decrease our net interest income by 4.2%, while a 100 basis-point decrease in interest rates will decrease net
interest income by 1.9%. As of December 31, 2012, we estimated that, over the next 41
and later
and later
three years on a cumulative basis, a 200 basis-point increase in the general level of interest rates will decrease our net interest income by 0.9%, while a 100 basis-point decrease in the general level of interest rates will decrease our net interest income by 2.8%. An EVPE analysis is also used to dynamically model the present value of asset and liability cash flows with rate shocks of up 200 basis points and down 100 basis points. The economic value of equity is likely to be different as interest rates change. Our EVPE as of December 31, 2013, would decline
by 20.62% with a rate shock of up 200 basis points, and increase by 12.84% with a rate shock of down 100 basis points. Our EVPE as of December 31, 2012, would decline by 19.37% with a rate shock of up 200 basis points, and increase by 9.73% with a rate shock of down 100 basis points. Capital A significant measure of the strength of a financial institution is its capital base. The Federal regulators of the Company and the Bank have classified and defined capital into the following components: (1) Tier 1 Capital, which includes tangible stockholders’ equity for common stock, qualifying
preferred stock and certain qualifying hybrid instruments, and (2) Tier 2 Capital, which includes a portion of the allowance for loan losses, certain qualifying long-term debt, and preferred stock which does not qualify for Tier 1 Capital. Minimum capital levels are regulated by risk-based capital adequacy
guidelines which require certain capital as a percent of the Bank’s assets and certain off-balance sheet items adjusted for predefined credit risk factors (risk-adjusted assets). The Company and the Bank are required to maintain, at a minimum, Tier 1 Capital as a percentage of risk-adjusted assets of 4.0% and combined Tier 1 and Tier 2 Capital as a percentage of risk-adjusted assets of 8.0%. In addition to the risk-based guidelines, the regulators require that an institution which meets the regulator’s highest performance and operation standards maintain a minimum leverage ratio (Tier 1 Capital as a percentage of average tangible assets) of 4.0%. For those institutions with higher levels of
risk or that are experiencing or anticipating significant growth, the minimum leverage ratio will be evaluated through the ongoing regulatory examination process. The following table summarizes the risk-based and leverage capital ratios for the Company and the Bank as well as the required minimum regulatory capital ratios:
At December 31, 2013
At December 31, 2012
Actual
Minimum
Well
Actual
Minimum
Well The Company: Leverage ratio
10.74
%
4.00
%
n/a
7.84
%
4.00
%
n/a Tier 1 Risk-based capitalization
11.68
%
4.00
%
n/a
9.26
%
4.00
%
n/a Total Risk-based capitalization
12.91
%
8.00
%
n/a
10.52
%
8.00
%
n/a The Bank: Leverage ratio
10.71
%
4.00
%
5.00
%
7.84
%
4.00
%
5.00
% Tier 1 Risk-based capitalization
11.65
%
4.00
%
6.00
%
9.26
%
4.00
%
6.00
% Total Risk-based capitalization
12.88
%
8.00
%
10.00
%
10.51
%
8.00
%
10.00
% The Company’s tangible common equity ratio was 10.45% as of December 31, 2013, and 7.76% as of December 31, 2012. Over the past several years, we issued shares of preferred stock in order to augment our capital base. In 2009, we issued 125,000 shares of our Series A Preferred Stock and 400,000 shares of our Series B Stock; in 2010, we issued 241,175 shares of our Series B Preferred Stock; in 2011, we issued
59,025 shares of our Series B Preferred Stock; and in 2012 we issued 7,500 shares of our Series C Preferred Stock. All of these shares were issued pursuant to exemptions from registration under Section 5 of the Securities Act. We received an aggregate of $24.0 million in proceeds from the sale of these
preferred shares. In accordance with the terms of each class of preferred stock, all of our outstanding preferred stock converted, during 2012, into shares of our common stock. We issued an aggregate of 909,921 shares of our common stock upon conversion of our outstanding preferred 42
Ratio
Requirement
Capitalized
Requirement
Ratio
Requirement
Capitalized
Requirement
stock, and as of December 31, 2012, no shares of our preferred stock were outstanding. We converted our outstanding preferred stock to common stock because (i) our Board believed the Company would be better served by maintaining a more simplified capital structure and (ii) the Board believed
regulatory agencies look more favorably on common stock as a capital component. Impact of Inflation and Changing Prices Our consolidated financial statements and notes thereto, presented elsewhere herein, have been prepared in accordance with generally accepted accounting principles which require the measurement of financial position and operating results in terms of historical dollars without considering the change
in the relative purchasing power of money over time and due to inflation. The impact of inflation is reflected in the increased cost of our operations. Unlike most industrial companies, nearly all of our assets and liabilities are monetary. Therefore, interest rates have a greater impact on our performance
than do the effects of general levels of inflation. Interest rates do not necessarily move in the same direction or to the same extent as the prices of goods and services. Item 7A. Quantitative and Qualitative Disclosures About Market Risk. Interest Rate Risk Management Interest rate risk management is our primary market risk. See Item 7—“Management’s Discussion and Analysis—Interest Rate Sensitivity Analysis” herein for a discussion of our management of our interest rate risk. Inflation Risk Management Inflation has an important impact on the growth of total assets in the banking industry and causes a need to increase equity capital higher than normal levels in order to maintain an appropriate equity-to-assets ratio. We cope with the effects of inflation by managing our interest rate sensitivity
position through our asset/liability management program, and by periodically adjusting our pricing of services and banking products to take into consideration current costs. Item 8. Financial Statements and Supplementary Data. The information required by this item is included elsewhere in this Annual Report on Form 10-K. Item 9. Changes in and Disagreements with Accountants on Accounting and Financial Disclosure. Not applicable Item 9A. Controls and Procedures. (a) Evaluation of disclosure controls and procedures The Company carried out an evaluation, under the supervision and with the participation of the Company’s management, including the Company’s Chief Executive Officer and Chief Financial Officer, of the effectiveness of the design and operation of the Company’s disclosure controls and procedures
pursuant to Exchange Act Rule 13a-15. Based upon that evaluation, the Chief Executive Officer and Chief Financial Officer concluded that, as of the end of the period covered by this report, the Company’s disclosure controls and procedures are effective in timely alerting them to material information
relating to the Company (including its consolidated subsidiaries) required to be included in the Company’s periodic SEC filings. (b) Management’s report on internal control over financial reporting The management of the Company is responsible for establishing and maintaining adequate internal control over financial reporting, based on the criteria established in the 1992 Internal Control—Integrated Framework issued by the Committee of Sponsoring Organizations of the 43
Treadway Commission (COSO). The Company’s system of internal control over financial reporting was designed by or under the supervision of the Company’s chief executive officer and chief financial officer to provide reasonable assurance regarding the reliability of the preparation of the Company’s
financial statements for external and regulatory reporting purposes, in accordance with U.S. generally accepted accounting principles. The Company’s management assessed the effectiveness of the Company’s internal control over financial reporting as of December 31, 2013, based on the criteria established
in the 1992 Internal Control—Integrated Framework issued by the COSO. Based on the assessment, management determined that, as of December 31, 2013, the Company’s internal control over financial reporting is effective. The forgoing shall not deemed to be “filed” for purposes of Section 18 of the Securities Exchange Act of 1934, as amended, or otherwise subject to the liabilities of that Section. In addition, this information shall not be deemed to be incorporated by reference into any of the Registrant’s filings with
the Securities and Exchange Commission, except as shall be expressly set forth by specific reference in any such filing.
/s/ FRANK SORRENTINO III
/s/ WILLIAM S. BURNS
Frank Sorrentino III.
William S. Burns There were not any significant changes in internal controls or in other factors that could significantly affect these controls subsequent to the date of their evaluation, including any corrective actions with regard to significant deficiencies and material weaknesses. Item 9B. Other Information. None. 44
Chairman & CEO
Executive Vice President & Chief
Financial Officer
PART III Item 10. Directors, Executive Officers
and Corporate Governance. The Certificate and By-Laws of ConnectOne provide that the number of Directors shall not be less than one (1) or more
than twenty-five (25) and permit the exact number to be determined from time to time by the Board of Directors. ConnectOne’s
Certificate of Incorporation provides for a Board of Directors divided into three classes. The following table sets forth the names, ages, principal occupations, and business experience for all directors, as well as their prior service on the ConnectOne Board, if any. Unless otherwise indicated, principal occupations shown for each Director have extended for five or more years.
Name and Position with Company
Age
Principal Occupation for Past Five Years
Term of Office
Frank Sorrentino III,
Chairman of the Board and
CEO
52
Chairman of the Board & Chief Executive Officer of ConnectOne and ConnectOne Bank
2004–2016
Frank W. Baier, Director
48
Executive Vice President and Chief Financial Officer of Continental Grain Company, a diversified operating and investment company. Previously, from July 2011 through September 2012, Executive Vice President and Chief Financial Officer of
ConnectOne and ConnectOne Bank. Chief Financial Officer of Capital Access Network, Inc from February 2009 until February 2010, and a Partner at Columbia Financial Partners LP, from May 2010 until June 2011.
2012–2016
Stephen Boswell, Director
60
President & Chief Executive Officer of Boswell Engineering
2004–2015
Frank Cavuoto, Director
62
CPA, Frank J. Cavuoto & Co., L.L.C.
2004–2014
Dale Creamer, Director
52
Vice President, J. Fletcher Creamer & Son, Inc.
2004–2015
Frank Huttle III, Director
59
Executive Vice President and General Counsel Hudson Media Inc.; formerly Of Counsel to the firm of DeCotiis, Fitzpatrick & Cole, LLP; Mayor of Englewood,
2004–2014
Michael Kempner, Director
56
President & Chief Executive Officer, MWW Group, Inc.
2004–2015
Joseph Parisi, Jr., Director
53
Chairman of the Board and CEO of Otterstedt Insurance Agency; Mayor, Borough of Englewood Cliffs, New Jersey
2004–2014 No Director of ConnectOne is also currently a director of a company having a class of securities registered under Section 12 of the Securities Exchange Act of 1934, as amended, or subject to the requirements of Section 15(d) of such Act or any company registered as an investment company under
the Investment Bank Act of 1940. However, Frank Baier was a director of Doral Financial Corporation from 2007 until 2011, and Michael Kempner served as a director of Lighting Science Group Corporation from January 2010 until May 2012. There are no arrangements or understanding between any director and ConnectOne pursuant to which such director was selected as a director. 45
Since—Expires
New Jersey
Information About the Board of Directors Frank Sorrentino III, Chairman of the Board and Chief Executive Officer, 52: Mr. Sorrentino was one of the founding organizers of ConnectOne Bank, has served as ConnectOne’s Chairman since its founding, and has been ConnectOne’s Chief Executive Officer since 2007 and the President of
ConnectOne Bank since 2011. Prior to becoming an officer of ConnectOne and ConnectOne Bank, Mr. Sorrentino was a builder and construction manager in Bergen County. Through his business contacts in ConnectOne’s market, Mr. Sorrentino has been able to bring customers and investors to
ConnectOne, and his real estate experience in ConnectOne’s market is of great value to the Board. In addition, as ConnectOne’s senior operating officer, his insight on ConnectOne’s operations is invaluable to the ConnectOne Board. Stephen Boswell, Lead Independent Director, 60: Mr. Boswell was a founding organizer of ConnectOne Bank. His firm, Boswell Engineering, Inc., for which he has served as President and Chief Executive Officer since 1990, is involved in many projects in ConnectOne’s market. Through his business
activities, Mr. Boswell has a strong sense of business conditions in ConnectOne’s market that is invaluable to the ConnectOne Board. Frank Baier, Director, 48: Prior to joining the ConnectOne Board in October of 2012, Mr. Baier served as ConnectOne’s Executive Vice President and Chief Financial Officer from July 2011 through September 2012. He currently serves as Executive Vice President and Chief Financial Officer of
Continental Grain Company, a diversified operating and investment company. Mr. Baier has an extensive background in finance, including service as Executive Vice President and Chief Financial Officer of Independence Community Bank Corp. from June 2001 until September 2005, Chief Financial
Officer and Chief Accounting Officer of Securities Industry and Financial Markets Association from June until September of 2008, Special Advisor to Washington Mutual from September 2008 until October 2008, Chief Financial Officer of Capital Access Network, Inc from February 2009 until February
2010, and a Partner at Columbia Financial Partners LP, from May 2010 until June 2011. Mr. Baier also currently serves as a Board Member of the Summit Police Athletic League. Mr. Baier’s extensive background and understanding of finance proves invaluable to the ConnectOne Board. Frank Cavuoto, Director, 62: Mr. Cavuoto was a founding organizer of ConnectOne Bank. He has been a certified public accountant for over 30 years and has owned Frank J. Cavuoto & Co since 2003. His accounting experience and his leadership of the Audit Committee are invaluable to the
ConnectOne Board. Dale Creamer, Director, 52: Mr. Creamer was a founding organizer of ConnectOne Bank. Mr. Creamer has served as Vice President of J. Fletcher Creamer & Son, Inc., a construction company, for more than ten years. As a leading businessman in the Bergen County area, Mr. Creamer brings valuable
insight into the market conditions of the surrounding communities. Frank Huttle III, Director, 59: Mr. Huttle was a founding organizer of ConnectOne Bank. He has over 30 years of experience in the insurance, mortgage banking and real estate industries, formerly as a practicing attorney and partner at DeCotiis, Fitzpatrick and Cole, prior to taking his current
position, and as a certified public accountant and Partner at Touche Ross & Co. Mr. Huttle has served as Executive Vice President and General Counsel to Hudson Media, Inc., a diversified magazine service and holding company, since February, 2010. His experience as a transactional attorney and as a businessman in ConnectOne’s market allows him to provide unique insight to the Board on a variety of matters, including current business conditions impacting ConnectOne’s customers. Mr. Huttle also currently serves as the mayor of the Borough of Englewood, New Jersey. Michael Kempner, Director, 56: Mr. Kempner was a founding organizer of ConnectOne Bank. He has over 30 years of public relations and media experience and has served as President and Chief Executive Officer for MWW Group, Inc since 1985. His experience as the head of a locally based media
company has proved invaluable to the ConnectOne Board Joseph Parisi, Jr., Director, 53: Mr. Parisi was a founding organizer of ConnectOne Bank. Mr. Parisi has served as President and Chief Executive Officer of Otterstedt Insurance Agency since 1979, as well as Mayor for the Borough of Englewood Cliffs, New Jersey since November 2005. His
experience both in the insurance industry and as the Mayor of a town in ConnectOne’s market allow him to provide valuable insight to the ConnectOne Board on conditions affecting ConnectOne’s customers. Diversity Statement Although ConnectOne has not adopted a formal policy on diversity, the ConnectOne Board considers diversity when selecting candidates for board service. When the ConnectOne Board determines there is a need to fill a director position, ConnectOne begins to identify qualified individuals for
consideration. ConnectOne seeks individuals that possess skill sets that a prospective director will be required to draw upon in order to contribute to the Board, including professional experience, education, and local knowledge. While education and skills are important factors, ConnectOne also considers
how candidates will contribute to the overall balance of the Board, so that ConnectOne will benefit from directors with different perspectives, varying view points and wide-ranging backgrounds and experiences. ConnectOne views and defines diversity in its broadest sense, which includes gender, ethnicity,
education, experience and leadership qualities. Information about Certain Executive Officers William S. Burns, Executive Vice President and Chief Financial
Officer, 54: Prior to joining us in October of 2012, Mr. Burns was the Chief Financial Officer of Somerset Hills Bancorp,
a bank holding company located in New Jersey, from April 2009 through September, 2012 and of The Trust Company of New Jersey, a
commercial banking institution which was acquired by North Fork Bancorporation. Mr. Burns has over thirty years of experience in
the financial services industry including senior positions at The Dime Savings Bank of New York, Summit Bank, The Bank of New York
and Ten Rock Capital Fund, L.P. (from 2005 – 2009). Mr. Burns received an M.B.A. from the Stern School of Business at New
York University and a B.S., cum laude, from Syracuse University. Elizabeth Magennis, Executive Vice President and Chief Lending
Officer, 45: Ms. Magennis began her career with us in 2006 as a Commercial Loan Officer and was promoted to Chief Lending Officer
in 2007. Previously, she was a Vice President and Commercial Loan Officer at Bergen Commercial Bank and an SBA Lender/Underwriter
at Sovereign Bank. She has over 24 years of banking experience and graduated from Ramapo College with a B.S. in Psychology and
St. John’s University with an A.S. in Business Administration. 46
Board of Directors; Independence; Committees Meetings of the ConnectOne Board of Directors are held ten times annually and as needed. The ConnectOne Board of Directors held thirteen meetings in the year ended December 31, 2013. ConnectOne’s policy is that all Directors make every effort to attend each meeting. For the year ended
December 31, 2013, each of ConnectOne’s Directors attended at least 75% of the aggregate of the total number of meetings of the Board of Directors and Board committees on which the respective Directors served. A majority of the ConnectOne Board consists of individuals who are “independent” under the Nasdaq listing standards. In making this determination with regard to Board member Michael Kempner, the ConnectOne Board considered the fact that ConnectOne and ConnectOne Bank have used Mr.
Kempner’s firm, MWW Group, to provide advertising and public relations assistance and advice. The ConnectOne Board considered, among other factors, the fees paid to MWW Group as a percentage of the firm’s total revenue (less than 1%) and Mr. Kempner’s personal income and determined that the
engagement of MWW Group did not interfere with Mr. Kempner’s exercise of independent judgment in carrying out the responsibilities of a director. In addition, the ConnectOne Board has considered the fact that several directors, including Messrs. Boswell, Creamer, Cavuoto, Huttle, Kempner and
Parisi, each own a direct or indirect interest in a limited liability company which acts as a landlord for two of ConnectOne Bank’s branches. The ConnectOne Board has concluded that based on each director’s respective interest in the rental payments compared to their overall net worth and cash,
membership in such limited liability company does not interfere with their exercise of independent judgment in carrying out the responsibilities of a director. Mr. Sorrentino, who serves as the Chairman and Chief Executive Officer of ConnectOne and ConnectOne Bank is not independent, nor is Mr.
Baier, since he recently served as the Chief Financial Officer of ConnectOne and ConnectOne Bank. Shareholders wishing to communicate directly with the independent members of the ConnectOne Board of Directors may send correspondence to ConnectOne Bancorp, Inc., attn.: Stephen Boswell, Lead
Independent Director, 301 Sylvan Avenue, Englewood Cliffs, New Jersey 07632. Code of Business Conduct and Ethics The Board of Directors has adopted a Code of Conduct governing ConnectOne’s Chief Executive Officer and senior financial officers, as required by the Sarbanes-Oxley Act and SEC regulations, as well as the ConnectOne Board of Directors and other senior members of management. ConnectOne’s
Code of Conduct governs such matters as conflicts of interest, use of corporate opportunity, confidentiality, compliance with law and the like. ConnectOne’s Code of Conduct is available on ConnectOne’s website at www.cnob.com. Committees Committees of ConnectOne’s Board of Directors Audit Committee. ConnectOne maintains an Audit Committee. The Audit Committee is responsible for the selection of the independent registered public accounting firm for the annual audit and to establish, and oversee the adherence to, a system of internal controls. The Audit Committee reviews
and accepts the reports of ConnectOne’s independent auditors and regulatory examiners. The Audit Committee arranges for an annual audit through ConnectOne’s registered independent public accounting firm, evaluates and implements the recommendations of the auditors as well as interim audits
performed by ConnectOne’s outsourced internal auditors, receives all reports of examination by bank regulatory agencies, analyzes such regulatory reports, and reports to the ConnectOne Board the results of its analysis of the regulatory reports. The Audit Committee met four times during 2013. The
ConnectOne Board of Directors has adopted a written charter for the Audit Committee which is available on ConnectOne’s website at www.cnob.com. The Audit Committee currently consists of Frank Cavuoto (Chair), Stephen Boswell and Frank Huttle, all of whom are “independent” under
the Nasdaq listing standards and meet the independence standards of the Sarbanes-Oxley Act for service on an audit committee. Although Mr. Cavuoto is a certified public accountant and has extensive experience in financial matters, it has not been determined by the ConnectOne Board that he is a
“financial expert”, as such term is defined by SEC regulations. ConnectOne’s Board believes that the interests of ConnectOne’s shareholders are adequately served by the current Audit Committee members collectively, but intends to continue to evaluate whether such an expert would be necessary or advisable. Audit Committee Report The Audit Committee meets periodically to consider the adequacy of ConnectOne’s financial controls and the objectivity of its financial reporting. The Audit Committee meets with ConnectOne’s independent auditors and ConnectOne’s internal auditors, all of whom have unrestricted access to the
Audit Committee. In connection with this year’s financial statements, the Audit Committee has reviewed and discussed ConnectOne’s audited financial statements with ConnectOne’s officers and Crowe Horwath LLP, our independent auditors. We have discussed with Crowe Horwath LLP, the matters required to be
discussed by Statement on Audit Standards No. 16, (“Communication with Audit Committees”). We also have received the written disclosures and letters from Crowe Horwath LLP required by Independence Standards Board Standard No. 1 (“Independence Discussions with Audit Committees”), and have
discussed with representatives of Crowe Horwath LLP their independence. Based on these reviews and discussions, the Audit Committee recommended to the Board of Directors that the audited financial statements be included in ConnectOne’s Annual Report on Form 10-K for the fiscal year 2013 for filing with the U.S. Securities and Exchange Commission. Frank Cavuoto, Chairman 47
Stephen Boswell
Frank Huttle
Compensation Committee. The Compensation Committee during 2013 consisted of directors Stephen Boswell (Chair), Steven Goldman and Joseph Parisi. Each member of the Compensation Committee serving during 2013 was independent, as such term is defined in the Nasdaq listing standards. The
purpose of the Compensation Committee is to review senior management’s performance and determine compensation, and review and set guidelines for compensation of all employees. The Compensation Committee does not delegate its authority regarding compensation. Mr. Sorrentino, ConnectOne’s
Chairman and Chief Executive Officer, provides input to the Committee regarding the compensation of ConnectOne’s executive officers. In 2013, the Compensation Committee met twice. ConnectOne’s Board of Directors has adopted a written charter for the Compensation Committee which is available
on ConnectOne’s website at www.cnob.com. In 2013, the Compensation Committee engaged Pearl Meyer & Partners to perform:
1.
An Executive Total Compensation Review to provide an understanding of the competitiveness of ConnectOne’s compensation levels for executives relative to the market and to develop an appropriate total pay structure and programs going forward; and 2. A Board of Directors Compensation Review to assess ConnectOne’s current board pay practices relative to market and best practices, and to recommend specific compensation program changes as appropriate (e.g. mix, cash vs. equity, retainer vs. meeting fee) relative to market practice and
emerging trends. Pearl Meyer & Partners is independent of ConnectOne’s management, reports directly to the Compensation Committee, and has no economic relationship with ConnectOne other than its role as advisor to the Compensation Committee. Nominating and Corporate Governance Committee. ConnectOne’s Nominating and Corporate Governance Committee is comprised of Michael Kempner (Chair), Frank Huttle and Dale Creamer. Each member of the Nominating and Corporate Governance Committee is independent as such term is
defined in the Nasdaq listing standards. The Nominating and Corporate Governance Committee met one time during 2013. The Board of Directors has adopted a written charter for the Nominating and Corporate Governance Committee which is available on ConnectOne’s website at www.cnob.com. The purpose of the Nominating and Corporate Governance Committee is to assess Board composition, size, additional skills and talents needed, and then identify and evaluate candidates and make recommendations to the ConnectOne Board regarding those assessments and/or candidates. The
Committee recommends to the ConnectOne Board the nominees for election as directors, and considers performance of incumbent directors to determine whether to nominate them for re-election. The Nominating and Corporate Governance Committee will consider qualified nominees for director
recommended by shareholders. All shareholder recommendations are evaluated on the same basis as any recommendation from members of the Board or management of the Company. Recommendations should be sent to Michael Kempner, c/o ConnectOne Bank, 301 Sylvan Avenue, Englewood Cliffs,
NJ 07632. Nominees should have a minimum of an undergraduate degree, have experience in a senior executive position in a corporate or equivalent organization, have experience in at least one facet of ConnectOne’s business or its major functions, be active in the communities in which ConnectOne
conducts business and be able to positively represent ConnecOne to its customers and potential customers. The Nominating and Corporate Goverance Committee met one time during 2013. Compensation Committee Interlocks and Insider Participation There are no compensation committee “interlocks,” which generally means that no executive officer of ConnectOne or ConnectOne Bank served as a director or member of the compensation committee of another entity, one of whose executive officers serves as a director or member of the
Compensation Committee. Board Leadership; Lead Independent Director The ConnectOne Board of Directors has appointed Mr. Sorrentino as both Chief Executive Officer and Chairman of the Board. The ConnectOne Board believes that the combination of these two roles provides more consistent communication and coordination throughout the organization, which
results in a more effective and efficient implementation of corporate strategy, and is important in unifying ConnectOne’s strategy behind a single vision. ConnectOne’s Board has also appointed Mr. Stephen Boswell, an independent director, to serve as Lead Independent Director of the ConnectOne
Board. As Lead Independent Director, Mr. Boswell presides over all ConnectOne Board meetings when the Chairman is not present, and presides over meetings of the non-management directors held in executive session. The Lead Independent Director has the responsibility of meeting and consulting
with the Chairman and Chief Executive Officer on ConnectOne Board and committee meeting agendas, acting as a liaison between management and the non-management directors, including maintaining frequent contact with the Chairman and Chief Executive and advising him on the efficiency of the
ConnectOne Board meetings, and facilitating teamwork and communication between the non-management directors and management. Risk Oversight Risk is an inherent part of the business of banking. Risks faced by ConnectOne Bank include credit risk relating to its loans and interest rate risk related to its entire balance sheet. The ConnectOne Board of Directors oversees these risks through the adoption of policies and by delegating oversight
to certain committees, including the Audit Committee and the Loan and Asset/Liability Committees of ConnectOne Bank. These committees exercise oversight by establishing a corporate environment that promotes timely and effective disclosure, fiscal accountability and compliance with all applicable
laws and regulations. Section 16(a) Beneficial Ownership Reports Compliance Section 16(a) of the Securities Exchange Act of 1934 requires ConnectOne’s officers and directors, and persons who own more than ten percent of a registered class of ConnectOne’s equity securities, to file reports of ownership and changes in ownership with the Securities and Exchange Commission.
Officers, directors and greater than ten percent stockholders are required by regulation of the Securities and Exchange Commission to furnish ConnectOne with copies of all Section 16(a) forms they file. ConnectOne believes that all persons associated with ConnectOne and subject to Section 16(a) have
made all required filings on a timely basis for the fiscal year ended December 31, 2013. 48
Item 11. Executive Compensation. The following table sets forth for the prior three years the compensation paid to ConnectOne’s Chief Executive Officer and ConnectOne’s two other most highly compensated executive officers earning in excess of $100,000 (the “named executive officers”) for the fiscal year ended December 31, 2013.
Name and principal position
Year
Salary
Bonus
Stock
Option
All
Total Frank Sorrentino III,
2013
$
475,000
$
205,000
$
205,000
—
$
17,622(1
)
$
902,622 Chairman and Chief
2012
$
410,000
$
185,000
$
92,500
$
92,500
$
15,993(1
)
$
795,993 Executive Officer
2011
$
370,000
$
164,062
$
72,187
—
$
15,000(1
)
$
621,249 William S. Burns,
2013
$
240,000
$
40,000
$
15,000
—
$
10,325
$
305,325 Chief Financial Officer
2012
$
60,000
(4)
—
$
37,057
—
$
2,271
$
99,328 Elizabeth Magennis,
2013
$
217,000
$
55,200
$
55,200
—
$
9,516
$
336,916 Chief Lending Officer
2012
$
184,000
$
42,000
$
14,000
$
14,000
$
9,158
$
263,158
2011
$
175,000
$
33,060
$
6,090
—
—
$
214,150
(1)
Represents a car allowance. (2) Awards of restricted stock were valued at the book value as of grant date, which was deemed to be fair value. (3) Represents the grant date fair value computed in accordance with FASB ASC Topic 718. (4) Mr. Burns joined ConnectOne in October, 2012 at an initial annual salary of $240,000. Employment Agreements ConnectOne and ConnectOne Bank are parties to employment agreements with Messrs Frank S. Sorrentino, III, their Chief Executive Officer, and Mr. William S. Burns, their Chief Financial Officer. The employment agreement with Mr. Sorrentino has an initial three-year term, and will automatically renew for one additional year unless any party provides written notice of its intention not to renew. Under the agreement, Mr. Sorrentino will receive an annual base salary of $475,000, subject to
increase as determined by the Board. He will also be eligible to participate in ConnectOne’s incentive plans and other benefit plans for executive officers. Under the agreement, ConnectOne or ConnectOne Bank will reimburse Mr. Sorrentino for his reasonable business expenses, and provide him with a
$1,250 monthly car allowance. In the event that Mr. Sorrentino’s employment is terminated without cause, he is entitled to receive a lump sum payment equal to the sum of (i) his then current base salary for the remaining term of the agreement, but no less than an amount equal to one year of base
salary and (ii) the greater of the highest bonus paid to him over the prior 36 months, or the amount accrued for his bonus in the year of termination. In the event of a merger, acquisition or change-in-control transaction after which Mr. Sorrentino does not continue employment at the resulting entity in
substantially the same position, under substantially the same terms and conditions under which he was employed prior to the change in control, he will receive a severance payment equal to the sum of (i) the highest annual base salary paid to him over the prior 36 month period, and (ii) the greater of
the highest bonus paid to him over the prior 36 months, or the amount accrued for his bonus in the year of termination, multiplied by two plus one twelfth for each year of service completed by Mr. Sorrentino after the effective date of his agreement, December 19, 2013. The severance benefits are
subject to reduction in the event the benefits would constitute an “excess parachute payment” under Section 280G of the Internal Revenue Code of 1986, as amended. Had a change in control occurred as of December 31, 2013, Mr. Sorrentino would have been entitled to receive severance benefits of
approximately $1,472,500. The employment agreement with Mr. Burns has an initial two-year term, and will automatically renew for one additional year unless either party provides written notice of its intention not to renew. Under the agreement, Mr. Burns will receive an annual base salary of $240,000, subject to increase as
determined by the Board. He will also be eligible to participate in ConnectOne’s bonus plan for executive officers. Mr. Burns is also entitled to participate in all benefit programs of ConnectOne and ConnectOne Bank. Under the agreement, ConnectOne or ConnectOne Bank will reimburse Mr. Burns for
his reasonable business expenses, and provide him with a $750 monthly car allowance. In the event that Mr. Burns’s employment is terminated without cause, he is entitled to receive the sum of (i) his then current annual Base Salary for the remainder of the Term (assuming there is no extension of the Term), but no less than one year of his then current Base Salary, and (ii) the
highest cash bonus paid to Mr. Burns over the prior twenty four (24) month period, or the amount accrued during the current year for Mr. Burns’ cash bonus for that year, whichever is higher. In the event a merger, acquisition or change-of-control transaction after which Mr. Burns does not continue
employment at the resulting entity, he will receive a severance payment equal to the sum of (i) his highest annual Base Salary over the prior twenty four (24) month period plus (ii) the highest cash bonus paid to him over the prior twenty four (24) month period, or the amount accrued during the current
year for his cash bonus for that year, whichever is higher, times two. The severance benefits are subject to reduction in the event the benefits would constitute an “excess parachute payment” under Section 280G of the Internal Revenue Code of 1986, as amended. Had a change in control occurred as of
December 31, 2013, he would have been entitled to receive severance benefits of approximately $696,000. 49
($)
($)
awards
($)(2)
awards
($)(3)
other
compensation
($)
($)
Agreements upon Change in Control Ms. Magennis has entered into a change of control agreement with ConnectOne. Under this agreement, in the event of a reorganization, merger, consolidation or sale of all or substantially all of the assets of ConnectOne, or any similar transaction which results in our shareholders holding less than a
majority of the voting power of the resulting entity, Ms. Magennis is to be employed by our successor for a period of twelve (12) months following the change in control. In the event she is terminated without cause, or if she resigns for certain reasons provided for in the agreement, she is entitled to the
sum of (i) the highest annual salary assigned to her by ConnectOne Bank’s Board or a duly assigned committee thereof during the twenty four months prior to the Consummation Date (as defined below) plus (ii) the highest annual bonus paid to or accrued for her over the twenty four months prior to
the Consummation Date. Had a change in control occurred as of December 31, 2013, Ms. Magennis would have been entitled to severance benefits of $311,750 (including the value of benefits to be paid). The following table sets forth the stock option awards and restricted stock awards at December 31, 2013 for each of ConnectOne’s named executive officers. Outstanding Equity Awards at Fiscal Year-End
Option awards(1)
Stock awards(1)
Number of
Number of
Option
Option
Number of
Market
Equity
Equity
Name
(#)
(#)
($)
(#)
(S)
(#)
($) (a)
(b)
(c)
(e)
(f)
(g)
(h)
(i)
(j) Frank Sorrentino III
30,000
$
10.00
6/21/2015
11,415 $
452,376
41,250
$
1,634,738
4,098
16.00
11/11/2016
10,000
16.00
1/11/2018
4,181
16.00
1/21/2018
4,508
16.00
11/11/2018
19,975
16.00
11/26/2018
4,495
16.00
1/9/2019
5,000
16.00
2/25/2019
8863
4,432
18.18
1/24/2022 William S. Burns
—
—
—
1,492
(2) $
59,178
20,625
$
817,369 Elizabeth Magennis
2,000
16.00
11/11/2016
2,784 $
110,330
13,500
$
535,005
963
12.00
1/9/2019
1322
662
18.18
1/24/2022
(1)
All option and stock awards (other than 830 restricted shares granted to Mr. Burns referenced in footnote 3) were granted subject to a three-year vesting requirement, with one-third of the award vesting on the first anniversary of the date of grant, one-third of the award vesting on the second
anniversary of the date of grant, and the final third vesting on the third anniversary of the date of grant. (2) 415 shares vest on the first anniversary of the date of grant, and an additional 415 shares vest on the second anniversary of the date of grant. 50
securities
underlying
unexercised
options
exercisable
securities
underlying
unexercised
options
unexercisable
exercise
price
expiration
date
shares
or units
of stock
that have
not vested
value of
shares
or units
of stock
that have
not vested
incentive
plan
awards:
number of
unearned
shares,
units or
other
rights
that
have not
vested
incentive
plan
awards:
market
or payout
value of
unearned
shares,
units or
other
rights
that
have
not
vested
Director Compensation The following table summarizes ConnectOne’s director compensation for the year ended December 31, 2013:
Name
Fees earned or
Option
Restricted
Total Frank Sorrentino III(1)
—
—
—
— Frank Baier
28,000
—
—
28,000 Stephen Boswell
25,900
—
—
25,900 Frank Cavuoto
25,395
—
—
25,395 Dale Creamer
24,600
—
—
24,600 Frank Huttle III
19,550
—
—
19,550 Michael Kempner
23,275
—
—
23,275 Joseph Parisi, Jr.
21,250
—
—
21,250
(1)
Mr. Sorrentino serves as an executive officer of ConnectOne, and is compensated as an employee of ConnectOne. He does not receive any additional compensation for serving on the Board of Directors. At December 31, 2013, Mr. Sorrentino held options to purchase 97,138 shares of ConnectOne
common stock.
(2)
In addition to
annual retainer and chairmanship fees, we pay the non-employee members of ConnectOne’s Board a fee of $1,000 per
Board meeting attended and $850 per ConnectOne Bank Board Committee meeting attended. On January 7, 2014 each director except
for Mr. Sorrentino was granted 458 restricted shares of ConnectOne common stock, subject to forfeiture until January
7, 2015. See the information set forth in Item 10 regarding Compensation Committee Interlocks and
Insider Participation required by Item 407(e)(4) of Regulation S-K. 51
paid in cash(2)
($)
Awards
($)
Stock
awards
($)
($)
Item 12. Security Ownership of Certain
Beneficial Owners and Management and Related Stockholder Matters. The following table sets forth information as of January 31, 2014 regarding the number of equity securities beneficially owned by all ConnectOne Directors, executive officers described in the compensation table, and by all ConnectOne Directors and executive officers as a group. Beneficial ownership
includes shares, if any, held in the name of the spouse, minor children or other relatives of the nominee living in such person’s home, as well as shares, if any, held in the name of another person under an arrangement whereby the ConnectOne Director or executive officer can vest title in himself at once
or within sixty days. Beneficially owned shares also include shares over which the named person has sole or shared voting or investment power, shares owned by corporations controlled by the named person, and shares owned by a partnership in which the named person is a partner.
Name
Common Stock
Percentage Directors Frank Sorrentino III
242,098(1
)
4.72
% Frank Baier
22,178(2
)
0.44
% Stephen Boswell
110,647(3
)
2.18
% Frank Cavuoto
84,045(4
)
1.66
% Dale Creamer
114,994(5
)
2.27
% Frank Huttle III
94,364(6
)
1.86
% Michael Kempner
155,102(7
)
3.06
% Joseph Parisi, Jr.
97,611(8
)
1.93
% Executive Officers Who Are Not Directors William S. Burns
6,644(9
)
0.13
% Elizabeth Magennis
10,689(10
)
0.21
% As a Group (12 persons)
938,372
17.69
%
(1)
Includes (i) 12,500 shares held in the name of Citigroup Global Markets f/b/o Frank Sorrentino III, IRA, (ii) 53,241 shares held in street name at Citigroup Global Markets, (iii) 2,011 shares held in trust for Mr. Sorrentino’s children, (iv) 97,138 shares purchaseable upon the exercise of stock options
and (v) 15,719 shares of restricted stock subject to forfeiture. (2) Includes 458 shares of restricted stock subject to forfeiture. (3) Includes (i) 28,682 shares purchasable upon the exercise of stock options and (ii) 458 shares of restricted stock subject to forfeiture. (4) Includes (i) 3,725 shares held in the name of Citigroup Global Markets f/b/o Frank Cavuoto, IRA, (ii) 1,500 shares held in the name of Citigroup Global Markets f/b/o Patricia Cavuoto, IRA, (iii) 31,760 shares held in the name of Mr. Cavuoto’s spouse, (iv) 25,859 shares purchasable upon the
exercise of stock options and (v) 458 shares of restricted stock subject to forfeiture. (5) Includes (i) 4,375 shares held in the name of Mr. Creamer’s wife, (ii) 18,750 shares held by Mr. Creamer as custodian for his children, (iii) 6,250 shares held in the name of River Cousins, of which Mr. Creamer’s children are part owners, (iv) 29,531 shares purchasable upon the exercise of stock
options and (v) 458 shares of restricted stock subject to forfeiture. (6) Includes (i) 14,487 shares held in the name of Citigroup Global Markets f/b/o Frank Huttle III, IRA, (ii) 3,375 shares held by Mr. Huttle and his wife in a joint tenancy, (iii) 2,500 shares held as trustee of the Francesca Huttle 2004 Family Trust, (iv) 2,500 shares held as trustee of the Alexandra
Huttle 2004 Family Trust, (v) 5,031 shares held in the name of Mr. Huttle’s spouse, (vi) 2,500 shares held by an LLC in which spouse is a member, (vii) 25,507 shares purchasable upon the exercise of stock options and (viii) 458 shares of restricted stock subject to forfeiture. (7) Includes (i) 29,531 shares purchasable upon the exercise of stock options and (ii) 458 shares of restricted stock subject to forfeiture. (8) Includes (i) 3,333 shares held in the name of Hudson Real Estate Holding, LLC, of which Mr. Parisi is managing director and owner of one-third, (ii) 11,296 shares held in the name of Otterstedt Insurance Agency, of which Mr. Parisi is part owner, (iii) 2,323 shares held by Mr Parisi as custodian for
his children, (iv) 31,508 shares held at Bear Stearns Security Corp (v) 27,326 shares purchasable upon the exercise of stock options and (vi) 458 shares of restricted stock subject to forfeiture. (9) Includes 3,810 shares of restricted stock subject to forfeiture. (10) Includes (i) 4,947 shares purchasable upon the exercise of stock options and (ii) 4,682 shares of restricted stock subject to forfeiture. There are no shareholders known to ConnectOne who beneficially own five (5%) percent or greater of ConnectOne’s common stock. 52
of Common Stock
Beneficially
Owned
Item 13. Certain Relationships and Related
Transactions, and Director Independence. ConnectOne Bank has made in the past and, assuming continued satisfaction of generally applicable credit standards, expects to continue to make loans to directors, executive officers and their associates (i.e. corporations or organizations for which they serve as officers or directors or in which they
have beneficial ownership interests of ten percent or more). These loans have all been made in the ordinary course of ConnectOne Bank’s business on substantially the same terms, including interest rates and collateral, as those prevailing at the time for comparable transactions with persons not affiliated
with ConnectOne and do not involve more than the normal risk of collectability or present other unfavorable features. ConnectOne utilizes the MWW Group to provide advertising and public relations assistance and advice. Michael Kempner, one of our directors, is the President and CEO of the MWW Group, Inc.. During 2013, 2012 and 2011, we paid the MWW Group a total of $244,000, $526,000 and $254,000,
respectively, for its services, including advertising, public relations assistance and related advice. We believe the fees charged ConnectOne Bank by the MWW Group are at least as favorable to ConnectOne Bank as ConnectOne could receive from an unaffiliated third party. ConnectOne has continued to
use the services of the MWW Group during 2014. Members of ConnectOne’s Board of Directors, including ConnectOne’s Chairman and CEO Frank Sorrentino and Messrs. Boswell, Cavuoto, Creamer, Huttle, Kempner and Parisi, are, either directly or through their interests in family limited liability companies, members of a limited liability company
that is the sole member of two other limited liability companies which each own one of ConnectOne’s branches, which are leased to ConnectOne Bank. ConnectOne’s Board members collectively own 52.4% of the membership interests in this limited liability company. Each of Messrs. Sorrentino, Huttle
III, Parisi Jr., and Kempner owns an 11.1% interest in the limited liability company. No director is the managing member or a manager or officer of any of the limited liability companies which serve as the landlords or the parent limited liability company. The lease for ConnectOne’s Cresskill branch has an initial term ending on June 30, 2026. ConnectOne Bank has the option to extend the lease term for up to three additional five-year periods, or a total of fifteen additional years. The initial rent for the branch was $157,795 per year, and the rent will
increase annually by the greater of 2.50% or the rate of increase of the consumer price index for the greater New York metropolitan area. In 2016, the rent will be reset to the greater of the prior year’s rent, or the “market rent” as defined under the lease, and will thereafter increase annually by the
greater of 2.50% or the rate of increase of the consumer price index for the greater New York metropolitan area. During any option period, the rent will be reset to the greater of the prior year’s rent or the “market rent”, as defined in the lease, and will then increase annually by the greater of 2.50% or
the rate of increase of the consumer price index for the greater New York metropolitan area. For 2013, 2012 and 2011, ConnectOne Bank paid total rent of $189,000, $184,510 and $180,529, respectively, for the Cresskill branch. The lease for ConnectOne Bank’s John Street, Hackensack branch has a term ending on December 31, 2016. ConnectOne Bank has the option to extend the lease term for up to three additional five-year periods, or a total of fifteen additional years. The initial rent for the branch was $148,000 per
year, and the rent will increase annually by the greater of 2.50% or the rate of increase of the consumer price index for the greater New York metropolitan area. During any option period, the rent will be reset to the greater of the prior year’s rent or the “market rent”, as defined in the lease, and will then increase annually by the greater of 2.50% or the rate of increase of the consumer price index for the greater New York metropolitan area. For 2013, 2012 and 2011, ConnectOne Bank
paid total rent of $200,000, $192,018 and $188,189, respectively, for the John Street, Hackensack branch. Because of the interests of Board members in these leases, the ConnectOne Board determined that the rent should be set at “fair market rent.” Under regulations of the New Jersey Department of Banking and Insurance, any real estate transaction with members of a bank’s board of directors must
be subject to an appraisal by an independent appraisal firm, which must opine that the terms of the transaction are arm’s length terms and as beneficial to ConnectOne Bank as it could obtain from a third party. ConnectOne Bank therefore retained an independent appraisal firm to review the properties
and determine the fair market rent, and this rent was used for the leases. These leases were then submitted to and approved by the New Jersey Department of Banking and Insurance. Based upon appraisals ConnectOne obtained prior to entering into each lease, ConnectOne believes the lease terms are
as fair to ConnectOne Bank as it would have received from an unaffiliated third party. See the information set forth in Item 10 regarding director independence required by item 407(a) of Regulation S-K. 53
Item 14. Principal Accounting Fees and
Services. Principal Accounting Firm Fees Aggregate fees billed to ConnectOne for the fiscal years ended December 31, 2013 and 2012 by ConnectOne’s principal accounting firm, Crowe, Horwath LLP, are shown in the following table.
Fiscal Year Ended
December 31
2013
2012 Audit Fees
$
160,000
$
125,000 Audit-Related Fees(1)
58,500
205,500 Tax Fees(2)
121,309
18,550 Total Fees
$
339,809
$
349,050
(1)
Audit-related fees of $205,500 in the fiscal year ended December 31, 2012 was for work performed in conjunction with ConnectOne’s 2013 initial public offering. Audit-related fees for the fiscal year ended December 31, 2013 were $55,500 to complete ConnectOne’s initial public offering and $3,000
relating to ConnectOne’s filing of a registration statement on Form S-8. (2) Consists of tax filing and tax related compliance and other advisory services. 54
PART IV Item 15. Exhibits, Financial
Statement Schedules. (a) Exhibits Exhibit 3(i).1 Restated Certificate of Incorporation
(1) Exhibit 3(i).2 Certificate of Amendment to the Restated
Certificate of Incorporation (1) Exhibit 3(ii) Bylaws (1) Exhibit 10.1 Employment Agreement of Frank Sorrento
III, as amended and restated on December 19, 2013 (2) Exhibit 10.2 Form of Change in Control Agreement for
Laura Criscione and Elizabeth Magennis dated December 19, 2013 (2) Exhibit 10.4 Employment Agreement with William S. Burns
dated December 19, 2013 (2) Exhibit 10.5 North Jersey Community Bank 2005 Stock
Option Plan – A (1) Exhibit 10.6 North Jersey Community Bank 2005 Stock
Option Plan – B (1) Exhibit 10.7 North Jersey Community Bank 2006 Equity
Compensation Plan (1) Exhibit 10.8 North Jersey Community Bank 2008 Equity
Compensation Plan (1) Exhibit 10.9 North Jersey Community Bank 2009 Equity
Compensation Plan (1) Exhibit 10.10 2012 Equity Compensation Plan (1) Exhibit 21 Subsidiaries of the Registrant Exhibit 23.1 Consent of Independent Registered Public Accounting Firm Exhibit 31 Rule 13a-14(a)/15d-14(a) Certifications Exhibit 32 Section 1350 Certifications 55
(1)
Incorporated by reference from the Registrant’s Registration Statement on Form S-1, as
amended, File No. 333-185979, declared effective on February 11, 2012
(2) Incorporated by reference from the Registrant’s Current Report on Form 8-k filed with the
SEC on December 20, 2013.
CONSOLIDATED FINANCIAL STATEMENTS CONTENTS
47
48
50
51
52
53
54 56
December 31, 2013 and 2012
REPORT OF INDEPENDENT REGISTERED PUBLIC ACCOUNTING FIRM The Board of Directors and Stockholders of We have audited the accompanying consolidated balance sheets of ConnectOne Bancorp, Inc. (“the Company”) as of December 31, 2013 and 2012, and the related consolidated statements of income, comprehensive income, changes in stockholders’ equity and cash flows for each of the years in the three
year period ended December 31, 2013. These financial statements are the responsibility of the Company’s management. Our responsibility is to express an opinion on these financial statements based on our audits. We conducted our audits in accordance with the standards of the Public Company Accounting Oversight Board (United States). Those standards require that we plan and perform the audit to obtain reasonable assurance about whether the financial statements are free of material misstatement. The
Company is not required to have, nor were we engaged to perform, an audit of its internal control over financial reporting. Our audit included consideration of internal control over financial reporting as a basis for designing audit procedures that are appropriate in the circumstances, but not for the
purpose of expressing an opinion on the effectiveness of the Company’s internal control over financial reporting. Accordingly, we express no such opinion. An audit includes examining, on a test basis, evidence supporting the amounts and disclosures in the financial statements. An audit also includes
assessing the accounting principles used and significant estimates made by management, as well as evaluating the overall financial statement presentation. We believe that our audits provide a reasonable basis for our opinion. In our opinion, the financial statements referred to above present fairly, in all material respects, the financial position of ConnectOne Bancorp, Inc. as of December 31, 2013 and 2012, and the results of its operations and its cash flows for each of the years in the three year period ended December 31,
2013, in conformity with U.S. generally accepted accounting principles. /s/ Crowe Horwath LLP Livingston, New Jersey 57
ConnectOne Bancorp, Inc.
Englewood Cliffs, New Jersey
March 3, 2014
ConnectOne Bancorp, Inc.
2013
2012
(dollars in thousands) ASSETS Cash and due from banks
$
2,907
$
3,242 Interest-bearing deposits with banks
31,459
47,387 Cash and cash equivalents
34,366
50,629 Securities available for sale
27,589
19,252 Securities held to maturity, fair value of $1,077 at 2013 and $2,084 at 2012
1,027
1,985 Loans held for sale
575
405 Loans receivable
1,151,904
848,842 Less: Allowance for loan losses
(15,979
)
(13,246
) Net loans receivable
1,135,925
835,596 Investment in restricted stock, at cost
7,622
4,744 Bank premises and equipment, net
7,526
7,904 Accrued interest receivable
4,102
3,361 Other real estate owned
1,303
433 Goodwill
260
260 Bank owned life insurance
15,191
— Deferred taxes
7,614
4,314 Other assets
128
1,043 Total assets
$
1,243,228
$
929,926 (Continued) 58
CONSOLIDATED BALANCE SHEETS
December 31, 2013 and 2012
See accompanying notes to consolidated financial statements.
ConnectOne Bancorp, Inc.
2013
2012
(dollars in thousands LIABILITIES AND STOCKHOLDERS’ EQUITY Liabilities Deposits Noninterest-bearing
$
216,804
$
170,355 Interest-bearing
749,003
598,963 Total deposits
965,807
769,318 FHLB borrowings
137,558
79,568 Accrued interest payable
2,762
2,803 Capital lease obligation
3,107
3,185 Other liabilities
3,866
2,690 Total liabilities
1,113,100
857,564 Commitments and Contingencies Stockholders’ Equity Preferred stock (Series A), no par value; $20 liquidation value; authorized 125,000 shares; no shares issued and outstanding at December 31, 2013 and 2012
—
— Preferred stock (Series B), no par value; $20 liquidation value; authorized no shares issued and outstanding at December 31, 2013 and 2012
—
— Preferred stock (Series C), no par value; $1,000 liquidation value; authorized 7,500 shares; no shares issued and outstanding at December 31, 2013 and 2012
—
— Common stock and Surplus, no par value; authorized 10,000,000 shares at December 31, 2013 and December 31, 2012; issued and outstanding 5,106,455 at December 31, 2013 and 3,166,217 at December 31, 2012
99,315
51,205 Retained earnings
30,931
20,661 Accumulated other comprehensive income (loss)
(118
)
496 Total stockholders’ equity
130,128
72,362 Total liabilities and stockholders’ equity
$
1,243,228
$
929,926 See accompanying notes to consolidated financial statements. 59
CONSOLIDATED BALANCE SHEETS
December 31, 2013 and 2012
except per share data)
ConnectOne Bancorp, Inc.
2013
2012
2011
(dollars in thousands, Interest income Loans receivable, including fees
$
46,405
$
39,625
$
32,113 Securities
795
1,079
1,505 Other interest income
103
83
58 Total interest income
47,303
40,787
33,676 Interest expense Deposits
4,798
4,777
4,888 Borrowings
1,489
1,349
1,121 Capital lease
189
193
198 Total interest expense
6,476
6,319
6,207 Net interest income
40,827
34,468
27,469 Provision for loan losses
4,575
3,990
2,355 Net interest income after provision for loan losses
36,252
30,478
25,114 Non-interest income Service fees
436
393
396 Gains on sales of loans
239
470
458 Gains on sales of securities
—
—
96 Income on bank owned life insurance
191
—
— Other income
336
279
163 Total non-interest income
1,202
1,142
1,113 Non-interest expenses Salaries and employee benefits
10,321
8,352
6,911 Occupancy and equipment
3,101
2,847
2,796 Professional fees
1,463
1,143
1,171 Advertising and promotion
477
489
356 Data processing
2,059
1,697
1,437 Other expenses
3,230
2,960
2,386 Total non-interest expenses
20,651
17,488
15,057 Income before income tax expense
16,803
14,132
11,170 Income tax expense
6,533
5,711
4,504 Net income
10,270
8,421
6,666 Dividends on preferred shares
—
354
600 Net income available to common stockholders
$
10,270
$
8,067
$
6,066 Earnings per common share: Basic
$
2.15
$
2.99
$
2.71 Diluted
2.09
2.63
2.18 Weighted average common shares outsanding: Basic
4,773,954
2,700,772
2,242,085 Diluted
4,919,384
3,196,558
3,063,076 See accompanying notes to consolidated financial statements. 60
CONSOLIDATED STATEMENTS OF INCOME
Years ended December 31, 2013, 2012 and 2011
except per share data)
ConnectOne Bancorp, Inc.
2013
2012
2011
(dollars in thousands) Net income
$
10,270
$
8,421
$
6,666 Unrealized losses on securities available for sale securities arising during the period
(1,026
)
(190
)
413 Reclassification adjustment for gains realized in income
—
—
(96
) Net unrealized gains/(losses)
(1,026
)
(190
)
317 Tax effect
(412
)
(76
)
126 Other comprehensive loss
(614
)
(114
)
191 Comprehensive income
$
9,656
$
8,307
$
6,857 See accompanying notes to consolidated financial statements. 61
CONSOLIDATED STATEMENTS OF COMPREHENSIVE INCOME
Years ended December 31, 2013, 2012 and 2011
ConnectOne Bancorp, Inc.
Common
Preferred
Preferred
Preferred
Retained
Accumulated
Total
(dollars in thousands) Balance at January 1, 2011
$
27,028
$
2,500
$
12,824
$
—
$
6,528
$
419
$
49,299 Net Income
—
—
—
—
6,666
—
6,666 Other comprehensive loss, net of taxes
—
—
—
—
—
191
191 Issuance of preferred stock; Series B, 59,025 shares
—
—
1,180
—
—
—
1,180 Cash dividends paid on preferred stock
—
—
—
—
(600
)
—
(600
) Equity-based compensation
121
—
—
—
—
—
121 Balance at December 31, 2011
$
27,149
$
2,500
$
14,004
$
—
$
12,594
$
610
$
56,857 Net Income
—
—
—
—
8,421
—
8,421 Other comprehensive loss, net of taxes
—
—
—
—
—
(114
)
(114
) Issuance of convertible preferred stock; Series C, 7,500 shares
—
—
—
7,500
—
—
7,500 Conversion of convertible preferred stocks to common stock
24,004
(2,500
)
(14,004
)
(7,500
)
—
—
— Cash dividends paid on preferred stock
—
—
—
—
(354
)
—
(354
) Equity-based compensation
52
—
—
—
—
—
52 Balance at December 31, 2012
51,205
—
—
—
20,661
496
72,362 Net Income
—
—
—
—
10,270
—
10,270 Other comprehensive loss, net of taxes
—
—
—
—
—
(614
)
(614
) Issuance of 1,840,000 shares, net of expenses
47,715
—
—
—
—
—
47,715 Grant of 100,238 restricted stock awards and performance units
—
—
—
—
—
—
— Equity-based compensation
395
—
—
—
—
—
395 Balance at December 31, 2013
$
99,315
$
—
$
—
$
—
$
30,931
$
(118
)
$
130,128 See accompanying notes to consolidated financial statements. 62
CONSOLIDATED STATEMENTS OF CHANGES IN STOCKHOLDERS’ EQUITY
Years ended December 31, 2013, 2012 and 2011
Stock
and Surplus
Stock,
Series A
Stock,
Series B
Stock,
Series C
Earnings
OCI
ConnectOne Bancorp, Inc.
2013
2012
2011
(dollars in thousands) Cash flows from operating activities Net income
$
10,270
$
8,421
$
6,666 Adjustments to reconcile net income to net cash provided by operating activities: Provision for loan losses
4,575
3,990
2,355 Depreciation and amortization
1,294
1,288
1,219 Net amortization of securities discounts and premiums
58
66
50 Amortization of intangible assets
—
14
14 Equity-based compensation
395
52
121 Gain on sales of securities
—
—
(96
) Proceeds from sale of loans
11,255
20,612
23,925 Originations of loans held for sale
(11,186
)
(20,407
)
(22,875
) Gain on sales of loans
(239
)
(470
)
(458
) Increase in bank owned life insurance
(191
)
—
— (Increase) decrease in provision for deferred income taxes
(2,888
)
(2,070
)
312 Increase in accrued interest receivable
(741
)
(614
)
(148
) Increase (decrease) in accrued interest payable
(41
)
853
731 Increase (decrease) in other liabilities
1,176
(10
)
563 Decrease in other assets
915
1,320
(877
) Net cash provided by operating activities
14,652
13,045
11,502 Cash flows from investing activities Net Increase in loans
(305,774
)
(220,265
)
(135,730
) Purchases of securities available for sale
(14,890
)
—
(20,984
) Purchases of securities held to maturity
—
—
(2,000
) Purchases of bank owned life insurance
(15,000
)
—
— Maturities, calls and repayments of securities
6,427
9,636
31,542 Proceeds from sales of securities available for sale
—
—
4,779 Net increase in investments in restricted stock, at cost
(2,878
)
(1,366
)
(740
) Purchases of bank premises and equipment
(916
)
(580
)
(1,351
) Net cash used in investing activities
(333,031
)
(212,575
)
(124,484
) Cash Flows From Financing Activities: Net increase in deposits
196,489
159,897
126,736 Decrease in securities sold under agreements to repurchase
—
—
(17,189
) Net change in fed funds purchased
—
—
(5,000
) Proceeds from FHLB borrowings
86,000
60,000
20,000 Repayment of FHLB borrowings
(28,010
)
(35,988
)
(5,968
) Net proceeds from initial public offering
47,715
—
— Proceeds from sale of preferred stock
—
7,500
1,180 Decrease in capital lease obligation
(78
)
(72
)
(67
) Preferred stock dividends
—
(354
)
(600
) Net cash provided by financing activities
302,116
190,983
119,092 Net decrease in cash and cash equivalents
(16,263
)
(8,547
)
6,110 Cash and cash equivalents, beginning of year
50,629
59,176
53,066 Cash and cash equivalents, end of year
$
34,366
$
50,629
$
59,176 Supplementary cash flows information: Interest paid
$
6,517
$
5,466
$
5,476 Income taxes paid
$
8,754
$
6,700
$
5,102 Supplementary information on noncash investing activities Loans transferred to other real estate owned
$
870
$
433
$
— See accompanying notes to consolidated financial statements. 63
CONSOLIDATED STATEMENTS OF CASH FLOWS
Years ended December 31, 2013, 2012 and 2011
ConnectOne Bancorp, Inc. NOTE 1—SUMMARY OF SIGNIFICANT ACCOUNTING POLICIES Nature of Operations and Principles of Consolidation: The consolidated financial statements include ConnectOne Bancorp, Inc. (“The Parent Corporation”) and its wholly owned subsidiary, ConnectOne Bank (“the Bank” and, collectively with the Parent Corporation and the Parent
Corporation’s other direct subsidiaries, “the Company.”) On October 1, 2013, the Bank formed, through a capital contribution, a real estate investment trust, ConnectOne Preferred Funding Corp. (“Funding Corp.”), to own and manage a portfolio of real estate backed loans. All significant intercompany
accounts and transactions have been eliminated in consolidation. The Company provides financial services through its offices in Bergen, Hudson, and Monmouth counties, New Jersey. Its primary deposit products are checking, savings, and term certificate accounts, and its primary lending products are residential mortgage, commercial, and installment loans.
Substantially all loans are secured by specific items of collateral including business assets, consumer assets, and commercial and residential real estate. Commercial loans are expected to be repaid from cash flow from business operations. There are no significant concentrations of loans to any one industry
or customer. However, the customers’ ability to repay their loans is dependent on the cash flows, real estate and general economic conditions in the area. Use of Estimates: To prepare financial statements in conformity with U.S. generally accepted accounting principles, management makes estimates and assumptions based on available information. These estimates and assumptions affect the amounts reported in the financial statements and
the disclosures provided, and actual results could differ. The allowance for loan losses and fair values of financial instruments are particularly subject to change. Cash Flows: Cash and cash equivalents include cash, deposits with other financial institutions with maturities of less than 90 days, and federal funds sold. Net cash flows are reported for customer loan and deposit transactions, interest bearing deposits in other financial institutions, and
federal funds purchased and repurchase agreements. Securities: Debt securities are classified as held to maturity and carried at amortized cost when management has the positive intent and ability to hold them to maturity. Debt securities are classified as available for sale when they might be sold before maturity. Equity securities with readily
determinable fair values are classified as available for sale. Securities available for sale are carried at fair value, with unrealized holding gains and losses reported in other comprehensive income, net of tax. Interest income includes amortization of purchase premium or discount. Premiums and discounts on securities are amortized on the level-yield method without anticipating prepayments, except for mortgage backed securities where prepayments are anticipated. Gains and losses on sales are recorded on
the trade date and determined using the specific identification method. Management evaluates securities for other-than-temporary impairment (“OTTI”) on at least a quarterly basis, and more frequently when economic or market conditions warrant such an evaluation. For securities in an unrealized loss position, management considers the extent and duration of the
unrealized loss, and the financial condition and near-term prospect of the issuer. Management also assesses whether it intends to sell, or it is more likely than not that it will be required to sell, a security in an unrealized loss position before recovery of its amortized cost basis. If either of the criteria
regarding intent or requirement to sell is met, the entire difference between amortized cost and fair value is recognized as impairment through earnings. For debt securities that do not meet the aforementioned criteria, the amount of impairment is split into two components as follows: 1) OTTI related to
credit loss, which must be recognized in the income statement and 2) OTTI related to other factors, which is recognized in other comprehensive income. The credit loss is defined as the difference between the present value of the cash flows expected to be collected and the amortized cost basis. For
equity securities, the entire amount of the impairment is recognized through earnings. 64
NOTES TO CONSOLIDATED FINANCIAL STATEMENTS
ConnectOne Bancorp, Inc. Loans Held for Sale: Mortgage loans originated and intended for sale in the secondary market are carried at the lower of aggregate cost or fair value, as determined by outstanding commitments from investors. Net unrealized losses, if any, are recorded as a valuation allowance and charged
to earnings. Loans are sold servicing released. Loans: Loans that management has the intent and ability to hold for the foreseeable future or until maturity or payoff are reported at the principal balance outstanding, net of deferred loan fees and costs, and an allowance for loan losses. Interest income is accrued on the unpaid principal
balance. Loan origination fees, net of certain direct origination costs, are deferred and recognized in interest income using the level-yield method without anticipating prepayments. Interest income on mortgage and commercial loans is discontinued at the time the loan is 90 days delinquent unless the loan is well-secured and in process of collection. Consumer and credit card loans are typically charged off no later than when the loan is 120 days past due. Past due status is based
on the contractual terms of the loan. In all cases, loans are placed on nonaccrual or charged-off at an earlier date if collection of principal or interest is considered doubtful. Nonaccrual loans and loans past due 90 days still on accrual include both smaller balance homogeneous loans that are collectively
evaluated for impairment and individually classified impaired loans. A loan is moved to non-accrual status in accordance with the Company’s policy, typically after 90 days of non-payment. All interest accrued but not received for loans placed on nonaccrual are reversed against interest income. Interest received on such loans is accounted for on the cash-basis or cost-recovery method, until qualifying for return to accrual. Loans are returned to accrual status when all the principal and
interest amounts contractually due are brought current and future payments are reasonably assured. Allowance for Loan Losses: The allowance for loan losses is a valuation allowance for probable incurred credit losses. Loan losses are charged against the allowance when management believes the uncollectibility of a loan balance is confirmed. Subsequent recoveries, if any, are credited to
the allowance. Management estimates the allowance balance required using past loan loss experience, the nature and volume of the portfolio, information about specific borrower situations and estimated collateral values, economic conditions, and other factors. Allocations of the allowance may be made
for specific loans, but the entire allowance is available for any loan that, in management’s judgment, should be charged off. The allowance consists of specific and general components. The specific component relates to loans that are individually classified as impaired. A loan is impaired when, based on current information and events, it is probable that the Company will be unable to collect all amounts due according to the contractual terms of the loan agreement. Loans, for which the terms have been modified, and for which the borrower is experiencing financial
difficulties, are considered troubled debt restructurings and classified as impaired. Factors considered by management in determining impairment include payment status, collateral value, and the probability of collecting scheduled principal and interest payments when due. Loans that experience insignificant payment delays and payment shortfalls generally are not classified as
impaired. Management determines the significance of payment delays and payment shortfalls on case-by-case basis, taking into consideration all of the circumstances surrounding the loan and the borrower, including the length of the delay, the reasons for the delay, the borrower’s prior payment record,
and the amount of the shortfall in relation to the principal and interest owed. Commercial, commercial construction and commercial real estate loans are individually evaluated for impairment. If a loan is impaired, a portion of the allowance is allocated so that the loan is reported, net, at the present value of estimated future cash flows using the loan’s existing rate or at the
fair value of collateral if repayment is expected solely from the collateral. Large 65
NOTES TO CONSOLIDATED FINANCIAL STATEMENTS—(Continued)
ConnectOne Bancorp, Inc. groups of smaller balance homogeneous loans, such as consumer and residential real estate loans are collectively evaluated for impairment, and accordingly, they are not separately identified for impairment disclosures. Troubled debt restructurings are separately identified for impairment disclosures and are measured at the present value of estimated future cash flows using the loan’s effective rate at inception. If a troubled debt restructuring is considered to be a collateral dependent loan, the loan is reported, net, at
the fair value of the collateral. For troubled debt restructurings that subsequently default, the Company determines the amount of reserve in accordance with the accounting policy for the allowance for loan losses. The general component covers non-impaired loans and is based on historical loss experience adjusted for current factors. The historical loss experience is determined by portfolio segment and is based on the actual loss history experienced by the Company over the most recent three years. This actual
loss experience is supplemented with other economic factors based on the risks present for each portfolio segment. These economic factors include consideration of the following: levels of and trends in delinquencies and impaired loans; levels of and trends in charge-offs and recoveries; trends in volume
and terms of loans; effects of any changes in risk selection and underwriting standards; other changes in lending policies, procedures, and practices; experience, ability, and depth of lending management and other relevant staff; national and local economic trends and conditions; industry conditions; and
effects of changes in credit concentrations. The following portfolio segments have been identified: commercial, commercial real estate, commercial construction, residential real estate, home equity and consumer loans. Restricted Stock: The Bank is a member of the Federal Home Loan Bank (“FHLB”) of New York. Members are required to own a certain amount of stock based on the level of borrowings and other factors, and may invest in additional amounts. FHLB stock is carried at cost, classified as
a restricted security, and periodically evaluated for impairment based on ultimate recovery of par value. Cash dividends on the stock are reported as income. Transfers of Financial Assets: Transfers of financial assets are accounted for as sales, when control over the assets has been relinquished. Control over transferred assets is deemed to be surrendered when the assets have been isolated from the Company, the transferee obtains the right (free
of conditions that constrain it from taking advantage of that right) to pledge or exchange the transferred assets, and the Company does not maintain effective control over the transferred assets through an agreement to repurchase them before their maturity. Foreclosed Assets: Assets acquired through deed in lieu or loan foreclosure are initially recorded at fair value less costs to sell when acquired, establishing a new cost basis. These assets are subsequently accounted for at lower of cost or fair value less estimated costs to sell. If fair value
declines subsequent to foreclosure, a valuation allowance is recorded through expense. Operating costs after acquisition are expensed. Premises and Equipment: Premises and equipment are stated at cost less accumulated depreciation. Buildings and related components are depreciated using the straight-line method with useful lives ranging from 4 to 39 years. Furniture, fixtures and equipment are depreciated using the
straight-line (or accelerated) method with useful lives ranging from 3 to 10 years. Goodwill and Other Intangible Assets: Goodwill resulting from business combinations is generally determined as the excess of the fair value of the consideration transferred, plus the fair value of any noncontrolling interests in the acquiree, over the fair value of the net assets acquired and
liabilities assumed as of the acquisition date. Goodwill and intangible assets acquired in a purchase business combination and determined to have an indefinite useful life are not amortized, but tested for impairment at least annually. The Company has selected December 31 as the date to perform the
annual impairment test. Intangible assets with definite useful lives are amortized over 66
NOTES TO CONSOLIDATED FINANCIAL STATEMENTS—(Continued)
ConnectOne Bancorp, Inc. their estimated useful lives to their estimated residual values. Goodwill is the only intangible asset with an indefinite life on our balance sheet. Stock-Based Compensation: Compensation cost is recognized for stock option, restricted stock, and performance unit awards issued to employees, based on the fair value of these awards at the date of grant. A Black-Scholes model is utilized to estimate the fair value of stock options, while
the fair value of the Company’s common stock at the award date is used for restricted stock and performance unit awards. Compensation costs related to performance unit awards are also based upon Company performance in relation to pre-established targets. Compensation cost is recognized over the
required service period, generally defined as the vesting period. Income Taxes: Income tax expense is the total of the current year income tax due or refundable and the change in deferred tax assets and liabilities. Deferred tax assets and liabilities are the expected future tax amounts for the temporary differences between carrying amounts and tax bases
of assets and liabilities, computed using enacted tax rates. A valuation allowance, if needed, reduces deferred tax assets to the amount expected to be realized. A tax position is recognized as a benefit only if it is “more likely than not” that the tax position would be sustained in a tax examination, with a tax examination being presumed to occur. The amount recognized is the largest amount of tax benefit that is greater than 50% likely of being realized on
examination. For tax positions not meeting the “more likely than not” test, no tax benefit is recorded. The company recognizes interest and/or penalties related to income tax matters in other expense. Retirement Plans: Employee 401(k) and profit sharing plan expense is the amount of matching contributions. Earnings Per Common Share: Basic earnings per common share is net income divided by the weighted average number of common shares outstanding during the period. Diluted earnings per common share include the dilutive effect of additional potential common shares issuable under
stock option plans, convertible preferred stock, and performance unit awards. Comprehensive Income: Comprehensive income consists of net income and other comprehensive income. Other comprehensive income includes unrealized gains and losses on securities available for sale which are also recognized as separate components of equity. Loan Commitments and Related Financial Instruments: Financial instruments include off-balance sheet credit instruments, such as commitments to make loans and commercial letters of credit, issued to meet customer financing needs. The face amount for these items represents the exposure
to loss, before considering customer collateral or ability to repay. Such financial instruments are recorded when they are funded. Loss Contingencies: Loss contingencies, including claims and legal actions arising in the ordinary course of business, are recorded as liabilities when the likelihood of loss is probable and an amount or range of loss can be reasonably estimated. Management does not believe there are any
such matters that will have a material effect on the financial statements. Restrictions on Cash: Cash on hand or on deposit with the Federal Reserve Bank is required to meet regulatory reserve and clearing requirements. Dividend Restriction: Banking regulations require maintaining certain capital levels and may limit the dividends paid by the Bank to the Company or by the Company to stockholders. Fair Value of Financial Instruments: Fair values of financial instruments are estimated using relevant market information and other assumptions, as more fully disclosed in a separate note. Fair value estimates involve uncertainties and matters of significant judgment regarding interest rates, 67
NOTES TO CONSOLIDATED FINANCIAL STATEMENTS—(Continued)
ConnectOne Bancorp, Inc. credit risk, prepayments, and other factors, especially in the absence of broad markets for particular items. Changes in assumptions or in market conditions could significantly affect the estimates. Segment Reporting: FASB ASC 28, “Segment Reporting,” requires companies to report certain information about operating segments. The Company is managed as one segment; a community bank. All decisions including but not limited to loan growth, deposit funding, interest rate risk,
credit risk and pricing are determined after assessing the effect on the totality of the organization. For example, loan growth is dependent on the ability of the organization to fund this growth through deposits or other borrowings. As a result, the Company is managed as one operating segment. Bank Owned Life Insurance: The Company has purchased life insurance policies on certain key executives. Bank owned life insurance is recorded at the amount that can be realized under the insurance contract at the balance sheet date, which is the cash surrender value adjusted for other
charges or other amounts due that are probable at settlement. Reclassifications: Some items in the prior year financial statements were reclassified to conform to the current presentation. Reclassifications had no effect on prior year net income or stockholders’ equity. NOTE 2—SECURITIES The amortized cost, gross unrealized gains and losses and fair value of securities available for sale at December 31, 2013 and 2012, are as follows (dollars in thousands):
Amortized
Gross
Gross
Fair December 31, 2013 Securities available for sale: U.S. Treasury securities
$
1,935
$
—
$
(132
)
$
1,803 States and political subdivisions
4,415
—
(80
)
4,335 Asset-backed securities: Residential mortgages
9,452
333
(128
)
9,657 Student loans
4,568
—
(20
)
4,548 Small business
1,414
—
(23
)
1,391 Equity securities
6,000
—
(145
)
5,855
$
27,784
$
333
$
(528
)
$
27,589 December 31, 2012 Securities available for sale: U.S. government sponsored agencies
$
1,000
$
5
$
—
$
1,005 Asset-backed securities: Residential mortgages
11,421
608
—
12,029 Equity securities
6,000
218
—
6,218
$
18,421
$
831
$
—
$
19,252 68
NOTES TO CONSOLIDATED FINANCIAL STATEMENTS—(Continued)
Cost
Unrealized
Gains
Unrealized
Losses
Value
ConnectOne Bancorp, Inc. The amortized cost, gross unrecognized gains and losses and fair value of securities held to maturity at December 31, 2013 and 2012, are as follows (dollars in thousands):
Amortized
Gross
Gross
Fair December 31, 2013 Securities held-to-maturity: Asset-backed securities—residential mortgages
$
1,027
$
50
$
—
$
1,077 December 31, 2012 Securities held-to-maturity: Asset-backed securities—residential mortgages
$
1,985
$
99
$
—
$
2,084 The amortized cost and fair value of debt securities held to maturity and available for sale at December 31, 2013, by contractual maturity, are shown below (dollars in thousands). Expected maturities may differ from contractual maturities because borrowers may have the right to call or prepay
obligations with or without call or prepayment penalties. Securities not due at a single maturity date are shown separately.
Available for Sale
Held to Maturity
Amortized
Fair
Amortized
Fair December 31, 2013 Available-for-Sale Due in under one year or less
$
1,003
$
1,003
$
1
$
1 Due after one year through five years
—
—
326
340 Due after five years through ten years
4,422
4,224
188
197 Due after ten years
6,907
6,852
512
539 Asset-backed securities—residential mortgages
9,452
9,655
—
—
$
21,784
$
21,734
$
1,027
$
1,077 For the years ended December 31, 2013 and 2012, there were no sales of available for sale securities. For the year ended December 31, 2011, there was one sale of an available for sale security which resulted in a pre-tax gain of $96,000. Securities with a carrying value of $215,000 and $322,000 at December 31, 2013 and 2012, respectively, were pledged to secure public deposits, securities sold under agreements to repurchase and for other purposes as required or permitted by law. 69
NOTES TO CONSOLIDATED FINANCIAL STATEMENTS—(Continued)
Cost
Unrealized
Gains
Unrealized
Losses
Value
Cost
Value
Cost
Value
ConnectOne Bancorp, Inc. The following table summarizes securities with unrealized losses at December 31, 2013, aggregated by major security type and length of time in a continuous unrealized loss position (dollars in thousands):
Less than 12 Months
12 Months or
Longer
Total
Fair
Unrealized
Fair
Unrealized
Fair
Unrealized December 31, 2013 Available for Sale U.S. Treasury securities
$
1,803
$
(132
)
$
—
$
—
$
1,803
$
(132
) States and political subdivisions
3,412
(80
)
—
—
3,412
(80
) Asset-backed securities— Residential mortgages
4,284
(128
)
—
—
4,284
(128
) Student loans
4,548
(20
)
—
—
4,548
(20
) Small business
1,391
(23
)
—
—
1,391
(23
) Equity securities
5,855
(145
)
—
—
5,855
(145
)
$
21,293
$
(528
)
$
—
$
—
$
21,293
$
(528
) Unrealized losses on available for sale securities have not been recognized into income because the securities are of high credit quality, management does not intend to sell and it is likely that management will not be required to sell the securities prior to their anticipated recovery, and the decline in
fair value is largely due to changes in interest rates. The fair value is expected to recover as the securities approach maturity. There were no held to maturity securities in an unrealized loss position at December 31, 2013 and 2012. There were no securities in an unrealized loss position at December 31, 2012. NOTE 3—LOANS RECEIVABLE The composition of loans receivable (which excludes loans held for sale) at December 31, 2013 and 2012, is as follows (dollars in thousands):
2013
2012 Commercial
$
203,690
$
147,455 Commercial real estate
769,121
549,218 Commercial construction
59,877
36,872 Residential real estate
85,568
82,962 Home equity
32,504
30,961 Consumer
2,340
1,801 Gross loans
1,153,100
849,269 Unearned net origination fees and costs
(1,196
)
(427
) Loans receivable
1,151,904
848,842 Less: Allowance for loan losses
(15,979
)
(13,246
) Nets loans receivable
$
1,135,925
$
835,596 The portfolio classes in the above table have unique risk characteristics with respect to credit quality:
•
The repayment of commercial loans is generally dependent on the creditworthiness and cash flow of borrowers, and if applicable, guarantors, which may be negatively impacted by adverse economic conditions. While the majority of these loans are secured, collateral type, marketing, coverage,
valuation and monitoring is not as uniform as in other portfolio classes and recovery from liquidation of such collateral may be subject to greater variability. • Payment on commercial mortgages is driven principally by operating results of the managed properties or underlying business and secondarily by the sale or refinance of such properties. 70
NOTES TO CONSOLIDATED FINANCIAL STATEMENTS—(Continued)
Value
Losses
Value
Losses
Value
Losses
ConnectOne Bancorp, Inc.
Both primary and secondary sources of repayment, and value of the properties in liquidation, may be affected to a greater extent by adverse conditions in the real estate market or the economy in general. • Properties underlying construction, land and land development loans often do not generate sufficient cash flows to service debt and thus repayment is subject to ability of the borrower and, if applicable, guarantors, to complete development or construction of the property and carry the project, often
for extended periods of time. As a result, the performance of these loans is contingent upon future events whose probability at the time of origination is uncertain. • The ability of borrowers to service debt in the residential, home equity and consumer loan portfolios is generally subject to personal income which may be impacted by general economic conditions, such as increased unemployment levels. These loans are predominately collateralized by first and/or
second liens on single family properties. If a borrower cannot maintain the loan, the Company’s ability to recover against the collateral in sufficient amount and in a timely manner may be significantly influenced by market, legal and regulatory conditions. The following table represents the allocation of allowance for loan losses and the related loans by loan portfolio segment disaggregated based on the impairment methodology at December 31, 2013 and 2012 (dollars in thousands):
Commercial
Commercial
Commercial
Residential
Home
Consumer
Unallocated
Total December 31, 2013 Allowance for loan losses: Individually evaluated for impairment
$
1,440
$
122
$
—
$
—
$
—
$
—
$
—
$
1,562 Collectively evaluated for impairment
2,998
8,622
639
1,248
698
52
160
14,417 Total
$
4,438
$
8,744
$
639
$
1,248
$
698
$
52
$
160
$
15,979 Gross loans: Individually evaluated for impairment
$
5,813
$
6,137
$
—
$
3,029
$
767
$
—
$
—
$
15,746 Collectively evaluated for impairment
197,877
762,984
59,877
82,539
31,737
2,340
—
1,137,354 Total
$
203,690
$
769,121
$
59,877
$
85,568
$
32,504
$
2,340
$
—
$
1,153,100 December 31, 2012 Allowance for loan losses: Individually evaluated for impairment
$
165
$
1,033
$
—
$
—
$
—
$
—
$
—
$
1,198 Collectively evaluated for impairment
2,237
6,712
633
1,542
617
41
266
12,048 Total
$
2,402
$
7,745
$
633
$
1,542
$
617
$
41
$
266
$
13,246 Gross loans: Individually evaluated for impairment
$
3,124
$
4,697
$
395
$
2,995
$
119
$
—
$
—
$
11,330 Collectively evaluated for impairment
144,331
544,521
36,477
79,967
30,842
1,801
—
837,939 Total
$
147,455
$
549,218
$
36,872
$
82,962
$
30,961
$
1,801
$
—
$
849,269 71
NOTES TO CONSOLIDATED FINANCIAL STATEMENTS—(Continued)
Real Estate
Construction
Real Estate
Equity
Lines of
Credit
ConnectOne Bancorp, Inc. The following table presents information related to impaired loans by class of loans as of and for the years ended December 31, 2013 and 2012 (dollars in thousands):
Unpaid
Recorded
Allowance for
Average
Interest
Cash Basis December 31, 2013 With no related allowance recorded: Commercial
$
934
$
809
$
—
$
830
$
15
$
— Commercial real estate
4,712
4,348
—
4,479
63
— Commercial construction
—
—
—
—
—
— Residential real estate
3,643
3,055
—
3,510
36
— Home equity lines of credit
771
768
—
567
7
— Consumer
—
—
—
—
—
—
10,060
8,980
—
9,386
121
— With an allowance recorded: Commercial
5,057
5,016
1,440
5,192
122
60 Commercial real estate
1,950
1,959
122
2,042
119
— Commercial construction
—
—
—
—
—
— Residential real estate
—
—
—
—
—
— Home equity lines of credit
—
—
—
—
—
— Consumer
—
—
—
—
—
—
7,007
6,975
1,562
7,234
241
60 Total
$
17,067
$
15,955
$
1,562
$
16,620
$
362
$
60 December 31, 2012 With no related allowance recorded: Commercial
$
273
$
291
$
—
$
285
$
—
$
— Commercial real estate
1,705
1,738
—
1,354
46
— Commercial construction
—
—
—
—
—
— Residential real estate
2,995
3,196
—
3,047
119
— Home equity lines of credit
119
125
—
121
7
— Consumer
—
—
—
—
—
—
5,092
5,350
—
4,807
172
— With an allowance recorded: Commercial
2,851
2,984
165
2,895
135
33 Commercial real estate
3,387
3,631
1,033
3,614
55
— Commercial construction
—
—
—
—
—
— Residential real estate
—
—
—
—
—
— Home equity lines of credit
—
—
—
—
—
— Consumer
—
—
—
—
—
—
6,238
6,615
1,198
6,509
190
33 Total
$
11,330
$
11,965
$
1,198
$
11,316
$
362
$
33 The recorded investment in loans includes accrued interest receivable and other capitalized costs such as real estate taxes paid on behalf of the borrower and loan origination fees, net. 72
NOTES TO CONSOLIDATED FINANCIAL STATEMENTS—(Continued)
Principal
Balance
Investment
Loan Losses
Allocated
Recorded
Investment
Income
Recognized
Interest
Recognized
ConnectOne Bancorp, Inc. The following tables present nonaccrual loans and loans past due over 90 days still on accrual by class of loans (dollars in thousands):
Nonaccrual
Loans Past Due
2013
2012
2013
2012 Commercial
$
3,582
$
3,124
$
—
$
— Commercial real estate
2,445
2,446
—
— Commercial construction
—
—
—
— Residential real estate
2,381
2,369
—
— Home equity lines of credit
767
—
—
— Consumer
—
—
—
— Total
$
9,175
$
7,939
$
—
$
— The following table presents past due and current loans by the loan portfolio class as of December 31, 2013 and 2012 (dollars in thousands):
30-59
60-89
90 Days
Total
Current
Total December 31, 2013 Commercial
$
—
$
—
$
634
$
634
$
203,056
$
203,690 Commercial real estate
—
—
1,394
1,394
767,727
769,121 Commercial construction
—
—
—
—
59,877
59,877 Residential real estate
—
431
1,763
2,194
83,374
85,568 Home equity lines of credit
—
—
653
653
31,851
32,504 Consumer
—
19
—
19
2,321
2,340 Total
$
—
$
450
$
4,444
$
4,894
$
1,148,206
$
1,153,100 December 31, 2012 Commercial
$
—
$
—
$
273
$
273
$
147,182
$
147,455 Commercial real estate
—
142
2,446
2,588
546,630
549,218 Commercial construction
—
—
—
—
36,872
36,872 Residential real estate
1,769
—
2,369
4,138
78,824
82,962 Home equity lines of credit
35
—
—
35
30,926
30,961 Consumer
—
—
—
—
1,801
1,801 Total
$
1,804
$
142
$
5,088
$
7,034
$
842,235
$
849,269 Troubled Debt Restructurings During the years ending December 31, 2013 and 2012, the terms of certain loans were modified as troubled debt restructurings. The modification of the terms of such loans included one or a combination of the following: a reduction of the stated interest rate of the loan; an extension of the maturity
date at a stated rate of interest lower than the current market rate for new debt with similar risk; or a permanent reduction of the recorded investment in the loan. The balance of troubled debt restructurings at December 31, 2013, consists of four loans totaling $2,934,000 that were performing at such date under their restructured terms and for which the Bank had no commitment to lend additional funds and three credits that were classified as non-accrual. The
balance of troubled debt restructurings at December 31, 2012, consists of five loans totaling $2,996,000 that were performing at such date under their restructured terms and for which the Bank has no commitment to lend additional funds and three credits that were currently classified as non- 73
NOTES TO CONSOLIDATED FINANCIAL STATEMENTS—(Continued)
Over 90 Days
Still Accruing
Days
Past Due
Days
Past Due
or Greater
Past Due
Past Due
Gross
Loans
ConnectOne Bancorp, Inc. accrual loans. The Company has allocated $43,000 of specific allocations with respect to loans whose loan terms had been modified in troubled debt restructurings as of December 31, 2013. The Company allocated $211,000 of specific allocations with respect to loans whose terms have been modified in
troubled debt restructurings as of December 31, 2012. There were no trouble debt restructurings that occurred during the year ended December 31, 2013. The following table presents loans by class modified as troubled debt restructurings that occurred during the year ended December 31, 2012 (dollars in thousands):
Number of
Pre-Modification
Post-Modification Trouble debt restructurings Commercial
2
$
3,901
$
3,901 Commercial real estate
—
—
— Commercial construction
—
—
— Residential real estate
—
—
— Home equity lines of credit
—
—
— Consumer
—
—
— Total
2
$
3,901
$
3,901 There were no troubled debt restructurings for which there was a payment default within twelve months following the modification during the years ended December 31, 2013 or 2012. A loan is considered to be in payment default once it is 90 days contractually past due under the modified terms. Credit Quality Indicators The Bank categorizes loans into risk categories based on relevant information about the quality and realizable value of collateral, if any, and the ability of borrowers to service their debts such as: current financial information, historical payment experience, credit documentation, public information,
and current economic trends, among other factors. The Bank analyzes loans individually by classifying the loans as to credit risk. This analysis is performed whenever a credit is extended, renewed or modified, or when an observable event occurs indicating a potential decline in credit quality, and no less
than annually for large balance loss. The Bank used the following definitions for risk ratings: Special Mention: Loans classified as special mention have a potential weakness that deserves management’s close attention. If left uncorrected, these potential weaknesses may result in deterioration of the repayment prospects for the loan or the Bank’s credit position at some future date. Substandard: Loans classified as substandard are inadequately protected by the current sound worth and paying capacity of the obligor or of the collateral pledged, if any. Loans so classified have a well-defined weakness or weaknesses that jeopardize the repayment and liquidation of the debt. They
are characterized by distinct possibility that the Bank will sustain some loss if the deficiencies are not corrected. Normal payment from the borrower is in jeopardy, although loss of principal, while still possible, is not imminent. Doubtful: Loans classified as doubtful have all the weaknesses inherent in those classified as Substandard, with the added characteristic that the weaknesses make collection or liquidation in
full, on the basis of currently known facts, conditions, and values, highly questionable and improbable. 74
NOTES TO CONSOLIDATED FINANCIAL STATEMENTS—(Continued)
Loans
Outstanding
Recorded
Investment
Outstanding
Recorded
Investment
ConnectOne Bancorp, Inc. The following table presents the risk category of loans by class of loans based on the most recent analysis performed as of December 31, 2013 and 2012 (dollars in thousands):
Credit Risk Profile by
Pass
Special Mention
Substandard
Doubtful
Total December 31, 2013 Commercial
$
184,340
$
14,377
$
4,973
$
—
$
203,690 Commercial real estate
755,533
1,947
11,641
—
769,121 Commercial construction
59,877
—
—
—
59,877 Total
$
999,750
$
16,324
$
16,614
$
—
$
1,032,688 December 31, 2012 Commercial
$
131,887
$
11,733
$
3,835
$
—
$
147,455 Commercial real estate
529,453
6,602
13,163
—
549,218 Commercial construction
35,985
—
887
—
36,872 Total
$
697,325
$
18,335
$
17,885
$
—
$
733,545 Residential real estate, home equity lines of credit, and consumer loans are not rated. The Company evaluates credit quality of those loans by aging status of the loan and by payment activity, which was previously presented. 75
NOTES TO CONSOLIDATED FINANCIAL STATEMENTS—(Continued)
Internally Assigned Grades
ConnectOne Bancorp, Inc. The following table presents the activity in the Company’s allowance for loan losses by class of loans (dollars in thousands):
Commercial
Commercial
Commercial
Residential
Home Equity
Consumer
Unallocated
Total Allowance for loan losses: Beginning balance at January 1, 2013
$
2,402
$
7,745
$
633
$
1,542
$
617
$
41
$
266
$
13,246 Charge-offs
—
(1,058
)
—
(594
)
(188
)
(2
)
—
(1,842
) Recoveries
—
—
—
—
—
—
—
— Provision for loan losses
2,036
2,057
6
300
269
13
(106
)
4,575 Total ending balance at December 31, 2013
$
4,438
$
8,744
$
639
$
1,248
$
698
$
52
$
160
$
15,979 Allowance for loan losses: Beginning balance at January 1, 2012
$
653
$
5,658
$
447
$
2,517
$
339
$
3
$
—
$
9,617 Charge-offs
(115
)
(109
)
(16
)
(153
)
—
—
—
(393
) Recoveries
—
—
—
—
—
32
—
32 Provision for loan losses
1,864
2,196
202
(822
)
278
6
266
3,990 Total ending balance at December 31, 2012
$
2,402
$
7,745
$
633
$
1,542
$
617
$
41
$
266
$
13,246 Allowance for loan losses: Beginning balance at January 1, 2011
$
634
$
2,902
$
808
$
2,773
$
292
$
5
$
—
$
7,414 Charge-offs
—
—
—
(90
)
—
(62
)
—
(152
) Recoveries
—
—
—
—
—
—
—
— Provision for loan losses
19
2,756
(361
)
(166
)
47
60
—
2,355 Total ending balance at December 31, 2011
$
653
$
5,658
$
447
$
2,517
$
339
$
3
$
—
$
9,617 NOTE 4—BANK PREMISES AND EQUIPMENT The components of premises and equipment at December 31, 2013 and 2012, are as follows (dollars in thousands):
2013
2012 Building
$
3,422
$
3,422 Leasehold improvements
6,356
5,933 Furniture, fixtures and equipment
3,279
2,897 Computer equipment and data processing software
2,069
1,970 Vehicles
164
152
15,290
14,374 Less: Accumulated depreciation and amortization
(7,764
)
(6,470
)
$
7,526
$
7,904 Depreciation expense amounted to $1,294,000, $1,288,000 and $1,219,000 for the years ended December 31, 2013, 2012 and 2011, respectively. Capital Leases: The Company has entered into a lease agreement for a building under a capital lease. The lease arrangement requires monthly payments through 2028. 76
NOTES TO CONSOLIDATED FINANCIAL STATEMENTS—(Continued)
Real Estate
Construction
Real Estate
Lines of Credit
ConnectOne Bancorp, Inc. The Company has included these leases in premises and equipment as follows (dollars in thousands):
2013
2012 Building
$
3,422
$
3,422 Accumulated depreciation
(856
)
(684
)
$
2,566
$
2,738 The following is a schedule by year of future minimum lease payments under the capitalized lease, together with the present value of net minimum lease payments at December 31, 2013 (dollars in thousands): 2014
$
291 2015
291 2016
292 2017
292 2018
294 Thereafter
3,340 Total minimum lease payments
4,800 Less amount representing interest
1,693 Present value of net minimum lease payments
$
3,107 Operating Leases: The Company leases certain branch properties under operating leases. Rent expense was $1,040,000, $1,031,000 and $899,000 for the years ended December 31, 2013, 2012 and 2011, respectively. Rent commitments, before considering renewal options that generally are present were
as follows at December 31, 2013 (dollars in thousands): 2014
$
992 2015
1,008 2016
885 2017
533 2018
467 Thereafter
494
$
4,379 NOTE 5—DEPOSITS The components of deposits at December 31, 2013 and 2012 are as follows (dollars in thousands):
2013
2012 Demand, non-interest bearing
$
216,804
$
170,355 Demand, interest-bearing & NOW
71,421
57,198 Money market accounts
192,552
193,600 Savings
69,319
72,693 Time, $100 and over
219,302
195,088 Time, other
196,409
80,384
$
965,807
$
769,318 77
NOTES TO CONSOLIDATED FINANCIAL STATEMENTS—(Continued)
ConnectOne Bancorp, Inc. At December 31, 2013, the scheduled maturities of time deposits are as follows (dollars in thousands): 2014
$
278,344 2015
35,221 2016
45,480 2017
29,141 2018
27,525
$
415,711 At December 31, 2013 and 2012, the Company had $103,573,000 and $29,298,000 of brokered certificates of deposit, respectively. NOTE 6—FHLB BORROWINGS The components of FHLB borrowings are as follows (dollars in thousands): December 31, 2013
December 31, 2012 Maturity
Interest
Outstanding
Maturity
Interest
Outstanding 01/03/14
0.37
%
$
15,000
03/11/13
1.16
%
$ 5,000 05/12/14
2.44
10,000
07/22/13
1.47
2,000 08/05/14
1.08
3,000
05/12/14
2.44
10,000 09/08/14
0.28
5,000
08/05/14
1.08
3,000 02/23/15
0.88
10,000
02/23/15
0.88
10,000 05/07/15
0.81
15,000
05/07/15
0.81
15,000 05/11/15
2.17
1,558
05/11/15
2.91
5,000 05/11/15
2.91
5,000
05/11/15
2.17
2,568 08/05/15
1.49
2,000
08/05/15
1.49
2,000 08/03/16
1.93
10,000
08/03/16
1.93
10,000 08/26/16
1.04
5,000
04/02/18
2.51
2,500 10/11/16
1.15
5,000
04/02/18
1.98
7,500 07/18/17
1.29
5,000
07/16/18
2.99
5,000 09/25/17
1.41
11,000
04/02/18
2.51
2,500
$79,568 04/02/18
1.98
7,500 07/16/18
2.99
5,000 10/23/18
1.68
10,000 11/19/18
1.68
10,000
$
137,558 Except as noted in the following sentences, each advance is payable at its maturity date, with a prepayment penalty of fixed rate advances. Three of the FHLB notes ($2,500,000 and $7,500,000 each due April 2, 2018, and $5,000,000 due July 16, 2018) contain a convertible option which allows the FHLB, at quarterly intervals, to convert the fixed convertible advance into replacement funding for the same or lesser principal based on any
advance then offered by the FHLB at their current market rate. The Company has the option to repay these advances, if converted, at par. The advances were collateralized by and $330,100,000 and $341,412,000 and of commercial mortgage loans, net of required over-collateralization amounts, under a
blanket lien arrangement at December 31, 2013 and 2012, respectively. 78
NOTES TO CONSOLIDATED FINANCIAL STATEMENTS—(Continued)
Date
Rate
Date
Rate
ConnectOne Bancorp, Inc. NOTE 7—STOCKHOLDERS’ EQUITY In September 2009, the Company completed its offering of Series A preferred stock and issued 125,000 shares of Series A preferred at $20 per share for net proceeds of $2,500,000. The Series A shares had no right to require the Company to redeem the shares. The Series A shares were entitled to
receive their liquidation preference before any distribution is made on common stock. The shares were convertible after the third anniversary of issuance by the holder or the Company to that number of common shares equal to the liquidation preference divided by the then current tangible book value
per common share of stock. The Series A shares voted together with the common stock and are entitled to noncumulative dividends at the Prime Rate, as reported in the Wall Street Journal, plus 1.5% reset quarterly, with a floor of 4.75%. Dividends were payable only when declared by the Board of
Directors. In December of 2009, the Company completed its first offering of Series B preferred stock and issued 400,000 shares at $20 per share for net proceeds of $8,000,000. The Series B shares had substantially the same rights as the Series A shares with a few differences. The Series B shares were
convertible after the third anniversary of issuance by the holder or the Company to the number of common shares equal to the stated value of the shares divided by one-and-a-half times the then book value per share of the Company’s common stock upon 60 days’ notice. The Series B shares were non-
voting and entitled to a 4% non-cumulative dividend for the first year and non-cumulative dividends after the first year at the Prime Rate with a maximum dividend rate of 7%. The Series B shares ranked pari passu with the Series A shares. In January of 2010, the Company completed another offering of Series B preferred stock and issued 50,200 shares at $20 per share for net proceeds of $1,004,000. In December of 2010, the Company completed a third offering of Series B preferred stock and issued 190,975 shares at $20 per share for net proceeds of $3,820,000. In January of 2011, the Company completed another offering of Series B preferred stock and issued 59,025 shares at $20 per share for net proceeds of $1,180,000. In March of 2012 the Company completed its first offering of Series C preferred stock and issued 7,500 shares at $1,000 per share for net proceeds of $7,500,000. The Shares did not bear voting rights, except in certain circumstances required by law, and were entitled to non-cumulative dividends at a
variable rate equal to the prime rate as reported in the Wall Street Journal from time to time, with a maximum dividend rate of 7% per annum. In addition, the Shares were convertible into shares of our common stock at the election of the holder, and the Company could require conversion of the
Shares into shares of our common stock, any time, at a ratio equal to the purchase price ($1,000) divided by the product of 1.25 multiplied by the then current book value per share of our common stock. The series C shares ranked pari passu with Series A and B shares. During 2012, the Series A preferred shares were converted into 127,676 common shares at an average conversion price of $19.58, the Series B preferred shares were converted into 475,857 common shares at an average conversion price of $29.44, and the Series C preferred shares were converted into
306,388 common shares at an average price of $24.48. On February 11, 2013, the company completed its initial public offering and issued 1,840,000 shares of common stock at $28 per share for net proceeds, after expenses of $3.8 million, of approximately $47.7 million. NOTE 8—STOCK OPTION PLANS AND EQUITY COMPENSATION PLAN In 2005, the Company adopted two stock option plans that were approved by stockholders on April 29, 2005. The 2005 A Stock Option Plan provides for granting of stock options to directors and employees to purchase up to 120,000 shares. The determination of the recipients of these 79
NOTES TO CONSOLIDATED FINANCIAL STATEMENTS—(Continued)
ConnectOne Bancorp, Inc. options and the vesting of these options is at the discretion of the Board of Directors. The shares granted under this plan may be either non-qualified options or “incentive stock options,” which are subject to the limitations under Section 422 of the Internal Revenue Code. Under this plan, “incentive
stock options” must have an exercise price of no less than 100% of the fair market value of the common stock on the date of grant, and non-qualified options may have an exercise price to be determined by the Board of Directors at grant, but no less than 85% of the fair market value of the common
stock on the date of grant. The 2005 B Stock Option plan permits grants of options to directors and employees to purchase up to 60,000 shares of common stock. The terms of this plan are substantially the same as the A Plan, with the exception that under the B Stock Option Plan, only non-qualified options may be granted. In 2006, the Company adopted the 2006 Equity Compensation Plan. This plan provides for granting of 45,300 stock options or restricted stock awards to directors and employees. The determination of the recipients of the equity compensation and the related vesting is at the discretion of the Board of
Directors. Stock options granted under this plan may be either non-qualified options or “incentive stock options,” which are subject to the limitations under Section 422 of the Internal Revenue Code. Under this plan, the non-qualified options and “incentive stock options” must have an exercise price of
no less than 100% of the fair market value of the common stock on the date of grant. In 2008, the Company adopted the 2008 Equity Compensation Plan. The plan provides for granting of 108,099 stock options or restricted awards to directors and employees. The determination of the recipients of the equity compensation and the related vesting is at the discretion of the Board of
Directors. Stock options granted under this plan may be either non-qualified options or “incentive stock options,” which are subject to the limitations under Section 422 of the Internal Revenue Code. Under this plan, the non-qualified options and “incentive stock options” must have an exercise price of
no less than 100% of the fair market value of the common stock on the date of grant. In 2009, the Company adopted the 2009 Equity Compensation Plan. The plan provides for granting of 111,113 stock options or restricted awards to directors and employees. The determination of the recipients of the equity compensation and the related vesting is at the discretion of the Board of
Directors. Stock options granted under this plan may be either non-qualified or incentive stock options, which are subject to the limitations under Section 422 of the Internal Revenue Code. Under this plan, the non-qualified options must have an exercise price of no less than 100% of the fair market
value of the common stock on the date of grant. In 2012, the Company adopted the 2012 Equity Compensation Plan. The plan provides for granting of 125,000 stock options, restricted awards or performance units, or any combination thereof, to directors, employees, members of any advisory committee or any other service provider to the Company.
The determination of the recipients of awards, the types of awards granted and the specific terms of each award is at the discretion of the Compensation Committee of the Board of Directors, subject to the terms of the Plan. Stock options granted under this plan may be either non-qualified or incentive
stock options, which are subject to the limitations under Section 422 of the Internal Revenue Code. Under this plan, the non-qualified options must have an exercise price of no less than 100% of the fair market value of the common stock on the date of grant. The fair value of each option award is estimated on the date of grant using a closed form option valuation (Black-Scholes) model. Expected volatilities are based on estimated historical volatilities of the Company’s common stock. The expected term of options granted is based on historical data and
represents the period of time that options granted are expected to be outstanding, which takes into account that the options are not transferable. The risk-free interest rate for the expected term of the option is based on the U.S. Treasury yield curve in effect at the 80
NOTES TO CONSOLIDATED FINANCIAL STATEMENTS—(Continued)
ConnectOne Bancorp, Inc. time of the grant. The fair value of stock options granted during 2012 was $4.94 on the date of grant using the Black-Scholes option pricing model with the following assumptions for 2012: stock price volatility of 27.63%, risk free interest rate of .84%, 0% dividend rate and expected life of 5.5 years. No
options were granted in 2011. At December 31, 2013, there were 106,985 options available for grants under the plans. A summary of the activity in the stock option plan for 2013 follows:
Shares
Weighted
Weighted
Aggregate Oustanding at beginning of year
300,438
$
12.32 Granted
—
— Exercised
—
— Forfeited
—
— Expired
—
— Oustanding at end of year
300,438
$
12.32
$
3.40
$
8,202,320 Fully vested and expected to vest
300,438
$
12.32
$
3.40
$
8,202,320 Exercisable at end of year
286,687
$
12.04
$
3.18
$
7,911,794 As of December 31, 2013 and 2012, there was zero unrecognized compensation cost related to nonvested stock options granted under the Plan. Aggregate intrinsic value is based on $39.63, which was the closing market price of our common stock at December 31, 2013. There were no stock options
granted in 2013 and 2012. There were no material expenses related to vesting of stock options in 2013 and 2012. In conjunction with the plans above, the Company granted restricted shares to certain executive officers. Compensation expense is recognized over the vesting period of the awards based on the fair value of the stock at issue date. The fair value of the stock granted prior to our IPO was based on the
book value of stock on the date of the grant. The fair value of the stock granted after our IPO was based on the closing market price of our common stock as of the grant date. Generally, grants of restricted shares vest one-third, each, on the first, second and third anniversaries of the grant date. A summary of changes in the Company’s nonvested restricted shares for the year ended December 31, 2013 follows:
Nonvested Shares
Shares
Weighted- Nonvested at December 31, 2012
10,075
$
18.26 Granted
14,925
22.76 Vested
(5,725
)
17.73 Forfeited
—
— Nonvested at December 31, 2013
19,275
$
21.90 As of December 31, 2013, there was $289,000 of total unrecognized compensation cost related to nonvested shares granted under the plans. The cost is expected to be recognized over a weighted average period of 12.1 months. The total fair value of shares vested during year ended December 31, 2013 and
2012, was $152,000 and 42,000, respectively. There were no material expenses related to vesting of restricted stock expense in 2013 or 2012. 81
NOTES TO CONSOLIDATED FINANCIAL STATEMENTS—(Continued)
Average
Exercise
Price
Average
Remaining
Contractual
Term (Years)
Intrinsic
Value
Average
Grant-Date
Fair Value
ConnectOne Bancorp, Inc. On August 7, 2013, the Company granted to various key employees performance unit awards, with each unit entitling the holder to one share of the Company’s common stock contingent upon the Company meeting or exceeding certain return on asset targets over the course of a three-year period
commencing July 1, 2013. Under the agreement, and assuming the Company has met or exceeded the applicable targets, grants of performance unit awards will vest one-third, each, on the third, fourth and fifth anniversaries of the grant date. At December 31, 2013, the specific number of shares related to
performance unit awards that were expected to vest was 85,313, determined by actual performance in consideration of the established range of the performance targets, which is consistent with the level of expense currently being recognized over the vesting period. Should this expectation change, additional
compensation expense could be recorded in future periods or previously recognized expense could be reversed. The maximum amount of performance unit awards is 102,375. A summary of the status of unearned performance unit awards and the change during the period is presented in the table below:
Shares
Weighted- Unearned at December 31, 2012
—
$
— Awarded
85,313
32.35 Forfeited
—
— Expired
—
— Unearned at December 31, 2013
85,313
$
32.35 The company recognized $253,000 in stock-based compensation expenses for services rendered for the year ended December 31, 2013. At December 31, 2013, compensation cost of $2,506,000 related to nonvested awards not yet recognized is expected to be recognized over a weighted-average period
of 3.5 years. NOTE 9—INCOME TAXES The components of income tax expense for the years ended December 31, 2013, 2012 and 2011 are as follows (dollars in thousands):
2013
2012
2011 Current expense Federal
$
7,773
$
5,931
$
3,224 State
1,648
1,850
968 Deferred expense (benefit) Federal
(2,288
)
(1,558
)
231 State
(600
)
(512
)
81
$
6,533
$
5,711
$
4,504 82
NOTES TO CONSOLIDATED FINANCIAL STATEMENTS—(Continued)
Average
Grant-Date
Fair Value
ConnectOne Bancorp, Inc. A reconciliation of the statutory federal income tax to the income tax expense included in the statements of income for the years ended December 31, 2013, 2012 and 2011 is as follows (dollars in thousands):
2013
2012
2011 Income before income tax expense
$
16,803
$
14,132
$
11,170 Federal statutory rate
35
%
34
%
34
% Federal income tax at statutory rate
$
5,881
$
4,805
$
3,798 State income taxes, net of federal benefit
681
883
693 Change in cash surrender value of bank-owned life insurance
67
—
— Tax-exempt interest income, net
(6
)
—
— Non-deductible expenses and other
(90
)
23
13
$
6,533
$
5,711
$
4,504 The components of the net deferred tax asset at the years ended December 31, 2013 and 2012 are as follows (dollars in thousands): Deferred tax assets: Allowance for loan losses
$
6,527
$
5,253 Equity based compensation
291
185 Deferred loan fees
488
171 Accrued compensation
433
— Nonaccrual loan interest income
113
— Unrealized loss on available for sale securities
77
— Other
98
88 Total deferred tax assets
8,027
5,697 Deferred tax liabilities Premises and equipment
221
802 Section 481 adjustment
169
134 Unrealized gain on securities available for sale
—
335 Other
23
112
413
1,383 Net deferred tax asset
$
7,614
$
4,314 Based upon the level of historical taxable income, management believes it is more likely than not that the Company will realize the benefits of these deductible differences. At December 31, 2013 and 2012, the Company had no unrecognized tax benefits. The Company does not expect the total amount of unrecognized tax benefits to significantly increase within the next twelve months. The Company’s policy is to account for interest as a component of interest expense
and penalties as a component of other expense. There was no amount of interest and penalties recorded in the income statement for the years ended December 31, 2013, 2012 and 2011. The Company and its subsidiary are subject to U.S. federal income tax as well as income tax of the State of New Jersey. The Company is no longer subject to examination by taxing authorities for years before 2010. 83
NOTES TO CONSOLIDATED FINANCIAL STATEMENTS—(Continued)
ConnectOne Bancorp, Inc. NOTE 10—TRANSACTIONS WITH EXECUTIVE OFFICERS, DIRECTORS AND PRINCIPAL STOCKHOLDERS Loans to principal officers, directors, and their affiliates during the years ended December 31, 2013 and 2012, were as follows (dollars in thousands):
2013
2012 Beginning balance
$
22,185
$
22,984 New loans
2,560
8,162 Repayments
(1,423
)
(8,961
) Ending balance
$
23,322
$
22,185 Deposits from principal officers, directors, and their affiliates at December 31, 2013 and 2012, were $34,620,000 and $26,475,000, respectively. The Company has had, and may be expected to have in the future, banking transactions in the ordinary course of business with its executive officers, directors, principal stockholders, their immediate families and affiliated companies (commonly referred to as related parties). The company also leases
branch facilities from related party entities. Total expenses to these entities were $570,000, $538,000 and $436,000 for the years ended December 31, 2013, 2012 and 2011, respectively. The Company also utilizes an advertising and public relations agency at which one of the Company’s directors is President
and CEO and a principal owner. Advertising expenses with this agency were $244,000, $526,000 and $259,000 for the years ended December 31, 2013, 2012 and 2011, respectively. Advertising expenses with this agency declined year over year primarily due to the Company being billed directly from third-
party media vendors in 2013 that were previously billed on a pass-through basis. In addition, 2012 expenses included costs affiliated with the re-branding of the Company. NOTE 11—FINANCIAL INSTRUMENTS WITH OFF-BALANCE SHEET RISK The Company is a party to financial instruments with off-balance sheet risk in the normal course of business to meet the financing needs of its customers. These financial instruments include commitments to extend credit. Such commitments involve, to varying degrees, elements of credit and interest
rate risk in excess of the amount recognized in the balance sheet. The Company’s exposure to credit loss in the event of nonperformance by the other party to the financial instrument for commitments to extend credit is represented by the contractual amount of those instruments. The Company uses the same credit policies in making commitments and conditional
obligations as it does for on-balance sheet instruments. The contract or notional amount of financial instruments where contract amounts represent credit risk at December 31, 2013 and 2012, are as follows (dollars in thousands):
2013
2012 Commitments to grant loans
$
243,600
$
90,858 Unused lines of credit
35,073
38,365 Standby letters of credit
2,222
1,696 Commitments to extend credit are agreements to lend to a customer as long as there is no violation of any condition established in the contract. Since many of the commitments are expected to expire without being drawn upon, the total commitment amounts do not necessarily represent future cash
requirements. Commitments generally have fixed expiration dates or other termination clauses and may require payment of a fee. The Company evaluates each customer’s credit worthiness on a case-by-case basis. The amount of collateral obtained, if deemed necessary by the Company upon extension of
credit, is based on management’s credit evaluation. Collateral held 84
NOTES TO CONSOLIDATED FINANCIAL STATEMENTS—(Continued)
ConnectOne Bancorp, Inc. varies but may include personal or commercial real estate, accounts receivable, inventory and equipment. Outstanding letters of credit written are conditional commitments issued by the Company to guarantee the performance of a customer to a third party. The majority of these standby letters of credit expire within the next twelve months. The credit risk involved in issuing letters of credit is essentially
the same as that involved in extending other loan commitments. The Company requires collateral supporting these letters of credit as deemed necessary. The current amount of the liability as of December 31, 2013 and 2012, for guarantees under standby letters of credit issued was not material. NOTE 12—REGULATORY MATTERS The Company and Bank are subject to various regulatory capital requirements administered by the federal banking agencies. Failure to meet the minimum capital requirements can initiate certain mandatory and possibly additional discretionary-actions by regulators that, if undertaken, could have a
direct material effect on the Company’s and Bank’s financial statements. Under capital adequacy guidelines and the regulatory framework for prompt corrective action, the Company and Bank must meet specific capital guidelines that involve quantitative measures of the Company’s and Bank’s assets,
liabilities and certain off-balance sheet items as calculated under regulatory accounting practices. The Company’s and Bank’s capital amounts and classification are also subject to qualitative judgments by the regulators about components, risk-weightings and other factors. Quantitative measures established by regulation to ensure capital adequacy require the Bank and the Company to maintain minimum amounts and ratios (set forth below) of total and Tier 1 capital (as defined in the regulations) to risk-weighted asset and of Tier 1 capital to average assets.
Management believes, as of December 31, 2013 and 2012, that the Company and the Bank meet all capital adequacy requirements to which they are subject. At year-end 2013 and 2012, the most recent regulatory notifications categorized the Bank as well capitalized under the regulatory framework for
prompt corrective action. There are no conditions or events since that notification that management believes have changed the institutions category. 85
NOTES TO CONSOLIDATED FINANCIAL STATEMENTS—(Continued)
ConnectOne Bancorp, Inc. Actual and required capital and ratios are presented below for December 31, 2013 and 2012 (dollars in thousands):
Actual
For Capital
To Be Well
Amount
Ratio
Amount
Ratio
Amount
Ratio December 31, 2013 Total capital to risk-weighted assets: Company
$
143,912
12.91
%
$
89,059
8.0
%
N/A
N/A Bank
143,574
12.88
89,059
8.0
$
111,323
10.0
% Tier 1 capital to risk-weighted assets: Company
129,986
11.68
44,529
4.0
N/A
N/A Bank
129,648
11.65
44,529
4.0
66,794
6.0 Tier 1 capital to total assets: Company
129,986
10.74
48,429
4.0
N/A
N/A Bank
129,648
10.71
48,429
4.0
60,537
5.0 December 31, 2012 Total capital to risk-weighted assets: Company
$
81,282
10.52
%
$
61,835
8.0
%
N/A
N/A Bank
81,262
10.51
61,835
8.0
$
77,294
10.0
% Tier 1 capital to risk-weighted assets: Company
71,576
9.26
30,918
4.0
N/A
N/A Bank
71,556
9.26
30,918
4.0
46,376
6.0 Tier 1 capital to total assets: Company
71,576
7.84
36,498
4.0
N/A
N/A Bank
71,556
7.84
36,498
4.0
45,623
5.0 The Bank is subject to certain regulatory restrictions on the amount of dividends that it may declare to the parent corporation without regulatory approval. NOTE 13—FAIR VALUE MEASUREMENTS AND FAIR VALUE OF FINANCIAL INSTRUMENTS Management uses its best judgment in estimating the fair value of the Company’s financial instruments; however, there are inherent weaknesses in any estimation technique. The estimated fair value amounts have been measured as of December 31, 2013 and 2012, and have not been re-evaluated or
updated for purposes of these consolidated financial statements subsequent to those respective dates. As such, the estimated fair values of these financial instruments subsequent to the respective reporting dates may be different than the amounts reported at each year end. Fair value is the exchange price that would be received for an asset or paid to transfer a liability (exit price) in the principal or most advantageous market for the asset or liability in an orderly transaction between market participants on the measurement date. There are three levels of inputs that
may be used to measure fair values: Level 1: Quoted prices (unadjusted) for identical assets or liabilities in active markets that the entity has the ability to access as of the measurement date. Level 2: Significant other observable inputs other than Level 1 prices such as quoted prices for similar assets or liabilities; quoted prices in markets that are not active; or other inputs that are observable or can be corroborated by observable market data. 86
NOTES TO CONSOLIDATED FINANCIAL STATEMENTS—(Continued)
Adequacy
Requiremnts
Capitalized
Under
Prompt
Corrective
Action
Provisions
ConnectOne Bancorp, Inc. Level 3: Significant unobservable inputs that reflect a reporting entity’s own assumptions about the assumptions that market participants would use in pricing an asset or liability. The Company used the following methods and significant assumptions to estimate fair value: An asset’s or liability’s level within the fair value hierarchy is based on the lowest level of input that is significant to the fair value measurement. Investment Securities: The fair values for investment securities are determined by quoted market prices, if available (Level 1). For securities where quoted prices are not available, fair values are calculated based on market prices of similar securities (Level 2). For securities where quoted
prices or market prices of similar securities are not available, fair values are calculated using discounted cash flows or other market indicators (Level 3). Discounted cash flows are calculated using spread to swap and LIBOR curves that are updated to incorporate loss severities, volatility, credit spread and
optionality. During times when trading is more liquid, broker quotes are used (if available) to validate the model. Rating agency and industry research reports as well as defaults and deferrals on individual securities are reviewed and incorporated into the calculations. Impaired Loans: The fair value of impaired loans with specific allocations of the allowance for loan losses is generally based on recent real estate appraisals. These appraisals may utilize a single valuation approach or a combination of approaches including comparable sales and the income
approach. Adjustments are routinely made in the appraisal process by the independent appraisers to adjust for differences between the comparable sales and income data available. Such adjustments are usually significant and typically result in a Level 3 classification of the inputs for determining fair value. 87
NOTES TO CONSOLIDATED FINANCIAL STATEMENTS—(Continued)
ConnectOne Bancorp, Inc. NOTE 13—FAIR VALUE MEASUREMENTS AND FAIR VALUE OF FINANCIAL INSTRUMENTS For financial assets measured at fair value on a recurring basis, the fair value measurements by level within the fair value hierarchy used at December 31, 2013 and 2012 are as follows (dollars in thousands): Assets and Liabilities Measured on a Recurring Basis
Fair Value Measurements Using
Quoted Prices
Significant
Significant December 31, 2013 Securities: U.S. Treasury securities
$
1,803
$
—
$
— States and political subdivisions
—
4,335
— Asset-backed securities: Residential mortgages
—
9,657
— Student loans
—
4,548
— Small business
—
1,391 Equity securities
—
5,855
— December 31, 2012 Securities: U.S. government sponsored agencies
$
—
$
1,005
$
— Asset-backed securities: Residential mortgages
—
12,029
— Equity securities
—
6,218
— Assets and Liabilities Measured on a Non-recurring Basis Assets measured at fair value on a non-recurring basis are summarized below (dollars in thousands):
Fair Value Measurements Using
Quoted Prices
Significant
Significant December 31, 2013 Impaired loans: Commercial real estate
$
—
$
—
$
1,828 Commercial
—
—
1,865 December 31, 2012 Impaired loans: Commercial real estate
$
—
$
—
$
2,354 As of December 31, 2013, impaired loans, which have a specific reserve and are measured for impairment using the fair value of the collateral, had an unpaid principal balance of $4,725,000 with a valuation allowance of $1,032,000, resulting in an additional provision for loan losses of $794,000 for the
year ended December 31, 2013. 88
NOTES TO CONSOLIDATED FINANCIAL STATEMENTS—(Continued)
in Active
Markets for
Identical Assets
(Level 1)
Other
Observable
Inputs
(Level 2)
Unobservable
Inputs
(Level 3)
in Active
Markets for
Identical Assets
(Level 1)
Other
Observable
Inputs
(Level 2)
Unobservable
Inputs
(Level 3)
ConnectOne Bancorp, Inc. As of December 31, 2012, impaired loans, which are measured for impairment using the fair value of the collateral for collateral dependent loans, had an unpaid principal balance of $3,387,000, with a valuation allowance of $1,033,000, resulting in an additional provision for loan losses of $558,000 for
the year ended December 31, 2012. The following table presents quantitative information about Level 3 fair value measurements for financial instruments measured at fair value on a non-recurring basis at December 31, 2013 (dollars in thousands): Fair Value Valuation Unobservable Input(s) Discount Weighted Impaired
loans: Commercial real
estate Income approach Adjustments for
differences in net
operating income
expectations. 4% Commercial $1,865 Sales comparison Adjustments for
differences between
the comparable sales. 39% The following table presents quantitative information about Level 3 fair value measurements for financial instruments measured at fair value on a non-recurring basis at December 31, 2012 (dollars in thousands): Fair Value Valuation Unobservable Input(s) Discount Weighted Commercial real
estate Income approach Adjustments for
differences in net
operating income
expectations. 4% 89
NOTES TO CONSOLIDATED FINANCIAL STATEMENTS—(Continued)
Technique(s)
Range
Average
$1,828
Sales comparison
Adjustments for
differences between
the comparable sales.
5%-15%
8%
4%
39%
Technique(s)
Range
Average
$2,354
Sales comparison
Adjustments for
differences between
the comparable sales.
10%-25%
20%
4%
ConnectOne Bancorp, Inc. The carrying value and estimated fair value of financial instruments as of December 31, 2013 and December 31, 2012 are summarized below (dollars in thousands):
2013
Carrying Value
Fair Value Measurements at December 31 Using
Quoted Prices
Significant
Significant Financial assets: Cash and due from banks
$
2,907
$
2,907
$
—
$
— Interest bearing deposits
31,459
31,459
—
— Securities available for sale
27,589
1,803
25,786
— Securities held to maturity
1,027
—
1,077
— FHLB Stock
4,744
n/a
n/a
n/a Loans held for sale
575
—
583
— Loans receivable, gross
1,151,904
—
—
1,151,870 Accrued interest receivable
4,102
—
99
4,003 Financial liabilities: Deposits: Demand, NOW, money market and savings
$
550,096
$
550,096
$
—
$
— Certificates of deposit
415,711
—
419,467
— Borrowings
137,558
—
141,902
— Accrued interest payable
2,762
—
2,762
—
2012 Financial assets: Cash and due from banks
$
3,242
$
3,242
$
—
$
— Interest bearing deposits
47,387
47,387
—
— Securities available for sale
19,252
—
19,252
— Securities held to maturity
1,985
—
2,084
— FHLB Stock
7,622
n/a
n/a
n/a Loans held for sale
405
—
414
— Loans receivable, gross
849,269
—
—
874,438 Accrued interest receivable
3,361
—
68
3,293 Financial liabilities: Deposits: Demand, NOW, money market and savings
$
505,264
$
505,264
$
—
$
— Certificates of deposit
264,054
—
277,614
— Borrowings
79,568
—
81,703
— Accrued interest payable
2,803
—
2,803
— The methods and assumptions, not previously presented, used to estimate fair values for the periods ended December 31, 2013 and December 31, 2012, are described as follows: Cash and due from banks and interest bearing deposits: The carrying amounts of cash and short-term instruments approximate fair values and are classified as Level 1. Loans: Fair value of loans, excluding loans held for sale, is estimated as follows: For variable rate loans that reprice frequently and with no significant change in credit risk, fair values are based on carrying values resulting in a Level 3 classification. Fair values for other loans are estimated
using discounted cash flow analyses, using interest rates currently being offered for 90
NOTES TO CONSOLIDATED FINANCIAL STATEMENTS—(Continued)
in Active
Markets for
Identical Assets
(Level 1)
Other
Observable
Inputs
(Level 2)
Unobservable
Inputs
(Level 3)
ConnectOne Bancorp, Inc. loans with similar terms to borrowers of similar credit quality resulting in a Level 3 classification. Impaired loans are valued at the lower of cost or fair value as described previously. The methods utilized to estimate the fair value of loans do not necessarily represent an exit price. The fair value of loans held for sale is estimated based upon binding contracts and quotes from third party investors resulting in a Level 2 classification. FHLB Stock: It is not practical to determine the fair value of FHLB Stock due to restrictions placed on its transformatility. Deposits: The fair values disclosed for demand deposits (e.g., interest and non-interest checking, passbook savings, and certain types of money market accounts) are, by definition, equal to the amount payable on demand at the reporting date (i.e., their carrying amount) resulting in a Level 1
classification. The carrying amounts of variable rate, fixed-term money market accounts and certificates of deposit approximate their fair values at the reporting date resulting in a Level 1 classification. Fair values for fixed rate certificates of deposit are estimated using a discounted cash flow
calculation that applies interest rates currently being offered on certificates to a schedule of aggregated expected monthly maturities on time deposits resulting in a Level 2 classification. Borrowings: Borrowings consist of Federal Home Loan Bank of New York borrowings which are estimated using a discounted cash flow calculation that applies interest rates currently being offered to a schedule of aggregated expected monthly Federal Home Loan borrowings maturities. Accrued interest receivable/payable: The carrying amounts of accrued interest approximate the fair value resulting in a Level 1, Level 2 or Level 3 classification. NOTE 14—PARENT COMPANY ONLY CONDENSED FINANCIAL INFORMATION CONDENSED STATEMENTS OF FINANCIAL CONDITION
2013
2012
(in thousands) ASSETS Cash and cash equivalents
$
79
$
27 Other assets
259
— Investment in banking subsidiary
129,790
72,342 Total assets
$
130,128
$
72,369 LIABILITIES AND EQUITY Accrued expenses and other liabilities
$
—
$
7 Stockholders’ equity
130,128
72,362 Total liabilities and stockholders’ equity
$
130,128
$
72,369 CONDENSED STATEMENTS OF COMPREHENSIVE INCOME
2013
2012
2011 Equity in undistributed subsidary income
$
10,270
$
8,421
$
6,666 Net Income
$
10,270
$
8,421
$
6,666 Comprehensive Income
$
9,656
$
8,307
$
6,857 91
NOTES TO CONSOLIDATED FINANCIAL STATEMENTS—(Continued)
December 31,
Years Ended December 31,
ConnectOne Bancorp, Inc. CONSOLIDATED STATEMENTS OF CASH FLOWS
2013
2012
2011
(in thousands) Cash Flows From Operating Activities: Net Income
$
10,270
$
8,421
$
6,666 Adjustments: Equity in undistributed subsidary income
(10,270
)
(8,421
)
(6,666
) Change in other liabilities
(7
)
(197
)
33 Net cash provided by (used in) operating activities
(7
)
(197
)
33 Cash Flows From Investing Activities: Investment in subsidiaries
(47,656
)
(7,094
)
(588
) Net cash used in investing activities
(47,656
)
(7,094
)
(588
) Cash Flows From Financing Activities: Proceeds from preffered stock issuance
47,715
7,500
1,180 Preferred stock dividends
—
(354
)
(600
) Net cash provided by financing activities
47,715
7,146
580 Net change in cash and cash equivalents
52
(145
)
25 Beginning cash and cash equivalents
27
172
147 Ending cash and cash equivalents
$
79
$
27
$
172 NOTE 15—EARNINGS PER SHARE The factors used in the earnings per share computation follow (in thousands, except per share data):
2013
2012
2011 Basic: Net income available to common stockholders
$
10,270
$
8,067
$
6,066 Weighted average common shares outstanding
4,774
2,701
2,242 Basic earnings per common share
$
2.15
$
2.99
$
2.71 Diluted: Net income available to common stockholders
$
10,270
$
8,067
$
6,066 Add: Preferred dividends
—
354
600 Net Income
$
10,270
$
8,421
6,666 Weighted average common shares outstanding for basic earnings per common share
4,774
2,701
2,242 Add: Dilutive effects of assumed exercises of stock options and stock awards
145
83
55 Add: Dilutive effects of assumed vesting of performance units
—
413
766 Average shares and dilutive potential common shares
4,919
3,197
3,063 Diluted earnings per common share
$
2.09
$
2.63
$
2.18 There were no stock options that resulted in anti-dilution for the periods presented. 92
NOTES TO CONSOLIDATED FINANCIAL STATEMENTS—(Continued)
Years Ended December 31,
ConnectOne Bancorp, Inc. NOTE 16—QUARTERLY FINANCIAL DATA (unaudited)
Selected Consolidated Quarterly Financial Data
March 31,
June 30,
September 30,
December 31,
(in thousands, except per share data) Total interest income
$
10,912
$
11,352
$
12,158
$
12,881 Total interest expense
1,528
1,526
1,608
1,814 Net interest income
9,384
9,826
10,550
11,067 Provision for loan losses
925
950
1,300
1,400 Net interest income after provision for loan losses
8,459
8,876
9,250
9,667 Non-interest income
259
301
293
349 Non-interest expense
4,741
4,925
5,220
5,765 Income before income taxes
3,977
4,252
4,323
4,251 Income tax expense
1,641
1,755
1,736
1,401 Net income
$
2,336
$
2,497
$
2,587
$
2,850 Earnings per share:(1) Basic
$
0.58
$
0.50
$
0.52
$
0.57 Diluted
$
0.56
$
0.49
$
0.50
$
0.55
Selected Consolidated Quarterly Financial Data
March 31,
June 30,
September 30,
December 31,
(in thousands, except per share data) Total interest income
$
9,304
$
10,369
$
10,289
$
10,825 Total interest expense
1,561
1,553
1,611
1,594 Net interest income
7,743
8,816
8,678
9,231 Provision for loan losses
750
1,140
950
1,150 Net interest income after provision for loan losses
6,993
7,676
7,728
8,081 Non-interest income
245
277
294
326 Non-interest expense
4,148
4,457
4,335
4,548 Income before income taxes
3,090
3,496
3,687
3,859 Income tax expense
1,248
1,418
1,488
1,557 Net income
1,842
2,078
2,199
2,302 Dividends on preferred stock
146
206
2
— Net income available to common stockholders
$
1,696
$
1,872
$
2,197
$
2,302 Earnings per share:(1) Basic
$
0.76
$
0.83
$
0.70
$
0.73 Diluted
$
0.62
$
0.62
$
0.68
$
0.71
(1) 93
NOTES TO CONSOLIDATED FINANCIAL STATEMENTS—(Continued)
2013 Quarter Ended,
2012 Quarter Ended,
Earnings per share (EPS) in each quarter is computed using the weighted-average number of shares outstanding during that quarter while EPS for the full year is computed using the weighted-average number of shares outstanding during the year. Thus, the sum of the four quarters’ EPS will not
necessarily equal the full-year EPS.
ConnectOne Bancorp, Inc. NOTE 17—SUBSEQUENT EVENTS On January 20, 2014, the Company, entered into an Agreement and Plan of Merger (the “Merger Agreement”) with Center Bancorp, Inc. (NASDAQ: “CNBC”) (“Center Bancorp”). The Merger Agreement provides that, upon the terms and subject to the conditions set forth therein, the Company
will merge with and into Center Bancorp, with Center Bancorp continuing as the surviving entity (the “Merger”). The Merger Agreement also provides that, immediately following the consummation of the Merger, Union Center National Bank, a commercial bank chartered pursuant to the laws of the
United States (“Union Center”) and a wholly-owned subsidiary of Center Bancorp, will merge with and into the Bank, with the Bank continuing as the surviving bank. Upon completion of the Merger, each share of common stock of the Company will be converted into and become the right to receive 2.6
shares of common stock, no par value per share, of Center Bancorp. Immediately after consummation of the transaction, the directors of the resulting corporation and the resulting bank shall consist of six individuals who previously served as Center Bancorp Directors and six Directors who previously
served as Directors of the Company, each to hold office in accordance with the Amended and Restated Certificate of Incorporation and the by-laws of the surviving corporation until their respective successors are duly elected or appointed and qualified. The officers of the surviving corporation shall
consist of (i) Frank S. Sorrentino III as Chairman, President and Chief Executive Officer; (ii) William S. Burns, Chief Financial Officer; and (iii) Anthony Weagley, current President and Chief Executive Officer of Center Bancorp, as Chief Operating Officer. Completion of the Merger is subject to various conditions, including, among others, (i) approval by shareholders of Center Bancorp and the Company of the Merger Agreement and the transactions contemplated thereby, (ii) the receipt of all necessary approvals and consents of governmental entities
required to consummate the transactions contemplated by the Merger Agreement, (iii) the absence of any order or proceeding which prohibits the Merger or the Bank Merger and (iv) the receipt by each of Center Bancorp and ConnectOne Bancorp of an opinion to the effect that the Merger will be
treated as a reorganization qualifying under Section 368(a) of the Internal Revenue Code of 1986, as amended. Each party’s obligation to consummate the Merger is also subject to certain customary conditions, including (i) subject to certain exceptions, the accuracy of the representations and warranties of
the other party, (ii) performance in all material respects of its agreements, covenants and obligations and (iii) the delivery of certain certificates and other documents. The Company expects the Merger to be completed in either the second or third quarter of 2014. On January 27, 2014, a complaint was filed against the Company and the members of its Board of Directors in the Superior Court of New Jersey, BergenCounty, seeking class action status and asserting that the Company and the members of its Board had violated their duties to the Company’s
shareholders in connection with the proposed merger with Center Bancorp, Inc. Subsequently, several additional complaints also seeking class action status and raising substantially the same allegations, were filed in the Superior Court of New Jersey, Bergen County. The plaintiffs propose to consolidate
these cases. The litigation is in its very early stages, and the Company’s time to answer has not yet run. The Company believes these complaints are without merit, and intends to vigorously defend these complaints. 94
NOTES TO CONSOLIDATED FINANCIAL STATEMENTS—(Continued)
SIGNATURES Pursuant to the requirements
of Section 13 or 15(d) of the Securities Exchange Act of 1934, the Registrant has duly caused this Amendment No. 2 to be
signed on its behalf by the undersigned, thereunto duly authorized in the Borough of Englewood Cliffs, State of New Jersey,
on April 30, 2014. ConnectOne Bancorp, Inc., 95
By: /s/ Frank Sorrentino III
Frank Sorrentino III
Chairman & Chief Executive Officer