Attached files
| file | filename |
|---|---|
| 8-K - FORM 8-K - Carlyle Group Inc. | d716169d8k.htm |
Exhibit 99.1

For Immediate Release
April 30, 2014
The Carlyle Group Announces First Quarter 2014 Financial Results
| — | $183 million of Distributable Earnings on a pre-tax basis in Q1 2014 and $852 million over last twelve months; $0.52 per common unit on a post-tax basis |
| — | Net accrued performance fee balance of $2.0 billion up 36% over Q1 2013, or $6.16 per Adjusted Unit, and gross accrued performance fee balance of $3.8 billion |
| — | $5.5 billion in new capital raised in Q1 2014 and $22.8 billion raised over the last twelve months |
| — | $3.1 billion in realized proceeds in Q1 2014 and $16.3 billion realized over the last twelve months |
| — | $1.1 billion in equity invested in Q1 2014 and another $3.1 billion committed, and $6.8 billion invested over the last twelve months |
| — | 6% carry fund portfolio appreciation in Q1 2014, driving Economic Net Income of $322 million on a pre-tax basis and $0.85 per Adjusted Unit on a post-tax basis |
| — | U.S. GAAP net income attributable to The Carlyle Group L.P. of $25 million, or $0.41 per common unit on a diluted basis, in Q1 2014 |
Washington, DC – Global alternative asset manager The Carlyle Group L.P. (NASDAQ: CG) today reported its unaudited results for the first quarter of 2014, which ended on March 31, 2014.
Carlyle Co-CEO David M. Rubenstein said, “Carlyle had a solid start to 2014, which has resulted in our last twelve month Distributable Earnings increasing 25% over the prior twelve month period to more than $850 million. Fundraising, fund performance, and investing activity are all running at strong levels. As new top talent joins our seasoned leadership team and we launch new fund strategies and make targeted acquisitions, Carlyle continues to meet the increasingly complex demands of our global investor base.”
Page | 1
Carlyle Co-CEO William E. Conway, Jr. said, “Carlyle’s funds produced great returns for our fund investors this quarter, led by an 8% increase in the value of our Private Equity carry funds, which helped drive a 36% increase in Carlyle’s net accrued performance fee balance year over year to $2.0 billion. Although the investing environment has grown more challenging over the past few quarters, we have been successful in committing to several exciting investment opportunities, and we are executing sales at attractive prices around the world.”
U.S. GAAP results for Q1 2014 included income before provision for income taxes of $472 million and net income attributable to the common unitholders through The Carlyle Group L.P. of $25 million, or net income per common unit of $0.41 on a diluted basis. Total balance sheet assets were $36.3 billion as of March 31, 2014.
| First Quarter Distribution |
The Board of Directors has declared a quarterly distribution of $0.16 per common unit to holders of record at the close of business on May 14, 2014, payable on May 22, 2014.
The Carlyle Group Distribution Policy
As further discussed in its Annual Report on Form 10-K and Quarterly Reports on Form 10-Q, Carlyle currently anticipates that it will cause Carlyle Holdings to make quarterly distributions to its partners, including The Carlyle Group L.P.’s wholly owned subsidiaries, that will enable The Carlyle Group L.P. to pay a quarterly distribution of $0.16 per common unit for each of the first three quarters of each year, and, for the fourth quarter of each year, to pay a distribution of at least $0.16 per common unit, that, taken together with the prior quarterly distributions in respect of that year, represents its share, net of taxes and amounts payable under the tax receivable agreement, of Carlyle’s Distributable Earnings in excess of the amount determined by the General Partner to be necessary or appropriate to provide for the conduct of its business, to make appropriate investments in its business and its funds or to comply with applicable law or any of its financing agreements. Carlyle anticipates that the aggregate amount of its distributions for most years will be less than its Distributable Earnings for that year due to these funding requirements. The declaration and payment of any distributions is at the sole discretion of the General Partner, which may change the distribution policy at any time.
Page | 2
| The Carlyle Engine |
Carlyle evaluates the underlying performance of its business on four key metrics known as the Carlyle Engine: funds raised, equity invested, carry fund returns and realized proceeds for fund investors. The table below highlights the results of these metrics for Q1 2014, year-to-date (YTD) and for the last twelve months (LTM)1.

Note: Equity Invested and Realized Proceeds reflect carry funds only.
During Q1 2014, within its carry funds, Carlyle generated realized proceeds of $3.1 billion from 124 different investments across 35 carry funds. Carlyle deployed $1.1 billion of equity in 72 new or follow-on investments across 24 carry funds. On an LTM basis, Carlyle realized proceeds of $16.3 billion and invested $6.8 billion.
| Segment | Realized Proceeds | Equity Invested | ||||||||||||||||
| # of Investments | # of Funds | $ millions |
# of Investments | # of Funds | $ millions | |||||||||||||
|
|
Corporate Private Equity | 37 | 16 | $2,205 | 13 | 11 | $881 | |||||||||||
| Global Market Strategies |
29 | 6 | $100 | 5 | 3 | $56 | ||||||||||||
| Real Assets |
62 | 13 | $763 | 54 | 10 | $210 | ||||||||||||
|
| ||||||||||||||||||
| Carlyle | 124 | 35 | $3,068 | 72 | 24 | $1,147 | ||||||||||||
|
| ||||||||||||||||||

Note: The columns may not sum as some investments cross segment lines, but are only counted one time for Carlyle results.
1 LTM, or last twelve months, refers to the period Q2 2013 through Q1 2014. Prior LTM, or the prior rolling twelve month period, refers to the period Q2 2012 through Q1 2013.
Page | 3
| Carlyle All Segment Results |
| — | Distributable Earnings (DE): $183 million for Q1 2014 and $852 million on an LTM basis |
| o | Pre-tax Distributable Earnings were $183 million for Q1 2014, or $0.52 per common unit on a post-tax basis. Distributable Earnings were $852 million on an LTM basis, 25% higher than the prior rolling twelve month period. |
| o | Fee-Related Earnings were $37 million for Q1 2014 and declined by $2 million from $39 million in Q1 2013 due to higher compensation, fundraising, and G&A expenses, offset by higher Fee-Earning Assets Under Management. Fee-Related Earnings were $151 million on an LTM basis, 15% lower than the prior rolling twelve month period. |
| o | Realized Net Performance Fees were $141 million for Q1 2014, compared to $142 million in Q1 2013. For Q1 2014, Realized Net Performance Fees were positively impacted by exits in Booz Allen, Commscope, The Nielsen Company, and Allison Transmission among others. Realized Net Performance Fees were $677 million on an LTM basis, 35% higher than the prior rolling twelve month period. |
| o | Realized Investment Income/(Loss) was $5 million in Q1 2014, driven by gains on Buyout, Structured Credit, and Real Estate investments. |
| — | Economic Net Income (ENI): $322 million for Q1 2014 and $1.2 billion on an LTM basis |
| o | Economic Net Income was $322 million for Q1 2014 and $1,248 million on an LTM basis, 69% higher than the prior rolling twelve month period. On a post-tax basis, Carlyle generated $0.85 in ENI per Adjusted Unit for Q1 2014. |
| o | Q1 2014 ENI was impacted by appreciation of 6% in Carlyle’s carry fund portfolio. Corporate Private Equity carry funds were up 8%, Global Market Strategies carry funds increased 3%, and Real Assets carry funds increased 2% compared to the end of Q4 2013. Carry fund appreciation was 18% on an LTM basis. |
| The Carlyle Group L.P. - All Segments | Period | LTM | % Change | |||||||||||||||
|
|
| |||||||||||||||||
| $ in millions, except per unit data and where noted | Q1 2013 | Q2 2013 | Q3 2013 | Q4 2013 | Q1 2014 | Q2 13-Q1 14 | QoQ | YoY | LTM | |||||||||
| Revenues |
852 | 508 | 615 | 1,394 | 897 | 3,413 | (36%) | 5% | 70% | |||||||||
|
Expenses |
458 | 352 | 420 | 818 | 575 | 2,165 | (30%) | 25% | 71% | |||||||||
|
Economic Net Income |
394 | 156 | 195 | 576 | 322 | 1,248 | (44%) | (18%) | 69% | |||||||||
|
Fee-Related Earnings |
39 | 31 | 44 | 39 | 37 | 151 | (4%) | (4%) | (15%) | |||||||||
|
Net Performance Fees |
355 | 123 | 157 | 592 | 307 | 1,178 | (48%) | (14%) | 116% | |||||||||
|
Realized Net Performance Fees |
142 | 118 | 61 | 357 | 141 | 677 | (61%) | (0%) | 35% | |||||||||
|
Distributable Earnings |
171 | 163 | 105 | 401 | 183 | 852 | (54%) | 7% | 25% | |||||||||
|
Distributable Earnings per common unit (after taxes) |
$0.48 | $0.53 | $0.32 | $1.18 | $0.52 | |||||||||||||
|
Distribution per common unit |
$0.16 | $0.16 | $0.16 | $1.40 | $0.16 | |||||||||||||
|
Total Assets Under Management ($ in billions) |
176.3 | 180.4 | 185.0 | 188.8 | 198.9 | 5% | 13% | 13% | ||||||||||
|
Fee-Earning Assets Under Management ($ in billions) |
122.9 | 132.0 | 137.9 | 139.9 | 142.1 | 2% | 16% | 16% | ||||||||||
Note: Totals may not sum due to rounding.
Page | 4
| Assets Under Management and Remaining Fair Value of Capital |
| — | Total Assets Under Management: $198.9 billion as of Q1 2014 (+13% LTM) |
| o | Major drivers of change versus Q4 2013: New capital commitments (+$6.1 billion), market appreciation (+$6.7 billion), acquisitions (+$3.0 billion), changes in CLO par value (+$0.5 billion), offset by net distributions (-$6.6 billion). |
| o | Total Dry Powder of $56.3 billion as of Q1 2014, comprised of $23.9 billion in Corporate Private Equity, $1.5 billion in Global Market Strategies, $10.1 billion in Real Assets and $20.8 billion in Solutions. |
| — | Fee-Earning Assets Under Management: $142.1 billion as of Q1 2014 (+16% LTM) |
| o | Major drivers of change versus Q4 2013: Acquisitions (+$2.9 billion), asset inflows including commitments (+$1.9 billion), changes in CLO par value (+$0.7 billion) and market appreciation (+$0.3 billion), partially offset by net distributions and outflows (-$3.7 billion). |
| o | Since the end of Q4 2013, Fee-Earning AUM was positively impacted by the addition of new commitments in Carlyle’s latest vintage buyout funds in Europe and Asia and our new international energy fund, in addition to other fundraising across the Carlyle platform. |
| — | Remaining Fair Value of Capital (carry funds only) as of Q1 2014: $63.7 billion |
| o | Current Multiple of Invested Capital (MOIC) of remaining fair value of capital: 1.3x. |
| o | Remaining fair value of capital in the ground in investments made in 2009 or earlier: 40% of total fair value. |
| o | AUM in-carry ratio as of the end of Q1 2014: 72%. |
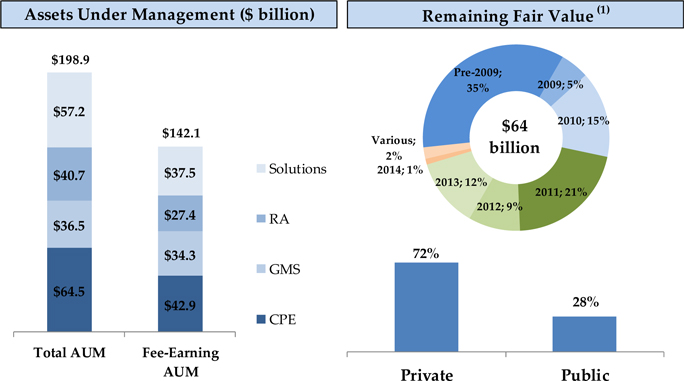
(1) Fair value of remaining carry fund capital in the ground, by vintage. Totals may not sum due to rounding.
Data as of March 31, 2014.
Page | 5
| Non-GAAP Operating Results |
Carlyle’s non-GAAP results for Q1 2014 are provided in the table below:
| Carlyle Group Summary | ||||
| $ in millions, except unit and per unit amounts | ||||
| Economic Net income | Q1 2014 | |||
|
|
||||
| Economic Net Income (pre-tax) |
$ | 321.9 | ||
| Less: Provision for income taxes (1) |
46.4 | |||
|
|
|
|||
| Economic Net Income, After Taxes |
$ | 275.5 | ||
|
|
|
|||
| Fully diluted units (in millions) |
323.8 | |||
| Economic Net Income, After Taxes per Adjusted Unit (2) |
$ | 0.85 | ||
| Distributable Earnings |
||||
|
|
||||
| Distributable Earnings |
$ | 183.3 | ||
| Less: Estimated foreign, state, and local taxes (3) |
14.0 | |||
|
|
|
|||
| Distributable Earnings, After Taxes |
$ | 169.3 | ||
|
|
|
|||
| Allocating Distributable Earnings for only public unitholders of The Carlyle Group L.P. |
||||
| Distributable Earnings to The Carlyle Group L.P. |
$ | 35.6 | ||
| Less: Estimated current corporate income taxes (4) |
0.8 | |||
|
|
|
|||
| Distributable Earnings to The Carlyle Group L.P. net of corporate income taxes |
$ | 34.8 | ||
|
|
|
|||
| Units in public float (in millions)(5) |
66.9 | |||
| Distributable Earnings, net, per The Carlyle Group L.P. common unit outstanding |
$ | 0.52 | ||
|
|
||||
(1) Represents the implied provision for income taxes that was calculated using a similar methodology applied in calculating the tax provision for The Carlyle Group L.P., without any reduction for noncontrolling interests.
(2) For information regarding our calculation of Adjusted Units, please see page 29.
(3) Represents the implied provision for current income taxes that was calculated using a similar methodology applied in calculating the current tax provision for The Carlyle Group L.P., without any reduction for noncontrolling interests.
(4) Represents current corporate income taxes payable upon distributable earnings allocated to Carlyle Holdings I GP Inc. and estimated current Tax Receivable Agreement payments owed.
(5) Includes 2,831,392 common units to be issued in May 2014 in connection with the vesting of deferred restricted common units. These newly issued units are included in this calculation because they will participate in the unitholder distribution that will be paid in May 2014.
Page | 6
| Corporate Private Equity (CPE) |

| — | Distributable Earnings (DE): $148 million for Q1 2014 and $572 million on an LTM basis, 45% higher than the prior LTM. The following components impacted Distributable Earnings in Q1 2014: |
| o | Fee-Related Earnings were $12 million in Q1 2014 and $20 million on an LTM basis, compared to $1 million in Q1 2013, with the increase driven by higher management fees from higher Fee-Earning Assets Under Management. |
| o | Realized Net Performance Fees were $133 million for Q1 2014 and $536 million on an LTM basis, compared to $111 million for Q1 2013. |
| — | Economic Net Income (ENI): $258 million for Q1 2014 and $1.1 billion on an LTM basis, 126% higher than the prior LTM. |
| o | Economic Net Income of $258 million for Q1 2014 and $1.1 billion on an LTM basis, compared to $239 million for Q1 2013. |
| o | CPE carry fund valuations increased 8% in Q1 2014 and 28% on an LTM basis, compared with an increase of 9% in Q1 2013. |
| o | Net Performance Fees of $246 million for Q1 2014 and $1,037 million on an LTM basis, compared to $235 million for Q1 2013. |
| — | Total Assets Under Management (AUM): $64.5 billion as of Q1 2014 |
| o | Total AUM increased 17% to $64.5 billion from $55.1 billion as of Q1 2013. |
| o | Funds Raised in Q1 2014 of $0.6 billion were largely driven by additional closings of our latest vintage Asia, Europe and Japan Buyout funds. |
| o | Fee-Earning Assets Under Management were $42.9 billion as of Q1 2014, up 29% from $33.2 billion as of Q1 2013, with the increase driven by $17.5 billion in inflows, and partially offset by $7.6 billion in outflows, including distributions and basis step downs. |
| Corporate Private Equity | Period | LTM | % Change | |||||||||||||||
|
|
| |||||||||||||||||
| $ in millions, except where noted | Q1 2013 | Q2 2013 | Q3 2013 | Q4 2013 | Q1 2014 | Q2 13-Q1 14 | QoQ | YoY | LTM | |||||||||
|
|
| |||||||||||||||||
|
Economic Net Income |
239 | 106 | 159 | 549 | 258 | 1,073 | (53%) | 8% | 126% | |||||||||
|
Fee-Related Earnings |
1 | (4) | 8 | 4 | 12 | 20 | 188% | 786% | (60%) | |||||||||
|
Net Performance Fees |
235 | 109 | 147 | 535 | 246 | 1,037 | (54%) | 5% | 150% | |||||||||
|
Realized Net Performance Fees |
111 | 86 | 45 | 271 | 133 | 536 | (51%) | 21% | 57% | |||||||||
|
Distributable Earnings |
114 | 84 | 54 | 286 | 148 | 572 | (48%) | 30% | 45% | |||||||||
|
Total Assets Under Management ($ in billions) |
55.1 | 57.9 | 62.2 | 64.9 | 64.5 | (1%) | 17% | |||||||||||
|
Fee-Earning Assets Under Management ($ in billions) |
33.2 | 38.5 | 41.9 | 43.0 | 42.9 | (0%) | 29% | |||||||||||
Note: Totals may not sum due to rounding.
Page | 7
| Global Market Strategies (GMS) |

Note: Funds Raised excludes acquisitions, but includes hedge funds and CLOs. Equity Invested and Realized Proceeds are for carry funds only.
| — | Distributable Earnings (DE): $22 million for Q1 2014 and $195 million on an LTM basis, 9% higher than the prior LTM. The following components impacted Distributable Earnings in Q1 2014: |
| o | Fee-Related Earnings were $17 million in Q1 2014 and $78 million on an LTM basis, compared to $25 million in Q1 2013. The decline in Q1 2014 was driven primarily by higher management fees in Q1 2013 from two CLOs that were in the process of liquidating and higher levels of compensation and other expenses. |
| o | Realized Net Performance Fees were $5 million for Q1 2014 and $100 million on an LTM basis, compared to $14 million for Q1 2013. |
| o | Realized Investment Income was $1 million for Q1 2014 and $17 million on an LTM basis. |
| — | Economic Net Income (ENI): $56 million for Q1 2014 and $180 million on an LTM basis, 22% lower than the prior LTM |
| o | Economic Net Income of $56 million for Q1 2014 and $180 million on an LTM basis, compared to $104 million for Q1 2013. |
| o | GMS carry fund valuations increased 3% in Q1 2014, compared with 9% appreciation in Q1 2013. The asset-weighted hedge fund performance of our reported funds was 2.2% in Q1 2014. |
| o | Net Performance Fees of $39 million for Q1 2014 and $95 million on an LTM basis, compared to $73 million for Q1 2013. |
| — | Total Assets Under Management (AUM): $36.5 billion as of Q1 2014 |
| o | Total AUM of $36.5 billion as of Q1 2014 increased 10% versus Q1 2013, while Fee-Earning AUM of $34.3 billion increased 9% versus Q1 2013. |
| o | Total hedge fund AUM ended Q1 2014 at $14.6 billion. |
| o | GMS carry fund AUM ended Q1 2014 at $3.8 billion. |
| o | Total structured credit AUM ended Q1 2014 at $17.8 billion. |
| o | Total business development company AUM ended Q1 2014 at $0.4 billion. |
| Global Market Strategies | Period | LTM | % Change | |||||||||||||||
|
|
|
| ||||||||||||||||
| $ in millions, except where noted | Q1 2013 | Q2 2013 | Q3 2013 | Q4 2013 | Q1 2014 | Q2 13 - Q1 14 | QoQ | YoY | LTM | |||||||||
|
|
| |||||||||||||||||
|
Economic Net Income |
104 | 47 | 10 | 67 | 56 | 180 | (15%) | (46%) | (22%) | |||||||||
|
Fee-Related Earnings |
25 | 23 | 17 | 21 | 17 | 78 | (23%) | (34%) | (21%) | |||||||||
|
Net Performance Fees |
73 | 25 | (12) | 43 | 39 | 95 | (9%) | (46%) | (12%) | |||||||||
|
Realized Net Performance Fees |
14 | 11 | 5 | 79 | 5 | 100 | (94%) | (69%) | 51% | |||||||||
|
Distributable Earnings |
41 | 46 | 24 | 102 | 22 | 195 | (78%) | (46%) | 9% | |||||||||
|
Total Assets Under Management ($ in billions) |
33.1 | 34.7 | 35.4 | 35.5 | 36.5 | 3% | 10% | |||||||||||
|
| ||||||||||||||||||
|
Fee-Earning Assets Under Management ($ in billions) |
31.4 | 33.1 | 33.7 | 33.4 | 34.3 | 3% | 9% | |||||||||||
|
| ||||||||||||||||||
|
|
||||||||||||||||||
|
Funds Raised, excluding hedge funds ($ in billions) |
1.3 | 1.5 | 1.1 | 0.7 | 1.5 | 4.9 | 115% | 20% | ||||||||||
|
Hedge Fund Net Inflows ($ in billions) |
(0.1) | 0.9 | 0.4 | (0.2) | 0.3 | 1.3 | 221% | 440% | ||||||||||
Note: Totals may not sum due to rounding. Funds Raised excludes the impact of acquisitions.
Page | 8
| Real Assets (RA) |

Note: Funds Raised excludes acquisitions. Equity Invested and Realized Proceeds are for carry funds only.
| — | Distributable Earnings (DE): $2 million for Q1 2014 and $36 million on an LTM basis, 61% lower than the prior LTM. The following components impacted Distributable Earnings: |
| o | Fee-Related Earnings were ($0) million in Q1 2014 and $15 million on an LTM basis, compared to $9 million in Q1 2013. The decline is largely attributable to higher compensation expenses and fundraising costs attributable to various significant funds raising capital. |
| o | Realized Net Performance Fees were $0 for Q1 2014 and $29 million on an LTM basis, compared to $16 million for Q1 2013. |
| o | Realized Investment Income/(Loss) was $2 million during Q1 2014 and ($8) million on a LTM basis. |
| — | Economic Net Income/(Loss) (ENI): ($17) million for Q1 2014 and ($92) million on an LTM basis, compared to $7 million in the prior LTM. |
| o | Economic Net Income/(Loss) of ($17) million for Q1 2014 and ($92) million on an LTM basis compared to $42 million for Q1 2013. |
| o | Real Asset carry fund valuations appreciated 2% in Q1 2014, compared to 3% in Q1 2013. |
| o | Net Performance Fees of $6 million for Q1 2014 and ($5) million on an LTM basis, compared to $42 million for Q1 2013. |
| o | Unrealized investment losses of ($21) million for Q1 2014 were primarily attributable to unrealized losses in certain Latin American and European real estate investments. |
| — | Total Assets Under Management (AUM): $40.7 billion as of Q1 2014 |
| o | Total AUM of $40.7 billion increased 1% from $40.3 billion in Q1 2013. |
| o | Funds Raised in Q1 2014 of $1.7 billion were largely driven by closings in our latest vintage U.S. real estate fund and new international energy fund. The new U.S. real estate fund will not generate management fees until the predecessor fund steps down their management fee basis. |
| o | Fee-Earning AUM of $27.4 billion was down 7% versus Q1 2013, with the decrease driven largely by outflows, including step downs and distributions (-$4.5 billion), partially offset by inflows, including commitments (+$2.3 billion). |
| Real Assets | Period | LTM | % Change | |||||||||||||||
|
|
| |||||||||||||||||
| $ in millions, except where noted | Q1 2013 | Q2 2013 | Q3 2013 | Q4 2013 | Q1 2014 | Q2 13 - Q1 14 | QoQ | YoY | LTM | |||||||||
|
|
| |||||||||||||||||
|
Economic Net Income (Loss) |
42 | (11) | 0 | (65) | (17) | (92) | 75% | (139%) | (1281%) | |||||||||
|
Fee-Related Earnings |
9 | 6 | 7 | 3 | (0) | 15 | (114%) | (104%) | 12% | |||||||||
|
Net Performance Fees |
42 | (17) | 10 | (3) | 6 | (5) | 297% | (86%) | (140%) | |||||||||
|
Realized Net Performance Fees |
16 | 19 | 9 | 1 | 0 | 29 | (67%) | (98%) | (69%) | |||||||||
|
Distributable Earnings |
12 | 25 | 12 | (2) | 2 | 36 | 187% | (83%) | (61%) | |||||||||
|
Total Assets Under Management ($ in billions) |
40.3 | 39.8 | 39.0 | 38.7 | 40.7 | 5% | 1% | |||||||||||
|
Fee-Earning Assets Under Management ($ in billions) |
29.4 | 28.7 | 28.5 | 28.4 | 27.4 | (4%) | (7%) | |||||||||||
Note: Totals may not sum due to rounding.
Page | 9
| Solutions |
| — | Distributable Earnings (DE): $11 million for Q1 2014 and $50 million on an LTM basis, 215% higher than the prior LTM. |
| o | Fee-Related Earnings were $9 million for Q1 2014 and $38 million on an LTM basis. |
| o | Realized Net Performance Fees were $3 million for Q1 2014 and $12 million on an LTM basis. |
| — | Economic Net Income (ENI): $24 million for Q1 2014 and $88 million on an LTM basis, compared to $9 million in Q1 2013. |
| o | Last twelve month Economic Net Income increased 262% over the prior LTM. |
| — | Total Assets Under Management (AUM): $57.2 billion as of Q1 2014 |
| o | Total AUM of $57.2 billion was up 20% compared to Q1 2013, driven in part by the acquisitions of Diversified Global Asset Management (DGAM) and Metropolitan Real Estate Equity Management (MRE) as well as net capital raised. |
| o | Fee-Earning AUM of $37.5 billion increased 30% versus Q1 2013, with the increase primarily driven by the activation of mandates at AlpInvest and the acquisitions of DGAM and MRE. |
| o | Funds Raised in Q1 2014 of $1.4 billion were driven by new commitments into the AlpInvest Secondaries Fund during the quarter, and substantial new co-investment and fund investment capital. |
| — | During the quarter, Carlyle completed the acquisition of DGAM. The DGAM acquisition closed February 3, 2014. As of March 31, 2014, DGAM advised 13 fund of fund vehicles, and had $2.9 billion in Fee-Earning Assets Under Management. DGAM also advises on $3.6 billion in assets, for which it earns a nominal advisory fee, and these assets are not included in Total Assets Under Management or Fee-Earning Assets Under Management. |
| Solutions | Period | LTM | % Change | |||||||||||||||
|
|
| |||||||||||||||||
| $ in millions, except where noted | Q1 2013 | Q2 2013 | Q3 2013 (1) | Q4 2013 (2) | Q1 2014 (3) | Q2 13 - Q1 14 | QoQ | YoY | LTM | |||||||||
|
|
| |||||||||||||||||
|
Economic Net Income |
9 | 13 | 25 | 26 | 24 | 88 | (9%) | 167% | 262% | |||||||||
|
Fee-Related Earnings |
3 | 6 | 12 | 10 | 9 | 38 | (14%) | 156% | 170% | |||||||||
|
Net Performance Fees |
6 | 7 | 12 | 16 | 16 | 51 | (4%) | 175% | 385% | |||||||||
|
Realized Net Performance Fees |
1 | 1 | 3 | 5 | 3 | 12 | (51%) | 420% | 547% | |||||||||
|
Distributable Earnings |
4 | 8 | 15 | 15 | 11 | 50 | (27%) | 190% | 215% | |||||||||
|
Total Assets Under Management ($ in billions) |
47.8 | 48.0 | 48.4 | 49.8 | 57.2 | 15% | 20% | |||||||||||
|
Fee-Earning Assets Under Management ($ in billions) |
28.9 | 31.8 | 33.7 | 35.1 | 37.5 | 7% | 30% | |||||||||||
Note: Totals may not sum due to rounding.
(1) - During Q3 2013, Carlyle acquired the remaining 40% interest in AlpInvest. As such, amounts since the acquisition represent 100% of the financial results of AlpInvest. Prior to Q3 2013, amounts represent Carlyle’s 60% economic interest in Alpinvest.
(2) - During Q4 2013, Carlyle acquired Metropolitan Real Estate Equity Management, LLC (“MRE”). As such, amounts since the acquisition include the financial results of Metropolitan.
(3) - During Q1 2014, Carlyle acquired Diversified Global Asset Management Corporation (“DGAM”). As such, amounts since the acquisition include the financial results of DGAM.
Page | 10
| Balance Sheet Highlights |
The amounts presented below exclude the effect of U.S. GAAP consolidation eliminations on investments and accrued performance fees, as well as cash and debt associated with Carlyle’s consolidated funds. All data is as of March 31, 2014.
| — | Cash and Cash Equivalents of $1,034 million. |
| — | On-balance sheet investments attributable to unitholders of $279 million, excluding the equity investment by Carlyle in NGP Energy Capital Management. |
| — | Net accrued performance fees attributable to unitholders of $1,951 million. These performance fees are comprised of gross accrued performance fees of $3,803 million less $46 million in accrued giveback obligation and $1,806 million in accrued performance fee compensation and non-controlling interest. |
| — | Loans payable and senior notes totaling $1,149 million. |
Conference Call
Carlyle will host a conference call at 8:30 a.m. EDT on Wednesday, April 30, 2014 to announce and discuss financial results for the first quarter of 2014.
The call may be accessed by dialing (800) 850-2903 (U.S.) or +1-253-237-1169 (international) and referencing “The Carlyle Group Financial Results Call.” The conference call will be webcast simultaneously via a link on Carlyle’s investor relations website at ir.carlyle.com and an archived replay of the webcast also will be available on the website soon after the live call.
About The Carlyle Group
The Carlyle Group (NASDAQ: CG) is a global alternative asset manager with $199 billion of assets under management across 120 funds and 133 fund of funds vehicles as of March 31, 2014. Carlyle’s purpose is to invest wisely and create value on behalf of its investors, many of whom are public pensions. Carlyle invests across four segments – Corporate Private Equity, Real Assets, Global Market Strategies and Solutions – in Africa, Asia, Australia, Europe, the Middle East, North America and South America. Carlyle has expertise in various industries, including: aerospace, defense & government services, consumer & retail, energy, financial services, healthcare, industrial, real estate, technology & business services, telecommunications & media and transportation. The Carlyle Group employs more than 1,600 people in 38 offices across six continents.
Web: www.carlyle.com
Videos: www.youtube.com/onecarlyle
Tweets: www.twitter.com/onecarlyle
Podcasts: www.carlyle.com/about-carlyle/market-commentary
Page | 11
Contacts:
Public Market Investor Relations
Daniel Harris
Phone: 212-813-4527
daniel.harris@carlyle.com
Media
Elizabeth Gill
Phone: 202-729-5385
elizabeth.gill@carlyle.com
Page | 12
Forward Looking Statements
This press release may contain forward-looking statements within the meaning of Section 27A of the Securities Act of 1933 and Section 21E of the Securities Exchange Act of 1934. These statements include, but are not limited to, statements related to our expectations regarding the performance of our business, our financial results, our liquidity and capital resources and other non-historical statements. You can identify these forward-looking statements by the use of words such as “outlook,” “believes,” “expects,” “potential,” “continues,” “may,” “will,” “should,” “seeks,” “approximately,” “predicts,” “intends,” “plans,” “estimates,” “anticipates” or the negative version of these words or other comparable words. These statements are subject to risks, uncertainties and assumptions, including those described under the section entitled “Risk Factors” in our Annual Report on Form 10-K for the year ended December 31, 2013 filed with the SEC on February 27, 2014, as such factors may be updated from time to time in our periodic filings with the SEC, which are accessible on the SEC’s website at www.sec.gov. These factors should not be construed as exhaustive and should be read in conjunction with the other cautionary statements that are included in this release and in our filings with the SEC. We undertake no obligation to publicly update or review any forward-looking statements, whether as a result of new information, future developments or otherwise, except as required by applicable law.
This release does not constitute an offer for any Carlyle fund.
Page | 13
The Carlyle Group L.P.
GAAP Statement of Operations (Unaudited)
| Three Months Ended | ||||||||
| Mar 31, 2014 |
Mar 31, 2013 |
|||||||
| (Dollars in millions, except unit and per unit data) | ||||||||
| Revenues |
||||||||
| Fund management fees |
$ | 260.3 | $ | 231.4 | ||||
| Performance fees |
||||||||
| Realized |
251.4 | 252.8 | ||||||
| Unrealized |
369.1 | 389.6 | ||||||
|
|
|
|
|
|||||
| Total performance fees |
620.5 | 642.4 | ||||||
| Investment income (loss) |
||||||||
| Realized |
- | (4.2) | ||||||
| Unrealized |
6.1 | 4.6 | ||||||
|
|
|
|
|
|||||
| Total investment income (loss) |
6.1 | 0.4 | ||||||
| Interest and other income |
3.8 | 2.4 | ||||||
| Interest and other income of Consolidated Funds |
250.7 | 268.4 | ||||||
| Revenue of a consolidated real estate VIE |
6.0 | - | ||||||
|
|
|
|
|
|||||
| Total revenues |
1,147.4 | 1,145.0 | ||||||
| Expenses |
||||||||
| Compensation and benefits |
||||||||
| Base compensation |
204.6 | 178.5 | ||||||
| Equity-based compensation |
74.2 | 52.3 | ||||||
| Performance fee related |
||||||||
| Realized |
108.7 | 108.7 | ||||||
| Unrealized |
221.6 | 195.0 | ||||||
|
|
|
|
|
|||||
| Total compensation and benefits |
609.1 | 534.5 | ||||||
| General, administrative and other expenses |
134.3 | 111.4 | ||||||
| Interest |
12.2 | 10.5 | ||||||
| Interest and other expenses of Consolidated Funds |
264.0 | 250.1 | ||||||
| Interest and other expenses of a consolidated real estate VIE |
49.2 | - | ||||||
| Other non-operating (income) expense |
30.2 | (2.4) | ||||||
|
|
|
|
|
|||||
| Total expenses |
1,099.0 | 904.1 | ||||||
| Other income |
||||||||
| Net investment gains of Consolidated Funds |
424.0 | 211.5 | ||||||
|
|
|
|
|
|||||
| Income before provision for income taxes |
472.4 | 452.4 | ||||||
| Provision for income taxes |
16.0 | 24.9 | ||||||
|
|
|
|
|
|||||
| Net income |
456.4 | 427.5 | ||||||
| Net income attributable to non-controlling interests in consolidated entities |
324.5 | 168.0 | ||||||
|
|
|
|
|
|||||
| Net income attributable to Carlyle Holdings |
131.9 | 259.5 | ||||||
| Net income attributable to non-controlling interests in Carlyle Holdings |
107.3 | 225.7 | ||||||
|
|
|
|
|
|||||
| Net income attributable to The Carlyle Group L.P. |
$ | 24.6 | $ | 33.8 | ||||
|
|
|
|
|
|||||
| Net income attributable to The Carlyle Group L.P. per common unit |
||||||||
| Basic (1) |
$ | 0.46 | $ | 0.78 | ||||
|
|
|
|
|
|||||
| Diluted (1) |
$ | 0.41 | $ | 0.66 | ||||
|
|
|
|
|
|||||
| Weighted-average common units |
||||||||
| Basic |
52,501,412 | 43,343,268 | ||||||
|
|
|
|
|
|||||
| Diluted |
59,453,670 | 51,109,008 | ||||||
|
|
|
|
|
|||||
(1) - Excluded from net income attributable to The Carlyle Group L.P. was approximately $0.5 million which was allocable to participating securities under the two-class method for the three months ended March 31, 2014.
Page | 14
Total Segment Information (Unaudited)
The following table sets forth information in the format used by management when making resource deployment decisions and in assessing the performance of our segments. The information below is the aggregate results of our four segments.
| Three Months Ended | Twelve Months Ended | |||||||||||||||||||
| Mar 31, 2014 |
Mar 31, 2013 |
Dec 31, 2013 |
Mar 31, 2014 |
Mar 31, 2013 |
||||||||||||||||
| (Dollars in millions) | ||||||||||||||||||||
| Segment Revenues |
||||||||||||||||||||
| Fund level fee revenues |
||||||||||||||||||||
| Fund management fees |
$ | 287.8 | $ | 240.1 | $ | 283.5 | $ | 1,102.4 | $ | 957.9 | ||||||||||
| Portfolio advisory fees, net |
3.8 | 4.6 | 10.6 | 25.1 | 18.6 | |||||||||||||||
| Transaction fees, net |
3.2 | 10.4 | 1.6 | 17.5 | 35.2 | |||||||||||||||
|
|
|
|
|
|
|
|
|
|
|
|||||||||||
| Total fee revenues |
294.8 | 255.1 | 295.7 | 1,145.0 | 1,011.7 | |||||||||||||||
| Performance fees |
||||||||||||||||||||
| Realized |
249.4 | 248.9 | 584.0 | 1,129.1 | 836.2 | |||||||||||||||
| Unrealized |
355.7 | 342.7 | 560.3 | 1,177.7 | 119.9 | |||||||||||||||
|
|
|
|
|
|
|
|
|
|
|
|||||||||||
| Total performance fees |
605.1 | 591.6 | 1,144.3 | 2,306.8 | 956.1 | |||||||||||||||
| Investment income (loss) |
||||||||||||||||||||
| Realized |
5.3 | (9.3) | 6.0 | 25.2 | 4.9 | |||||||||||||||
| Unrealized |
(13.2) | 12.3 | (55.7) | (78.7) | 16.3 | |||||||||||||||
|
|
|
|
|
|
|
|
|
|
|
|||||||||||
| Total investment income (loss) |
(7.9) | 3.0 | (49.7) | (53.5) | 21.2 | |||||||||||||||
| Interest and other income |
4.5 | 2.4 | 3.9 | 15.0 | 13.5 | |||||||||||||||
|
|
|
|
|
|
|
|
|
|
|
|||||||||||
| Total revenues |
896.5 | 852.1 | 1,394.2 | 3,413.3 | 2,002.5 | |||||||||||||||
| Segment Expenses |
||||||||||||||||||||
| Compensation and benefits |
||||||||||||||||||||
| Direct base compensation |
126.7 | 108.0 | 115.6 | 454.7 | 424.2 | |||||||||||||||
| Indirect base compensation |
46.1 | 33.6 | 43.0 | 165.3 | 145.0 | |||||||||||||||
| Equity-based compensation |
14.0 | 2.6 | 4.9 | 27.1 | 4.4 | |||||||||||||||
| Performance fee related |
||||||||||||||||||||
| Realized |
108.6 | 107.4 | 227.3 | 452.5 | 335.3 | |||||||||||||||
| Unrealized |
189.9 | 129.5 | 325.1 | 676.1 | 76.3 | |||||||||||||||
|
|
|
|
|
|
|
|
|
|
|
|||||||||||
| Total compensation and benefits |
485.3 | 381.1 | 715.9 | 1,775.7 | 985.2 | |||||||||||||||
| General, administrative, and other indirect expenses |
71.7 | 62.3 | 85.1 | 318.8 | 234.1 | |||||||||||||||
| Depreciation and amortization expense |
5.4 | 6.3 | 5.6 | 23.4 | 22.6 | |||||||||||||||
| Interest expense |
12.2 | 8.5 | 11.7 | 47.3 | 23.2 | |||||||||||||||
|
|
|
|
|
|
|
|
|
|
|
|||||||||||
| Total expenses |
574.6 | 458.2 | 818.3 | 2,165.2 | 1,265.1 | |||||||||||||||
|
|
|
|
|
|
|
|
|
|
|
|||||||||||
| Economic Net Income |
$ | 321.9 | $ | 393.9 | $ | 575.9 | $ | 1,248.1 | $ | 737.4 | ||||||||||
|
|
|
|
|
|
|
|
|
|
|
|||||||||||
| (-) Net Performance Fees |
306.6 | 354.7 | 591.9 | 1,178.2 | 544.5 | |||||||||||||||
| (-) Investment Income (Loss) |
(7.9) | 3.0 | (49.7) | (53.5) | 21.2 | |||||||||||||||
| (+) Equity-based compensation |
14.0 | 2.6 | 4.9 | 27.1 | 4.4 | |||||||||||||||
|
|
|
|
|
|
|
|
|
|
|
|||||||||||
| (=) Fee Related Earnings |
$ | 37.2 | $ | 38.8 | $ | 38.6 | $ | 150.5 | $ | 176.1 | ||||||||||
|
|
|
|
|
|
|
|
|
|
|
|||||||||||
| (+) Realized Net Performance Fees |
140.8 | 141.5 | 356.7 | 676.6 | 500.9 | |||||||||||||||
| (+) Realized Investment Income (Loss) |
5.3 | (9.3) | 6.0 | 25.2 | 4.9 | |||||||||||||||
|
|
|
|
|
|
|
|
|
|
|
|||||||||||
| (=) Distributable Earnings |
$ | 183.3 | $ | 171.0 | $ | 401.3 | $ | 852.3 | $ | 681.9 | ||||||||||
|
|
|
|
|
|
|
|
|
|
|
|||||||||||
Page | 15
Total Segment Information (Unaudited), cont
| Three Months Ended | ||||||||||||||||||||||||||||
| Mar 31, 2014 vs. | ||||||||||||||||||||||||||||
| Mar 31, 2013 |
Jun 30, 2013 |
Sept 30, 2013 |
Dec 31, 2013 |
Mar 31, 2014 |
Mar 31, 2013 | Dec 31, 2013 | ||||||||||||||||||||||
| (Dollars in millions) | ||||||||||||||||||||||||||||
| Economic Net Income, Total Segments |
||||||||||||||||||||||||||||
| Revenues |
||||||||||||||||||||||||||||
| Segment fee revenues |
||||||||||||||||||||||||||||
| Fund management fees |
$ | 240.1 | $ | 249.9 | $ | 281.2 | $ | 283.5 | $ | 287.8 | $ | 47.7 | $ | 4.3 | ||||||||||||||
| Portfolio advisory fees, net |
4.6 | 5.7 | 5.0 | 10.6 | 3.8 | (0.8) | (6.8) | |||||||||||||||||||||
| Transaction fees, net |
10.4 | 6.8 | 5.9 | 1.6 | 3.2 | (7.2) | 1.6 | |||||||||||||||||||||
|
|
|
|
|
|
|
|
|
|
|
|
|
|
|
|||||||||||||||
| Total fee revenues |
255.1 | 262.4 | 292.1 | 295.7 | 294.8 | 39.7 | (0.9) | |||||||||||||||||||||
| Performance fees |
||||||||||||||||||||||||||||
| Realized |
248.9 | 192.6 | 103.1 | 584.0 | 249.4 | 0.5 | (334.6) | |||||||||||||||||||||
| Unrealized |
342.7 | 42.1 | 219.6 | 560.3 | 355.7 | 13.0 | (204.6) | |||||||||||||||||||||
|
|
|
|
|
|
|
|
|
|
|
|
|
|
|
|||||||||||||||
| Total performance fees |
591.6 | 234.7 | 322.7 | 1,144.3 | 605.1 | 13.5 | (539.2) | |||||||||||||||||||||
| Investment income (loss) |
||||||||||||||||||||||||||||
| Realized |
(9.3) | 14.6 | (0.7) | 6.0 | 5.3 | 14.6 | (0.7) | |||||||||||||||||||||
| Unrealized |
12.3 | (7.7) | (2.1) | (55.7) | (13.2) | (25.5) | 42.5 | |||||||||||||||||||||
|
|
|
|
|
|
|
|
|
|
|
|
|
|
|
|||||||||||||||
| Total investment income (loss) |
3.0 | 6.9 | (2.8) | (49.7) | (7.9) | (10.9) | 41.8 | |||||||||||||||||||||
| Interest and other income |
2.4 | 4.0 | 2.6 | 3.9 | 4.5 | 2.1 | 0.6 | |||||||||||||||||||||
|
|
|
|
|
|
|
|
|
|
|
|
|
|
|
|||||||||||||||
| Total revenues |
852.1 | 508.0 | 614.6 | 1,394.2 | 896.5 | 44.4 | (497.7) | |||||||||||||||||||||
| Expenses |
||||||||||||||||||||||||||||
| Compensation and benefits |
||||||||||||||||||||||||||||
| Direct base compensation |
108.0 | 101.0 | 111.4 | 115.6 | 126.7 | 18.7 | 11.1 | |||||||||||||||||||||
| Indirect base compensation |
33.6 | 35.0 | 41.2 | 43.0 | 46.1 | 12.5 | 3.1 | |||||||||||||||||||||
| Equity-based compensation |
2.6 | 4.2 | 4.0 | 4.9 | 14.0 | 11.4 | 9.1 | |||||||||||||||||||||
| Performance fee related |
||||||||||||||||||||||||||||
| Realized |
107.4 | 74.8 | 41.8 | 227.3 | 108.6 | 1.2 | (118.7) | |||||||||||||||||||||
| Unrealized |
129.5 | 37.4 | 123.7 | 325.1 | 189.9 | 60.4 | (135.2) | |||||||||||||||||||||
|
|
|
|
|
|
|
|
|
|
|
|
|
|
|
|||||||||||||||
| Total compensation and benefits |
381.1 | 252.4 | 322.1 | 715.9 | 485.3 | 104.2 | (230.6) | |||||||||||||||||||||
| General, administrative, and other indirect expenses |
62.3 | 82.0 | 80.0 | 85.1 | 71.7 | 9.4 | (13.4) | |||||||||||||||||||||
| Depreciation and amortization expense |
6.3 | 6.2 | 6.2 | 5.6 | 5.4 | (0.9) | (0.2) | |||||||||||||||||||||
| Interest expense |
8.5 | 11.6 | 11.8 | 11.7 | 12.2 | 3.7 | 0.5 | |||||||||||||||||||||
|
|
|
|
|
|
|
|
|
|
|
|
|
|
|
|||||||||||||||
| Total expenses |
458.2 | 352.2 | 420.1 | 818.3 | 574.6 | 116.4 | (243.7) | |||||||||||||||||||||
|
|
|
|
|
|
|
|
|
|
|
|
|
|
|
|||||||||||||||
| Economic Net Income |
$ | 393.9 | $ | 155.8 | $ | 194.5 | $ | 575.9 | $ | 321.9 | $ | (72.0) | $ | (254.0) | ||||||||||||||
|
|
|
|
|
|
|
|
|
|
|
|
|
|
|
|||||||||||||||
| (-) Net Performance Fees |
354.7 | 122.5 | 157.2 | 591.9 | 306.6 | (48.1) | (285.3) | |||||||||||||||||||||
| (-) Investment Income (Loss) |
3.0 | 6.9 | (2.8) | (49.7) | (7.9) | (10.9) | 41.8 | |||||||||||||||||||||
| (+) Equity-based compensation |
2.6 | 4.2 | 4.0 | 4.9 | 14.0 | 11.4 | 9.1 | |||||||||||||||||||||
|
|
|
|
|
|
|
|
|
|
|
|
|
|
|
|||||||||||||||
| (=) Fee Related Earnings |
$ | 38.8 | $ | 30.6 | $ | 44.1 | $ | 38.6 | $ | 37.2 | $ | (1.6) | $ | (1.4) | ||||||||||||||
|
|
|
|
|
|
|
|
|
|
|
|
|
|
|
|||||||||||||||
| (+) Realized Net Performance Fees |
141.5 | 117.8 | 61.3 | 356.7 | 140.8 | (0.7) | (215.9) | |||||||||||||||||||||
| (+) Realized Investment Income (Loss) |
(9.3) | 14.6 | (0.7) | 6.0 | 5.3 | 14.6 | (0.7) | |||||||||||||||||||||
|
|
|
|
|
|
|
|
|
|
|
|
|
|
|
|||||||||||||||
| (=) Distributable Earnings |
$ | 171.0 | $ | 163.0 | $ | 104.7 | $ | 401.3 | $ | 183.3 | $ | 12.3 | $ | (218.0) | ||||||||||||||
|
|
|
|
|
|
|
|
|
|
|
|
|
|
|
|||||||||||||||
Page | 16
Corporate Private Equity Segment Results (Unaudited)
| Three Months Ended | ||||||||||||||||||||||||||||
| Mar 31, 2014 vs. | ||||||||||||||||||||||||||||
| Mar 31, 2013 |
Jun 30, 2013 |
Sept 30, 2013 |
Dec 31, 2013 |
Mar 31, 2014 |
Mar 31, 2013 | Dec 31, 2013 | ||||||||||||||||||||||
| Corporate Private Equity | (Dollars in millions) | |||||||||||||||||||||||||||
| Revenues |
||||||||||||||||||||||||||||
| Segment fee revenues |
||||||||||||||||||||||||||||
| Fund management fees |
$ | 108.3 | $ | 108.8 | $ | 131.0 | $ | 123.5 | $ | 129.8 | $ | 21.5 | $ | 6.3 | ||||||||||||||
| Portfolio advisory fees, net |
4.1 | 4.9 | 4.7 | 9.5 | 3.5 | (0.6) | (6.0) | |||||||||||||||||||||
| Transaction fees, net |
10.4 | 4.0 | 5.7 | 0.6 | 3.2 | (7.2) | 2.6 | |||||||||||||||||||||
|
|
|
|
|
|
|
|
|
|
|
|
|
|
|
|||||||||||||||
| Total fee revenues |
122.8 | 117.7 | 141.4 | 133.6 | 136.5 | 13.7 | 2.9 | |||||||||||||||||||||
| Performance fees |
||||||||||||||||||||||||||||
| Realized |
212.3 | 151.4 | 79.1 | 471.7 | 234.7 | 22.4 | (237.0) | |||||||||||||||||||||
| Unrealized |
207.6 | 31.2 | 182.2 | 538.1 | 212.9 | 5.3 | (325.2) | |||||||||||||||||||||
|
|
|
|
|
|
|
|
|
|
|
|
|
|
|
|||||||||||||||
| Total performance fees |
419.9 | 182.6 | 261.3 | 1,009.8 | 447.6 | 27.7 | (562.2) | |||||||||||||||||||||
| Investment income (loss) |
||||||||||||||||||||||||||||
| Realized |
1.8 | 1.7 | 1.6 | 10.7 | 1.9 | 0.1 | (8.8) | |||||||||||||||||||||
| Unrealized |
2.8 | 2.4 | 5.5 | (0.3) | 5.4 | 2.6 | 5.7 | |||||||||||||||||||||
|
|
|
|
|
|
|
|
|
|
|
|
|
|
|
|||||||||||||||
| Total investment income (loss) |
4.6 | 4.1 | 7.1 | 10.4 | 7.3 | 2.7 | (3.1) | |||||||||||||||||||||
| Interest and other income |
1.0 | 1.7 | 1.5 | 2.3 | 2.2 | 1.2 | (0.1) | |||||||||||||||||||||
|
|
|
|
|
|
|
|
|
|
|
|
|
|
|
|||||||||||||||
| Total revenues |
548.3 | 306.1 | 411.3 | 1,156.1 | 593.6 | 45.3 | (562.5) | |||||||||||||||||||||
| Expenses |
||||||||||||||||||||||||||||
| Compensation and benefits |
||||||||||||||||||||||||||||
| Direct base compensation |
55.0 | 50.0 | 53.9 | 53.7 | 59.5 | 4.5 | 5.8 | |||||||||||||||||||||
| Indirect base compensation |
20.0 | 21.8 | 27.6 | 25.6 | 22.0 | 2.0 | (3.6) | |||||||||||||||||||||
| Equity-based compensation |
1.5 | 2.3 | 2.1 | 1.5 | 7.1 | 5.6 | 5.6 | |||||||||||||||||||||
| Performance fee related |
||||||||||||||||||||||||||||
| Realized |
101.6 | 65.1 | 34.6 | 200.4 | 101.3 | (0.3) | (99.1) | |||||||||||||||||||||
| Unrealized |
83.6 | 8.8 | 79.8 | 274.0 | 100.5 | 16.9 | (173.5) | |||||||||||||||||||||
|
|
|
|
|
|
|
|
|
|
|
|
|
|
|
|||||||||||||||
| Total compensation and benefits |
261.7 | 148.0 | 198.0 | 555.2 | 290.4 | 28.7 | (264.8) | |||||||||||||||||||||
| General, administrative, and other indirect expenses |
39.0 | 41.6 | 43.7 | 42.6 | 35.4 | (3.6) | (7.2) | |||||||||||||||||||||
| Depreciation and amortization expense |
3.5 | 3.4 | 3.3 | 3.0 | 2.7 | (0.8) | (0.3) | |||||||||||||||||||||
| Interest expense |
4.9 | 6.7 | 6.9 | 6.7 | 6.7 | 1.8 | - | |||||||||||||||||||||
|
|
|
|
|
|
|
|
|
|
|
|
|
|
|
|||||||||||||||
| Total expenses |
309.1 | 199.7 | 251.9 | 607.5 | 335.2 | 26.1 | (272.3) | |||||||||||||||||||||
|
|
|
|
|
|
|
|
|
|
|
|
|
|
|
|||||||||||||||
| Economic Net Income |
$ | 239.2 | $ | 106.4 | $ | 159.4 | $ | 548.6 | $ | 258.4 | $ | 19.2 | $ | (290.2) | ||||||||||||||
|
|
|
|
|
|
|
|
|
|
|
|
|
|
|
|||||||||||||||
| (-) Net Performance Fees |
234.7 | 108.7 | 146.9 | 535.4 | 245.8 | 11.1 | (289.6) | |||||||||||||||||||||
| (-) Investment Income |
4.6 | 4.1 | 7.1 | 10.4 | 7.3 | 2.7 | (3.1) | |||||||||||||||||||||
| (+) Equity-based compensation |
1.5 | 2.3 | 2.1 | 1.5 | 7.1 | 5.6 | 5.6 | |||||||||||||||||||||
|
|
|
|
|
|
|
|
|
|
|
|
|
|
|
|||||||||||||||
| (=) Fee Related Earnings |
$ | 1.4 | $ | (4.1) | $ | 7.5 | $ | 4.3 | $ | 12.4 | $ | 11.0 | $ | 8.1 | ||||||||||||||
|
|
|
|
|
|
|
|
|
|
|
|
|
|
|
|||||||||||||||
| (+) Realized Net Performance Fees |
110.7 | 86.3 | 44.5 | 271.3 | 133.4 | 22.7 | (137.9) | |||||||||||||||||||||
| (+) Realized Investment Income |
1.8 | 1.7 | 1.6 | 10.7 | 1.9 | 0.1 | (8.8) | |||||||||||||||||||||
|
|
|
|
|
|
|
|
|
|
|
|
|
|
|
|||||||||||||||
| (=) Distributable Earnings |
$ | 113.9 | $ | 83.9 | $ | 53.6 | $ | 286.3 | $ | 147.7 | $ | 33.8 | $ | (138.6) | ||||||||||||||
|
|
|
|
|
|
|
|
|
|
|
|
|
|
|
|||||||||||||||
Page | 17
Global Market Strategies Segment Results (Unaudited)
| Three Months Ended | ||||||||||||||||||||||||||||
| Mar 31, 2014 vs. | ||||||||||||||||||||||||||||
| Mar 31, 2013 |
Jun 30, 2013 |
Sept 30, 2013 |
Dec 31, 2013 |
Mar 31, 2014 |
Mar 31, 2013 | Dec 31, 2013 | ||||||||||||||||||||||
| Global Market Strategies | (Dollars in millions) | |||||||||||||||||||||||||||
| Revenues |
||||||||||||||||||||||||||||
| Segment fee revenues |
||||||||||||||||||||||||||||
| Fund management fees |
$ | 66.3 | $ | 73.8 | $ | 65.7 | $ | 69.4 | $ | 63.2 | $ | (3.1) | $ | (6.2) | ||||||||||||||
| Portfolio advisory fees, net |
0.2 | 0.5 | 0.1 | 0.6 | 0.1 | (0.1) | (0.5) | |||||||||||||||||||||
| Transaction fees, net |
- | 0.1 | - | - | - | - | - | |||||||||||||||||||||
|
|
|
|
|
|
|
|
|
|
|
|
|
|
|
|||||||||||||||
| Total fee revenues |
66.5 | 74.4 | 65.8 | 70.0 | 63.3 | (3.2) | (6.7) | |||||||||||||||||||||
| Performance fees |
||||||||||||||||||||||||||||
| Realized |
24.1 | 17.9 | 5.8 | 104.1 | 8.3 | (15.8) | (95.8) | |||||||||||||||||||||
| Unrealized |
64.3 | 23.0 | (13.6) | (41.3) | 49.5 | (14.8) | 90.8 | |||||||||||||||||||||
|
|
|
|
|
|
|
|
|
|
|
|
|
|
|
|||||||||||||||
| Total performance fees |
88.4 | 40.9 | (7.8) | 62.8 | 57.8 | (30.6) | (5.0) | |||||||||||||||||||||
| Investment income (loss) |
||||||||||||||||||||||||||||
| Realized |
1.9 | 12.2 | 2.0 | 1.4 | 1.3 | (0.6) | (0.1) | |||||||||||||||||||||
| Unrealized |
5.1 | (11.9) | 3.2 | 2.1 | 1.9 | (3.2) | (0.2) | |||||||||||||||||||||
|
|
|
|
|
|
|
|
|
|
|
|
|
|
|
|||||||||||||||
| Total investment income (loss) |
7.0 | 0.3 | 5.2 | 3.5 | 3.2 | (3.8) | (0.3) | |||||||||||||||||||||
| Interest and other income |
1.1 | 1.5 | 0.7 | 0.9 | 1.3 | 0.2 | 0.4 | |||||||||||||||||||||
|
|
|
|
|
|
|
|
|
|
|
|
|
|
|
|||||||||||||||
| Total revenues |
163.0 | 117.1 | 63.9 | 137.2 | 125.6 | (37.4) | (11.6) | |||||||||||||||||||||
| Expenses |
||||||||||||||||||||||||||||
| Compensation and benefits |
||||||||||||||||||||||||||||
| Direct base compensation |
25.7 | 24.9 | 23.6 | 25.4 | 27.5 | 1.8 | 2.1 | |||||||||||||||||||||
| Indirect base compensation |
4.8 | 5.5 | 4.6 | 6.9 | 6.0 | 1.2 | (0.9) | |||||||||||||||||||||
| Equity-based compensation |
0.4 | 0.6 | 0.6 | 1.4 | 2.7 | 2.3 | 1.3 | |||||||||||||||||||||
| Performance fee related |
||||||||||||||||||||||||||||
| Realized |
9.7 | 6.7 | 0.8 | 24.9 | 3.8 | (5.9) | (21.1) | |||||||||||||||||||||
| Unrealized |
6.2 | 9.6 | 3.1 | (5.2) | 14.8 | 8.6 | 20.0 | |||||||||||||||||||||
|
|
|
|
|
|
|
|
|
|
|
|
|
|
|
|||||||||||||||
| Total compensation and benefits |
46.8 | 47.3 | 32.7 | 53.4 | 54.8 | 8.0 | 1.4 | |||||||||||||||||||||
| General, administrative, and other indirect expenses |
9.5 | 19.5 | 17.8 | 14.1 | 11.6 | 2.1 | (2.5) | |||||||||||||||||||||
| Depreciation and amortization expense |
1.2 | 1.1 | 1.2 | 1.0 | 0.9 | (0.3) | (0.1) | |||||||||||||||||||||
| Interest expense |
1.5 | 2.1 | 2.1 | 2.2 | 2.1 | 0.6 | (0.1) | |||||||||||||||||||||
|
|
|
|
|
|
|
|
|
|
|
|
|
|
|
|||||||||||||||
| Total expenses |
59.0 | 70.0 | 53.8 | 70.7 | 69.4 | 10.4 | (1.3) | |||||||||||||||||||||
|
|
|
|
|
|
|
|
|
|
|
|
|
|
|
|||||||||||||||
| Economic Net Income |
$ | 104.0 | $ | 47.1 | $ | 10.1 | $ | 66.5 | $ | 56.2 | $ | (47.8) | $ | (10.3) | ||||||||||||||
|
|
|
|
|
|
|
|
|
|
|
|
|
|
|
|||||||||||||||
| (-) Net Performance Fees |
72.5 | 24.6 | (11.7) | 43.1 | 39.2 | (33.3) | (3.9) | |||||||||||||||||||||
| (-) Investment Income |
7.0 | 0.3 | 5.2 | 3.5 | 3.2 | (3.8) | (0.3) | |||||||||||||||||||||
| (+) Equity-based compensation |
0.4 | 0.6 | 0.6 | 1.4 | 2.7 | 2.3 | 1.3 | |||||||||||||||||||||
|
|
|
|
|
|
|
|
|
|
|
|
|
|
|
|||||||||||||||
| (=) Fee Related Earnings |
$ | 24.9 | $ | 22.8 | $ | 17.2 | $ | 21.3 | $ | 16.5 | $ | (8.4) | $ | (4.8) | ||||||||||||||
|
|
|
|
|
|
|
|
|
|
|
|
|
|
|
|||||||||||||||
| (+) Realized Net Performance Fees |
14.4 | 11.2 | 5.0 | 79.2 | 4.5 | (9.9) | (74.7) | |||||||||||||||||||||
| (+) Realized Investment Income |
1.9 | 12.2 | 2.0 | 1.4 | 1.3 | (0.6) | (0.1) | |||||||||||||||||||||
|
|
|
|
|
|
|
|
|
|
|
|
|
|
|
|||||||||||||||
| (=) Distributable Earnings |
$ | 41.2 | $ | 46.2 | $ | 24.2 | $ | 101.9 | $ | 22.3 | $ | (18.9) | $ | (79.6) | ||||||||||||||
|
|
|
|
|
|
|
|
|
|
|
|
|
|
|
|||||||||||||||
Page | 18
Real Assets Segment Results (Unaudited)
| Three Months Ended | ||||||||||||||||||||||||||||
| Mar 31, 2014 vs. | ||||||||||||||||||||||||||||
| Mar 31, 2013 |
Jun 30, 2013 |
Sept 30, 2013 |
Dec 31, 2013 |
Mar 31, 2014 |
Mar 31, 2013 | Dec 31, 2013 | ||||||||||||||||||||||
| Real Assets | (Dollars in millions) | |||||||||||||||||||||||||||
| Revenues |
||||||||||||||||||||||||||||
| Segment fee revenues |
||||||||||||||||||||||||||||
| Fund management fees |
$ | 47.0 | $ | 46.4 | $ | 47.3 | $ | 48.2 | $ | 50.3 | $ | 3.3 | $ | 2.1 | ||||||||||||||
| Portfolio advisory fees, net |
0.3 | 0.3 | 0.2 | 0.5 | 0.2 | (0.1) | (0.3) | |||||||||||||||||||||
| Transaction fees, net |
- | 2.7 | 0.2 | 1.0 | - | - | (1.0) | |||||||||||||||||||||
|
|
|
|
|
|
|
|
|
|
|
|
|
|
|
|||||||||||||||
| Total fee revenues |
47.3 | 49.4 | 47.7 | 49.7 | 50.5 | 3.2 | 0.8 | |||||||||||||||||||||
| Performance fees |
||||||||||||||||||||||||||||
| Realized |
11.0 | 20.6 | 12.5 | (3.6) | 0.5 | (10.5) | 4.1 | |||||||||||||||||||||
| Unrealized |
49.5 | (33.4) | 12.1 | 15.2 | 14.0 | (35.5) | (1.2) | |||||||||||||||||||||
|
|
|
|
|
|
|
|
|
|
|
|
|
|
|
|||||||||||||||
| Total performance fees |
60.5 | (12.8) | 24.6 | 11.6 | 14.5 | (46.0) | 2.9 | |||||||||||||||||||||
| Investment income (loss) |
||||||||||||||||||||||||||||
| Realized |
(13.0) | 0.7 | (4.3) | (6.1) | 2.1 | 15.1 | 8.2 | |||||||||||||||||||||
| Unrealized |
4.5 | 1.7 | (10.9) | (57.6) | (20.6) | (25.1) | 37.0 | |||||||||||||||||||||
|
|
|
|
|
|
|
|
|
|
|
|
|
|
|
|||||||||||||||
| Total investment income (loss) |
(8.5) | 2.4 | (15.2) | (63.7) | (18.5) | (10.0) | 45.2 | |||||||||||||||||||||
| Interest and other income |
0.3 | 0.6 | 0.4 | 0.7 | 0.7 | 0.4 | - | |||||||||||||||||||||
|
|
|
|
|
|
|
|
|
|
|
|
|
|
|
|||||||||||||||
| Total revenues |
99.6 | 39.6 | 57.5 | (1.7) | 47.2 | (52.4) | 48.9 | |||||||||||||||||||||
| Expenses |
||||||||||||||||||||||||||||
| Compensation and benefits |
||||||||||||||||||||||||||||
| Direct base compensation |
17.9 | 18.2 | 17.1 | 17.0 | 18.7 | 0.8 | 1.7 | |||||||||||||||||||||
| Indirect base compensation |
7.5 | 6.4 | 7.9 | 8.6 | 14.3 | 6.8 | 5.7 | |||||||||||||||||||||
| Equity-based compensation |
0.6 | 1.2 | 1.2 | 1.6 | 3.5 | 2.9 | 1.9 | |||||||||||||||||||||
| Performance fee related |
||||||||||||||||||||||||||||
| Realized |
(4.9) | 1.6 | 3.8 | (4.5) | 0.2 | 5.1 | 4.7 | |||||||||||||||||||||
| Unrealized |
23.6 | 2.9 | 11.1 | 19.1 | 8.4 | (15.2) | (10.7) | |||||||||||||||||||||
|
|
|
|
|
|
|
|
|
|
|
|
|
|
|
|||||||||||||||
| Total compensation and benefits |
44.7 | 30.3 | 41.1 | 41.8 | 45.1 | 0.4 | 3.3 | |||||||||||||||||||||
| General, administrative, and other indirect expenses |
10.4 | 16.5 | 12.8 | 18.7 | 15.5 | 5.1 | (3.2) | |||||||||||||||||||||
| Depreciation and amortization expense |
1.1 | 1.2 | 1.0 | 1.0 | 0.9 | (0.2) | (0.1) | |||||||||||||||||||||
| Interest expense |
1.6 | 2.2 | 2.2 | 2.2 | 2.2 | 0.6 | - | |||||||||||||||||||||
|
|
|
|
|
|
|
|
|
|
|
|
|
|
|
|||||||||||||||
| Total expenses |
57.8 | 50.2 | 57.1 | 63.7 | 63.7 | 5.9 | - | |||||||||||||||||||||
|
|
|
|
|
|
|
|
|
|
|
|
|
|
|
|||||||||||||||
| Economic Net Income (Loss) |
$ | 41.8 | $ | (10.6) | $ | 0.4 | $ | (65.4) | $ | (16.5) | $ | (58.3) | $ | 48.9 | ||||||||||||||
|
|
|
|
|
|
|
|
|
|
|
|
|
|
|
|||||||||||||||
| (-) Net Performance Fees |
41.8 | (17.3) | 9.7 | (3.0) | 5.9 | (35.9) | 8.9 | |||||||||||||||||||||
| (-) Investment Income (Loss) |
(8.5) | 2.4 | (15.2) | (63.7) | (18.5) | (10.0) | 45.2 | |||||||||||||||||||||
| (+) Equity-based compensation |
0.6 | 1.2 | 1.2 | 1.6 | 3.5 | 2.9 | 1.9 | |||||||||||||||||||||
|
|
|
|
|
|
|
|
|
|
|
|
|
|
|
|||||||||||||||
| (=) Fee Related Earnings |
$ | 9.1 | $ | 5.5 | $ | 7.1 | $ | 2.9 | $ | (0.4) | $ | (9.5) | $ | (3.3) | ||||||||||||||
|
|
|
|
|
|
|
|
|
|
|
|
|
|
|
|||||||||||||||
| (+) Realized Net Performance Fees |
15.9 | 19.0 | 8.7 | 0.9 | 0.3 | (15.6) | (0.6) | |||||||||||||||||||||
| (+) Realized Investment Income (Loss) |
(13.0) | 0.7 | (4.3) | (6.1) | 2.1 | 15.1 | 8.2 | |||||||||||||||||||||
|
|
|
|
|
|
|
|
|
|
|
|
|
|
|
|||||||||||||||
| (=) Distributable Earnings |
$ | 12.0 | $ | 25.2 | $ | 11.5 | $ | (2.3) | $ | 2.0 | $ | (10.0) | $ | 4.3 | ||||||||||||||
|
|
|
|
|
|
|
|
|
|
|
|
|
|
|
|||||||||||||||
Page | 19
Solutions Segment Results (Unaudited)
| Three Months Ended | ||||||||||||||||||||||||||||
| Mar 31, 2014 vs. | ||||||||||||||||||||||||||||
| Mar 31, 2013 |
Jun 30, 2013 |
Sept 30, 2013 (1) |
Dec 31, 2013 (2) |
Mar 31, 2014 (3) |
Mar 31, 2013 | Dec 31, 2013 | ||||||||||||||||||||||
| Solutions | (Dollars in millions) | |||||||||||||||||||||||||||
| Revenues |
||||||||||||||||||||||||||||
| Segment fee revenues |
||||||||||||||||||||||||||||
| Fund management fees |
$ | 18.5 | $ | 20.9 | $ | 37.2 | $ | 42.4 | $ | 44.5 | $ | 26.0 | $ | 2.1 | ||||||||||||||
| Portfolio advisory fees, net |
- | - | - | - | - | - | - | |||||||||||||||||||||
| Transaction fees, net |
- | - | - | - | - | - | - | |||||||||||||||||||||
|
|
|
|
|
|
|
|
|
|
|
|
|
|
|
|||||||||||||||
| Total fee revenues |
18.5 | 20.9 | 37.2 | 42.4 | 44.5 | 26.0 | 2.1 | |||||||||||||||||||||
| Performance fees |
||||||||||||||||||||||||||||
| Realized |
1.5 | 2.7 | 5.7 | 11.8 | 5.9 | 4.4 | (5.9) | |||||||||||||||||||||
| Unrealized |
21.3 | 21.3 | 38.9 | 48.3 | 79.3 | 58.0 | 31.0 | |||||||||||||||||||||
|
|
|
|
|
|
|
|
|
|
|
|
|
|
|
|||||||||||||||
| Total performance fees |
22.8 | 24.0 | 44.6 | 60.1 | 85.2 | 62.4 | 25.1 | |||||||||||||||||||||
| Investment income (loss) |
||||||||||||||||||||||||||||
| Realized |
- | - | - | - | - | - | - | |||||||||||||||||||||
| Unrealized |
(0.1) | 0.1 | 0.1 | 0.1 | 0.1 | 0.2 | - | |||||||||||||||||||||
|
|
|
|
|
|
|
|
|
|
|
|
|
|
|
|||||||||||||||
| Total investment income (loss) |
(0.1) | 0.1 | 0.1 | 0.1 | 0.1 | 0.2 | - | |||||||||||||||||||||
| Interest and other income |
- | 0.2 | - | - | 0.3 | 0.3 | 0.3 | |||||||||||||||||||||
|
|
|
|
|
|
|
|
|
|
|
|
|
|
|
|||||||||||||||
| Total revenues |
41.2 | 45.2 | 81.9 | 102.6 | 130.1 | 88.9 | 27.5 | |||||||||||||||||||||
| Expenses |
||||||||||||||||||||||||||||
| Compensation and benefits |
||||||||||||||||||||||||||||
| Direct base compensation |
9.4 | 7.9 | 16.8 | 19.5 | 21.0 | 11.6 | 1.5 | |||||||||||||||||||||
| Indirect base compensation |
1.3 | 1.3 | 1.1 | 1.9 | 3.8 | 2.5 | 1.9 | |||||||||||||||||||||
| Equity-based compensation |
0.1 | 0.1 | 0.1 | 0.4 | 0.7 | 0.6 | 0.3 | |||||||||||||||||||||
| Performance fee related |
||||||||||||||||||||||||||||
| Realized |
1.0 | 1.4 | 2.6 | 6.5 | 3.3 | 2.3 | (3.2) | |||||||||||||||||||||
| Unrealized |
16.1 | 16.1 | 29.7 | 37.2 | 66.2 | 50.1 | 29.0 | |||||||||||||||||||||
|
|
|
|
|
|
|
|
|
|
|
|
|
|
|
|||||||||||||||
| Total compensation and benefits |
27.9 | 26.8 | 50.3 | 65.5 | 95.0 | 67.1 | 29.5 | |||||||||||||||||||||
| General, administrative, and other indirect expenses |
3.4 | 4.4 | 5.7 | 9.7 | 9.2 | 5.8 | (0.5) | |||||||||||||||||||||
| Depreciation and amortization expense |
0.5 | 0.5 | 0.7 | 0.6 | 0.9 | 0.4 | 0.3 | |||||||||||||||||||||
| Interest expense |
0.5 | 0.6 | 0.6 | 0.6 | 1.2 | 0.7 | 0.6 | |||||||||||||||||||||
|
|
|
|
|
|
|
|
|
|
|
|
|
|
|
|||||||||||||||
| Total expenses |
32.3 | 32.3 | 57.3 | 76.4 | 106.3 | 74.0 | 29.9 | |||||||||||||||||||||
|
|
|
|
|
|
|
|
|
|
|
|
|
|
|
|||||||||||||||
| Economic Net Income |
$ | 8.9 | $ | 12.9 | $ | 24.6 | $ | 26.2 | $ | 23.8 | $ | 14.9 | $ | (2.4) | ||||||||||||||
|
|
|
|
|
|
|
|
|
|
|
|
|
|
|
|||||||||||||||
| (-) Net Performance Fees |
5.7 | 6.5 | 12.3 | 16.4 | 15.7 | 10.0 | (0.7) | |||||||||||||||||||||
| (-) Investment Income (Loss) |
(0.1) | 0.1 | 0.1 | 0.1 | 0.1 | 0.2 | - | |||||||||||||||||||||
| (+) Equity-based compensation |
0.1 | 0.1 | 0.1 | 0.4 | 0.7 | 0.6 | 0.3 | |||||||||||||||||||||
|
|
|
|
|
|
|
|
|
|
|
|
|
|
|
|||||||||||||||
| (=) Fee Related Earnings |
$ | 3.4 | $ | 6.4 | $ | 12.3 | $ | 10.1 | $ | 8.7 | $ | 5.3 | $ | (1.4) | ||||||||||||||
| (+) Realized Net Performance Fees |
0.5 | 1.3 | 3.1 | 5.3 | 2.6 | 2.1 | (2.7) | |||||||||||||||||||||
| (+) Realized Investment Income |
- | - | - | - | - | - | - | |||||||||||||||||||||
|
|
|
|
|
|
|
|
|
|
|
|
|
|
|
|||||||||||||||
| (=) Distributable Earnings |
$ | 3.9 | $ | 7.7 | $ | 15.4 | $ | 15.4 | $ | 11.3 | $ | 7.4 | $ | (4.1) | ||||||||||||||
|
|
|
|
|
|
|
|
|
|
|
|
|
|
|
|||||||||||||||
(1) - During Q3 2013, Carlyle acquired the remaining 40% ownership interest in AlpInvest. As such, amounts since the acquisition represent 100% of the financial results of AlpInvest. Prior to Q3 2013, amounts represent Carlyle’s 60% economic interest in Alpinvest.
(2) - During Q4 2013, Carlyle acquired Metropolitan Real Estate Equity Management, LLC (“Metropolitan”). As such, amounts since the acquisition include the financial results of Metropolitan.
(3) - During Q1 2014, Carlyle acquired Diversified Global Asset Management Corporation (“DGAM”). As such, amounts since the acquisition include the financial results of DGAM.
Page | 20
Total Assets Under Management Roll Forward (Unaudited)
| Corporate Private Equity | Global Market Strategies (8) |
Real Assets (9) | Solutions (10) | Total | ||||||||||||||||||||||||||||||||||||||||||||||||||||||||
| (USD in millions) | Available Capital |
Fair Value of Capital |
Total AUM |
Available Capital |
Fair Value of Capital |
Total AUM |
Available Capital |
Fair Value of Capital |
Total AUM |
Available Capital |
Fair Value of Capital |
Total AUM |
Available Capital |
Fair Value of Capital |
Total AUM |
|||||||||||||||||||||||||||||||||||||||||||||
|
|
|
|
|
|
|
|
|
|
|
|||||||||||||||||||||||||||||||||||||||||||||||||||
| Balance, As of December 31, 2013 |
$ | 24,743 | $ | 40,122 | $ | 64,865 | $ | 1,458 | $ | 34,019 | $ | 35,477 | $ | 8,754 | $ | 29,910 | $ | 38,664 | $ | 17,063 | $ | 32,741 | $ | 49,804 | $ | 52,018 | $ | 136,792 | $ | 188,810 | ||||||||||||||||||||||||||||||
| Acquisitions |
- | - | - | - | - | - | - | - | - | - | 2,993 | 2,993 | - | 2,993 | 2,993 | |||||||||||||||||||||||||||||||||||||||||||||
| Commitments (1) |
(86) | - | (86) | - | - | - | 1,665 | - | 1,665 | 4,534 | - | 4,534 | 6,113 | - | 6,113 | |||||||||||||||||||||||||||||||||||||||||||||
| Capital Called, net (2) |
(886) | 753 | (133) | (32) | 145 | 113 | (512) | 765 | 253 | (919) | 858 | (61) | (2,349) | 2,521 | 172 | |||||||||||||||||||||||||||||||||||||||||||||
| Distributions (3) |
130 | (3,197) | (3,067) | 71 | (190) | (119) | 209 | (1,352) | (1,143) | 58 | (2,337) | (2,279) | 468 | (7,076) | (6,608) | |||||||||||||||||||||||||||||||||||||||||||||
| Subscriptions, net of Redemptions (4) |
- | - | - | - | 173 | 173 | - | - | - | - | (28) | (28) | - | 145 | 145 | |||||||||||||||||||||||||||||||||||||||||||||
| Changes in CLO collateral |
- | - | - | - | 544 | 544 | - | - | - | - | - | - | - | 544 | 544 | |||||||||||||||||||||||||||||||||||||||||||||
| Market Appreciation/ |
- | 2,844 | 2,844 | - | 354 | 354 | - | 1,238 | 1,238 | - | 2,239 | 2,239 | - | 6,675 | 6,675 | |||||||||||||||||||||||||||||||||||||||||||||
| Foreign Exchange and other (7) |
8 | 29 | 37 | - | (5) | (5) | (1) | 27 | 26 | 19 | 24 | 43 | 26 | 75 | 101 | |||||||||||||||||||||||||||||||||||||||||||||
|
|
|
|
|
|
|
|
|
|
|
|||||||||||||||||||||||||||||||||||||||||||||||||||
| Balance, As of March 31, 2014 |
$ | 23,909 | $ | 40,551 | $ | 64,460 | $ | 1,497 | $ | 35,040 | $ | 36,537 | $ | 10,115 | $ | 30,588 | $ | 40,703 | $ | 20,755 | $ | 36,490 | $ | 57,245 | $ | 56,276 | $ | 142,669 | $ | 198,945 | ||||||||||||||||||||||||||||||
|
|
|
|
|
|
|
|
|
|
|
|||||||||||||||||||||||||||||||||||||||||||||||||||
| Balance, As of March 31, 2013 |
$ | 17,062 | $ | 38,057 | $ | 55,119 | $ | 1,762 | $ | 31,326 | $ | 33,088 | $ | 9,521 | $ | 30,819 | $ | 40,340 | $ | 17,853 | $ | 29,913 | $ | 47,766 | $ | 46,198 | $ | 130,115 | $ | 176,313 | ||||||||||||||||||||||||||||||
| Acquisitions |
- | - | - | - | 78 | 78 | - | - | - | 622 | 4,514 | 5,136 | 622 | 4,592 | 5,214 | |||||||||||||||||||||||||||||||||||||||||||||
| Commitments (1) |
9,954 | - | 9,954 | 331 | - | 331 | 3,207 | - | 3,207 | 5,074 | - | 5,074 | 18,566 | - | 18,566 | |||||||||||||||||||||||||||||||||||||||||||||
| Capital Called, net (2) |
(4,259) | 3,919 | (340) | (891) | 1,282 | 391 | (3,596) | 3,988 | 392 | (3,895) | 3,860 | (35) | (12,641) | 13,049 | 408 | |||||||||||||||||||||||||||||||||||||||||||||
| Distributions (3) |
1,058 | (11,996) | (10,938) | 295 | (937) | (642) | 951 | (6,362) | (5,411) | 466 | (9,384) | (8,918) | 2,770 | (28,679) | (25,909) | |||||||||||||||||||||||||||||||||||||||||||||
| Subscriptions, net of Redemptions (4) |
- | - | - | - | 1,163 | 1,163 | - | - | - | - | (28) | (28) | - | 1,135 | 1,135 | |||||||||||||||||||||||||||||||||||||||||||||
| Changes in CLO collateral |
- | - | - | - | 612 | 612 | - | - | - | - | - | - | - | 612 | 612 | |||||||||||||||||||||||||||||||||||||||||||||
| Market Appreciation/ |
- | 10,060 | 10,060 | - | 1,056 | 1,056 | - | 2,046 | 2,046 | - | 6,594 | 6,594 | - | 19,756 | 19,756 | |||||||||||||||||||||||||||||||||||||||||||||
| Foreign Exchange and other (7) |
94 | 511 | 605 | - | 460 | 460 | 32 | 97 | 129 | 635 | 1,021 | 1,656 | 761 | 2,089 | 2,850 | |||||||||||||||||||||||||||||||||||||||||||||
|
|
|
|
|
|
|
|
|
|
|
|||||||||||||||||||||||||||||||||||||||||||||||||||
| Balance, As of March 31, 2014 |
$ | 23,909 | $ | 40,551 | $ | 64,460 | $ | 1,497 | $ | 35,040 | $ | 36,537 | $ | 10,115 | $ | 30,588 | $ | 40,703 | $ | 20,755 | $ | 36,490 | $ | 57,245 | $ | 56,276 | $ | 142,669 | $ | 198,945 | ||||||||||||||||||||||||||||||
|
|
|
|
|
|
|
|
|
|
|
|||||||||||||||||||||||||||||||||||||||||||||||||||
(1) Represents capital raised by our carry funds, NGP management fee funds, NGP carry funds and fund of funds vehicles, net of expired available capital.
(2) Represents capital called by our carry funds, NGP management fee funds, NGP carry funds and fund of funds vehicles, net of fund fees and expenses. Equity invested amounts may vary from capital called due to timing differences between investment acquisition and capital call dates.
(3) Represents distributions from our carry funds, NGP mangement fee funds, NGP carry fundes, and fund of funds vehicles, net of amounts recycled. Distributions are based on when proceeds are actually distributed to investors, which may differ from when they are realized.
(4) Represents the net result of subscriptions to and redemptions from our hedge funds and fund of hedge funds vehicles.
(5) Represents the change in the aggregate collateral balance and principal cash at par of the CLOs.
(6) Market Appreciation/(Depreciation) represents realized and unrealized gains (losses) on portfolio investments and changes in the net asset value of our hedge funds and fund of hedge funds vehicles.
(7) Includes onboarding of fully committed existing funds from another manager and represents the impact of foreign exchange rate fluctuations on the translation of our non-U.S. dollar denominated funds and other changes in Total AUM. Activity during the period is translated at the average rate for the period. Ending balances are translated at the spot rate as of the period end.
(8) Ending balance is comprised of approximately $17.8 billion from our structured credit funds, $14.6 billion in our hedge funds, $3.8 billion (including $1.5 billion of Available Capital) in our carry funds and $0.4 billion from our business development companies.
(9) Amounts related to the NGP management fee funds and NGP carry funds are based on the latest available information (in most cases as of December 31, 2013).
(10) The fair market values for our Solutions fund of funds vehicles are based on the latest available valuations of the underlying limited partnership interests (in most cases as of December 31, 2013) as provided by their general partners, plus the net cash flows since the latest valuation, up to March 31, 2014.
Page | 21
Fee-Earning AUM Roll Forward (Unaudited)
| For the Three Months Ended March 31, 2014 | ||||||||||||||||||||
| (USD in millions) | Corporate Private Equity |
Global Market Strategies |
Real Assets (7) |
Solutions | Total | |||||||||||||||
|
|
|
|||||||||||||||||||
| Fee-earning AUM |
||||||||||||||||||||
| Balance, Beginning of Period |
$ | 43,033 | $ | 33,411 | $ | 28,438 | $ | 35,067 | $ | 139,949 | ||||||||||
| Acquisitions |
- | - | - | 2,894 | 2,894 | |||||||||||||||
| Inflows, including Commitments(1) |
697 | 136 | 408 | 700 | 1,941 | |||||||||||||||
| Outflows, including Distributions(2) |
(886) | (301) | (1,454) | (1,097) | (3,738) | |||||||||||||||
| Subscriptions, net of Redemptions (3) |
- | 103 | - | (28) | 75 | |||||||||||||||
| Changes in CLO collateral balances (4) |
- | 719 | - | - | 719 | |||||||||||||||
| Market Appreciation/(Depreciation) (5) |
- | 282 | 3 | (34) | 251 | |||||||||||||||
| Foreign Exchange and other (6) |
14 | (4) | 21 | (34) | (3) | |||||||||||||||
|
|
|
|||||||||||||||||||
| Balance, End of Period |
$ | 42,858 | $ | 34,346 | $ | 27,416 | $ | 37,468 | $ | 142,088 | ||||||||||
|
|
|
|||||||||||||||||||
| For the Twelve Months Ended March 31, 2014 | ||||||||||||||||||||
| (USD in millions) | Corporate Private Equity |
Global Market Strategies |
Real Assets (7) |
Solutions | Total | |||||||||||||||
|
|
|
|||||||||||||||||||
| Fee-earning AUM |
||||||||||||||||||||
| Balance, Beginning of Period |
$ | 33,195 | $ | 31,436 | $ | 29,419 | $ | 28,854 | $ | 122,904 | ||||||||||
| Acquisitions |
- | 78 | - | 5,051 | 5,129 | |||||||||||||||
| Inflows, including Commitments(1) |
17,485 | 721 | 2,280 | 7,061 | 27,547 | |||||||||||||||
| Outflows, including Distributions(2) |
(7,569) | (551) | (4,458) | (5,854) | (18,432) | |||||||||||||||
| Subscriptions, net of Redemptions (3) |
- | 1,118 | - | (28) | 1,090 | |||||||||||||||
| Changes in CLO collateral balances (4) |
- | 479 | - | - | 479 | |||||||||||||||
| Market Appreciation/(Depreciation) (5) |
- | 627 | 3 | (14) | 616 | |||||||||||||||
| Foreign Exchange and other (6) |
(253) | 438 | 172 | 2,398 | 2,755 | |||||||||||||||
|
|
|
|||||||||||||||||||
| Balance, End of Period |
$ | 42,858 | $ | 34,346 | $ | 27,416 | $ | 37,468 | $ | 142,088 | ||||||||||
|
|
|
|||||||||||||||||||
(1) Inflows represent limited partner capital raised and capital invested by our carry funds, NGP management fee funds, NGP carry funds and fund of funds vehicles outside the investment period, weighted-average investment period, or commitment fee period.
(2) Outflows represent limited partner distributions from our carry funds and fund of funds vehicles and changes in basis for our carry funds, NGP management fee funds, NGP carry funds and fund of funds vehicles where the investment period, weighted-average investment period, or commitment fee period has expired.
(3) Represents the net result of subscriptions to and redemptions from our hedge funds and fund of hedge funds vehicles.
(4) Represent the change in the aggregate Fee-earning collateral balances at par of our CLOs, as of the quarterly cut-off dates.
(5) Market Appreciation/(Depreciation) represents changes in the net asset value of our hedge funds, fund of hedge funds vehicles, and of our fund of funds vehicles based on the lower of cost or fair value.
(6) Includes funds with fees based on gross asset value, onboarding of fully committed existing funds from another manager and represents the impact of foreign exchange rate fluctuations on the translation of our non-U.S. dollar denominated funds. Activity during the period is translated at the average rate for the period. Ending balances are translated at the spot rate as of the period end.
(7) Energy I, Energy II, Energy III, Energy IV, Renew I, and Renew II (collectively, the “Legacy Energy Funds”), are managed with Riverstone Holdings LLC and its affiliates. Affiliates of both Carlyle and Riverstone act as investment advisers to each of the Legacy Energy Funds. With the exception of Energy IV and Renew II, where Carlyle has a minority representation on the funds’ management committees, management of each of the Legacy Energy Funds is vested in committees with equal representation by Carlyle and Riverstone, and the consent of representatives of both Carlyle and Riverstone are required for investment decisions. As of March 31, 2014, the Legacy Energy Funds had, in the aggregate, approximately $12.5 billion in AUM and $7.3 billion in Fee-earning AUM. NGP VII, NGP VIII, NGP IX, NGP X, or in the case of NGP M&R, NGP ETP I, NGP ETP II, and NGPC, certain affiliated entities (collectively, the “NGP management fee funds”) and NGP Agribusiness (the “NGP carry fund”), are managed by NGP Energy Capital Management. As of March 31, 2014, the NGP management fee and carry funds had, in the aggregate, approximately $12.3 billion in AUM and $9.2 billion in Fee-earning AUM.
Page | 22
Corporate Private Equity and Real Assets Fund Performance (Unaudited)
The fund return information reflected in this discussion and analysis is not indicative of the performance of The Carlyle Group L.P. and is also not necessarily indicative of the future performance of any particular fund. An investment in The Carlyle Group L.P. is not an investment in any of our funds. There can be no assurance that any of our existing or future funds will achieve similar returns.
| TOTAL INVESTMENTS | REALIZED/PARTIALLY REALIZED INVESTMENTS (5) | |||||||||||||||||||||||||||||||||||
|
|
|
|
| |||||||||||||||||||||||||||||||||
| as of March 31, 2014 | as of March 31, 2014 | |||||||||||||||||||||||||||||||||||
|
|
|
|
| |||||||||||||||||||||||||||||||||
| Fund
Inception
Date (1) |
Committed
Capital |
Cumulative
Invested
Capital (2) |
Total Fair
Value (3) |
MOIC
(4) |
Gross
IRR (7) |
Net
IRR (8) |
Cumulative |
Total Fair
Value (3) |
MOIC
(4) |
Gross | ||||||||||||||||||||||||||
|
|
|
| ||||||||||||||||||||||||||||||||||
| Corporate Private Equity | (Reported in Local Currency, in Millions) | (Reported in Local Currency, in Millions) | ||||||||||||||||||||||||||||||||||
| Fully Invested Funds (6) |
||||||||||||||||||||||||||||||||||||
| CP II |
10/1994 | $ | 1,331.1 | $ | 1,362.4 | $ | 4,072.2 | 3.0x | 34% | 25% | $ | 1,362.4 | $ | 4,072.2 | 3.0x | 34% | ||||||||||||||||||||
| CP III |
2/2000 | $ | 3,912.7 | $ | 4,031.6 | $ | 10,146.6 | 2.5x | 27% | 21% | $ | 4,031.6 | $ | 10,146.6 | 2.5x | 27% | ||||||||||||||||||||
| CP IV |
12/2004 | $ | 7,850.0 | $ | 7,612.6 | $ | 17,710.2 | 2.3x | 17% | 13% | $ | 6,079.0 | $ | 16,265.7 | 2.7x | 20% | ||||||||||||||||||||
| CP V |
5/2007 | $ | 13,719.7 | $ | 12,738.9 | $ | 22,295.1 | 1.8x | 19% | 14% | $ | 3,386.0 | $ | 8,187.1 | 2.4x | 28% | ||||||||||||||||||||
| CEP I |
12/1997 | € | 1,003.6 | € | 981.6 | € | 2,126.5 | 2.2x | 18% | 11% | € | 981.6 | € | 2,126.5 | 2.2x | 18% | ||||||||||||||||||||
| CEP II |
9/2003 | € | 1,805.4 | € | 2,048.5 | € | 3,866.4 | 1.9x | 37% | 20% | € | 1,230.8 | € | 3,088.0 | 2.5x | 61% | ||||||||||||||||||||
| CEP III |
12/2006 | € | 5,294.9 | € | 4,954.2 | € | 7,953.1 | 1.6x | 15% | 10% | € | 1,002.6 | € | 2,259.5 | 2.3x | 27% | ||||||||||||||||||||
| CAP I |
12/1998 | $ | 750.0 | $ | 627.7 | $ | 2,491.8 | 4.0x | 25% | 18% | $ | 627.7 | $ | 2,491.8 | 4.0x | 25% | ||||||||||||||||||||
| CAP II |
2/2006 | $ | 1,810.0 | $ | 1,628.6 | $ | 2,841.8 | 1.7x | 12% | 8% | $ | 720.0 | $ | 2,127.9 | 3.0x | 26% | ||||||||||||||||||||
| CAP III |
5/2008 | $ | 2,551.6 | $ | 2,406.1 | $ | 3,566.1 | 1.5x | 18% | 11% | $ | 765.4 | $ | 1,576.2 | 2.1x | 25% | ||||||||||||||||||||
| CJP I |
10/2001 | ¥ | 50,000.0 | ¥ | 47,291.4 | ¥ | 136,351.1 | 2.9x | 61% | 37% | ¥ | 39,756.6 | ¥ | 131,454.6 | 3.3x | 65% | ||||||||||||||||||||
| CJP II |
7/2006 | ¥ | 165,600.0 | ¥ | 141,866.7 | ¥ | 159,657.3 | 1.1x | 3% | (1%) | ¥ | 31,806.1 | ¥ | 57,537.9 | 1.8x | 25% | ||||||||||||||||||||
| CGFSP I |
9/2008 | $ | 1,100.2 | $ | 1,038.0 | $ | 1,634.6 | 1.6x | 18% | 11% | $ | 218.1 | $ | 529.8 | 2.4x | 28% | ||||||||||||||||||||
| All Other Funds(9) |
Various | $ | 4,431.5 | $ | 6,914.1 | 1.6x | 17% | 7% | $ | 2,802.4 | $ | 4,962.2 | 1.8x | 20% | ||||||||||||||||||||||
| Coinvestments and Other(10) |
Various | $ | 7,730.5 | $ | 19,079.7 | 2.5x | 36% | 33% | $ | 5,097.1 | $ | 15,410.6 | 3.0x | 36% | ||||||||||||||||||||||
|
|
|
|
| |||||||||||||||||||||||||||||||||
| Total Fully Invested Funds |
$ | 56,439.4 | $ | 112,831.0 | 2.0x | 26% | 19% | $ | 30,211.7 | $ | 77,897.3 | 2.6x | 30% | |||||||||||||||||||||||
|
|
|
|
| |||||||||||||||||||||||||||||||||
| Funds in the Investment Period(6) |
||||||||||||||||||||||||||||||||||||
| CP VI (12) |
5/2012 | $ | 13,000.0 | $ | 393.5 | $ | 382.5 | 1.0x | n/m | n/m | ||||||||||||||||||||||||||
| CAP IV (12) |
11/2012 | $ | 2,130.5 | n/a | n/a | n/a | n/a | n/m | ||||||||||||||||||||||||||||
| CAGP IV |
6/2008 | $ | 1,041.4 | $ | 768.7 | $ | 1,032.2 | 1.3x | 15% | 6% | ||||||||||||||||||||||||||
| CEOF I |
5/2011 | $ | 1,119.1 | $ | 617.7 | $ | 692.1 | 1.1x | 13% | 4% | ||||||||||||||||||||||||||
| All Other Funds(11) |
Various | $ | 987.8 | $ | 984.8 | 1.0x | 1% | (16%) | ||||||||||||||||||||||||||||
|
|
|
|
| |||||||||||||||||||||||||||||||||
| Total Funds in the Investment Period |
$ | 2,374.2 | $ | 2,709.1 | 1.1x | 10% | (6%) | $ | 196.4 | $ | 449.6 | 2.3x | 40% | |||||||||||||||||||||||
|
|
|
|
| |||||||||||||||||||||||||||||||||
| TOTAL CORPORATE PRIVATE EQUITY(13) |
|
$ | 58,813.6 | $ | 115,540.1 | 2.0x | 26% | 19% | $ | 30,408.1 | $ | 78,346.9 | 2.6x | 30% | ||||||||||||||||||||||
|
|
|
|
| |||||||||||||||||||||||||||||||||
| TOTAL INVESTMENTS | REALIZED/PARTIALLY REALIZED INVESTMENTS (5) | |||||||||||||||||||||||||||||||||||
|
|
|
|
| |||||||||||||||||||||||||||||||||
| as of March 31, 2014 | as of March 31, 2014 | |||||||||||||||||||||||||||||||||||
|
|
|
|
| |||||||||||||||||||||||||||||||||
| Fund
Inception
Date (1) |
Committed
Capital |
Cumulative
Invested
Capital (2) |
Total Fair
Value (3) |
MOIC
(4) |
Gross
IRR (7) |
Net
IRR (8) |
Cumulative
Invested
Capital (2) |
Total Fair
Value (3) |
MOIC
(4) |
Gross
IRR (7) | ||||||||||||||||||||||||||
|
|
|
| ||||||||||||||||||||||||||||||||||
| Real Assets | (Reported in Local Currency, in Millions) | (Reported in Local Currency, in Millions) | ||||||||||||||||||||||||||||||||||
| Fully Invested Funds (6) |
||||||||||||||||||||||||||||||||||||
| CRP III |
11/2000 | $ | 564.1 | $ | 522.5 | $ | 1,379.5 | 2.6x | 44% | 30% | $ | 522.5 | $ | 1,379.5 | 2.6x | 44% | ||||||||||||||||||||
| CRP IV |
12/2004 | $ | 950.0 | $ | 1,198.6 | $ | 1,286.0 | 1.1x | 2% | (2%) | $ | 442.0 | $ | 472.4 | 1.1x | 10% | ||||||||||||||||||||
| CRP V |
11/2006 | $ | 3,000.0 | $ | 3,282.1 | $ | 4,642.5 | 1.4x | 11% | 7% | $ | 2,459.2 | $ | 3,572.9 | 1.5x | 13% | ||||||||||||||||||||
| CEREP I |
3/2002 | € | 426.6 | € | 517.0 | € | 694.7 | 1.3x | 12% | 7% | € | 503.2 | € | 667.5 | 1.3x | 13% | ||||||||||||||||||||
| CEREP II |
4/2005 | € | 762.7 | € | 833.8 | € | 128.1 | 0.2x | n/a | n/a | € | 483.2 | € | 132.8 | 0.3x | n/a | ||||||||||||||||||||
| CEREP III |
5/2007 | € | 2,229.5 | € | 1,956.2 | € | 1,883.7 | 1.0x | (1%) | (5%) | € | 257.2 | € | 347.8 | 1.4x | 9% | ||||||||||||||||||||
| CIP |
9/2006 | $ | 1,143.7 | $ | 1,011.7 | $ | 1,155.3 | 1.1x | 4% | 0% | $ | 180.7 | $ | - | 0.0x | n/a | ||||||||||||||||||||
| Energy II |
7/2002 | $ | 1,100.0 | $ | 1,334.8 | $ | 3,472.6 | 2.6x | 81% | 54% | $ | 827.4 | $ | 3,263.4 | 3.9x | 105% | ||||||||||||||||||||
| Energy III |
10/2005 | $ | 3,800.0 | $ | 3,559.9 | $ | 6,257.5 | 1.8x | 13% | 9% | $ | 1,545.4 | $ | 4,250.5 | 2.8x | 27% | ||||||||||||||||||||
| Energy IV |
12/2007 | $ | 5,979.1 | $ | 5,296.4 | $ | 8,598.4 | 1.6x | 19% | 13% | $ | 1,997.1 | $ | 4,130.3 | 2.1x | 31% | ||||||||||||||||||||
| All Other Funds(14) |
Various | $ | 2,497.4 | $ | 2,628.3 | 1.1x | 2% | (3%) | $ | 1,638.3 | $ | 1,870.8 | 1.1x | 7% | ||||||||||||||||||||||
| Coinvestments and Other(10) |
Various | $ | 5,224.7 | $ | 8,355.1 | 1.6x | 18% | 14% | $ | 2,122.2 | $ | 4,513.4 | 2.1x | 28% | ||||||||||||||||||||||
|
|
|
|
| |||||||||||||||||||||||||||||||||
| Total Fully Invested Funds |
$ | 28,482.8 | $ | 41,502.9 | 1.5x | 14% | 8% | $ | 13,447.5 | $ | 25,034.4 | 1.9x | 25% | |||||||||||||||||||||||
|
|
|
|
| |||||||||||||||||||||||||||||||||
| Funds in the Investment Period (6) |
||||||||||||||||||||||||||||||||||||
| CIEP I (12) |
9/2013 | $ | 1,060.5 | $ | 108.6 | $ | 102.2 | 0.9x | n/m | n/m | ||||||||||||||||||||||||||
| CRP VI |
9/2010 | $ | 2,340.0 | $ | 1,437.5 | $ | 2,025.0 | 1.4x | 32% | 19% | ||||||||||||||||||||||||||
| Renew II |
3/2008 | $ | 3,417.5 | $ | 2,791.6 | $ | 3,852.4 | 1.4x | 12% | 8% | ||||||||||||||||||||||||||
| All Other Funds(15) |
Various | $ | 226.8 | $ | 269.8 | 1.2x | n/a | n/a | ||||||||||||||||||||||||||||
|
|
|
|
| |||||||||||||||||||||||||||||||||
| Total Funds in the Investment Period |
$ | 4,564.5 | $ | 6,249.4 | 1.4x | 15% | 9% | $ | 849.0 | $ | 1,258.1 | 1.5x | 18% | |||||||||||||||||||||||
|
|
|
|
| |||||||||||||||||||||||||||||||||
| TOTAL Real Assets (13) |
$ | 33,047.3 | $ | 47,752.3 | 1.4x | 14% | 8% | $ | 14,296.5 | $ | 26,292.4 | 1.8x | 25% | |||||||||||||||||||||||
|
|
|
|
| |||||||||||||||||||||||||||||||||
Page | 23
Global Markets Strategies Carry Funds and Solutions (Unaudited)
| TOTAL INVESTMENTS | ||||||||||||||||||||
|
|
| |||||||||||||||||||
| as of March 31, 2014 | ||||||||||||||||||||
| Fund
Inception
Date (16) |
Committed Capital |
Cumulative
Invested Capital
(17) |
Total Fair
Value (3) |
MOIC (4) | Gross IRR (7) | Net IRR (8) | ||||||||||||||
|
| ||||||||||||||||||||
| (Reported in Local Currency, in Millions) | ||||||||||||||||||||
| Global Market Strategies | ||||||||||||||||||||
| CSP II |
6/2007 | $ | 1,352.3 | $ | 1,352.3 | $ | 2,447.1 | 1.8x | 18% | 13% | ||||||||||
| CEMOF I |
12/2010 | $ | 1,382.5 | $ | 814.2 | $ | 983.5 | 1.2x | 26% | 11% | ||||||||||
| TOTAL INVESTMENTS | ||||||||||||||||||||
|
|
| |||||||||||||||||||
| as of March 31, 2014 | ||||||||||||||||||||
|
|
| |||||||||||||||||||
| Vintage
Year |
Fund Size | Cumulative
Invested Capital
(2)(8) |
Total Fair
Value (3)(20) |
MOIC (4) | Gross IRR (7) | Net IRR (8) | ||||||||||||||
|
| ||||||||||||||||||||
| Solutions (19) | (Reported in Local Currency, in Millions) | |||||||||||||||||||
| Fully Committed Funds (18) |
||||||||||||||||||||
| Main Fund I - Fund Investments |
2000 | € | 5,174.6 | € | 3,794.1 | € | 6,167.2 | 1.6x | 12% | 12% | ||||||||||
| Main Fund II - Fund Investments |
2003 | € | 4,545.0 | € | 4,329.8 | € | 6,557.3 | 1.5x | 10% | 10% | ||||||||||
| Main Fund III - Fund Investments |
2005 | € | 11,500.0 | € | 10,358.1 | € | 13,902.2 | 1.3x | 8% | 8% | ||||||||||
| Main Fund IV - Fund Investments |
2009 | € | 4,880.0 | € | 2,177.6 | € | 2,513.9 | 1.2x | 10% | 9% | ||||||||||
| Main Fund I - Secondary Investments |
2002 | € | 519.4 | € | 451.5 | € | 839.2 | 1.9x | 54% | 50% | ||||||||||
| Main Fund II - Secondary Investments |
2003 | € | 998.4 | € | 896.9 | € | 1,626.0 | 1.8x | 28% | 26% | ||||||||||
| Main Fund III - Secondary Investments |
2006 | € | 2,250.0 | € | 2,050.5 | € | 2,823.5 | 1.4x | 10% | 9% | ||||||||||
| Main Fund IV - Secondary Investments |
2010 | € | 1,856.4 | € | 1,651.5 | € | 2,354.8 | 1.4x | 20% | 19% | ||||||||||
| Main Fund II - Co-Investments |
2003 | € | 1,090.0 | € | 855.2 | € | 2,386.5 | 2.8x | 45% | 43% | ||||||||||
| Main Fund III - Co-Investments |
2006 | € | 2,760.0 | € | 2,435.1 | € | 3,362.1 | 1.4x | 6% | 5% | ||||||||||
| Main Fund IV - Co-Investments |
2010 | € | 1,475.0 | € | 1,202.7 | € | 2,036.5 | 1.7x | 23% | 20% | ||||||||||
| Main Fund II - Mezzanine Investments |
2004 | € | 700.0 | € | 685.6 | € | 926.6 | 1.4x | 8% | 7% | ||||||||||
| Main Fund III - Mezzanine Investments |
2006 | € | 2,000.0 | € | 1,451.8 | € | 1,903.6 | 1.3x | 11% | 9% | ||||||||||
| All Other Funds (21) |
Various | € | 1,353.2 | € | 1,979.6 | 1.5x | 17% | 14% | ||||||||||||
|
|
| |||||||||||||||||||
| Total Fully Committed Funds |
€ | 33,693.6 | € | 49,378.9 | 1.5x | 12% | 11% | |||||||||||||
|
|
| |||||||||||||||||||
| Funds in the Commitment Period |
||||||||||||||||||||
| Main Fund V - Fund Investments |
2012 | € | 5,080.0 | € | 340.0 | € | 305.7 | 0.9x | (20%) | (27%) | ||||||||||
| Main Fund V - Secondary Investments |
2011 | € | 3,718.3 | € | 1,156.4 | € | 1,521.9 | 1.3x | 34% | 31% | ||||||||||
| Main Fund V - Co-Investments |
2012 | € | 1,747.5 | € | 494.9 | € | 732.5 | 1.5x | 56% | 51% | ||||||||||
| All Other Funds (21) |
Various | € | 144.7 | € | 175.2 | 1.2x | 23% | 20% | ||||||||||||
|
|
| |||||||||||||||||||
| Total Funds in the Commitment Period |
€ | 2,136.0 | € | 2,735.3 | 1.3x | 34% | 29% | |||||||||||||
|
|
| |||||||||||||||||||
| TOTAL SOLUTIONS |
€ | 35,829.6 | € | 52,114.2 | 1.5x | 12% | 11% | |||||||||||||
|
|
| |||||||||||||||||||
| TOTAL SOLUTIONS (USD) (22) |
$ | 49,345.3 | $ | 71,772.7 | 1.5x | |||||||||||||||
|
|
|
|||||||||||||||||||
Page | 24
(1) The data presented herein that provides “inception to date” performance results of our segments relates to the period following the formation of the first fund within each segment. For our Corporate Private Equity segment our first fund was formed in 1990. For our Real Assets segment our first fund was formed in 1997.
(2) Represents the original cost of all capital called for investments since inception of the fund.
(3) Represents all realized proceeds combined with remaining fair value, before management fees, expenses and carried interest.
(4) Multiple of invested capital (“MOIC”) represents total fair value, before management fees, expenses and carried interest, divided by cumulative invested capital.
(5) An investment is considered realized when the investment fund has completely exited, and ceases to own an interest in, the investment. An investment is considered partially realized when the total amount of proceeds received in respect of such investment, including dividends, interest or other distributions and/or return of capital, represents at least 85% of invested capital and such investment is not yet fully realized. Because part of our value creation strategy involves pursuing best exit alternatives, we believe information regarding Realized/Partially Realized MOIC and Gross IRR, when considered together with the other investment performance metrics presented, provides investors with meaningful information regarding our investment performance by removing the impact of investments where significant realization activity has not yet occurred. Realized/Partially Realized MOIC and Gross IRR have limitations as measures of investment performance, and should not be considered in isolation. Such limitations include the fact that these measures do not include the performance of earlier stage and other investments that do not satisfy the criteria provided above. The exclusion of such investments will have a positive impact on Realized/Partially Realized MOIC and Gross IRR in instances when the MOIC and Gross IRR in respect of such investments are less than the aggregate MOIC and Gross IRR. Our measurements of Realized/Partially Realized MOIC and Gross IRR may not be comparable to those of other companies that use similarly titled measures. We do not present Realized/Partially Realized performance information separately for funds that are still in the investment period because of the relatively insignificant level of realizations for funds of this type. However, to the extent such funds have had realizations, they are included in the Realized/Partially Realized performance information presented for Total Corporate Private Equity and Total Real Assets.
(6) Fully Invested funds are past the expiration date of the investment period as defined in the respective limited partnership agreement. In instances where a successor fund has had its first capital call, the predecessor fund is categorized as fully invested.
(7) Gross Internal Rate of Return (“Gross IRR”) represents the annualized IRR for the period indicated on Limited Partner invested capital based on contributions, distributions and unrealized value before management fees, expenses and carried interest.
(8) Net Internal Rate of Return (“Net IRR”) represents the annualized IRR for the period indicated on Limited Partner invested capital based on contributions, distributions and unrealized value after management fees, expenses and carried interest.
(9) Aggregate includes the following funds: CP I, CMG, CVP I, CVP II, CUSGF III, CEVP, CETP I, CETP II, CAVP I, CAVP II, CAGP III, Mexico, and MENA.
(10) Includes co-investments, prefund investments, and certain other stand-alone investments arranged by us.
(11) Aggregate includes the following funds: CJP III, CGFSP II, CSABF, CSSAF, CBPF, CPF I, and CCI.
(12) Returns are not considered meaningful, as the investment period commenced in May 2012 for CP VI, November 2012 for CAP IV, and September 2013 for CIEP.
(13) For purposes of aggregation, funds that report in foreign currency have been converted to U.S. dollars at the reporting period spot rate.
(14) Aggregate includes the following funds: CRP I, CRP II, CAREP I, CAREP II, CRCP I, Energy I and Renew I.
(15) Aggregate includes the following fund: CPOCP.
(16) The data presented herein that provides “inception to date” performance results for CSP II and CEMOF I related to the period following the formation of the funds in June 2007 and December 2010, respectively.
(17) Represents the original cost of investments net of investment level recallable proceeds which is adjusted to reflect recyclability of invested capital for the purpose of calculating the fund MOIC.
(18) Fully Committed funds are past the expiration date of the commitment period as defined in the respective limited partnership agreement.
(19) Includes private equity and mezzanine primary fund investments, secondary fund investments and co-investments originated by the AlpInvest team. Excluded from the performance information shown are a) investments that were not originated by AlpInvest and b) Direct Investments, which was spun off from AlpInvest in 2005. As of March 31, 2014, these excluded investments represent $0.7 billion of AUM.
(20) To exclude the impact of FX, all foreign currency cash flows have been converted to Euro at the reporting period spot rate.
(21) Aggregate includes Main Fund I - Co-Investments, Main Fund I - Mezzanine Investments, AlpInvest CleanTech Funds and funds which are not included as part of a main fund.
(22) Represents the U.S. dollar equivalent balance translated at the spot rate as of period end.
Page | 25
Remaining Fair Value Analysis
| Remaining
Fair Value(1) |
Unrealized
MOIC(2) |
Total
MOIC(3) |
%
Invested(4) |
In Accrued
Carry/
(Clawback) (5) |
LTM
Realized
Carry (6) |
Catch
up Rate |
Fee
Initiation
Date(7) |
Quarters
Since Fee
Initiation |
Original
Investment
Period End Date | |||||||||||||||
|
|
| |||||||||||||||||||||||
| As of March 31, 2014 | ||||||||||||||||||||||||
| Corporate Private Equity |
||||||||||||||||||||||||
| CP V |
$ | 14,312.7 | 1.8x | 1.8x | 93% | Ö | Ö | 100% | Nov-07 | 26 | May-13 | |||||||||||||
| CEP III |
€ | 5,457.9 | 1.7x | 1.6x | 94% | Ö | 100% | Dec-07 | 26 | Dec-12 | ||||||||||||||
| CP IV |
$ | 3,876.7 | 1.8x | 2.3x | 97% | Ö | Ö | 80% | Dec-05 | 34 | Dec-10 | |||||||||||||
| CAP III |
$ | 2,242.5 | 1.3x | 1.5x | 94% | Ö | 100% | Dec-08 | 22 | May-14 | ||||||||||||||
| CAP II |
$ | 1,151.6 | 1.2x | 1.7x | 90% | Ö | 80% | Dec-06 | 30 | Feb-12 | ||||||||||||||
| CJP II |
¥ | 97,027.8 | 0.9x | 1.1x | 86% | 80% | Oct-06 | 30 | Jul-12 | |||||||||||||||
| CEP II |
€ | 716.0 | 0.9x | 1.9x | 113% | Ö | 80% | Sep-03 | 43 | Sep-08 | ||||||||||||||
| CGFSP I |
$ | 963.2 | 1.3x | 1.6x | 94% | Ö | Ö | 100% | Oct-08 | 22 | Sep-14 | |||||||||||||
| CAGP IV |
$ | 776.6 | 1.1x | 1.3x | 74% | 100% | Dec-08 | 22 | Jun-14 | |||||||||||||||
| CEOF I |
$ | 644.9 | 1.1x | 1.1x | 55% | 80% | Dec-11 | 10 | May-17 | |||||||||||||||
| CP VI |
$ | 412.2 | 1.0x | 1.0x | 3% | 100% | Oct-13 | 2 | May-18 | |||||||||||||||
| All Other Funds (8) |
$ | 2,644.4 | 1.2x | 2.2x | n/m | n/m | ||||||||||||||||||
| Coinvestment and Other (9) |
$ | 4,068.5 | 1.7x | 2.5x | n/m | n/m | ||||||||||||||||||
|
|
|
|||||||||||||||||||||||
| Total Corporate Private Equity |
$ | 40,537.5 | 1.5x | 2.0x | ||||||||||||||||||||
|
|
|
|||||||||||||||||||||||
| Real Assets |
||||||||||||||||||||||||
| Energy IV |
$ | 4,867.9 | 1.3x | 1.6x | 89% | Ö | Ö | 80% | Feb-08 | 25 | Dec-13 | |||||||||||||
| Renew II |
$ | 2,535.8 | 1.4x | 1.4x | 82% | (Ö) | 80% | Nov-08 | 22 | May-14 | ||||||||||||||
| CEREP III |
€ | 1,610.8 | 0.9x | 1.0x | 88% | 67% | Oct-07 | 26 | May-11 | |||||||||||||||
| Energy III |
$ | 1,917.5 | 0.9x | 1.8x | 94% | Ö | Ö | 80% | Nov-05 | 34 | Oct-11 | |||||||||||||
| CRP VI |
$ | 1,623.3 | 1.3x | 1.4x | 61% | Ö | 50% | Dec-11 | 10 | Mar-16 | ||||||||||||||
| CRP V |
$ | 1,129.3 | 1.4x | 1.4x | 109% | 50% | Nov-06 | 30 | Nov-11 | |||||||||||||||
| CIP |
$ | 949.1 | 1.4x | 1.1x | 88% | 80% | Oct-06 | 30 | Sep-12 | |||||||||||||||
| CRP IV |
$ | 785.5 | 1.0x | 1.1x | 126% | (Ö) | 50% | Dec-05 | 34 | Dec-09 | ||||||||||||||
| Energy II |
$ | 354.9 | 0.7x | 2.6x | 121% | (Ö) | Ö | 80% | Dec-02 | 46 | Jul-08 | |||||||||||||
| CRP III |
$ | 236.5 | 38.3x | 2.6x | 93% | Ö | Ö | 50% | Dec-01 | 50 | May-05 | |||||||||||||
| CIEP I |
$ | 101.7 | 0.9x | 0.9x | 10% | 80% | Oct-13 | 2 | Sep-19 | |||||||||||||||
| All Other Funds (10) |
$ | 678.4 | 0.6x | 0.9x | n/m | n/m | ||||||||||||||||||
| Coinvestment and Other (9) |
$ | 3,533.6 | 1.1x | 1.6x | n/m | n/m | ||||||||||||||||||
|
|
|
|||||||||||||||||||||||
| Total Real Assets |
$ | 20,932.1 | 1.1x | 1.4x | ||||||||||||||||||||
|
|
|
|||||||||||||||||||||||
| Global Market Strategies |
||||||||||||||||||||||||
| CEMOF I |
$ | 682.7 | 1.1x | 1.2x | 59% | Ö | 100% | Dec-10 | 14 | Dec-15 | ||||||||||||||
| CSP II |
$ | 529.8 | 1.0x | 1.8x | 100% | Ö | Ö | 80% | Dec-07 | 26 | Jun-11 | |||||||||||||
| All Other Funds (11) |
$ | 871.3 | 1.2x | 1.4x | n/m | n/m | ||||||||||||||||||
| Coinvestment and Other (9) |
$ | 191.0 | 1.0x | 1.2x | n/m | n/m | ||||||||||||||||||
|
|
|
|||||||||||||||||||||||
| Total Global Market Strategies |
$ | 2,274.8 | 1.1x | 1.5x | ||||||||||||||||||||
|
|
|
|||||||||||||||||||||||
Notes:
(1) Net asset value of our carry funds. Reflects significant funds with remaining fair value of greater than $100 million.
(2) Unrealized multiple of invested capital (“MOIC”) represents remaining fair market value, before management fees, expenses and carried interest, divided by investment cost.
(3) Total MOIC represents total fair value, before management fees, expenses and carried interest, divided by cumulative invested capital
(4) Represents cumulative equity invested as of the reporting period divided by total commitments. Amount can be greater than 100% due to the re-investment of recallable distributions to fund investors.
(5) Fund has accrued carry/(clawback) as of the reporting period.
(6) Fund has realized carry in the last twelve months.
(7) Represents the date of the first capital contribution for management fees.
(8) Aggregate includes the following funds: CMP, CP I, CP II, CP III, CP IV, CEP I, CEP IV, CAP I, CAP IV, CBPF, CJP I, CJP III, CEVP, CETP I, CETP II, CCI, CAVP I, CAVP II, CAGP III, Mexico, MENA, CSABF, CGFSP II, CSSAF, CPF, CVP I, CVP II, and CUSGF III. In Accrued Carry/(Clawback) and LTM Realized Carry not indicated because the indicator does not apply to each fund within the aggregate.
(9) Includes co-investments, prefund investments and certain other stand-alone investments arranged by us. In Accrued Carry/(Clawback) and LTM Realized Carry not indicated because the indicator does not apply to each fund within the aggregate.
(10) Aggregate includes the following funds: CRP I, CRP II, CRCP I, CEREP I, CEREP II, CAREP I, CAREP II, CPOCP I, Energy I and Renew I. In Accrued Carry/(Clawback) and LTM Realized Carry not indicated because the indicator does not apply to each fund within the aggregate.
(11) Aggregate includes the following funds: CSP I, CSP III, CMP I, and CMP II. In Accrued Carry/(Clawback) and LTM Realized Carry not indicated because the indicator does not apply to each fund within the aggregate.
Page | 26
Largest Publicly Traded Positions in Carry Funds
| Rank | Largest Publicly Traded Equity Positions |
Fund(s) |
Q1 2014 Value (1,2) | |||||
| 1 | CommScope, Inc. | CP V, CEP III | $ | 2,994,719,821 | ||||
| 2 | Booz Allen Hamilton, Inc. | CP V, CMP II | 1,597,521,545 | |||||
| 3 | Pattern Energy Group Holdings, L.P. | RENEW II | 1,563,805,618 | |||||
| 4 | Allison Transmission, Inc. | CP IV | 1,057,518,225 | |||||
| 5 | Numericable & Completel | CEP III, CEP II | 1,038,372,867 | |||||
| 6 | HD Supply, Inc. | CP V | 953,739,453 | |||||
| 7 | The Nielsen Company | CP IV, CEP II | 829,348,775 | |||||
| 8 | Freescale Semiconductor, Inc. | CP IV, CAP II, CJP I, CEP II | 761,869,010 | |||||
| 9 | Wesco Holdings, Inc. | CP IV, CMP I | 645,557,347 | |||||
| 10 | Cobalt International Energy | ENERGY III, ENERGY II | 639,135,925 | |||||
| Top 10 Positions | 12,081,588,586 | |||||||
| Total Public Equity Portfolio (carry fund only) | 17,814,674,405 | |||||||
| % of public portfolio in top 10 positions | 68% | |||||||
|
|
||||||||
(1) Includes gross fund only investment results including external coinvestment. May include portion of private business in value.
(2) In U.S. dollars, or converted to U.S. dollars at the prevailing exchange rate on the last day of the fiscal period.
Note: Includes all classes of shares irrespective of trading status
Page | 27
Reconciliation for Economic Net Income and Distributable Earnings (Unaudited)
| Three Months Ended | ||||||||
| Mar 31,
2014 |
Mar 31,
2013 |
|||||||
| (Dollars in millions) | ||||||||
| Income before provision for income taxes |
$ | 472.4 | $ | 452.4 | ||||
| Adjustments: |
||||||||
| Equity-based compensation issued in conjunction with the initial
public |
62.4 | 52.1 | ||||||
| Acquisition related charges and amortization of intangibles |
80.1 | 62.5 | ||||||
| Other non-operating expenses |
30.2 | (2.4) | ||||||
| Net income attributable to non-controlling interests in consolidated |
(324.5) | (168.0) | ||||||
| Other adjustments |
1.3 | (2.7) | ||||||
|
|
|
|
|
|||||
| Economic Net Income |
$ | 321.9 | $ | 393.9 | ||||
|
|
|
|
|
|||||
| Net performance fees |
306.6 | 354.7 | ||||||
| Investment income (loss) |
(7.9) | 3.0 | ||||||
| Equity-based compensation |
14.0 | 2.6 | ||||||
|
|
|
|
|
|||||
| Fee Related Earnings |
$ | 37.2 | $ | 38.8 | ||||
|
|
|
|
|
|||||
| Realized performance fees, net of related compensation |
140.8 | 141.5 | ||||||
| Investment income - realized |
5.3 | (9.3) | ||||||
|
|
|
|
|
|||||
| Distributable Earnings |
$ | 183.3 | $ | 171.0 | ||||
|
|
|
|
|
|||||
| Depreciation and amortization expense |
5.4 | 6.3 | ||||||
| Interest expense |
12.2 | 8.5 | ||||||
|
|
|
|
|
|||||
| Adjusted EBITDA |
$ | 200.9 | $ | 185.8 | ||||
|
|
|
|
|
|||||
Page | 28
Reconciliation for Economic Net income and Distributable Earnings, cont.
(Unaudited)
| Three Months Ended | |||||
| Mar 31, | |||||
| 2014 | |||||
| (Dollars in millions, except unit and per unit amounts) | |||||
| Economic Net Income |
$ | 321.9 | |||
| Less: Provision for Income Taxes |
46.4 | ||||
|
|
|
||||
| Economic Net Income, After Taxes |
$ | 275.5 | |||
|
|
|
||||
| Economic Net Income, After Taxes per Adjusted Unit(1) |
$ | 0.85 | |||
|
|
|
||||
| Distributable Earnings |
$ | 183.3 | |||
| Less: Estimated foreign, state, and local taxes |
14.0 | ||||
|
|
|
||||
| Distributable Earnings, After Taxes |
$ | 169.3 | |||
|
|
|
||||
| Distributable Earnings to The Carlyle Group L.P. |
$ | 35.6 | |||
| Less: Estimated current corporate income taxes and TRA payments |
0.8 | ||||
|
|
|
||||
|
Distributable Earnings to The Carlyle Group L.P. net of corporate income taxes |
$ | 34.8 | |||
|
|
|
||||
| Distributable Earnings, net, per The Carlyle Group L.P. common unit outstanding(2) |
$ | 0.52 | |||
|
|
|
||||
| (1) | Adjusted Units were determined as follows: |
| The Carlyle Group L.P. common units outstanding |
64,092,165 | |||||||
| Carlyle Holdings partnership units not held by The Carlyle Group L.P. |
252,718,742 | |||||||
| Dilutive effect of unvested deferred restricted common units |
6,486,349 | |||||||
| Contingently issuable Carlyle Holdings partnership units |
465,909 | |||||||
|
|
|
|||||||
| Total Adjusted Units |
323,763,165 | |||||||
|
|
|
| (2) | As of March 31, 2014, there were 64,092,165 outstanding common units of The Carlyle Group L.P. In May 2014, an additional 2,831,392 common units will be issued that relate to vested deferred restricted common units. For purposes of this calculation, those common units have been added to the common units outstanding as of March 31, 2014, resulting in total common units of 66,923,557. |
Page | 29
GAAP for 12-Month Rolling Summary (Unaudited)
| Twelve Months Ended | ||||||||
| Mar 31, 2014 |
Mar 31, 2013 |
|||||||
| (Dollars in millions) | ||||||||
| Revenues |
||||||||
| Fund management fees |
$ | 1,013.5 | $ | 974.6 | ||||
| Performance fees |
||||||||
| Realized |
1,175.3 | 879.7 | ||||||
| Unrealized |
1,178.1 | 163.0 | ||||||
|
|
|
|
|
|||||
| Total performance fees |
2,353.4 | 1,042.7 | ||||||
| Investment income |
||||||||
| Realized |
18.6 | 12.9 | ||||||
| Unrealized |
5.9 | 2.4 | ||||||
|
|
|
|
|
|||||
| Total investment income |
24.5 | 15.3 | ||||||
| Interest and other income |
13.3 | 14.2 | ||||||
| Interest and other income of Consolidated Funds |
1,025.4 | 960.4 | ||||||
| Revenue of a consolidated real estate VIE |
13.5 | - | ||||||
|
|
|
|
|
|||||
| Total revenues |
4,443.6 | 3,007.2 | ||||||
| Expenses |
||||||||
| Compensation and benefits |
||||||||
| Base compensation |
764.1 | 696.9 | ||||||
| Equity-based compensation |
344.3 | 254.0 | ||||||
| Performance fee related |
||||||||
| Realized |
539.2 | 359.9 | ||||||
| Unrealized |
671.1 | 172.4 | ||||||
|
|
|
|
|
|||||
| Total compensation and benefits |
2,318.7 | 1,483.2 | ||||||
| General, administrative and other expenses |
519.3 | 377.7 | ||||||
| Interest |
47.2 | 24.7 | ||||||
| Interest and other expenses of Consolidated Funds |
904.5 | 823.7 | ||||||
| Interest and other expenses of a consolidated real estate VIE |
83.0 | - | ||||||
| Other non-operating expenses |
16.1 | 8.8 | ||||||
|
|
|
|
|
|||||
| Total expenses |
3,888.8 | 2,718.1 | ||||||
| Other income |
||||||||
| Net investment gains of Consolidated Funds |
909.2 | 1,097.4 | ||||||
|
|
|
|
|
|||||
| Income before provision for income taxes |
1,464.0 | 1,386.5 | ||||||
| Provision for income taxes |
87.3 | 53.6 | ||||||
|
|
|
|
|
|||||
| Net income |
1,376.7 | 1,332.9 | ||||||
| Net income attributable to non-controlling interests in consolidated entities |
832.5 | 1,059.8 | ||||||
|
|
|
|
|
|||||
| Net income attributable to Carlyle Holdings |
544.2 | 273.1 | ||||||
| Net income attributable to non-controlling interests in Carlyle Holdings |
449.3 | 219.0 | ||||||
|
|
|
|
|
|||||
| Net income attributable to The Carlyle Group L.P. |
$ | 94.9 | $ | 54.1 | ||||
|
|
|
|
|
|||||
Page | 30
Reconciliation of Non-GAAP to GAAP for 12-Month Rolling Summary (Unaudited)
| Twelve Months Ended | ||||||||
| Mar 31, 2014 |
Mar 31, 2013 |
|||||||
| (Dollars in millions) | ||||||||
| Income before provision for income taxes |
$ | 1,464.0 | $ | 1,386.5 | ||||
| Adjustments: |
||||||||
| Partner compensation |
- | 5.6 | ||||||
| Equity-based compensation issued in conjunction with the IPO and strategic |
324.7 | 252.2 | ||||||
| Acquisition related charges and amortization of intangibles |
278.0 | 166.7 | ||||||
| Other non-operating expenses |
16.1 | 8.8 | ||||||
| Net income attributable to non-controlling interests in consolidated entities |
(832.5) | (1,059.8) | ||||||
| Other adjustments |
(2.2) | (22.6) | ||||||
|
|
|
|
|
|||||
| Economic Net Income |
$ | 1,248.1 | $ | 737.4 | ||||
|
|
|
|
|
|||||
| Net performance fees |
1,178.2 | 544.5 | ||||||
| Investment income (loss) |
(53.5) | 21.2 | ||||||
| Equity-based compensation |
27.1 | 4.4 | ||||||
|
|
|
|
|
|||||
| Fee Related Earnings |
$ | 150.5 | $ | 176.1 | ||||
|
|
|
|
|
|||||
| Realized performance fees, net of related compensation |
676.6 | 500.9 | ||||||
| Investment income - realized |
25.2 | 4.9 | ||||||
|
|
|
|
|
|||||
| Distributable Earnings |
$ | 852.3 | $ | 681.9 | ||||
|
|
|
|
|
|||||
| Depreciation and amortization expense |
23.4 | 22.6 | ||||||
| Interest expense |
47.3 | 23.2 | ||||||
|
|
|
|
|
|||||
| Adjusted EBITDA |
$ | 923.0 | $ | 727.7 | ||||
|
|
|
|
|
|||||
Page | 31
The Carlyle Group L.P.
GAAP Balance Sheet (Unaudited)
| As of March 31, 2014 | ||||||||||||||||
| Consolidated Operating Entities |
Consolidated Funds |
Eliminations | Consolidated | |||||||||||||
| (Dollars in millions) | ||||||||||||||||
| Assets |
||||||||||||||||
| Cash and cash equivalents |
$ | 1,034.3 | $ | - | $ | - | $ | 1,034.3 | ||||||||
| Cash and cash equivalents held at Consolidated Funds |
- | 2,149.8 | - | 2,149.8 | ||||||||||||
| Restricted cash |
45.4 | - | - | 45.4 | ||||||||||||
| Restricted cash and securities of Consolidated Funds |
- | 25.2 | - | 25.2 | ||||||||||||
| Accrued performance fees |
3,803.0 | - | (26.4) | 3,776.6 | ||||||||||||
| Investments |
903.4 | - | (155.4) | 748.0 | ||||||||||||
| Investments of Consolidated Funds |
- | 27,081.4 | (1.3) | 27,080.1 | ||||||||||||
| Due from affiliates and other receivables, net |
179.0 | - | (13.7) | 165.3 | ||||||||||||
| Due from affiliates and other receivables of Consolidated Funds, net |
- | 282.9 | - | 282.9 | ||||||||||||
| Receivables and inventory of a consolidated real estate VIE |
170.9 | - | - | 170.9 | ||||||||||||
| Fixed assets, net |
67.4 | - | - | 67.4 | ||||||||||||
| Deposits and other |
47.1 | 3.1 | - | 50.2 | ||||||||||||
| Other assets of a consolidated real estate VIE |
46.7 | - | - | 46.7 | ||||||||||||
| Intangible assets, net |
568.6 | - | - | 568.6 | ||||||||||||
| Deferred tax assets |
137.1 | - | - | 137.1 | ||||||||||||
|
|
|
|
|
|
|
|
|
|||||||||
| Total assets |
$ | 7,002.9 | $ | 29,542.4 | $ | (196.8) | $ | 36,348.5 | ||||||||
|
|
|
|
|
|
|
|
|
|||||||||
| Liabilities and partners’ capital |
||||||||||||||||
| Loans payable |
$ | 42.4 | $ | - | $ | - | $ | 42.4 | ||||||||
| 3.875% Senior Notes due 2023 |
499.8 | - | - | 499.8 | ||||||||||||
| 5.625% Senior Notes due 2043 |
607.0 | - | - | 607.0 | ||||||||||||
| Loans payable of Consolidated Funds |
- | 15,801.4 | (122.7) | 15,678.7 | ||||||||||||
|
Loans payable of a consolidated real estate VIE at fair value (principal amount |
125.3 | - | - | 125.3 | ||||||||||||
| Accounts payable, accrued expenses and other liabilities |
285.9 | - | (45.7) | 240.2 | ||||||||||||
| Accrued compensation and benefits |
2,193.3 | - | - | 2,193.3 | ||||||||||||
| Due to affiliates |
274.0 | 0.8 | (0.5) | 274.3 | ||||||||||||
| Deferred revenue |
196.7 | 1.3 | - | 198.0 | ||||||||||||
| Deferred tax liabilities |
120.4 | - | - | 120.4 | ||||||||||||
| Other liabilities of Consolidated Funds |
- | 1,706.5 | (58.8) | 1,647.7 | ||||||||||||
| Other liabilities of a consolidated real estate VIE |
98.0 | - | - | 98.0 | ||||||||||||
| Accrued giveback obligations |
45.9 | - | (10.2) | 35.7 | ||||||||||||
|
|
|
|
|
|
|
|
|
|||||||||
| Total liabilities |
4,488.7 | 17,510.0 | (237.9) | 21,760.8 | ||||||||||||
| Redeemable non-controlling interests in consolidated entities |
8.1 | 4,663.3 | - | 4,671.4 | ||||||||||||
| Total partners’ capital |
2,506.1 | 7,369.1 | 41.1 | 9,916.3 | ||||||||||||
|
|
|
|
|
|
|
|
|
|||||||||
| Total liabilities and partners’ capital |
$ | 7,002.9 | $ | 29,542.4 | $ | (196.8) | $ | 36,348.5 | ||||||||
|
|
|
|
|
|
|
|
|
|||||||||
Page | 32
The Carlyle Group L.P.
Non-GAAP Financial Information and Other Key Terms
Non-GAAP Financial Information
Carlyle discloses in this press release the following financial measures that are calculated and presented on the basis of methodologies other than in accordance with generally accepted accounting principles in the United States of America:
| — | Economic net income or “ENI,” represents segment net income which excludes the impact of income taxes, acquisition-related items including amortization of acquired intangibles and contingent consideration taking the form of earn-outs, charges associated with equity-based compensation issued in Carlyle’s initial public offering or in acquisitions or strategic investments, corporate actions and infrequently occurring or unusual events. Carlyle believes the exclusion of these items provides investors with a meaningful indication of its core operating performance. For segment reporting purposes, revenues and expenses, and accordingly segment net income, are presented on a basis that deconsolidates certain Carlyle funds, related co-investment entities and CLOs (referred to collectively as the “Consolidated Funds”) that Carlyle consolidates in its consolidated financial statements pursuant to U.S. GAAP. For periods prior to its Initial Public Offering, ENI also reflects pro forma compensation expense for compensation to senior Carlyle professionals, which Carlyle has accounted for as distributions from equity rather than as employee compensation for periods prior to its Initial Public Offering. Total Segment ENI equals the aggregate of ENI for all segments. ENI and its components are evaluated regularly by management in making resource deployment decisions and in assessing performance of Carlyle’s four segments and for compensation. Carlyle believes that reporting ENI is helpful to understanding its business and that investors should review the same supplemental financial measure that management uses to analyze its segment performance. |
| — | Fee-Related Earnings is a component of ENI and is used to measure Carlyle’s operating profitability excluding equity-based compensation, performance fees, investment income from investments in Carlyle’s funds and performance fee related compensation. Accordingly, Fee-Related Earnings reflect the ability of the business to cover direct base compensation and operating expenses from fee revenues other than performance fees. For periods prior to its Initial Public Offering, Fee-Related Earnings also reflects pro forma compensation expense for compensation to senior Carlyle professionals, which Carlyle has accounted for as distributions from equity rather than as employee compensation for periods prior to its Initial Public Offering. Fee-Related Earnings are reported as part of Carlyle’s segment results. Carlyle uses Fee-Related Earnings from operations to measure its profitability from fund management fees. |
| — | Distributable Earnings is a component of ENI representing total ENI less net performance fees and investment income plus realized net performance fees and realized investment income and excluding equity-based compensation. Distributable Earnings is intended to show the amount of net realized earnings without the effects of consolidation of the Consolidated Funds. Distributable Earnings is derived from Carlyle’s segment reported results and is an additional measure to assess performance and amounts potentially available for distribution from Carlyle Holdings to its equity holders. |
Page | 33
| — | Adjusted EBITDA is a component of ENI and is used to measure Carlyle’s ability to cover recurring operating expenses from cash earnings. Adjusted EBITDA is computed as ENI excluding unrealized performance fees, unrealized performance fee compensation, unrealized investment income, depreciation and amortization expense, interest expense and equity-based compensation. |
Income before provision for income taxes is the GAAP financial measure most comparable to ENI, Fee-Related Earnings, Distributable Earnings, and Adjusted EBITDA. Reconciliations of these non-GAAP financial measures to income before provision for income taxes are included within this press release. These non-GAAP financial measures should be considered in addition to and not as a substitute for, or superior to, financial measures presented in accordance with U.S. GAAP.
Other Key Terms
“Assets under management” or “AUM” refers to the assets managed by Carlyle. AUM equals the sum of the following:
(a) the fair value of the capital invested in Carlyle carry funds, co-investment vehicles, NGP management fee funds, NGP carry funds and fund of funds vehicles plus the capital that Carlyle is entitled to call from investors in those funds and vehicles (including Carlyle commitments to those funds and vehicles and those of senior Carlyle professionals and employees) pursuant to the terms of their capital commitments to those funds and vehicles;
(b) the amount of aggregate collateral balance and principal cash at par of our CLOs (inclusive of all positions) and the reference portfolio notional amount of our synthetic CLOs;
(c) the net asset value (pre-redemptions and subscriptions) of Carlyle’s long/short credit, emerging markets, multi-product macroeconomic, fund of hedge funds vehicles, and other hedge funds; and
(d) the gross assets (including assets acquired with leverage) of our Business Development Companies.
AUM includes certain energy and renewable resources funds that Carlyle jointly advises with Riverstone Holdings L.L.C. (“Riverstone”) and certain NGP management fee funds and NGP carry funds advised by NGP Energy Capital Management. In addition, our Solutions segment includes certain assets under consultative relationships. Total AUM includes only those assets which earn a material fee. Carlyle’s calculation of AUM (but not Fee-Earning AUM) includes uncalled commitments to, and the fair value of invested capital in, investment funds from Carlyle and its personnel, regardless of whether such commitments or invested capital are subject to management or performance fees.
Page | 34
“Available capital,” commonly known as “dry powder,” for Carlyle’s carry funds, NGP management fee funds, and NGP carry funds refers to the amount of capital commitments available to be called for investments. Amounts previously called may be added back to available capital following certain distributions.
“Carlyle funds,” “our funds” and “our investment funds” refer to the investment funds and vehicles advised by Carlyle.
“Carry funds” refers to those investment funds that Carlyle advises, including the buyout funds, growth capital funds, real estate funds, infrastructure funds, certain energy funds and distressed debt and mezzanine funds (but excluding Carlyle’s structured credit funds, hedge funds and fund of funds vehicles as well as the NGP management fee and NGP carry funds), where Carlyle receives a special residual allocation of income, which is referred to as a “carried interest,” in the event that specified investment returns are achieved by the fund.
“Expired available capital” occurs when a fund has passed the investment and follow-on periods and can no longer invest capital into new or existing deals. Any remaining available capital, typically a result of either recycled distributions or specific reserves established for the follow-on period that are not drawn, can only be called for fees and expenses and is therefore removed from the total AUM calculation.
“Fee-Earning assets under management” or “Fee-Earning AUM” refers to the assets managed by Carlyle from which Carlyle derives recurring fund management fees. Fee-Earning AUM generally equals the sum of:
(a) for carry funds and certain co-investment vehicles where the investment period has not expired and Metropolitan fund of funds vehicles where the weighted-average investment period of the underlying funds has not expired, the amount of limited partner capital commitments, for AlpInvest fund of funds vehicles, the amount of external investor capital commitments during the commitment period, and for NGP management fee funds, the amount of investor capital commitments before the first investment realization;
(b) for substantially all carry funds and certain co-investment vehicles where the investment period has expired and Metropolitan fund of funds vehicles where the weighted-average investment period of the underlying funds has expired, the remaining amount of limited partner invested capital and for NGP management fee funds where the first investment has been realized, the amount of partner commitments less realized and written-off investments;
Page | 35
(c) the amount of aggregate Fee-Earning collateral balance at par of our collateralized loan obligations (“CLOs”), as defined in the fund indentures (typically exclusive of equities and defaulted positions) as of the quarterly cut-off date for each CLO, and the reference portfolio notional amount of our synthetic collateralized loan obligations (“synthetic CLOs”);
(d) the external investor portion of the net asset value (pre-redemptions and subscriptions) of our long/short credit, emerging markets, multi-product macroeconomic, fund of hedge funds vehicles, and other hedge funds; and
(e) for AlpInvest fund of funds vehicles where the commitment fee period has expired and certain carry funds where the investment period has expired, the lower of cost or fair value of invested capital.
Fee-Earning AUM includes certain energy and renewable resources carry funds that Carlyle jointly advises with Riverstone and certain NGP management fee and NGP carry funds advised by NGP Energy Capital Management. In addition, our Solutions segment includes certain assets under consultative relationships. Fee-Earning AUM includes only those assets which earn a material fee.
For Carlyle’s carry funds, co-investment vehicles, NGP management fee funds, NGP carry funds and fund of funds vehicles, total AUM includes the fair value of the capital invested, whereas Fee-Earning AUM includes the amount of capital commitments or the remaining amount of invested capital at cost, depending on whether the investment period for the fund has expired. As such, Fee-Earning AUM may be greater than total AUM when the aggregate fair value of the remaining investments is less than the cost of those investments.
“Fund of funds vehicles” refers to those funds, accounts and vehicles advised by AlpInvest Partners B.V., Metropolitan Real Estate Equity Management, LLC, and Diversified Global Asset Management Corporation.
“NGP carry funds” refer to those funds advised by NGP Energy Capital Management (together with its affiliates and subsidiaries) from which we are entitled to receive a carried interest.
“NGP management fee funds” refer to those funds advised by NGP Energy Capital Management (together with its affiliates and subsidiaries) from which we only receive management fees.
“Net performance fees” refers to the performance fees from Carlyle funds and fund of funds vehicles net of the portion allocated to Carlyle investment professionals which is reflected as performance fee related compensation expense.
“Performance fees” consist principally of carried interest from carry funds and certain fund of funds vehicles and incentive fees or allocations from certain of our Global Market Strategies funds. Carlyle is generally entitled to a 20% allocation (or 1.8% to 10% in the case of most of the fund of funds
Page | 36
vehicles) of the net realized income or gain as a carried interest after returning the invested capital, the allocation of preferred returns of generally 8% to 9% and the return of certain fund costs (subject to catch-up provisions as set forth in the fund limited partnership agreement). Carried interest revenue, which is a component of performance fees in Carlyle’s consolidated financial statements, is recognized by Carlyle upon appreciation of the valuation of the applicable funds’ investments above certain return hurdles as set forth in each respective partnership agreement and is based on the amount that would be due to Carlyle pursuant to the fund partnership agreement at each period end as if the funds were liquidated at such date.
“Realized net performance fees” refers to the realized performance fees from Carlyle funds and fund of funds vehicles net of the portion allocated to Carlyle investment professionals which is reflected as realized performance fee related compensation expense.
“VIE” refers to a variable interest entity, as that term is defined in Accounting Standards Codification Topic 810, Consolidation.
Page | 37