Attached files
| file | filename |
|---|---|
| 8-K - 8-K - CBRE GROUP, INC. | a14-11449_18k.htm |
| EX-99.1 - EX-99.1 - CBRE GROUP, INC. | a14-11449_1ex99d1.htm |
Exhibit 99.2
|
|
CBRE GROUP, INC. First Quarter 2014: Earnings Conference Call April 30, 2014 |

|
|
This presentation contains statements that are forward looking within the meaning of the Private Securities Litigation Reform Act of 1995, including statements regarding our future growth momentum, operations, financial performance, business outlook and ability to successfully integrate businesses we have acquired with our existing operations. These statements should be considered as estimates only and actual results may ultimately differ from these estimates. Except to the extent required by applicable securities laws, we undertake no obligation to update or publicly revise any of the forward-looking statements that you may hear today. Please refer to our first quarter earnings report, filed on Form 8-K, and our current annual report on Form 10-K, in particular any discussion of risk factors or forward-looking statements, which are filed with the SEC and available at the SEC’s website (www.sec.gov), for a full discussion of the risks and other factors that may impact any estimates that you may hear today. We may make certain statements during the course of this presentation, which include references to “non-GAAP financial measures,” as defined by SEC regulations. As required by these regulations, we have provided reconciliations of these measures to what we believe are the most directly comparable GAAP measures, which are attached hereto within the appendix. FORWARD-LOOKING STATEMENTS |
|
|
CONFERENCE CALL PARTICIPANTS Bob Sulentic PRESIDENT AND CHIEF EXECUTIVE OFFICER Jim Groch CHIEF FINANCIAL OFFICER Gil Borok DEPUTY CHIEF FINANCIAL OFFICER Steve Iaco INVESTOR RELATIONS AND CORPORATE COMMUNICATIONS |
|
|
Q1 2014 Region Highlights BUSINESS OVERVIEW Americas EMEA Asia Pacific Revenue 10% Led by property sales with an increase of 17% Occupier outsourcing increased 13% Leasing grew by double-digits for third consecutive quarter Revenue127% (122% in local currency) Double digit organic growth in every major business line Without Norland, revenue increased a robust 32% (27% in local currency) Property sales surged 61% Revenue 8% (18% in local currency) Property sales increased 26% (or 38% in local currency) Strong growth in leasing and outsourcing in local currency Weakened currencies tempered growth rate when translated into U.S. dollars |
|
|
Revenue ($ in millions) Contractual Revenue Sources Capital Markets Global Corporate Services and Asset Services2 Investment Management Appraisal & Valuation Leasing Sales Commercial Mortgage Services Development Services Other Total Q1 2014 869.3 112.5 95.8 411.3 267.2 74.4 10.2 20.1 1,860.8 % of Q1 2014 Total 47% 6% 5% 22% 14% 4% 1% 1% 100% Q1 20131 585.3 127.3 89.3 374.6 210.4 65.8 12.7 13.6 1,479.0 Growth Rate (Change Q1 2014-over-Q1 2013) USD 49% -12% 7% 10% 27% 13% -20% 48% 26% Local Currency 50% -13% 9% 11% 29% 13% -20% 50% 27% Q1 2014 BUSINESS LINE REVENUE Includes revenue from discontinued operations. See slide 21 for details. Global Corporate Services (GCS) and Asset Services revenue excludes all associated leasing and sales revenue, most of which is contractual. 80% of total revenue Contractual revenue plus leasing, which is largely recurring, is 80% of total revenue |
|
|
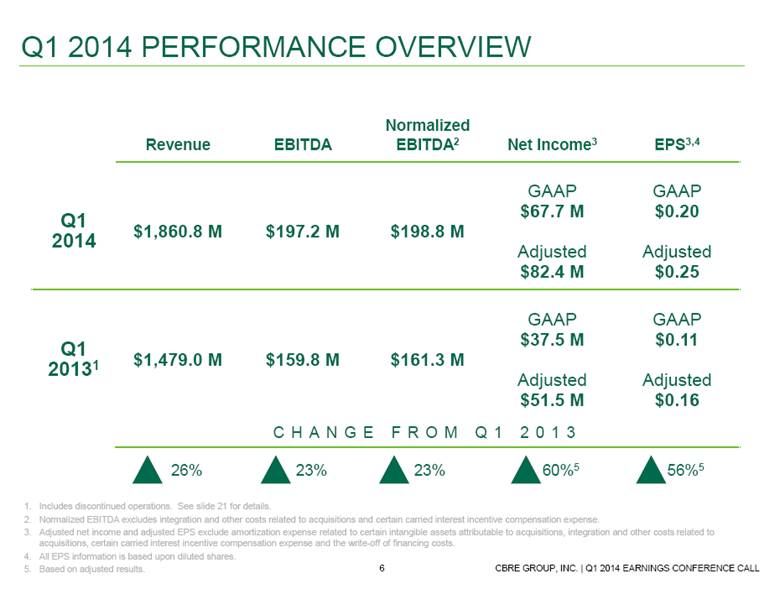
Q1 2014 PERFORMANCE OVERVIEW Includes discontinued operations. See slide 21 for details. Normalized EBITDA excludes integration and other costs related to acquisitions and certain carried interest incentive compensation expense. Adjusted net income and adjusted EPS exclude amortization expense related to certain intangible assets attributable to acquisitions, integration and other costs related to acquisitions, certain carried interest incentive compensation expense and the write-off of financing costs. All EPS information is based upon diluted shares. Based on adjusted results. Revenue EBITDA Normalized EBITDA2 Net Income3 EPS3,4 Q1 2014 $1,860.8 M $197.2 M $198.8 M GAAP $67.7 M Adjusted $82.4 M GAAP $0.20 Adjusted $0.25 Q1 20131 $1,479.0 M $159.8 M $161.3 M GAAP $37.5 M Adjusted $51.5 M GAAP $0.11 Adjusted $0.16 CHANGE FROM Q1 2013 26% 23% 23% 60%5 56%5 |
|
|
Total Americas Total U.S. Total Q1 2014 revenue up 10% in USD or 11% in local currency AMERICAS REVENUE: MAJOR COMPONENTS SALES LEASING GCS & ASSET SERVICES1 17% USD 19% LC 10% USD 11% LC 9% USD 10% LC 38% USD ($ in millions) Q1 Global Corporate Services (GCS) and Asset Services revenue excludes all associated leasing and sales revenue, most of which is contractual. |
|
|
Total Q1 2014 revenue up 127% in USD or 122% in local currency Excluding Norland up 32% in USD or 27% in local currency EMEA REVENUE: MAJOR COMPONENTS SALES LEASING ($ in millions) Q1 Including Norland Excluding Norland 276% USD 272% LC 16% USD 11% LC 61% USD 54% LC 30% USD 25% LC GCS & ASSET SERVICES1 Global Corporate Services (GCS) and Asset Services revenue excludes all associated leasing and sales revenue, most of which is contractual. |
|
|
Total Q1 2014 revenue up 8% in USD or 18% in local currency ASIA PACIFIC REVENUE: MAJOR COMPONENTS Q1 ($ in millions) SALES LEASING 1% USD 12% LC 5% USD 13% LC 26% USD 38% LC GCS & ASSET SERVICES1 Global Corporate Services (GCS) and Asset Services revenue excludes all associated leasing and sales revenue, most of which is contractual. |
|
|
GLOBAL INVESTMENT MANAGEMENT Includes discontinued operations. See slide 21 for details. Excludes securities business. As of April 30, 2014. As of March 31, 2014. In 2011, CBRE acquired the real estate investment management operations of ING Group in Europe, Asia and its global securities business. Q1 FINANCIAL RESULTS Revenue Normalized EBITDA ($ in millions) Rental Carried Interest Asset Management Acquisition, Disposition & Incentive Capital to deploy $5.3 billion3 Co-Investment $159.8 million4 CAPITAL RAISED2 ($ in billions) Q1 1 ASSETS UNDER MANAGEMENT (AUM) ($ in billions) 5 1 |
|
|
DEVELOPMENT SERVICES 3 $87.6 million of co-investments at the end of Q1 2014 $7.7 million in recourse debt to CBRE and repayment guarantees at the end of Q1 2014 Q1 FINANCIAL RESULTS PROJECTS IN PROCESS/PIPELINE HIGHLIGHTS Includes discontinued operations. See slide 21 for details. Pro-forma revenue includes gains on sales of assets and equity in unconsolidated subsidiaries net of non-controlling interest. In Process figures include Long-Term Operating Assets (LTOA) of $0.7 billion for 1Q 14, $0.9 billion for 4Q 13, $1.2 billion for 4Q 12, $1.5 billion for 4Q 11, $1.6 billion for 4Q 10, and $1.4 billion for 4Q 09. LTOA are projects that have achieved a stabilized level of occupancy or have been held 18-24 months following shell completion or acquisition. Revenue Normalized EBITDA ($ in millions) ($ in billions) Revenue Pro-forma Revenue2 1 1 |
|
|
Facilities Management Global New 25 Expansions 24 Renewals 14 GLOBAL CORPORATE SERVICES Q1 2014 TOTAL CONTRACTS Best-in-class building technical engineering services in Europe Fits perfectly with growing international adoption of outsourcing High-growth, largely recurring business Prestigious, sticky client base Exceeded growth target in Q1 2014 Enhanced cross-selling opportunities Transaction Services Project Management |
|
|
CBRE’s many strengths were evident in Q1 2014 Most business lines performed materially better than the market Good momentum in the business continues Expectations for balance of 2014: Property Sales should continue strong, double-digit growth pace expected to moderate from Q1’s robust level more difficult comparisons as the year progresses Declining GSE volume likely to remain a challenge, while activity increases with other capital sources Leasing is expected to continue to grow well despite slow, uneven recovery Occupier Outsourcing is expected to sustain double-digit growth Norland provides enhanced growth prospects and long-term contractual revenue Investment Management and Development, combined, still expected to perform roughly in line with 2013, excluding carried interest 2014 Expectations BUSINESS OUTLOOK |
|
|
See more upside than downside to full-year guidance Q1 is a relatively small portion of the year’s earnings and not an adequate barometer of full-year performance Year-over-year earnings comparisons will be more challenging in the quarters ahead At the present time, not updating our earnings expectation for full-year 2014 CBRE well positioned for growth with measured investments in our people and platform as well as strong client service Expect ongoing market share gains and strong long-term growth Excellent liquidity, cash flow and a conservative balance sheet provide a strong foundation for future growth 2014 Expectations BUSINESS OUTLOOK |
|
|
SUPPLEMENTAL SLIDES AND GAAP RECONCILIATION TABLES |

|
|
U.S. VACANCY U.S. ABSORPTION TRENDS (in millions of square feet) 1Q13 1Q14 2014F 2015F 1Q13 1Q14 2013 2014F 2015F Office 15.4% 14.8% 14.6% 14.2% 3.8 5.5 35.8 29.9 35.5 Industrial 12.2% 11.1% 10.8% 10.6% 61.8 43.5 233.5 188.9 128.9 Retail 12.5% 11.9% 10.8% 10.0% 7.0 8.2 26.8 39.0 47.5 U.S. MARKET STATISTICS Source: CBRE Econometric Advisors (EA) Outlooks 1Q 2014 preliminary CAP RATES AND OVERALL VOLUMES 1Q13 1Q14 Office Volume ($B) 17.3 22.7 Cap Rate 7.1% 6.7% Industrial Volume ($B) 7.6 11.3 Cap Rate 7.6% 7.4% Retail Volume ($B) 9.3 22.9 Cap Rate 7.1% 6.8% Source: RCA April 2014 |
|
|
As of March 31, 2014 MANDATORY AMORTIZATION AND MATURITY SCHEDULE ($ in millions) $1,200.0 million revolver facility matures in March 2018. As of March 31, 2014, the outstanding revolver balance was $359.5 million. 1 Global Cash Available Revolver 1,232 30 40 68 255 440 2 352 198 800 - 250.0 500.0 750.0 1,000.0 1,250.0 1,500.0 Q1 2014 2014 2015 2016 2017 2018 2019 2020 2021 2022 2023 Current Liquidity Term Loan A Term Loan B Revolver 1 Sr. Unsecured Notes - 6.625% Sr. Unsecured Notes - 5.00% |
|
|
CAPITALIZATION Excludes $27.2 million of cash in consolidated funds and other entities not available for Company use at March 31, 2014. Represents notes payable on real estate in Development Services that are recourse to the Company. Excludes non-recourse notes payable on real estate of $127.9 million at March 31, 2014. Excludes $306.6 million of aggregate warehouse facilities outstanding at March 31, 2014. Calculation includes EBITDA from discontinued operations. See slide 21 for details. Cash1 $ 401.0 Revolving credit facility 359.5 Senior secured term loan A (new) 462.5 Senior secured term loan B (new) 212.9 Senior unsecured notes 5.0% 800.0 Senior unsecured notes 6.625% 350.0 Notes payable on real estate2 4.0 Other debt3 5.5 Total debt $ 2,194.4 Stockholders’ equity 1,989.6 Total capitalization 4,184.0 Total net debt $ 1,793.4 Net debt to TTM Normalized EBITDA4 1.69x As of March 31, 2014 ($ in millions) |
|
|
Three Months Ended March 31, ($ in millions) 2014 20131 Normalized EBITDA $ 198.8 $ 161.3 Adjustments: Carried interest incentive compensation2 1.6 - Integration and other costs related to acquisitions - 1.5 EBITDA 197.2 159.8 Add: Interest Income 1.6 2.0 Less: Depreciation and amortization 65.2 46.6 Interest expense 28.0 44.2 Write-off of financing costs - 13.6 Provision for income taxes 37.9 19.9 Net Income attributable to CBRE Group, Inc. 67.7 37.5 Revenue $ 1,860.8 $ 1,479.0 Normalized EBITDA Margin 10.7% 10.9% RECONCILIATION OF NORMALIZED EBITDA TO EBITDA TO NET INCOME Includes discontinued operations. See slide 21 for details. Carried interest incentive compensation is related to funds that began recording carried interest expense in Q2 2013 and beyond. |
|
|
Three Months Ended March 31, ($ in millions) 2014 2013 Net income attributable to CBRE Group, Inc. $ 67.7 $ 37.5 Amortization expense related to certain intangible assets attributable to acquisitions, net of tax 13.7 4.6 Carried interest incentive compensation, net of tax1 1.0 - Integration and other costs related to acquisitions, net of tax - 1.1 Write-off of financing costs, net of tax - 8.3 Net income attributable to CBRE Group, Inc., as adjusted $ 82.4 $ 51.5 Diluted income per share attributable to CBRE Group, Inc., as adjusted $ 0.25 $ 0.16 Weighted average shares outstanding for diluted income per share 333,349,519 330,802,552 Carried interest incentive compensation is related to funds that began recording carried interest expense in Q2 2013 and beyond. RECONCILIATION OF NET INCOME TO NET INCOME, AS ADJUSTED |
|
|
Discontinued Operations for the Three Months Ended March 31, 2013 ($ in millions) Global Investment Management Development Services Total CBRE Revenue $ 0.7 $ 3.3 $ 4.0 EBITDA1 $ 0.6 $ 3.8 $ 4.4 Less: Depreciation & amortization 0.1 0.2 0.3 Interest expense 0.5 1.3 1.8 Provision for income taxes - 0.9 0.9 Net income attributable to CBRE Group, Inc. $ - $ 1.4 $ 1.4 RECONCILIATION OF DISCONTINUED OPERATIONS There are no selected charges attributable to discontinued operations. |