Attached files
| file | filename |
|---|---|
| 8-K - FORM 8-K - FARMERS NATIONAL BANC CORP /OH/ | d713653d8k.htm |
Exhibit 99.1

| Annual Meeting of Shareholders Thursday, April 24, 2014 |

| 2013 |

| "Health of Our Wealth" |

| Kevin J. Helmick President & Chief Executive Officer |

| National Recognition Named One of the Top 200 Community Banks in America for the Second Consecutive Year by American Banker Magazine Named one of the Top 100 Banks by Bank Director in the 2013 Bank Performance Scorecard |

| Stock Performance Last three calendar year total shareholder return: 83% 2013 Stock Price Appreciation 5.6% from $6.20 at 12-31-12 to $6.55 at 12-31-13 Compelling Valuation 1.20x of tangible book value 12.4x LTM pre-tax pre- provision earnings 16.0x LTM EPS Stock Up 82% Since '08 |

| FMNB Stock Performance (CHART) Period Ending Period Ending Period Ending Period Ending Index 12/31/08 12/31/09 12/31/10 12/31/11 12/31/12 12/31/13 Farmers National Banc Corp. 100.00 141.36 115.32 161.86 208.78 224.82 NASDAQ Composite 100.00 145.36 171.74 170.38 200.63 281.22 NASDAQ Bank 100.00 83.70 95.55 85.52 101.50 143.84 SNL Microcap Bank Index 100.00 73.74 75.89 72.18 91.22 117.71 |

| Increasing Shareholder Value Stable Dividend Policy Always paid a quarterly cash dividend Dividend yield was $0.12 or 1.83% yield on 12/31/13 on stock price of $6.55 Dividend payout in 2013 was 28.9% of net income |

| Wealth Management Wealth Management Creates Fee-based Income Fee Income 2009: 14.5% of total gross income Noninterest income excluding security gains Fee Income 2013: 26.7% of total gross income Noninterest income excluding security gains Wealth Management Build-out Timeline 2000 Farmers National Investments 2009 Farmers Trust Company 2010 Farmers National Insurance 2012 Private Client Services 2013 National Associates, Inc. |

| Farmers National Investments Record Year #1 in the District for 2013 2013 2012 2011 Total GDC $1,448,916 $1,314,566 $1,231,419 YOY 10% 7% 17% AUM $232,627,882 $191,021,554 $158,718,192 YOY 22% 20% 11% |

| Farmers Trust Company New business in 2013 totaled over $406,000 or 8% revenue growth Leadership Transition James H. Sisek, Esq, Chairman & Chief Legal Counsel Joseph J. DePascale, CPA, CFP(r), AIFA(r), CMFS, President & Chief Executive Officer William Hanshaw, Esq., Chief Operating Officer |

| Farmers Trust Company Historical Operating Profit Type - Year Historical 2011 Historical 2012 Historical 2013 Income 5,462,929 5,618,268 5,707,809 Expense 4,354,336 4,508,560 4,506,864 Income Before Taxes and Amortization 1,108,593 1,109,708 1,200,945 |

| Farmers National Insurance Revenue Growth 108% in 2013 from 2012 230% since 2009 Wide Range of Competitively-priced Policies Auto - Homeowner Rental/Condo - Personal Liability Business - Life Disability - Individual/Group Health & Dental Medicare Supplements - Worksite Benefits |

| Private Client Services First full year of Farmers' Private Banking program 162 new enrollments in 2013 Mahoning Valley as of March 31, 2014 204 Clients $16,209,903 in Loans $56,128,821 in Deposits $6,630,084 in Investments Canton as of March 31, 2014 43 Clients $8,234,549 in Loans $3,218,509 in Deposits |

| National Associates, Inc. National Associates, Inc. Acquired in July, 2013 Leading independent consultant to retirement plans Offers actuarial, plan design, compliance and administrative services NAI retained its corporate name, full staff of 17 and current location in Cleveland Assets Under Administration of approximately $505 million Generates Fee Income Six-month Revenue: $627,000 |

| Rocky River Expansion Lending/Wealth Management Branch Received OCC Branch License in January, 2014 Located in NAI Office Branch staffed by: David Simko, Vice President, Commercial Lending Relationship Manager Ted Grabowski, Vice President, Private Client Relationship Manager Financial Advisor Mortgage Consultant Universal Banker |
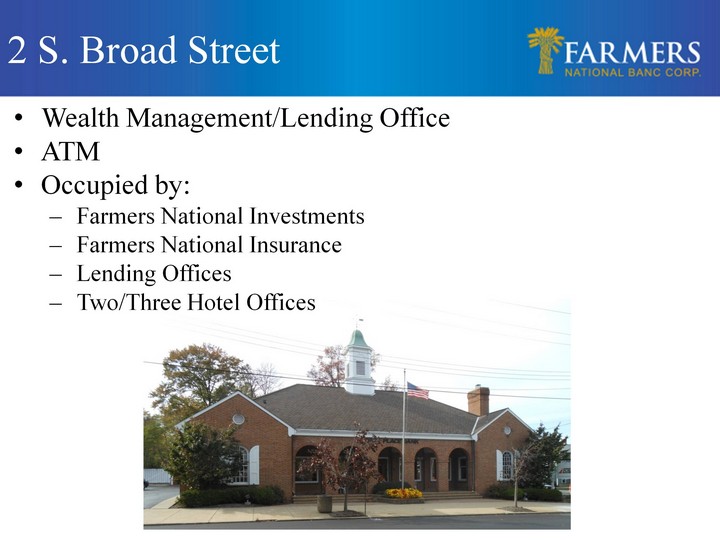
| 2 S. Broad Street 2 S. Broad Street Wealth Management/Lending Office ATM Occupied by: Farmers National Investments Farmers National Insurance Lending Offices Two/Three Hotel Offices |
| Alliance Branch Alliance Branch Located across the street from the University of Mount Union campus Newly constructed university development Student Population Growth Mount Union's undergraduate enrollment has nearly doubled in the past few decades, increasing from approximately 1,300 in 1990 to more than 2,200 today This past fall, Mount Union welcomed a new student class of 679 to campus, with students representing 13 countries, 20 states and 53 counties in Ohio Student enrollment from the Farmers market area Columbiana - 6% Mahoning - 5% Trumbull - 3% Stark - 17% Connects Farmers' branches from Damascus to Canton |
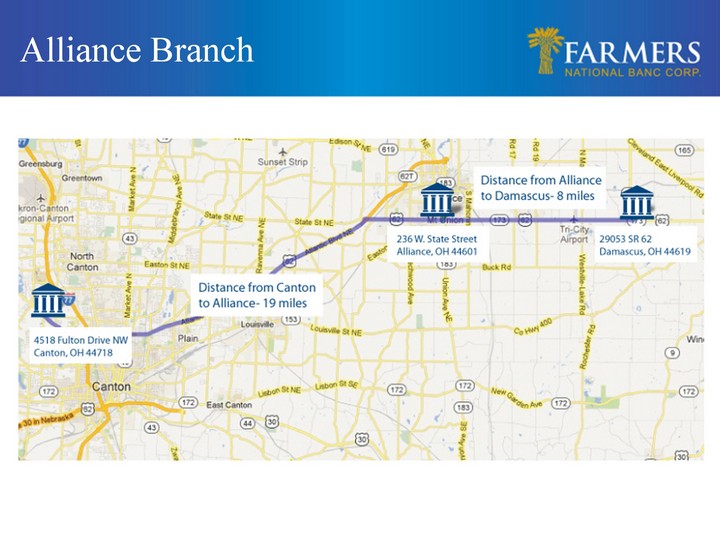
| Alliance Branch |

| Coming Soon...Alliance Branch Coming Soon...Alliance Branch |

| Corporate Efficiencies Profit Improvement Committee (PIC) Branch Efficiencies Closing of Leetonia and Warren Branches Customer accounts transferred to Columbiana and Eastwood Minimal account loss Elimination of Assistant Manager Position Checking Account Fee/Service Charge Adjustments Fees and service charges had not been adjusted since 2003 Created an additional $200,000 from September to December in income and $36,000 in savings |

| Competitive Landscape Significant competition for customer's share of wallet Increasing regulatory concerns The difficulty and costs for smaller banks to comply with regulations may create opportunities for Farmers Banks are adjusting their balance sheets to comply with Basel 3 Banks are reducing expenses to offset regulatory reform costs |
| Competitive Landscape Consolidation of Banks in Ohio and Nationally Forcing companies to make decisions regarding their strategic direction Economic Challenges Prolonged slow growth, low rate environment Uncertainty in loan demand |

| Competitive Landscape Strategy for Profitability Strong Capital Position Strong Asset Quality Loan Growth Diversifying Revenue Stream Controlling Non-interest Expenses |

| 2013 Strategic Initiatives Retain, Support, Develop and Attract Quality Associates Grow Interest Revenue through Loan Growth, Acquisition and a Higher Loan to Deposit Ratio Diversify Financial Services & Expand Non-Interest Income Leverage Technology to Enhance Service and Minimize Operational Risk Enterprise Risk Management and Asset Quality Brand and Product Enhancements |

| 2014 Strategic Initiatives Growth of Non-Interest Income through Wealth Management and Related Businesses and Bank Fee Revenues Grow Loan Production Volume Technology and the Automated Virtual Bank Expense Control Culture Enterprise Risk Management Acquisition or "Lift Outs" Shareholder Management |

| Carl D. Culp Executive Vice President Chief Financial Officer |

| 2013 Financial Overview Marked the 31st consecutive year of profitability One-time charges impacted the level of profitability in 2013 Fourth quarter was the 124 consecutive quarterly dividend payment Robust loan growth Strong asset quality Remain committed to diversifying and growing sources of revenue and income Successfully managing yield of earning assets and cost of funds in a low rate environment Continued improvements in cost structure |

| Loan Portfolio Note: Dollars in thousands 7.6% net loan growth in 2013 due to increased Commercial, Commercial Real Estate and Indirect Automobile Loans Improvement in Loan to Deposit Ratio in 2013 Improvement in Loan to Deposit Ratio in 2013 Improvement in Loan to Deposit Ratio in 2013 Improvement in Loan to Deposit Ratio in 2013 (CHART) |

| Total Assets Asset Growth of 7% since 2011 Note: Dollars in thousands Note: Dollars in thousands Note: Dollars in thousands |

| Conservative Credit Quality Source: FDIC. FMNB Commercial Banks with assets between $1 billion and $3 billion 1. Source: SNL Financial. Publicly traded banks with headquarters in Ohio. 2. Source: FDIC. Bank Holding Companies with assets between $1 billion and $3 billion (CHART) (CHART) |
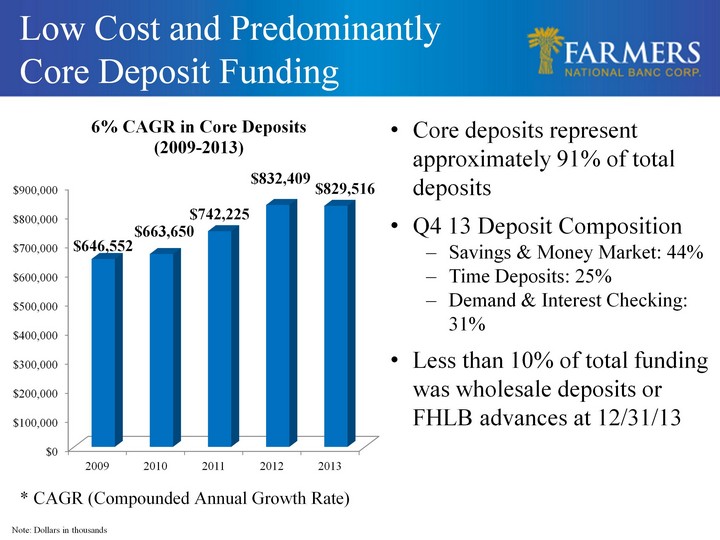
| Low Cost and Predominantly Core Deposit Funding Note: Dollars in thousands Core deposits represent approximately 91% of total deposits Q4 13 Deposit Composition Savings & Money Market: 44% Time Deposits: 25% Demand & Interest Checking: 31% Q4 13 Deposit Composition Savings & Money Market: 44% Time Deposits: 25% Demand & Interest Checking: 31% Q4 13 Deposit Composition Savings & Money Market: 44% Time Deposits: 25% Demand & Interest Checking: 31% Less than 10% of total funding was wholesale deposits or FHLB advances at 12/31/13 Less than 10% of total funding was wholesale deposits or FHLB advances at 12/31/13 Less than 10% of total funding was wholesale deposits or FHLB advances at 12/31/13 * CAGR (Compounded Annual Growth Rate) (CHART) |

| (CHART) Farmers' Returns vs. Peers Source: SNL Financial FMNB Publicly traded banks with headquarters in Ohio (CHART) Net interest margin compression and increased expenses impacted returns in 2013 |

| Profitability Excluding $1.3 million in severance costs for terminated employees, earnings per share in 2013 would have been $0.46 per share Improvement in fourth quarter earnings per share after cost savings initiatives and fee income changes implemented (CHART) (CHART) |

| Profitability Source: FDIC. FMNB Commercial Banks with assets between $1 billion and $3 billion Net interest margin for Farmers stabilized in fourth quarter (CHART) Net interest margin continued to compress for the banking industry and FMNB (CHART) |

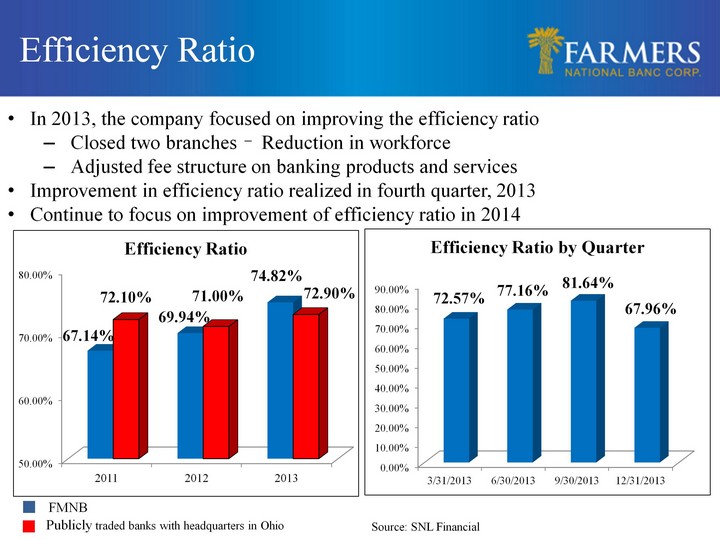
| Efficiency Ratio Source: SNL Financial In 2013, the company focused on improving the efficiency ratio Closed two branches Reduction in workforce Adjusted fee structure on banking products and services Improvement in efficiency ratio realized in fourth quarter, 2013 Continue to focus on improvement of efficiency ratio in 2014 FMNB Publicly traded banks with headquarters in Ohio (CHART) (CHART) |
| Highlights of First Quarter 2014 125 consecutive quarters of profitability Net income per diluted share for three months ended March 31, 2014 was $0.12, an increase of 9% compared to $0.11 for the first quarter, 2013 Efficiency ratio for the first quarter improved to 69.87%, compared to 72.57% for the same quarter in 2013 Loans increased 5.7% since March 31, 2013 Non-performing assets to total assets remain at low levels, 0.76% at March 31, 2014 |

| Ronald V. Wertz Farmers National Banc Corp. Board of Directors 1989 - 2014 |

| Questions and Answers |