Attached files
| file | filename |
|---|---|
| 8-K - 8-K - Capella Healthcare, Inc. | d713650d8k.htm |
 Lender
Presentation April 2014
Exhibit 99.1 |
 Disclaimer
2
Forward-Looking Statement
Certain statements made in this presentation, as well as information included in oral
statements or other written statements made, or to be made, by our management, contain,
or will contain, disclosures that are “forward-looking statements” within the meaning of the safe harbor provisions of the Private
Securities Litigation Reform Act of 1995. Forward-looking statements include all
statements that do not relate solely to historical or current facts and can be
identified by the use of words such as “may,” “will,” “expect,” “believe,” “intend,” “plan,” “estimate,” “project,” “continue,” “should” and other
comparable terms. These forward-looking statements are based on the current plans
and expectations of our management and are subject to a number of risks and
uncertainties, which could significantly affect our current plans and expectations and future financial condition and results and there can be no
assurance that the plan or expectation will be achieved or accomplished. Except as required by
law, we undertake no obligation to publicly update or revise any forward-looking
statements, whether as a result of new information, future events or otherwise. Investors are cautioned against relying on such
forward-looking statements when evaluating the information contained in this presentation
or included in oral statements or other written statements. Presentation of Non-GAAP Information
The presentation also contains certain financial measures. The SEC has issued rules to
regulate the use in filings with the SEC of “non-GAAP financial
measures,” such as EBITDA and adjusted EBITDA, that are derived on the basis of
methodologies other than in accordance with accounting principles generally accepted in
the United States, or GAAP. Our management relies on EBITDA and adjusted EBITDA as the primary measures to review and assess
the operating performance of our facilities and their management teams. We believe it is
useful to investors to provide disclosures of our operating results on the same basis as
that used by management. Management and investors also review EBITDA and adjusted EBITDA to evaluate our overall performance
and to compare our current operating results with corresponding periods and with other
companies in the health care industry. EBITDA and adjusted EBITDA should not be
considered in isolation or as a substitute for GAAP financial measures. Because EBITDA and adjusted EBITDA are not measurements
determined in accordance with GAAP and are thus susceptible to varying calculations, they may
not be comparable as presented to other similarly titled measures of other companies.
|
 Presenters
3
Michael Wiechart
President & Chief Executive Officer
James Brett
Bank of America Merrill Lynch
Denise Wilder Warren
EVP and Chief Financial Officer |
 4
Executive Summary |
 ($ in
millions) As of
Pro Forma
1Q14
Adj.
1Q14
Leverage
Cash and Cash Equivalents
$11.4
$4.6
$16.0
New Revolver
-
-
-
Muskogee, M6 and Athena Leases
53.4
(39.9)
13.5
Muskogee Promissory Note
3.4
(3.4)
-
New First Lien Term Loan
-
425.0
425.0
Total First Lien Debt
$56.8
$438.5
4.75x
New Second Lien Term Loan
-
160.0
160.0
Total Senior Secured Debt
$56.8
$598.5
6.48x
9.250% Senior Notes
500.0
(500.0)
-
Total Debt
$556.8
$598.5
6.48x
Total Net Debt
$545.4
$582.5
6.30x
Financial Statistics as of 3/31/14:
LTM Adjusted EBITDA
$92.4
$92.4
Executive Summary
Transaction Overview
5
Capella Healthcare, Inc. (“Capella”) is pursuing a transaction to purchase
the MCH Capital Lease, payoff the MCH Promissory Note and refinance the existing
Senior Notes due 2017 The transaction will provide Capella with an overall
maturity extension, prepayable debt and substantial interest savings
The contemplated transaction consists of a $100 million ABL Revolver, a $425 million
First Lien Term Loan, and a $160 million Second Lien Term Loan
Note: All 1Q14 results are unaudited.
(1) Assumes the call price of 104.625% of par on 7/1/14.
($ in millions)
Sources
Amount
%
New Term Loan B
$425.0
73%
New Second Lien Term Loan
160.0
27%
Total Sources
$585.0
100%
Uses
Amount
%
Refinance Existing Senior Notes
$500.0
85%
Muskogee Lease Buyout
39.9
7%
Muskogee Promissory Note Pay Off
3.4
1%
Estimated Call Premium
(1)
23.1
4%
Estimated Fees, Expenses and OID
14.0
2%
Cash To Balance Sheet
4.6
1%
Total Uses
$585.0
100% |
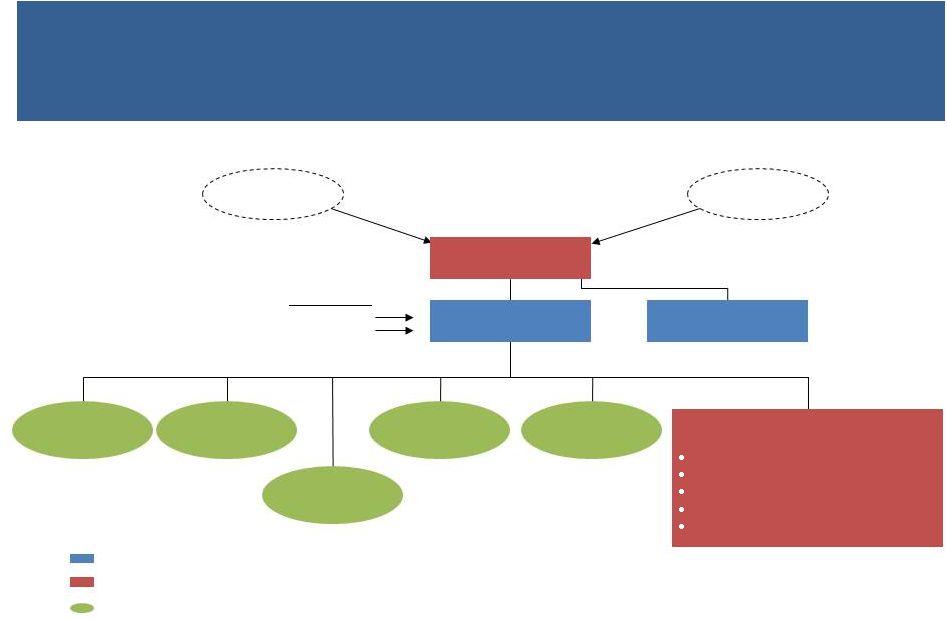 New
Financing $100 mm ABL RC
$425 mm First Lien TL
$160 mm Second Lien TL
(100%)
Common
Stock
–
729.5M
shares
(85.0%)
(90.3%)
Capital
Medical
Center (WA)*
5 wholly-owned domestic subsidiaries:
St. Mary’s Regional Medical Center (AR)
Mineral Area Regional Medical Center (MO)
EASTAR Health System (OK)
Southwestern Medical Center (OK)
Willamette Valley Medical Center (OR)
Auriga Insurance Group
= Borrower: pledge of all owned stock, intercompany notes and other assets (including
mortgages) = Guarantor: pledge of all owned stock, intercompany notes and other
assets (including mortgages) = Non-Guarantor Joint Venture: pledge of all
stock, GP and LP interests held by Capella and pledge of all secured
intercompany notes owing to Capella
(100%)
Capella Healthcare Inc.
(DE)
Common
Stock
–
128.7M
shares
(15.0%)
(100%)
Executive Summary
Legal Structure
6
River Park
Hospital (TN)*
(93.5%)
GTCR
Capella
Management
Capella Holdings, Inc.
(DE)
(58.0%)
Cannon
County (TN)*
National Park
Medical Center
(AR)*
Highlands Medical
Center (TN)*
(81.2%)
(95.3%)
* St. Thomas owns a 6.49% stake in Highlands Medical Center,
River Park Hospital, and Cannon County. The remainder of minority interest is physician-owned.
|
 Executive
Summary Key Investment Highlights
7
Diversified Portfolio
of Well Positioned
Assets
Capitalize on
Identified and
Actionable Growth
Strategies
Geographically
Positioned to
Capitalize on Network
/ Affiliation
Opportunities
Meaningful Upside
from Healthcare
Reform
Significant Resources
Dedicated to Patient
Care Excellence
Consistent Operating
Performance
Strong Credit and
Liquidity Profile |
 8
Capella Overview |
 Company
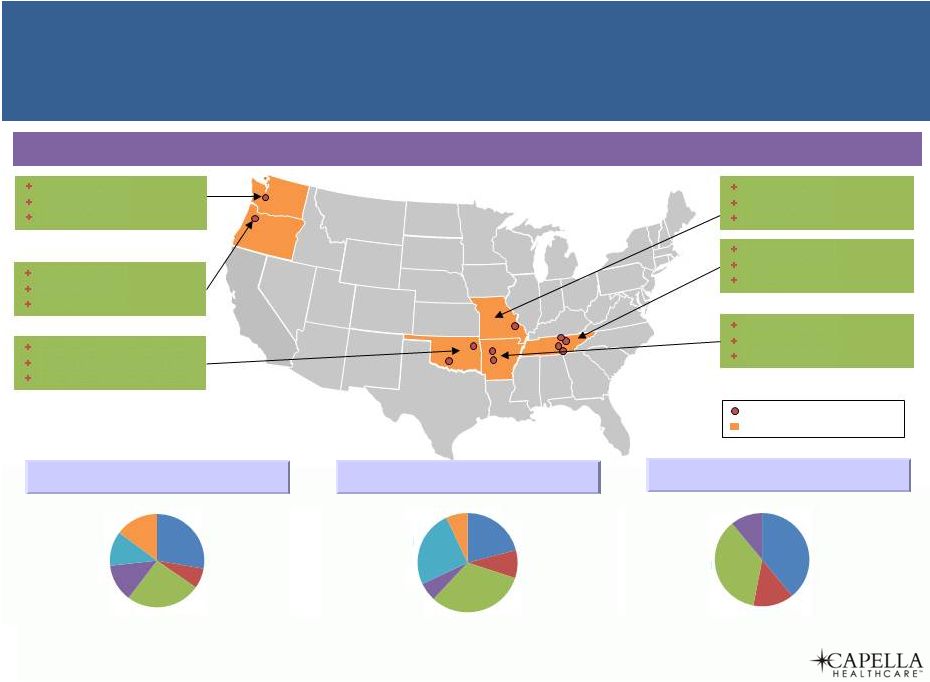
Overview Unique & Diversified Portfolio of Assets in Strong Geographic
Markets 9
Well Capitalized Portfolio | Limited CapEx Needs | Future CapEx for
Revenue-Generating, Targeted Growth Initiatives Arkansas
2 hospitals
336 beds
Washington
1 hospital
110 beds
Oklahoma
2
hospitals
(4
hospital
campuses)
519 beds
Missouri
1 hospital
135 beds
Tennessee
4 hospitals
316 beds
Oregon
1 hospital
88 beds
States with Capella Presence
Capella Facilities
Source: Company website, Public Filings.
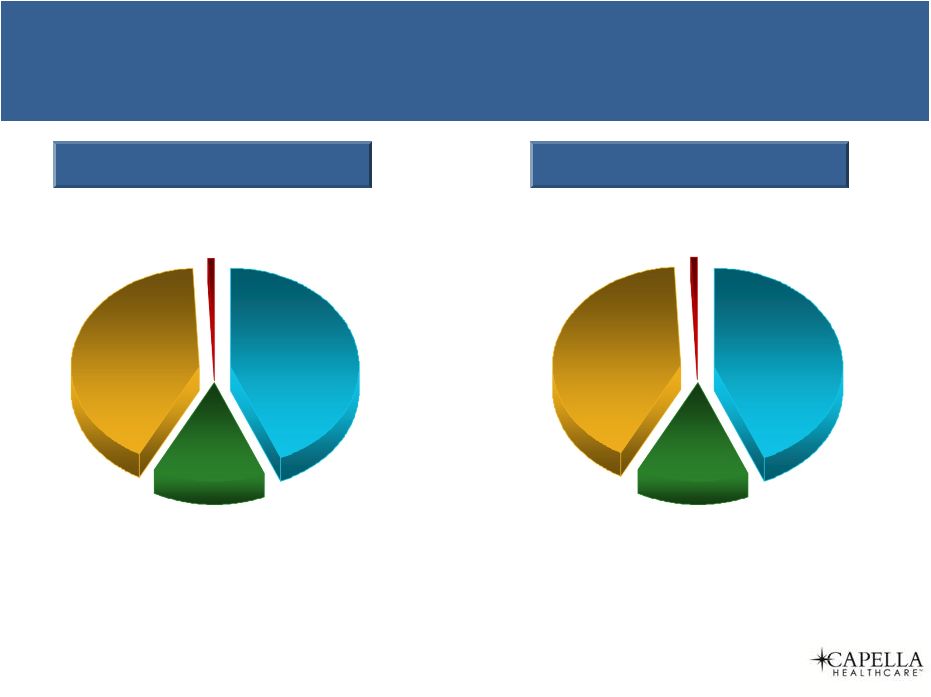
2013 Payor Mix by Net Revenue
(ex. Bad Debt)
Beds by Geography
2013 Net Revenue by Geography
12%
38%
14%
36%
Medicare
Medicaid
Managed
Care &
Other
Self Pay
22%
9%
35%
6%
21%
7%
AR
MO
OK
OR
TN
WA
AR
MO
OK
OR
TN
WA
28%
6%
26%
13%
12%
15% |
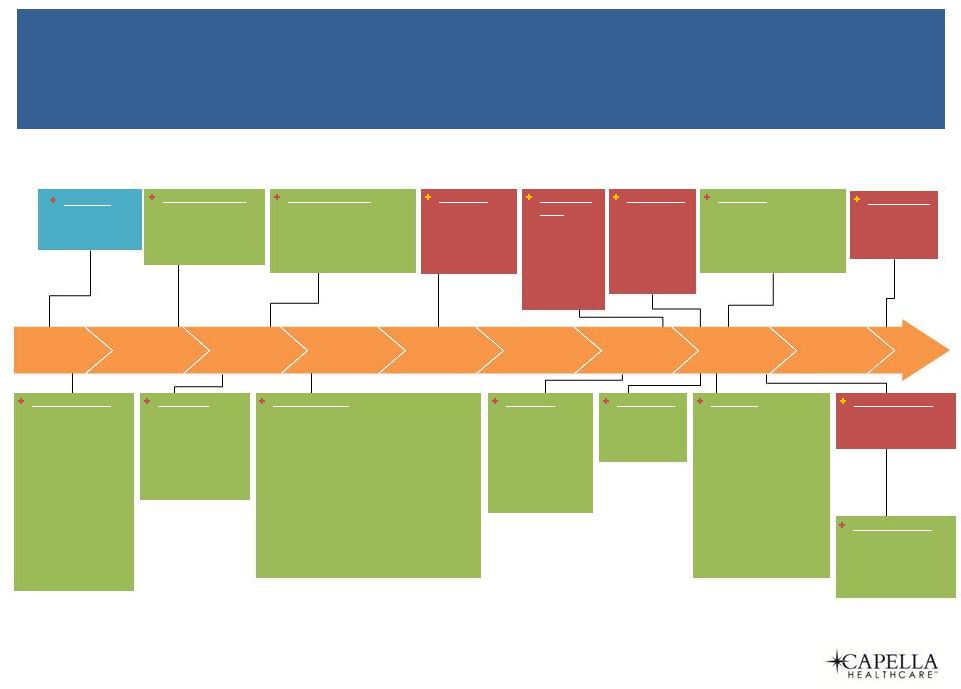 Company
Overview Strategic Timeline of Events: Building & Shaping an Attractive
Portfolio 10
December 2006:
Acquired Middle
Tenn. Surgical Care
(River Park Hospital
(TN))
November
2005:
Acquired Facilities
(GTCR Investment:
$70mm)
April
2007:
Leased Muskogee
Regional Medical
Center (EASTAR
Health System,
OK) (GTCR
Investment:
$36mm )
July
2009:
Divested
Woodland
Medical Center
(AL)
February
2008:
Acquired
Facilities
from
Community Health Systems (CYH) (GTCR
Investment: $102mm)
December
2011:
Divested
Parkway
Medical
Center (AL)
July
2011:
Partnered with
Cannon County
Hospitals
November 2007:
Acquired Providence MRI
Associates and
Providence Radiological
Services (EASTAR Health
System (OK))
March
2012:
Divested
Hartselle
Medical
Center (AL)
July
2012:
Acquired
Muskogee Community
Hospital through long-
term lease to expand
presence in
Northeastern OK
March
2012:
Acquired
Muskogee RT
Associates
(OK)
May
2012:
Partnered
with Saint Thomas
Health (Ascension)
resulting in joint
ownership and
operation of the
Company’s four Middle
TN hospitals including
River Park Hospital,
Highlands Medical
Center, DeKalb
Community Hospital,
and Stones River
Hospital
December
2012:
Divested
Jacksonville
Medical Center
(AL)
December 2012:
Acquired Southwest
Imaging Center
(OK) and
Raindancer (DIC)
(OK)
2005
2006
2007
2008
2009
2010
2011
2012
2013
2014
March 2014:
Divested
Grandview
Medical
Center (TN)
May 2005:
GTCR Initial
Commitment:
$200mm
•
Southwestern
Medical Center
(OK)
•
Grandview
Medical Center
(TN)
•
River Park
Hospital (TN)
•
Capital Medical
Center (WA)
from HCA
•
National Park Medical Center (AR)
•
St. Mary's Regional Medical Center (AR)
•
Mineral
Area
Regional
Medical
Center
(MO)
•
White County Community Hospital (TN)
(Highlands Medical Center)
•
Willamette Valley Medical Center (OR)
•
Hartselle Medical Center (AL)
•
Jacksonville Medical Center (AL)
•
Parkway Medical Center (AL)
•
Woodland Medical Center (AL)
•
DeKalb
Community
Hospital (TN)
•
Stones River
Hospital (TN) |
 11
Source: Company website.
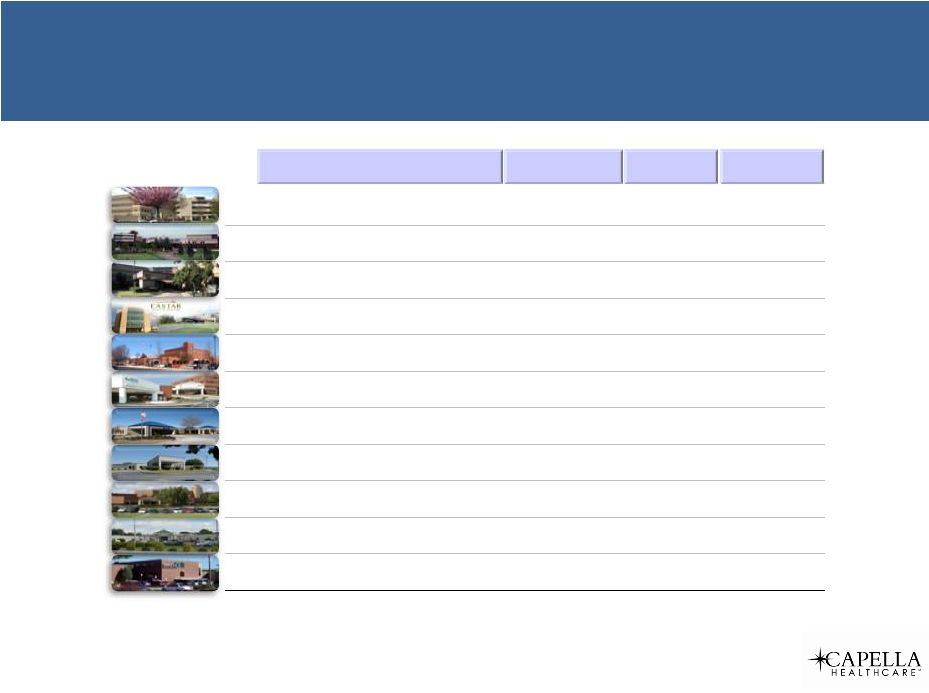
Company Overview
Consolidated Facilities Summary
Name
City
State
# of Beds
Capital Medical Center
Olympia
WA
110
Willamette Valley Medical Center
McMinnville
OR
88
Southwestern Medical Center
Lawton
OK
199
EASTAR Health System
Muskogee
OK
320
St. Mary’s Regional Medical Center
Russellville
AR
170
National Park Medical Center
Hot Springs
AR
166
Highlands Medical Center
Sparta
TN
60
Stones River Hospital
Woodbury
TN
60
River Park Hospital
McMinnville
TN
125
DeKalb Community Hospital
Smithville
TN
71
Mineral Area Regional Medical Center
Farmington
MO
135
Total
1,504 |
 12
Source: Company website.
Michael Wiechart
President,
Chief Executive Officer
26+ years
Tom Anderson
Vice Chair
39+ years
Quality
Development
Operations
Finance
Administrative
Open
EVP, Chief Medical Officer
Andy Slusser
EVP, Acquisitions & Development
32+ years
Michael Wiechart
President & Chief Executive
Officer
26+ years
Denise Warren
EVP, Chief Financial Officer
29+ years
Neil Kunkel
EVP, Chief Legal &
Administrative Officer
21+ years
Average 30
Years of
Experience
Company Overview
Proven & Experienced Leadership Team
Dan Slipkovich
Executive Chair
33+ years |
 Hospital
Management
Teams
Local
Physician
Leadership
Groups
13
Patient Care
Excellence
Begins in our
Communities
Boards of
Trustees &
Community
Leaders
Participation
in our
National
Leadership
Meetings
National
Physician
Leadership
Group / Physician
Advisory
Group
“O”
Leadership
Council
Company Overview
Foundation of Patient Care Excellence |
 Company
Overview Physician Engagement
14
5 Whole Hospital
1 ASC
5 Whole Hospital
1 ASC
Physician JVs
Physician JVs
More than
800 with active
admitting privileges
More than
800 with active
admitting privileges
Affiliate
Affiliate
Physician
Leadership
Physician
Leadership
CMO
NPLG
CMO
NPLG
LPLG
PAG
LPLG
PAG
National Park
Medical Center
166
4.7%
May 2006
(Hot Springs, AR)
Capital Medical
Center
110
9.8%
June 2007
(Olympia, WA)
Highlands Medical
Center
60
12.3%
August 2009
(Sparta, TN)
DeKalb Community
Hospital
71
35.5%
July 2011
(Smithville, TN)
Stones River
Hospital
60
35.5%
July 2011
(Woodbury, TN)
Hospital
(City, State)
Beds
%JV
Year of JV |
 15
Company Overview
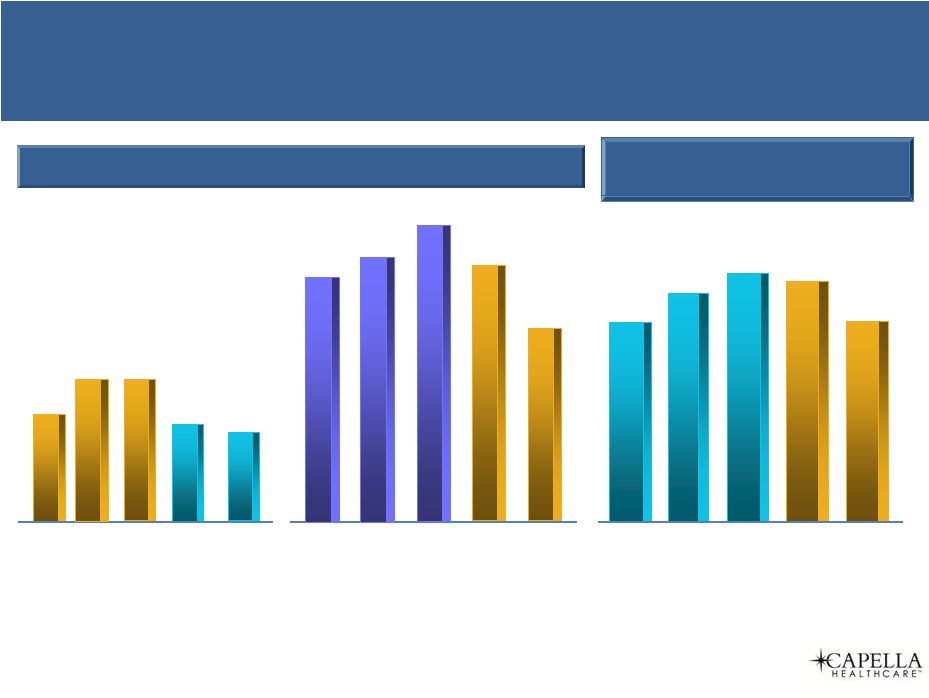
Physician Engagement
Employed Physicians
Recruitment
Mix
2009
2010
2011
2012
2013
120
133
143
132
145
2009
2010
2011
2012
2013
14
Target
62
51
31
37
41
40
PC,
36%
Spclsts,
64% |
 16
Portfolio Overview |
 17
Capital Medical
Center |
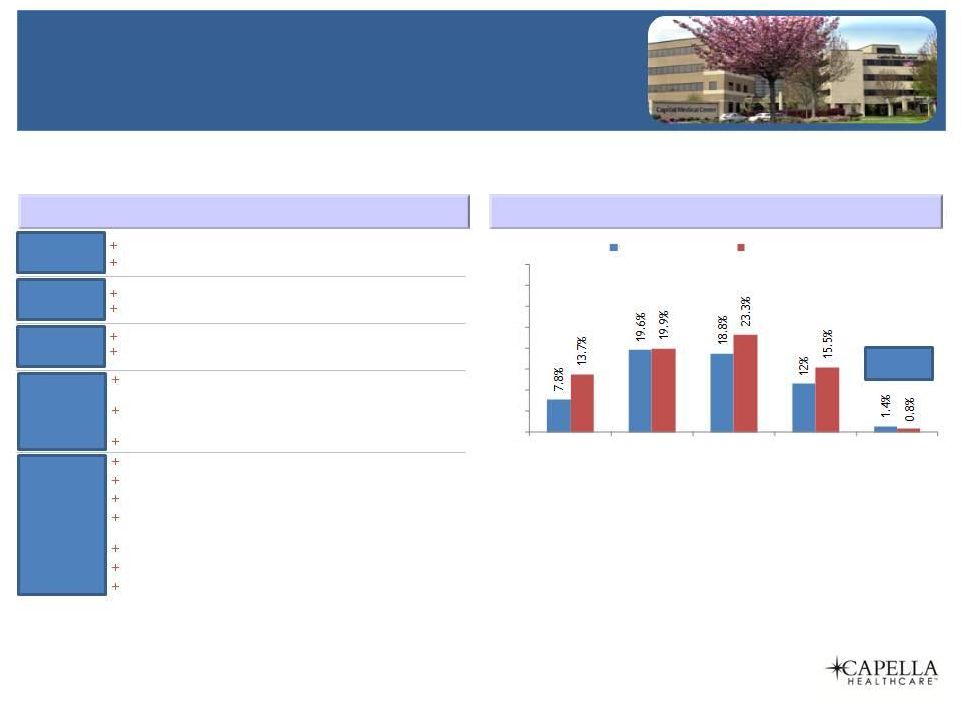 Capital
Medical Center Olympia, WA
18
Market -
Key Demographics (2010)
(1)
Acquired in December of 2005
JV Hospital with physician ownership at 9.75%
History & Overview
Key Awards
&
Accreditations
Location
Size
History
110 bed hospital
70 active physicians
Located approximately 65 miles south of Seattle
Closest competitor, Providence St. Peter Hospital is ~7 miles away
Blue
Distinction
“Total
Value
Designation”
for
knee/hip
and
spine
surgery
#1 in WA for Medical Excellence for Orthopedic Care, Major
Neurosurgery
Top 10% in WA for General Surgery
‘10-’15
CAGR
(1) US Census.
Positioning
Overall #2 player behind local NFP
Strong state-wide reputation for quality
Strength in advanced surgical services
Newer service offerings of expanded Diagnostic Imaging Center,
wound care/hyperbarics, cardiac cath lab
Highly supportive and engaged medical staff
Tertiary partner linkage with University of Washington
Cap-X focus: (ICU, OR, nurse call system)
0.0%
5.0%
10.0%
15.0%
20.0%
25.0%
30.0%
35.0%
40.0%
>65
Female
15
-
44
-
<= 138 FPL
% Uninsured
PSA CAGR
Cty or PSA
US Avg |
 19
Willamette Valley
Medical Center |
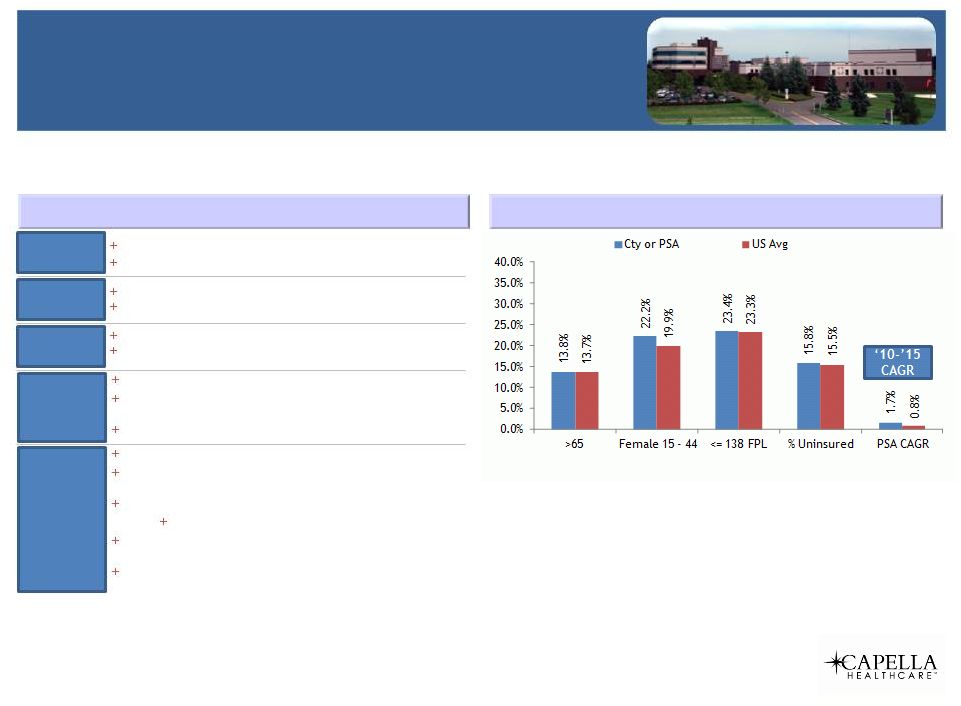 Willamette Valley Medical Center
McMinnville, OR
20
Acquired in February 2008
Major renovations in 2007 ($35mm-$40mm)
Key Awards
&
Accreditations
Location
Size
History
88 bed hospital
99 active physicians
~34 miles from Portland
Closest competitor, Providence Newberg is ~15 miles away
Certification and Gold Seal of Approval by The Joint Commission
for knee and hip replacement
5-Star rated by HealthGrades
Market
-
Key
Demographics
(2010)
(1)
History & Overview
(1) US Census.
Positioning
Geographically isolated; strong community support
Strength in all key services; cohesive physician base with strong
reputation for quality
Very attractive, well capitalized facility
$35mm-$40mm renovation in late 2007/2008
Manage additional 7,000 commercial lives under the Willamette
Valley Health Solution ACO (separate from YCCO)
Manage additional 3,300 lives under Medicaid through regional
YCCO initiative
One of Nation’s 100 “strongest hospitals” (iVantage Health) |
 21
Southwestern
Medical Center |
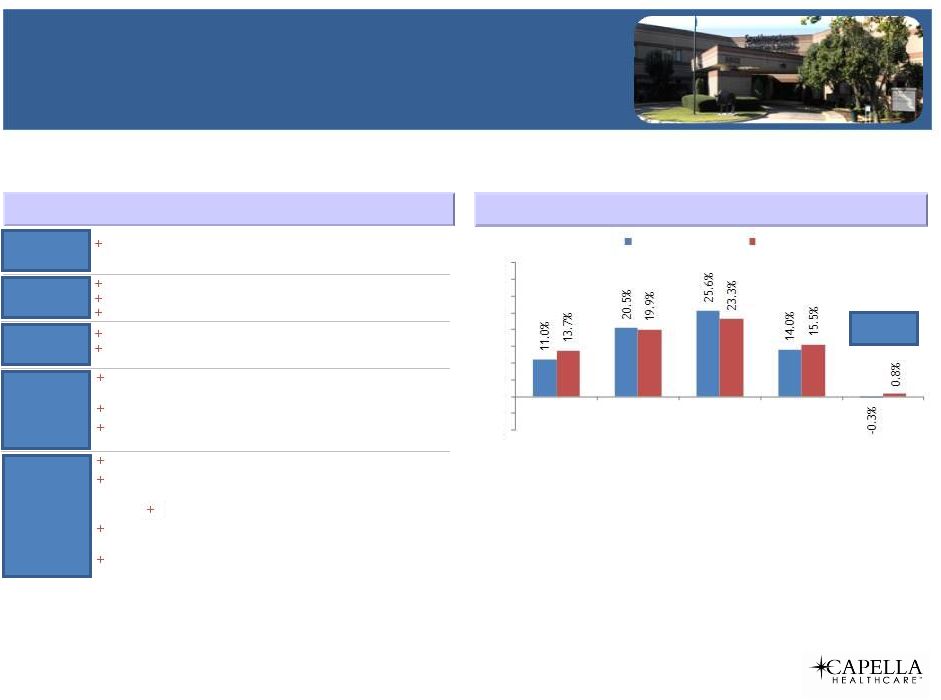 Southwestern Medical Center
Lawton, OK
22
Key Awards
&
Accreditations
Location
Size
History
Acquired in December 2005
2 campuses
199 total beds
85 active physicians
Located approximately 75 miles SW of Oklahoma City
Closest competitor, Comanche County Memorial Hospital is
~3 miles away
Becker’s Hospital Review’s Top 100 “Greatest Places to Work in
HC”
First Hospital in OK to receive TJC Stroke Certification
Only Sleep Services program in South West OK to be AASM
accredited
Market
-
Key
Demographics
(2010)
(1)
History & Overview
(1) US Census.
Positioning
# 2 player behind local NFP
Well positioned in targeted service lines that align with
demographics
Behavioral Health, Obstetrics and Neuro-surgery
Significantly expanded outpatient presence with recent in-market
acquisitions of ASC and two diagnostic imaging centers
Building new ASC; will convert to HOPD
-10.0%
-5.0%
5.0%
10.0%
15.0%
20.0%
25.0%
30.0%
35.0%
40.0%
>65
Female 15 -
44
<= 138 FPL
% Uninsured
PSA CAGR
Cty or PSA
US Avg
0.0%
‘10-’15
CAGR |
 23
EASTAR
Health System |
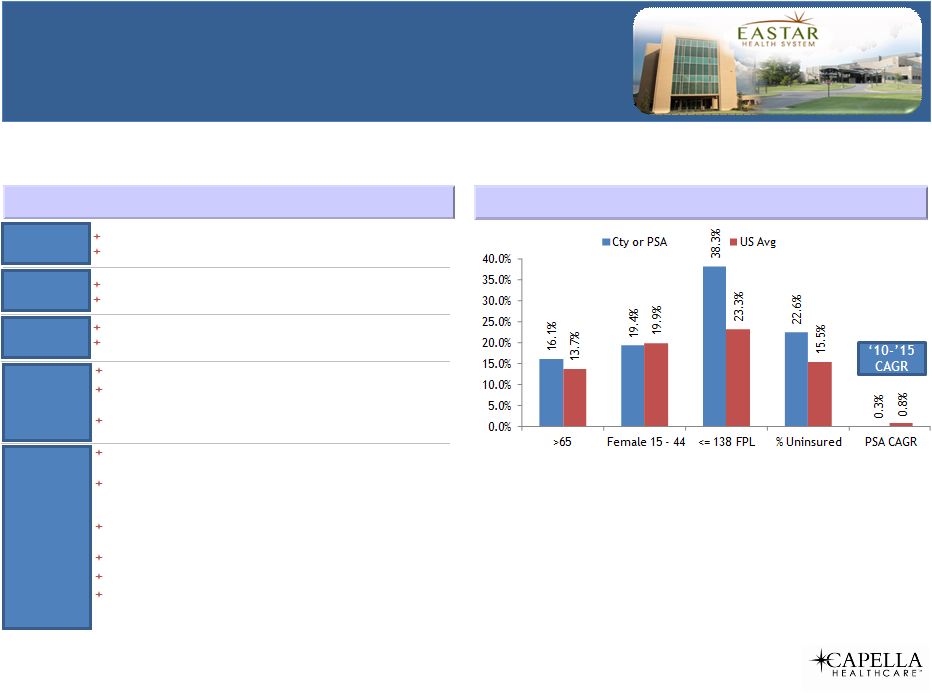 EASTAR
Health System Muskogee, OK
24
Key Awards
&
Accreditations
Location
Size
History
320
bed
hospital;
located
on
two
campuses
~3
miles
apart
98
active
physicians
Located
approximately
50
miles
from
Tulsa
Strongest
competitor,
Tahlequah,
is
~29
miles
away
Full
3-year
accreditation
from
Commission
on
Cancer
HealthStream
“Excellence
Through
Insight”
award
–
most
improved
physician
satisfaction
Part
of
OSU’s
Community
Hospital
Rotation
for
high
quality
student
training
Muskogee
Regional
acquired
in
2007
via
long
term
lease
MCH
acquired
in
2012;
merged
with
MRMC
to
become
EASTAR
Market -
Key Demographics (2010)
(1)
History & Overview
(1) US Census.
Positioning
Clear
#
1
market
player;
sole
community
provider
in
PSA
with
deep
penetration
into
SSA
Market
leader
in
cancer
care
with
April
2012
acquisition
of
competing
Artesian
Cancer
Center
as
well
as
Novalis
Tx
Radiation
Oncology
platform
and
CT
simulator
East
Campus
Focus:
women’s
health,
elective
surgery,
Dx
Imaging,
wound
care
&
sleep
center
Re-launch
of
bariatric
services
from
East
Campus
Expand
neonatology
services
to
support
28+
week
babies
Renovate
former
women’s
unit
and
consolidate
ICU
services;
add
step
down
unit
in
former
ICU
space
to
support
resource
management
initiatives |
 25
St. Mary's Regional
Medical Center |
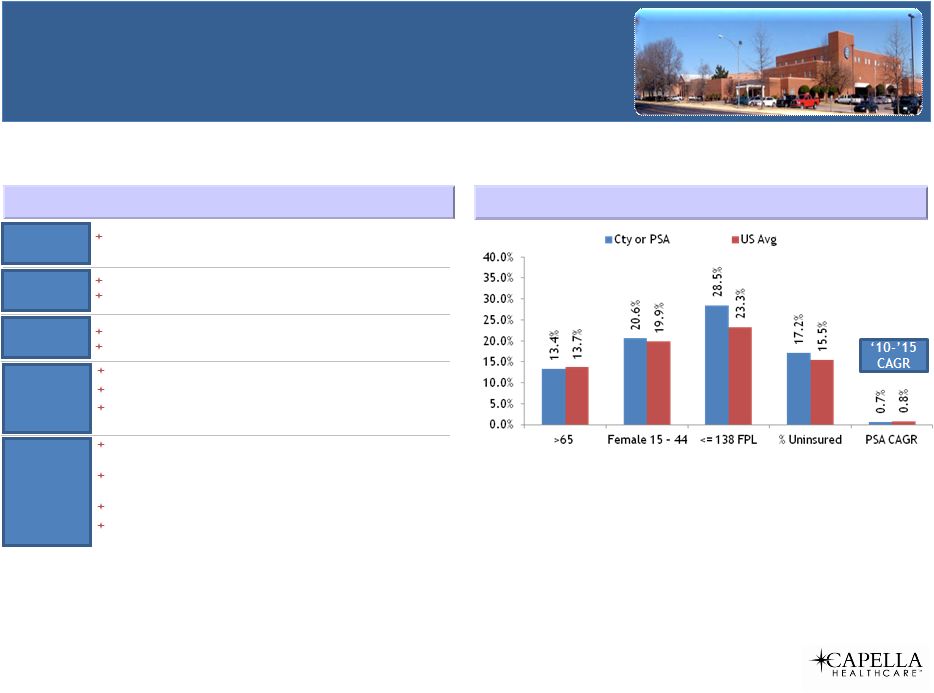 St.
Mary's Regional Medical Center Russellville, AR
26
Acquired
in
2008
Key Awards
&
Accreditations
Location
Size
History
170
beds
53
active
physicians;
40
physicians
in
affiliated
Millard
Henry
Clinic
Located
approximately
70
miles
NW
of
Little
Rock
Strongest
competitor,
Conway
Regional,
is
~47
miles
away
Leapfrog
“A”
safety
Rating
#1
in
AR,
Top
100
for
Women’s
Health
HealthStream
“Excellence
Through
Insight”
award
–physician
satisfaction
Market -
Key Demographics (2010)
(1)
History & Overview
(1) US Census.
Positioning
Clear
#1
player
in
the
market;
only
full-service
facility
within
35
miles
Affiliated
Millard
Henry
Clinic
is
a
large,
multi-specialty
group
poised
to
expand
in
new
adjacent
MOB
High
quality,
regional
women’s
health
provider
Recent
expansion
in
cardiology
(2nd
cath
lab);
cancer
care
(new
IMRT)
and
growing
adult
psych
services |
 27
National Park
Medical Center |
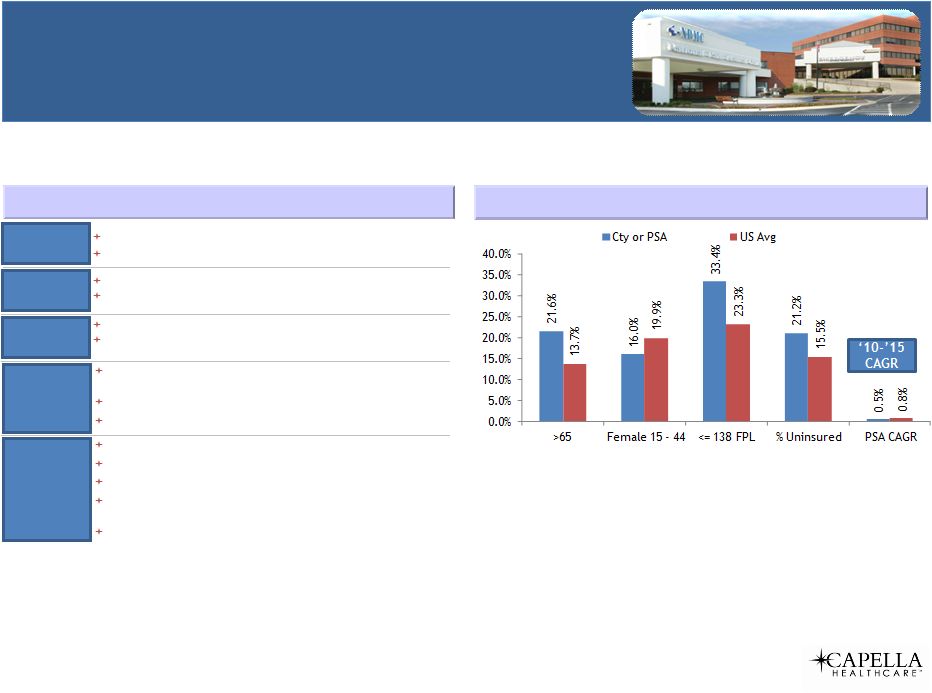 National
Park Medical Center Hot Springs, AR
28
Key Awards
&
Accreditations
Location
Size
History
Built
a
new
main
facility
in
1985
Joint
venture
with
physicians;
4.7%
physician
ownership
166
beds
127
active
physicians
Located
approximately
50
miles
SW
of
Little
Rock
Closest
competitor,
Mercy
Hospital
Hot
Springs,
is
~5
miles
away
HealthStream
“Excellence
Through
Insight”
award,
most
improved
OP
satisfaction
2011
AR
Medicaid
Inpatient
Quality
Incentive
3
time
winner
of
STAR
Award
for
best
overall
performance
Market -
Key Demographics (2010)
(1)
History & Overview
(1) US Census.
Positioning
#
2
player
behind
Mercy
Hospital
Hot
Springs
Physician
JV
(4.7%)
Adjacent
land
purchase
to
expand
facility
footprint
Recent
inclusion
in
large
Employer
Health
Coalition,
which
expands
access
to
commercial
lives
Exceptional
employee,
physician
and
patient
satisfaction
results |
 29
Tennessee Facilities |
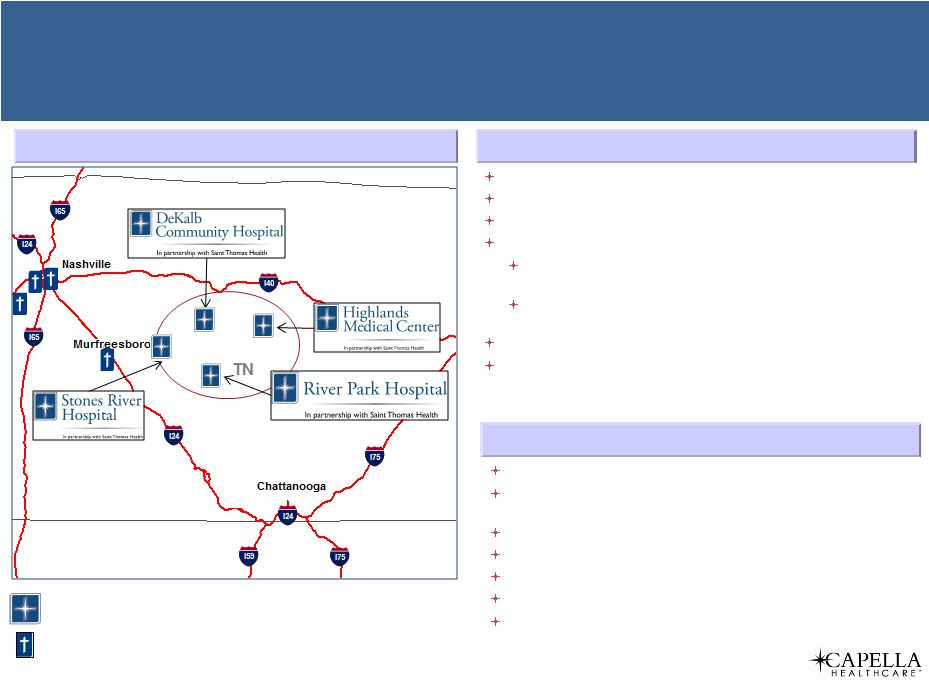 Geographic Location
Tennessee Facilities
Ascension-Capella Joint Venture
30
Timeline-Milestones
Ascension-Capella JV Facilities
Ascension Facilities
December
2005:
Acquired
River
Park
Hospital
March
2008:
Acquired
Highlands
Medical
Center
Aug
2009:
Initial
JV
with
Highlands
Physicians
(88%/12%)
July
2011:
Acquired
Cannon
County
LLC
via
contribution
agreements
Highlands
Physician
Investors
“re-up”
via
contribution
of
ownership
interests
to
form
UCHI
Jan
2012:
UCHI
secondary
offering
adds
8
physicians
May
2012:
Ascension
–
Capella
JV;
including
River
Park
Hospital
Key Provisions
Capella
Managing
Member
Saint
Thomas
–
contributed
brand,
in-market
ancillaries,
physician
staffing,
service
development
60
county
exclusive
development
Physician
5-year
non-competes
Ethical
&
Religious
Directives
compliant;
charity
policy
Capella
Hospitals
Tier
1
Mission
Point
ACO
members
Reciprocal
Change
in
Control
rights |
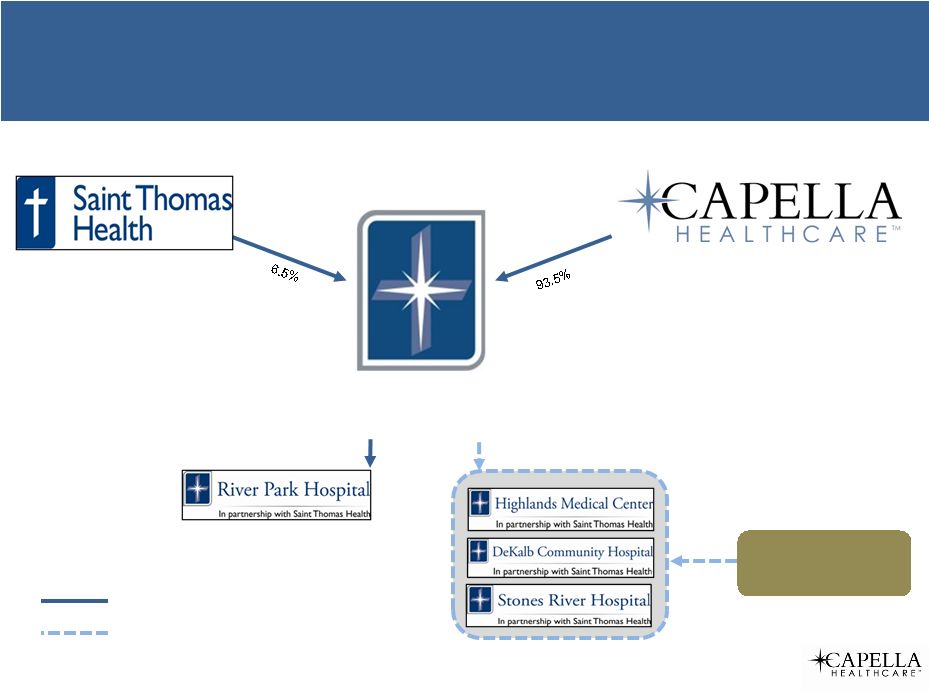 Ascension-Capella Joint Venture
31
Saint
Thomas-
Capella
LLC
UCHI LLC
(Physicians)
~23.3%
~76.7%
100%
STHe-Capella
Partnership
Capella-UCHI
Partnership |
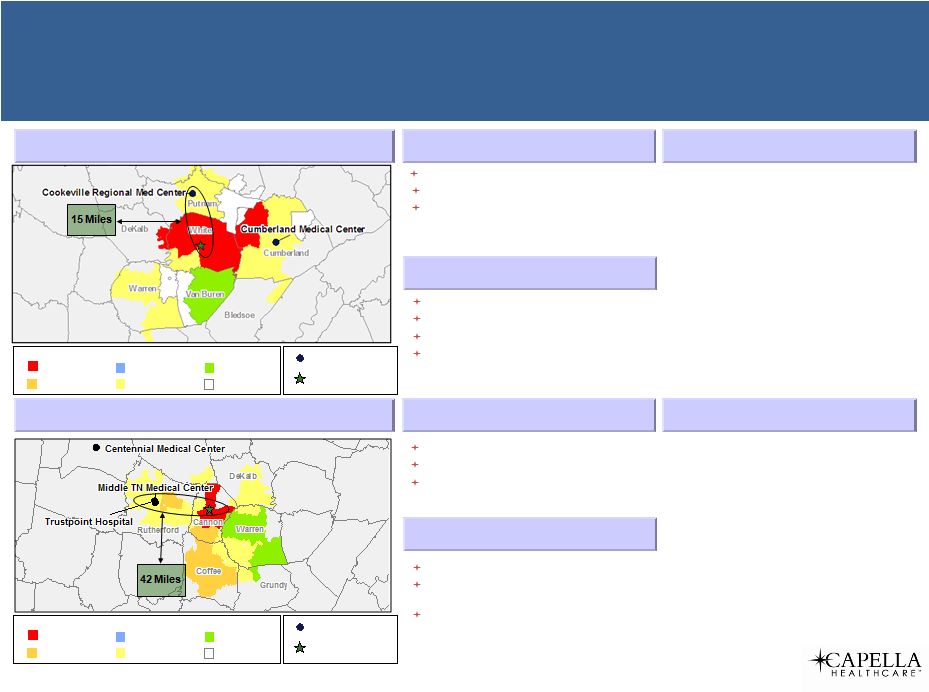 Highlands Medical Center (Sparta, Tennessee)
32
Demographics
2011A Adj. Admits
Over 500
76 to 150
351 to 500
25 to 75
151 to 350
Below 25
Competition
Capella Facility
Overview
Population 2010:
25,841
Pop. Growth '10-'15:
5.3%
Median Income 2010:
$35,345
Positioning
Established primary care base
Strong Geropsych program
Competing for SSA market share
Opportunity to acquire in-market ancillary
services
Stones River Hospital (Woodbury, Tennessee)
Demographics
2011A Adj. Admits
Over 500
76 to 150
351 to 500
25 to 75
151 to 350
Below 25
Competition
Capella Facility
Overview
Population 2010:
2,680
Pop. Growth '10-'15:
1.3%
Median Income 2010:
$55,144
Positioning
Sole community provider
Good working relationship with other UCHI
hospitals
Growing Geropsych program
60 beds
Highlands JV Ownership: 81.23%
Chief Quality Officer selected as presenter
for CRIMSON Clinical Advantage educational
program
60 beds
Stones River JV Ownership: 58.01%
Joint Commission’s “Gold Seal of Approval”
Tennessee Facilities |
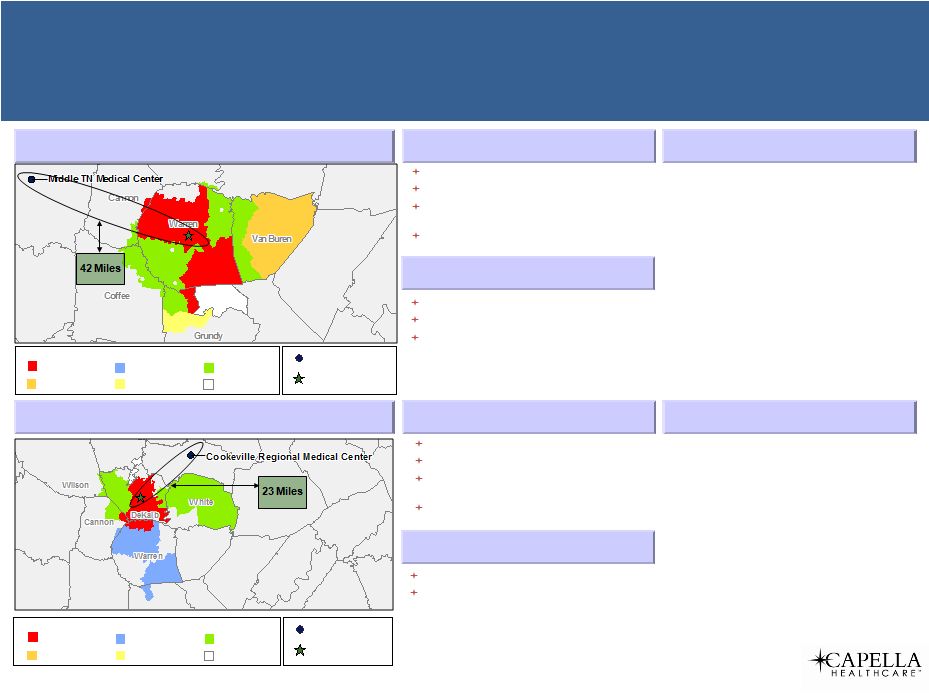 River
Park Hospital (McMinnville, Tennessee) 33
Demographics
125 beds
River Park JV Ownership: 93.51%
Chest Pain Center accredited Emergency
Department
“Stroke Ready”
affiliation, part of Saint
Thomas Stroke Network
2011A Adj. Admits
Over 500
76 to 150
351 to 500
25 to 75
151 to 350
Below 25
Competition
Capella Facility
Overview
Population 2010:
36,473
Pop. Growth '10-'15:
1.7%
Median Income 2010:
$37,620
Positioning
Attractive physical plant
Strong ED volumes
24/7 general surgery coverage
DeKalb Community Hospital (Smithville, Tennessee)
Demographics
2011A Adj. Admits
Over 500
76 to 150
351 to 500
25 to 75
151 to 350
Below 25
Competition
Capella Facility
Overview
Population 2010:
4,530
Pop. Growth '10-'15:
(0.5%)
Median Income 2010:
$59,455
Positioning
Sole community provider
Good working relationship with other UCHI
hospitals
71 beds
DeKalb JV Ownership: 58.01%
“Stroke Ready”
affiliation, part of Saint
Thomas Stroke Network
“Most Improved”
ED Patient Satisfaction
(HealthStream)
Tennessee Facilities |
 34
Mineral Area Regional
Medical Center |
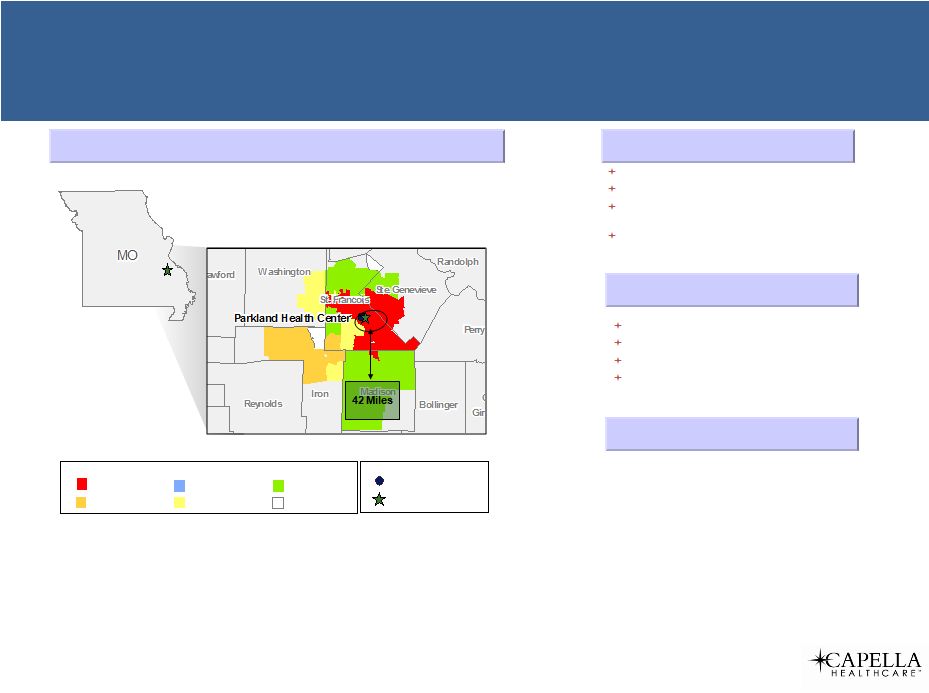 35
Demographics
Overview
Population 2010:
65,359
Pop. Growth '10-'15:
5.0%
Median Income 2010:
$38,589
Positioning
Strong local management team
Psych unit is a market differentiator
Potential for a tertiary partnership
Potential to sell MOBs
Primary Service Area
Mineral Area Regional Medical Center
Farmington, MO
135 beds
Leapfrog “A”
Safety Rating, 1 of 16 in MO
HealthStream “Excellence Through Insight”
award
First hospital in MO to add Airstrip
OB technology
2011A Adj. Admits
Over 500
76 to 150
351 to 500
25 to 75
151 to 350
Below 25
Competition
Capella Facility |
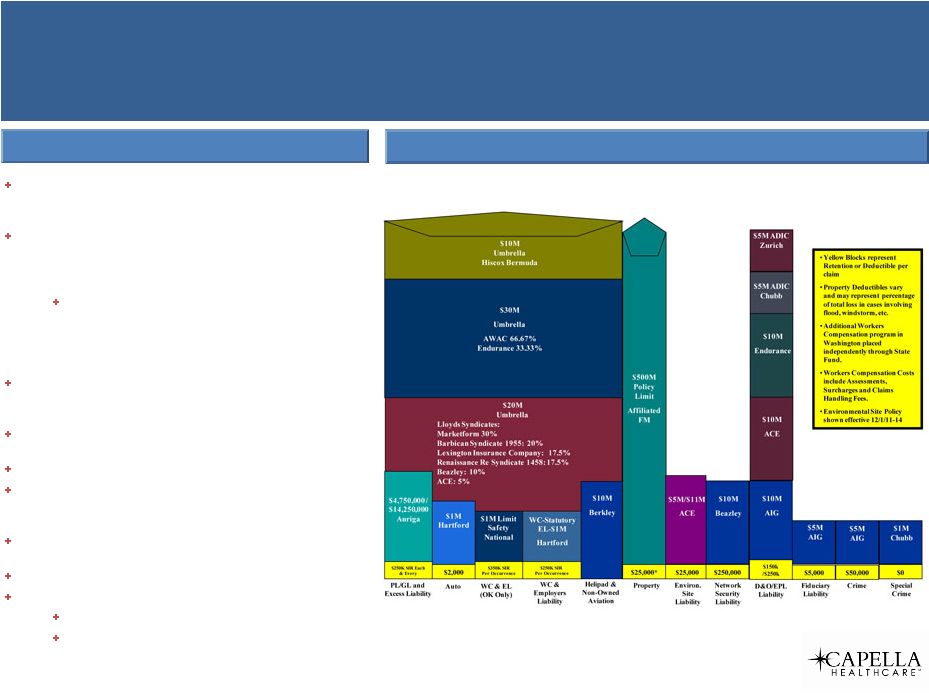 Auriga
Insurance Group 36
Formed in March 2009 to write medical malpractice
and general liability insurance for Capella hospitals,
employed physicians, physician extenders and nurses
Under terms of coverage, Capella pays the first
$250,000 of each and every claim, Auriga then steps in
and pays the next $4,750,000 per claim up to an
aggregate of $14,250,000
Auriga buys its first level of re-insurance
($20mm) from the Lloyds of London Syndicate;
its second level of re-insurance ($30mm) from
the Bermuda market; and its third level
($10mm) also from the Bermuda market
Domiciled in Grand Cayman, where the majority of
healthcare captives and domiciled, and managed by
AON Insurance Managers -
Cayman
Scribner
Hall
provided
tax
opinion
–
953d
election
take
(US taxpayer)
Honigman Miller selected as captive Counsel
Ernst
&
Young
selected
as
original
auditors
-
change
made to PKF Cayman for 2013 audit due to fee and
simplicity
AON alternative risk provides actuarial reports twice a
year
Vanguard Funds manage investment portfolio
Employee medical stop loss added in late 2009
No lazers
Policy provides unlimited coverage in excess of
a $350,000 deductible
Capella Program Snapshot 2014
Auriga Insurance Group |
 37
Financial Overview |
 2013
Financial & Operational Highlights 38
Terminated APA for Mercy Hospital Hot Springs
Purchased
land
for
expansion
of
National
Park
–
Plan
B
Implementation
Strategic portfolio management:
Exited Alabama market at end of 12/31/12
Signed
LOI
for
one
facility
–
Grandview
transaction
closed
February
28,
2014
Met Meaningful Use Requirements for Stage 1 –
Progressing to Stage 2
Completed EASTAR East Campus Women’s Facility & Ambulatory Project
Healthcare Reform –
Prepared facilities for enrollment and negotiated new
Exchange Contracts for each facility
Implemented physician training for Two Midnight Rule (on-going process)
Implemented training for ICD-10 (on-going process)
Began construction of new ASC on Southwestern Medical Center campus
Helped organize and lead Coordinated Care Organization in Oregon
|
 2013
Financial Highlights Excludes SHOPP and MRF items
39
Adj Net Revenue growth of $22.2m or 3.2% excluding one-time charge for change
in estimate related to the allowance for doubtful accounts
Growth in orthopedic and cardiac services lines
Adj EBITDA decline from $96.8m to $95.0m or -1.9%
Ramp-up EASTAR East Campus; Two Midnight Rule (-$1.2m); Sequestration
(-$4.6m); SSI% updates (-$1.4m); one time training costs for Meditech 6.0
installations (-$1.7m)
Uncompensated care challenges -
growth in self pay revenues as well as in high
deductible and co-pay plans; from 21.8% to 23.3% of Adj NR or up $21.0m
Consolidated admissions decline of 3.7%, adjusted admissions -1.7%
Strongest volume indicators in peer class
Surgical Volumes best in peer class
IP Surgeries down 2.4%; OP Surgeries up 3.6%
ER visits down 0.6% or -1,268; ER self-pay visits up 3.6% or 1,589
|
 Q1 2014
Preliminary Financial and Operational Highlights All Numbers Compared to Q1
2013 40
Net Revenue growth of $2.1 million
Adj. EBITDA contraction of $2.5m
Sequestration (-$1.5m); 2 Midnight Rule (-$1.0)
Admissions decline of 672 or 6.1%
One-day stay decline of 372 or 16.4%
Observation visits up 409 or 11.9%
Adj. Admissions decline of 3.8%
ER visits were down 4.6% …
82% of the decline was in self-pay
Grand opening of the Millard-Henry Clinic new MOB at St. Mary’s Regional
Medical Center
Completed final plans for the OB renovation at Capital Medical Center
Completed corporate re-organization that resulted in leadership changes,
reporting line changes and a reduction in the corporate staff of
approximately
10%
Note: All 1Q14 results are unaudited. |
 Company
Overview Statistical Highlights
41
1Q13
1Q14
Variance
Admissions
11,001
10,329
(672)
-6.1%
Adjusted Admissions
22,677
21,810
(868)
-3.8%
ER Visits
55,938
53,340
(2,598)
-4.6%
SP ER Visits
11,171
9,035
(2,136)
-19.1%
IP –
Surgeries
2,413
2,199
(214)
-8.9%
OP -
Surgeries
5,632
5,303
(329)
-5.8%
Observations
3,433
3,842
409
11.9%
One-Day Stays
2,271
1,899
372
16.4%
NR / AA
$7,959
$8,368
$409
5.1%
Note: All 1Q14 results are unaudited. |
 Company
Overview 2 Midnight Rule
42
4Q12
4Q13
Variance
Observations
3,471
3,864
393
11.3%
One-Day Stays
2,164
1,706
-458
-21.2%
FY 2012
FY 2013
Variance
Observations
14,061
14,339
278
2.0%
One-Day Stays
8,275
7,367
-908
-11.0%
1Q13
1Q14
Variance
Observations
3,433
3,842
409
11.9%
One-Day Stays
2,271
1,899
372
16.4%
Estimate quarterly EBITDA impact to be -$1.0 million
Note: All 1Q14 results are unaudited. |
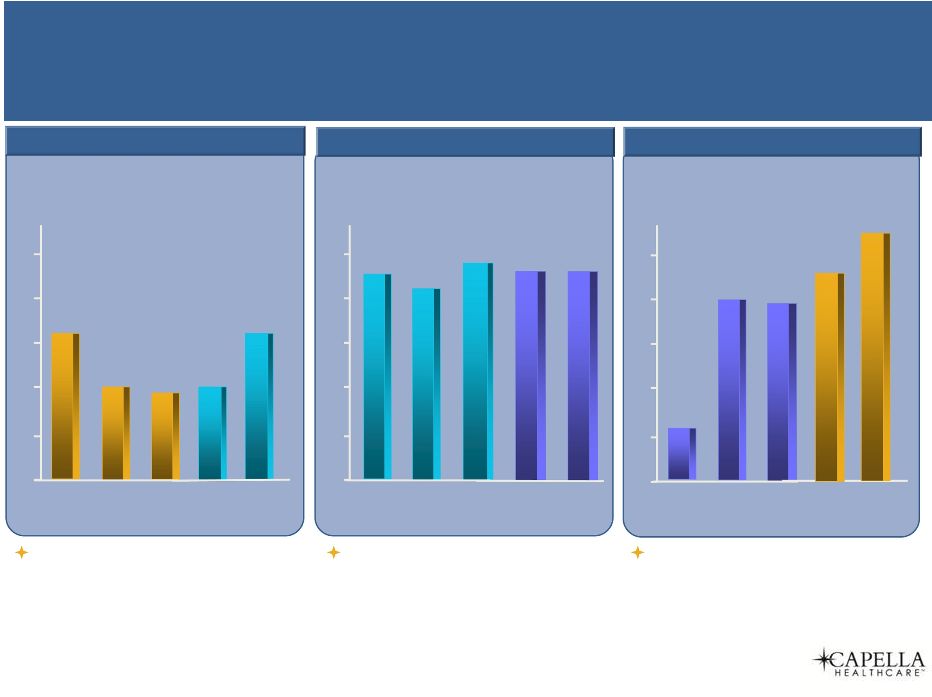
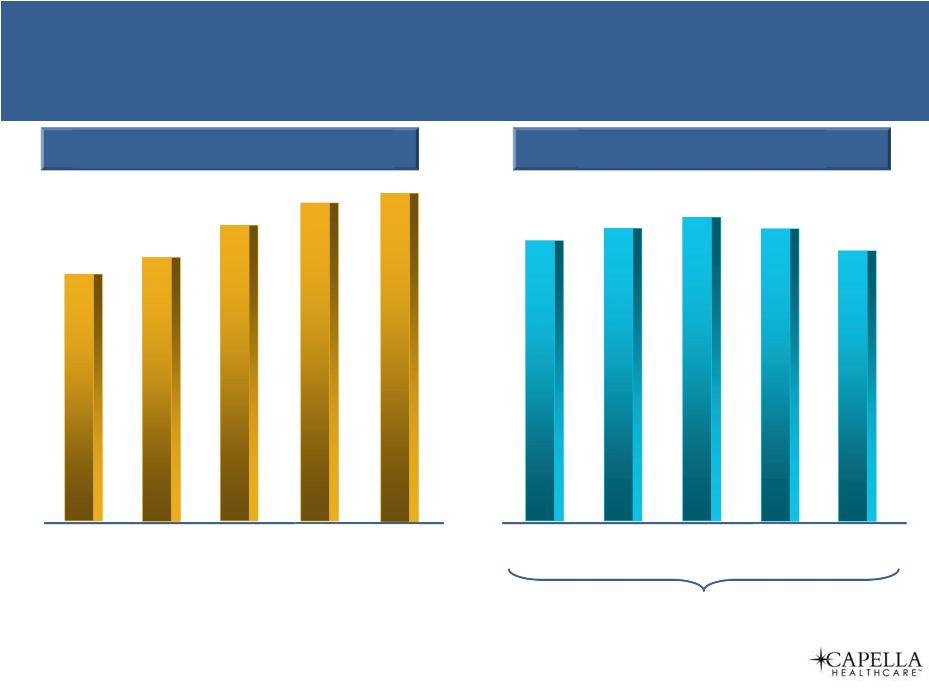 Adjusted EBITDA
* Excluding Out of Period SHOPP+Rural Floor Net Rev = $13.4m
(EBITDA $8.3m)
** Excluding one-time change in estimate for the allowance for
doubtful accounts.
43
Adj EBITDA: EBITDA plus transaction costs + stock comp + restructuring
costs + one-time change in estimate
2010
2011
2012
$625
$651
$705
*
2013
$727**
15.0%
14.6%
13.8%
Adjusted EBITDA Margin
13.1%
12.6%
$94
$97*
$95
2010
2011
2012
2013
$95
LTM 1Q14
$92
LTM 1Q14
$729**
Note: All 1Q14 results are unaudited.
Adjusted Net Revenue
Financial Performance
($ in millions) |
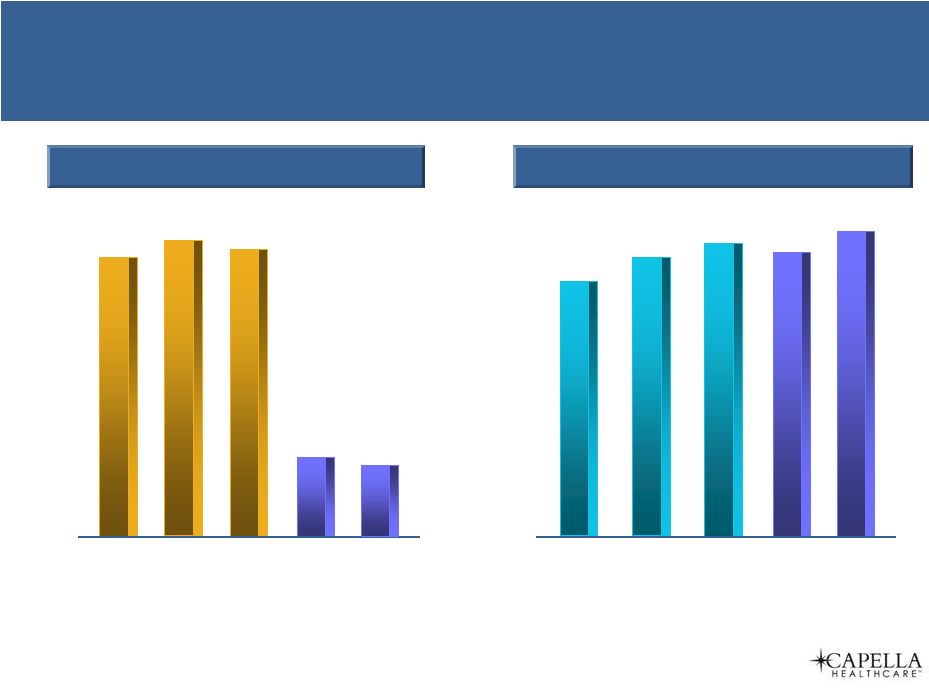 Adjusted Admissions
44
Revenue Per Adjusted Admission
2011
2012
90,037
91,770
2013
90,207
$7,234
2011
2012
2013
$7,827
$8,007
1Q13
1Q13
$7,959
1Q14
$8,368
22,677
1Q14
21,810
Operating Metrics
Note: All 1Q14 results are unaudited. |
 Diversified Net Revenue Payor Mix
Medicare
and
Managed
Medicare
Managed
Care/Other
Self Pay
Medicaid and
Managed Medicaid
43.6%
17.2%
1.7%
37.5%
2012 Payor Mix
Medicare
and
Managed
Medicare
Managed
Care/Other
Self Pay
Medicaid and
Managed Medicaid
43.2%
16.5%
1.3%
38.9%
2013 Payor Mix
45 |
 Uncompensated Care
Self-Pay Stats as % of Total
5.6%
6.0%
6.0%
2011
2012
2013
Uncompensated Care
Measures
20.3%
23.3%
21.8%
2011
2012
2013
2011
2012
2013
19.4%
20.3%
21.2%
Admissions
ER Visits
46
5.2%
1Q13
4.5%
1Q14
1Q13
20.0%
1Q14
16.9%
22.0%
1Q13
20.1%
1Q14
Note: All 1Q14 results are unaudited. |
 Some shift from employment
models to managed services
combined with increases in
contract labor and benefits
2011
2012
2013
46.8%
48.2%
47.3%
Salaries and Benefits Expense
50%
49%
48%
47%
46%
45%
Supplies expense increase
consistent with increases in
orthopedic & cardiac
procedures
16.9%
16.6%
16.3%
Supplies Expense
17%
16%
15%
14%
13%
12%
2011
2012
2013
Shift from SWB to Pro Fees
and Contract Services; Hi-
Tech income recorded as
contra expense
23.8%
21.1%
24.3%
Other Operating Expenses
25%
24%
23%
22%
21%
20%
2011
2012
2013
47
1Q13
1Q14
47.0%
48.1%
16.7%
1Q13
1Q14
16.6%
24.7%
1Q13
25.5%
1Q14
Expense Metrics
(% of Adjusted Net Revenue)
Note: All 1Q14 results are unaudited.
* 2012 excludes Out of Period SHOPP & Rural Floor
|
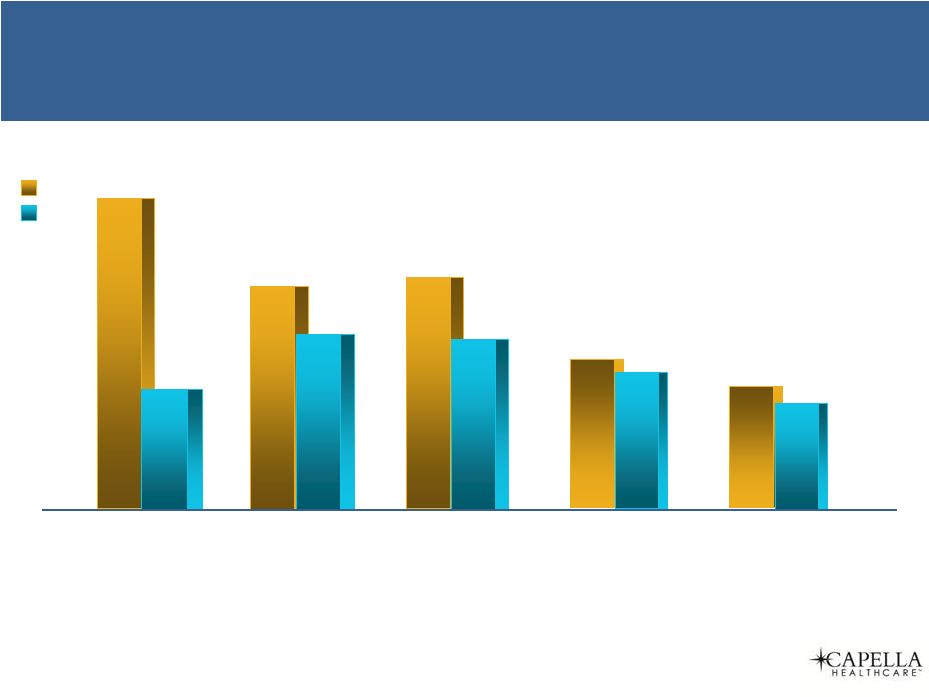 CFFO
CapX
Operating Cash Flow & Capital Expenditures
2010
2011
$62.7
(1)
$26.1
$34.2
$43.0
2012
$33.8
$44.0
$28.4
$30.8
2013
First 9 Months
($ in millions)
2012: $13.6m out of period cash
from prior period SHOPP and
Medicare Rural Floor settlement
48
$24.0
$26.3
LTM 1Q14
Note: All 1Q14 results are unaudited.
(1) Increase due to timing of indenture payment. |
 49
1Q14 Early ACA Data
49
Preliminary Results –
Data Remains Limited
Note: All 1Q14 results are unaudited.
Self-pay gross revenue down 5%
Medicaid expansion states make up 105% of the decline
ER Visits down 4.6% …
self pay ER visits down 19.1% accounting for 82.2% of the
Uncompensated care down 10%
70.5% of the decline from expansion states
Uninsured discounts down 13%
92.1% of the decline from expansion states
Bad Debts Expense down 1.9%; but expansion states up slightly
decline |
 Key
Investment Highlights 50
Diversified Portfolio
of Well Positioned
Assets
Capitalize on
Identified and
Actionable Growth
Strategies
Geographically
Positioned to
Capitalize on Network
/ Affiliation
Opportunities
Meaningful Upside
from Healthcare
Reform
Significant Resources
Dedicated to Patient
Care Excellence
Consistent Operating
Performance
Strong Credit and
Liquidity Profile |