Attached files
| file | filename |
|---|---|
| 8-K - CIRRUS LOGIC, INC. 8-K - CIRRUS LOGIC, INC. | a50850152.htm |
| EX-99.1 - EXHIBIT 99.1 - CIRRUS LOGIC, INC. | a50850152ex99_1.htm |
Exhibit 99.2
1 April 24, 2014 Letter to
Shareholders Q4 FY14 CIRRUS LOGIC, INC. 800 WEST SIXTH STREET, AUSTIN,
TEXAS 78701
2 April 24, 2014 Dear
Shareholders,Cirrus Logic’s financial results for the fourth quarter
reached the high end of our expectations with revenue of $149.7 million,
GAAP gross margin of 49 percent and earnings per share of $0.20. On an
annual basis, we delivered revenue of $714.3 million, GAAP gross margin
of 50 percent and earnings per share of $1.65. We are pleased to have
exceeded our long-term operating profit goal in FY14 with GAAP operating
margin of 22 percent and non-GAAP operating margin of 25 percent. The
company generated over $228 million in cash from operations in FY14,
resulting in an increase of total cash and marketable securities of
roughly $148 million. We exited the year with approximately $384.5
million in cash on the balance sheet. In FY14, Cirrus Logic focused on
developing compelling new products, strengthening existing customer
relationships and establishing new relationships with key players in the
markets we serve, all of which are vital for future growth. This past
year the company expanded its footprint in portable audio with the
addition of several leading smartphone OEMs in Asia and the United
States. We believe the portable audio market is poised for growth in the
coming years, driven in part by the proliferation of voice as a key
interface in mobile devices. With a robust pipeline consisting of custom
and general market products, we expect to tape out a number of 55
nanometer components this year, which will create additional
opportunities in portable audio beginning as early as calendar year 2015.
3 Revenue and Gross Margins
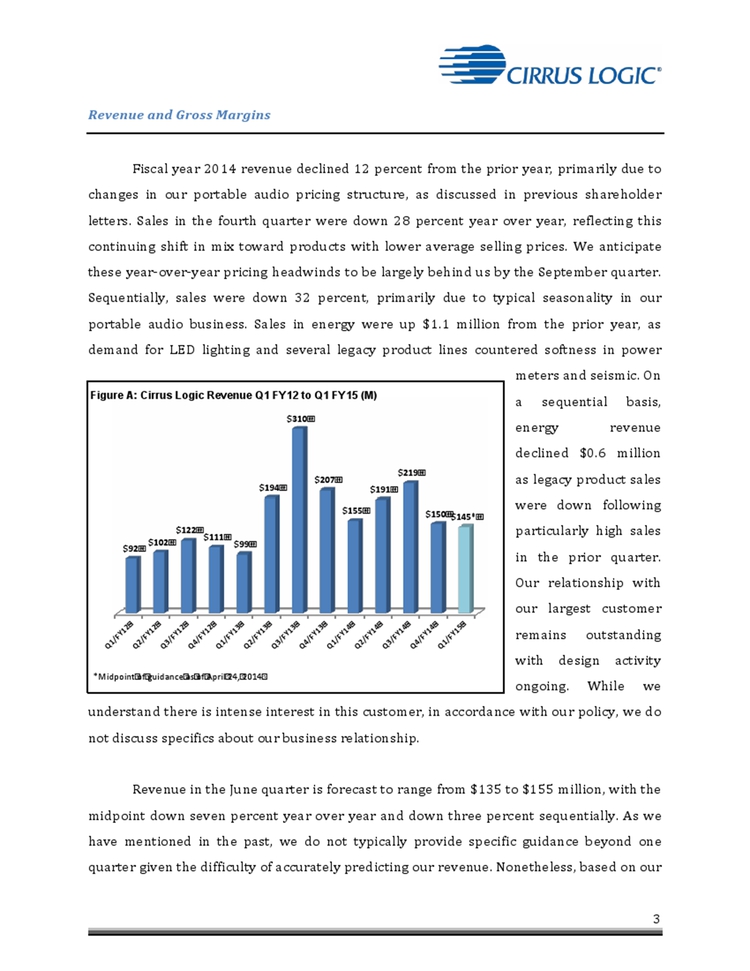
Fiscal year 2014 revenue declined 12 percent from the prior year,
primarily due to changes in our portable audio pricing structure, as
discussed in previous shareholder letters. Sales in the fourth quarter
were down 28 percent year over year, reflecting this continuing shift in
mix toward products with lower average selling prices. We anticipate
these year-over-year pricing headwinds to be largely behind us by the
September quarter. Sequentially, sales were down 32 percent, largely due
to typical seasonality in our portable audio business. Sales in energy
were up $1.1 million from the prior year, as demand for LED lighting and
several legacy product lines countered softness in power meters and
seismic. On a sequential basis, energy revenue declined $0.6 million as
legacy product sales were down following particularly high sales from
the prior quarter. Our relationship with our largest customer remains
outstanding with design activity ongoing. While we understand there is
intense interest in this customer, in accordance with our policy, we do
not discuss specifics about our business relationship. Revenue in the
June quarter is forecast to range from $135 to $155 million, with the
midpoint down seven percent year over year and down three percent
sequentially. As we have mentioned in the past, we do not typically
provide specific guidance beyond one quarter given the difficulty of
accurately predicting our revenue. Nonetheless, based on our Figure A:
Cirrus Logic Revenue Q1 FY12 to Q1 FY15 (M) *Midpoint of guidance as of
April 24, 2014 Q1/FY12 Q2/FY12 Q3/FY12 Q4/FY12 Q1/FY13 Q2/FY13 Q3/FY13
Q4/FY13 Q1/FY14 Q2/FY14 Q3/FY14 Q4/FY14 Q1/FY15 $92 $102 $122 $111 $99
$194 $310 $207 $155 $191 $219 $150 $145*
4 limited visibility at
this time, we anticipate revenue in FY15 to be approximately flat year
over year. Gross margins for the March quarter were 49 percent,
reflecting a seasonally lower mix of portable audio products. In the
June quarter, we expect gross margin to range from 47 percent to 49
percent, with a seasonally lighter mix of portable audio products ahead
of stronger demand in the second half of the calendar year. Our
long-term gross margin expectations remain in the mid-40 percent range.
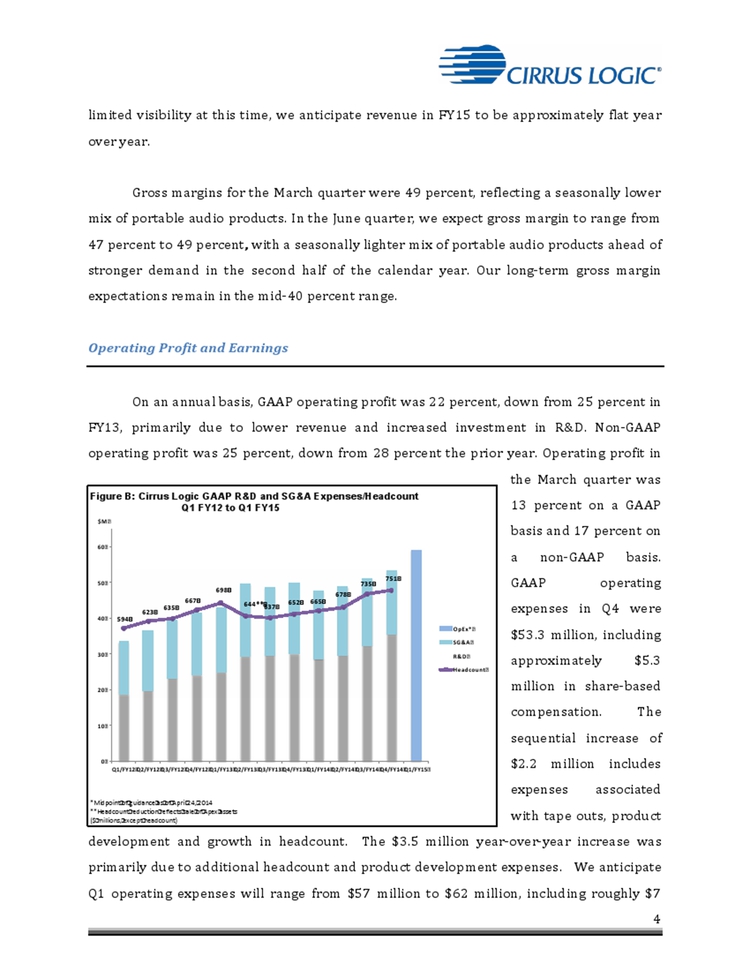
Operating Profit and Earnings On an annual basis, GAAP operating profit
was 22 percent, down from 25 percent in FY13, primarily due to lower
revenue and increased investment in R&D. Non-GAAP operating profit was
25 percent, down from 28 percent the prior year. Operating profit in the
March quarter was 13 percent on a GAAP basis and 17 percent on a
non-GAAP basis. GAAP operating expenses in Q4 were $53.3 million,
including approximately $5.3 million in share-based compensation. The
sequential increase of $2.2 million includes expenses associated with
tape outs, product development and growth in headcount. The $3.5 million
year-over-year increase was primarily due to additional headcount and
product development expenses. We anticipate Q1 operating expenses will
range from $57 million to $62 million, including roughly $7 Figure B:
Cirrus Logic GAAP R&D and SG&A Expenses/Headcount Q1 FY12 to Q1 FY15
*Midpoint of guidance as of April 24, 2014 **Headcount reduction
reflects sale of Apex assets ($ millions, except headcount) 594 623 635
667 698 644** 637 652 665 678 735 751 0 10 20 30 40 50 60 Q1/FY12
Q2/FY12 Q3/FY12 Q4/FY12 Q1/FY13 Q2/FY13 Q3/FY13 Q4/FY13 Q1/FY14 Q2/FY14
Q3/FY14 Q4/FY14 Q1/FY15 OpEx* SG&AR&D Headcount $M
5 million in share-based
compensation and amortization of acquired intangibles. The year over
year increase is predominately due to higher product development
expenses and headcount, although this is offset somewhat by lower
variable compensation. The sequential growth in operating expense is
largely driven by product development expenses, including the tape out
of new audio products. Our total headcount in Q4 was 751, up 16
employees from the December quarter. The ending cash balance in the
March quarter was $384.5 million, up $56.9 million from the prior
quarter. Cash from operations in Q4 was $65 million. During the quarter,
we utilized $9.7 million to repurchase approximately 500,000 shares of
common stock at an average price of $19.50. As of March 29, 2014 we had
$62.3 million remaining in the authorized program and we expect to
continue to execute repurchases opportunistically from time to time.
Taxes and Inventory Our GAAP tax expense during the quarter was $7.7
million, which included $7.8 million of non-cash expense associated with
our deferred tax asset and other tax credits. We have approximately $54
million remaining of deferred tax assets and other tax credits. We
expect our effective quarterly cash tax rate to be less than four
percent, until we have depleted the remaining deferred tax assets and
other tax credits. Q4 inventory was $69.7 million, relatively unchanged
from the prior quarter. We expect inventory to increase over the next
two quarters as we ramp ahead of normal seasonal trends in the back half
of the calendar year. Company Strategy We believe the portable audio
market has significant growth potential in the coming years as mobile
devices continue to evolve from a basic communication device into a tool
for creating, sharing and enjoying multimedia content. As the primary
interface for mobile
6 devices moves beyond touch, the need for sophisticated voice processing hardware and embedded software is expected to grow substantially. The desire for compelling end product features and functionality requires ultra low power high-performance audio solutions with increased signal processing capabilities. Cirrus Logic is uniquely positioned to be a leader in this market given our expertise in analog and mixed signal processing, extensive intellectual property portfolio and ultra low power components. Further, the company’s ability to deliver innovative products and effectively manage its supply chain has helped build and maintain excellent relationships with some of the best companies in the world. With cutting edge hardware and our embedded SoundClear® software, we are leveraging our engineering expertise to develop custom and general market audio subsystems that intelligently solve system design issues, resulting in a reliable and compelling user experience. Our high performance data conversion and amplifier components address the demand for higher quality audio capture and playback, while the inclusion of ultra low power mixed signal circuits for always on, always listening processing requirements combined with advanced DSP functionality, enables hearing and being heard in any environment without compromising battery life. With an extensive pipeline of 55 nanometer products focused on audio and voice applications and strong customer relationships across the portable audio market, we are poised to capitalize on these opportunities over the next 12 to 18 months. During the quarter, design activity in audio with both custom and general market products continued to gain momentum. In portable audio, we added a new top tier smartphone customer as we began shipments of our boosted amplifier with speaker protection. In LED lighting, we remained engaged with key tier-one OEMs and tier-two ODMs, expanded into new SKUs with existing customers and delivered initial shipments of our MR16 product to a new customer. While revenue from LED lighting is expected to experience modest growth this year, the majority of revenue and growth opportunities in the foreseeable future are likely to be dominated by audio products.
7 We believe Cirrus Logic’s
ability to target fast growing markets and develop innovative products
in a timely manner positions the company at an advantage to many of its
peers. With two-to three-year product design cycles, our business model
requires a substantial investment in R&D and the prudent allocation of
engineering capital. We have seen a considerable increase in demand for
audio products, particularly in mobile devices, over the past several
years. The management team regularly evaluates opportunities in both
audio and energy based on market size, total available content and our
long-term product roadmap. While Cirrus Logic hired approximately 100
employees in FY14, our opportunities in audio exceed our engineering
bandwidth. Therefore, although we expect to continue to invest in our
energy businesses, including LED lighting, we have recently reallocated
engineering resources to apply a larger portion of our development
capacity to audio opportunities that we believe will deliver greater
revenue growth and a better return on investment. Summary and Guidance
For the June quarter, we expect the following results: • Revenue to
range between $135 million and $155 million; • Gross margin to be
between 47 percent and 49 percent; and • Combined R&D and SG&A expenses
to range between $57 million and $62 million, including approximately $7
million in share-based compensation expense and amortization of acquired
intangibles. In summary, Cirrus Logic is exiting FY14 with a robust
pipeline of innovative products, a compelling roadmap pairing our best
in class hardware with embedded SoundClear® software and solid
relationships with leading players in our target markets. This past
year, we are pleased to have broadened our customer base to include
numerous leading international smartphone manufacturers. Moreover, we
added additional SKUs with existing and new customers in automotive,
home, LED lighting and power meters. As we move into FY15, we are
excited to introduce new custom and catalog products that are expected
to broaden our footprint in the markets we serve and fuel long-term
growth.
8 Sincerely, Jason Rhode
Thurman Case President and Chief Executive Officer Chief Financial
Officer Conference Call Q&A Session Cirrus Logic will host a live Q&A
session at 5 p.m. EDT today to answer questions related to its financial
results and business outlook. Participants may listen to the conference
call on the Cirrus Logic website. Participants who would like to submit
a question to be addressed during the call are requested to email
investor.relations@cirrus.com. A replay of the webcast can be accessed
on the Cirrus Logic website approximately two hours following its
completion, or by calling (404) 537-3406, or toll-free at (855)
859-2056 (Access Code: 23057089). Use of Non-GAAP Financial Information
This shareholder letter and its attachments include references to
non-GAAP financial information, including operating expenses, net
income, operating profit and diluted earnings per share. A
reconciliation of the adjustments to GAAP results is included in the
tables below. Non-GAAP financial information is not meant as a
substitute for GAAP results, but is included because management believes
such information is useful to our investors for informational and
comparative purposes. In addition, certain non-GAAP financial
information is used internally by management to evaluate and manage the
company. As a note, the non-GAAP financial information used by Cirrus
Logic may differ from that used by other companies. These non-GAAP
measures should be considered in
9 addition to, and not as a
substitute for, the results prepared in accordance with GAAP. Safe
Harbor Statement Except for historical information contained herein, the
matters set forth in this news release contain forward-looking
statements, including our future growth expectations and our estimates
of first quarter and full fiscal year 2015 revenue, gross margin,
combined research and development and selling, general and
administrative expense levels, share-based compensation expense and
amortization of acquired intangibles. In some cases, forward-looking
statements are identified by words such as “expect,” “anticipate,”
“target,” “project,” “believe,” “goals,” “opportunity,” “estimates,”
“intend,” and variations of these types of words and similar
expressions. In addition, any statements that refer to our plans,
expectations, strategies or other characterizations of future events or
circumstances are forward-looking statements. These forward-looking
statements are based on our current expectations, estimates and
assumptions and are subject to certain risks and uncertainties that
could cause actual results to differ materially. These risks and
uncertainties include, but are not limited to, the level of orders and
shipments during the first quarter and full fiscal year 2015, as well as
customer cancellations of orders, or the failure to place orders
consistent with forecasts; and the risk factors listed in our Form 10-K
for the year ended March 30, 2013, and in our other filings with the
Securities and Exchange Commission, which are available at www.sec.gov.
The foregoing information concerning our business outlook represents our
outlook as of the date of this news release, and we undertake no
obligation to update or revise any forward-looking statements, whether
as a result of new developments or otherwise. Cirrus Logic, Cirrus and
SoundClear are registered trademarks of Cirrus Logic, Inc. All other
product names noted herein may be trademarks of their respective
holders. Summary financial data follows:
10 Mar. 29, Dec. 28, Mar.
30, Mar. 29, Mar. 30, 2014 2013 2013 2014 2013 Q4'14 Q3'14 Q4'13 Q4'14
Q4'13 Audio products 137,773 $ 206,388 $ 196,098 $ 667,739 $ 754,769 $
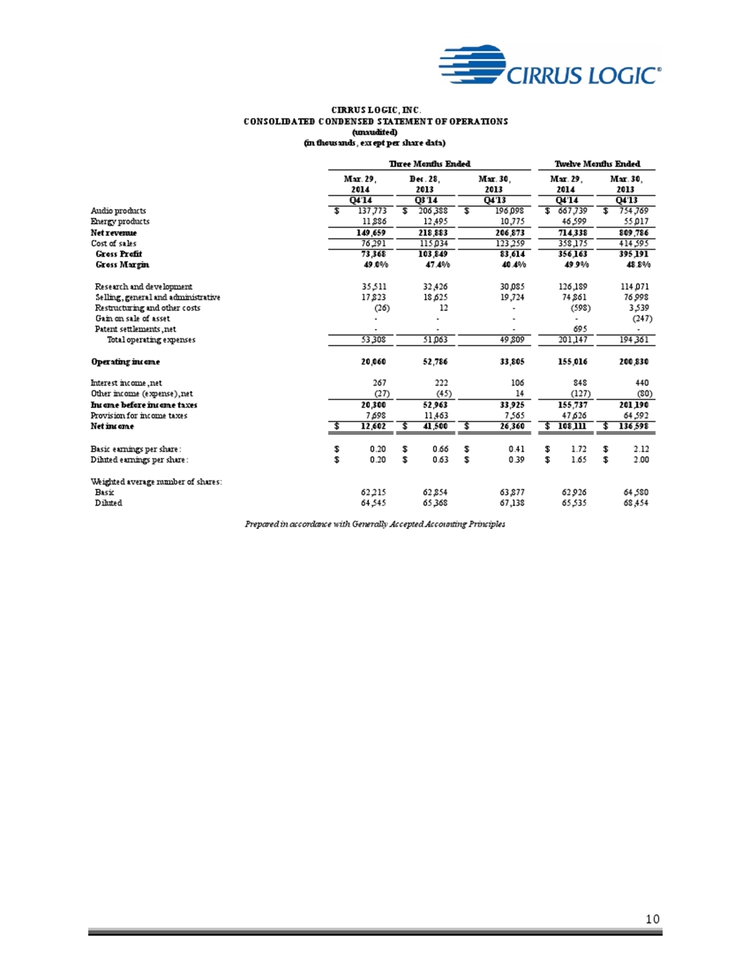
Energy products 11,886 12,495 10,775 46,599 55,017 CIRRUS LOGIC, INC.
CONSOLIDATED CONDENSED STATEMENT OF OPERATIONS (unaudited) (in
thousands, except per share data) Three Months Ended Twelve Months Ended
Net revenue 149,659 218,883 206,873 714,338 809,786 Cost of sales 76,291
115,034 123,259 358,175 414,595 Gross Profit 73,368 103,849 83,614
356,163 395,191 Gross Margin 49.0% 47.4% 40.4% 49.9% 48.8% Research and
development 35,511 32,426 30,085 126,189 114,071Selling, general and
administrative 17,823 18,625 19,724 74,861 76,998 Restructuring and
other costs (26) 12 - (598) 3,539 Gain on sale of asset -(247) Patent
settlements, net - 695 - Total operating expenses 53,308 51,063 49,809
201,147 194,361 Operating income 20,060 52,786 33,805 155,016 200,830
Interest income, net 267 222 106 848 440 Other income (expense), net
(27) (45) 14 (127) (80) Income before income taxes 20,300 52,963 33,925
155,737 201,190 Provision for income taxes 7,698 11,463 7,565 47,626
64,592 Net income 12,602 $ 41,500 $ 26,360 $ 108,111 $ 136,598 $ Basic
earnings per share: 0.20 $ 0.66 $ 0.41 $ 1.72 $ 2.12 $ Diluted earnings
per share: 0.20 $ 0.63 $ 0.39 $ 1.65 $ 2.00 $ Weighted average number of
shares: Basic 62,215 62,854 63,877 62,926 64,580 Diluted 64,545 65,368
67,138 65,535 68,454 Prepared in accordance with Generally Accepted
Accounting Principles
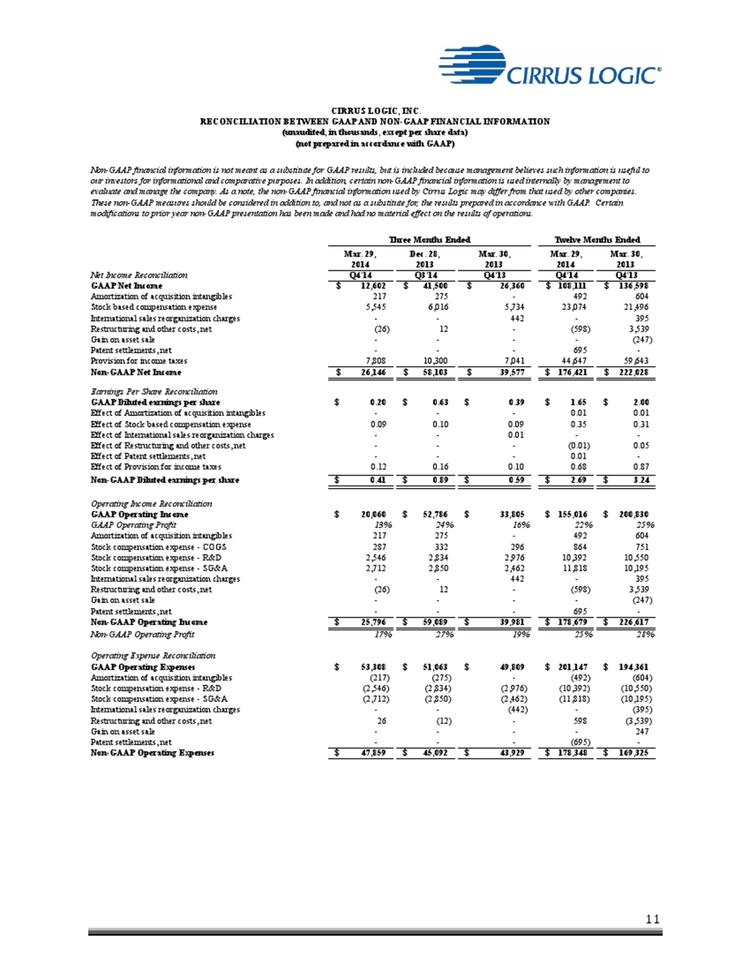
11 Mar. 29, Dec. 28, Mar.
30, Mar. 29, Mar. 30, 2014 2013 2013 2014 2013 Net Income Reconciliation
Q4'14 Q3'14 Q4'13 Q4'14 Q4'13 GAAP Net Income 12,602 $ 41,500 $ 26,360 $
108,111 $ 136,598 $Amortization of acquisition intangibles 217 275 - 492
604 Stock based compensation expense 5,545 6,016 5,734 23,074 21,496
Non-GAAP financial information is not meant as a substitute for GAAP
results, but is included because management believes such information is
useful toour investors for informational and comparative purposes. In
addition, certain non-GAAP financial information is used internally by
management to evaluate and manage the company. As a note, the non-GAAP
financial information used by Cirrus Logic may differ from that used by
other companies. These non-GAAP measures should be considered in
addition to, and not as a substitute for, the results prepared in
accordance with GAAP. Certain modifications to prior year non-GAAP
presentation has been made and had no material effect on the results of
operations. Three Months Ended Twelve Months Ended (not prepared in
accordance with GAAP) CIRRUS LOGIC, INC. RECONCILIATION BETWEEN GAAPAND
NON-GAAPFINANCIAL INFORMATION (unaudited, in thousands, except per share
data) International sales reorganization charges - 442 – 395
Restructuring and other costs, net (26) 12 - (598) 3,539 Gain on asset
sale - (247) Patent settlements, net - 695 -Provision for income taxes
7,808 10,300 7,041 44,647 59,643Non-GAAP Net Income 26,146 $ 58,103 $
39,577 $ 176,421 $ 222,028 $ Earnings Per Share Reconciliation GAAP
Diluted earnings per share 0.20 $ 0.63 $ 0.39 $ 1.65 $ 2.00 $ Effect of
Amortization of acquisition intangibles - - - 0.01 0.01 Effect of Stock
based compensation expense 0.09 0.10 0.09 0.35 0.31 Effect of
International sales reorganization charges - 0.01 - Effect of
Restructuring and other costs, net - (0.01) 0.05 Effect of Patent
settlements, net - 0.01 - Effect of Provision for income taxes 0.12 0.16
0.10 0.68 0.87 Non-GAAP Diluted earnings per share 0.41 $ 0.89 $ 0.59 $
2.69 $ 3.24 $ Operating Income Reconciliation GAAP Operating Income
20,060 $ 52,786 $ 33,805 $ 155,016 $ 200,830 $ GAAP Operating Profit 13%
24% 16% 22% 25% Amortization of acquisition intangibles 217 275 - 492
604 Stock compensation expense - COGS 287 332 296 864 751 Stock
compensation expense - R&D 2,546 2,834 2,976 10,392 10,550 Stock
compensation expense - SG&A 2,712 2,850 2,462 11,818 10,195
International sales reorganization charges -442 – 395 Restructuring and
other costs, net (26) 12 - (598) 3,539Gain on asset sale - (247) Patent
settlements, net -695 Non-GAAP Operating Income 25,796 $ 59,089 $
39,981 $ 178,679 $ 226,617 $ Non-GAAP Operating Profit 17% 27% 19% 25%
28% Operating Expense Reconciliation GAAP Operating Expenses 53,308 $
51,063 $ 49,809 $ 201,147 $ 194,361 $ Amortization of acquisition
intangibles (217) (275) - (492) (604) Stock compensation expense - R&D
(2,546) (2,834) (2,976) (10,392) (10,550) Stock compensation expense -
SG&A (2,712) (2,850) (2,462) (11,818) (10,195) International sales
reorganization charges - (442) - (395) Restructuring and other costs,
net 26 (12) - 598 (3,539) Gain on asset sale - 247 Patent settlements,
net - (695) - Non-GAAP Operating Expenses 47,859 $ 45,092 $ 43,929 $
178,348 $ 169,325 $
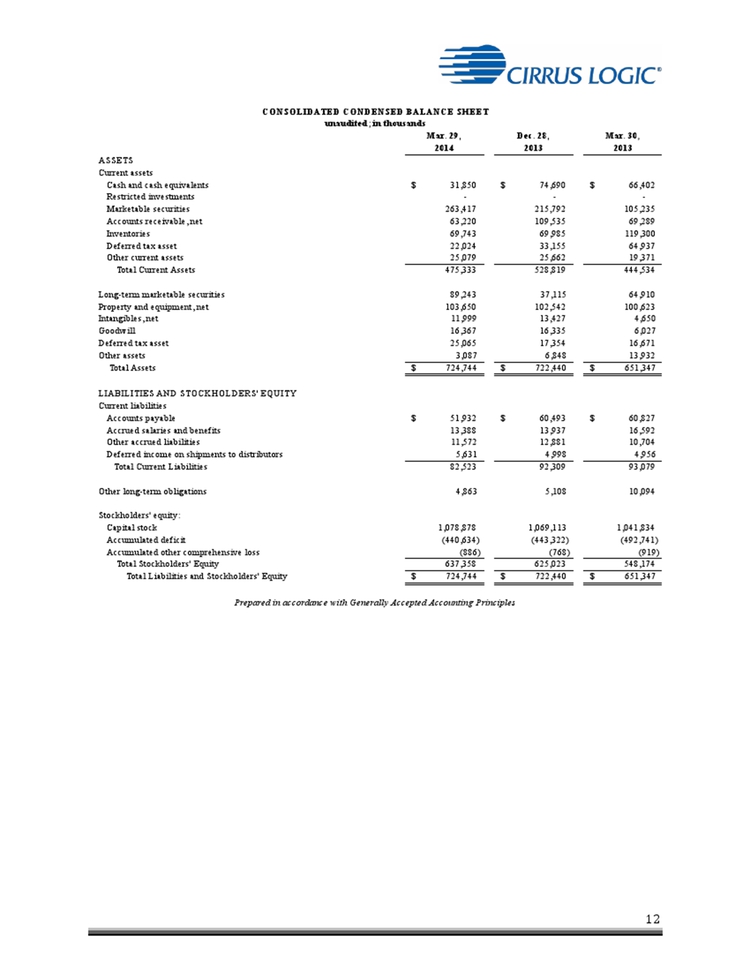
12 CONSOLIDATED CONDENSED
BALANCE SHEET unaudited; in thousands Mar. 29, Dec. 28, Mar. 30, 2014
2013 2013 ASSETS Current assets Cash and cash equivalents 31,850 $
74,690 $ 66,402 $ Restricted investments - Marketable securities
263,417 215,792 105,235 Accounts receivable, net 63,220 109,535 69,289
Inventories 69,743 69,985 119,300 Deferred tax asset 22,024 33,155
64,937 Other current assets 25,079 25,662 19,371 Total Current Assets
475,333 528,819 444,534 Long-term marketable securities 89,243 37,115
64,910 Property and equipment, net 103,650 102,542 100,623 Intangibles,
net 11,999 13,427 4,650 Goodwill 16,367 16,335 6,027 Deferred tax asset
25,065 17,354 16,671 Other assets 3,087 6,848 13,932 Total Assets
724,744 $ 722,440 $ 651,347 $ LIABILITIES AND STOCKHOLDERS'
EQUITYCurrent liabilities Accounts payable 51,932 $ 60,493 $ 60,827 $
Accrued salaries and benefits 13,388 13,937 16,592 Other accrued
liabilities 11,572 12,881 10,704 Deferred income on shipments to
distributors 5,631 4,998 4,956 Total Current Liabilities 82,523 92,309
93,079 Other long-term obligations 4,863 5,108 10,094 Stockholders'
equity: Capital stock 1,078,878 1,069,113 1,041,834 Accumulated deficit
(440,634) (443,322) (492,741) Accumulated other comprehensive loss (886)
(768) (919) Total Stockholders' Equity 637,358 625,023 548,174 Total
Liabilities and Stockholders' Equity 724,744 $ 722,440 $ 651,347 $
Prepared in accordance with Generally Accepted Accounting Principles