Attached files
| file | filename |
|---|---|
| EX-99.1 - EX-99.1 - NABORS INDUSTRIES LTD | a14-10901_1ex99d1.htm |
| 8-K - 8-K - NABORS INDUSTRIES LTD | a14-10901_18k.htm |
Exhibit 99.2
|
|
vert_photos1.jpgnbr_alt_logo_horz2.jpg1Q14 Earnings Presentation April 23, 2014 Presenters: Anthony G. Petrello Chairman, President & Chief Executive Officer William Restrepo Vice President & Chief Financial Officer |
|
|
nbr_alt_logo_horz2.jpgForward-Looking Statements 2 We often discuss expectations regarding our markets, demand for our products and services, and our future performance in our annual and quarterly reports, press releases, and other written and oral statements. Such statements, including statements in this document incorporated by reference that relate to matters that are not historical facts are “forward-looking statements” within the meaning of the safe harbor provisions of Section 27A of the Securities Act of 1933 and Section 21E of the Securities Exchange Act of 1934. These “forward-looking statements” are based on our analysis of currently available competitive, financial and economic data and our operating plans. They are inherently uncertain, and investors must recognize that events and actual results could turn out to be significantly different from our expectations. You should consider the following key factors when evaluating these forward-looking statements: • fluctuations in worldwide prices and demand for natural gas, natural gas liquids and crude oil; • fluctuations in levels of natural gas, natural gas liquids and crude oil exploration and development activities; • fluctuations in the demand for our services; • the existence of competitors, technological changes and developments in the oilfield services industry; • the existence of operating risks inherent in the oilfield services industry; • the existence of regulatory and legislative uncertainties; • the possibility of changes in tax laws; • the possibility of political instability, war or acts of terrorism in any of the countries in which we do business; and • general economic conditions including the capital and credit markets. Our businesses depend, to a large degree, on the level of spending by oil and gas companies for exploration, development and production activities. Therefore, a sustained increase or decrease in the price of natural gas, natural gas liquids or crude oil, which could have a material impact on exploration and production activities, could also materially affect our financial position, results of operations and cash flows. The above description of risks and uncertainties is by no means all inclusive, but is designed to highlight what we believe are important factors to consider. |
|
|
nbr_alt_logo_horz2.jpg\\Houfile1\Home1\Tyler.Renaudin\Desktop\125_K8V0477.jpg3 Recent Highlights |
|
|
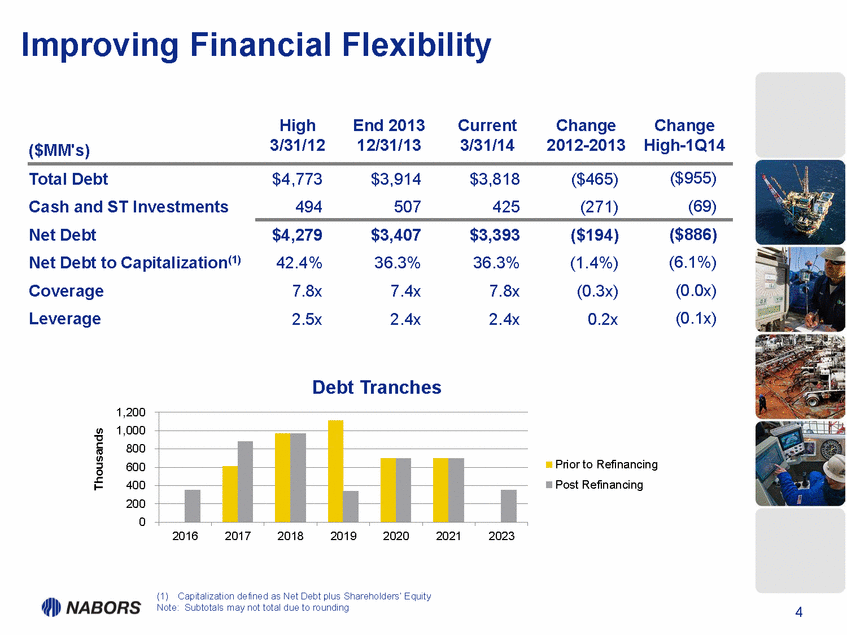
vert_photos2.jpgnbr_alt_logo_horz2.jpgImproving Financial Flexibility 4 (1)Capitalization defined as Net Debt plus Shareholders’ Equity Note: Subtotals may not total due to rounding High 3/31/12 End 2013 12/31/13 Current 3/31/14 Change 2012-2013 Change High-1Q14 ($MM's) Total Debt $4,773 $3,914 $3,818 ($465) ($955) Cash and ST Investments 494 507 425 (271) (69) Net Debt $4,279 $3,407 $3,393 ($194) ($886) Net Debt to Capitalization(1) 42.4% 36.3% 36.3% (1.4%) (6.1%) Coverage 7.8x 7.4x 7.8x (0.3x) (0.0x) Leverage 2.5x 2.4x 2.4x 0.2x (0.1x) 0 200 400 600 800 1,000 1,200 2016 2017 2018 2019 2020 2021 2023 Thousands Debt Tranches Prior to Refinancing Post Refinancing |
|
|
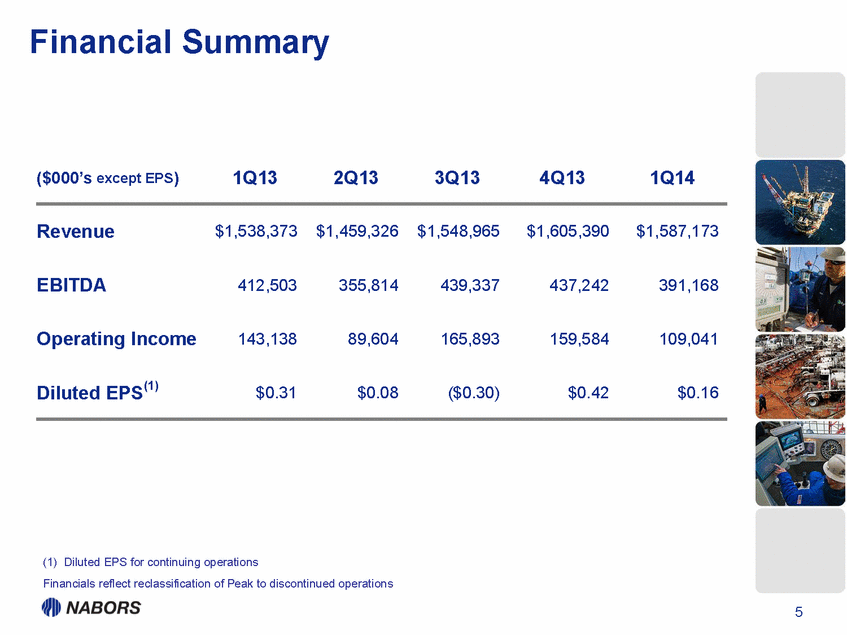
vert_photos2.jpgnbr_alt_logo_horz2.jpg5 Financial Summary ($000’s except EPS) 1Q13 2Q13 3Q13 4Q13 1Q14 Revenue $1,538,373 $1,459,326 $1,548,965 $1,605,390 $1,587,173 EBITDA 412,503 355,814 439,337 437,242 391,168 Operating Income 143,138 89,604 165,893 159,584 109,041 Diluted EPS(1) $0.31 $0.08 ($0.30) $0.42 $0.16 (1)Diluted EPS for continuing operations Financials reflect reclassification of Peak to discontinued operations |
|
|
nbr_alt_logo_horz2.jpgG:\NCS\Investor_Relations\Marketing & Branding\Photos\NDUSA\North Dakota\NAB11_0415.jpg6 Drilling & Rig Services |
|
|
nbr_alt_logo_horz2.jpg7 Drilling & Rig Services Adjusted Income (Loss) Derived from Operating Activities ($000’s) 1Q13 2Q13 3Q13 4Q13 1Q14 Drilling & Rig Services: U.S. $77,595 $69,813 $92,710 $75,378 $72,494 Canada 30,518 3,895 12,244 14,536 26,160 International 21,469 32,481 54,271 69,612 48,119 Rig Services 1,287 (5,383) 2,357 (2,179) 8,728 Total $130,869 $100,806 $161,582 $157,347 $155,501 |
|
|
nbr_alt_logo_horz2.jpgGlobal Rig Fleet Details 8 AC SCR Mech Total Moving Systems Alaska Land 5 12 2 19 13 Lower 48 172 88 26 286 151 Offshore 9 40 1 50 n/a Canada 17 19 28 64 20 International Land 37 71 28 136 60 Total 240 230 85 555 244 Rig Counts include contracted rigs scheduled to be delivered and transferred, and moving systems scheduled to be installed 49% 51% Global Rigs with Moving Systems Moving Systems Non-Moving 43% 42% 15% Rigs by Power Type AC SCR Mech As of 3/31/14 vert_photos2.jpgnbr_alt_logo_horz2.jpg1 |
|
|
nbr_alt_logo_horz2.jpgG:\NCS\Investor_Relations\Marketing & Branding\US Marketing Pitch Book\Backup\PACE X Rendering Photo.bmpDriving Technology & Innovation PACE® Rig Performance PACE-X Competitor A1 Competitor A2 Competitor B Feet/Day in SCOOP - 2013 PACE-B Competitor A Competitor B Feet/Day in Bakken - 2013 PACE®-X rigs outperformed competitors by an average of 17% in the SCOOP PACE®-B rigs outperformed competitors by an average of 11% in the Bakken Feet per Day Feet per Day 10 nbr_alt_logo_horz2.jpg Q14 Rig Utilization & Availability 9 Rig Fleet(1) 1Q14 Rig Years Average Utilization U.S. Lower 48 AC 153 144 94% Legacy 114 43 38% U.S. Lower 48 Total 267 187 70% U.S. Offshore 23 12 52% Alaska 19 8 42% Canada 64 44 69% International 148 130 88% Subtotal 521 381 73% PACE®-X Construction(2) 19 Intl. Newbuilds & Upgrades 12 U.S. & Intl. Offshore Newbuilds 3 Total Fleet 555 (1)As of 3/31/14 (2)Includes announced newbuild commitments and rigs to be delivered |
|
|
vert_photos2.jpgnbr_alt_logo_horz2.jpg4.60 4.80 5.00 5.20 5.40 1Q12 2Q12 3Q12 4Q12 1Q13 2Q13 3Q13 4Q13 1Q14 Wells per Rig US Land Drilling Efficiencies Flattening >Initial signs of diminishing efficiency improvements in key shale plays bode well for high-tech rig demand Source: Baker Hughes U.S. Land Wells/Rig by Basin Date Eagle Ford Marcellus Permian Williston Total Q2 - 2013 4.73 7.33 4.82 3.70 5.15 Q3 - 2013 4.70 6.69 5.08 4.10 5.14 Q4 - 2013 5.20 6.70 5.08 4.09 5.27 Q1 - 2014 5.02 6.47 4.84 3.95 5.07 TTM % 6.14% -11.74% 0.31% 6.80% -1.48% Wells/Rig 12 Trendline PACE-X Rig Deployments & Rig Years 0 5 10 15 20 25 30 35 40 45 50 1Q13 2Q13 3Q13 4Q13 1Q14 2Q14 3Q14 4Q14 1Q15 2Q15 Deployments Cumulative Deployments Cumulative Rig Year 9.7 PACE®-X Rig Years through 1Q14 PACE®-X Contract Summary Contracted Revenue $603 Million Rig Years 54.1 Avg. Contract Duration ~2.4 Years Rig Years at 3/31/14 9.68 *Does not include PACE-X rigs being built on spec Avg. U.S. Rig Equiv. 92.4 11 |
|
|
nbr_alt_logo_horz2.jpgInternational Working Rigs 13 Algeria 10 Ecuador 6 Kurdistan 2 Romania 1 Angola 1 India 4 Kuwait 2 Russia 5 Argentina 21 Iraq 2 Malaysia 2 Saudi Arabia 32 Colombia 6 Italy 1 Mexico 12 UAE 1 Congo 1 Kazakhstan 1 Oman 4 Venezuela 5 PNG 2 Yemen 2 Total 123 As of 3/31/14 nbr_alt_logo_horz2.jpg |
|
|
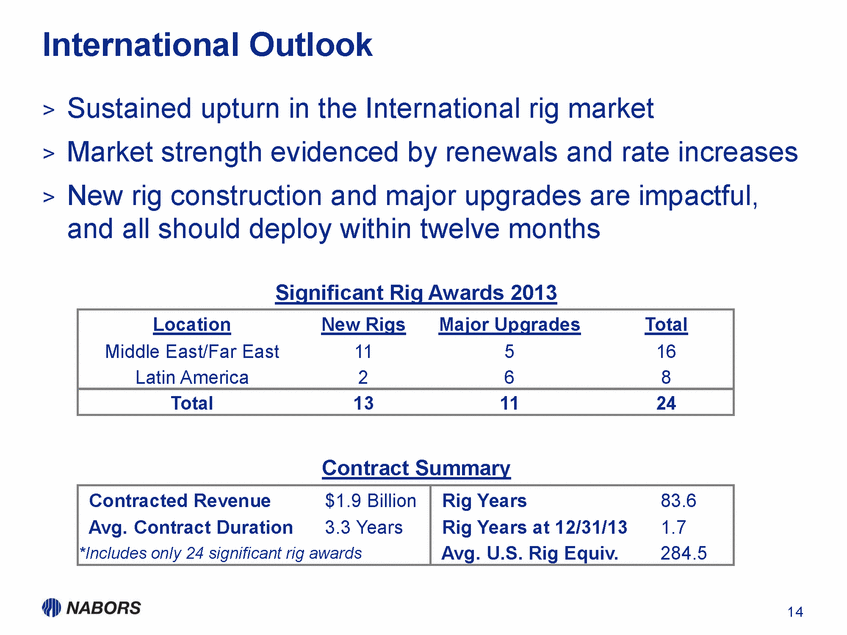
nbr_alt_logo_horz2.jpg\\Houfile1\Home1\Tyler.Renaudin\Desktop\Cresson Plant-024.jpg15 Completion & Production Services International Outlook >Sustained upturn in the International rig market >Market strength evidenced by renewals and rate increases >New rig construction and major upgrades are impactful, and all should deploy within twelve months Location New Rigs Major Upgrades Total Middle East/Far East 11 5 16 Latin America 2 6 8 Total 13 11 24 Contracted Revenue $1.9 Billion Rig Years 83.6 Avg. Contract Duration 3.3 Years Rig Years at 12/31/13 1.7 *Includes only 24 significant rig awards Avg. U.S. Rig Equiv. 284.5 Significant Rig Awards 2013 Contract Summary 14 |
|
|
nbr_alt_logo_horz2.jpgCompletion & Production Services Adjusted Income Derived from Operating Activities 16 ($000’s) 1Q13 2Q13 3Q13 4Q13 1Q14 Completion & Production Services: Completion Services $17,756 $6,870 $13,024 $14,072 ($33,635) Production Services 26,014 23,471 25,909 26,736 30,591 Total $43,770 $30,341 $38,933 $40,808 ($3,044) |
|
|
nbr_alt_logo_horz2.jpgU.S. Completion & Production Services Fleet Region Rigs Frac Crews Trucks Frac Tanks CTU Cementing Wireline SWD Western 181 550 1,824 16 12 Rockies 74 9 58 322 1 9 10 2 Mid-Con 34 1 99 447 8 11 3 Northeast 7 5 100 599 40 15 West Texas 107 3 327 1,236 3 4 3 13 South Texas 28 3 200 511 1 7 3 3 Ark-La-Tex 14 117 301 10 Gulf Coast 4 San Angelo Facility 3 9 Total 445 24 1,451 5,240 30 84 42 31 17 As of 3/31/14 nbr_alt_logo_horz2.jpgD:\NABORS_MGP2_04\North_Dakota_11.2011-1\300 PPI JPG (High Res)\NAB11_0008.jpg18 |
|
|
vert_photos2.jpgnbr_alt_logo_horz2.jpgKey Takeaways 19 >International poised for strong growth beginning in 2H 2014 >U.S. Drilling benefits from PACE®-X deployments and tightening rig market >Larger global opportunity set relative to U.S. peers >Opportunities for additional high-impact investments in high spec rigs >Focus on matters within our control to improve profitability Outlook and Summary |
|
|
nbr_alt_logo_horz2.jpg\\Houfile1\Home1\Tyler.Renaudin\Desktop\007_G5A9435.jpg20 Appendix |
|
|
nbr_alt_logo_horz2.jpgEBITDA 21 ($000’s) 1Q13 2Q13 3Q13 4Q13 1Q14 Drilling & Rig Services $346,238 $316,630 $384,188 $380,242 $382,238 Completion & Production Services 97,842 81,515 90,814 96,425 $53,402 Other reconciling items (31,577) (42,331) (35,665) (39,425) (44,472) Total $412,503 $355,814 $439,337 $437,242 $391,168 |
|
|
nbr_alt_logo_horz2.jpg22 Nabors Global Infrastructure Margins and Activities 2Q13 3Q13 4Q13 1Q14 Drilling Margin (1) Rig Yrs Margin (1) Rig Yrs Margin (1) Rig Yrs Margin (1) Rig Yrs U.S. Lower 48 $9,388 175.5 $11,357 178.6 $9,992 183.1 $9,423 187.2 U.S. Offshore 20,888 15.6 18,717 11.9 21,543 10.7 19,469 11.8 Alaska 36,307 4.7 29,476 5.0 32,428 4.6 38,651 7.6 Canada 14,956 17.4 11,459 30.0 11,478 32.5 11,452 43.8 International 12,432 125.2 14,397 124.2 15,884 124.6 13,811 129.8 Production Services Rev/Hr Rig Hrs Rev/Hr Rig Hrs Rev/Hr Rig Hrs Rev/Hr Rig Hrs U.S. $584 224,681 $573 223,504 $587 205,456 $576 209,982 Canada 711 28,802 753 39,463 820 36,455 860 41,540 (1) Margin = gross margin per rig per day for the period. Gross margin is computed by subtracting direct costs from operating revenues for the period. |
|
|
vert_photos2.jpgnbr_alt_logo_horz2.jpgKey Takeaways 19 >International poised for strong growth beginning in 2H 2014 >U.S. Drilling benefits from PACE®-X deployments and tightening rig market >Larger global opportunity set relative to U.S. peers >Opportunities for additional high-impact investments in high spec rigs >Focus on matters within our control to improve profitability |
|
|
nbr_alt_logo_horz2.jpg\\Houfile1\Home1\Tyler.Renaudin\Desktop\007_G5A9435.jpg20 Appendix |
|
|
nbr_alt_logo_horz2.jpgEBITDA 21 ($000’s) 1Q13 2Q13 3Q13 4Q13 1Q14 Drilling & Rig Services $346,238 $316,630 $384,188 $380,242 $382,238 Completion & Production Services 97,842 81,515 90,814 96,425 $53,402 Other reconciling items (31,577) (42,331) (35,665) (39,425) (44,472) Total $412,503 $355,814 $439,337 $437,242 $391,168 |
|
|
nbr_alt_logo_horz2.jpg22 Nabors Global Infrastructure Margins and Activities 2Q13 3Q13 4Q13 1Q14 Drilling Margin (1) Rig Yrs Margin (1) Rig Yrs Margin (1) Rig Yrs Margin (1) Rig Yrs U.S. Lower 48 $9,388 175.5 $11,357 178.6 $9,992 183.1 $9,423 187.2 U.S. Offshore 20,888 15.6 18,717 11.9 21,543 10.7 19,469 11.8 Alaska 36,307 4.7 29,476 5.0 32,428 4.6 38,651 7.6 Canada 14,956 17.4 11,459 30.0 11,478 32.5 11,452 43.8 International 12,432 125.2 14,397 124.2 15,884 124.6 13,811 129.8 Production Services Rev/Hr Rig Hrs Rev/Hr Rig Hrs Rev/Hr Rig Hrs Rev/Hr Rig Hrs U.S. $584 224,681 $573 223,504 $587 205,456 $576 209,982 Canada 711 28,802 753 39,463 820 36,455 860 41,540 (1) Margin = gross margin per rig per day for the period. Gross margin is computed by subtracting direct costs from operating revenues for the period. |


