Attached files
| file | filename |
|---|---|
| 8-K - CURRENT REPORT - Your Community Bankshares, Inc. | v375351_8k.htm |
| EX-10.1 - FORM OF AFFILIATE AGREEMENTS - Your Community Bankshares, Inc. | v375351_ex10-1.htm |
| EX-99.1 - JOINT PRESS RELEASE - Your Community Bankshares, Inc. | v375351_ex99-1.htm |
| EX-2.1 - AGREEMENT AND PLAN OF SHARE EXCHANGE - Your Community Bankshares, Inc. | v375351_ex2-1.htm |
| EX-10.2 - FORM OF SUBSCRIPTION AGREEMENT - Your Community Bankshares, Inc. | v375351_ex10-2.htm |
Exhibit 99.2
Community Bank Shares of Indiana, Inc.
Pursuant to Rule 425 under the Securities Act of 1933
and deemed filed pursuant to Rule 14a-12
of the Securities Exchange Act of 1934
Subject Company: First Financial Service Corp.
(Commission File No. 000-18832)
Community Bank Shares of Indiana, Inc.
This communication does not constitute a solicitation of any vote or approval or offer to sell securities. The Company intends to file a registration statement on Form S-4 with the SEC to register the Company’s shares that will be issued to FFKY’s shareholders in connection with the transaction. The registration statement will include a joint proxy statement/prospectus of the Company and FFKY that also constitutes a prospectus of the Company. The Company and FFKY will mail a definitive a joint proxy statement/prospectus to each of their respective shareholders when it is complete and the registration statement on Form S-4 becomes effective. The joint proxy statement/prospectus to be filed with the SEC related to the proposed transaction will contain important information about the Company, FFKY, the proposed transaction and related matters. WE URGE INVESTORS AND SECURITY HOLDERS TO READ THE REGISTRATION STATEMENT AND JOINT PROXY/PROSPECTUS WHEN IT BECOMES AVAILABLE (AND ANY OTHER DOCUMENTS FILED WITH THE SEC IN CONNECTION WITH THE TRANSACTION OR INCORPORATED BY REFERENCE INTO THE JOINT PROXY/PROSPECTUS) BECAUSE THOSE DOCUMENTS WILL CONTAIN IMPORTANT INFORMATION REGARDING THE PROPOSED SHARE EXCHANGE. Investors and security holders may obtain free copies of these documents and other documents filed with the SEC on the SEC’s website at http://www.sec.gov. Investors and security holders may also obtain free copies of the documents filed with the SEC by the Company at the Company’s website at http://www.yourcommunitybank.com (which website is not incorporated herein by reference) or by contacting Paul Chrisco by telephone at (812) 981-7375. Investors and security holders may also obtain free copies of the documents filed with the SEC by the FFKY at its website at http://www.ffsbky.com (which website is not incorporated herein by reference) or by contacting Frank Perez by telephone at (270) 765-2131.
The Company, FFKY and their respective directors and officers and certain other members of management and employees may be deemed to be participants in the solicitation of proxies from its shareholders in connection with the proposed share exchange. Information regarding these persons who may, under the rules of the SEC, be considered participants in the solicitation of shareholders in connection with the proposed share exchange will be provided in the joint proxy statement/prospectus described above when it is filed with the SEC. Additional information regarding each of the Company’s and FFKY’s respective executive officers and directors, including shareholdings, is included in the Company’s definitive proxy statement for 2014, which was filed with the SEC on April 4, 2014 and FFKY’s definitive proxy statement for 2014, which was filed with the SEC on April 21, 2014, respectively. You can obtain free copies of this document from the Company or FFKY, respectively, using the contact information above.

30 - 70 - 135 0 - 175 - 240 125 - 193 - 72 - CONFIDENTIAL - - CONFIDENTIAL - Community Bank Shares of Indiana, Inc. A NASDAQ Traded Company - Symbol CBIN Investor Presentation April 2014 - CONFIDENTIAL - “Achieving Financial Goals with Exceptional People and Exceptional Service”

30 - 70 - 135 0 - 175 - 240 125 - 193 - 72 - CONFIDENTIAL - Page| 2 Safe Harbor Statement for Forward - Looking Statements This investor presentation contains forward - looking statements within the meaning of the federal securities laws . These statements are not historical facts, but rather statements based on our current expectations regarding our business strategies and their intended results and our future performance . Forward - looking statements are preceded by terms such as “expects,” “believes,” “anticipates,” “intends” and similar expressions, as well as any statements related to future expectations of performance . Forward - looking statements are not guarantees of future performance . Numerous risks and uncertainties could cause or contribute to our actual results, performance, and achievements to be materially different from those expressed or implied by the forward - looking statements . Factors that may cause or contribute to these differences include, without limitation, our failure to integrate acquired institutions in accordance with expectations ; deviations from our performance expectations related to acquired institutions ; general economic conditions, including changes in market interest rates and changes in monetary and fiscal policies of the federal government ; legislative and regulatory changes ; competitive conditions in the banking markets served by our subsidiaries ; the adequacy of the allowance for losses on loans and the level of future provisions for losses on loans ; and other factors disclosed periodically in our filings with the Securities and Exchange Commission . Because of the risks and uncertainties inherent in forward - looking statements, readers are cautioned not to place undue reliance on them, whether included in this report or made elsewhere from time to time by us or on our behalf . We assume no obligation to update any forward - looking statements .

30 - 70 - 135 0 - 175 - 240 125 - 193 - 72 - CONFIDENTIAL - - CONFIDENTIAL - Transaction Overview

30 - 70 - 135 0 - 175 - 240 125 - 193 - 72 - CONFIDENTIAL - Executive Summary □ Community Bank Shares of Indiana, Inc . (“Community Bank Shares” or “CBIN”) is finalizing a definitive agreement to acquire First Financial Service Corp . (“First Financial” or “FFKY”) □ First Financial will be merged into Community Bank Shares with FFKY’s subsidiary, First Federal Savings Bank of Elizabethtown, merged into CBIN’s subsidiary, Your Community Bank (the “Transaction”) □ Community Bank Shares has also entered into subscription agreements to sell 1 , 120 , 950 shares of common stock at closing for $ 22 . 33 per share the “Offering”) . The funding and closing of the Offering will be contingent on the closing of the Transaction Page| 4

30 - 70 - 135 0 - 175 - 240 125 - 193 - 72 - CONFIDENTIAL - Company Overview: Community Bank Shares of Indiana, Inc. 24 Branches in Indiana & Kentucky Executive Management Financial Highlights Page| 5 Source: SNL Financial (1) NPAs/Assets excludes TDRs from nonperforming assets. (2) In July 2013, CBIN closed its Georgetown, KY branch (Scott County, KY) and approximately $5.5 million in deposits were transferred to CBIN’s Vine Street branch in Lexington, KY (Fayette County, KY). Community Bank Shares of Indiana For the Years Ended: Balance Sheet 12/31/12 12/31/13 3/31/13 6/30/13 9/30/13 12/31/13 Total Assets ($000) 819,500 846,735 809,666 838,371 831,185 846,735 Total Net Loans ($000) 458,052 552,994 464,151 541,737 538,967 552,994 Total Deposits ($000) 624,667 643,625 622,464 674,324 644,379 643,625 Tangible Equity ($000) 85,804 87,335 86,240 82,568 84,152 87,335 Loans / Deposits (%) 74.5 87.2 75.7 81.7 85.1 87.2 TCE / TA (%) 7.1 7.0 7.2 6.5 6.8 7.0 Tier 1 Ratio (%) 17.9 17.2 18.1 16.8 17.1 17.2 Total RBC Ratio (%) 19.1 18.5 19.4 18.0 18.3 18.5 Profitability Net Income ($000) 7,685 8,667 1,907 2,204 2,260 2,296 ROAA (%) 0.95 1.04 0.94 1.04 1.09 1.09 ROAE (%) 9.16 10.03 8.75 10.03 10.77 9.83 Net Interest Margin (%) 4.07 4.24 4.06 4.23 4.47 4.20 Efficiency Ratio (%) 61.28 65.00 68.01 65.19 66.30 60.73 Asset Quality (%) NPAs / Assets (%) (1) 1.84 1.63 2.64 2.69 2.50 1.63 Reserves / Loans (%) 1.88 1.43 1.63 1.76 1.73 1.43 Per Share Information TBV per Share ($) 17.03 17.48 17.23 16.10 16.55 17.48 Earnings Per Share ($) 2.06 2.32 0.50 0.57 0.60 0.66 For the Quarters Ended: Name Position James D. "Jim" Rickard President & CEO Paul A. Chrisco Executive VP & CFO As of June 30, 2013 Total Total 2013 Number of Deposits Market Rank County, ST Branches ($000) Share (%) 2 Floyd, IN 7 221,565 17.60 2 Clark, IN 5 213,591 15.42 1 Scott, IN 4 119,053 45.61 18 Fayette, KY 3 48,585 0.80 19 Jefferson, KY 3 39,262 0.24 6 Nelson, KY 2 34,485 5.07 Total 24 676,541 Deposit Market Share Summary by County (2)
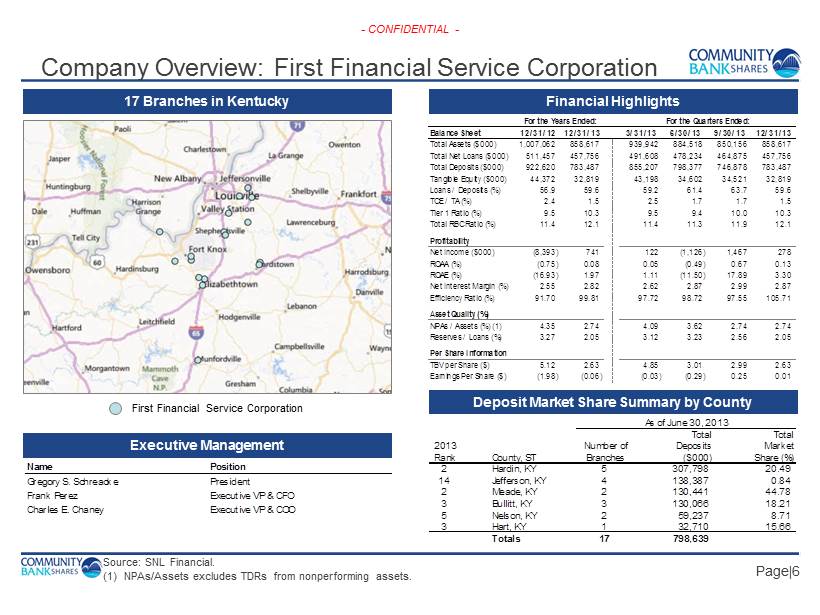
30 - 70 - 135 0 - 175 - 240 125 - 193 - 72 - CONFIDENTIAL - Company Overview: First Financial Service Corporation 17 Branches in Kentucky Deposit Market Share Summary by County Executive Management Financial Highlights Page| 6 Source: SNL Financial. (1) NPAs/Assets excludes TDRs from nonperforming assets . 187 - 224 - 227 First Financial Service Corporation For the Years Ended: Balance Sheet 12/31/12 12/31/13 3/31/13 6/30/13 9/30/13 12/31/13 Total Assets ($000) 1,007,062 858,617 939,942 884,518 850,156 858,617 Total Net Loans ($000) 511,457 457,756 491,608 478,234 464,875 457,756 Total Deposits ($000) 922,620 783,487 855,207 798,377 746,878 783,487 Tangible Equity ($000) 44,372 32,819 43,198 34,602 34,521 32,819 Loans / Deposits (%) 56.9 59.6 59.2 61.4 63.7 59.6 TCE / TA (%) 2.4 1.5 2.5 1.7 1.7 1.5 Tier 1 Ratio (%) 9.5 10.3 9.5 9.4 10.0 10.3 Total RBC Ratio (%) 11.4 12.1 11.4 11.3 11.9 12.1 Profitability Net Income ($000) (8,393) 741 122 (1,126) 1,467 278 ROAA (%) (0.75) 0.08 0.05 (0.49) 0.67 0.13 ROAE (%) (16.93) 1.97 1.11 (11.50) 17.89 3.30 Net Interest Margin (%) 2.55 2.82 2.62 2.87 2.99 2.87 Efficiency Ratio (%) 91.70 99.81 97.72 98.72 97.55 105.71 Asset Quality (%) NPAs / Assets (%) (1) 4.35 2.74 4.09 3.62 2.74 2.74 Reserves / Loans (%) 3.27 2.05 3.12 3.23 2.56 2.05 Per Share Information TBV per Share ($) 5.12 2.63 4.85 3.01 2.99 2.63 Earnings Per Share ($) (1.98) (0.06) (0.03) (0.29) 0.25 0.01 For the Quarters Ended: Name Position Gregory S. Schreacke President Frank Perez Executive VP & CFO Charles E. Chaney Executive VP & COO As of June 30, 2013 Total Total 2013 Number of Deposits Market Rank County, ST Branches ($000) Share (%) 2 Hardin, KY 5 307,798 20.49 14 Jefferson, KY 4 138,387 0.84 2 Meade, KY 2 130,441 44.78 3 Bullitt, KY 3 130,066 18.21 5 Nelson, KY 2 59,237 8.71 3 Hart, KY 1 32,710 15.66 Totals 17 798,639

30 - 70 - 135 0 - 175 - 240 125 - 193 - 72 - CONFIDENTIAL - Transaction Overview Consideration □ Each FFKY share to be exchanged for 0.153 shares of CBIN (subject to adjustment) at close □ $20.0 million of preferred stock redeemed for $12.3 million in cash, resulting in a $7.7 million gain to common equity □ Options cashed out at close Exchange Ratio Adjustment □ Adjusted downward if tangible common equity at close is less than $13.0 million □ Adjusted downward to the extent that the disposition of certain problem assets does not reduce anticipated credit mark by at least $3.0 million Estimated Loan Credit Mark □ ($25.5 million) or 5.5% of loans at 12/31/2013 Projected Cost Savings □ 40% of FFKY’s noninterest expense base □ 50% phased in for 2014; 75% for 2015; 100% thereafter Estimated Merger - Related Charges □ $7.1 million (after - tax) Page| 7

30 - 70 - 135 0 - 175 - 240 125 - 193 - 72 - CONFIDENTIAL - Transaction Overview (Cont’d.) Board Representation □ CBIN will appoint one First Financial director to its holding company board and one to the board of Your Community Bank Required Approvals □ Approval of First Financial and Community Bank Shares shareholders □ Regulatory Anticipated Closing □ 3 rd or 4 th Quarter of 2014 Page| 8

30 - 70 - 135 0 - 175 - 240 125 - 193 - 72 - CONFIDENTIAL - Transaction Pricing Multiples (as of 12/31/13) Implied Common Stock Deal Value ($MM) (2) Preferred Stock Redemption ($MM) Total Deal Value (Common & Preferred) ($MM) $14.7 12.3 $27.0 $17.9 12.3 $30.2 Total Deal Value / Tangible Equity 82.4% 92.0% Common Deal Value / Adjusted Tangible Common Equity (3) 71.8% 87.1% Page| 9 (1) Lower Band assumes shortfall on Special Assets of $3.0 million; Upper Band assumes no shortfall on Special Assets. (2) Based on CBIN 20 trading day average stock price of $22.33 as of 4/17/14. (3) Tangible common book value adjusted for the $7.7 million gain on redemption of preferred stock. Upper Band (1) Lower Band (1)
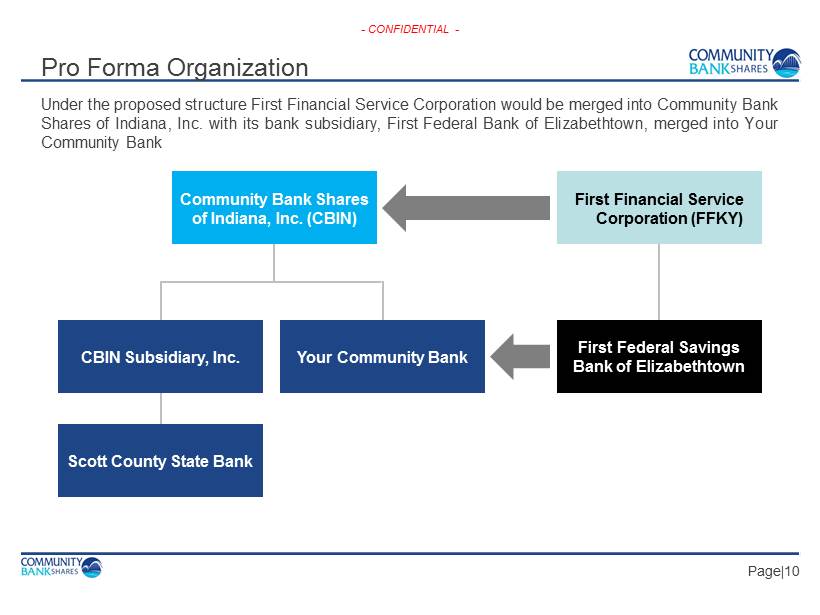
30 - 70 - 135 0 - 175 - 240 125 - 193 - 72 - CONFIDENTIAL - Page| 10 Pro Forma Organization Community Bank Shares of Indiana, Inc. (CBIN) Scott County State Bank First Financial Service Corporation (FFKY) First Federal Savings Bank of Elizabethtown Your Community Bank CBIN Subsidiary, Inc. 187 - 224 - 227 Under the proposed structure First Financial Service Corporation would be merged into Community Bank Shares of Indiana, Inc . with its bank subsidiary, First Federal Bank of Elizabethtown, merged into Your Community Bank

30 - 70 - 135 0 - 175 - 240 125 - 193 - 72 - CONFIDENTIAL - Page| 11 Estimated Financial Metrics of the Transaction □ Projected IRR of + 20% □ +4% accretive to 2015 estimated earnings (75% of cost savings phased in) • Includes the impact of the shares issued in the Offering □ +18% accretive to 2016 estimated earnings (100% of cost savings phased in) • Includes the impact of the shares issued in the Offering □ Estimated dilution to tangible book value recaptured in less than 2 years □ Estimated 2015 Pro Forma ROAA +1.0% □ Marked - to - market balance sheet

30 - 70 - 135 0 - 175 - 240 125 - 193 - 72 - CONFIDENTIAL - Lexingto n Indianapoli s Dayton Cincinnat i Louisvill e Evansville Columbu s Pro Forma Franchise Page| 12 Source: SNL Financial. Branch level deposit data as of 6/30/13. (1) Ranking based on deposit market share of all community banks & thrifts in the Louisville, KY MSA with total assets less than $100 billion (source: SNL Financial). FFKY Branches CBIN Branches 187 - 224 - 227 Louisville/Jefferson County, KY-IN MSA 2013 2013 # of Deposits Market Rank Institution Branches ($000) Share (%) 1 PNC Financial Services Group (PA) 70 5,138,327 22.70 2 JPMorgan Chase & Co. (NY) 45 3,432,385 15.16 3 Fifth Third Bancorp (OH) 42 2,437,466 10.77 4 S.Y. Bancorp Inc. (KY) 28 1,718,092 7.59 5 Republic Bancorp Inc. (KY) 24 1,625,631 7.18 6 BB&T Corp. (NC) 28 1,351,127 5.97 7 Pro Forma CBIN / FFKY 26 861,924 3.81 7 U.S. Bancorp (MN) 27 765,190 3.38 8 Commonwealth Bancshares Inc. (KY) 15 650,093 2.87 9 Community Bank Shares of IN (IN) 19 593,471 2.62 15 First Financial Service Corp. (KY) 7 268,453 1.19 Total For Institutions In Market 442 22,640,203 □ Transaction immediately doubles CBIN’s current asset - size to approximately $ 1 . 6 billion and places it among the top three largest community banks in the Louisville metro area ( 1 ) □ Meaningfully expands CBIN’s Kentucky presence in core markets, while adding branches in neighboring markets Strategic Rationale
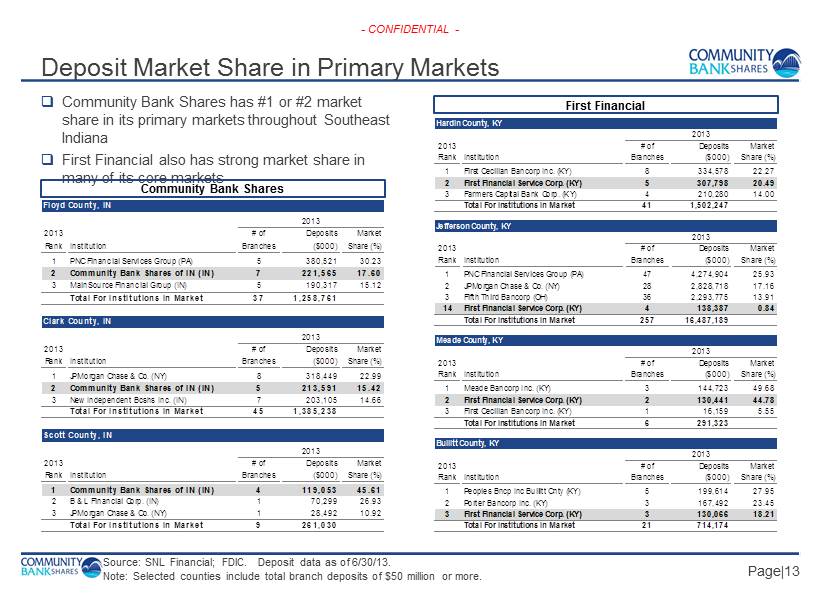
30 - 70 - 135 0 - 175 - 240 125 - 193 - 72 - CONFIDENTIAL - Source: SNL Financial; FDIC. Deposit data as of 6/30/13. Note: Selected counties include total branch deposits of $50 million or more. Page| 13 Deposit Market Share in Primary Markets □ Community Bank Shares has #1 or #2 market share in its primary markets throughout Southeast Indiana □ First Financial also has strong market share in many of its core markets First Financial Community Bank Shares Hardin County, KY 2013 2013 # of Deposits Market Rank Institution Branches ($000) Share (%) 1 First Cecilian Bancorp Inc. (KY) 8 334,578 22.27 2 First Financial Service Corp. (KY) 5 307,798 20.49 3 Farmers Capital Bank Corp. (KY) 4 210,280 14.00 Total For Institutions In Market 41 1,502,247 Jefferson County, KY 2013 2013 # of Deposits Market Rank Institution Branches ($000) Share (%) 1 PNC Financial Services Group (PA) 47 4,274,904 25.93 2 JPMorgan Chase & Co. (NY) 28 2,828,718 17.16 3 Fifth Third Bancorp (OH) 36 2,293,775 13.91 14 First Financial Service Corp. (KY) 4 138,387 0.84 Total For Institutions In Market 257 16,487,189 Meade County, KY 2013 2013 # of Deposits Market Rank Institution Branches ($000) Share (%) 1 Meade Bancorp Inc. (KY) 3 144,723 49.68 2 First Financial Service Corp. (KY) 2 130,441 44.78 3 First Cecilian Bancorp Inc. (KY) 1 16,159 5.55 Total For Institutions In Market 6 291,323 Bullitt County, KY 2013 2013 # of Deposits Market Rank Institution Branches ($000) Share (%) 1 Peoples Bncp Inc Bullitt Cnty (KY) 5 199,614 27.95 2 Porter Bancorp Inc. (KY) 3 167,492 23.45 3 First Financial Service Corp. (KY) 3 130,066 18.21 Total For Institutions In Market 21 714,174 Floyd County, IN 2013 2013 # of Deposits Market Rank Institution Branches ($000) Share (%) 1 PNC Financial Services Group (PA) 5 380,521 30.23 2 Community Bank Shares of IN (IN) 7 221,565 17.60 3 MainSource Financial Group (IN) 5 190,317 15.12 Total For Institutions In Market 37 1,258,761 Clark County, IN 2013 2013 # of Deposits Market Rank Institution Branches ($000) Share (%) 1 JPMorgan Chase & Co. (NY) 8 318,449 22.99 2 Community Bank Shares of IN (IN) 5 213,591 15.42 3 New Independent Bcshs Inc. (IN) 7 203,105 14.66 Total For Institutions In Market 45 1,385,238 Scott County, IN 2013 2013 # of Deposits Market Rank Institution Branches ($000) Share (%) 1 Community Bank Shares of IN (IN) 4 119,053 45.61 2 B & L Financial Corp. (IN) 1 70,299 26.93 3 JPMorgan Chase & Co. (NY) 1 28,492 10.92 Total For Institutions In Market 9 261,030

30 - 70 - 135 0 - 175 - 240 125 - 193 - 72 - CONFIDENTIAL - 2.78 4.15 3.52 2.58 2.10 3.62 (1.00%) 0.00% 1.00% 2.00% 3.00% 4.00% 5.00% CBIN FFKY Pro Forma KY IN US Source: SNL Financial; Company reports. Deposit data as of 6/30/13. Note: In July 2013, CBIN closed its Georgetown, KY branch (Scott County, KY) and approximately $5.5 million in deposits were transferred to CBIN’s Vine Street branch in Lexington, KY (Fayette County, KY). Page| 14 Market Demographics Est. 2013 - 2018 Population Change (%) 2013 Median HHI ($) Est. 2013 - 2018 Median HHI Change (%) CBIN Branches # of Deposits Market Population Median Household Income Checks County Branches ($000) Share (%) 2013 Proj. 2018 % Chg. 2013 Proj. 2018 % Chg. Floyd, IN 7 221,565 17.60 76,316 78,505 2.87 50,912 61,394 20.59 Clark, IN 5 213,591 15.42 112,411 116,932 4.02 44,944 54,760 21.84 Scott, IN 4 119,053 45.61 24,321 24,122 -0.82 39,110 44,540 13.88 Fayette, KY 3 48,585 0.80 302,940 319,265 5.39 48,077 55,088 14.58 Jefferson, KY 3 39,262 0.24 744,296 760,069 2.12 44,387 51,974 17.09 Nelson, KY 2 34,485 5.07 44,366 46,168 4.06 45,595 52,516 15.18 Total/Weighted Average 24 676,541 2.78 46,098 54,882 18.89 FFKY Branches # of Deposits Market Population Median Household Income County Branches ($000) Share (%) 2013 Proj. 2018 % Chg. 2013 Proj. 2018 % Chg. Hardin, KY 5 307,798 20.49 109,708 116,822 6.48 45,292 53,431 17.97 Jefferson, KY 4 138,387 0.84 744,296 760,069 2.12 44,387 51,974 17.09 Meade, KY 2 130,441 44.78 28,390 28,592 0.71 39,621 46,841 18.22 Bullitt, KY 3 130,066 18.21 76,426 79,902 4.55 52,362 58,471 11.67 Nelson, KY 2 59,237 8.71 44,366 46,168 4.06 45,595 52,516 15.18 Hart, KY 1 32,710 15.66 18,706 19,305 3.20 29,906 31,845 6.48 Total/Weighted Average 17 798,639 4.15 44,753 51,971 16.15 Pro Forma Weighted Avg. 41 1,475,180 3.52 45,370 53,306 17.41 Kentucky 2.58 40,750 48,362 18.68 Indiana 2.10 46,401 56,206 21.13 National 3.62 51,314 59,580 16.11 46,098 44,753 45,370 40,750 46,401 51,314 0 10,000 20,000 30,000 40,000 50,000 60,000 CBIN FFKY Pro… KY IN US 18.89 16.15 17.41 18.68 21.13 16.11 0.00% 5.00% 10.00% 15.00% 20.00% 25.00% CBIN FFKY Pro Forma KY IN US

30 - 70 - 135 0 - 175 - 240 125 - 193 - 72 - CONFIDENTIAL - 7.5% 25.2% 7.1% 16.9% 22.0% 5.7% 0.9% 10.8% 3.9% 7.9% 26.2% 9.0% 13.1% 30.0% 4.9% 0.3% 4.4% 4.2% 7.1% 24.4% 5.5% 20.0% 15.4% 6.4% 1.4% 16.3% 3.6% Pro Forma Loan Composition Page| 15 Source: SNL Financial. Financial data based on Bank Holding Company regulatory filings as of 12/31/13. Note: Pro forma loan composition does not include purchase accounting adjustments. CBIN FFKY Pro Forma Residential Mortgage Construction & Land Home Equity CRE (Owner Occupied) C & I Consumer & Other MRQ Yield on Loans: 5.09% MRQ Yield on Loans: 5.01% Wtd Avg MRQ Yield on Loans: 5.05% CRE (Non - Owner Occupied) Multifamily Loans ($000) Construction & Land 39,986$ 7.1% Residential Mortgage 136,964$ 24.4% Home Equity 30,641$ 5.5% CRE (Owner Occupied) 112,072$ 20.0% CRE (Non-Owner Occupied) 86,405$ 15.4% Multifamily 36,056$ 6.4% Agriculture 7,576$ 1.4% C & I 91,183$ 16.3% Consumer & Other 20,120$ 3.6% Total 561,003$ 100.0% Loans ($000) Construction & Land 37,105$ 7.9% Residential Mortgage 122,524$ 26.2% Home Equity 41,910$ 9.0% CRE (Owner Occupied) 61,523$ 13.1% CRE (Non-Owner Occupied) 140,307$ 30.0% Multifamily 22,915$ 4.9% Agriculture 1,363$ 0.3% C & I 20,426$ 4.4% Consumer & Other 19,814$ 4.2% Total 467,887$ 100.0% Loans ($000) Construction & Land 77,091$ 7.5% Residential Mortgage 259,488 25.2% Home Equity 72,551 7.1% CRE (Owner Occupied) 173,595 16.9% CRE (Non-Owner Occupied) 226,712 22.0% Multifamily 58,971 5.7% Agriculture 8,939 0.9% C & I 111,609 10.8% Consumer & Other 39,934 3.9% Total 1,028,890$ 100.0% Agriculture
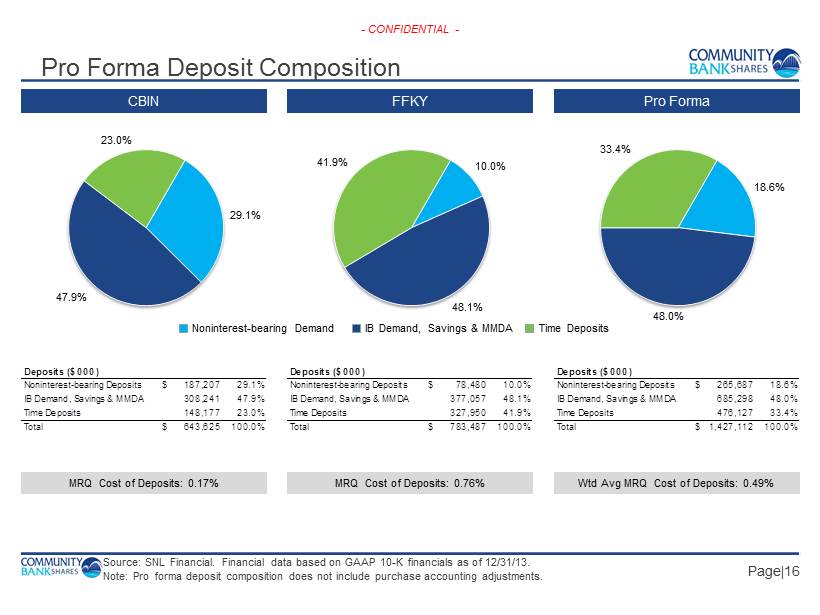
30 - 70 - 135 0 - 175 - 240 125 - 193 - 72 - CONFIDENTIAL - 29.1% 47.9% 23.0% 10.0% 48.1% 41.9% 18.6% 48.0% 33.4% Pro Forma Deposit Composition Page| 16 Source: SNL Financial. Financial data based on GAAP 10 - K financials as of 12/31/13. Note: Pro forma deposit composition does not include purchase accounting adjustments. CBIN FFKY Pro Forma IB Demand, Savings & MMDA Noninterest - bearing Demand Time Deposits MRQ Cost of Deposits: 0.76% MRQ Cost of Deposits: 0.17% Wtd Avg MRQ Cost of Deposits: 0.49% Deposits ($000) Noninterest-bearing Deposits 187,207$ 29.1% IB Demand, Savings & MMDA 308,241 47.9% Time Deposits 148,177 23.0% Total 643,625$ 100.0% Deposits ($000) Noninterest-bearing Deposits 78,480$ 10.0% IB Demand, Savings & MMDA 377,057 48.1% Time Deposits 327,950 41.9% Total 783,487$ 100.0% Deposits ($000) Noninterest-bearing Deposits 265,687$ 18.6% IB Demand, Savings & MMDA 685,298 48.0% Time Deposits 476,127 33.4% Total 1,427,112$ 100.0%

30 - 70 - 135 0 - 175 - 240 125 - 193 - 72 - CONFIDENTIAL - Deposit Composition: 2000 vs. Today Page| 17 4Q 2000 4Q 2013 Total Deposits: $258 million 43% Non - Time Deposits Total Deposits: $644 million 77% Non - Time Deposits Reduced Proportion of Time Deposits by 34% Noninterest - Bearing Deposits 8% IB Demand, MMDA & Savings 35% Time Deposits 57% Noninterest - Bearing Deposits 29% IB Demand, MMDA & Savings 48% Time Deposits 23%

30 - 70 - 135 0 - 175 - 240 125 - 193 - 72 - CONFIDENTIAL - Page| 18 Disciplined Execution □ Community Bank Shares began due diligence in December 2013 □ Community Bank Shares’ management is familiar with primary market areas □ Regulators engaged early in the process □ Comprehensive reviews of loans, OREO, fixed assets, and contracts through review of First Financial’s documentation, as well as in - depth interviews with key personnel □ Target portfolio reviewed by independent 3 rd party □ CBIN’s Chief Risk Officer has reviewed FFKY’s risk management and compliance framework as the basis for a risk management integration plan □ CBIN will be adding Risk Management / Compliance staff to help manage any compliance issues that currently exist or come up during integration □ CBIN has a history of robust risk and compliance management that can be applied across the combined organization □ CBIN is currently interviewing merger integration consultants to obtain assistance with integrating the operations of the two companies Due Diligence Merger Integration
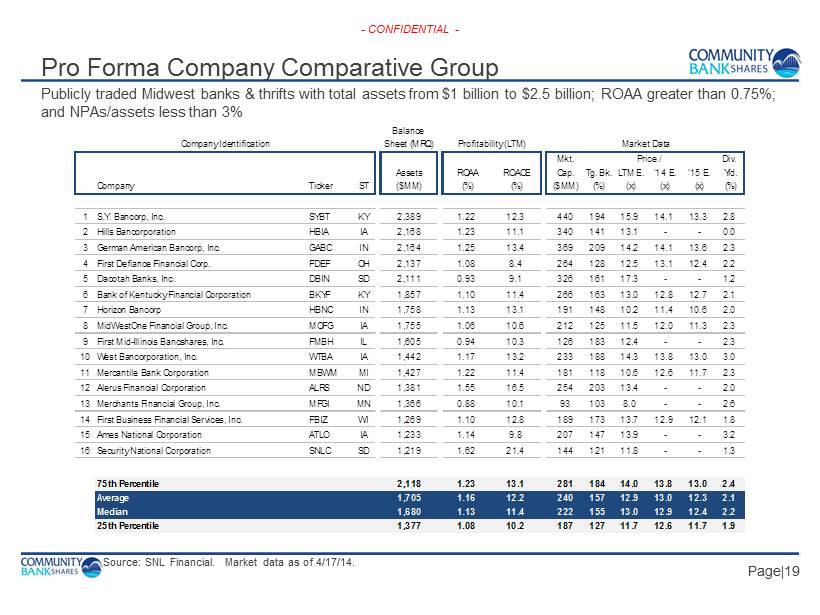
30 - 70 - 135 0 - 175 - 240 125 - 193 - 72 - CONFIDENTIAL - Source: SNL Financial. Market data as of 4/17/14. Pro Forma Company Comparative Group Page| 19 Publicly traded Midwest banks & thrifts with total assets from $1 billion to $2.5 billion; ROAA greater than 0.75%; and NPAs/assets less than 3% Balance Company Identification Sheet (MRQ) Profitability (LTM) Market Data Mkt. Price / Div. Assets ROAA ROACE Cap. Tg. Bk.LTM E. '14 E. '15 E. Yld. Company Ticker ST ($MM) (%) (%) ($MM) (%) (x) (x) (x) (%) 1 S.Y. Bancorp, Inc. SYBT KY 2,389 1.22 12.3 440 194 15.9 14.1 13.3 2.8 2 Hills Bancorporation HBIA IA 2,168 1.23 11.1 340 141 13.1 - - 0.0 3 German American Bancorp, Inc. GABC IN 2,164 1.25 13.4 369 209 14.2 14.1 13.6 2.3 4 First Defiance Financial Corp. FDEF OH 2,137 1.08 8.4 264 128 12.5 13.1 12.4 2.2 5 Dacotah Banks, Inc. DBIN SD 2,111 0.93 9.1 326 161 17.3 - - 1.2 6 Bank of Kentucky Financial Corporation BKYF KY 1,857 1.10 11.4 266 163 13.0 12.8 12.7 2.1 7 Horizon Bancorp HBNC IN 1,758 1.13 13.1 191 148 10.2 11.4 10.6 2.0 8 MidWestOne Financial Group, Inc. MOFG IA 1,755 1.06 10.6 212 125 11.5 12.0 11.3 2.3 9 First Mid-Illinois Bancshares, Inc. FMBH IL 1,605 0.94 10.3 126 183 12.4 - - 2.3 10 West Bancorporation, Inc. WTBA IA 1,442 1.17 13.2 233 188 14.3 13.8 13.0 3.0 11 Mercantile Bank Corporation MBWM MI 1,427 1.22 11.4 181 118 10.6 12.6 11.7 2.3 12 Alerus Financial Corporation ALRS ND 1,381 1.55 16.5 254 203 13.4 - - 2.0 13 Merchants Financial Group, Inc. MFGI MN 1,366 0.88 10.1 93 103 8.0 - - 2.6 14 First Business Financial Services, Inc. FBIZ WI 1,269 1.10 12.8 189 173 13.7 12.9 12.1 1.8 15 Ames National Corporation ATLO IA 1,233 1.14 9.8 207 147 13.9 - - 3.2 16 Security National Corporation SNLC SD 1,219 1.62 21.4 144 121 11.8 - - 1.3 75th Percentile 2,118 1.23 13.1 281 184 14.0 13.8 13.0 2.4 Average 1,705 1.16 12.2 240 157 12.9 13.0 12.3 2.1 Median 1,680 1.13 11.4 222 155 13.0 12.9 12.4 2.2 25th Percentile 1,377 1.08 10.2 187 127 11.7 12.6 11.7 1.9

30 - 70 - 135 0 - 175 - 240 125 - 193 - 72 - CONFIDENTIAL - Investment Highlights □ Creates a dynamic community banking franchise covering the complete Louisville MSA □ Expected to have significant core earnings power after potential synergies are realized □ Experienced management team with a track record of: □ Growing profits, both organically and through acquisition □ Reducing problem assets with on - staff experienced work out specialists □ Transforming higher cost funding into low cost core deposits □ At current valuation levels, CBIN stock is priced attractively relative to peers Page| 20
30 - 70 - 135 0 - 175 - 240 125 - 193 - 72 - CONFIDENTIAL - - CONFIDENTIAL - Overview of CBIN

30 - 70 - 135 0 - 175 - 240 125 - 193 - 72 - CONFIDENTIAL - Source: SNL Financial; Company management. Market data as of 4/17/14. (1) Market data based on CBIN 20 trading day average stock price of $22.33 as of 4/17/14. Financial data as of 12/31/13. Company Profile Market Data (1) Shares Outstanding 3.4 million Market Cap $76.8 million 20 Trading Day Avg. Price per Share $22.33 Dividend Yield 1.9% Price / Tg. Book Value 127.7% Price / LTM EPS 9.6x Insider Ownership 18% Financial Highlights Year End 12/31/13 Assets $846.7 million Loans, Net $553.0 million Deposits $643.6 million Tg. Equity $87.3 million Tg. Common Equity $59.3 million TE / TA 10.33% TCE / TA 7.02% 2013 Net Income $8.7 million Net Income Avail. to Common $7.9 million ROAA 1.04% ROACE 13.61% NPAs (Excl. TDRs) / Assets 1.63% NIM 4.24% Cost of Interest - bearing Liabilities 0.39% Experienced Management Team Name, Title Yrs. Experience James D. “Jim” Rickard, President & CEO 39 Paul A. Chrisco, EVP & CFO 21 Michael K. Bauer, EVP & Chief Credit Officer 30 Kevin J. Cecil, EVP – President of Indiana Market Division 37 Page| 22
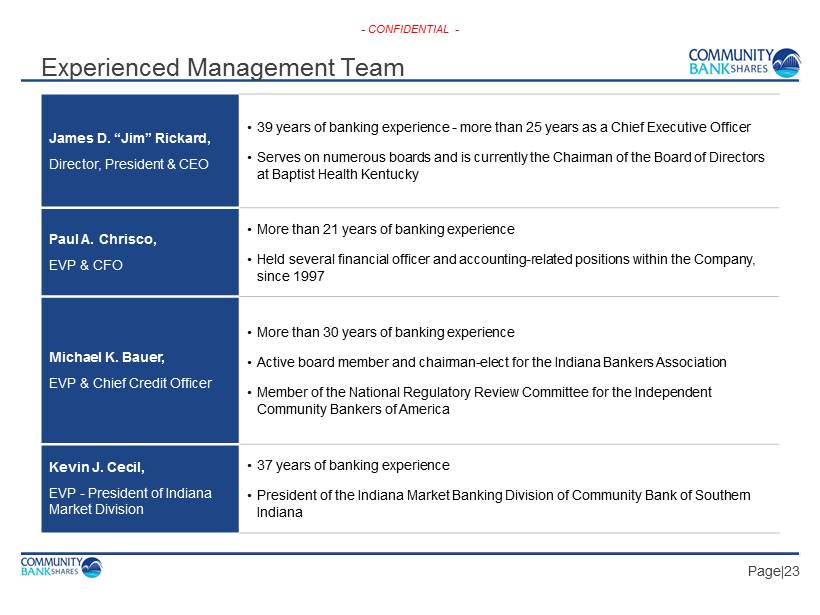
30 - 70 - 135 0 - 175 - 240 125 - 193 - 72 - CONFIDENTIAL - Experienced Management Team Page| 23 James D. “Jim” Rickard, Director, President & CEO • 39 years of banking experience - more than 25 years as a Chief Executive Officer • Serves on numerous boards and is currently the Chairman of the Board of Directors at Baptist Health Kentucky Paul A. Chrisco, EVP & CFO • More than 21 years of banking experience • Held several financial officer and accounting - related positions within the Company, since 1997 Michael K. Bauer, EVP & Chief Credit Officer • More than 30 years of banking experience • Active board member and chairman - elect for the Indiana Bankers Association • Member of the National Regulatory Review Committee for the Independent Community Bankers of America Kevin J. Cecil, EVP - President of Indiana Market Division • 37 years of banking experience • President of the Indiana Market Banking Division of Community Bank of Southern Indiana

30 - 70 - 135 0 - 175 - 240 125 - 193 - 72 - CONFIDENTIAL - (1) Jim Rickard named President and Chief Executive Officer in August 2000. Company on the Move Page| 24 Acquisition of NCF Bank & Trust in Bardstown, KY 1998 1934 Bank opens as First Federal S&LA of New Albany 1991 Community Bank Shares of Indiana established as the nation’s first mutual holding company 1995 Company listed on the NASDAQ under ticker symbol: CBIN 2013 FDIC - acquisition of First Federal Bank in Lexington, KY 2006 Acquisition of Scott County State Bank in Scottsburg, IN 1996 Converted from Federal to State charter Significant Financial Milestones 1994 1998 2000 (1) 2003 2005 2006 2010 2011 2012 2013 Net Income ($mm): $1.6 $2.4 $2.7 $2.3 $3.7 $4.1 $7.0 $7.4 $7.7 $8.7 Total Assets ($mm): $205 $332 $416 $521 $665 $817 $801 $797 $820 $847 Total Deposits ($mm): $174 $213 $258 $341 $465 $550 $619 $581 $625 $644 No. of Branches: 6 8 10 15 16 21 21 21 21 24 Operating name of lead bank changed to Your Community Bank 2005 Jim Rickard named President & CEO 2000 Represents a calendar year when CBIN achieved record earnings.

30 - 70 - 135 0 - 175 - 240 125 - 193 - 72 - CONFIDENTIAL - 2013 Highlights Page| 25 Summary ▪ Record earnings of $8.7 million in 2013 » Net income has increased 30% , since 2011 » Net income available to common of $ 7.9 million (or $2.32 per share), after preferred dividend ▪ Loan growth of 20.5% ▪ Non - interest bearing deposit growth of 10.5% ▪ Net interest margin expansion for the 6th consecutive year ▪ Increased quarterly dividend to $0.11 per share in 2Q 2013 and to $0.12 in January 2014 ▪ Reduced nonperforming assets by 34% , since 2011 ‒ Largely driven by a reduction in non - accrual loans (51%) ▪ Stockholders rewarded with 49% return in 2013 and over 2% dividend yield Performance Metrics ▪ Return on Avg. Assets: 1.04% ▪ Return on Avg. Common Equity : 13.61% ▪ NIM: 4.24% ▪ Efficiency Ratio: 65.0% ▪ NPAs (Excl. TDRs) / Assets: 1.63%

30 - 70 - 135 0 - 175 - 240 125 - 193 - 72 - CONFIDENTIAL - 2013 Highlights - Continued… Page| 26 Franchise Growth ▪ We are committed to acting on growth opportunities that make strategic sense for us via acquisition and organically ▪ In April 2013, completed a FDIC - assisted acquisition of First Federal Bank of Lexington, KY » Added three new branches in Lexington, KY » $67.8 million in loans and $87.0 million in deposits ‒ Credit mark of $2.6 million or approximately 3.8% of loans acquired » Recorded a $1.9 million bargain purchase gain ▪ Opened a Scott County State Bank branch in Austin, IN Awards & Recognition ▪ In 2013, we received national honors for outstanding financial performance and regional awards for our strong corporate culture ▪ Among top - performing, publicly traded community banks under $2bn in assets (ranked #2 in Indiana for category) ‒ The American Banker magazine ‒ Based on average return on equity from 2010 to 2012 ▪ Received several awards in recognition of our strong corporate culture, which we believe drives our financial success ‒ Indiana Bankers Association, Indiana Chamber of Commerce, Business First Magazine, and more

30 - 70 - 135 0 - 175 - 240 125 - 193 - 72 - CONFIDENTIAL - Consistent Profitability Page| 27 Earnings per Share ($) 1.77 1.79 2.06 2.32 0.00 0.50 1.00 1.50 2.00 2.50 2010Y 2011Y 2012Y 2013Y

30 - 70 - 135 0 - 175 - 240 125 - 193 - 72 - CONFIDENTIAL - Low Cost Deposit Base Page| 28 Source: SNL Financial. Peer Group includes select publicly traded Midwest banks & thrifts with total assets from $750mm to $1.25bn. Cost of Deposits (%) Peer Group CBIN 0.88 0.65 0.36 0.18 1.20 0.87 0.62 0.67 0.00 0.25 0.50 0.75 1.00 1.25 2010Y 2011Y 2012Y 2013Y

30 - 70 - 135 0 - 175 - 240 125 - 193 - 72 - CONFIDENTIAL - Strong Net Interest Margin Page| 29 Net Interest Margin (%) Peer Group CBIN Source: SNL Financial. Peer Group includes select publicly traded Midwest banks & thrifts with total assets from $750mm to $1.25bn. 3.90 4.07 4.07 4.24 3.67 3.68 3.51 3.38 2.50 2.75 3.00 3.25 3.50 3.75 4.00 4.25 4.50 2010Y 2011Y 2012Y 2013Y
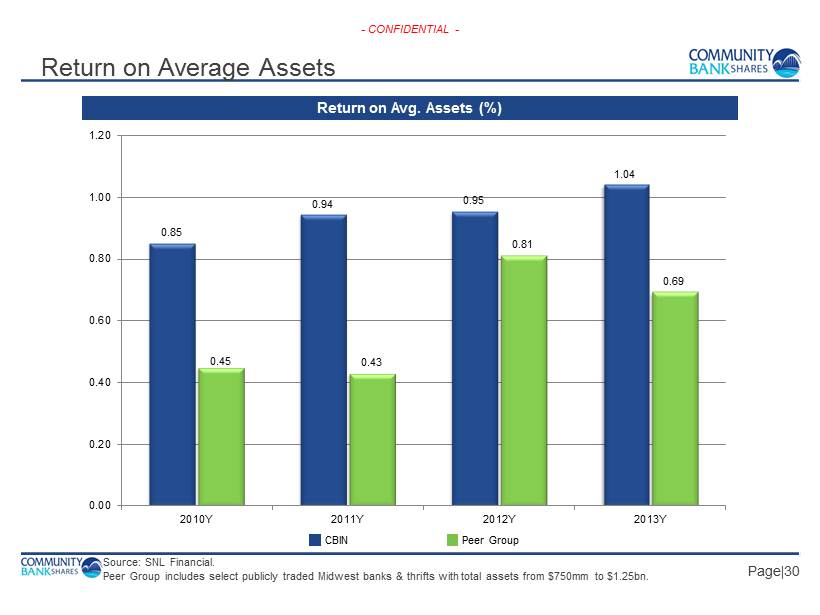
30 - 70 - 135 0 - 175 - 240 125 - 193 - 72 - CONFIDENTIAL - Return on Average Assets Return on Avg. Assets (%) Page| 30 Peer Group CBIN Source: SNL Financial. Peer Group includes select publicly traded Midwest banks & thrifts with total assets from $750mm to $1.25bn. 0.85 0.94 0.95 1.04 0.45 0.43 0.81 0.69 0.00 0.20 0.40 0.60 0.80 1.00 1.20 2010Y 2011Y 2012Y 2013Y

30 - 70 - 135 0 - 175 - 240 125 - 193 - 72 - CONFIDENTIAL - Above Average Shareholder Returns Return on Avg. Common Equity (%) Page| 31 Peer Group CBIN Source: SNL Financial. Peer Group includes select publicly traded Midwest banks & thrifts with total assets from $750mm to $1.25bn. 13.55 12.32 12.53 13.61 4.36 4.93 9.39 7.19 0.00 2.00 4.00 6.00 8.00 10.00 12.00 14.00 16.00 2010Y 2011Y 2012Y 2013Y
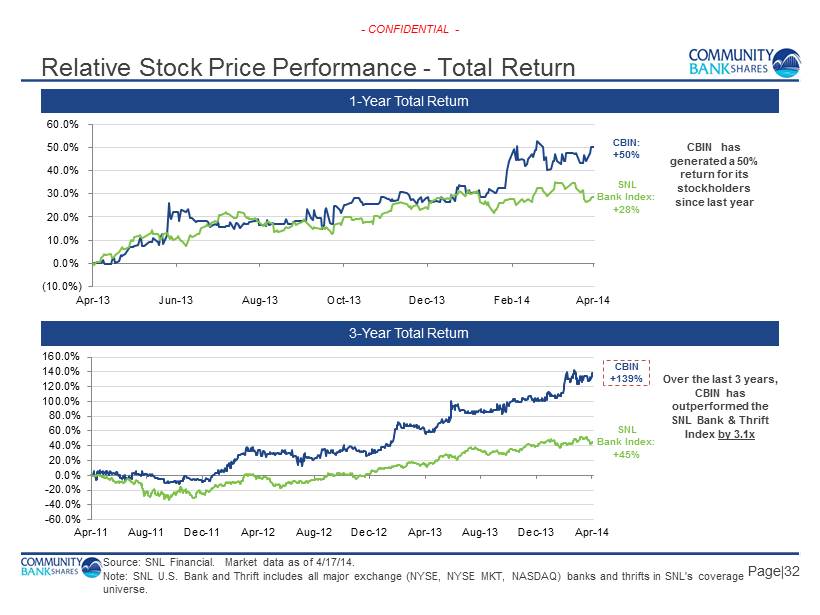
30 - 70 - 135 0 - 175 - 240 125 - 193 - 72 - CONFIDENTIAL - Source: SNL Financial. Market data as of 4/17/14. Note: SNL U.S. Bank and Thrift includes all major exchange (NYSE, NYSE MKT, NASDAQ) banks and thrifts in SNL's coverage universe. Relative Stock Price Performance - Total Return Page| 32 1 - Year Total Return 3 - Year Total Return CBIN: +50% SNL Bank Index: +28% CBIN has generated a 50% return for its stockholders since last year CBIN +139% SNL Bank Index: +45% Over the last 3 years, CBIN has outperformed the SNL Bank & Thrift Index by 3.1x (10.0%) 0.0% 10.0% 20.0% 30.0% 40.0% 50.0% 60.0% Apr-13 Jun-13 Aug-13 Oct-13 Dec-13 Feb-14 Apr-14 -60.0% -40.0% -20.0% 0.0% 20.0% 40.0% 60.0% 80.0% 100.0% 120.0% 140.0% 160.0% Apr-11 Aug-11 Dec-11 Apr-12 Aug-12 Dec-12 Apr-13 Aug-13 Dec-13 Apr-14