Attached files
| file | filename |
|---|---|
| 8-K - 8-K - Northwest Bancshares, Inc. | a14-10748_18k.htm |
Exhibit 99.1
|
|
[LOGO] |
|
|
NASDAQ: NWBI Current Market Value: $14.82 As of April 15, 2014 |
|
|
Forward-Looking Statements 3 This presentation contains forward-looking statements, which can be identified by the use of words such as “estimate,” “project,” “believe,” “intend,” “anticipate,” “plan,” “seek,” “expect” and words of similar meaning. These forward-looking statements include, but are not limited to: statements of our goals, intentions and expectations; statements regarding our business plans, prospects, growth and operating strategies; statements regarding the asset quality of our loan and investment portfolios; and estimates of our risks and future costs and benefits. These forward-looking statements are based on current beliefs and expectations of our management and are inherently subject to significant business, economic and competitive uncertainties and contingencies, many of which are beyond our control. In addition, these forward-looking statements are subject to assumptions with respect to future business strategies and decisions that are subject to change. The following factors, among others, could cause actual results to differ materially from the anticipated results or other expectations expressed in the forward-looking statements: changes in laws or government regulations or policies affecting financial institutions, including changes in regulatory fees and capital requirements; general economic conditions, either nationally or in our market areas, that are worse than expected; competition among depository and other financial institutions; inflation and changes in the interest rate environment that reduce our margins or reduce the fair value of financial instruments; adverse changes in the securities markets; our ability to enter new markets successfully and capitalize on growth opportunities; our ability to successfully integrate acquired entities, if any; changes in consumer spending, borrowing and savings habits; changes in our organization, compensation and benefit plans; our ability to continue to increase and manage our commercial and residential real estate, multi-family, and commercial and industrial loans; possible impairments of securities held by us, including those issued by government entities and government sponsored enterprises; the level of future deposit premium assessments; the impact of the current recession on our loan portfolio (including cash flow and collateral values), investment portfolio, customers and capital market activities; the impact of the current governmental effort to restructure the U.S. financial and regulatory system; changes in the financial performance and/or condition of our borrowers; and the effect of changes in accounting policies and practices, as may be adopted by the regulatory agencies, as well as the Securities and Exchange Commission, the Public Company Accounting Oversight Board, the Financial Accounting Standards Board and other accounting standard setters. Because of these and other uncertainties, our actual future results may be materially different from the results indicated by these forward-looking statements. |
|
|
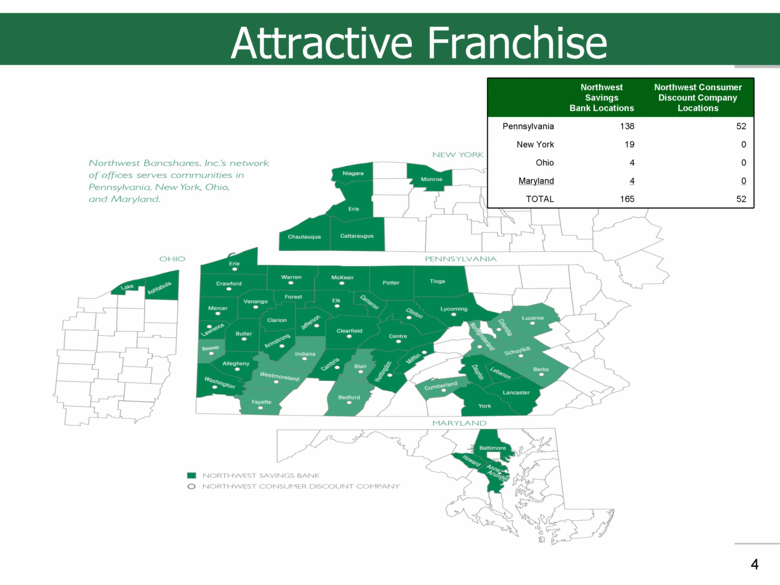
Attractive Franchise 4 Northwest Savings Bank Locations Northwest Consumer Discount Company Locations Pennsylvania 138 52 New York 19 0 Ohio 4 0 Maryland 4 0 TOTAL 165 52 |
|
|
5 Corporate Profile and Overview 165 retail banking locations 50 consumer finance locations ($109.2 mil in assets, $2.3 mil in net income for year ended 12/31/13) 2,043 full-time equivalent employees (1,855 full-time and 376 part-time employees) Total assets of $7.88 billion Net loans of $5.81 billion Deposits of $5.67 billion Tangible shareholders’ equity of $983.1 million Market Capitalization Market capitalization of $1.35 billion* Ranked 6th in market capitalization and 6th in total asset size among banks headquartered in Pennsylvania. Ranked approximately 74th in market cap and 110th in deposit size nationally. * Based on a market price of $14.32 per share. |
|
|
Highlights for 2013 Franchise – Improvement Opened full-service office in Zelienople, Butler County, PA Opened full-service office in Hershey, PA Consolidated office in Sykesville, PA with DuBois, PA office Closed drive-up facility in Oil City, PA Acquired the Bert Insurance Agency in Erie, PA which effectively doubled our insurance revenues Acquired Evans Capital Management in Erie, PA with assets under management of $240 million Upgraded most of our branch office ATMs to accept deposits Initiated a mobile banking application 6 |
|
|
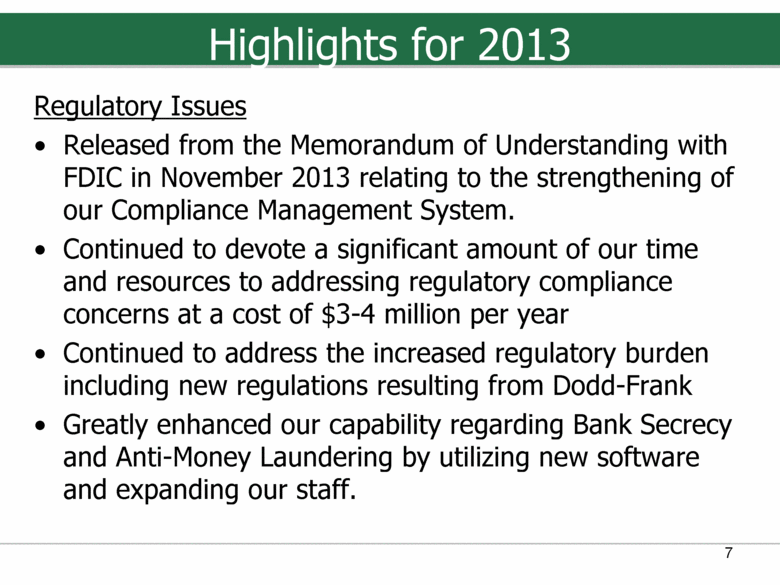
Highlights for 2013 Regulatory Issues Released from the Memorandum of Understanding with FDIC in November 2013 relating to the strengthening of our Compliance Management System. Continued to devote a significant amount of our time and resources to addressing regulatory compliance concerns at a cost of $3-4 million per year Continued to address the increased regulatory burden including new regulations resulting from Dodd-Frank Greatly enhanced our capability regarding Bank Secrecy and Anti-Money Laundering by utilizing new software and expanding our staff. 7 |
|
|
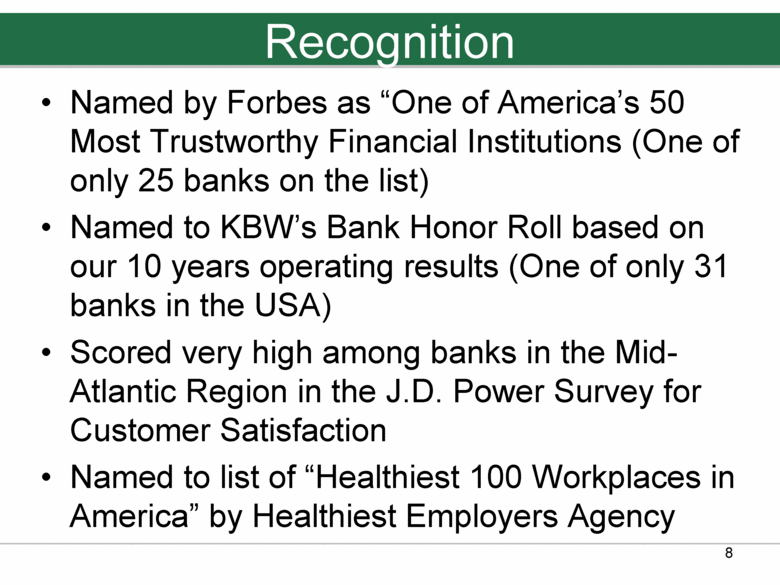
Recognition Named by Forbes as “One of America’s 50 Most Trustworthy Financial Institutions (One of only 25 banks on the list) Named to KBW’s Bank Honor Roll based on our 10 years operating results (One of only 31 banks in the USA) Scored very high among banks in the Mid-Atlantic Region in the J.D. Power Survey for Customer Satisfaction Named to list of “Healthiest 100 Workplaces in America” by Healthiest Employers Agency 8 |
|
|
Historic Performance |
|
|
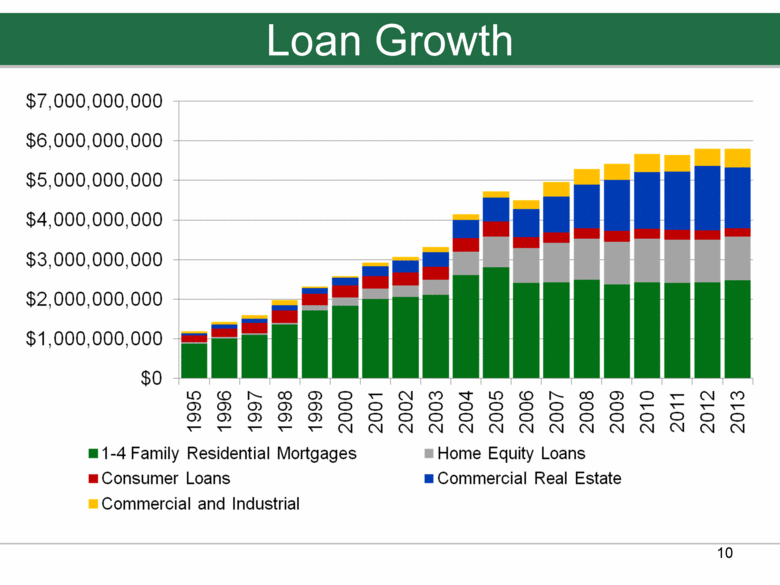
Loan Growth 10 |
|
|
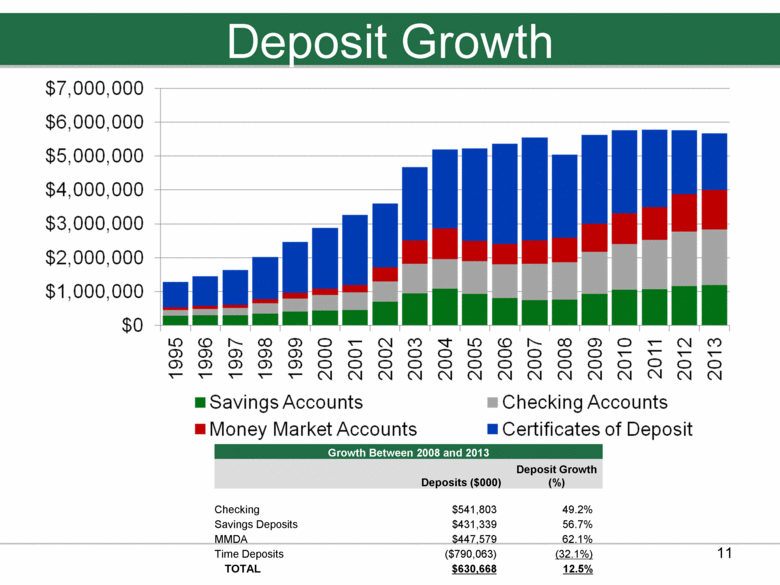
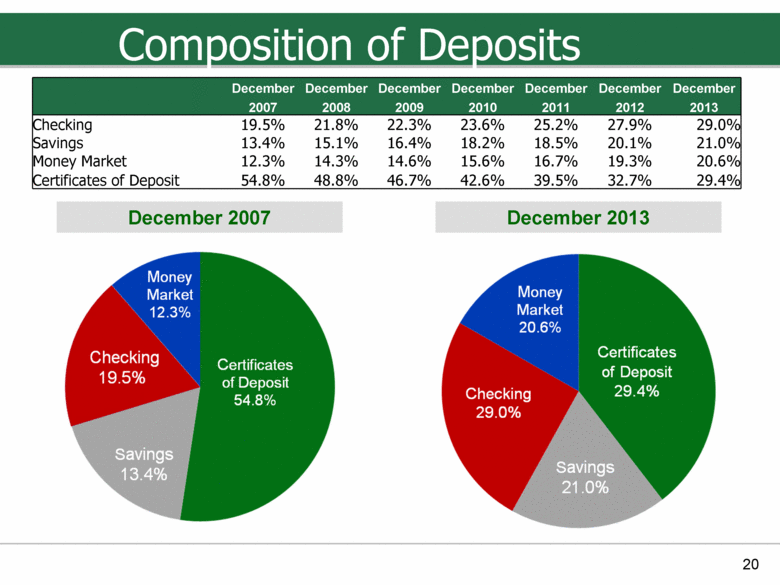
Deposit Growth 11 Growth Between 2008 and 2013 Deposits ($000) Deposit Growth (%) Checking $541,803 49.2% Savings Deposits $431,339 56.7% MMDA $447,579 62.1% Time Deposits ($790,063) (32.1%) TOTAL $630,668 12.5% |
|
|
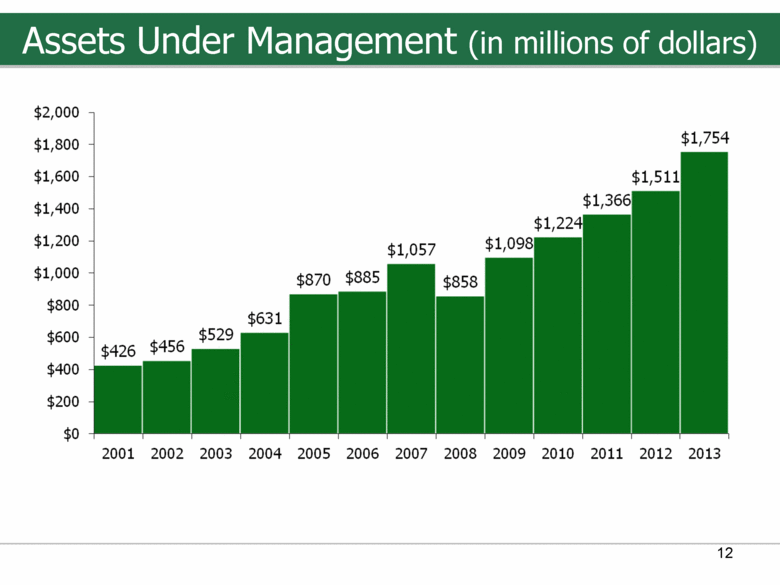
Assets Under Management (in millions of dollars) 12 |
|
|
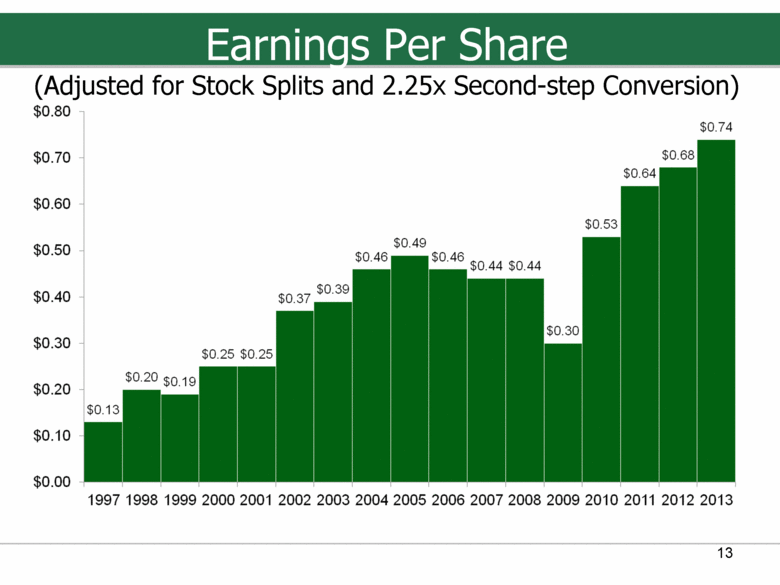
Earnings Per Share (Adjusted for Stock Splits and 2.25x Second-step Conversion) 13 |
|
|
Stock Performance and Per Share Information |
|
|
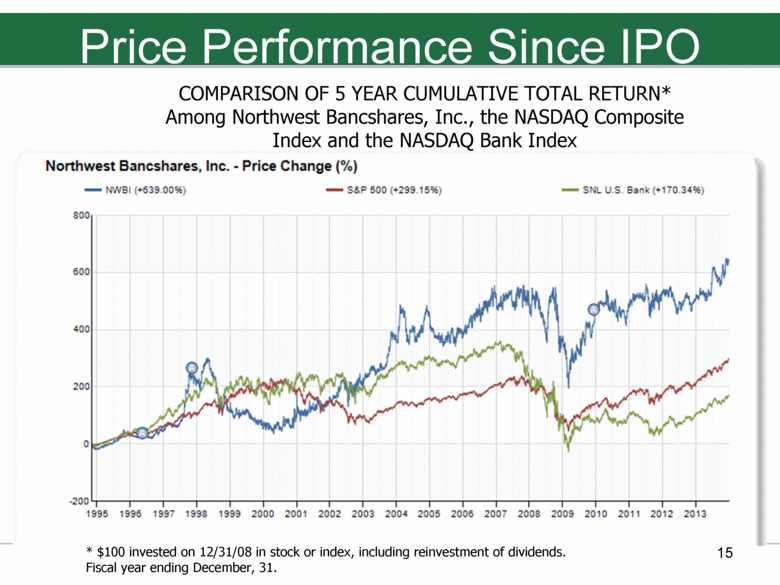
Price Performance Since IPO (11/4/94) 15 COMPARISON OF 5 YEAR CUMULATIVE TOTAL RETURN* Among Northwest Bancshares, Inc., the NASDAQ Composite Index and the NASDAQ Bank Index * $100 invested on 12/31/08 in stock or index, including reinvestment of dividends. Fiscal year ending December, 31. |
|
|
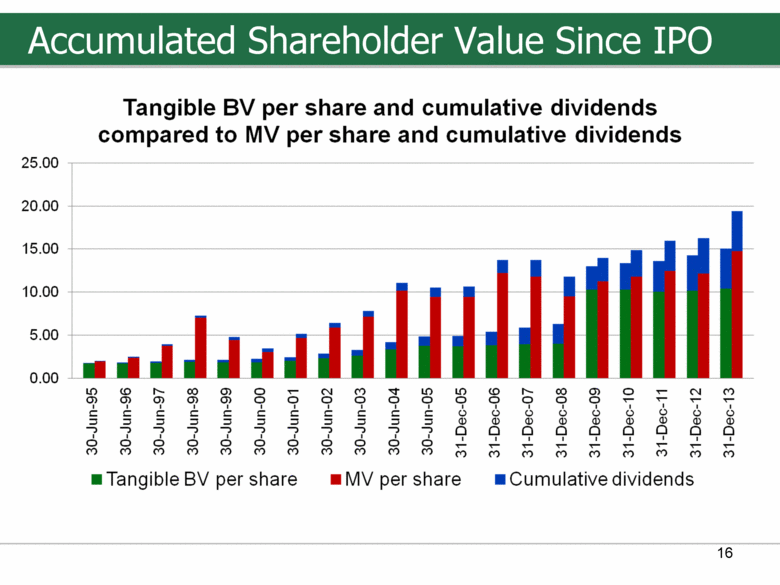
16 Accumulated Shareholder Value Since IPO |
|
|
Financial Performance |
|
|
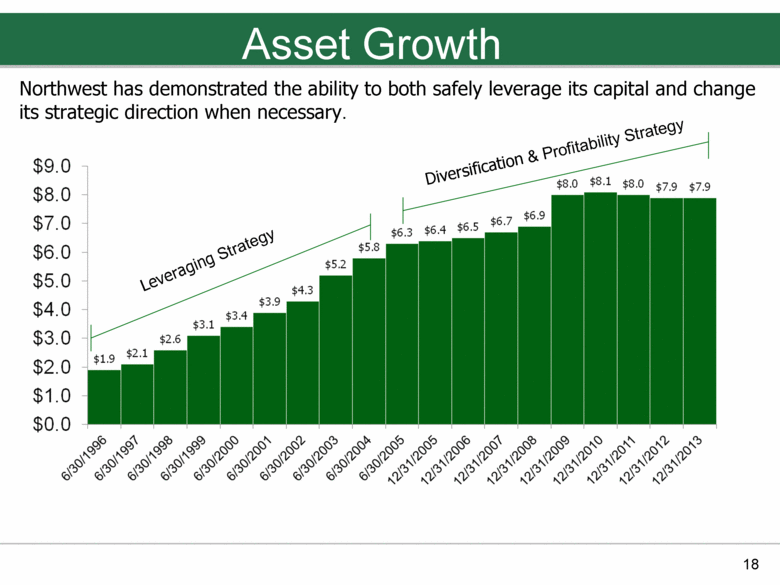
Asset Growth 18 Northwest has demonstrated the ability to both safely leverage its capital and change its strategic direction when necessary. Leveraging Strategy Diversification & Profitability Strategy |
|
|
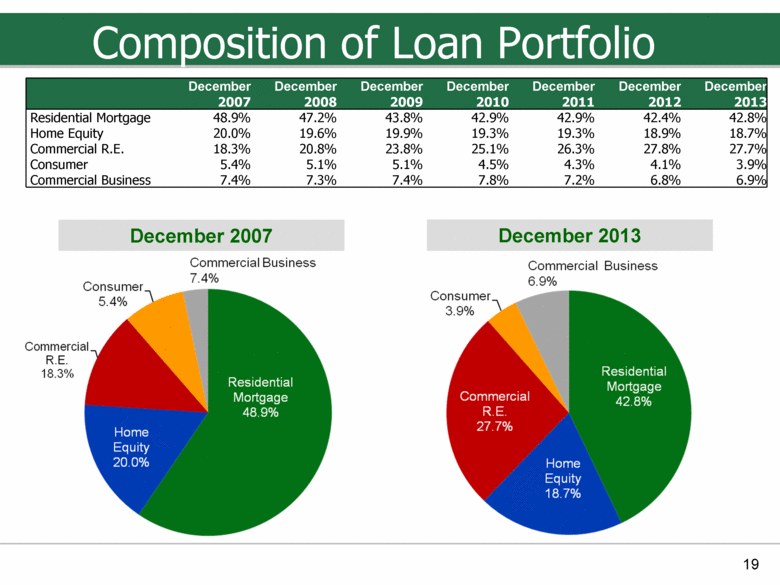
Composition of Loan Portfolio 19 December 2007 December 2013 December December December December December December December 2007 2008 2009 2010 2011 2012 2013 Residential Mortgage 48.9% 47.2% 43.8% 42.9% 42.9% 42.4% 42.8% Home Equity 20.0% 19.6% 19.9% 19.3% 19.3% 18.9% 18.7% Commercial R.E. 18.3% 20.8% 23.8% 25.1% 26.3% 27.8% 27.7% Consumer 5.4% 5.1% 5.1% 4.5% 4.3% 4.1% 3.9% Commercial Business 7.4% 7.3% 7.4% 7.8% 7.2% 6.8% 6.9% |
|
|
Composition of Deposits 20 20 December 2007 December 2013 December December December December December December December 2007 2008 2009 2010 2011 2012 2013 Checking 19.5% 21.8% 22.3% 23.6% 25.2% 27.9% 29.0% Savings 13.4% 15.1% 16.4% 18.2% 18.5% 20.1% 21.0% Money Market 12.3% 14.3% 14.6% 15.6% 16.7% 19.3% 20.6% Certificates of Deposit 54.8% 48.8% 46.7% 42.6% 39.5% 32.7% 29.4% |
|
|
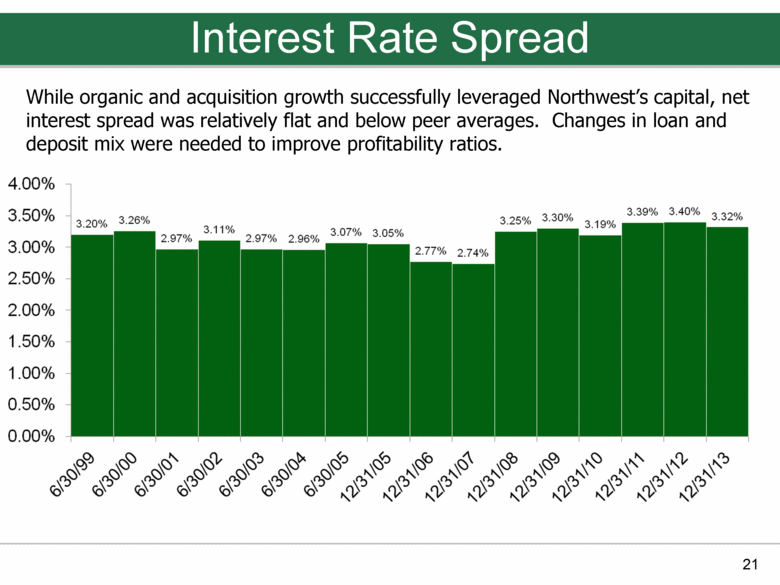
Interest Rate Spread 21 While organic and acquisition growth successfully leveraged Northwest’s capital, net interest spread was relatively flat and below peer averages. Changes in loan and deposit mix were needed to improve profitability ratios. |
|
|
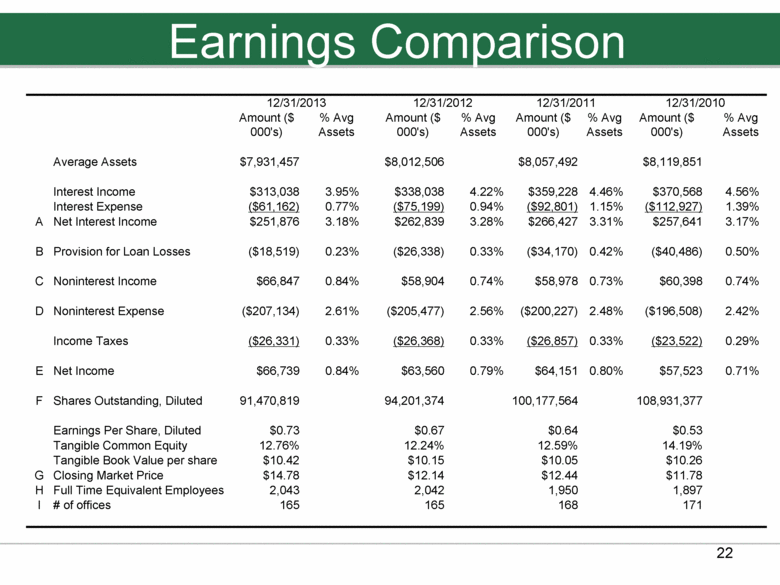
22 Earnings Comparison 12/31/2013 12/31/2012 12/31/2011 12/31/2010 Amount ($ 000's) % Avg Assets Amount ($ 000's) % Avg Assets Amount ($ 000's) % Avg Assets Amount ($ 000's) % Avg Assets Average Assets $7,931,457 $8,012,506 $8,057,492 $8,119,851 Interest Income $313,038 3.95% $338,038 4.22% $359,228 4.46% $370,568 4.56% Interest Expense ($61,162) 0.77% ($75,199) 0.94% ($92,801) 1.15% ($112,927) 1.39% A Net Interest Income $251,876 3.18% $262,839 3.28% $266,427 3.31% $257,641 3.17% B Provision for Loan Losses ($18,519) 0.23% ($26,338) 0.33% ($34,170) 0.42% ($40,486) 0.50% C Noninterest Income $66,847 0.84% $58,904 0.74% $58,978 0.73% $60,398 0.74% D Noninterest Expense ($207,134) 2.61% ($205,477) 2.56% ($200,227) 2.48% ($196,508) 2.42% Income Taxes ($26,331) 0.33% ($26,368) 0.33% ($26,857) 0.33% ($23,522) 0.29% E Net Income $66,739 0.84% $63,560 0.79% $64,151 0.80% $57,523 0.71% F Shares Outstanding, Diluted 91,470,819 94,201,374 100,177,564 108,931,377 Earnings Per Share, Diluted $0.73 $0.67 $0.64 $0.53 Tangible Common Equity 12.76% 12.24% 12.59% 14.19% Tangible Book Value per share $10.42 $10.15 $10.05 $10.26 G Closing Market Price $14.78 $12.14 $12.44 $11.78 H Full Time Equivalent Employees 2,043 2,042 1,950 1,897 I # of offices 165 165 168 171 |
|
|
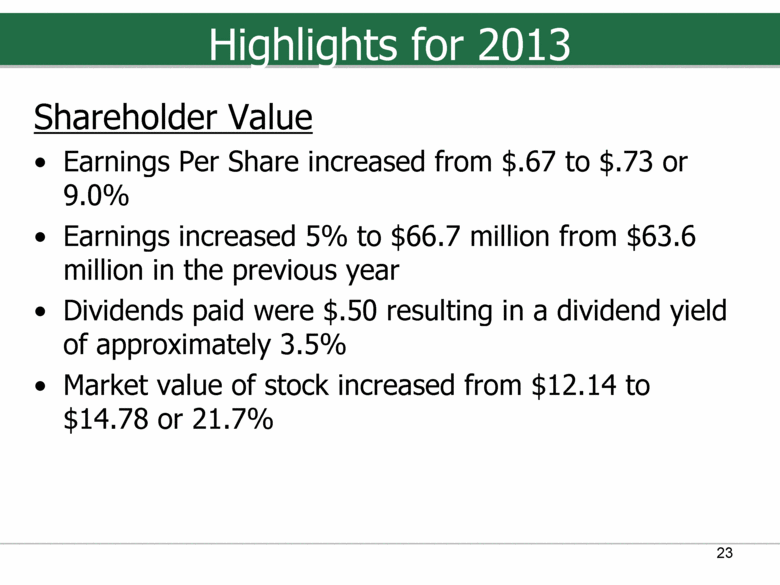
Highlights for 2013 Shareholder Value Earnings Per Share increased from $.67 to $.73 or 9.0% Earnings increased 5% to $66.7 million from $63.6 million in the previous year Dividends paid were $.50 resulting in a dividend yield of approximately 3.5% Market value of stock increased from $12.14 to $14.78 or 21.7% 23 |
|
|
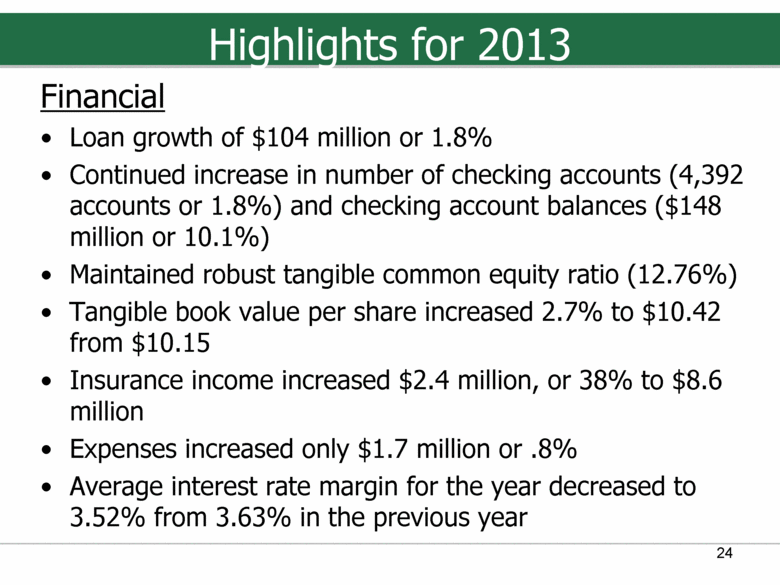
Highlights for 2013 Financial Loan growth of $104 million or 1.8% Continued increase in number of checking accounts (4,392 accounts or 1.8%) and checking account balances ($148 million or 10.1%) Maintained robust tangible common equity ratio (12.76%) Tangible book value per share increased 2.7% to $10.42 from $10.15 Insurance income increased $2.4 million, or 38% to $8.6 million Expenses increased only $1.7 million or .8% Average interest rate margin for the year decreased to 3.52% from 3.63% in the previous year 24 |
|
|
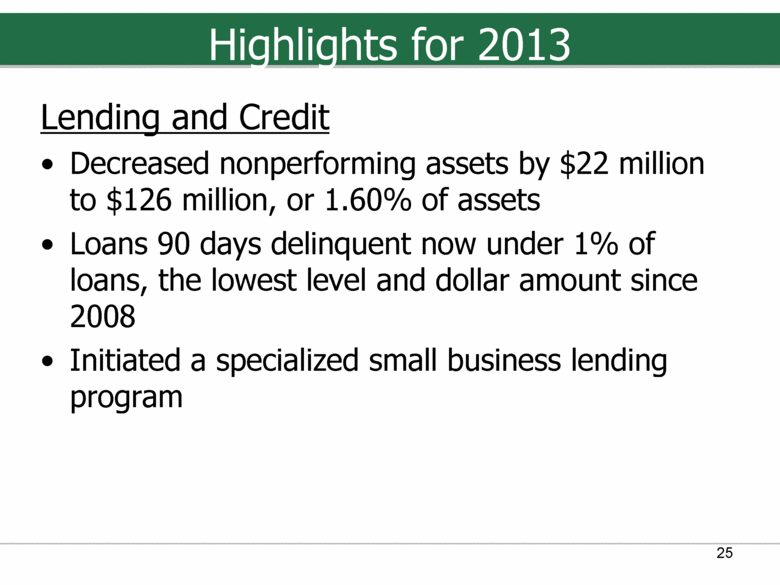
Highlights for 2013 Lending and Credit Decreased nonperforming assets by $22 million to $126 million, or 1.60% of assets Loans 90 days delinquent now under 1% of loans, the lowest level and dollar amount since 2008 Initiated a specialized small business lending program 25 |
|
|
Asset Quality |
|
|
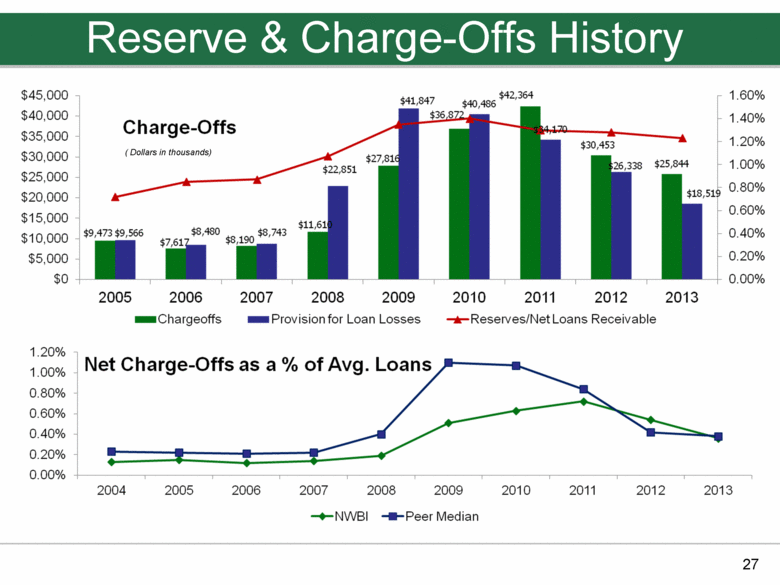
Reserve & Charge-Offs History 27 ( Dollars in thousands) |
|
|
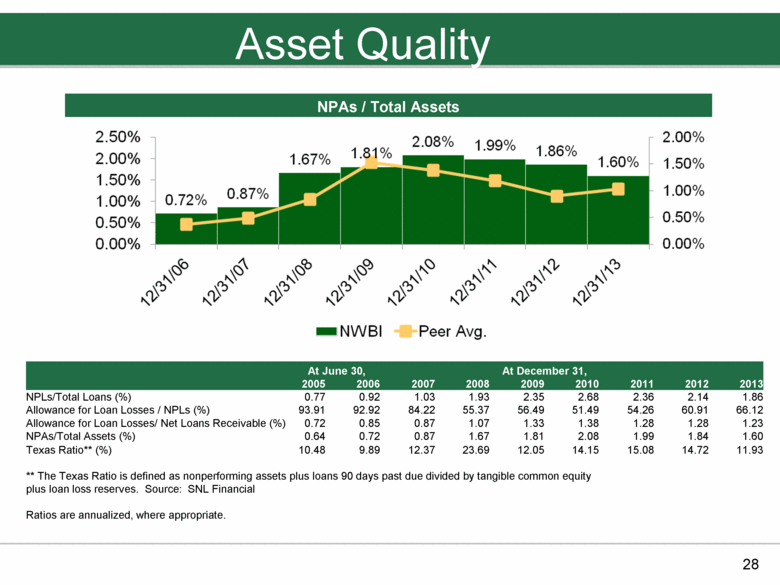
Asset Quality 28 NPAs / Total Assets At June 30, At December 31, 2005 2006 2007 2008 2009 2010 2011 2012 2013 NPLs/Total Loans (%) 0.77 0.92 1.03 1.93 2.35 2.68 2.36 2.14 1.86 Allowance for Loan Losses / NPLs (%) 93.91 92.92 84.22 55.37 56.49 51.49 54.26 60.91 66.12 Allowance for Loan Losses/ Net Loans Receivable (%) 0.72 0.85 0.87 1.07 1.33 1.38 1.28 1.28 1.23 NPAs/Total Assets (%) 0.64 0.72 0.87 1.67 1.81 2.08 1.99 1.84 1.60 Texas Ratio** (%) 10.48 9.89 12.37 23.69 12.05 14.15 15.08 14.72 11.93 ** The Texas Ratio is defined as nonperforming assets plus loans 90 days past due divided by tangible common equity plus loan loss reserves. Source: SNL Financial Ratios are annualized, where appropriate. |
|
|
Looking Ahead |
|
|
Management of Capital |
|
|
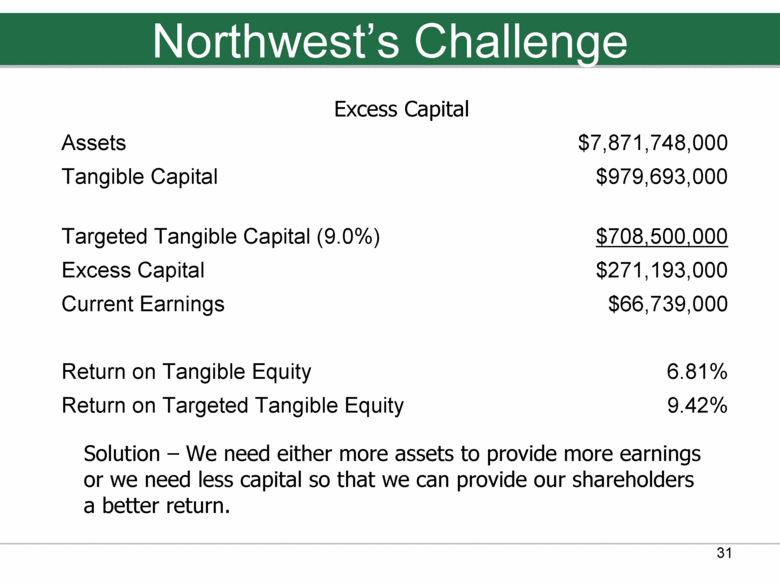
Northwest’s Challenge Excess Capital Assets $7,871,748,000 Tangible Capital $979,693,000 Targeted Tangible Capital (9.0%) $708,500,000 Excess Capital $271,193,000 Current Earnings $66,739,000 Return on Tangible Equity 6.81% Return on Targeted Tangible Equity 9.42% 31 Solution – We need either more assets to provide more earnings or we need less capital so that we can provide our shareholders a better return. |
|
|
Solution to Excess Capital Challenge Grow Assets Internal deposit and loan growth Acquisition of Other Banks or Branches of Other Banks– when they can be completed without significantly diluting tangible book value per share and when the earn back period is within acceptable parameters Return Capital to Our Shareholders Stock Buybacks At approximately 140% of tangible book value, purchases are excessively dilutive to our shareholders and the earn back period is not within acceptable parameters ($14.78 versus $10.40). Continue to pay aggressive dividends 32 |
|
|
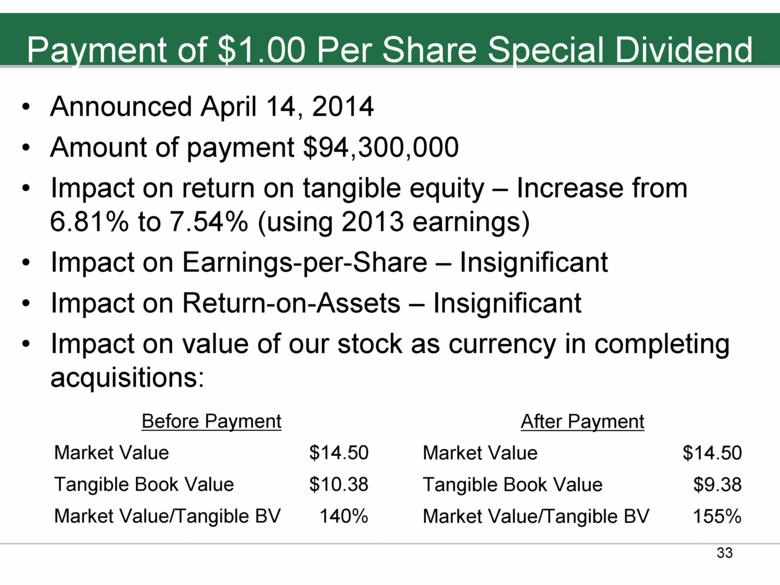
Payment of $1.00 Per Share Special Dividend Announced April 14, 2014 Amount of payment $94,300,000 Impact on return on tangible equity – Increase from 6.81% to 7.54% (using 2013 earnings) Impact on Earnings-per-Share – Insignificant Impact on Return-on-Assets – Insignificant Impact on value of our stock as currency in completing acquisitions: 33 Before Payment Market Value $14.50 Tangible Book Value $10.38 Market Value/Tangible BV 140% After Payment Market Value $14.50 Tangible Book Value $9.38 Market Value/Tangible BV 155% |
|
|
Payment of $1.00 Per Share Special Dividend Other Benefits: Provides cash to our shareholders at a time when cash flow and dividend yield are sorely needed Provides opportunity for investors to reinvest dividends in additional Northwest shares or alternative investments 34 |
|
|
Strategic Goals |
|
|
Strategic Focus Mission Building Loyalty, Trust and Value among our Employees, Customers, Communities and Shareholders Issues Critical to Our Goals to Enhance Shareholder Value Achieving higher levels of profitability Achieving necessary level of loan growth Continuing to grow our fee based businesses (wealth management and insurance) Achieving a higher level of efficiency Deployment of excess capital Capitalizing on opportunities created by shale gas exploration in our footprint 36 |


