Attached files
| file | filename |
|---|---|
| 8-K - 8-K - FIRST HORIZON CORP | d711394d8k.htm |
Exhibit 99.1

FIRST QUARTER 2014
FINANCIAL SUPPLEMENT
If you need further information, please contact:
Aarti Bowman, Investor Relations
901-523-4017
aagoorha@firsthorizon.com
FHN TABLE OF CONTENTS
| Page | ||||
| First Horizon National Corporation Segment Structure |
3 | |||
| Performance Highlights |
4 | |||
| Consolidated Results |
||||
| Income Statement |
||||
| Income Statement |
6 | |||
| Other Income and Other Expense |
7 | |||
| Balance Sheet |
||||
| Period End Balance Sheet |
8 | |||
| Average Balance Sheet |
9 | |||
| Net Interest Income |
10 | |||
| Average Balance Sheet: Yields and Rates |
11 | |||
| Capital Highlights |
12 | |||
| Business Segment Detail |
||||
| Segment Highlights |
13 | |||
| Regional Banking |
14 | |||
| Capital Markets and Corporate |
15 | |||
| Non-Strategic |
16 | |||
| Asset Quality |
||||
| Asset Quality: Consolidated |
17 | |||
| Asset Quality: Regional Banking and Corporate |
19 | |||
| Asset Quality: Non-Strategic |
20 | |||
| Portfolio Metrics |
21 | |||
| Non-GAAP to GAAP Reconciliation |
22 | |||
| Glossary of Terms |
23 | |||
Other Information
This financial supplement contains forward-looking statements involving significant risks and uncertainties. A number of important factors could cause actual results to differ materially from those in the forward-looking information. Those factors include general economic and financial market conditions, including expectations of and actual timing and amount of interest rate movements including the slope of the yield curve, competition, customer and investor responses to these conditions, ability to execute business plans, geopolitical developments, recent and future legislative and regulatory developments, natural disasters, and items mentioned in this financial supplement and in First Horizon National Corporation’s (“FHN”) most recent press release, as well as critical accounting estimates and other factors described in FHN’s recent filings with the SEC. FHN disclaims any obligation to update any such factors or to publicly announce the result of any revisions to any of the forward-looking statements included herein or therein to reflect future events or developments.
Use of Non-GAAP Measures
Certain ratios are included in this financial supplement that are non-GAAP, meaning they are not presented in accordance with generally accepted accounting principles (“GAAP”) in the U.S. FHN’s management believes such ratios are relevant to understanding the capital position and results of the Company. The non-GAAP ratios presented in this financial supplement are tangible common equity (“TCE”) to tangible assets (“TA”), tangible book value per common share, tier 1 common to risk weighted assets (“RWA”), adjusted tangible common equity to risk weighted assets, pre-tax pre-provision net revenue (“PPNR”), and net interest margin using net interest income adjusted for fully taxable equivalent (“FTE”). These ratios are reported to FHN’s management and Board of Directors through various internal reports. Additionally, disclosure of non-GAAP capital ratios provides a meaningful base for comparability to other financial institutions as demonstrated by their use by the various banking regulators in reviewing the capital adequacy of financial institutions. Non-GAAP measures are not formally defined by GAAP or codified in currently effective federal banking regulations, and other entities may use calculation methods that differ from those used by FHN. Tier 1 capital is a regulatory term and is generally defined as the sum of core capital (including common equity and instruments that can not be redeemed at the option of the holder) adjusted for certain items under risk based capital regulations. Also a regulatory term, risk weighted assets includes total assets adjusted for credit risk and is used to determine regulatory capital ratios. Refer to the tabular reconciliation of non-GAAP to GAAP measures and presentation of the most comparable GAAP items on page 22 of this financial supplement.
| FIRST HORIZON NATIONAL CORPORATION SEGMENT STRUCTURE |

|
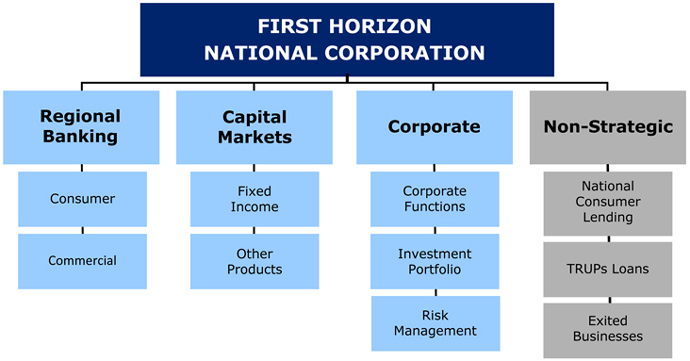
3
FHN PERFORMANCE HIGHLIGHTS
Summary of First Quarter 2014 Significant Items
| Segment | Item | Income Statement | Amount | Comments | ||||
| Non-Strategic | Sale of Mortgage Servicing Rights | Mortgage banking | $20.0 million | Pre-tax income associated with the receipt of previously unrecognized servicing fees in conjunction with servicing sale | ||||
| Corporate | Investment securities gain | Securities gains/(losses) | $5.6 million | Pre-tax gain related to the sale of a cost method investment | ||||
| Non-Strategic | On-balance sheet consumer loan securitizations | Gain/(loss) on debt extinguishment & Mortgage banking | $(6.4) million | Net pre-tax loss on the resolution/deconsolidation of three previously consolidated on-balance sheet consumer loan securitizations | ||||
| Corporate & Non-Strategic | Restructuring, Repositioning, and Efficiency Initiatives | Primarily Occupancy & Employee compensation, incentives, and benefits | $(5.7) million | Primarily pre-tax expense associated with a lease abandonment and severance-related costs associated with efficiency initiatives within corporate and bank service functions | ||||
First Quarter 2014 vs. Fourth Quarter 2013
Consolidated
| • | Net income available to common shareholders was $44.9 million, or $.19 per diluted share in first quarter, compared to $49.4 million, or $.21 per diluted share in prior quarter |
| • | NII decreased to $152.4 million in first quarter from $157.1 million in fourth quarter; NIM decreased to 2.88 percent from 2.98 percent in the prior quarter |
| • | NII was affected by a number of factors including fewer days in first quarter compared to fourth quarter and lower loan balances |
| • | A linked quarter decline in accretion from acquired loans and elevated excess cash held at the Fed during the quarter negatively affected NIM in first quarter |
| • | Noninterest income (including securities gains) increased to $145.7 million in first quarter from $135.0 million in fourth quarter |
| • | The increase was largely driven by additional servicing fees received in conjunction with the servicing sale and securities gains in first quarter |
| • | Noninterest expense decreased $36.9 million to $220.2 million in first quarter |
| • | The decline in expense is largely due to litigation accruals recognized in fourth quarter related to legacy businesses combined with lower personnel expenses across various segments |
| • | Average loans were $15.1 billion in first quarter compared to $15.3 billion in fourth quarter; period-end loans declined 2 percent to $15.1 billion |
Regional Banking
| • | Pre-tax income was $56.0 million in first quarter compared to $67.5 million in fourth quarter; PPNR was $69.0 million and $70.0 million in first and fourth quarters, respectively |
| • | Average core deposits increased to $14.9 billion in first quarter from $14.5 billion in fourth quarter; period-end core deposits increased 2 percent to $15.2 billion |
| • | Period-end loans decreased 1 percent, or $129.6 million to $12.0 billion in first quarter primarily driven by declines in loans to mortgage companies due to a reduction in refinance volume driven by higher rates |
| • | NII was $142.0 million in first quarter compared to $146.4 million in fourth quarter |
| • | The decrease in NII is primarily attributable to the impact of day variance relative to fourth quarter, a decline in accretion on acquired loans, and a decline in loans to mortgage companies, partially offset by cash basis interest income |
| • | Loan loss provision was $13.0 million in first quarter compared to $2.6 million in prior quarter |
| • | Generally, first quarter provision was affected by further refinement to the credit card reserving process as well as macro-economic factors |
| • | Noninterest income was $60.0 million in first quarter compared to $62.8 million in fourth quarter |
| • | Deposit fee income decreased primarily due to seasonality in non-sufficient funds (“NSF”) fee structure |
| • | Noninterest expense declined to $133.1 million in first quarter from $139.2 million in the prior quarter |
| • | Fourth quarter included charges associated with branch closings and higher professional fees |
Capital Markets
| • | Fixed income revenue decreased to $49.6 million in first quarter from $50.9 million in fourth quarter |
| • | Fixed income average daily revenue (“ADR”) was $.8 million in first and fourth quarters |
| • | Noninterest expense decreased to $52.6 million in first quarter from $53.1 million in fourth quarter |
| • | The expense decrease was primarily due to a decline in variable compensation costs partially offset by FICA reset |
Corporate
| • | NII was negative $9.1 million in first quarter compared to negative $10.4 million in the prior quarter |
| • | Estimated effective duration of the securities portfolio was 3.7 years in first quarter compared to 3.8 years in fourth quarter |
| • | Estimated modified duration of the securities portfolio was 4.0 years in first and fourth quarters |
| • | Noninterest income increased to $13.2 million in first quarter from $7.8 million in fourth quarter |
| • | First quarter and fourth quarter include gains of $5.6 million and $3.3 million, respectively, on the sale of cost method investments; Fourth quarter also included $1.1 million other-than-temporary impairment of another investment |
| • | First quarter fee income also increased due to $2.8 million of BOLI policy benefits received |
| • | Noninterest expense was $19.6 million in first quarter compared to $18.8 million in the prior quarter |
| • | Increase driven by a lease abandonment expense and elevated advertising expense related to FHN’s 150 year celebration campaign, partially offset by a decline in personnel expense |
4
FHN PERFORMANCE HIGHLIGHTS (continued)
First Quarter 2014 vs. Fourth Quarter 2013
Non-Strategic
| • | Pre-tax income was $19.7 million in first quarter compared to a pre-tax loss of $36.7 million in fourth quarter |
| • | Provision credit of $3.0 million in first quarter compared to provision expense of $12.4 million in prior quarter |
| • | Provision credit in first quarter primarily driven by a net reserve decrease related to trust preferred loan (“TRUPs”) sales partially offset by provision associated with the consumer portfolios |
| • | Noninterest income was $15.8 million in first quarter compared to $4.9 million in fourth quarter |
| • | Increase primarily due to higher servicing income in first quarter resulting from the receipt of previously unrecognized servicing fees in conjunction with the servicing sale |
| • | This increase was partially offset by a $4.4 million loss on extinguishment of debt associated with the collapse of 2 HELOC trusts and a $2.0 million loss associated with the deconsolidation of a securitization trust |
| • | Noninterest expense was $15.0 million in first quarter compared to $46.0 million in the prior quarter |
| • | Fourth quarter included a $30.0 million reversal of mortgage repurchase and foreclosure provision expense and $57.0 million of net loss accruals related to legal matters |
Asset Quality
| • | The provision for loan losses declined to $10.0 million in first quarter from $15.0 million in fourth quarter |
| • | In first quarter, 3 TRUPs (2 relationships) that were on interest deferral within the non-strategic segment were sold which favorably affected NPL and ALLL levels and resulted in $3.1 million in charge-offs |
| • | The sales contributed to a $23.7 million decline in C&I NPLs |
| • | Reserves declined $8.4 million and after charge-offs, resulted in net reserve release of $5.3 million |
| • | Net charge-offs (“NCOs”) were $16.6 million in first quarter compared to $16.9 million in prior quarter |
| • | Annualized net charge-offs were relatively flat at 45 basis points of average loans |
| • | A decline in NCOs within regional bank C&I mostly offset charge-offs associated with the TRUPs sales |
| • | The allowance as a percentage of loans ratio was relatively flat at 164 basis points in first quarter compared to 165 basis points in prior quarter |
| • | Total reserves decreased to $247.2 million from $253.8 million in fourth quarter |
| • | The net decline in reserves was driven by a $8.8 million commercial reserve release, partially offset by $2.2 million net reserve increase in the consumer portfolios |
| • | The consumer allowance increase was largely driven by a reserve build in the regional bank credit card and other portfolio |
| • | Nonperforming loans (“NPLs”) in the portfolio declined $14.1 million to $240.9 million |
| • | Total commercial NPLs declined $30.6 million largely driven by the TRUPs sales |
| • | The decline was partially offset by an increase in nonaccruing junior liens |
| • | Nonperforming assets (“NPAs”), including loans held-for-sale, decreased to $345.5 million in first quarter from $361.9 million in prior quarter |
| • | Total 30+ delinquencies were $106.0 million in first quarter compared to $102.6 million in prior quarter |
| • | The increase in 30+ delinquencies was largely driven by C&I and Income CRE loans within the regional banking segment |
| • | CRE delinquencies primarily driven by 2 larger purchase credit impaired loans from the Mountain National Bank (“MNB”) acquisition |
| • | C&I delinquencies primarily driven by 1 credit |
| • | Permanent mortgage and consumer real estate delinquencies decreased $15.4 million in first quarter which more than offset an uptick in credit card delinquencies |
| • | Troubled debt restructurings (“TDRs”) were $490.4 million at the end of first quarter compared with $487.9 million in prior quarter |
Taxes
| • | The effective tax rate for first quarter is 27.47 percent which reflects forecasted taxable income for the year and the favorable effect on the tax rate from permanent benefits |
| • | Permanent differences primarily consist of: tax credit investments, life insurance, tax-exempt interest, and a decrease in the capital loss deferred tax valuation allowance |
Capital and Liquidity
| • | Paid $0.05 per common share dividend on April 1, 2014 |
| • | Approved a $100.0 million common share purchase program in January 2014; Terminated the older program, originally announced in 2011 |
| • | Paid preferred quarterly dividend of $1.6 million on April 10, 2014 |
| • | Capital ratios (regulatory capital ratios estimated based on period-end balances) |
| • | 8.37 percent for tangible common equity to tangible assets |
| • | 14.20 percent for Tier 1 |
| • | 16.24 percent for Total Capital |
| • | 11.06 percent for Tier 1 Common |
| • | 11.19 percent for Leverage |
5
FHN CONSOLIDATED INCOME STATEMENT
Quarterly, Unaudited
| 1Q14 Changes vs. | ||||||||||||||||||||||||||||
| (Dollars in thousands, except per share data) |
1Q14 | 4Q13 | 3Q13 | 2Q13 | 1Q13 | 4Q13 | 1Q13 | |||||||||||||||||||||
| Interest income |
$ | 173,584 | $ | 179,053 | $ | 182,610 | $ | 183,991 | $ | 186,399 | (3 | )% | (7 | )% | ||||||||||||||
| Less: interest expense |
21,225 | 21,918 | 23,772 | 23,972 | 25,017 | (3 | )% | (15 | )% | |||||||||||||||||||
|
|
|
|
|
|
|
|
|
|
|
|
|
|
|
|||||||||||||||
| Net interest income |
152,359 | 157,135 | 158,838 | 160,019 | 161,382 | (3 | )% | (6 | )% | |||||||||||||||||||
| Provision for loan losses |
10,000 | 15,000 | 10,000 | 15,000 | 15,000 | (33 | )% | (33 | )% | |||||||||||||||||||
|
|
|
|
|
|
|
|
|
|
|
|
|
|
|
|||||||||||||||
| Net interest income after provision for loan losses |
142,359 | 142,135 | 148,838 | 145,019 | 146,382 | * | (3 | )% | ||||||||||||||||||||
|
|
|
|
|
|
|
|
|
|
|
|
|
|
|
|||||||||||||||
| Noninterest income: |
||||||||||||||||||||||||||||
| Capital markets (a) |
56,840 | 59,653 | 64,283 | 69,265 | 79,163 | (5 | )% | (28 | )% | |||||||||||||||||||
| Deposit transactions and cash management |
26,456 | 29,194 | 29,279 | 28,254 | 27,656 | (9 | )% | (4 | )% | |||||||||||||||||||
| Brokerage, management fees and commissions |
12,276 | 11,505 | 10,868 | 10,540 | 9,348 | 7 | % | 31 | % | |||||||||||||||||||
| Mortgage banking (b) |
19,029 | 3,853 | 14,460 | 5,589 | 9,373 | NM | NM | |||||||||||||||||||||
| Trust services and investment management |
6,744 | 6,596 | 6,649 | 6,950 | 6,328 | 2 | % | 7 | % | |||||||||||||||||||
| Bankcard income |
4,520 | 4,998 | 5,303 | 5,299 | 4,882 | (10 | )% | (7 | )% | |||||||||||||||||||
| Bank owned life insurance (c) |
6,032 | 3,636 | 3,560 | 3,946 | 5,472 | 66 | % | 10 | % | |||||||||||||||||||
| Other service charges |
2,845 | 3,144 | 3,707 | 3,503 | 3,086 | (10 | )% | (8 | )% | |||||||||||||||||||
| Insurance commissions |
437 | 960 | 733 | 730 | 600 | (54 | )% | (27 | )% | |||||||||||||||||||
| Securities gains/(losses), net (d) |
5,657 | 2,183 | (96 | ) | (351 | ) | 24 | NM | NM | |||||||||||||||||||
| Gain/(loss) on divestitures |
— | (4 | ) | 115 | — | — | NM | NM | ||||||||||||||||||||
| Other (e) |
4,894 | 9,325 | 11,614 | 8,907 | 10,495 | (48 | )% | (53 | )% | |||||||||||||||||||
|
|
|
|
|
|
|
|
|
|
|
|
|
|
|
|||||||||||||||
| Total noninterest income |
145,730 | 135,043 | 150,475 | 142,632 | 156,427 | 8 | % | (7 | )% | |||||||||||||||||||
|
|
|
|
|
|
|
|
|
|
|
|
|
|
|
|||||||||||||||
| Adjusted gross income after provision for loan losses |
288,089 | 277,178 | 299,313 | 287,651 | 302,809 | 4 | % | (5 | )% | |||||||||||||||||||
|
|
|
|
|
|
|
|
|
|
|
|
|
|
|
|||||||||||||||
| Noninterest expense: |
||||||||||||||||||||||||||||
| Employee compensation, incentives, and benefits |
119,229 | 127,144 | 132,213 | 130,500 | 139,184 | (6 | )% | (14 | )% | |||||||||||||||||||
| Repurchase and foreclosure provision |
— | (30,000 | ) | 200,000 | — | — | NM | NM | ||||||||||||||||||||
| Legal and professional fees |
15,039 | 15,419 | 12,704 | 14,065 | 11,171 | (2 | )% | 35 | % | |||||||||||||||||||
| Occupancy (f) |
17,592 | 12,811 | 13,147 | 11,785 | 12,822 | 37 | % | 37 | % | |||||||||||||||||||
| Computer software |
10,656 | 10,197 | 10,446 | 9,608 | 10,076 | 5 | % | 6 | % | |||||||||||||||||||
| Contract employment and outsourcing (g) |
4,325 | 9,059 | 9,241 | 8,581 | 9,039 | (52 | )% | (52 | )% | |||||||||||||||||||
| Operations services |
8,982 | 9,104 | 9,199 | 8,842 | 8,070 | (1 | )% | 11 | % | |||||||||||||||||||
| Equipment rentals, depreciation, and maintenance |
7,849 | 8,431 | 7,890 | 7,597 | 7,820 | (7 | )% | * | ||||||||||||||||||||
| FDIC premium expense |
3,991 | 4,477 | 4,631 | 5,037 | 6,011 | (11 | )% | (34 | )% | |||||||||||||||||||
| Advertising and public relations |
5,908 | 4,685 | 5,486 | 4,121 | 3,947 | 26 | % | 50 | % | |||||||||||||||||||
| Communications and courier |
4,224 | 4,473 | 4,517 | 4,531 | 4,437 | (6 | )% | (5 | )% | |||||||||||||||||||
| Foreclosed real estate |
784 | 1,050 | 523 | 1,287 | 1,439 | (25 | )% | (46 | )% | |||||||||||||||||||
| Amortization of intangible assets |
982 | 1,128 | 928 | 928 | 928 | (13 | )% | 6 | % | |||||||||||||||||||
| Other (e) |
20,653 | 79,119 | 22,631 | 20,526 | 25,596 | (74 | )% | (19 | )% | |||||||||||||||||||
|
|
|
|
|
|
|
|
|
|
|
|
|
|
|
|||||||||||||||
| Total noninterest expense |
220,214 | 257,097 | 433,556 | 227,408 | 240,540 | (14 | )% | (8 | )% | |||||||||||||||||||
|
|
|
|
|
|
|
|
|
|
|
|
|
|
|
|||||||||||||||
| Income/(loss) before income taxes |
67,875 | 20,081 | (134,243 | ) | 60,243 | 62,269 | NM | 9 | % | |||||||||||||||||||
| Provision/(benefit) for income taxes (h) |
18,645 | (33,813 | ) | (31,094 | ) | 15,008 | 17,730 | NM | 5 | % | ||||||||||||||||||
|
|
|
|
|
|
|
|
|
|
|
|
|
|
|
|||||||||||||||
| Income/(loss) from continuing operations |
49,230 | 53,894 | (103,149 | ) | 45,235 | 44,539 | (9 | )% | 11 | % | ||||||||||||||||||
| Income/(loss) from discontinued operations, net of tax |
— | (6 | ) | 123 | 1 | 430 | NM | NM | ||||||||||||||||||||
|
|
|
|
|
|
|
|
|
|
|
|
|
|
|
|||||||||||||||
| Net income/(loss) |
49,230 | 53,888 | (103,026 | ) | 45,236 | 44,969 | (9 | )% | 9 | % | ||||||||||||||||||
| Net income attributable to noncontrolling interest |
2,813 | 2,934 | 2,875 | 2,843 | 2,813 | (4 | )% | * | ||||||||||||||||||||
|
|
|
|
|
|
|
|
|
|
|
|
|
|
|
|||||||||||||||
| Net income/(loss) attributable to controlling interest |
46,417 | 50,954 | (105,901 | ) | 42,393 | 42,156 | (9 | )% | 10 | % | ||||||||||||||||||
| Preferred stock dividends |
1,550 | 1,550 | 1,550 | 1,550 | 1,188 | * | 30 | % | ||||||||||||||||||||
|
|
|
|
|
|
|
|
|
|
|
|
|
|
|
|||||||||||||||
| Net income/(loss) available to common shareholders |
$ | 44,867 | $ | 49,404 | $ | (107,451 | ) | $ | 40,843 | $ | 40,968 | (9 | )% | 10 | % | |||||||||||||
|
|
|
|
|
|
|
|
|
|
|
|
|
|
|
|||||||||||||||
| Common Stock Data |
||||||||||||||||||||||||||||
| Diluted EPS from continuing operations |
$ | 0.19 | $ | 0.21 | $ | (0.45 | ) | $ | 0.17 | $ | 0.17 | (10 | )% | 12 | % | |||||||||||||
| Diluted EPS |
$ | 0.19 | $ | 0.21 | $ | (0.45 | ) | $ | 0.17 | $ | 0.17 | (10 | )% | 12 | % | |||||||||||||
| Diluted shares (thousands) |
237,401 | 236,753 | 236,895 | 240,891 | 242,799 | * | (2 | )% | ||||||||||||||||||||
|
|
|
|
|
|
|
|
|
|
|
|
|
|
|
|||||||||||||||
| Key Ratios & Other |
||||||||||||||||||||||||||||
| Return on average assets (annualized) (i) |
0.83 | % | 0.90 | % | (1.69 | )% | 0.74 | % | 0.73 | % | ||||||||||||||||||
| Return on average common equity (annualized) (i) |
8.48 | 9.42 | % | (20.39 | )% | 7.46 | % | 7.48 | % | |||||||||||||||||||
| Fee income to total revenue (j) |
47.90 | 45.81 | % | 48.66 | % | 47.19 | % | 49.22 | % | |||||||||||||||||||
| Efficiency ratio (k) |
75.30 | 88.66 | % | NM | 75.05 | % | 75.69 | % | ||||||||||||||||||||
| Full time equivalent employees |
4,251 | 4,309 | 4,338 | 4,296 | 4,381 | |||||||||||||||||||||||
|
|
|
|
|
|
|
|
|
|
|
|||||||||||||||||||
NM - Not meaningful
| * | Amount is less than one percent. |
| (a) | 1Q14 ADR was $.8 million. 2Q13 and 1Q13 include a gain of $1.0 million and $2.4 million, respectively, from a LOCOM reversal associated with a TRUP loan payoff within the non-strategic segment. |
| (b) | 1Q14 increase reflects the receipt of previously unrecognized servicing fees in conjunction with transfers of servicing in 1Q14, partially offset by a $2.0 million loss on the deconsolidation of a securitization trust; 4Q13 decline due to transfers of servicing; 3Q13 increase in servicing reflects the terms of the agreement to sell servicing, somewhat offset by $2.2 million of estimated costs for obligations associated with the servicing sale. |
| (c) | 1Q14 increase driven by $2.8 million of policy benefits received. |
| (d) | 1Q14 and 4Q13 include gains of $5.6 million and $3.3 million, respectively, on the sale of cost method investments; 4Q13 also includes a $1.1 million other-than-temporary impairment of an investment. |
| (e) | Refer to the Other Income and Other Expense table on page 7 for additional information. |
| (f) | 1Q14 includes $4.6 million of lease abandonment expense. |
| (g) | 1Q14 decline due to lower subservicing costs associated with the sales of servicing. |
| (h) | 4Q13 includes $7.5 million in tax benefits related to discrete period tax items. |
| (i) | Return on average assets is calculated using net income. Return on average common equity is calculated using net income available to common shareholders. |
| (j) | Ratio excludes securities gains/(losses). |
| (k) | Noninterest expense divided by total revenue excluding securities gains/(losses). |
6
FHN OTHER INCOME AND OTHER EXPENSE
Quarterly, Unaudited
| 1Q14 Changes vs. | ||||||||||||||||||||||||||||
| (Thousands) |
1Q14 | 4Q13 | 3Q13 | 2Q13 | 1Q13 | 4Q13 | 1Q13 | |||||||||||||||||||||
| Other Income |
||||||||||||||||||||||||||||
| ATM and interchange fees |
$ | 2,497 | $ | 2,721 | $ | 2,680 | $ | 2,627 | $ | 2,384 | (8 | )% | 5 | % | ||||||||||||||
| Electronic banking fees |
1,534 | 1,535 | 1,607 | 1,585 | 1,562 | * | (2 | )% | ||||||||||||||||||||
| Letter of credit fees |
1,663 | 1,215 | 1,171 | 1,196 | 1,499 | 37 | % | 11 | % | |||||||||||||||||||
| Deferred compensation (a) |
657 | 1,210 | 2,160 | (278 | ) | 1,593 | (46 | )% | (59 | )% | ||||||||||||||||||
| Gain /(loss) on extinguishment of debt |
(4,350 | ) | — | — | — | — | NM | NM | ||||||||||||||||||||
| Other |
2,893 | 2,644 | 3,996 | 3,777 | 3,457 | 9 | % | (16 | )% | |||||||||||||||||||
|
|
|
|
|
|
|
|
|
|
|
|
|
|
|
|||||||||||||||
| Total |
$ | 4,894 | $ | 9,325 | $ | 11,614 | $ | 8,907 | $ | 10,495 | (48 | )% | (53 | )% | ||||||||||||||
|
|
|
|
|
|
|
|
|
|
|
|
|
|
|
|||||||||||||||
| Other Expense |
||||||||||||||||||||||||||||
| Litigation and regulatory matters |
$ | 90 | $ | 57,355 | $ | 229 | $ | 900 | $ | 5,170 | NM | (98 | )% | |||||||||||||||
| Other insurance and taxes |
3,060 | 3,261 | 3,215 | 3,076 | 3,046 | (6 | )% | * | ||||||||||||||||||||
| Tax credit investments |
2,495 | 3,063 | 3,079 | 2,989 | 2,972 | (19 | )% | (16 | )% | |||||||||||||||||||
| Travel and entertainment |
1,824 | 2,339 | 2,400 | 2,372 | 1,848 | (22 | )% | (1 | )% | |||||||||||||||||||
| Employee training and dues |
866 | 1,327 | 1,244 | 1,229 | 1,254 | (35 | )% | (31 | )% | |||||||||||||||||||
| Customer relations |
1,243 | 1,179 | 1,204 | 1,255 | 1,278 | 5 | % | (3 | )% | |||||||||||||||||||
| Miscellaneous loan costs |
714 | 701 | 1,349 | 1,163 | 996 | 2 | % | (28 | )% | |||||||||||||||||||
| Supplies |
1,116 | 1,090 | 950 | 705 | 1,055 | 2 | % | 6 | % | |||||||||||||||||||
| Other (b) |
9,245 | 8,804 | 8,961 | 6,837 | 7,977 | 5 | % | 16 | % | |||||||||||||||||||
|
|
|
|
|
|
|
|
|
|
|
|
|
|
|
|||||||||||||||
| Total |
$ | 20,653 | $ | 79,119 | $ | 22,631 | $ | 20,526 | $ | 25,596 | (74 | )% | (19 | )% | ||||||||||||||
|
|
|
|
|
|
|
|
|
|
|
|
|
|
|
|||||||||||||||
NM - Not meaningful
| * | Amount is less than one percent. |
| (a) | Amounts driven by market conditions and are mirrored by changes in deferred compensation expense which is included in employee compensation expense. |
| (b) | 1Q14 includes a $2.3 million negative valuation adjustment associated with the derivatives related to prior sales of Visa Class B shares. |
7
FHN CONSOLIDATED PERIOD-END BALANCE SHEET
Quarterly, Unaudited
| 1Q14 Changes vs. | ||||||||||||||||||||||||||||
| (Thousands) |
1Q14 | 4Q13 | 3Q13 | 2Q13 | 1Q13 | 4Q13 | 1Q13 | |||||||||||||||||||||
| Assets: |
||||||||||||||||||||||||||||
| Investment securities |
$ | 3,575,453 | $ | 3,398,457 | $ | 3,186,943 | $ | 3,228,379 | $ | 3,190,219 | 5 | % | 12 | % | ||||||||||||||
| Loans held-for-sale |
361,359 | 370,152 | 371,640 | 385,105 | 390,874 | (2 | )% | (8 | )% | |||||||||||||||||||
| Loans, net of unearned income (Restricted - $.1 billion) (a) |
15,119,461 | 15,389,074 | 15,408,556 | 16,197,952 | 15,889,670 | (2 | )% | (5 | )% | |||||||||||||||||||
| Federal funds sold |
16,555 | 66,079 | 52,830 | 52,169 | 33,738 | (75 | )% | (51 | )% | |||||||||||||||||||
| Securities purchased under agreements to resell |
605,276 | 412,614 | 576,355 | 602,126 | 732,696 | 47 | % | (17 | )% | |||||||||||||||||||
| Interest-bearing cash (b) |
685,540 | 730,297 | 184,179 | 344,150 | 431,182 | (6 | )% | 59 | % | |||||||||||||||||||
| Trading securities |
1,194,749 | 801,718 | 1,343,134 | 1,267,348 | 1,397,746 | 49 | % | (15 | )% | |||||||||||||||||||
|
|
|
|
|
|
|
|
|
|
|
|
|
|
|
|||||||||||||||
| Total earning assets |
21,558,393 | 21,168,391 | 21,123,637 | 22,077,229 | 22,066,125 | 2 | % | (2 | )% | |||||||||||||||||||
|
|
|
|
|
|
|
|
|
|
|
|
|
|
|
|||||||||||||||
| Cash and due from banks |
450,270 | 349,216 | 395,631 | 382,601 | 275,262 | 29 | % | 64 | % | |||||||||||||||||||
| Capital markets receivables |
51,082 | 45,255 | 83,154 | 151,660 | 169,927 | 13 | % | (70 | )% | |||||||||||||||||||
| Mortgage servicing rights, net (c) |
4,687 | 72,793 | 116,686 | 113,853 | 109,102 | (94 | )% | (96 | )% | |||||||||||||||||||
| Goodwill (d) |
141,943 | 141,943 | 140,479 | 140,479 | 134,242 | * | 6 | % | ||||||||||||||||||||
| Other intangible assets, net |
21,007 | 21,988 | 22,216 | 23,144 | 21,772 | (4 | )% | (4 | )% | |||||||||||||||||||
| Premises and equipment, net |
299,183 | 305,244 | 308,779 | 314,764 | 299,740 | (2 | )% | * | ||||||||||||||||||||
| Real estate acquired by foreclosure (e) |
66,035 | 71,562 | 71,626 | 69,901 | 54,672 | (8 | )% | 21 | % | |||||||||||||||||||
| Allowance for loan losses (Restricted - $2.0 million) (a) |
(247,246 | ) | (253,809 | ) | (255,710 | ) | (261,934 | ) | (265,218 | ) | (3 | )% | (7 | )% | ||||||||||||||
| Derivative assets |
166,465 | 181,866 | 215,116 | 235,759 | 274,332 | (8 | )% | (39 | )% | |||||||||||||||||||
| Other assets (Restricted - $.9 million) (a) |
1,430,170 | 1,685,384 | 1,637,139 | 1,605,344 | 1,663,092 | (15 | )% | (14 | )% | |||||||||||||||||||
|
|
|
|
|
|
|
|
|
|
|
|
|
|
|
|||||||||||||||
| Total assets (Restricted - $.1 billion) (a) |
$ | 23,941,989 | $ | 23,789,833 | $ | 23,858,753 | $ | 24,852,800 | $ | 24,803,048 | 1 | % | (3 | )% | ||||||||||||||
|
|
|
|
|
|
|
|
|
|
|
|
|
|
|
|||||||||||||||
| Liabilities and Equity: |
||||||||||||||||||||||||||||
| Deposits: |
||||||||||||||||||||||||||||
| Savings |
$ | 6,630,142 | $ | 6,732,326 | $ | 6,781,522 | $ | 6,928,447 | $ | 6,498,832 | (2 | )% | 2 | % | ||||||||||||||
| Other interest-bearing deposits |
4,071,699 | 3,859,079 | 3,494,236 | 3,825,235 | 3,740,257 | 6 | % | 9 | % | |||||||||||||||||||
| Time deposits |
898,223 | 951,755 | 997,726 | 1,051,327 | 988,375 | (6 | )% | (9 | )% | |||||||||||||||||||
|
|
|
|
|
|
|
|
|
|
|
|
|
|
|
|||||||||||||||
| Total interest-bearing core deposits |
11,600,064 | 11,543,160 | 11,273,484 | 11,805,009 | 11,227,464 | * | 3 | % | ||||||||||||||||||||
| Noninterest-bearing deposits |
4,534,245 | 4,637,839 | 4,434,746 | 4,603,954 | 4,454,045 | (2 | )% | 2 | % | |||||||||||||||||||
|
|
|
|
|
|
|
|
|
|
|
|
|
|
|
|||||||||||||||
| Total core deposits (f) |
16,134,309 | 16,180,999 | 15,708,230 | 16,408,963 | 15,681,509 | * | 3 | % | ||||||||||||||||||||
|
|
|
|
|
|
|
|
|
|
|
|
|
|
|
|||||||||||||||
| Certificates of deposit $100,000 and more |
538,434 | 553,957 | 575,679 | 602,921 | 522,958 | (3 | )% | 3 | % | |||||||||||||||||||
|
|
|
|
|
|
|
|
|
|
|
|
|
|
|
|||||||||||||||
| Total deposits |
16,672,743 | 16,734,956 | 16,283,909 | 17,011,884 | 16,204,467 | * | 3 | % | ||||||||||||||||||||
|
|
|
|
|
|
|
|
|
|
|
|
|
|
|
|||||||||||||||
| Federal funds purchased |
1,135,665 | 1,042,633 | 1,062,901 | 1,142,749 | 1,361,670 | 9 | % | (17 | )% | |||||||||||||||||||
| Securities sold under agreements to repurchase |
411,795 | 442,789 | 427,232 | 433,761 | 488,010 | (7 | )% | (16 | )% | |||||||||||||||||||
| Trading liabilities |
667,257 | 368,348 | 585,969 | 596,869 | 781,306 | 81 | % | (15 | )% | |||||||||||||||||||
| Other short-term borrowings |
204,023 | 181,146 | 303,686 | 446,909 | 186,898 | 13 | % | 9 | % | |||||||||||||||||||
| Term borrowings (Restricted - $.1 billion) (a) (g) |
1,507,048 | 1,739,859 | 1,771,288 | 1,800,255 | 2,197,864 | (13 | )% | (31 | )% | |||||||||||||||||||
| Capital markets payables |
39,510 | 21,173 | 53,784 | 90,231 | 97,954 | 87 | % | (60 | )% | |||||||||||||||||||
| Derivative liabilities |
137,863 | 154,280 | 165,918 | 198,489 | 199,999 | (11 | )% | (31 | )% | |||||||||||||||||||
| Other liabilities |
621,948 | 603,898 | 770,773 | 585,245 | 685,153 | 3 | % | (9 | )% | |||||||||||||||||||
|
|
|
|
|
|
|
|
|
|
|
|
|
|
|
|||||||||||||||
| Total liabilities (Restricted - $.1 billion) (a) |
21,397,852 | 21,289,082 | 21,425,460 | 22,306,392 | 22,203,321 | 1 | % | (4 | )% | |||||||||||||||||||
|
|
|
|
|
|
|
|
|
|
|
|
|
|
|
|||||||||||||||
| Equity: |
||||||||||||||||||||||||||||
| Common stock |
147,866 | 147,731 | 147,705 | 150,347 | 150,766 | * | (2 | )% | ||||||||||||||||||||
| Capital surplus (h) |
1,417,170 | 1,416,767 | 1,413,248 | 1,416,563 | 1,461,292 | * | (3 | )% | ||||||||||||||||||||
| Undivided profits |
728,165 | 695,207 | 657,676 | 777,108 | 748,427 | 5 | % | (3 | )% | |||||||||||||||||||
| Accumulated other comprehensive loss, net |
(140,119 | ) | (150,009 | ) | (176,391 | ) | (188,665 | ) | (151,639 | ) | (7 | )% | (8 | )% | ||||||||||||||
| Preferred stock |
95,624 | 95,624 | 95,624 | 95,624 | 95,624 | * | * | |||||||||||||||||||||
| Noncontrolling interest (i) |
295,431 | 295,431 | 295,431 | 295,431 | 295,257 | * | * | |||||||||||||||||||||
|
|
|
|
|
|
|
|
|
|
|
|
|
|
|
|||||||||||||||
| Total equity |
2,544,137 | 2,500,751 | 2,433,293 | 2,546,408 | 2,599,727 | 2 | % | (2 | )% | |||||||||||||||||||
|
|
|
|
|
|
|
|
|
|
|
|
|
|
|
|||||||||||||||
| Total liabilities and equity |
$ | 23,941,989 | $ | 23,789,833 | $ | 23,858,753 | $ | 24,852,800 | $ | 24,803,048 | 1 | % | (3 | )% | ||||||||||||||
|
|
|
|
|
|
|
|
|
|
|
|
|
|
|
|||||||||||||||
| * | Amount is less than one percent. |
| (a) | Restricted balances parenthetically presented are as of March 31, 2014. |
| (b) | Includes excess balances held at Fed. |
| (c) | Decreases in 1Q14 and 4Q13 reflect transfers associated with an agreement to sell mortgage servicing rights entered into in 3Q13. |
| (d) | 2Q13 increase driven by the MNB acquisition. |
| (e) | 1Q14 includes $23.1 million of foreclosed assets related to government insured mortgages. |
| (f) | 1Q14 average core deposits were $16.0 billion. |
| (g) | In 2Q13 $350.0 million of subordinated notes matured. In 1Q14 FHN resolved the collateralized borrowings for three previously on-balance sheet consumer loan securitizations. |
| (h) | 2Q13 decrease related to $40.0 million prepaid share repurchase agreement. The shares were delivered to FHN in 3Q13. |
| (i) | Consists of preferred stock of subsidiaries. |
8
FHN CONSOLIDATED AVERAGE BALANCE SHEET
Quarterly, Unaudited
| 1Q14 Changes vs. | ||||||||||||||||||||||||||||
| (Thousands) |
1Q14 | 4Q13 | 3Q13 | 2Q13 | 1Q13 | 4Q13 | 1Q13 | |||||||||||||||||||||
| Assets: |
||||||||||||||||||||||||||||
| Earning assets: |
||||||||||||||||||||||||||||
| Loans, net of unearned income: |
||||||||||||||||||||||||||||
| Commercial, financial, and industrial (C&I) |
$ | 7,639,584 | $ | 7,694,029 | $ | 7,888,297 | $ | 8,121,219 | $ | 8,199,249 | (1 | )% | (7 | )% | ||||||||||||||
| Commercial real estate |
1,139,749 | 1,164,748 | 1,215,586 | 1,134,268 | 1,161,467 | (2 | )% | (2 | )% | |||||||||||||||||||
| Consumer real estate |
5,305,596 | 5,400,751 | 5,502,825 | 5,561,689 | 5,644,275 | (2 | )% | (6 | )% | |||||||||||||||||||
| Permanent mortgage |
637,642 | 678,938 | 721,554 | 771,253 | 801,000 | (6 | )% | (20 | )% | |||||||||||||||||||
| Credit card and other |
336,454 | 334,887 | 323,551 | 304,561 | 291,221 | * | 16 | % | ||||||||||||||||||||
|
|
|
|
|
|
|
|
|
|
|
|
|
|
|
|||||||||||||||
| Total loans, net of unearned income (Restricted - $.1 billion) (a) (b) |
15,059,025 | 15,273,353 | 15,651,813 | 15,892,990 | 16,097,212 | (1 | )% | (6 | )% | |||||||||||||||||||
|
|
|
|
|
|
|
|
|
|
|
|
|
|
|
|||||||||||||||
| Loans held-for-sale |
367,899 | 368,373 | 378,263 | 389,273 | 392,272 | * | (6 | )% | ||||||||||||||||||||
| Investment securities: |
||||||||||||||||||||||||||||
| U.S. treasuries |
41,828 | 39,994 | 41,303 | 40,815 | 44,107 | 5 | % | (5 | )% | |||||||||||||||||||
| U.S. government agencies |
3,222,642 | 2,959,355 | 2,900,838 | 2,924,012 | 2,818,958 | 9 | % | 14 | % | |||||||||||||||||||
| States and municipalities |
19,425 | 15,155 | 15,246 | 15,390 | 15,255 | 28 | % | 27 | % | |||||||||||||||||||
| Other |
211,891 | 229,728 | 224,213 | 218,701 | 216,860 | (8 | )% | (2 | )% | |||||||||||||||||||
|
|
|
|
|
|
|
|
|
|
|
|
|
|
|
|||||||||||||||
| Total investment securities |
3,495,786 | 3,244,232 | 3,181,600 | 3,198,918 | 3,095,180 | 8 | % | 13 | % | |||||||||||||||||||
|
|
|
|
|
|
|
|
|
|
|
|
|
|
|
|||||||||||||||
| Capital markets securities inventory |
1,101,798 | 1,159,570 | 1,156,262 | 1,310,044 | 1,308,969 | (5 | )% | (16 | )% | |||||||||||||||||||
| Mortgage banking trading securities |
6,949 | 12,712 | 15,558 | 16,398 | 17,486 | (45 | )% | (60 | )% | |||||||||||||||||||
| Other earning assets: |
||||||||||||||||||||||||||||
| Federal funds sold |
21,615 | 19,471 | 28,498 | 26,698 | 24,173 | 11 | % | (11 | )% | |||||||||||||||||||
| Securities purchased under agreements to resell |
622,466 | 581,798 | 593,978 | 705,129 | 754,630 | 7 | % | (18 | )% | |||||||||||||||||||
| Interest-bearing cash (c) |
972,537 | 614,628 | 537,631 | 401,236 | 653,712 | 58 | % | 49 | % | |||||||||||||||||||
|
|
|
|
|
|
|
|
|
|
|
|
|
|
|
|||||||||||||||
| Total other earning assets |
1,616,618 | 1,215,897 | 1,160,107 | 1,133,063 | 1,432,515 | 33 | % | 13 | % | |||||||||||||||||||
|
|
|
|
|
|
|
|
|
|
|
|
|
|
|
|||||||||||||||
| Total earnings assets (Restricted - $.1 billion) (a) |
21,648,075 | 21,274,137 | 21,543,603 | 21,940,686 | 22,343,634 | 2 | % | (3 | )% | |||||||||||||||||||
|
|
|
|
|
|
|
|
|
|
|
|
|
|
|
|||||||||||||||
| Allowance for loan losses (Restricted - $3.2 million) (a) |
(249,733 | ) | (250,074 | ) | (256,789 | ) | (260,944 | ) | (270,385 | ) | * | (8 | )% | |||||||||||||||
| Cash and due from banks (Restricted - $1.4 million) (a) |
336,543 | 341,066 | 351,972 | 342,053 | 348,581 | (1 | )% | (3 | )% | |||||||||||||||||||
| Capital markets receivables |
54,654 | 45,179 | 82,289 | 97,851 | 88,211 | 21 | % | (38 | )% | |||||||||||||||||||
| Premises and equipment, net |
301,065 | 307,285 | 308,199 | 302,263 | 299,846 | (2 | )% | * | ||||||||||||||||||||
| Derivative assets |
181,586 | 201,609 | 209,878 | 257,181 | 286,243 | (10 | )% | (37 | )% | |||||||||||||||||||
| Other assets (Restricted - $1.4 million) (a) |
1,643,879 | 1,926,109 | 1,942,481 | 1,903,728 | 1,948,417 | (15 | )% | (16 | )% | |||||||||||||||||||
|
|
|
|
|
|
|
|
|
|
|
|
|
|
|
|||||||||||||||
| Total assets (Restricted - $.1 billion) (a) |
$ | 23,916,069 | $ | 23,845,311 | $ | 24,181,633 | $ | 24,582,818 | $ | 25,044,547 | * | (5 | )% | |||||||||||||||
|
|
|
|
|
|
|
|
|
|
|
|
|
|
|
|||||||||||||||
| Liabilities and equity: |
||||||||||||||||||||||||||||
| Interest-bearing liabilities: |
||||||||||||||||||||||||||||
| Interest-bearing deposits: |
||||||||||||||||||||||||||||
| Savings |
$ | 6,683,749 | $ | 6,642,159 | $ | 6,957,875 | $ | 6,516,889 | $ | 6,593,590 | 1 | % | 1 | % | ||||||||||||||
| Other interest-bearing deposits |
3,830,839 | 3,520,348 | 3,494,211 | 3,645,674 | 3,709,988 | 9 | % | 3 | % | |||||||||||||||||||
| Time deposits |
924,025 | 977,107 | 1,025,788 | 998,762 | 1,004,887 | (5 | )% | (8 | )% | |||||||||||||||||||
|
|
|
|
|
|
|
|
|
|
|
|
|
|
|
|||||||||||||||
| Total interest-bearing core deposits |
11,438,613 | 11,139,614 | 11,477,874 | 11,161,325 | 11,308,465 | 3 | % | 1 | % | |||||||||||||||||||
| Certificates of deposit $100,000 and more |
545,845 | 580,760 | 594,536 | 542,244 | 516,785 | (6 | )% | 6 | % | |||||||||||||||||||
| Federal funds purchased |
1,161,594 | 1,236,763 | 1,119,273 | 1,224,070 | 1,479,316 | (6 | )% | (21 | )% | |||||||||||||||||||
| Securities sold under agreements to repurchase |
454,937 | 446,894 | 452,940 | 480,960 | 572,666 | 2 | % | (21 | )% | |||||||||||||||||||
| Capital markets trading liabilities |
607,114 | 567,531 | 598,195 | 718,309 | 779,409 | 7 | % | (22 | )% | |||||||||||||||||||
| Other short-term borrowings |
184,721 | 219,593 | 243,195 | 525,493 | 209,376 | (16 | )% | (12 | )% | |||||||||||||||||||
| Term borrowings (Restricted - $.1 billion) (a) (d) |
1,702,107 | 1,764,476 | 1,792,250 | 2,007,372 | 2,221,297 | (4 | )% | (23 | )% | |||||||||||||||||||
|
|
|
|
|
|
|
|
|
|
|
|
|
|
|
|||||||||||||||
| Total interest-bearing liabilities |
16,094,931 | 15,955,631 | 16,278,263 | 16,659,773 | 17,087,314 | 1 | % | (6 | )% | |||||||||||||||||||
|
|
|
|
|
|
|
|
|
|
|
|
|
|
|
|||||||||||||||
| Noninterest-bearing deposits |
4,536,080 | 4,559,023 | 4,542,127 | 4,493,440 | 4,441,411 | (1 | )% | 2 | % | |||||||||||||||||||
| Capital markets payables |
33,144 | 32,896 | 57,275 | 58,435 | 57,859 | 1 | % | (43 | )% | |||||||||||||||||||
| Derivative liabilities |
152,596 | 159,575 | 161,611 | 184,192 | 194,892 | (4 | )% | (22 | )% | |||||||||||||||||||
| Other liabilities |
563,045 | 666,312 | 660,458 | 598,854 | 683,596 | (15 | )% | (18 | )% | |||||||||||||||||||
|
|
|
|
|
|
|
|
|
|
|
|
|
|
|
|||||||||||||||
| Total liabilities (Restricted - $.1 billion) (a) |
21,379,796 | 21,373,437 | 21,699,734 | 21,994,694 | 22,465,072 | * | (5 | )% | ||||||||||||||||||||
|
|
|
|
|
|
|
|
|
|
|
|
|
|
|
|||||||||||||||
| Equity: |
||||||||||||||||||||||||||||
| Common stock |
147,751 | 147,724 | 149,000 | 150,468 | 151,613 | * | (3 | )% | ||||||||||||||||||||
| Capital surplus |
1,417,642 | 1,414,810 | 1,418,259 | 1,430,998 | 1,476,797 | * | (4 | )% | ||||||||||||||||||||
| Undivided profits |
714,988 | 691,958 | 715,451 | 771,953 | 742,070 | 3 | % | (4 | )% | |||||||||||||||||||
| Accumulated other comprehensive loss, net |
(135,163 | ) | (173,673 | ) | (191,866 | ) | (156,178 | ) | (150,093 | ) | (22 | )% | (10 | )% | ||||||||||||||
| Preferred stock |
95,624 | 95,624 | 95,624 | 95,624 | 63,831 | * | 50 | % | ||||||||||||||||||||
| Noncontrolling interest |
295,431 | 295,431 | 295,431 | 295,259 | 295,257 | * | * | |||||||||||||||||||||
|
|
|
|
|
|
|
|
|
|
|
|
|
|
|
|||||||||||||||
| Total equity |
2,536,273 | 2,471,874 | 2,481,899 | 2,588,124 | 2,579,475 | 3 | % | (2 | )% | |||||||||||||||||||
|
|
|
|
|
|
|
|
|
|
|
|
|
|
|
|||||||||||||||
| Total liabilities and equity |
$ | 23,916,069 | $ | 23,845,311 | $ | 24,181,633 | $ | 24,582,818 | $ | 25,044,547 | * | (5 | )% | |||||||||||||||
|
|
|
|
|
|
|
|
|
|
|
|
|
|
|
|||||||||||||||
| * | Amount is less than one percent. |
| (a) | Restricted balances parenthetically presented are quarterly averages as of March 31, 2014. |
| (b) | Includes loans on nonaccrual status. |
| (c) | Includes excess balances held at Fed. |
| (d) | In 2Q13 $350.0 million of subordinated notes matured. |
9
FHN CONSOLIDATED NET INTEREST INCOME (a)
Quarterly, Unaudited
| 1Q14 Changes vs. | ||||||||||||||||||||||||||||
| (Thousands) |
1Q14 | 4Q13 | 3Q13 | 2Q13 | 1Q13 | 4Q13 | 1Q13 | |||||||||||||||||||||
| Interest Income: |
||||||||||||||||||||||||||||
| Loans, net of unearned income (b) |
$ | 140,487 | $ | 147,322 | $ | 151,504 | $ | 153,070 | $ | 154,955 | (5 | )% | (9 | )% | ||||||||||||||
| Loans held-for-sale |
3,215 | 3,253 | 3,058 | 3,169 | 3,502 | (1 | )% | (8 | )% | |||||||||||||||||||
| Investment securities: |
||||||||||||||||||||||||||||
| U.S. treasuries |
5 | 4 | 10 | 11 | 8 | 25 | % | (38 | )% | |||||||||||||||||||
| U.S. government agencies |
20,837 | 19,020 | 18,537 | 18,321 | 18,507 | 10 | % | 13 | % | |||||||||||||||||||
| States and municipalities |
117 | 21 | 21 | 25 | 23 | NM | NM | |||||||||||||||||||||
| Other |
2,281 | 2,307 | 2,355 | 2,315 | 2,332 | (1 | )% | (2 | )% | |||||||||||||||||||
|
|
|
|
|
|
|
|
|
|
|
|
|
|
|
|||||||||||||||
| Total investment securities |
23,240 | 21,352 | 20,923 | 20,672 | 20,870 | 9 | % | 11 | % | |||||||||||||||||||
|
|
|
|
|
|
|
|
|
|
|
|
|
|
|
|||||||||||||||
| Capital markets securities inventory |
8,063 | 8,631 | 8,425 | 8,467 | 7,901 | (7 | )% | 2 | % | |||||||||||||||||||
| Mortgage banking trading securities |
159 | 247 | 403 | 452 | 489 | (36 | )% | (67 | )% | |||||||||||||||||||
| Other earning assets: |
||||||||||||||||||||||||||||
| Federal funds sold |
53 | 48 | 73 | 66 | 61 | 10 | % | (13 | )% | |||||||||||||||||||
| Securities purchased under agreements to resell (c) |
(192 | ) | (99 | ) | (171 | ) | (189 | ) | 44 | (94 | )% | NM | ||||||||||||||||
| Interest-bearing cash |
546 | 343 | 289 | 197 | 364 | 59 | % | 50 | % | |||||||||||||||||||
|
|
|
|
|
|
|
|
|
|
|
|
|
|
|
|||||||||||||||
| Total other earning assets |
407 | 292 | 191 | 74 | 469 | 39 | % | (13 | )% | |||||||||||||||||||
|
|
|
|
|
|
|
|
|
|
|
|
|
|
|
|||||||||||||||
| Interest income |
$ | 175,571 | $ | 181,097 | $ | 184,504 | $ | 185,904 | $ | 188,186 | (3 | )% | (7 | )% | ||||||||||||||
|
|
|
|
|
|
|
|
|
|
|
|
|
|
|
|||||||||||||||
| Interest Expense: |
||||||||||||||||||||||||||||
| Interest-bearing deposits: |
||||||||||||||||||||||||||||
| Savings |
$ | 3,083 | $ | 3,205 | $ | 3,471 | $ | 3,689 | $ | 4,397 | (4 | )% | (30 | )% | ||||||||||||||
| Other interest-bearing deposits |
818 | 772 | 817 | 1,013 | 1,145 | 6 | % | (29 | )% | |||||||||||||||||||
| Time deposits |
3,062 | 3,585 | 4,013 | 4,064 | 4,217 | (15 | )% | (27 | )% | |||||||||||||||||||
|
|
|
|
|
|
|
|
|
|
|
|
|
|
|
|||||||||||||||
| Total interest-bearing core deposits |
6,963 | 7,562 | 8,301 | 8,766 | 9,759 | (8 | )% | (29 | )% | |||||||||||||||||||
| Certificates of deposit $100,000 and more (d) |
1,023 | 873 | 1,658 | 1,550 | 1,561 | 17 | % | (34 | )% | |||||||||||||||||||
| Federal funds purchased |
726 | 791 | 716 | 777 | 932 | (8 | )% | (22 | )% | |||||||||||||||||||
| Securities sold under agreements to repurchase |
118 | 126 | 148 | 134 | 268 | (6 | )% | (56 | )% | |||||||||||||||||||
| Capital markets trading liabilities |
3,571 | 3,442 | 3,632 | 3,354 | 3,196 | 4 | % | 12 | % | |||||||||||||||||||
| Other short-term borrowings |
261 | 222 | 239 | 245 | 106 | 18 | % | NM | ||||||||||||||||||||
| Term borrowings |
8,563 | 8,902 | 9,078 | 9,146 | 9,195 | (4 | )% | (7 | )% | |||||||||||||||||||
|
|
|
|
|
|
|
|
|
|
|
|
|
|
|
|||||||||||||||
| Interest expense |
21,225 | 21,918 | 23,772 | 23,972 | 25,017 | (3 | )% | (15 | )% | |||||||||||||||||||
|
|
|
|
|
|
|
|
|
|
|
|
|
|
|
|||||||||||||||
| Net interest income - tax equivalent basis |
154,346 | 159,179 | 160,732 | 161,932 | 163,169 | (3 | )% | (5 | )% | |||||||||||||||||||
| Fully taxable equivalent adjustment |
(1,987 | ) | (2,044 | ) | (1,894 | ) | (1,913 | ) | (1,787 | ) | 3 | % | (11 | )% | ||||||||||||||
|
|
|
|
|
|
|
|
|
|
|
|
|
|
|
|||||||||||||||
| Net interest income |
$ | 152,359 | $ | 157,135 | $ | 158,838 | $ | 160,019 | $ | 161,382 | (3 | )% | (6 | )% | ||||||||||||||
|
|
|
|
|
|
|
|
|
|
|
|
|
|
|
|||||||||||||||
NM - Not meaningful
| (a) | Net interest income adjusted to a FTE basis. |
| (b) | Includes interest on loans in nonaccrual status. |
| (c) | 1Q14, 4Q13, 3Q13 and 2Q13 driven by negative market rates on reverse repurchase agreements. |
| (d) | 1Q14 and 4Q13 include the effect of amortizing the valuation adjustment for acquired time deposits related to the MNB acquisition. |
10
FHN CONSOLIDATED AVERAGE BALANCE SHEET: YIELDS AND RATES
Quarterly, Unaudited
| 1Q14 | 4Q13 | 3Q13 | 2Q13 | 1Q13 | ||||||||||||||||
| Assets: |
||||||||||||||||||||
| Earning assets (a): |
||||||||||||||||||||
| Loans, net of unearned income: |
||||||||||||||||||||
| Commercial loans |
3.60 | % | 3.66 | % | 3.69 | % | 3.68 | % | 3.70 | % | ||||||||||
| Retail loans |
4.01 | 4.07 | 4.06 | 4.12 | 4.16 | |||||||||||||||
|
|
|
|
|
|
|
|
|
|
|
|||||||||||
| Total loans, net of unearned income (b) |
3.77 | 3.83 | 3.85 | 3.86 | 3.89 | |||||||||||||||
|
|
|
|
|
|
|
|
|
|
|
|||||||||||
| Loans held-for-sale |
3.50 | 3.53 | 3.23 | 3.26 | 3.57 | |||||||||||||||
| Investment securities: |
||||||||||||||||||||
| U.S. treasuries |
0.05 | 0.04 | 0.09 | 0.11 | 0.07 | |||||||||||||||
| U.S. government agencies |
2.59 | 2.57 | 2.56 | 2.51 | 2.63 | |||||||||||||||
| States and municipalities (c) |
2.41 | 0.56 | 0.55 | 0.65 | 0.59 | |||||||||||||||
| Other |
4.31 | 4.02 | 4.20 | 4.23 | 4.30 | |||||||||||||||
|
|
|
|
|
|
|
|
|
|
|
|||||||||||
| Total investment securities |
2.66 | 2.63 | 2.63 | 2.58 | 2.70 | |||||||||||||||
|
|
|
|
|
|
|
|
|
|
|
|||||||||||
| Capital markets securities inventory |
2.93 | 2.98 | 2.91 | 2.59 | 2.41 | |||||||||||||||
| Mortgage banking trading securities |
9.16 | 7.79 | 10.36 | 11.02 | 11.19 | |||||||||||||||
| Other earning assets: |
||||||||||||||||||||
| Federal funds sold |
0.99 | 0.98 | 1.01 | 0.99 | 1.02 | |||||||||||||||
| Securities purchased under agreements to resell (d) |
(0.13 | ) | (0.07 | ) | (0.11 | ) | (0.11 | ) | 0.02 | |||||||||||
| Interest-bearing cash |
0.23 | 0.22 | 0.21 | 0.20 | 0.23 | |||||||||||||||
|
|
|
|
|
|
|
|
|
|
|
|||||||||||
| Total other earning assets |
0.10 | 0.10 | 0.07 | 0.03 | 0.13 | |||||||||||||||
|
|
|
|
|
|
|
|
|
|
|
|||||||||||
| Interest income/total earning assets |
3.27 | % | 3.39 | % | 3.41 | % | 3.40 | % | 3.40 | % | ||||||||||
|
|
|
|
|
|
|
|
|
|
|
|||||||||||
| Liabilities: |
||||||||||||||||||||
| Interest-bearing liabilities: |
||||||||||||||||||||
| Interest-bearing deposits: |
||||||||||||||||||||
| Savings |
0.19 | % | 0.19 | % | 0.20 | % | 0.23 | % | 0.27 | % | ||||||||||
| Other interest-bearing deposits |
0.09 | 0.09 | 0.09 | 0.11 | 0.13 | |||||||||||||||
| Time deposits |
1.34 | 1.46 | 1.55 | 1.63 | 1.70 | |||||||||||||||
|
|
|
|
|
|
|
|
|
|
|
|||||||||||
| Total interest-bearing core deposits |
0.25 | 0.27 | 0.29 | 0.32 | 0.35 | |||||||||||||||
| Certificates of deposit $100,000 and more (e) |
0.76 | 0.60 | 1.11 | 1.15 | 1.23 | |||||||||||||||
| Federal funds purchased |
0.25 | 0.25 | 0.25 | 0.25 | 0.26 | |||||||||||||||
| Securities sold under agreements to repurchase |
0.11 | 0.11 | 0.13 | 0.11 | 0.19 | |||||||||||||||
| Capital markets trading liabilities |
2.39 | 2.41 | 2.41 | 1.87 | 1.66 | |||||||||||||||
| Other short-term borrowings |
0.57 | 0.40 | 0.39 | 0.19 | 0.21 | |||||||||||||||
| Term borrowings (f) |
2.01 | 2.02 | 2.03 | 1.82 | 1.66 | |||||||||||||||
|
|
|
|
|
|
|
|
|
|
|
|||||||||||
| Interest expense/total interest-bearing liabilities |
0.53 | 0.55 | 0.58 | 0.58 | 0.59 | |||||||||||||||
|
|
|
|
|
|
|
|
|
|
|
|||||||||||
| Net interest spread |
2.74 | % | 2.84 | % | 2.83 | % | 2.82 | % | 2.81 | % | ||||||||||
| Effect of interest-free sources used to fund earning assets |
0.14 | 0.14 | 0.14 | 0.14 | 0.14 | |||||||||||||||
|
|
|
|
|
|
|
|
|
|
|
|||||||||||
| Net interest margin |
2.88 | % | 2.98 | % | 2.97 | % | 2.96 | % | 2.95 | % | ||||||||||
|
|
|
|
|
|
|
|
|
|
|
|||||||||||
Yields are adjusted to a FTE basis. Refer to the Non-GAAP to GAAP Reconciliation on page 22 for reconciliation of net interest income (GAAP) to net interest income adjusted for impact of FTE (non-GAAP).
| (a) | Earning assets yields are expressed net of unearned income. |
| (b) | Includes loans on nonaccrual status. |
| (c) | 1Q14 increase driven by the yield on an HTM municipal bond. |
| (d) | 1Q14, 4Q13, 3Q13 and 2Q13 driven by negative market rates on reverse repurchase agreements. |
| (e) | 1Q14 and 4Q13 rate includes the effect of amortizing the valuation adjustment for acquired time deposits related to the MNB acquisition. |
| (f) | Rates are expressed net of unamortized debenture cost for term borrowings. |
11
FHN CAPITAL HIGHLIGHTS
Quarterly, Unaudited
| 1Q14 Changes vs. | ||||||||||||||||||||||||||||
| (Thousands) |
1Q14 | 4Q13 | 3Q13 | 2Q13 | 1Q13 | 4Q13 | 1Q13 | |||||||||||||||||||||
| Tier 1 capital (a) (b) |
$ | 2,666,485 | $ | 2,618,976 | $ | 2,555,140 | $ | 2,712,398 | $ | 2,738,558 | 2 | % | (3 | )% | ||||||||||||||
| Tier 2 capital (a) |
382,472 | 444,655 | 449,100 | 463,735 | 510,847 | (14 | )% | (25 | )% | |||||||||||||||||||
|
|
|
|
|
|
|
|
|
|
|
|
|
|
|
|||||||||||||||
| Total capital (a) (b) |
$ | 3,048,957 | $ | 3,063,631 | $ | 3,004,240 | $ | 3,176,133 | $ | 3,249,405 | * | (6 | )% | |||||||||||||||
|
|
|
|
|
|
|
|
|
|
|
|
|
|
|
|||||||||||||||
| Risk weighted assets (“RWA”) (a) |
$ | 18,773,300 | $ | 18,878,594 | $ | 19,236,793 | $ | 20,419,119 | $ | 20,192,003 | (1 | )% | (7 | )% | ||||||||||||||
| Tier 1 ratio (a) |
14.20 | % | 13.87 | % | 13.28 | % | 13.28 | % | 13.56 | % | ||||||||||||||||||
| Tier 2 ratio (a) |
2.04 | % | 2.36 | % | 2.34 | % | 2.27 | % | 2.53 | % | ||||||||||||||||||
|
|
|
|
|
|
|
|
|
|
|
|
|
|
|
|||||||||||||||
| Total capital ratio (a) |
16.24 | % | 16.23 | % | 15.62 | % | 15.55 | % | 16.09 | % | ||||||||||||||||||
|
|
|
|
|
|
|
|
|
|
|
|
|
|
|
|||||||||||||||
| Tier 1 common ratio to risk weighted assets (a) (c) |
11.06 | % | 10.75 | % | 10.21 | % | 10.39 | % | 10.64 | % | ||||||||||||||||||
| Leverage ratio (a) |
11.19 | % | 11.04 | % | 10.60 | % | 11.07 | % | 10.97 | % | ||||||||||||||||||
| Total equity to total assets |
10.63 | % | 10.51 | % | 10.20 | % | 10.25 | % | 10.48 | % | ||||||||||||||||||
| Adjusted tangible common equity to risk weighted assets (“TCE/RWA”) (a) (c) (d) |
10.61 | % | 10.37 | % | 9.71 | % | 9.71 | % | 9.93 | % | ||||||||||||||||||
| Tangible common equity/tangible assets (“TCE/TA”) (c) (e) |
8.37 | % | 8.24 | % | 7.93 | % | 8.07 | % | 8.33 | % | ||||||||||||||||||
| Period-end shares outstanding (thousands) |
236,586 | 236,370 | 236,328 | 240,555 | 241,225 | * | (2 | )% | ||||||||||||||||||||
| Cash dividends declared per share |
$ | 0.05 | $ | 0.05 | $ | 0.05 | $ | 0.05 | $ | 0.05 | * | * | ||||||||||||||||
| Book value per common share (f) |
$ | 9.10 | $ | 8.93 | $ | 8.64 | $ | 8.96 | $ | 9.16 | ||||||||||||||||||
| Tangible book value per common share (c) (f) |
$ | 8.41 | $ | 8.23 | $ | 7.95 | $ | 8.28 | $ | 8.51 | ||||||||||||||||||
| Market capitalization (millions) |
$ | 2,919.5 | $ | 2,753.7 | $ | 2,597.2 | $ | 2,694.2 | $ | 2,576.3 | ||||||||||||||||||
|
|
|
|
|
|
|
|
|
|
|
|
|
|
|
|||||||||||||||
Certain previously reported amounts have been reclassified to agree with current presentation.
| (a) | Current quarter is an estimate. |
| (b) | All quarters presented include $200 million of tier 1 qualifying trust preferred securities. |
| (c) | Refer to the Non-GAAP to GAAP Reconciliation on page 22 of this financial supplement. |
| (d) | See Glossary of Terms for definition of ratio. |
| (e) | Calculated using period-end balances. |
| (f) | 2Q13 decrease due to $40 million prepaid share repurchase agreement, shares were delivered in 3Q13. |
12
FHN BUSINESS SEGMENT HIGHLIGHTS
Quarterly, Unaudited
| 1Q14 Changes vs. | ||||||||||||||||||||||||||||
| (Thousands) |
1Q14 | 4Q13 | 3Q13 | 2Q13 | 1Q13 | 4Q13 | 1Q13 | |||||||||||||||||||||
| Regional Banking |
||||||||||||||||||||||||||||
| Net interest income |
$ | 142,010 | $ | 146,427 | $ | 149,541 | $ | 148,220 | $ | 147,120 | (3 | )% | (3 | )% | ||||||||||||||
| Noninterest income |
59,992 | 62,806 | 63,883 | 61,885 | 59,144 | (4 | )% | 1 | % | |||||||||||||||||||
|
|
|
|
|
|
|
|
|
|
|
|
|
|
|
|||||||||||||||
| Total revenues |
202,002 | 209,233 | 213,424 | 210,105 | 206,264 | (3 | )% | (2 | )% | |||||||||||||||||||
| Provision/(provision credit) for loan losses |
12,990 | 2,585 | 5,159 | 13,201 | (2,485 | ) | NM | NM | ||||||||||||||||||||
| Noninterest expense |
133,050 | 139,186 | 131,961 | 129,584 | 131,077 | (4 | )% | 2 | % | |||||||||||||||||||
|
|
|
|
|
|
|
|
|
|
|
|
|
|
|
|||||||||||||||
| Income before income taxes |
55,962 | 67,462 | 76,304 | 67,320 | 77,672 | (17 | )% | (28 | )% | |||||||||||||||||||
| Provision for income taxes |
19,880 | 24,049 | 27,554 | 24,146 | 28,221 | (17 | )% | (30 | )% | |||||||||||||||||||
|
|
|
|
|
|
|
|
|
|
|
|
|
|
|
|||||||||||||||
| Net income |
$ | 36,082 | $ | 43,413 | $ | 48,750 | $ | 43,174 | $ | 49,451 | (17 | )% | (27 | )% | ||||||||||||||
|
|
|
|
|
|
|
|
|
|
|
|
|
|
|
|||||||||||||||
| Capital Markets |
||||||||||||||||||||||||||||
| Net interest income |
$ | 3,478 | $ | 4,301 | $ | 3,811 | $ | 4,097 | $ | 3,968 | (19 | )% | (12 | )% | ||||||||||||||
| Noninterest income |
56,758 | 59,509 | 64,115 | 68,199 | 76,612 | (5 | )% | (26 | )% | |||||||||||||||||||
|
|
|
|
|
|
|
|
|
|
|
|
|
|
|
|||||||||||||||
| Total revenues |
60,236 | 63,810 | 67,926 | 72,296 | 80,580 | (6 | )% | (25 | )% | |||||||||||||||||||
| Noninterest expense |
52,594 | 53,130 | 57,930 | 59,822 | 61,533 | (1 | )% | (15 | )% | |||||||||||||||||||
|
|
|
|
|
|
|
|
|
|
|
|
|
|
|
|||||||||||||||
| Income before income taxes |
7,642 | 10,680 | 9,996 | 12,474 | 19,047 | (28 | )% | (60 | )% | |||||||||||||||||||
| Provision for income taxes |
2,845 | 3,981 | 3,765 | 4,651 | 7,222 | (29 | )% | (61 | )% | |||||||||||||||||||
|
|
|
|
|
|
|
|
|
|
|
|
|
|
|
|||||||||||||||
| Net income |
$ | 4,797 | $ | 6,699 | $ | 6,231 | $ | 7,823 | $ | 11,825 | (28 | )% | (59 | )% | ||||||||||||||
|
|
|
|
|
|
|
|
|
|
|
|
|
|
|
|||||||||||||||
| Corporate |
||||||||||||||||||||||||||||
| Net interest income/(expense) |
$ | (9,113 | ) | $ | (10,413 | ) | $ | (11,654 | ) | $ | (11,182 | ) | $ | (10,059 | ) | 12 | % | 9 | % | |||||||||
| Noninterest income |
13,215 | 7,831 | 6,558 | 3,811 | 7,855 | 69 | % | 68 | % | |||||||||||||||||||
|
|
|
|
|
|
|
|
|
|
|
|
|
|
|
|||||||||||||||
| Total revenues |
4,102 | (2,582 | ) | (5,096 | ) | (7,371 | ) | (2,204 | ) | NM | NM | |||||||||||||||||
| Noninterest expense |
19,578 | 18,770 | 21,739 | 17,141 | 17,613 | 4 | % | 11 | % | |||||||||||||||||||
|
|
|
|
|
|
|
|
|
|
|
|
|
|
|
|||||||||||||||
| Loss before income taxes |
(15,476 | ) | (21,352 | ) | (26,835 | ) | (24,512 | ) | (19,817 | ) | 28 | % | 22 | % | ||||||||||||||
| Benefit for income taxes |
(11,766 | ) | (19,004 | ) | (16,593 | ) | (15,698 | ) | (12,083 | ) | 38 | % | 3 | % | ||||||||||||||
|
|
|
|
|
|
|
|
|
|
|
|
|
|
|
|||||||||||||||
| Net loss |
$ | (3,710 | ) | $ | (2,348 | ) | $ | (10,242 | ) | $ | (8,814 | ) | $ | (7,734 | ) | (58 | )% | 52 | % | |||||||||
|
|
|
|
|
|
|
|
|
|
|
|
|
|
|
|||||||||||||||
| Non-Strategic |
||||||||||||||||||||||||||||
| Net interest income |
$ | 15,984 | $ | 16,820 | $ | 17,140 | $ | 18,884 | $ | 20,353 | (5 | )% | (21 | )% | ||||||||||||||
| Noninterest income |
15,765 | 4,897 | 15,919 | 8,737 | 12,816 | NM | 23 | % | ||||||||||||||||||||
|
|
|
|
|
|
|
|
|
|
|
|
|
|
|
|||||||||||||||
| Total revenues |
31,749 | 21,717 | 33,059 | 27,621 | 33,169 | 46 | % | (4 | )% | |||||||||||||||||||
| Provision/(provision credit) for loan losses |
(2,990 | ) | 12,415 | 4,841 | 1,799 | 17,485 | NM | NM | ||||||||||||||||||||
| Noninterest expense |
14,992 | 46,011 | 221,926 | 20,861 | 30,317 | (67 | )% | (51 | )% | |||||||||||||||||||
|
|
|
|
|
|
|
|
|
|
|
|
|
|
|
|||||||||||||||
| Income/(loss) before income taxes |
19,747 | (36,709 | ) | (193,708 | ) | 4,961 | (14,633 | ) | NM | NM | ||||||||||||||||||
| Provision/(benefit) for income taxes |
7,686 | (42,839 | ) | (45,820 | ) | 1,909 | (5,630 | ) | NM | NM | ||||||||||||||||||
|
|
|
|
|
|
|
|
|
|
|
|
|
|
|
|||||||||||||||
| Income/(loss) from continuing operations |
12,061 | 6,130 | (147,888 | ) | 3,052 | (9,003 | ) | 97 | % | NM | ||||||||||||||||||
| Income/(loss) from discontinued operations, net of tax |
— | (6 | ) | 123 | 1 | 430 | NM | NM | ||||||||||||||||||||
|
|
|
|
|
|
|
|
|
|
|
|
|
|
|
|||||||||||||||
| Net income/(loss) |
$ | 12,061 | $ | 6,124 | $ | (147,765 | ) | $ | 3,053 | $ | (8,573 | ) | 97 | % | NM | |||||||||||||
|
|
|
|
|
|
|
|
|
|
|
|
|
|
|
|||||||||||||||
| Total Consolidated |
||||||||||||||||||||||||||||
| Net interest income |
$ | 152,359 | $ | 157,135 | $ | 158,838 | $ | 160,019 | $ | 161,382 | (3 | )% | (6 | )% | ||||||||||||||
| Noninterest income |
145,730 | 135,043 | 150,475 | 142,632 | 156,427 | 8 | % | (7 | )% | |||||||||||||||||||
|
|
|
|
|
|
|
|
|
|
|
|
|
|
|
|||||||||||||||
| Total revenues |
298,089 | 292,178 | 309,313 | 302,651 | 317,809 | 2 | % | (6 | )% | |||||||||||||||||||
| Provision for loan losses |
10,000 | 15,000 | 10,000 | 15,000 | 15,000 | (33 | )% | (33 | )% | |||||||||||||||||||
| Noninterest expense |
220,214 | 257,097 | 433,556 | 227,408 | 240,540 | (14 | )% | (8 | )% | |||||||||||||||||||
|
|
|
|
|
|
|
|
|
|
|
|
|
|
|
|||||||||||||||
| Income/(loss) before income taxes |
67,875 | 20,081 | (134,243 | ) | 60,243 | 62,269 | NM | 9 | % | |||||||||||||||||||
| Provision/(benefit) for income taxes |
18,645 | (33,813 | ) | (31,094 | ) | 15,008 | 17,730 | NM | 5 | % | ||||||||||||||||||
|
|
|
|
|
|
|
|
|
|
|
|
|
|
|
|||||||||||||||
| Income/(loss) from continuing operations |
49,230 | 53,894 | (103,149 | ) | 45,235 | 44,539 | (9 | )% | 11 | % | ||||||||||||||||||
| Income/(loss) from discontinued operations, net of tax |
— | (6 | ) | 123 | 1 | 430 | NM | NM | ||||||||||||||||||||
|
|
|
|
|
|
|
|
|
|
|
|
|
|
|
|||||||||||||||
| Net income/(loss) |
$ | 49,230 | $ | 53,888 | $ | (103,026 | ) | $ | 45,236 | $ | 44,969 | (9 | )% | 9 | % | |||||||||||||
|
|
|
|
|
|
|
|
|
|
|
|
|
|
|
|||||||||||||||
NM - Not meaningful
Certain previously reported amounts have been reclassified to agree with current presentation.
13
FHN REGIONAL BANKING
Quarterly, Unaudited
| 1Q14 Changes vs. | ||||||||||||||||||||||||||||
| 1Q14 | 4Q13 | 3Q13 | 2Q13 | 1Q13 | 4Q13 | 1Q13 | ||||||||||||||||||||||
| Income Statement (thousands) |
||||||||||||||||||||||||||||
| Net interest income |
$ | 142,010 | $ | 146,427 | $ | 149,541 | $ | 148,220 | $ | 147,120 | (3 | )% | (3 | )% | ||||||||||||||
| Provision/(provision credit) for loan losses |
12,990 | 2,585 | 5,159 | 13,201 | (2,485 | ) | NM | NM | ||||||||||||||||||||
| Noninterest income: |
||||||||||||||||||||||||||||
| NSF / Overdraft fees (a) |
9,156 | 11,411 | 11,660 | 10,250 | 10,031 | (20 | )% | (9 | )% | |||||||||||||||||||
| Cash management fees |
8,916 | 9,063 | 8,760 | 9,133 | 9,330 | (2 | )% | (4 | )% | |||||||||||||||||||
| Debit card income |
2,655 | 2,739 | 2,782 | 2,695 | 2,534 | (3 | )% | 5 | % | |||||||||||||||||||
| Other |
4,864 | 5,112 | 5,126 | 5,183 | 4,909 | (5 | )% | (1 | )% | |||||||||||||||||||
|
|
|
|
|
|
|
|
|
|
|
|
|
|
|
|||||||||||||||
| Total deposit transactions and cash management |
25,591 | 28,325 | 28,328 | 27,261 | 26,804 | (10 | )% | (5 | )% | |||||||||||||||||||
| Brokerage, management fees and commissions |
12,276 | 11,505 | 10,868 | 10,540 | 9,348 | 7 | % | 31 | % | |||||||||||||||||||
| Trust services and investment management |
6,760 | 6,612 | 6,665 | 6,966 | 6,343 | 2 | % | 7 | % | |||||||||||||||||||
| Bankcard income |
4,365 | 4,815 | 5,089 | 5,054 | 4,691 | (9 | )% | (7 | )% | |||||||||||||||||||
| Other service charges |
2,559 | 2,873 | 3,451 | 3,255 | 2,873 | (11 | )% | (11 | )% | |||||||||||||||||||
| Miscellaneous revenue |
8,441 | 8,676 | 9,482 | 8,809 | 9,085 | (3 | )% | (7 | )% | |||||||||||||||||||
|
|
|
|
|
|
|
|
|
|
|
|
|
|
|
|||||||||||||||
| Total noninterest income |
59,992 | 62,806 | 63,883 | 61,885 | 59,144 | (4 | )% | 1 | % | |||||||||||||||||||
|
|
|
|
|
|
|
|
|
|
|
|
|
|
|
|||||||||||||||
| Noninterest expense: |
||||||||||||||||||||||||||||
| Employee compensation, incentives, and benefits |
50,318 | 50,921 | 51,656 | 50,438 | 50,386 | (1 | )% | * | ||||||||||||||||||||
| Other |
82,732 | 88,265 | 80,305 | 79,146 | 80,691 | (6 | )% | 3 | % | |||||||||||||||||||
|
|
|
|
|
|
|
|
|
|
|
|
|
|
|
|||||||||||||||
| Total noninterest expense |
133,050 | 139,186 | 131,961 | 129,584 | 131,077 | (4 | )% | 2 | % | |||||||||||||||||||
|
|
|
|
|
|
|
|
|
|
|
|
|
|
|
|||||||||||||||
| Income before income taxes |
$ | 55,962 | $ | 67,462 | $ | 76,304 | $ | 67,320 | $ | 77,672 | (17 | )% | (28 | )% | ||||||||||||||
|
|
|
|
|
|
|
|
|
|
|
|
|
|
|
|||||||||||||||
| PPNR (Non-GAAP) (b) |
$ | 68,952 | $ | 70,047 | $ | 81,463 | $ | 80,521 | $ | 75,187 | (2 | )% | (8 | )% | ||||||||||||||
|
|
|
|
|
|
|
|
|
|
|
|
|
|
|
|||||||||||||||
| Efficiency ratio (c) |
65.87 | % | 66.52 | % | 61.83 | % | 61.68 | % | 63.55 | % | ||||||||||||||||||
|
|
|
|
|
|
|
|
|
|
|
|
|
|
|
|||||||||||||||
| Balance Sheet (millions) |
||||||||||||||||||||||||||||
| Average loans |
$ | 11,897 | $ | 11,972 | $ | 12,184 | $ | 12,225 | $ | 12,237 | (1 | )% | (3 | )% | ||||||||||||||
| Average other earning assets |
50 | 43 | 54 | 53 | 53 | 16 | % | (6 | )% | |||||||||||||||||||
| Total average earning assets |
11,947 | 12,015 | 12,238 | 12,278 | 12,290 | (1 | )% | (3 | )% | |||||||||||||||||||
| Average core deposits |
14,857 | 14,466 | 14,484 | 14,624 | 14,560 | 3 | % | 2 | % | |||||||||||||||||||
| Average other deposits |
546 | 581 | 595 | 542 | 517 | (6 | )% | 6 | % | |||||||||||||||||||
| Total average deposits |
15,403 | 15,047 | 15,079 | 15,166 | 15,077 | 2 | % | 2 | % | |||||||||||||||||||
| Total period-end deposits |
15,723 | 15,480 | 14,862 | 15,562 | 15,225 | 2 | % | 3 | % | |||||||||||||||||||
| Total period-end assets |
12,891 | 13,019 | 12,909 | 13,496 | 12,845 | (1 | )% | * | ||||||||||||||||||||
|
|
|
|
|
|
|
|
|
|
|
|
|
|
|
|||||||||||||||
| Net interest margin (d) |
4.88 | % | 4.90 | % | 4.91 | % | 4.90 | % | 4.90 | % | ||||||||||||||||||
| Net interest spread |
3.41 | 3.50 | 3.49 | 3.46 | 3.46 | |||||||||||||||||||||||
| Loan yield |
3.61 | 3.71 | 3.74 | 3.72 | 3.75 | |||||||||||||||||||||||
| Deposit average yield |
0.20 | 0.21 | 0.25 | 0.26 | 0.29 | |||||||||||||||||||||||
|
|
|
|
|
|
|
|
|
|
|
|
|
|
|
|||||||||||||||
| Key Statistics |
||||||||||||||||||||||||||||
| Financial center locations |
172 | 172 | 182 | 183 | 171 | * | 1 | % | ||||||||||||||||||||
|
|
|
|
|
|
|
|
|
|
|
|
|
|
|
|||||||||||||||
NM - Not meaningful.
| * | Amount is less than one percent. |
Certain previously reported amounts have been reclassified to agree with current presentation.
| (a) | 1Q14 decline primarily attributable to seasonality in NSF fees. |
| (b) | Pre-tax, pre-provision, net revenue is a Non-GAAP number and is calculated by adding the provision/(provision credit) for loan losses (GAAP) to Income before income taxes (GAAP). |
| (c) | Noninterest expense divided by total revenue. |
| (d) | Net interest margin is computed using total net interest income adjusted for FTE. Refer to the Non-GAAP to GAAP Reconciliation on page 22 of this supplement. |
14
FHN CAPITAL MARKETS
Quarterly, Unaudited
| 1Q14 Changes vs. | ||||||||||||||||||||||||||||
| 1Q14 | 4Q13 | 3Q13 | 2Q13 | 1Q13 | 4Q13 | 1Q13 | ||||||||||||||||||||||
| Income Statement (thousands) |
||||||||||||||||||||||||||||
| Net interest income |
$ | 3,478 | $ | 4,301 | $ | 3,811 | $ | 4,097 | $ | 3,968 | (19 | )% | (12 | )% | ||||||||||||||
| Noninterest income: |
||||||||||||||||||||||||||||
| Fixed income |
49,614 | 50,937 | 54,428 | 58,535 | 67,953 | (3 | )% | (27 | )% | |||||||||||||||||||
| Other |
7,144 | 8,572 | 9,687 | 9,664 | 8,659 | (17 | )% | (17 | )% | |||||||||||||||||||
|
|
|
|
|
|
|
|
|
|
|
|
|
|
|
|||||||||||||||
| Total noninterest income |
56,758 | 59,509 | 64,115 | 68,199 | 76,612 | (5 | )% | (26 | )% | |||||||||||||||||||
| Noninterest expense |
52,594 | 53,130 | 57,930 | 59,822 | 61,533 | (1 | )% | (15 | )% | |||||||||||||||||||
|
|
|
|
|
|
|
|
|
|
|
|
|
|
|
|||||||||||||||
| Income before income taxes |
$ | 7,642 | $ | 10,680 | $ | 9,996 | $ | 12,474 | $ | 19,047 | (28 | )% | (60 | )% | ||||||||||||||
|
|
|
|
|
|
|
|
|
|
|
|
|
|
|
|||||||||||||||
| Efficiency ratio (a) |
87.31 | % | 83.26 | % | 85.28 | % | 82.75 | % | 76.36 | % | ||||||||||||||||||
| Fixed income average daily revenue |
$ | 813 | $ | 822 | $ | 850 | $ | 915 | $ | 1,133 | (1 | )% | (28 | )% | ||||||||||||||
|
|
|
|
|
|
|
|
|
|
|
|
|
|
|
|||||||||||||||
| Balance Sheet (millions) |
||||||||||||||||||||||||||||
| Average trading inventory |
$ | 1,102 | $ | 1,160 | $ | 1,156 | $ | 1,310 | $ | 1,309 | (5 | )% | (16 | )% | ||||||||||||||
| Average other earning assets |
628 | 588 | 604 | 714 | 770 | 7 | % | (18 | )% | |||||||||||||||||||
| Total average earning assets |
1,730 | 1,748 | 1,760 | 2,024 | 2,079 | (1 | )% | (17 | )% | |||||||||||||||||||
| Total period-end assets |
2,094 | 1,511 | 2,275 | 2,299 | 2,592 | 39 | % | (19 | )% | |||||||||||||||||||
|
|
|
|
|
|
|
|
|
|
|
|
|
|
|
|||||||||||||||
| Net interest margin (b) |
0.82 | % | 1.02 | % | 0.89 | % | 0.84 | % | 0.78 | % | ||||||||||||||||||
|
|
|
|
|
|
|
|
|
|
|
|
|
|
|
|||||||||||||||
Certain previously reported amounts have been reclassified to agree with current presentation.
| (a) | Noninterest expense divided by total revenue. |
| (b) | Net interest margin is computed using total net interest income adjusted for FTE. Refer to the Non-GAAP to GAAP Reconciliation on page 22 of this supplement. |
FHN CORPORATE
Quarterly, Unaudited
| 1Q14 Changes vs. | ||||||||||||||||||||||||||||
| 1Q14 | 4Q13 | 3Q13 | 2Q13 | 1Q13 | 4Q13 | 1Q13 | ||||||||||||||||||||||
| Income Statement (thousands) |
||||||||||||||||||||||||||||
| Net interest income/(expense) |
$ | (9,113 | ) | $ | (10,413 | ) | $ | (11,654 | ) | $ | (11,182 | ) | $ | (10,059 | ) | 12 | % | 9 | % | |||||||||
| Noninterest income excluding securities gains/(losses) |
7,558 | 5,649 | 6,690 | 4,174 | 7,825 | 34 | % | (3 | )% | |||||||||||||||||||
| Securities gains/(losses), net (a) |
5,657 | 2,182 | (132 | ) | (363 | ) | 30 | NM | NM | |||||||||||||||||||
| Noninterest expense |
19,578 | 18,770 | 21,739 | 17,141 | 17,613 | 4 | % | 11 | % | |||||||||||||||||||
|
|
|
|
|
|
|
|
|
|
|
|
|
|
|
|||||||||||||||
| Loss before income taxes |
$ | (15,476 | ) | $ | (21,352 | ) | $ | (26,835 | ) | $ | (24,512 | ) | $ | (19,817 | ) | 28 | % | 22 | % | |||||||||
|
|
|
|
|
|
|
|
|
|
|
|
|
|
|
|||||||||||||||
| Average Balance Sheet (millions) |
||||||||||||||||||||||||||||
| Average loans |
$ | 169 | $ | 182 | $ | 196 | $ | 217 | $ | 226 | (7 | )% | (25 | )% | ||||||||||||||
| Total earning assets |
$ | 4,617 | $ | 4,026 | $ | 3,900 | $ | 3,802 | $ | 3,959 | 15 | % | 17 | % | ||||||||||||||
| Net interest margin (b) |
(0.83 | )% | (1.00 | )% | (1.16 | )% | (1.19 | )% | (1.07 | )% | ||||||||||||||||||
|
|
|
|
|
|
|
|
|
|
|
|
|
|
|
|||||||||||||||
NM - Not meaningful
Certain previously reported amounts have been reclassified to agree with current presentation.
| (a) | 1Q14 and 4Q13 include gains of $5.6 million and $3.3 million, respectively, on the sale of cost method investments; 4Q13 also includes a $1.1 million other-than-temporary impairment of an investment. |
| (b) | Net interest margin is computed using total net interest income adjusted for FTE. Refer to the Non-GAAP Reconciliation on page 22 of this supplement. |
15
FHN NON-STRATEGIC
Quarterly, Unaudited
| 1Q14 Changes vs. | ||||||||||||||||||||||||||||
| 1Q14 | 4Q13 | 3Q13 | 2Q13 | 1Q13 | 4Q13 | 1Q13 | ||||||||||||||||||||||
| Income Statement (thousands) |
||||||||||||||||||||||||||||
| Net interest income |
$ | 15,984 | $ | 16,820 | $ | 17,140 | $ | 18,884 | $ | 20,353 | (5 | )% | (21 | )% | ||||||||||||||
| Noninterest income excluding securities gains/(losses) (a) |
15,765 | 4,897 | 15,919 | 8,733 | 12,822 | NM | 23 | % | ||||||||||||||||||||
| Securities gains/(losses), net |
— | — | — | 4 | (6 | ) | NM | NM | ||||||||||||||||||||
| Noninterest expense: |
||||||||||||||||||||||||||||
| Repurchase and foreclosure provision |
— | (30,000 | ) | 200,000 | — | — | NM | NM | ||||||||||||||||||||
| Other expenses (b) |
14,992 | 76,011 | 21,926 | 20,861 | 30,317 | (80 | )% | (51 | )% | |||||||||||||||||||
|
|
|
|
|
|
|
|
|
|
|
|
|
|
|
|||||||||||||||
| Total noninterest expense |
14,992 | 46,011 | 221,926 | 20,861 | 30,317 | (67 | )% | (51 | )% | |||||||||||||||||||
| Provision/(provision credit) for loan losses |
(2,990 | ) | 12,415 | 4,841 | 1,799 | 17,485 | NM | NM | ||||||||||||||||||||
|
|
|
|
|
|
|
|
|
|
|
|
|
|
|
|||||||||||||||
| Income/(loss) before income taxes |
$ | 19,747 | $ | (36,709 | ) | $ | (193,708 | ) | $ | 4,961 | $ | (14,633 | ) | NM | NM | |||||||||||||
|
|
|
|
|
|
|
|
|
|
|
|
|
|
|
|||||||||||||||
| Average Balance Sheet (millions) |
||||||||||||||||||||||||||||
| Loans |
$ | 2,993 | $ | 3,119 | $ | 3,272 | $ | 3,451 | $ | 3,634 | (4 | )% | (18 | )% | ||||||||||||||
| Loans held-for-sale |
344 | 343 | 349 | 360 | 354 | * | (3 | )% | ||||||||||||||||||||
| Trading securities |
7 | 13 | 16 | 16 | 17 | (46 | )% | (59 | )% | |||||||||||||||||||
| Other assets |
60 | 342 | 350 | 340 | 370 | (82 | )% | (84 | )% | |||||||||||||||||||
| Total assets |
3,404 | 3,817 | 3,987 | 4,167 | 4,375 | (11 | )% | (22 | )% | |||||||||||||||||||
| Net interest margin (c) |
1.92 | % | 1.93 | % | 1.88 | % | 1.97 | % | 2.04 | % | ||||||||||||||||||
| Efficiency ratio (d) |
47.22 | % | NM | NM | 75.54 | % | 91.39 | % | ||||||||||||||||||||
|
|
|
|
|
|
|
|
|
|
|
|
|
|
|
|||||||||||||||
| Mortgage Warehouse - Period-end (millions) |
||||||||||||||||||||||||||||
| Ending warehouse balance (loans held-for-sale) |
$ | 332 | $ | 336 | $ | 346 | $ | 358 | $ | 362 | (1 | )% | (8 | )% | ||||||||||||||
|
|
|
|
|
|
|
|
|
|
|
|
|
|
|
|||||||||||||||
| Ending servicing portfolio (millions) (e) (f) |
$ | 1,679 | $ | 9,943 | $ | 15,033 | $ | 16,025 | $ | 17,055 | (83 | )% | (90 | )% | ||||||||||||||
|
|
|
|
|
|
|
|
|
|
|
|
|
|
|
|||||||||||||||
NM - Not meaningful
| * | Amount is less than one percent. |
Certain previously reported amounts have been reclassified to agree with current presentation.
| (a) | 1Q14 increase reflects the receipt of previously unrecognized servicing fees in conjunction with transfers of servicing in 1Q14, partially offset by a $2.0 million loss on the deconsolidation of a securitization trust; 3Q13 increase reflects the effect of the terms of the agreement to sell servicing, somewhat offset by a $2.2 million negative adjustment made as a result of estimated costs for obligations associated with the agreement to sell servicing; 2Q13 and 1Q13 include a gain of $1.0 million and $2.4 million, respectively, from a LOCOM reversal associated with a TRUP loan payoff. |
| (b) | 4Q13 includes $57.0 million net loss accruals related to legal matters. |
| (c) | Net interest margin is computed using total net interest income adjusted for FTE. Refer to the Non-GAAP to GAAP Reconciliation on page 22 of this supplement. |
| (d) | Noninterest expense divided by total revenue excluding securities gains/(losses). |
| (e) | Includes mortgage loans serviced from FHN’s legacy mortgage banking business, legacy equity lending serviced for others, and mortgage loans in portfolio and warehouse. |
| (f) | In 3Q13 FHN signed a definitive agreement to sell substantially all remaining legacy mortgage servicing; transfers of servicing began in fourth quarter. |
16
FHN ASSET QUALITY: CONSOLIDATED
Quarterly, Unaudited
| 1Q14 Changes vs. | ||||||||||||||||||||||||||||
| (Thousands) |
1Q14 | 4Q13 | 3Q13 | 2Q13 | 1Q13 | 4Q13 | 1Q13 | |||||||||||||||||||||
| Allowance for Loan Losses Walk-Forward |
||||||||||||||||||||||||||||
| Beginning reserve |
$ | 253,809 | $ | 255,710 | $ | 261,934 | $ | 265,218 | $ | 276,963 | (1 | )% | (8 | )% | ||||||||||||||
| Provision |
10,000 | 15,000 | 10,000 | 15,000 | 15,000 | (33 | )% | (33 | )% | |||||||||||||||||||
| Charge-offs |
(24,692 | ) | (29,000 | ) | (26,046 | ) | (30,272 | ) | (36,100 | ) | (15 | )% | (32 | )% | ||||||||||||||
| Recoveries |
8,129 | 12,099 | 9,822 | 11,988 | 9,355 | (33 | )% | (13 | )% | |||||||||||||||||||
|
|
|
|
|
|
|
|
|
|
|
|
|
|
|
|||||||||||||||
| Ending balance (Restricted - $2.0 million) (a) |
$ | 247,246 | $ | 253,809 | $ | 255,710 | $ | 261,934 | $ | 265,218 | (3 | )% | (7 | )% | ||||||||||||||
|
|
|
|
|
|
|
|
|
|
|
|
|
|
|
|||||||||||||||
| Reserve for unfunded commitments |
2,882 | 3,017 | 2,956 | 2,976 | 3,439 | (4 | )% | (16 | )% | |||||||||||||||||||
| Total allowance for loan losses plus reserve for unfunded commitments |
$ | 250,128 | $ | 256,826 | $ | 258,666 | $ | 264,910 | $ | 268,657 | (3 | )% | (7 | )% | ||||||||||||||
|
|
|
|
|
|
|
|
|
|
|
|
|
|
|
|||||||||||||||
| Allowance for Loan Losses |
||||||||||||||||||||||||||||
| Regional Banking |
$ | 128,234 | $ | 121,027 | $ | 125,440 | $ | 124,627 | $ | 120,161 | 6 | % | 7 | % | ||||||||||||||
| Non-Strategic |
119,012 | 132,782 | 130,270 | 137,307 | 145,057 | (10 | )% | (18 | )% | |||||||||||||||||||
| Corporate (b) |
NM | NM | NM | NM | NM | NM | NM | |||||||||||||||||||||
|
|
|
|
|
|
|
|
|
|
|
|
|
|
|
|||||||||||||||
| Total allowance for loan losses |
$ | 247,246 | $ | 253,809 | $ | 255,710 | $ | 261,934 | $ | 265,218 | (3 | )% | (7 | )% | ||||||||||||||
|
|
|
|
|
|
|
|
|
|
|
|
|
|
|
|||||||||||||||
| Nonperforming Assets |
||||||||||||||||||||||||||||
| Regional Banking |
||||||||||||||||||||||||||||
| Nonperforming loans |
$ | 83,275 | $ | 87,324 | $ | 118,507 | $ | 135,902 | $ | 124,824 | (5 | )% | (33 | )% | ||||||||||||||
| Foreclosed real estate (c) (d) |
27,705 | 28,806 | 33,594 | 34,561 | 13,142 | (4 | )% | NM | ||||||||||||||||||||
|
|
|
|
|
|
|
|
|
|
|
|
|
|
|
|||||||||||||||
| Total Regional Banking |
$ | 110,980 | $ | 116,130 | $ | 152,101 | $ | 170,463 | $ | 137,966 | (4 | )% | (20 | )% | ||||||||||||||
|
|
|
|
|
|
|
|
|
|
|
|
|
|
|
|||||||||||||||
| Non-Strategic |
||||||||||||||||||||||||||||
| Nonperforming loans |
$ | 153,972 | $ | 163,104 | $ | 164,534 | $ | 173,705 | $ | 129,240 | (6 | )% | 19 | % | ||||||||||||||
| Nonperforming loans held-for-sale after fair value adjustments |
61,631 | 61,139 | 65,972 | 67,077 | 60,623 | 1 | % | 2 | % | |||||||||||||||||||
| Foreclosed real estate (c) |
15,265 | 16,947 | 16,437 | 16,781 | 19,513 | (10 | )% | (22 | )% | |||||||||||||||||||
|
|
|
|
|
|
|
|
|
|
|
|
|
|
|
|||||||||||||||
| Total Non-Strategic |
$ | 230,868 | $ | 241,190 | $ | 246,943 | $ | 257,563 | $ | 209,376 | (4 | )% | 10 | % | ||||||||||||||
|
|
|
|
|
|
|
|
|
|
|
|
|
|
|
|||||||||||||||
| Corporate |
||||||||||||||||||||||||||||
| Nonperforming loans |
$ | 3,672 | $ | 4,598 | $ | 5,001 | $ | 4,526 | $ | 1,936 | (20 | )% | 90 | % | ||||||||||||||
|
|
|
|
|
|
|
|
|
|
|
|
|
|
|
|||||||||||||||
| Total nonperforming assets (e) |
$ | 345,520 | $ | 361,918 | $ | 404,045 | $ | 432,552 | $ | 349,278 | (5 | )% | (1 | )% | ||||||||||||||
|
|
|
|
|
|
|
|
|
|
|
|
|
|
|
|||||||||||||||
| Net Charge-Offs |
||||||||||||||||||||||||||||
| Regional Banking |
$ | 5,783 | $ | 6,997 | $ | 4,347 | $ | 8,735 | $ | 5,564 | (17 | )% | 4 | % | ||||||||||||||
| Non-Strategic |
10,780 | 9,904 | 11,877 | 9,549 | 21,181 | 9 | % | (49 | )% | |||||||||||||||||||
|
|
|
|
|
|
|
|
|
|
|
|
|
|
|
|||||||||||||||
| Total net charge-offs |
$ | 16,563 | $ | 16,901 | $ | 16,224 | $ | 18,284 | $ | 26,745 | (2 | )% | (38 | )% | ||||||||||||||
|
|
|
|
|
|
|
|
|
|
|
|
|
|
|
|||||||||||||||
| Consolidated Key Ratios (f) |
||||||||||||||||||||||||||||
| NPL % (e) |
1.59 | % | 1.66 | % | 1.87 | % | 1.94 | % | 1.61 | % | ||||||||||||||||||
| NPA % (d) (e) |
1.87 | 1.95 | 2.19 | 2.25 | 1.81 | |||||||||||||||||||||||
| Net charge-offs % |
0.45 | 0.44 | 0.41 | 0.46 | 0.67 | |||||||||||||||||||||||
| Allowance / loans |
1.64 | 1.65 | 1.66 | 1.62 | 1.67 | |||||||||||||||||||||||
| Allowance / NPL |
1.03x | 1.00x | 0.89x | 0.83x | 1.04x | |||||||||||||||||||||||
| Allowance / NPA |
0.87x | 0.84x | 0.76x | 0.72x | 0.92x | |||||||||||||||||||||||
| Allowance / charge-offs |
3.68x | 3.79x | 3.97x | 3.57x | 2.45x | |||||||||||||||||||||||
|
|
|
|
|
|
|
|
|
|
|
|
|
|
|
|||||||||||||||
| Other |
||||||||||||||||||||||||||||
| Loans past due 90 days or more (g) |
$ | 60,734 | $ | 69,863 | $ | 75,109 | $ | 65,367 | $ | 77,568 | (13 | )% | (22 | )% | ||||||||||||||
| Guaranteed portion (g) |
35,063 | 35,260 | 37,509 | 33,483 | 35,051 | (1 | )% | * | ||||||||||||||||||||
| Foreclosed real estate from government insured loans |
23,065 | 25,809 | 21,596 | 18,560 | 22,017 | (11 | )% | 5 | % | |||||||||||||||||||
| Period-end loans, net of unearned income (millions) |
15,119 | 15,389 | 15,409 | 16,198 | 15,890 | (2 | )% | (5 | )% | |||||||||||||||||||
| Remaining unfunded commitments (millions) |
8,238 | 8,191 | 8,184 | 7,645 | 7,727 | 1 | % | 7 | % | |||||||||||||||||||
|
|
|
|
|
|
|
|
|
|
|
|
|
|
|
|||||||||||||||
NM - Not meaningful
| * | Amount is less than one percent. |
Certain previously reported amounts have been reclassified to agree with current presentation.
| (a) | Restricted balances parenthetically presented are as of March 31, 2014. |
| (b) | The valuation adjustment taken upon exercise of clean-up calls includes expected losses. |
| (c) | Excludes foreclosed real estate from government-insured mortgages. |
| (d) | 2Q13 increase primarily relates to acquired foreclosed real estate from the MNB acquisition. |
| (e) | 2Q13 increase primarily relates to second liens placed on nonaccrual based on third party data obtained on the performance status of non-FHN serviced first liens. |
| (f) | See Glossary of Terms for definitions of Consolidated Key Ratios. |
| (g) | Includes loans held-for-sale. |
17
FHN ASSET QUALITY: CONSOLIDATED
Quarterly, Unaudited
| 1Q14 Changes vs. | ||||||||||||||||||||||||||||
| 1Q14 | 4Q13 | 3Q13 | 2Q13 | 1Q13 | 4Q13 | 1Q13 | ||||||||||||||||||||||
| Key Portfolio Details |
||||||||||||||||||||||||||||
| C&I |
||||||||||||||||||||||||||||
| Period-end loans ($ millions) |
$ | 7,753 | $ | 7,924 | $ | 7,747 | $ | 8,368 | $ | 8,091 | (2 | )% | (4 | )% | ||||||||||||||
|
|
|
|
|
|
|
|
|
|
|
|
|
|
|
|||||||||||||||
| 30+ Delinq. % (a) |
0.27 | % | 0.13 | % | 0.11 | % | 0.13 | % | 0.17 | % | ||||||||||||||||||
| NPL % |
0.68 | 1.01 | 1.33 | 1.45 | 1.40 | |||||||||||||||||||||||
| Charge-offs % (qtr. annualized) |
0.22 | 0.21 | 0.08 | 0.14 | 0.10 | |||||||||||||||||||||||
|
|
|
|
|
|
|
|
|
|
|
|
|
|
|
|||||||||||||||
| Allowance / loans % |
0.94 | % | 1.09 | % | 1.18 | % | 1.12 | % | 1.06 | % | ||||||||||||||||||
| Allowance / charge-offs |
4.27x | 5.33x | 14.16x | 8.34x | 10.94x | |||||||||||||||||||||||
|
|
|
|
|
|
|
|
|
|
|
|
|
|
|
|||||||||||||||
| Commercial Real Estate |
||||||||||||||||||||||||||||
| Period-end loans ($ millions) (b) |
$ | 1,152 | $ | 1,133 | $ | 1,174 | $ | 1,219 | $ | 1,117 | 2 | % | 3 | % | ||||||||||||||
|
|
|
|
|
|
|
|
|
|
|
|
|
|
|
|||||||||||||||
| 30+ Delinq. % (a) |
1.61 | % | 0.90 | % | 0.60 | % | 0.54 | % | 0.42 | % | ||||||||||||||||||
| NPL % |
1.30 | 1.60 | 2.13 | 2.74 | 3.46 | |||||||||||||||||||||||
| Charge-offs % (qtr. annualized) |
0.12 | NM | NM | NM | 0.26 | |||||||||||||||||||||||
|
|
|
|
|
|
|
|
|
|
|
|
|
|
|
|||||||||||||||
| Allowance / loans % (c) |
1.35 | % | 0.94 | % | 0.94 | % | 1.14 | % | 1.36 | % | ||||||||||||||||||
| Allowance / charge-offs |
10.97x | NM | NM | NM | 5.08x | |||||||||||||||||||||||
|
|
|
|
|
|
|
|
|
|
|
|
|
|
|
|||||||||||||||
| Consumer Real Estate |
||||||||||||||||||||||||||||
| Period-end loans ($ millions) |
$ | 5,258 | $ | 5,333 | $ | 5,458 | $ | 5,549 | $ | 5,590 | (1 | )% | (6 | )% | ||||||||||||||
|
|
|
|
|
|
|
|
|
|
|
|
|
|
|
|||||||||||||||
| 30+ Delinq. % (a) |
1.01 | % | 1.13 | % | 1.05 | % | 1.10 | % | 1.21 | % | ||||||||||||||||||
| NPL % (d) |
2.51 | 2.20 | 2.23 | 2.15 | 1.21 | |||||||||||||||||||||||
| Charge-offs % (qtr. annualized) |
0.56 | 0.62 | 0.87 | 0.96 | 1.33 | |||||||||||||||||||||||
|
|
|
|
|
|
|
|
|
|
|
|
|
|
|
|||||||||||||||
| Allowance / loans % |
2.35 | % | 2.38 | % | 2.21 | % | 2.18 | % | 2.35 | % | ||||||||||||||||||
| Allowance / charge-offs |
4.17x | 3.79x | 2.54x | 2.26x | 1.75x | |||||||||||||||||||||||
|
|
|
|
|
|
|
|
|
|
|
|
|
|
|
|||||||||||||||
| Permanent Mortgage |
||||||||||||||||||||||||||||
| Period-end loans ($ millions) |
$ | 622 | $ | 662 | $ | 698 | $ | 746 | $ | 793 | (6 | )% | (22 | )% | ||||||||||||||
|
|
|
|
|
|
|
|
|
|
|
|
|
|
|
|||||||||||||||
| 30+ Delinq. % (a) |
1.44 | % | 2.62 | % | 2.48 | % | 2.51 | % | 2.16 | % | ||||||||||||||||||
| NPL % |
6.46 | 5.76 | 5.30 | 5.14 | 4.37 | |||||||||||||||||||||||
| Charge-offs % (qtr. annualized) |
1.04 | 1.46 | 0.29 | 0.62 | 1.64 | |||||||||||||||||||||||
|
|
|
|
|
|
|
|
|
|
|
|
|
|
|
|||||||||||||||
| Allowance / loans % |
3.62 | % | 3.40 | % | 3.66 | % | 3.63 | % | 3.21 | % | ||||||||||||||||||
| Allowance / charge-offs |
3.39x | 2.27x | 12.26x | 5.64x | 1.93x | |||||||||||||||||||||||
|
|
|
|
|
|
|
|
|
|
|
|
|
|
|
|||||||||||||||
| Credit Card and Other |
||||||||||||||||||||||||||||
| Period-end loans ($ millions) |
$ | 334 | $ | 337 | $ | 332 | $ | 316 | $ | 299 | (1 | )% | 12 | % | ||||||||||||||
|
|
|
|
|
|
|
|
|
|
|
|
|
|
|
|||||||||||||||
| 30+ Delinq. % (a) |
1.30 | % | 1.35 | % | 1.11 | % | 1.00 | % | 1.25 | % | ||||||||||||||||||
| NPL % |
0.42 | 0.42 | 0.42 | 0.54 | 0.57 | |||||||||||||||||||||||
| Charge-offs % (qtr. annualized) |
3.71 | 3.05 | 2.61 | 2.22 | 3.25 | |||||||||||||||||||||||
|
|
|
|
|
|
|
|
|
|
|
|
|
|
|
|||||||||||||||
| Allowance / loans % |
3.91 | % | 2.22 | % | 2.09 | % | 2.07 | % | 2.38 | % | ||||||||||||||||||
| Allowance / charge-offs |
1.05x | 0.73x | 0.82x | 0.97x | 0.75x | |||||||||||||||||||||||
|
|
|
|
|
|
|
|
|
|
|
|
|
|
|
|||||||||||||||
NM - Not meaningful
Certain previously reported amounts have been reclassified to agree with current presentation.
| (a) | 30+ Delinquency % includes all accounts delinquent more than one month and still accruing interest. |
| (b) | 2Q13 increase is related to MNB acquisition. |
| (c) | 2Q13 decline is related to MNB loans that were acquired at fair value with no allowance at acquisition. |
| (d) | NPL levels affected by the impact of placing second liens on nonaccrual based on third party data obtained on the performance status of non-FHN serviced first liens beginning in 2Q13. |
18
FHN ASSET QUALITY: REGIONAL BANKING
Quarterly, Unaudited
| 1Q14 Changes vs. | ||||||||||||||||||||||||||||
| 1Q14 | 4Q13 | 3Q13 | 2Q13 | 1Q13 | 4Q13 | 1Q13 | ||||||||||||||||||||||
| Total Regional Banking |
||||||||||||||||||||||||||||
| Period-end loans ($ millions) |
$ | 12,042 | $ | 12,167 | $ | 12,039 | $ | 12,634 | $ | 12,127 | (1 | )% | (1 | )% | ||||||||||||||
|
|
|
|
|
|
|
|
|
|
|
|
|
|
|
|||||||||||||||
| 30+ Delinq. % (a) |
0.52 | % | 0.38 | % | 0.35 | % | 0.31 | % | 0.36 | % | ||||||||||||||||||
| NPL % |
0.69 | 0.72 | 0.98 | 1.08 | 1.03 | |||||||||||||||||||||||
| Charge-offs % (qtr. annualized) |
0.20 | 0.23 | 0.14 | 0.29 | 0.18 | |||||||||||||||||||||||
|
|
|
|
|
|
|
|
|
|
|
|
|
|
|
|||||||||||||||
| Allowance / loans % |
1.06 | % | 0.99 | % | 1.04 | % | 0.99 | % | 0.99 | % | ||||||||||||||||||
| Allowance / charge-offs |
5.47x | 4.36x | 7.27x | 3.56x | 5.32x | |||||||||||||||||||||||
|
|
|
|
|
|
|
|
|
|
|
|
|
|
|
|||||||||||||||
| Key Portfolio Details |
||||||||||||||||||||||||||||
| C&I |
||||||||||||||||||||||||||||
| Period-end loans ($ millions) |
$ | 7,287 | $ | 7,431 | $ | 7,254 | $ | 7,865 | $ | 7,580 | (2 | )% | (4 | )% | ||||||||||||||
|
|
|
|
|
|
|
|
|
|
|
|
|
|
|
|||||||||||||||
| 30+ Delinq. % (a) |
0.26 | % | 0.14 | % | 0.12 | % | 0.13 | % | 0.17 | % | ||||||||||||||||||
| NPL % |
0.55 | 0.59 | 0.92 | 0.96 | 0.89 | |||||||||||||||||||||||
| Charge-offs % (qtr. annualized) |
0.07 | 0.24 | 0.07 | 0.27 | 0.10 | |||||||||||||||||||||||
|
|
|
|
|
|
|
|
|
|
|
|
|
|
|
|||||||||||||||
| Allowance / loans % |
0.93 | % | 0.97 | % | 1.06 | % | 0.99 | % | 0.92 | % | ||||||||||||||||||
| Allowance / charge-offs |
13.74x | 4.24x | 15.09x | 3.81x | 8.71x | |||||||||||||||||||||||
|
|
|
|
|
|
|
|
|
|
|
|
|
|
|
|||||||||||||||
| Commercial Real Estate |
||||||||||||||||||||||||||||
| Period-end loans ($ millions) (b) |
$ | 1,145 | $ | 1,124 | $ | 1,164 | $ | 1,202 | $ | 1,098 | 2 | % | 4 | % | ||||||||||||||
|
|
|
|
|
|
|
|
|
|
|
|
|
|
|
|||||||||||||||
| 30+ Delinq. % (a) (c) |
1.62 | % | 0.91 | % | 0.61 | % | 0.55 | % | 0.43 | % | ||||||||||||||||||
| NPL % |
1.05 | 1.35 | 1.87 | 2.38 | 3.01 | |||||||||||||||||||||||
| Charge-offs % (qtr. annualized) |
0.10 | NM | NM | NM | 0.34 | |||||||||||||||||||||||
|
|
|
|
|
|
|
|
|
|
|
|
|
|
|
|||||||||||||||
| Allowance / loans % (d) |
1.31 | % | 0.88 | % | 0.88 | % | 1.03 | % | 1.25 | % | ||||||||||||||||||
| Allowance / charge-offs |
13.38x | NM | NM | NM | 3.59x | |||||||||||||||||||||||
|
|
|
|
|
|
|
|
|
|
|
|
|
|
|
|||||||||||||||
| Consumer Real Estate |
||||||||||||||||||||||||||||
| Period-end loans ($ millions) |
$ | 3,280 | $ | 3,278 | $ | 3,291 | $ | 3,253 | $ | 3,152 | * | 4 | % | |||||||||||||||
|
|
|
|
|
|
|
|
|
|
|
|
|
|
|
|||||||||||||||
| 30+ Delinq. % (a) |
0.62 | % | 0.65 | % | 0.66 | % | 0.58 | % | 0.68 | % | ||||||||||||||||||
| NPL % (e) |
0.92 | 0.85 | 0.90 | 0.97 | 0.74 | |||||||||||||||||||||||
| Charge-offs % (qtr. annualized) |
0.18 | 0.12 | 0.14 | 0.31 | 0.07 | |||||||||||||||||||||||
|
|
|
|
|
|
|
|
|
|
|
|
|
|
|
|||||||||||||||
| Allowance / loans % |
0.99 | % | 0.96 | % | 0.95 | % | 0.87 | % | 0.96 | % | ||||||||||||||||||
| Allowance / charge-offs |
5.42x | 7.72x | 6.84x | 2.85x | 13.36x | |||||||||||||||||||||||
|
|
|
|
|
|
|
|
|
|
|
|
|
|
|
|||||||||||||||
| Credit Card, Permanent Mortgage, and Other |
||||||||||||||||||||||||||||
| Period-end loans ($ millions) |
$ | 330 | $ | 334 | $ | 330 | $ | 314 | $ | 297 | (1 | )% | 11 | % | ||||||||||||||
|
|
|
|
|
|
|
|
|
|
|
|
|
|
|
|||||||||||||||
| 30+ Delinq. % (a) |
1.38 | % | 1.55 | % | 1.29 | % | 1.14 | % | 1.40 | % | ||||||||||||||||||
| NPL % |
0.27 | 0.16 | 0.20 | 0.20 | 0.34 | |||||||||||||||||||||||
| Charge-offs % (qtr. annualized) |
3.43 | 2.92 | 2.52 | 2.03 | 2.94 | |||||||||||||||||||||||
|
|
|
|
|
|
|
|
|
|
|
|
|
|
|
|||||||||||||||
| Allowance / loans % |
3.91 | % | 2.21 | % | 2.04 | % | 2.02 | % | 2.26 | % | ||||||||||||||||||
| Allowance / charge-offs |
1.13x | 0.76x | 0.83x | 1.03x | 0.79x | |||||||||||||||||||||||
|
|
|
|
|
|
|
|
|
|
|
|
|
|
|
|||||||||||||||
| ASSET QUALITY: CORPORATE | ||||||||||||||||||||||||||||
| Permanent Mortgage |
||||||||||||||||||||||||||||
| Period-end loans ($ millions) |
$ | 164 | $ | 175 | $ | 185 | $ | 205 | $ | 229 | (6 | )% | (28 | )% | ||||||||||||||
|
|
|
|
|
|
|
|
|
|
|
|
|
|
|
|||||||||||||||
| 30+ Delinq. % (a) |
1.83 | % | 2.34 | % | 2.05 | % | 1.83 | % | 2.55 | % | ||||||||||||||||||
| NPL % |
2.24 | 2.63 | 2.70 | 2.21 | 0.84 | |||||||||||||||||||||||
| Charge-offs % (qtr. annualized) |
NM | NM | NM | NM | NM | |||||||||||||||||||||||
|
|
|
|
|
|
|
|
|
|
|
|
|
|
|
|||||||||||||||
| Allowance / loans % |
NM | NM | NM | NM | NM | |||||||||||||||||||||||
| Allowance / charge-offs |
NM | NM | NM | NM | NM | |||||||||||||||||||||||
|
|
|
|
|
|
|
|
|
|
|
|
|
|
|
|||||||||||||||
NM - Not meaningful
| * | Amount is less than one percent. |
Certain previously reported amounts have been reclassified to agree with current presentation.
| (a) | 30+ Delinquency % includes all accounts delinquent more than one month and still accruing interest. |
| (b) | 2Q13 increase is related to MNB acquisition. |
| (c) | 1Q14 increase is primarily driven by 2 purchase credit impaired loans acquired from MNB. |
| (d) | 2Q13 decline is related to MNB loans that were acquired at fair value with no allowance at acquisition. |
| (e) | NPL levels affected by the impact of placing second liens on nonaccrual based on third party data obtained on the performance status of non-FHN serviced first liens beginning in 2Q13. |
19
FHN ASSET QUALITY: NON-STRATEGIC
Quarterly, Unaudited
| 1Q14 Changes vs. | ||||||||||||||||||||||||||||
| 1Q14 | 4Q13 | 3Q13 | 2Q13 | 1Q13 | 4Q13 | 1Q13 | ||||||||||||||||||||||
| Total Non-Strategic |
||||||||||||||||||||||||||||
| Period-end loans ($ millions) |
$ | 2,913 | $ | 3,047 | $ | 3,185 | $ | 3,359 | $ | 3,534 | (4 | )% | (18 | )% | ||||||||||||||
|
|
|
|
|
|
|
|
|
|
|
|
|
|
|
|||||||||||||||
| 30+ Delinq. % (a) |
1.38 | % | 1.70 | % | 1.53 | % | 1.70 | % | 1.62 | % | ||||||||||||||||||
| NPL % (b) |
5.28 | 5.35 | 5.17 | 5.17 | 3.66 | |||||||||||||||||||||||
| Charge-offs % (qtr. annualized) |
1.46 | 1.26 | 1.44 | 1.11 | 2.36 | |||||||||||||||||||||||
|
|
|
|
|
|
|
|
|
|
|
|
|
|
|
|||||||||||||||
| Allowance / loans % |
4.08 | % | 4.36 | % | 4.09 | % | 4.09 | % | 4.10 | % | ||||||||||||||||||
| Allowance / charge-offs |
2.72x | 3.38x | 2.76x | 3.58x | 1.69x | |||||||||||||||||||||||
|
|
|
|
|
|
|
|
|
|
|
|
|
|
|
|||||||||||||||
| Key Portfolio Details |
||||||||||||||||||||||||||||
| C&I |
||||||||||||||||||||||||||||
| Period-end loans ($ millions) |
$ | 466 | $ | 492 | $ | 493 | $ | 503 | $ | 512 | (5 | )% | (9 | )% | ||||||||||||||
|
|
|
|
|
|
|
|
|
|
|
|
|
|
|
|||||||||||||||
| 30+ Delinq. % (a) |
0.43 | % | 0.06 | % | 0.04 | % | 0.04 | % | 0.08 | % | ||||||||||||||||||
| NPL % (c) |
2.64 | 7.33 | 7.36 | 9.13 | 8.95 | |||||||||||||||||||||||
| Charge-offs % (qtr. annualized) |
2.48 | NM | 0.27 | NM | NM | |||||||||||||||||||||||
|
|
|
|
|
|
|
|
|
|
|
|
|
|
|
|||||||||||||||
| Allowance / loans % |
1.02 | % | 2.87 | % | 2.89 | % | 3.14 | % | 3.24 | % | ||||||||||||||||||
| Allowance / charge-offs |
0.39x | NM | 10.61x | NM | NM | |||||||||||||||||||||||
|
|
|
|
|
|
|
|
|
|
|
|
|
|
|
|||||||||||||||
| Commercial Real Estate |
||||||||||||||||||||||||||||
| Period-end loans ($ millions) |
$ | 7 | $ | 9 | $ | 10 | $ | 16 | $ | 19 | (22 | )% | (63 | )% | ||||||||||||||
|
|
|
|
|
|
|
|
|
|
|
|
|
|
|
|||||||||||||||
| 30+ Delinq. % (a) |
— | % | — | % | — | % | — | % | — | % | ||||||||||||||||||
| NPL % |
40.93 | 32.30 | 32.16 | 29.38 | 29.86 | |||||||||||||||||||||||
| Charge-offs % (qtr. annualized) |
3.46 | 3.72 | 1.74 | NM | NM | |||||||||||||||||||||||
|
|
|
|
|
|
|
|
|
|
|
|
|
|
|
|||||||||||||||
| Allowance / loans % |
7.43 | % | 7.98 | % | 7.55 | % | 9.56 | % | 7.58 | % | ||||||||||||||||||
| Allowance / charge-offs |
1.80x | 2.00x | 2.93x | NM | NM | |||||||||||||||||||||||
|
|
|
|
|
|
|
|
|
|
|
|
|
|
|
|||||||||||||||
| Consumer Real Estate |
||||||||||||||||||||||||||||
| Period-end loans ($ millions) |
$ | 1,978 | $ | 2,055 | $ | 2,167 | $ | 2,297 | $ | 2,438 | (4 | )% | (19 | )% | ||||||||||||||
|
|
|
|
|
|
|
|
|
|
|
|
|
|
|
|||||||||||||||
| 30+ Delinq. % (a) |
1.65 | % | 1.89 | % | 1.64 | % | 1.84 | % | 1.89 | % | ||||||||||||||||||
| NPL % (b) |
5.14 | 4.36 | 4.26 | 3.84 | 1.83 | |||||||||||||||||||||||
| Charge-offs % (qtr. annualized) |
1.17 | 1.39 | 1.93 | 1.84 | 2.90 | |||||||||||||||||||||||
|
|
|
|
|
|
|
|
|
|
|
|
|
|
|
|||||||||||||||
| Allowance / loans % |
4.60 | % | 4.64 | % | 4.13 | % | 4.03 | % | 4.15 | % | ||||||||||||||||||
| Allowance / charge-offs |
3.86x | 3.25x | 2.08x | 2.12x | 1.39x | |||||||||||||||||||||||
|
|
|
|
|
|
|
|
|
|
|
|
|
|
|
|||||||||||||||
| Permanent Mortgage |
||||||||||||||||||||||||||||
| Period-end loans ($ millions) |
$ | 446 | $ | 475 | $ | 499 | $ | 527 | $ | 548 | (6 | )% | (19 | )% | ||||||||||||||
|
|
|
|
|
|
|
|
|
|
|
|
|
|
|
|||||||||||||||
| 30+ Delinq. % (a) |
1.21 | % | 2.59 | % | 2.55 | % | 2.70 | % | 1.91 | % | ||||||||||||||||||
| NPL % |
7.99 | 6.96 | 6.28 | 6.31 | 5.78 | |||||||||||||||||||||||
| Charge-offs % (qtr. annualized) |
1.46 | 2.04 | 0.41 | 0.89 | 2.35 | |||||||||||||||||||||||
|
|
|
|
|
|
|
|
|
|
|
|
|
|
|
|||||||||||||||
| Allowance / loans % |
5.00 | % | 4.68 | % | 5.07 | % | 5.10 | % | 4.62 | % | ||||||||||||||||||
| Allowance / charge-offs |
3.36x | 2.25x | 12.14x | 5.58x | 1.93x | |||||||||||||||||||||||
|
|
|
|
|
|
|
|
|
|
|
|
|
|
|
|||||||||||||||
| Other Consumer |
||||||||||||||||||||||||||||
| Period-end loans ($ millions) |
$ | 16 | $ | 16 | $ | 16 | $ | 16 | $ | 17 | * | (6 | )% | |||||||||||||||
|
|
|
|
|
|
|
|
|
|
|
|
|
|
|
|||||||||||||||
| 30+ Delinq. % (a) |
1.95 | % | 2.33 | % | 1.63 | % | 1.99 | % | 2.26 | % | ||||||||||||||||||
| NPL % |
9.03 | 8.66 | 8.53 | 10.02 | 9.61 | |||||||||||||||||||||||
| Charge-offs % (qtr. annualized) |
6.83 | 3.35 | 2.12 | 3.72 | 5.44 | |||||||||||||||||||||||
|
|
|
|
|
|
|
|
|
|
|
|
|
|
|
|||||||||||||||
| Allowance / loans % |
2.12 | % | 2.25 | % | 3.06 | % | 2.85 | % | 2.78 | % | ||||||||||||||||||
| Allowance / charge-offs |
0.30x | 0.66x | 1.41x | 0.75x | 0.50x | |||||||||||||||||||||||
|
|
|
|
|
|
|
|
|
|
|
|
|
|
|
|||||||||||||||
NM - Not meaningful
| * | Amount is less than one percent. |
Certain previously reported amounts have been reclassified to agree with current presentation.
| (a) | 30+ Delinquency % includes all accounts delinquent more than one month and still accruing interest. |
| (b) | NPL levels affected by the impact of placing second liens on nonaccrual based on third party data obtained on the performance status of non-FHN serviced first liens beginning in 2Q13. |
| (c) | 1Q14 NPL decrease related to TRUPs sale. |
20
FHN: PORTFOLIO METRICS
Unaudited
C&I Portfolio: $7.8 Billion (51.3% of Total Loans) as of March 31, 2014
| % OS | ||||
| General Corporate, Commercial, and Business Banking Loans |
86 | % | ||
| Loans to Mortgage Companies |
9 | % | ||
| Trust Preferred Loans |
4 | % | ||
| Bank Holding Company Loans |
1 | % | ||
Consumer Real Estate (primarily Home Equity) Portfolio: $5.3 Billion (34.8% of Total Loans)
| Origination LTV and FICO for Portfolio as of March 31, 2014 | Loan-to-Value | |||||||||||||||
| (excludes whole loan insurance) |
<=60% | >60% - <=80% | >80% - 90% | >90% | ||||||||||||
| FICO score greater than or equal to 740 |
11 | % | 23 | % | 17 | % | 8 | % | ||||||||
| FICO score 720-739 |
2 | % | 4 | % | 4 | % | 2 | % | ||||||||
| FICO score 700-719 |
1 | % | 4 | % | 4 | % | 2 | % | ||||||||
| FICO score 660-699 |
2 | % | 4 | % | 4 | % | 3 | % | ||||||||
| FICO score 620-659 |
— | % | 1 | % | 1 | % | 1 | % | ||||||||
| FICO score less than 620 |
— | % | 1 | % | — | % | 1 | % | ||||||||
| Origination LTV and FICO for Portfolio - Regional Bank as of March 31, 2014 | Loan-to-Value | |||||||||||||||
| (excludes whole loan insurance) |
<=60% | >60% - <=80% | >80% - 90% | >90% | ||||||||||||
| FICO score greater than or equal to 740 |
13 | % | 24 | % | 18 | % | 10 | % | ||||||||
| FICO score 720-739 |
1 | % | 4 | % | 3 | % | 2 | % | ||||||||
| FICO score 700-719 |
1 | % | 3 | % | 2 | % | 2 | % | ||||||||
| FICO score 660-699 |
1 | % | 4 | % | 3 | % | 2 | % | ||||||||
| FICO score 620-659 |
1 | % | 1 | % | 1 | % | 1 | % | ||||||||
| FICO score less than 620 |
— | % | 1 | % | 1 | % | 1 | % | ||||||||
| Origination LTV and FICO for Portfolio - Non-Strategic as of March 31, 2014 | Loan-to-Value | |||||||||||||||
| (excludes whole loan insurance) |
<=60% | >60% - <=80% | >80% - 90% | >90% | ||||||||||||
| FICO score greater than or equal to 740 |
8 | % | 22 | % | 15 | % | 5 | % | ||||||||
| FICO score 720-739 |
2 | % | 6 | % | 6 | % | 2 | % | ||||||||
| FICO score 700-719 |
2 | % | 6 | % | 6 | % | 2 | % | ||||||||
| FICO score 660-699 |
2 | % | 5 | % | 4 | % | 3 | % | ||||||||
| FICO score 620-659 |
— | % | 1 | % | 1 | % | 1 | % | ||||||||
| FICO score less than 620 |
— | % | — | % | — | % | 1 | % | ||||||||
Consumer Real Estate Portfolio Detail:
| Origination Characteristics | ||||||||||||||||||||||||
| Vintage |
Balances ($B) | W/A Age (mo.) | CLTV | FICO | % TN | % 1st lien | ||||||||||||||||||
| pre-2003 |
$ | 0.1 | 147 | 78 | % | 704 | 43 | % | 32 | % | ||||||||||||||
| 2003 |
$ | 0.2 | 129 | 76 | % | 720 | 31 | % | 38 | % | ||||||||||||||
| 2004 |
$ | 0.4 | 116 | 80 | % | 723 | 21 | % | 27 | % | ||||||||||||||
| 2005 |
$ | 0.7 | 104 | 81 | % | 729 | 17 | % | 16 | % | ||||||||||||||
| 2006 |
$ | 0.6 | 93 | 78 | % | 732 | 21 | % | 17 | % | ||||||||||||||
| 2007 |
$ | 0.7 | 81 | 80 | % | 736 | 26 | % | 19 | % | ||||||||||||||
| 2008 |
$ | 0.3 | 70 | 75 | % | 745 | 72 | % | 50 | % | ||||||||||||||
| 2009 |
$ | 0.2 | 58 | 72 | % | 749 | 87 | % | 57 | % | ||||||||||||||
| 2010 |
$ | 0.2 | 44 | 81 | % | 750 | 92 | % | 73 | % | ||||||||||||||
| 2011 |
$ | 0.4 | 32 | 77 | % | 760 | 89 | % | 86 | % | ||||||||||||||
| 2012 |
$ | 0.8 | 21 | 76 | % | 763 | 89 | % | 91 | % | ||||||||||||||
| 2013 |
$ | 0.6 | 10 | 77 | % | 758 | 86 | % | 84 | % | ||||||||||||||
| 2014 |
$ | 0.1 | 1 | 79 | % | 756 | 89 | % | 84 | % | ||||||||||||||
| Total |
$ | 5.3 | 64 | 78 | % | 743 | (a) | 55 | % | 51 | % | |||||||||||||
|
|
|
|
|
|
|
|
|
|
|
|
|
|||||||||||||
| (a) | 743 average portfolio origination FICO; 736 weighted average portfolio FICO (refreshed). |
21
FHN NON-GAAP TO GAAP RECONCILIATION
Quarterly, Unaudited
| (Thousands) |
1Q14 | 4Q13 | 3Q13 | 2Q13 | 1Q13 | |||||||||||||||
| Tangible Common Equity (Non-GAAP) |
||||||||||||||||||||
| (A) Total equity (GAAP) |
$ | 2,544,137 | $ | 2,500,751 | $ | 2,433,293 | $ | 2,546,408 | $ | 2,599,727 | ||||||||||
| Less: Noncontrolling interest (a) |
295,431 | 295,431 | 295,431 | 295,431 | 295,257 | |||||||||||||||
| Less: Preferred stock |
95,624 | 95,624 | 95,624 | 95,624 | 95,624 | |||||||||||||||
|
|
|
|
|
|
|
|
|
|
|
|||||||||||
| (B) Total common equity |
$ | 2,153,082 | $ | 2,109,696 | $ | 2,042,238 | $ | 2,155,353 | $ | 2,208,846 | ||||||||||
| Less: Intangible assets (GAAP) (b) |
162,950 | 163,931 | 162,695 | 163,623 | 156,014 | |||||||||||||||
|
|
|
|
|
|
|
|
|
|
|
|||||||||||
| (C) Tangible common equity (Non-GAAP) |
$ | 1,990,132 | $ | 1,945,765 | $ | 1,879,543 | $ | 1,991,730 | $ | 2,052,832 | ||||||||||
| Less: Unrealized gains/(losses) on AFS securities, net of tax |
(1,762 | ) | (11,241 | ) | 11,153 | 9,439 | 48,591 | |||||||||||||
|
|
|
|
|
|
|
|
|
|
|
|||||||||||
| (D) Adjusted tangible common equity (Non-GAAP) (c) |
$ | 1,991,894 | $ | 1,957,006 | $ | 1,868,390 | $ | 1,982,291 | $ | 2,004,241 | ||||||||||
|
|
|
|
|
|
|
|
|
|
|
|||||||||||
| Tangible Assets (Non-GAAP) |
||||||||||||||||||||
| (E) Total assets (GAAP) |
$ | 23,941,989 | $ | 23,789,833 | $ | 23,858,753 | $ | 24,852,800 | $ | 24,803,048 | ||||||||||
| Less: Intangible assets (GAAP) (b) |
162,950 | 163,931 | 162,695 | 163,623 | 156,014 | |||||||||||||||
|
|
|
|
|
|
|
|
|
|
|
|||||||||||
| (F) Tangible assets (Non-GAAP) |
$ | 23,779,039 | $ | 23,625,902 | $ | 23,696,058 | $ | 24,689,177 | $ | 24,647,034 | ||||||||||
|
|
|
|
|
|
|
|
|
|
|
|||||||||||
| Period-end Shares Outstanding |
||||||||||||||||||||
| (G) Period-end shares outstanding |
236,586 | 236,370 | 236,328 | 240,555 | 241,225 | |||||||||||||||
|
|
|
|
|
|
|
|
|
|
|
|||||||||||
| Tier 1 Common (Non-GAAP) |
||||||||||||||||||||
| (H) Tier 1 capital (d) (e) |
$ | 2,666,485 | $ | 2,618,976 | $ | 2,555,140 | $ | 2,712,398 | $ | 2,738,558 | ||||||||||
| Less: Noncontrolling interest - FTBNA preferred stock (a) (f) |
294,816 | 294,816 | 294,816 | 294,816 | 294,816 | |||||||||||||||
| Less: Preferred Stock |
95,624 | 95,624 | 95,624 | 95,624 | 95,624 | |||||||||||||||
| Less: Trust preferred (g) |
200,000 | 200,000 | 200,000 | 200,000 | 200,000 | |||||||||||||||
|
|
|
|
|
|
|
|
|
|
|
|||||||||||
| (I) Tier 1 common (Non-GAAP) |
$ | 2,076,045 | $ | 2,028,536 | $ | 1,964,700 | $ | 2,121,958 | $ | 2,148,118 | ||||||||||
|
|
|
|
|
|
|
|
|
|
|
|||||||||||
| Risk Weighted Assets |
||||||||||||||||||||
| (J) Risk weighted assets (d) (e) |
$ | 18,773,300 | $ | 18,878,594 | $ | 19,236,793 | $ | 20,419,119 | $ | 20,192,003 | ||||||||||
|
|
|
|
|
|
|
|
|
|
|
|||||||||||
| Ratios |
||||||||||||||||||||
| (C)/(F) Tangible common equity to tangible assets (“TCE/TA”) (Non-GAAP) |
8.37 | % | 8.24 | % | 7.93 | % | 8.07 | % | 8.33 | % | ||||||||||
| (A)/(E) Total equity to total assets (GAAP) |
10.63 | % | 10.51 | % | 10.20 | % | 10.25 | % | 10.48 | % | ||||||||||
| (C)/(G) Tangible book value per common share (Non-GAAP) |
$ | 8.41 | $ | 8.23 | $ | 7.95 | $ | 8.28 | $ | 8.51 | ||||||||||
| (B)/(G) Book value per common share (GAAP) |
$ | 9.10 | $ | 8.93 | $ | 8.64 | $ | 8.96 | $ | 9.16 | ||||||||||
| (I)/(J) Tier 1 common to risk weighted assets (Non-GAAP) (d) |
11.06 | % | 10.75 | % | 10.21 | % | 10.39 | % | 10.64 | % | ||||||||||
| (H)/(E) Tier 1 capital to total assets (GAAP) (d) |
11.14 | % | 11.01 | % | 10.71 | % | 10.91 | % | 11.04 | % | ||||||||||
| (D)/(J) Adjusted tangible common equity to risk weighted assets (“TCE/RWA”) (Non-GAAP) (c) (d) |
10.61 | % | 10.37 | % | 9.71 | % | 9.71 | % | 9.93 | % | ||||||||||
|
|
|
|
|
|
|
|
|
|
|
|||||||||||
| Net interest income adjusted for impact of fully taxable equivalent (“FTE”) (Non-GAAP) |
||||||||||||||||||||
| Regional Banking |
||||||||||||||||||||
| Net interest income (GAAP) |
$ | 142,010 | $ | 146,427 | $ | 149,541 | $ | 148,220 | $ | 147,120 | ||||||||||
| FTE adjustment |
1,830 | 1,909 | 1,806 | 1,756 | 1,670 | |||||||||||||||
|
|
|
|
|
|
|
|
|
|
|
|||||||||||
| Net interest income adjusted for impact of FTE (Non-GAAP) |
$ | 143,840 | $ | 148,336 | $ | 151,347 | $ | 149,976 | $ | 148,790 | ||||||||||
|
|
|
|
|
|
|
|
|
|
|
|||||||||||
| Capital Markets |
||||||||||||||||||||
| Net interest income (GAAP) |
$ | 3,478 | $ | 4,301 | $ | 3,811 | $ | 4,097 | $ | 3,968 | ||||||||||
| FTE adjustment |
117 | 128 | 81 | 149 | 109 | |||||||||||||||
|
|
|
|
|
|
|
|
|
|
|
|||||||||||
| Net interest income adjusted for impact of FTE (Non-GAAP) |
$ | 3,595 | $ | 4,429 | $ | 3,892 | $ | 4,246 | $ | 4,077 | ||||||||||
|
|
|
|
|
|
|
|
|
|
|
|||||||||||
| Corporate |
||||||||||||||||||||
| Net interest income (GAAP) |
$ | (9,113 | ) | $ | (10,413 | ) | $ | (11,654 | ) | $ | (11,182 | ) | $ | (10,059 | ) | |||||
| FTE adjustment |
40 | 7 | 7 | 8 | 8 | |||||||||||||||
|
|
|
|
|
|
|
|
|
|
|
|||||||||||
| Net interest income adjusted for impact of FTE (Non-GAAP) |
$ | (9,073 | ) | $ | (10,406 | ) | $ | (11,647 | ) | $ | (11,174 | ) | $ | (10,051 | ) | |||||
|
|
|
|
|
|
|
|
|
|
|
|||||||||||
| Non-Strategic |
||||||||||||||||||||
| Net interest income (GAAP) |
$ | 15,984 | $ | 16,820 | $ | 17,140 | $ | 18,884 | $ | 20,353 | ||||||||||
| FTE adjustment |
— | — | — | — | — | |||||||||||||||
|
|
|
|
|
|
|
|
|
|
|
|||||||||||
| Net interest income adjusted for impact of FTE (Non-GAAP) |
$ | 15,984 | $ | 16,820 | $ | 17,140 | $ | 18,884 | $ | 20,353 | ||||||||||
|
|
|
|
|
|
|
|
|
|
|
|||||||||||
| Total Consolidated |
||||||||||||||||||||
| Net interest income (GAAP) |
$ | 152,359 | $ | 157,135 | $ | 158,838 | $ | 160,019 | $ | 161,382 | ||||||||||
| FTE adjustment |
1,987 | 2,044 | 1,894 | 1,913 | 1,787 | |||||||||||||||
|
|
|
|
|
|
|
|
|
|
|
|||||||||||
| Net interest income adjusted for impact of FTE (Non-GAAP) |
$ | 154,346 | $ | 159,179 | $ | 160,732 | $ | 161,932 | $ | 163,169 | ||||||||||
|
|
|
|
|
|
|
|
|
|
|
|||||||||||
Certain previously reported amounts have been reclassified to agree with current presentation.
| (a) | Included in Total equity on the Consolidated Balance Sheet. |
| (b) | Includes goodwill and other intangible assets, net of amortization. |
| (c) | See Glossary of Terms for definition of ratio. |
| (d) | Current quarter is an estimate. |
| (e) | Defined by and calculated in conformity with bank regulations. |
| (f) | Represents FTBNA preferred stock included in noncontrolling interest. |
| (g) | Included in Term borrowings on the Consolidated Balance Sheet. |
22
FHN GLOSSARY OF TERMS
Adjusted Tangible Common Equity to Risk Weighted Assets: Common equity excluding intangible assets and unrealized gains/losses on available-for-sale securities divided by risk weighted assets.
Core Businesses: Management treats regional banking, capital markets, and corporate as FHN’s core businesses. Non-strategic has significant legacy assets and operations that are being wound down.
Lower of Cost or Market (“LOCOM”): A method of accounting for certain assets by recording them at the lower of their historical cost or their current market value.
Purchase Credit Impaired (“PCI”) Loans: Acquired loans that have experienced deterioration of credit quality between origination and the time of acquisition and for which the timely collection of the interest and principal is no longer reasonably assured.
Restricted Real Estate Loans: Restricted loans that are assets of a consolidated variable interest entity that can be used only to settle obligations of the consolidated variable interest entity.
Troubled Debt Restructuring (“TDR”): A restructuring of debt whereby a creditor for economic or legal reasons related to the borrower’s financial difficulties grants a concession to the borrower that it would not otherwise consider. Such concession is granted in an attempt to protect as much of the creditor’s investment as possible by increasing the probability of repayment.
Asset Quality - Consolidated Key Ratios
NPL %: Ratio is nonperforming loans in the loan portfolio to total period-end loans.
NPA %: Ratio is nonperforming assets related to the loan portfolio to total period-end loans plus foreclosed real estate and other assets.
Net charge-offs %: Ratio is annualized net charge-offs to total average loans.
Allowance / loans: Ratio is allowance for loan losses to total period-end loans.
Allowance / NPL: Ratio is allowance for loan losses to nonperforming loans in the loan portfolio.
Allowance / NPA: Ratio is allowance for loan losses to nonperforming assets related to the loan portfolio.
Allowance / charge-offs: Ratio is allowance for loan losses to annualized net charge-offs.
23
 First Horizon
National Corporation First Quarter 2014 Earnings
April 17, 2014 |
 2
Portions of this presentation use non-GAAP financial information. Each of those portions is
so noted, and a reconciliation
of
that
non-GAAP
information
to
comparable
GAAP
information
is
provided
in
a
footnote
or
in
the
appendix at the end of this presentation.
This presentation contains forward-looking statements, which may include guidance,
involving significant risks and uncertainties which will be identified by words such as
“believe”,“expect”,“anticipate”,“intend”,“estimate”,
“should”,“is
likely”,“will”,“going
forward”
and
other
expressions
that
indicate
future
events
and
trends
and
may
be
followed
by
or
reference
cautionary
statements.
A
number
of
factors
could
cause
actual
results
to
differ
materially
from those in the forward-looking information.
These factors are outlined in our recent earnings and other press
releases
and
in
more
detail
in
the
most
current
10-Q
and
10-K.
FHN
disclaims
any
obligation
to
update
any
such
factors or to publicly announce the result of any revisions to any of the forward-looking
statements included herein or therein to reflect future events or developments.
|
 Building
Franchise Value Executing “Blue Chip”
Priorities
Being easy to do business with
Providing differentiated customer service
Using the bonefish to drive profitability
3 |
 Building
Franchise Value Efficiency, Productivity, Economic Profitability,
and Growth Opportunities On Track
4
Rationalizing Expenses
-8%
Organizational alignment on the path to achieving
long-term bonefish profitability
Exceeded the goal of less than $900mm of annualized
expenses
Demonstrated loan growth in CRE, ABL, Mid-Atlantic,
Middle Tennessee, and East Tennessee
Profitable growth opportunities in Specialty Lending,
Middle Tennessee, and Mid-Atlantic markets
Non-Strategic average loans now comprise less than
20% of the total loan portfolio
Non-Strategic Average Loan Run-Off
-18%
1
Average Regional Banking loans. Growth is from 1Q13 to 1Q14.
2
Private Client & Wealth Management loans are originated within the geographical markets
listed above. 3
East Tennessee includes loans from the MNB acquisition.
Regional Bank Areas of Loan Growth Since 1Q13
*Specialty Lending Areas
Asset Based Lending*
4%
6%
11%
4%
Mid-Atlantic
Middle TN
East TN
8%
Private Client / Wealth Mgmt
CRE*
12%
3
2
1 |
 5
Core Businesses Relative Positioning
Core Businesses Continue to Deliver Solid Results
Balance Sheet Positioned to Benefit from Rising Rates
TTM
Returns
Key TTM
Bonefish
Metrics
ROTCE
ROA
Capital ratios remain ~200-300bps
above normalized Bonefish Tier 1
Common capital levels
NIM
NCO %
Fee Income %
Efficiency Ratio
Better than long-term bonefish
targets
FTN Financial significant differentiator
vs peers
In line with long-term bonefish
targets
Regional Banking efficiency ratio of 64%
Core Businesses expenses down $6mm
or 3% linked quarter
Significant latent income embedded in
balance sheet
A 200bps rise in rates would have
improved NII by ~$66mm annually
and added ~38bps to Core NIM
4
2
2
2
2 |
 FINANCIAL
RESULTS 6 |
 1Q14 Consolidated
Financial Results 7
NII
Fee Income
Expense
EPS
$ in millions, except EPS
Financial Results
1Q14
$152
Net Income Available to Common Shareholders
Loan Loss Provision
$146
$220
$10
$45
$0.19
1Q14 vs
-$9
-$11
-$20
-$5
+$4
+$0.02
4Q13
$157
$135
$257
$15
$49
$0.21
1Q13
$161
$156
$241
$15
$41
$0.17
4Q13
-$5
+$11
-$37
-$5
-$5
-$0.02
1Q13
Actuals
Net income available to common of $45mm, with EPS of $0.19
Net interest margin of 2.88%
Loan loss provision of $10mm with net charge-offs of $17mm
Annualized expenses below $900mm goal
Tier 1 Common of 11.1%
Total average loans at $15B
Total average deposits of $17B
1
Numbers may not add to total due to rounding.
All non-GAAP numbers are reconciled in the appendix.
1
Tier 1 Common: current quarter is an estimate and a non-GAAP number.
|
 First Quarter
2014 Significant Items 8
Impact to EPS
Previously Unrecognized
Servicing Fees Associated
with the MSR Sale
$12.3mm
After-Tax Amount
$0.05
Securities Gain on
an
Equity Investment
$3.4mm
$0.01
Significant Item
Pre-Tax Amount
$20.0mm
Lease Abandonment &
Other Restructuring Charges
$(3.5)mm
$(0.01)
$(5.7)mm
Net Impact from
Resolution / Collapse of
On-Balance Sheet
Consumer Securitizations
$(3.9)mm
$(0.02)
$(6.4)mm
$5.6mm
Numbers may not add to total due to rounding.
1
After-tax impact assumes a statutory tax rate of 38.6%.
2
EPS impact calculated by dividing the after-tax impact by the 237mm diluted shares
outstanding. 1
2 |
 1Q14 Segment
Highlights 9
Drivers and Impacts
Net Income
$ in millions,
except EPS
Regional
Banking
Capital
Markets
Corporate
Core
Businesses
Non-
Strategic
Total
4Q13
$43
$7
$(7)
$43
$6
$49
1Q13
$49
$12
$(12)
$50
$(9)
$41
1Q14
$36
$5
$(8)
$33
$12
$45
$0.15
$0.02
$(0.03)
$0.14
$0.05
$0.19
Fixed income ADR of $813k in 1Q14 vs $822k in 4Q13
Linked quarter decrease in expense from lower variable
compensation, partially offset by FICA reset
Includes $20mm gain from unrecognized servicing fees in 1Q14
Loan loss provision credit of $(3)mm in 1Q14 vs $12mm in 4Q13
Zero mortgage repurchase provision in 1Q14; 4Q13 included a
$30mm repurchase reserve reversal and $57mm of net loss
accruals related to legal matters
Pre-provision
net
revenue³
relatively
flat
linked
quarter
as
expense reductions offset revenue declines
1Q14 provision was affected by further refinement to the credit
card reserving process as well as macroeconomic factors
Fee income up $5mm linked quarter, including a $5.6mm
investment gain in 1Q14
Expense includes a ~$5mm lease abandonment charge
4Q13
tax
expense
was
favorably
affected
by
the
pattern
of
quarterly earnings in 2013 and $7.5mm in discrete items
1Q14
Per Share
Impact
2
1
1
1
1 |
 Regional Banking
Financial Results 10
NII
Fee Income
Expense
$ in millions
Financial Results
1Q14
$142
Net Income
Loan Loss Provision
$60
$133
$13
$36
1Q14 vs
-$5
+$1
+$2
+$15
-$13
4Q13
$146
$63
$139
$3
$43
1Q13
$147
$59
$131
-$2
$49
4Q13
-$4
-$3
-$6
+$10
-$7
1Q13
Actuals
Average core deposits grew 3% linked quarter
Average
loans
relatively
steady
linked
quarter,
despite
loans
to
mortgage
companies
declining
by
24%
Solid loan growth in CRE, ABL, Mid-Atlantic, Middle Tennessee, and East Tennessee
Pre-provision
net
revenue
relatively
flat
linked
quarter
as
expense
reduction
offsets
revenue
declines
1
Fee income linked quarter decline driven by seasonally lower deposit transaction fees,
somewhat offset by an increase in brokerage and trust fees
Expenses in 4Q13 included charges associated with branch closings and higher professional fees
1Q14 provision was affected by further refinement to the credit card reserving process
as well as macroeconomic factors
Numbers may not add to total due to rounding.
1
Regional Banking pre-provision net revenue is non-GAAP and reconciled in the
appendix. |
 11
Profitable Growth Opportunities: Regional Banking
Broad Product Offerings with Focus on
Specialty Lending Provide Growth Opportunities
Regional Banking Average Loans by Lending Area
Linked quarter highlights:
ABL grew 6%
Middle Tennessee market grew 1%
CRE loans up 3%
Private Client / Wealth Management loans up 1%
Regional
Bank
Areas
of
Loan
Growth
Since
1Q13
*Specialty Lending Areas
Asset Based Lending*
4%
6%
11%
4%
Mid-Atlantic
Middle TN
East TN
8%
Private
Client
/
Wealth
Mgmt
CRE*
12%
$4.9
$4.1
$2.9
$2.9
$0.6
$0.8
$1.6
$1.7
$2.1
$2.1
$3.6
$3.6
$1.2
1Q13
1Q14
$0
$2
$4
$6
$8
$10
Commercial
Private Client / Wealth Management
Business Banking
Retail
Specialty Lending (includes:
Loans to Mortgage Companies)
1
2
3
$12B |
 12
Capital Markets
Capital Markets Provides a Unique Business Model
with Solid Returns and A Broad Customer Base
Fixed Income Average Daily Revenue
Fixed income average daily revenue at $813k in 1Q14
Expense decline associated with lower variable
compensation, partially offset by seasonal payroll taxes
Focused on investing in extensive fixed income
distribution platform:
Strategic hiring of sales and trading resources
Expansion of municipal products platform, including
development of public finance capability
Lower levels of fixed income ADR due to market
conditions
NII
Fee Income
Expense
$ in millions, except ADR
Financial Results
1Q14
$3
Average Daily Revenue (ADR)
Net Income
$57
$53
$5
$813k
1Q14 vs
-$0
-$20
-$9
-$7
-$320k
4Q13
$4
$60
$53
$7
$822k
1Q13
$4
$77
$62
$12
$1,133k
4Q13
-$1
-$3
-$1
-$2
-$9k
1Q13
Actuals
Numbers may not add to total due to rounding.
Normalized ADR range
of $1.0-1.5mm |
 13
NIM linked quarter decline due to lower loan balances,
continued pressure on commercial loan yields, higher
Fed balances, and a decrease in NII related to lower
day count
Current NIM expectations in the ~2.85%-2.95% range
in 2014
Key assumptions:
Rates stay at current levels
Continued modest loan yield declines
Earning assets relatively stable
Regional Banking average deposit rate paid of 20bps in
1Q14 vs 29bps in 1Q13
Attractive and stable low-cost funding mix in Regional
Banking with 54% DDA and interest checking deposits
Selectively pursuing fixed-rate lending in relationship-
oriented opportunities
Floating rate loans comprise 64%
vs
fixed rate loans at 36%
Net Interest Income Sensitivity Impact
NII and Net Interest Margin
Balance Sheet Positioned to Benefit from Rising Rates
Net Interest Margin
3.09%
2.95%
2.96%
2.97%
2.98%
2.88%
2.6%
2.7%
2.8%
2.9%
3.0%
3.1%
4Q12
1Q13
2Q13
3Q13
4Q13
1Q14
-1.4%
-$8mm
+1.2%
+$7mm
+5.5%
+$34mm
+10.8%
+$66mm
-3%
0%
3%
6%
9%
12%
Long End
-50bps
Long End
+50bps
+100bps
+200bps
NIM could fluctuate based on excess cash Fed
balances, Capital Markets inventory, and balances in
loans to mortgage companies
1 |
 14
Annualized Noninterest Expense
Continued Efficiencies
Execution Capabilities Demonstrated
Performance vs Peers Meaningfully Differentiated
Annualized
noninterest
expense
declined
30%
from
1Q11
reflecting
broad-based
improvement
in
most
categories
Achieving efficiency improvements by reducing occupancy, operations, and foreclosed real
estate costs Continued focus on reducing Non-Strategic expense
Contract employment declined 52% related to a significant reduction in sub-servicing
expense related to
the MSR sale
Optimizing corporate real estate footprint by reducing square footage
Rationalizing branch network as consumer usage shifts to FHN’s expanded digital banking
platforms Exceeded goal of below $900mm of annualized run-rate of consolidated
expenses by year end 2014 -30%
Numbers/percentages may not add due to rounding.
Working on 133 processes that are candidates for elimination, optimization, or
automation $1,255mm
$1,288mm
$962mm
$881mm
<$900mm
1Q11 Annualized
1Q12 Annualized
1Q13 Annualized
1Q14 Annualized
4Q14 Annualized Goal |
 15
Non-Performing Assets
Net Charge-Offs
Stable Asset Quality Trends
Portfolio Continues to See Positive Grade Migration
Disciplined Underwriting on New and Renewed Credits
Reserves
$280mm
Net charge-offs of $17mm, down 2% linked quarter
NPL levels at $303mm, down 4% linked quarter
Commercial NPLs down 31%
ORE at $43mm in 1Q14 vs $46mm in 4Q13¹
Sold three TRUPs in 1Q14, resulting in $5mm reserve
decrease
Numbers may not add due to rounding.
2
Net charge-off % is annualized.
$0
$100
$200
$300
$400
1Q13
2Q13
3Q13
4Q13
1Q14
NPLs
NPLs Held for Sale
ORE
$500mm
0.0%
0.3%
0.6%
0.9%
1.2%
$0
$10
$20
1Q13
2Q13
3Q13
4Q13
1Q14
NCOs $
Provision $
NCO %²
$30mm
1.0%
1.2%
1.4%
1.6%
1.8%
2.0%
$180
$200
$220
$240
$260
1Q13
2Q13
3Q13
4Q13
1Q14
Reserves $
Reserves / Loans %
1
Year over year ORE increase related to the MNB acquisition, which contributed $16mm of ORE in
1Q14. |
 16
Trailing Twelve Months¹
Consolidated
Core Businesses
4
Long-Term Targets
ROTCE²
1.32%
9.56%
15.00 –
20.00%
ROA²
0.19%
0.85%
1.25 -
1.45%
NIM²
2.95%
3.15%
3.50 -
4.00%
Tier 1 Common³
10.60%
8.00 –
9.00%
NCO / Average Loans²
0.44%
0.21%
0.30 -
0.70%
Fee Income / Revenue
48%
49%
40 -
50%
Efficiency Ratio
95%
77%
60 -
65%
Equity / Assets
Return on Assets
1.25% - 1.45%
Risk Adjusted Margin
Return on Tangible
Common Equity
15% - 20%
Total Assets
Earning Assets
Pre-tax Income
Tax Rate
Efficiency Ratio
60% - 65%
Annualized Net Charge-Offs
0.30% - 0.70%
Net Interest Margin
3.50% - 4.00%
Tier 1 Common
8% - 9%
% Fee Income
40% - 50%
Building Long-Term Earnings Power: Bonefish Targets
Focused on Growing Our Company Selectively and Profitably While Positioning
Our Balance Sheet for Sustainable, Higher Returns in the Long Term |
 Building
Franchise Value Closing the Gap to Bonefish Targets
17
Current
Earnings
Power
Profitable
Growth
Opportunities
Economic
Profit
Improvement
Bonefish
Earnings
Power
Continued
Efficiencies
Capital
Optimization/
Deployment
Rise in
Interest
Rates
Non-Strategic
wind-down
Process
improvements
Infrastructure
reductions
Specialty lending
Mid-Atlantic
Middle TN
Houston
Wealth / Investments
Municipals (FTN Financial)
Resource
allocation to
profitable
businesses
Product
profitability
Dividends
Share
buybacks
M&A
Latent income
embedded in
asset sensitive
balance sheet
Metric
Target Range
Current Low Rate Environment
Normalized Higher Rate Environment
ROTCE
8% -12%
15% –
20%
Tier 1 Common
10% -
11%
8% –
9%
Asset Growth Assumption
0% -
2%
3% -
5%
Potential Payout Ratio¹
30% -
100%
65% -
85%
1
Payout ratio refers to common stock dividends and repurchases. Dividends and repurchases are
subject to FHN Board approval and regulatory considerations. |
 18
Building a Foundation for Attractive Long-Term Earnings Power
Proven execution capabilities
Unique size, scope, and strengths
Focused on efficiency, productivity, economic profitability, and
growth opportunities
Organizational alignment on the path to achieving long-term bonefish profitability
Breadth and depth of talent that will be able to profitably run and grow the company
Successfully Executing on Key Priorities
FHN Is Well Positioned For Attractive Long-Term Earnings Power |
 APPENDIX
19 |
 20
1Q14 Credit Quality Summary by Portfolio
($ in millions)
CRE
HE &
HELOC
Other
1
Total
Permanent
Mortgage
Commercial
(C&I & Other)
CRE
HE &
HELOC
Permanent
Mortgage
Other
2
Total
Period End Loans
$7,287
$1,145
$3,280
$330
$12,042
$164
$466
$7
$1,978
$446
$16
$15,119
30+ Delinquency
0.26%
1.62%
0.62%
1.38%
0.52%
1.83%
0.43%
0.00%
1.65%
1.21%
1.95%
0.70%
Dollars
$19
$19
$20
$5
$63
$3
$2
$0
$33
$5
$0
$106
NPL %
0.55%
1.05%
0.92%
0.27%
0.69%
2.24%
2.64%
40.93%
5.14%
7.99%
9.03%
1.59%
Dollars
$40
$12
$30
$1
$83
$4
$12
$3
$102
$36
$1
$241
Net Charge-offs
3
%
0.07%
0.10%
0.18%
3.43%
0.20%
NM
2.48%
3.46%
1.17%
1.46%
6.83%
0.45%
Dollars
$1
$0
$1
$3
$6
NM
$3
$0
$6
$2
$0
$17
Allowance
$68
$15
$32
$13
$128
NM
$5
$1
$91
$22
$0
$247
Allowance / Loans %
0.93%
1.31%
0.99%
3.91%
1.06%
NM
1.02%
7.43%
4.60%
5.00%
2.12%
1.64%
Allowance / Charge-offs
13.74x
13.38x
5.42x
1.13x
5.47x
NM
0.39x
1.80x
3.86x
3.36x
0.30x
3.68x
Regional Banking
Corporate
4
Non-Strategic
Commercial
(C&I & Other) |
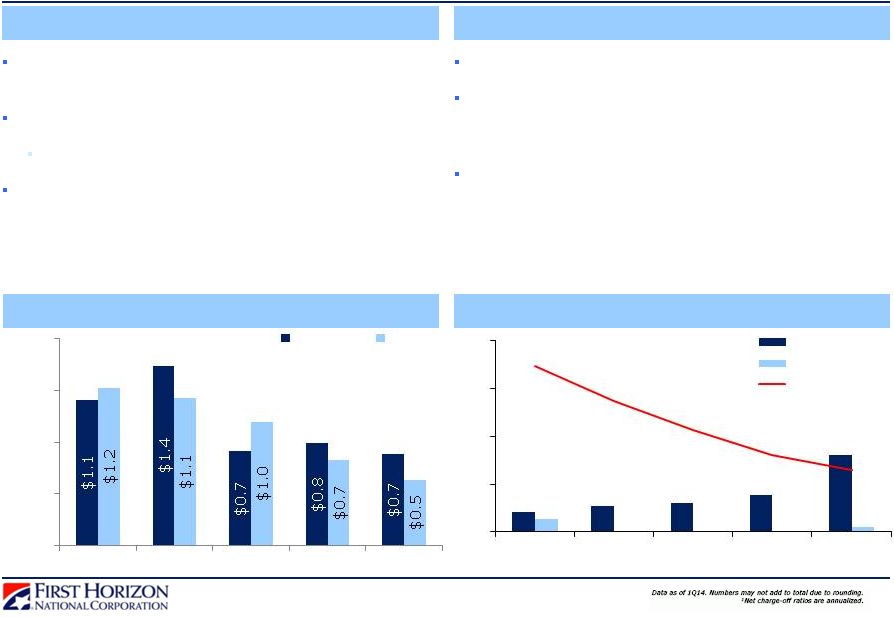 21
C&I and CRE Portfolio Detail
C&I: Loans to Mortgage Companies
$2.0B
$7.8B portfolio, diversified by industry, managed
primarily in Regional Banking
Net charge-offs at $4mm in 1Q14
$3.1mm of NCOs related to TRUPs sales
C&I consolidated reserves of 0.94% at 3/31/14
C&I Overview
Commercial Real Estate Overview
$1.2B portfolio
Increase in delinquencies is largely attributable to two
MNB acquisition related loans that are purchase credit
impaired
CRE consolidated reserves of 1.35% at 3/31/14
CRE Overview
$0.0
$0.4
$0.8
$1.2
1Q13
2Q13
3Q13
4Q13
1Q14
Period End
Average
3.46%
2.74%
2.13%
1.60%
1.30%
0%
1%
2%
3%
4%
1Q13
2Q13
3Q13
4Q13
1Q14
30+ Delinquencies
Net
Charge-Offs
1
NPLs / Total Loans |
 22
Home Equity Overview
Percent of Portfolio: Months Until Repayment
Portfolio Characteristics
Geographic Distribution
First
Second
Total
Balance
$2.7B
$2.6B
$5.3B
Original FICO
751
735
743
Refreshed FICO
750
722
736
Original CLTV
75%
81%
78%
Full Doc
90%
73%
82%
Owner Occupied
92%
95%
93%
HELOCs
$0.7B
$2.1B
$2.8B
Core
Banking
Customers
TN
55%
CA
10%
GA
3%
FL
2%
Other
30%
$2.1
$0.7
$0.0
$0.5
$1.0
$1.5
$2.0
In Draw
In Repayment
$2.5B
0%
5%
10%
15%
20%
25%
30%
15%
19%
14%
16%
8%
28%
0-12
13-24
25-36
37-48
49-60
>60
HELOC Draw vs Repayment Balances |
 23
Signed a definitive agreement in 3Q13 to sell
substantially all remaining legacy mortgage servicing;
transfers of servicing began in 4Q13, were
substantially completed in 1Q14
Wind-down of Non-Strategic on track with reduced
balances and improving credit quality
Sold three TRUPs in 1Q14, resulting in $5.3mm reserve
decrease
TRUPs balances declined to $349mm, down 7%
linked quarter and 10% year over year
Non-Strategic comprised less than 20% of total
average loans in 1Q14, down from 23% in 1Q13
Non-Strategic Revenue Components
Non-Strategic Expense Components
Non-Strategic loan
portfolio includes
floating rate loans
of 69% vs fixed
rate loans of 31%
Primarily servicing
income, including
$20mm of previously
unrecognized
servicing fees
associated with
the MSR Sale
1Q14
Total
Revenue:
$32mm
Non-Strategic Consumer Real Estate Run-Off
$3.0B
Non-Strategic Update
$35mm
$2.5
$2.0
$1.5
$1.0
$0.5
$0.0
20%
20%
18%
18%
19%
1Q13
2Q13
3Q13
4Q13
1Q14
1Q13
1Q14
Period End Balance
Constant Pre-Payment Rate (Right Axis)
21%
20%
19%
18%
17%
16%
Environmental
Sub-Servicing
Other
$28
$21
$14
$7
$0
Fee
Income
$16
NII
$16
2
3 |
 24
Agency & Non-Agency Update
Entered Repurchase Resolution Agreements with Both GSEs
Total
Pipeline
of
Repurchase
Requests
$600mm
Mortgage Repurchase Reserve
($ in millions)
Beginning Balance
Net Realized Losses
Ending Balance
Provision
3Q13
$123
$(29)
$294
$200
4Q13
$294
$(98)
$165
$(30)
1Q14
$165
$(20)
$145
$0
1Q13
$232
$(49)
$184
$0
2Q13
$184
$(61)
$123
$0
Other Whole Loan Sales and Non-Agency
Represent 18% of all active repurchase/make whole
requests in 1Q14 pipeline
Some non-Agency FHN loans were bundled with other
companies’
loans and securitized by the purchasers
A trustee for a bundler has commenced a legal
action seeking repurchase of FHN loans
Certain purchasers have requested indemnity related
to FHN loans included in their securitizations
Loan file review process regarding certain bundled
FHN loans has been initiated
Non-Agency HUD/FHA Investigation
HUD and the US DOJ are investigating FHA insurance claims on
insured loans originated by FHN; initial period covers 1/1/06
through 3/31/12
2
From 1/1/06 through 8/31/08 FHN originated ~48,000 loans
with original UPB of ~$8.2B
FHA originations declined substantially after FHN’s mortgage
business divestiture on 8/31/08
FHN had an initial meeting with HUD and DOJ in 2Q13
HUD has reviewed a small sample of loans from the covered period,
and its investigation remains incomplete
HUD and DOJ have made no demands but could seek up to treble
and special damages under the False Claims Act and other laws
FHN does not have the ability now to estimate a reserve or a range
of reasonably possible losses
$0
$200
$400
1Q13
2Q13
3Q13
4Q13
1Q14
GSE New Requests
Other New Requests
Resolved
Pipeline
1 |
 FHFA Litigation
Securitizations FHFA Litigation Certificate Breakdown
25
$1.0B
$874mm*
*The original balance related to the FHFA lawsuit is $874mm, plus an additional $9mm of cost
over par, totaling $883mm ($ in millions)
Alt-A Deal
FHFA-Related
Tranche
Original
UPB
Paid
Off
Current
UPB
Performing
UPB
60D+
Delinquent
Cumulative
Loss
FHAMS 2005-AA9
IIA1
$214
$127
$74
$68
$7
$13
FHAMS 2005-AA10
IA1
$140
$85
$48
$43
$5
$7
FHAMS 2005-AA11
IA1
$129
$71
$46
$41
$5
$12
FHAMS 2005-AA12¹
IIA1
$161
$76
$70
$60
$10
$14
FHAMS 2006-AA1
IA1
$230
$143
$68
$60
$9
$19
FHFA Total
$874
$502
$307
$271
$35
$65 |
 ($ in
millions) Deal
FHASI 2005-AR5¹
(Schwab)
Senior
$30.0
$19.3
$10.7
$10.1
$0.6
$0.0
FHASI 2007-AR2¹
(Schwab)
Senior
$50.0
$32.0
$16.0
$13.8
$2.2
$2.1
FHASI 2006-3
(Western-Southern)
Junior
$9.9
$0.5
$1.6
$1.5
$0.2
$7.8
FHASI 2007-5
(Western-Southern)
Junior
$7.1
$0.2
$0.0
$0.0
$0.0
$6.9
FHAMS 2007-FA4
(Western-Southern)
Senior
$5.1
$0.2
$0.0
$0.0
$0.0
$4.8
FHAMS 2006-FA6
(FDIC Alabama)
Senior
$11.1
$3.0
$7.3
$5.7
$1.6
$0.8
FHAMS 2006-FA6
(FDIC Alabama)
Senior
$15.2
$4.4
$9.8
$8.0
$1.7
$1.0
FHAMS 2006-FA7
(FDIC Alabama)
Senior
$20.7
$5.8
$12.8
$10.3
$2.6
$2.0
FHAMS 2007-FA4¹
(FDIC Alabama)
Senior
$14.4
$3.2
$9.6
$7.2
$2.4
$1.5
FHAMS 2007-FA1
(FDIC New York)
Senior
$44.5
$12.8
$26.8
$20.5
$6.2
$4.9
FHAMS 2007-FA2
(FDIC New York)
Senior
$34.9
$10.8
$20.3
$15.4
$4.9
$3.7
FHAMS 2005-FA8
(FHLB Indemnification)
Senior
$100.0
$75.4
$24.6
$21.0
$3.6
$0.0
FHAMS 2007-FA3
(MetLife Indemnification)
Senior
$103.0
$58.2
$37.9
$30.4
$7.5
$6.9
FHAMS 2005-FA10²
(Royal Park Indemnification)
Senior
$100.0
$62.4
$34.6
$29.4
$5.2
$2.9
FHAMS 2006-FA2¹
(Royal Park Indemnification)
Senior
$30.0
$22.7
$6.3
$5.1
$1.1
$1.0
Total
$575.7
$311.0
$218.3
$178.4
$39.9
$46.4
Cumulative
Loss
Certificate
Original
UPB
Paid
Off
Current
UPB
Performing
UPB
60D+
Delinquent
Non-FHFA Litigation Securitizations
Non-FHFA Litigation Certificate Breakdown
26
$576mm |
 Reconciliation to
GAAP Financials Slides in this presentation use non-GAAP information of net income,
assets, net interest income, charge-offs, revenue, noninterest income and expense,
and various ratios using one or more of those measures. That information is not presented
according to generally accepted accounting principles (GAAP) & is reconciled to GAAP
information below. 27
Return
on Assets¹
Net Interest
Margin
Net Charge-Offs/
Average Loans¹
Fee Income /
Total Revenue
Efficiency
Ratio
Regional Banking (GAAP)
1.16%
4.88%
0.20%
30%
66%
Capital Markets (GAAP)
0.95%
0.82%
0.00%
94%
87%
Corporate (GAAP)
-0.26%
-0.83%
NM
NM
NM
Core Businesses (Non-GAAP)
0.73%
3.05%
0.19%
49%
79%
Non-Strategic (GAAP)
1.44%
1.92%
1.46%
50%
47%
Consolidated (GAAP)
0.83%
2.88%
0.45%
49%
75%
Regional Banking (GAAP)
1.36%
4.90%
0.23%
30%
67%
Capital Markets (GAAP)
1.29%
1.02%
0.00%
93%
83%
Corporate (GAAP)
-0.18%
-1.00%
NM
NM
NM
Core Businesses (Non-GAAP)
0.95%
3.18%
0.23%
48%
79%
Non-Strategic (GAAP)
0.64%
1.93%
1.26%
23%
NM
Consolidated (GAAP)
0.90%
2.98%
0.44%
46%
89%
Regional Banking (GAAP)
1.50%
4.91%
0.14%
30%
62%
Capital Markets (GAAP)
1.17%
0.89%
0.00%
94%
85%
Corporate (GAAP)
-0.79%
-1.16%
NM
NM
NM
Core Businesses (Non-GAAP)
0.88%
3.19%
0.14%
49%
77%
Non-Strategic (GAAP)
-14.70%
1.88%
1.44%
48%
NM
Consolidated (GAAP)
-1.69%
2.97%
0.41%
49%
NM
Regional Banking (GAAP)
1.34%
4.90%
0.29%
29%
62%
Capital Markets (GAAP)
1.30%
0.84%
0.00%
94%
83%
Corporate (GAAP)
-0.70%
-1.19%
NM
NM
NM
Core Businesses (Non-GAAP)
0.83%
3.17%
0.28%
49%
75%
Non-Strategic (GAAP)
0.29%
1.97%
1.11%
32%
76%
Consolidated (GAAP)
0.74%
2.96%
0.46%
47%
75%
Regional Banking (GAAP)
1.34%
4.90%
0.22%
30%
64%
Capital Markets (GAAP)
1.18%
0.89%
0.00%
94%
85%
Corporate (GAAP)
-0.48%
-1.05%
NM
NM
NM
Core Businesses (Non-GAAP)
0.85%
3.15%
0.21%
49%
77%
Non-Strategic (GAAP)
-3.08%
1.93%
1.32%
38%
NM
Consolidated (GAAP)
0.19%
2.95%
0.44%
48%
95% |
 Reconciliation to
GAAP Financials 28
Slides in this presentation use non-GAAP information of risk weighted assets, tangible
common equity, net income, non-controlling interest,
average
common
equity,
intangibles,
and
various
ratios
using
those
measures.
That
information
is
not
presented
according
to
generally
accepted
accounting
principles
(GAAP)
and
is
reconciled
to
GAAP
information
below.
($ in millions)
1Q14
4Q13
3Q13
2Q13
Average
4
Core Businesses Return On Tangible Common Equity
Total
FHN
Risk
Weighted
Assets
Estimate¹
(Regulatory
GAAP)
$18,773
$18,879
$19,237
$20,419
Less:
Non-Strategic
Risk
Weighted
Assets
Estimate¹
(Regulatory
Non-GAAP)
$2,851
$3,268
$3,404
$3,670
Total
Core
Businesses²
Risk
Weighted
Assets
Estimate
(Non-GAAP)
$15,922
$15,610
$15,833
$16,749
Total FHN Average Tangible Common Equity (Non-GAAP)
$1,982
$1,919
$1,923
$2,038
Less:
Non-Strategic
Allocated
Tangible
Common
Equity
at
the
Tier
1
Common
Ratio
%³
(Non-GAAP)
$315
$351
$348
$381
Total
Core
Businesses²
Average
Tangible
Common
Equity
(Non-GAAP)
$1,666
$1,567
$1,575
$1,656
FHN Net Income Available to Common (GAAP)
$45
$49
($107)
$41
Core Businesses²
Net Income Available to Common (Non-GAAP)
$33
$43
$40
$38
FHN Annualized Return on Tangible Common Equity (Non-GAAP)
9.18%
10.22%
-22.17%
8.04%
1.32%
Core
Businesses²
Annualized
Return
on
Tangible
Common
Equity
(Non-GAAP)
7.98%
10.96%
10.15%
9.15%
9.56%
Core Businesses Net Income Available to Common
Corporate Net Income (GAAP)
-$4
-$2
-$10
-$9
Less: Corporate Non-Controlling Interest (GAAP)
$3
$3
$3
$3
Less: Corporate Preferred Stock Dividends (GAAP)
$2
$2
$2
$2
Corporate Net Income Available to Common (Non-GAAP)
-$8
-$7
-$15
-$13
Regional Banking Net Income (GAAP)
$36
$43
$49
$43
Capital Markets Net Income (GAAP)
$5
$7
$6
$8
Core
Businesses²
Net
Income
Available
to
Common
(Non-GAAP)
$33
$43
$40
$38
Return on Tangible Common Equity
Average Common Equity (GAAP)
$2,145
$2,081
$2,091
$2,197
Less: Average Intangibles (GAAP)
$163
$162
$168
$160
Average Tangible Common Equity (Non-GAAP)
$1,982
$1,919
$1,923
$2,038
FHN Net Income Available to Common (GAAP)
$45
$49
($107)
$41
FHN Annualized Return on Tangible Common Equity (Non-GAAP)
9.18%
10.22%
-22.17%
8.04%
1.32% |
 Reconciliation to
GAAP Financials Slides in this presentation use non-GAAP information of net interest
income, FTE adjustments, earning assets, and various ratios using one or more of those
measures. That information is not presented according to generally accepted accounting principles
(GAAP) & is reconciled to GAAP information below.
29
Net Interest Margin
($ in millions)
1Q13
2Q13
3Q13
4Q13
1Q14
Regional Banking Net interest income (GAAP)
$147
$148
$150
$146
$142
Regional Banking FTE adjustment
$2
$2
$2
$2
$2
Regional Banking Net interest income adjusted for impact of FTE (Non-GAAP)
$149
$150
$151
$148
$144
Capital Markets Net interest income (GAAP)
$4
$4
$4
$4
$3
Capital Markets FTE adjustment
$0
$0
$0
$0
$0
Capital Markets Net interest income adjusted for impact of FTE (Non-GAAP)
$4
$4
$4
$4
$4
Corporate Net interest income (GAAP)
-$10
-$11
-$12
-$10
-$9
Corporate FTE adjustment
$0
$0
$0
$0
$0
Corporate Net
interest income
adjusted for impact of FTE (Non-GAAP)
-$10
-$11
-$12
-$10
-$9
Core
Businesses
Net
interest
income
(Non-GAAP)
1
$141
$141
$142
$140
$136
Core
Businesses
FTE
adjustment
(Non-GAAP)
1
$2
$2
$2
$2
$2
Core
Businesses
Net
interest
income
adjusted
for
impact
of
FTE
(Non-GAAP)
1
$143
$143
$144
$142
$138
Non-Strategic Net interest income (GAAP)
$20
$19
$17
$17
$16
Non-Strategic FTE adjustment
$0
$0
$0
$0
$0
Non-Strategic Net interest income adjusted for impact of FTE (Non-GAAP)
$20
$19
$17
$17
$16
Consolidated Net interest income (GAAP)
$161
$160
$159
$157
$152
Consolidated FTE adjustment
$2
$2
$2
$2
$2
Consolidated Net interest income adjusted for impact of FTE (Non-GAAP)
$163
$162
$161
$159
$154
Average Earning Assets
1Q14
Regional Banking Earning Assets (GAAP)
$11,947
Capital Markets Earning Assets (GAAP)
$1,730
Corporate Earning Assets (GAAP)
$4,617
Core Businesses
¹
Earning Assets (Non-GAAP)
$18,294
Non-Strategic Earning Assets (GAAP)
$3,354
Consolidated Earning Assets (GAAP)
$21,648
Core Businesses
1
NIM with 200bps Rate Shock
1Q14
Annualized Core Businesses Net interest income adjusted for impact of FTE (Non-GAAP)
a
$561
Core Businesses Average Earning Assets (Non-GAAP)
b
$18,294
Core Businesses NIM (Non-GAAP)
a/b
3.05%
Core Businesses Additional Annual NII from a 200bps Rate Shock (Non-GAAP)²
c
$66
Core Businesses NIM with 200bps Rate Shock (Non-GAAP)
(a+c)/b
3.43%
Annualized Consolidated Net interest income adjusted for impact of FTE (Non-GAAP)
d
$626
Consolidated Average Earning Assets (GAAP)
e
$21,648
Consolidated NIM (GAAP)
d/e
2.88%
Consolidated Additional Annual NII from a 200bps Rate Shock (Non-GAAP)²
f
$66
Consolidated NIM with 200bps Rate Shock (Non-GAAP)
(d+f)/e
3.20% |
 Reconciliation to
GAAP Financials 30
Slides in this presentation use non-GAAP information of equity, assets, tier 1 capital,
risk weighted assets, and various ratios using one
or
more
of
those
measures.
That
information
is
not
presented
according
to
generally
accepted
accounting
principles
(GAAP)
and is reconciled to GAAP information below.
($ in millions)
1Q14
4Q13
3Q13
2Q13
1Q13
Average
2
Tangible Common Equity (Non-GAAP)
Total equity (GAAP)
$2,544
$2,501
$2,433
$2,546
$2,600
Less: Noncontrolling interest
$295
$295
$295
$295
$295
Less: Preferred stock
$96
$96
$96
$96
$96
Total common equity
$2,153
$2,110
$2,042
$2,155
$2,209
Less:
intangible
assets
(GAAP)
1
$163
$164
$163
$164
$156
Tangible common equity (Non-GAAP)
$1,990
$1,946
$1,880
$1,992
$2,053
Less: unrealized gains on AFS securities, net of tax
-$2
-$11
$11
$9
$49
Adjusted tangible common equity (Non-GAAP)
$1,992
$1,957
$1,868
$1,982
$2,004
Tangible Assets (Non-GAAP)
Total assets (GAAP)
$23,942
$23,790
$23,859
$24,853
$24,803
Less:
intangible
assets
(GAAP)
1
$163
$164
$163
$164
$156
Tangible assets (Non-GAAP)
$23,779
$23,626
$23,696
$24,689
$24,647
Tier 1 Common (Non-GAAP)
Tier 1 capital
$2,666
$2,619
$2,555
$2,712
$2,739
Less:
noncontrolling
interest
-
FTBNA
preferred
stock
$295
$295
$295
$295
$295
Less: Preferred stock
$96
$96
$96
$96
$96
Less: trust preferred
$200
$200
$200
$200
$200
Tier 1 common (Non-GAAP)
$2,076
$2,029
$1,965
$2,122
$2,148
Risk Weighted Assets
Risk weighted assets
$18,773
$18,879
$19,237
$20,419
$20,192
Ratios
Tangible common equity to tangible assets (TCE/TA) (Non-GAAP)
8.37%
8.24%
7.93%
8.07%
8.33%
8.15%
Total equity to total assets (GAAP)
10.63%
10.51%
10.20%
10.25%
10.48%
10.40%
Tier 1 common ratio to risk weighted assets (Non-GAAP)
11.06%
10.75%
10.21%
10.39%
10.64%
10.60%
Tier 1 capital to total assets (GAAP)
11.14%
11.01%
10.71%
10.91%
11.04%
10.94%
Tangible common equity to risk weighted assets (TCE/RWA) (Non-GAAP)
10.60%
10.31%
9.77%
9.75%
10.17%
10.11%
Tangible common equity plus reserves to risk weighted assets (Non-GAAP)
11.92%
11.65%
11.10%
11.04%
11.48%
11.43%
Total equity plus reserves to total assets (GAAP)
11.66%
11.58%
11.27%
11.30%
11.55%
11.45% |
 Reconciliation to
GAAP Financials 31
Slides in this presentation use non-GAAP information of revenue, expense, and various
ratios using one or more of those measures. That information is not presented according
to generally accepted accounting principles (GAAP) and is reconciled to GAAP information
below. Numbers may not add to total due to rounding.
1
Core Businesses include the Regional Banking, Capital Markets, and Corporate segments.
Peer group includes UBSI, ONB, TRMK, IBKC, BXS, UMBF, BOH, VLY, FULT, FCNCA, WTFC, TCB, SUSQ,
HBHC, WBS, CBSH, CFR, ASBC, SNV, BOKF, FNFG. Peer data is a four quarter average
of each metric from 1Q13-4Q13. Regional Banking Pre-Provision Net Revenue
($ in millions)
1Q13
4Q13
1Q14
Regional Banking Total Revenue (GAAP)
$206
$209
$202
Regional Banking Total Expense (GAAP)
$131
$139
$133
Regional Banking Pre-Provision Net Revenue (Non-GAAP)
$75
$70
$69
Core Business Expense
($ in millions)
1Q13
4Q13
1Q14
Regional Banking Expense (GAAP)
$131
$139
$133
Capital Markets Expense (GAAP)
$62
$53
$53
Corporate Expense (GAAP)
$18
$19
$20
Core
Businesses‘
Expense
1
(Non-GAAP)
$210
$211
$205
Non-Strategic Expense (GAAP)
$30
$46
$15
Consolidated Expense (GAAP)
$241
$257
$220 |