Attached files
| file | filename |
|---|---|
| 8-K - CHIMERA INVESTMENT CORPORATION 8-K - CHIMERA INVESTMENT CORP | a50846167.htm |
Exhibit 99.1
 Information is
unaudited, estimated and subject to change. WWW.ANNALY.COM
CHIMERAREIT.COM Supplemental Financial Information as of December 2013
Information is
unaudited, estimated and subject to change. WWW.ANNALY.COM
CHIMERAREIT.COM Supplemental Financial Information as of December 2013
 Information is
unaudited, estimated and subject to change. Disclaimer This material is
not intended to be exhaustive, is preliminary in nature and may be
subject to change. In addition, much of the information contained herein
is based on various assumptions (some of which are beyond the control of
Chimera Investment Corporation, the “Company”) and may be identified by
reference to a future period or periods or by the use of forward-looking
terminology, such as “believe,” “expect,” “anticipate,” “estimate,”
“plan,” “continue,” “intend,” “should,” “may,” “would,” “projected,”
“will” or similar expressions, or variations on those terms or the
negative of those terms. The Company’s forward-looking statements are
subject to numerous risks, uncertainties and other factors, including
the impact of the transition to a new independent registered public
accounting firm and the Company’s ability to timely complete the process
necessary to file its quarterly and annual reports for the quarters and
year subsequent to September 30, 2013. Furthermore, none of the
financial information contained in this material has been audited or
approved by the Company’s independent registered public accounting firm.
Information is
unaudited, estimated and subject to change. Disclaimer This material is
not intended to be exhaustive, is preliminary in nature and may be
subject to change. In addition, much of the information contained herein
is based on various assumptions (some of which are beyond the control of
Chimera Investment Corporation, the “Company”) and may be identified by
reference to a future period or periods or by the use of forward-looking
terminology, such as “believe,” “expect,” “anticipate,” “estimate,”
“plan,” “continue,” “intend,” “should,” “may,” “would,” “projected,”
“will” or similar expressions, or variations on those terms or the
negative of those terms. The Company’s forward-looking statements are
subject to numerous risks, uncertainties and other factors, including
the impact of the transition to a new independent registered public
accounting firm and the Company’s ability to timely complete the process
necessary to file its quarterly and annual reports for the quarters and
year subsequent to September 30, 2013. Furthermore, none of the
financial information contained in this material has been audited or
approved by the Company’s independent registered public accounting firm.
 Information is
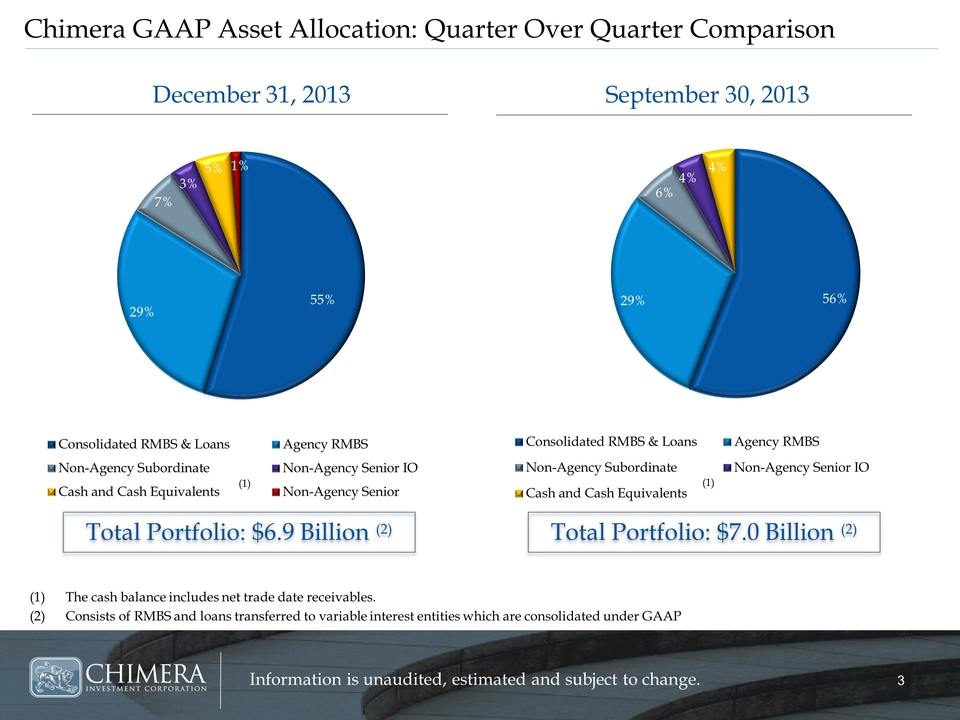
unaudited, estimated and subject to change. Chimera GAAP Asset
Allocation: Quarter Over Quarter Comparison (1)The cash balance includes
net trade date receivables. (2)Consists of RMBS and loans transferred to
variable interest entities which are consolidated under GAAP December
31, 2013 September 30, 2013 Total Portfolio: $6.9 Billion (2) Total
Portfolio: $7.0 Billion (2) 56% 29% 6% 4% 4% Consolidated RMBS & Loans
Agency RMBS Non-Agency Subordinate Non-Agency Senior IO Cash and Cash
Equivalents(1) 55% 29% 7% 3% 5% 1% Consolidated RMBS & Loans Agency RMBS
Non-Agency Subordinate Non-Agency Senior IO Cash and Cash Equivalents
Non-Agency Senior(1)
Information is
unaudited, estimated and subject to change. Chimera GAAP Asset
Allocation: Quarter Over Quarter Comparison (1)The cash balance includes
net trade date receivables. (2)Consists of RMBS and loans transferred to
variable interest entities which are consolidated under GAAP December
31, 2013 September 30, 2013 Total Portfolio: $6.9 Billion (2) Total
Portfolio: $7.0 Billion (2) 56% 29% 6% 4% 4% Consolidated RMBS & Loans
Agency RMBS Non-Agency Subordinate Non-Agency Senior IO Cash and Cash
Equivalents(1) 55% 29% 7% 3% 5% 1% Consolidated RMBS & Loans Agency RMBS
Non-Agency Subordinate Non-Agency Senior IO Cash and Cash Equivalents
Non-Agency Senior(1)
 Information is
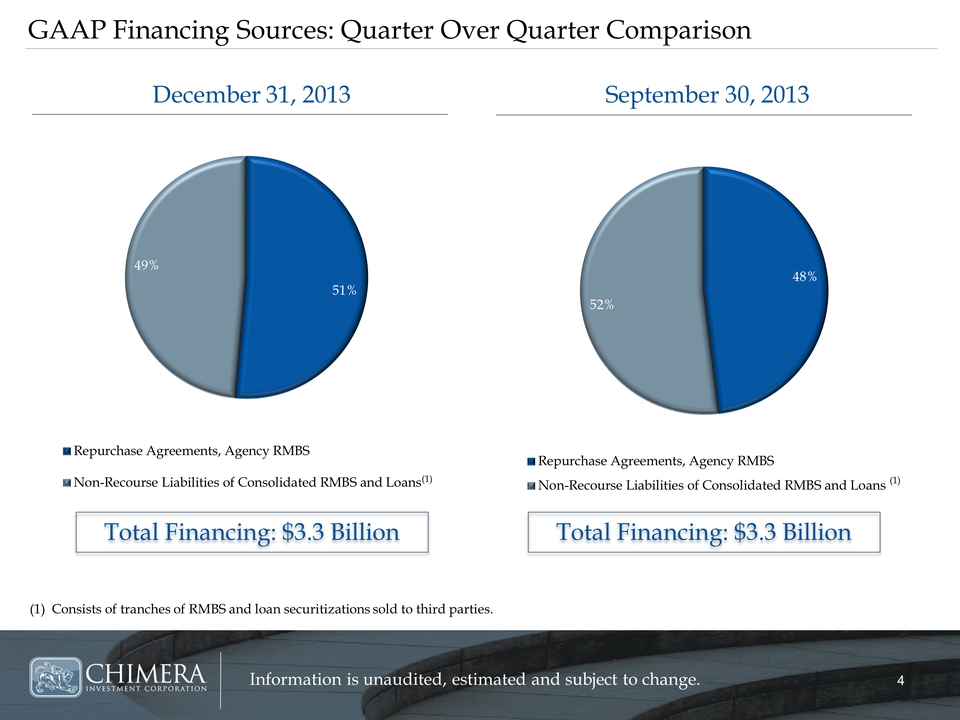
unaudited, estimated and subject to change. GAAP Financing Sources:
Quarter Over Quarter Comparison (1) Consists of tranches of RMBS and
loan securitizations sold to third parties. December 31, 2013 September
30, 2013 Total Financing: $3.3 Billion Total Financing: $3.3 Billion (1)
(1) 51% 49% Repurchase Agreements, Agency RMBS Non-Recourse Liabilities
of Consolidated RMBS and Loans48% 52% Repurchase Agreements, Agency RMBS
Non-Recourse Liabilities of Consolidated RMBS and Loans
Information is
unaudited, estimated and subject to change. GAAP Financing Sources:
Quarter Over Quarter Comparison (1) Consists of tranches of RMBS and
loan securitizations sold to third parties. December 31, 2013 September
30, 2013 Total Financing: $3.3 Billion Total Financing: $3.3 Billion (1)
(1) 51% 49% Repurchase Agreements, Agency RMBS Non-Recourse Liabilities
of Consolidated RMBS and Loans48% 52% Repurchase Agreements, Agency RMBS
Non-Recourse Liabilities of Consolidated RMBS and Loans
 Information is
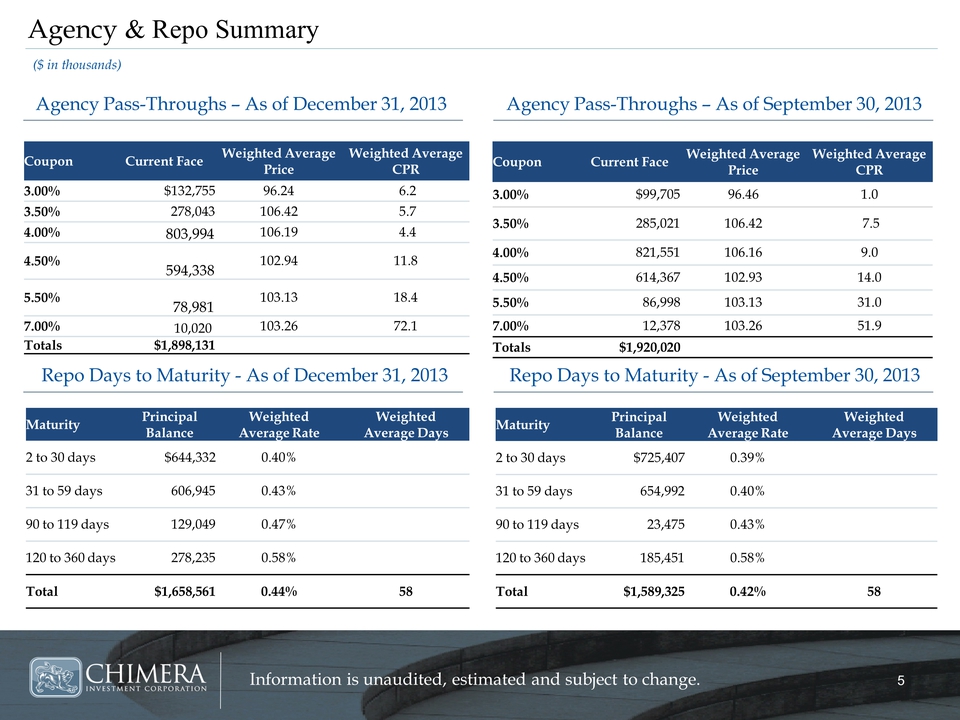
unaudited, estimated and subject to change. Maturity Principal Balance
Weighted Average Rate Weighted Average Days 2 to 30 days $644,332 0.40%
31 to 59 days 606,945 0.43% 90 to 119 days 129,049 0.47% 120 to 360 days
278,235 0.58% Total $1,658,561 0.44% 58 Coupon Current Face Weighted
Average Price Weighted Average CPR 3.00% $132,755 96.24 6.2 3.50%
278,043 106.42 5.7 4.00% 803,994 106.19 4.4 4.50% 594,338 102.94 11.8
5.50% 78,981 103.13 18.4 7.00% 10,020 103.26 72.1 Totals $1,898,131
Agency & Repo Summary Agency Pass-Throughs – As of December 31, 2013
Repo Days to Maturity - As of December 31, 2013 Agency Pass-Throughs –
As of September 30, 2013 Repo Days to Maturity - As of September 30,
2013 Maturity Principal Balance Weighted Average Rate Weighted Average
Days 2 to 30 days $725,407 0.39% 31 to 59 days 654,992 0.40% 90 to 119
days 23,475 0.43% 120 to 360 days 185,451 0.58% Total $1,589,325 0.42%
58 ($ in thousands) Coupon Current Face Weighted Average Price Weighted
Average CPR 3.00% $99,705 96.46 1.0 3.50% 285,021 106.42 7.5 4.00%
821,551 106.16 9.0 4.50% 614,367 102.93 14.0 5.50% 86,998 103.13 31.0
7.00% 12,378 103.26 51.9 Totals $1,920,020
Information is
unaudited, estimated and subject to change. Maturity Principal Balance
Weighted Average Rate Weighted Average Days 2 to 30 days $644,332 0.40%
31 to 59 days 606,945 0.43% 90 to 119 days 129,049 0.47% 120 to 360 days
278,235 0.58% Total $1,658,561 0.44% 58 Coupon Current Face Weighted
Average Price Weighted Average CPR 3.00% $132,755 96.24 6.2 3.50%
278,043 106.42 5.7 4.00% 803,994 106.19 4.4 4.50% 594,338 102.94 11.8
5.50% 78,981 103.13 18.4 7.00% 10,020 103.26 72.1 Totals $1,898,131
Agency & Repo Summary Agency Pass-Throughs – As of December 31, 2013
Repo Days to Maturity - As of December 31, 2013 Agency Pass-Throughs –
As of September 30, 2013 Repo Days to Maturity - As of September 30,
2013 Maturity Principal Balance Weighted Average Rate Weighted Average
Days 2 to 30 days $725,407 0.39% 31 to 59 days 654,992 0.40% 90 to 119
days 23,475 0.43% 120 to 360 days 185,451 0.58% Total $1,589,325 0.42%
58 ($ in thousands) Coupon Current Face Weighted Average Price Weighted
Average CPR 3.00% $99,705 96.46 1.0 3.50% 285,021 106.42 7.5 4.00%
821,551 106.16 9.0 4.50% 614,367 102.93 14.0 5.50% 86,998 103.13 31.0
7.00% 12,378 103.26 51.9 Totals $1,920,020
 Information is
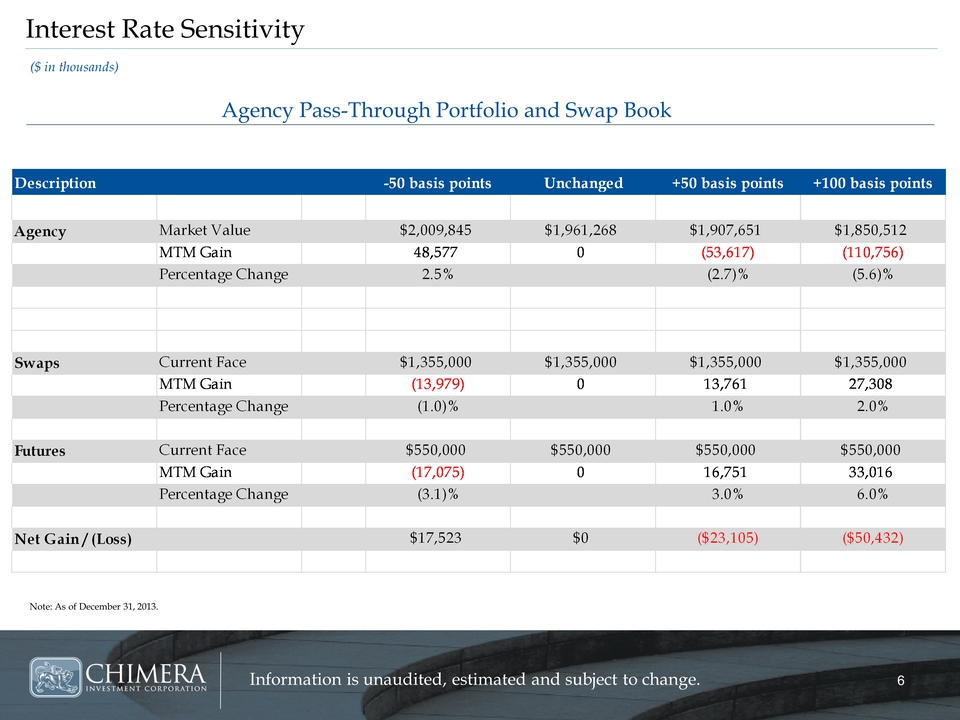
unaudited, estimated and subject to change. Interest Rate Sensitivity
Agency Pass-Through Portfolio and Swap Book Note: As of December 31,
2013. ($ in thousands) Description-50 basis pointsUnchanged+50 basis
points+100 basis points Agency Market
Value$2,009,845$1,961,268$1,907,651$1,850,512MTM
Gain48,5770(53,617)(110,756)Percentage Change2.5%(2.7)%(5.6)% Swaps
Current Face$1,355,000$1,355,000$1,355,000$1,355,000MTM
Gain(13,979)013,76127,308Percentage Change(1.0)%1.0%2.0%FuturesCurrent
Face$550,000$550,000$550,000$550,000MTM
Gain(17,075)016,75133,016Percentage Change(3.1)%3.0%6.0%Net Gain /
(Loss)$17,523$0($23,105)($50,432)
Information is
unaudited, estimated and subject to change. Interest Rate Sensitivity
Agency Pass-Through Portfolio and Swap Book Note: As of December 31,
2013. ($ in thousands) Description-50 basis pointsUnchanged+50 basis
points+100 basis points Agency Market
Value$2,009,845$1,961,268$1,907,651$1,850,512MTM
Gain48,5770(53,617)(110,756)Percentage Change2.5%(2.7)%(5.6)% Swaps
Current Face$1,355,000$1,355,000$1,355,000$1,355,000MTM
Gain(13,979)013,76127,308Percentage Change(1.0)%1.0%2.0%FuturesCurrent
Face$550,000$550,000$550,000$550,000MTM
Gain(17,075)016,75133,016Percentage Change(3.1)%3.0%6.0%Net Gain /
(Loss)$17,523$0($23,105)($50,432)
 Information is
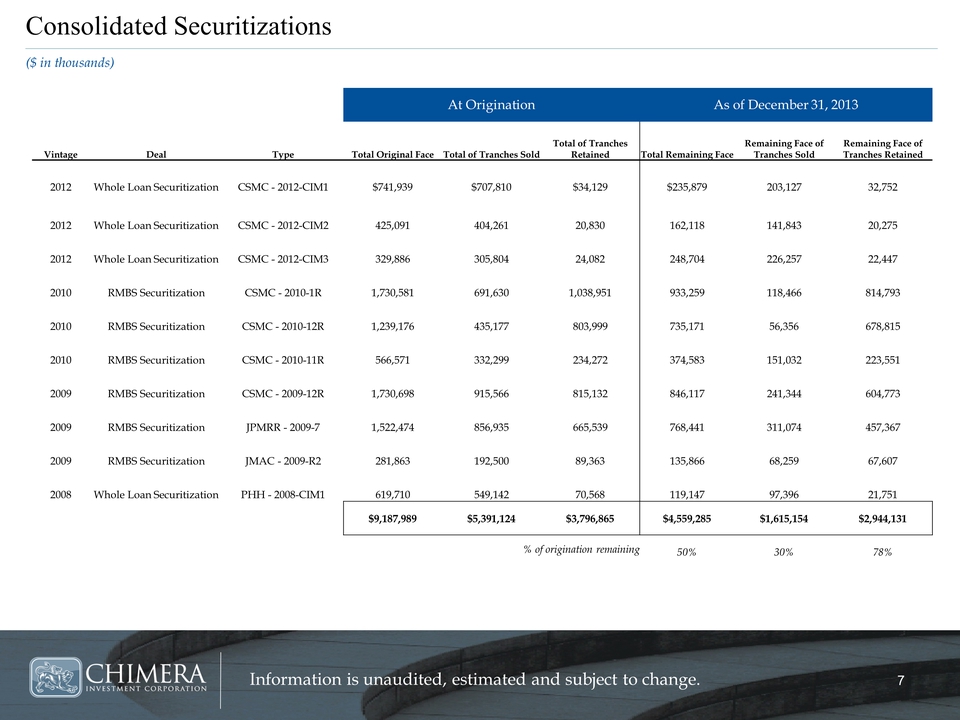
unaudited, estimated and subject to change. Consolidated Securitizations
($ in thousands) At Origination As of December 31, 2013 Vintage Deal
Type Total Original Face Total of Tranches Sold Total of Tranches
Retained Total Remaining Face Remaining Face of Tranches Sold Remaining
Face of Tranches Retained 2012 Whole Loan Securitization CSMC -
2012-CIM1 $741,939 $707,810 $34,129 $235,879 203,127 32,752 2012 Whole
Loan Securitization CSMC - 2012-CIM2 425,091 404,261 20,830 162,118
141,843 20,275 2012 Whole Loan Securitization CSMC - 2012-CIM3 329,886
305,804 24,082 248,704 226,257 22,447 2010 RMBS Securitization CSMC -
2010-1R 1,730,581 691,630 1,038,951 933,259 118,466 814,793 2010 RMBS
Securitization CSMC - 2010-12R 1,239,176 435,177 803,999 735,171 56,356
678,815 2010 RMBS Securitization CSMC - 2010-11R 566,571 332,299 234,272
374,583 151,032 223,551 2009 RMBS Securitization CSMC - 2009-12R
1,730,698 915,566 815,132 846,117 241,344 604,773 2009 RMBS
Securitization JPMRR - 2009-7 1,522,474 856,935 665,539 768,441 311,074
457,367 2009 RMBS Securitization JMAC - 2009-R2 281,863 192,500 89,363
135,866 68,259 67,607 2008 Whole Loan Securitization PHH - 2008-CIM1
619,710 549,142 70,568 119,147 97,396 21,751 $9,187,989 $5,391,124
$3,796,865 $4,559,285 $1,615,154 $2,944,131 % of origination remaining
50% 30% 78%
Information is
unaudited, estimated and subject to change. Consolidated Securitizations
($ in thousands) At Origination As of December 31, 2013 Vintage Deal
Type Total Original Face Total of Tranches Sold Total of Tranches
Retained Total Remaining Face Remaining Face of Tranches Sold Remaining
Face of Tranches Retained 2012 Whole Loan Securitization CSMC -
2012-CIM1 $741,939 $707,810 $34,129 $235,879 203,127 32,752 2012 Whole
Loan Securitization CSMC - 2012-CIM2 425,091 404,261 20,830 162,118
141,843 20,275 2012 Whole Loan Securitization CSMC - 2012-CIM3 329,886
305,804 24,082 248,704 226,257 22,447 2010 RMBS Securitization CSMC -
2010-1R 1,730,581 691,630 1,038,951 933,259 118,466 814,793 2010 RMBS
Securitization CSMC - 2010-12R 1,239,176 435,177 803,999 735,171 56,356
678,815 2010 RMBS Securitization CSMC - 2010-11R 566,571 332,299 234,272
374,583 151,032 223,551 2009 RMBS Securitization CSMC - 2009-12R
1,730,698 915,566 815,132 846,117 241,344 604,773 2009 RMBS
Securitization JPMRR - 2009-7 1,522,474 856,935 665,539 768,441 311,074
457,367 2009 RMBS Securitization JMAC - 2009-R2 281,863 192,500 89,363
135,866 68,259 67,607 2008 Whole Loan Securitization PHH - 2008-CIM1
619,710 549,142 70,568 119,147 97,396 21,751 $9,187,989 $5,391,124
$3,796,865 $4,559,285 $1,615,154 $2,944,131 % of origination remaining
50% 30% 78%
 Information is
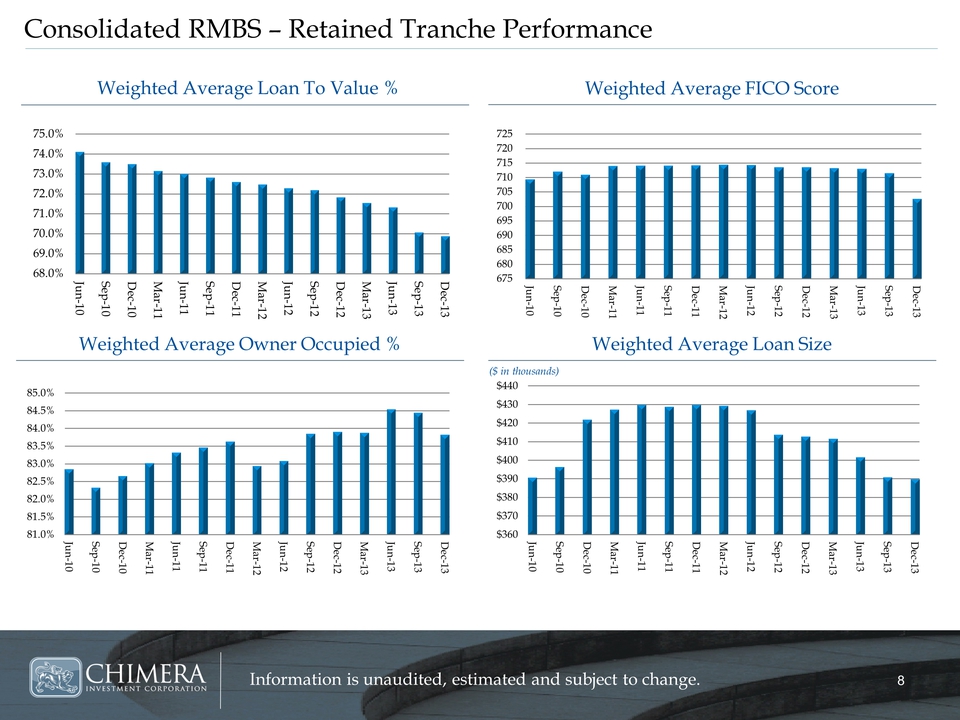
unaudited, estimated and subject to change. Consolidated RMBS – Retained
Tranche Performance Weighted Average Loan To Value % Weighted Average
FICO Score Weighted Average Loan Size Weighted Average Owner Occupied %
($ in thousands)
68.0%69.0%70.0%71.0%72.0%73.0%74.0%75.0%Jun-10Sep-10Dec-10Mar-11Jun-11Sep-11Dec-11Mar-12Jun-12Sep-12Dec-12Mar-13Jun-13Sep-13Dec-13675680685690695700705710715720725
Jun-10Sep-10Dec-10Mar-11Jun-11Sep-11Dec-11Mar-12Jun-12Sep-12Dec-12Mar-13Jun-13Sep-13Dec-1381.0%81.5%82.0%82.5%83.0%83.5%84.0%84.5%85.0%Jun-10Sep-10Dec-10Mar-11
Jun-11Sep-11Dec-11Mar-12Jun-12Sep-12Dec-12Mar-13Jun-13Sep-13Dec-13$360$370$380$390$400$410$420$430$440Jun-10Sep-10Dec-10Mar-11Jun-11Sep-11Dec-11Mar-12Jun-12Sep-12Dec-12
Mar-13Jun-13Sep-13Dec-13
Information is
unaudited, estimated and subject to change. Consolidated RMBS – Retained
Tranche Performance Weighted Average Loan To Value % Weighted Average
FICO Score Weighted Average Loan Size Weighted Average Owner Occupied %
($ in thousands)
68.0%69.0%70.0%71.0%72.0%73.0%74.0%75.0%Jun-10Sep-10Dec-10Mar-11Jun-11Sep-11Dec-11Mar-12Jun-12Sep-12Dec-12Mar-13Jun-13Sep-13Dec-13675680685690695700705710715720725
Jun-10Sep-10Dec-10Mar-11Jun-11Sep-11Dec-11Mar-12Jun-12Sep-12Dec-12Mar-13Jun-13Sep-13Dec-1381.0%81.5%82.0%82.5%83.0%83.5%84.0%84.5%85.0%Jun-10Sep-10Dec-10Mar-11
Jun-11Sep-11Dec-11Mar-12Jun-12Sep-12Dec-12Mar-13Jun-13Sep-13Dec-13$360$370$380$390$400$410$420$430$440Jun-10Sep-10Dec-10Mar-11Jun-11Sep-11Dec-11Mar-12Jun-12Sep-12Dec-12
Mar-13Jun-13Sep-13Dec-13
 Information is
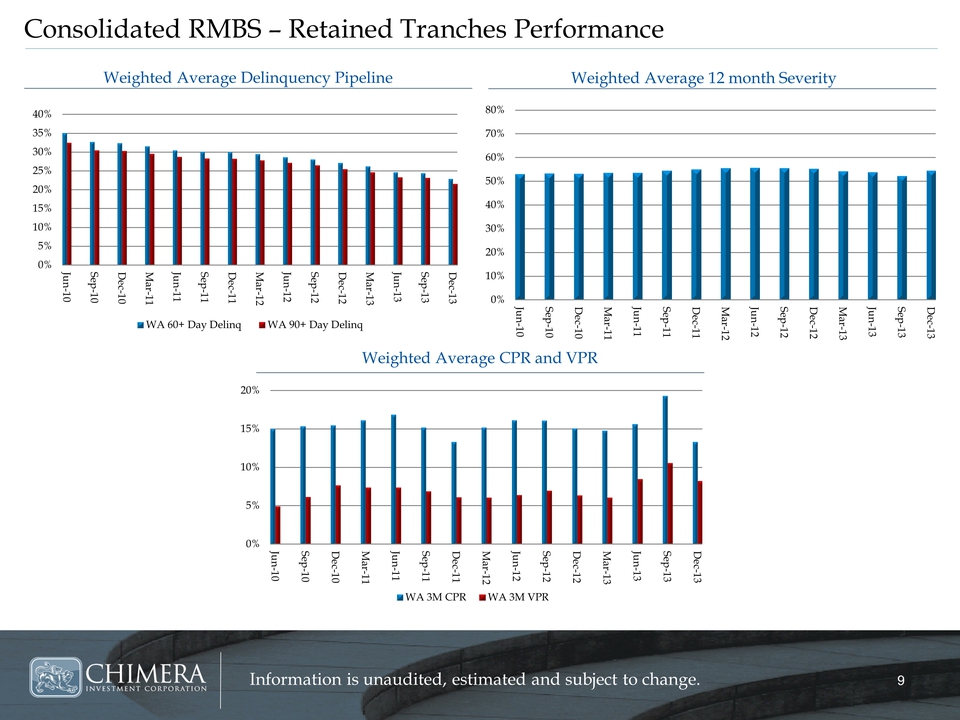
unaudited, estimated and subject to change. Consolidated RMBS – Retained
Tranches Performance Weighted Average Delinquency Pipeline Weighted
Average 12 month Severity Weighted Average CPR and VPR
0%5%10%15%20%25%30%35%40%Jun-10Sep-10Dec-10Mar-11Jun-11Sep-11Dec-11Mar-12Jun-12Sep-12Dec-12Mar-13Jun-13Sep-13Dec-13WA
60+ Day Delinq WA 90+ Day
Delinq0%10%20%30%40%50%60%70%80%Jun-10Sep-10Dec-10Mar-11Jun-11Sep-11Dec-11Mar-12Jun-12Sep-12Dec-12Mar-13Jun-13Sep-13
Dec-130%5%10%15%20%Jun-10Sep-10Dec-10Mar-11Jun-11Sep-11Dec-11Mar-12Jun-12Sep-12Dec-12Mar-13Jun-13Sep-13Dec-13WA
3M CPRWA 3M VPR
Information is
unaudited, estimated and subject to change. Consolidated RMBS – Retained
Tranches Performance Weighted Average Delinquency Pipeline Weighted
Average 12 month Severity Weighted Average CPR and VPR
0%5%10%15%20%25%30%35%40%Jun-10Sep-10Dec-10Mar-11Jun-11Sep-11Dec-11Mar-12Jun-12Sep-12Dec-12Mar-13Jun-13Sep-13Dec-13WA
60+ Day Delinq WA 90+ Day
Delinq0%10%20%30%40%50%60%70%80%Jun-10Sep-10Dec-10Mar-11Jun-11Sep-11Dec-11Mar-12Jun-12Sep-12Dec-12Mar-13Jun-13Sep-13
Dec-130%5%10%15%20%Jun-10Sep-10Dec-10Mar-11Jun-11Sep-11Dec-11Mar-12Jun-12Sep-12Dec-12Mar-13Jun-13Sep-13Dec-13WA
3M CPRWA 3M VPR