Attached files
| file | filename |
|---|---|
| EX-99.2 - TRUIST FINANCIAL CORP | exhibit992.htm |
| EX-99.1 - TRUIST FINANCIAL CORP | exhibit991.htm |
| 8-K - TRUIST FINANCIAL CORP | earn8k1q2014.htm |
Exhibit 99.3

Forward-Looking Information This presentation contains “forward-looking statements” within the meaning of the Private Securities Litigation Reform Act of 1995, regarding the financial condition, results of operations, business plans and the future performance of BB&T that are based on the beliefs and assumptions of the management of BB&T and the information available to management at the time that these disclosures were prepared. Words such as “anticipates,” “believes,” “estimates,” “expects,” “forecasts,” “intends,” “plans,” “projects,” “may,” “will,” “should,” “could,” and other similar expressions are intended to identify these forward-looking statements. Such statements are subject to factors that could cause actual results to differ materially from anticipated results. Such factors include, but are not limited to, the following: general economic or business conditions, either nationally or regionally, may be less favorable than expected, resulting in, among other things, a deterioration in credit quality and/or a reduced demand for credit, insurance or other services; disruptions to the credit and financial markets, either nationally or globally, including the impact of a downgrade of U.S. government obligations by one of the credit ratings agencies and the adverse effects of recessionary conditions in Europe; changes in the interest rate environment and cash flow reassessments may reduce NIM and/or the volumes and values of loans made or held as well as the value of other financial assets held; competitive pressures among depository and other financial institutions may increase significantly; legislative, regulatory or accounting changes, including changes resulting from the adoption and implementation of the Dodd-Frank Act may adversely affect the businesses in which BB&T is engaged; local, state or federal taxing authorities may take tax positions that are adverse to BB&T; a reduction may occur in BB&T’s credit ratings; adverse changes may occur in the securities markets; competitors of BB&T may have greater financial resources and develop products that enable them to compete more successfully thanBB&T and may be subject to different regulatory standards than BB&T; natural or other disasters could have an adverse effect on BB&T in that such events could materially disrupt BB&T’s operations or the ability or willingness of BB&T’s customers to access the financial services BB&T offers; costs or difficulties related to the integration of the businesses of BB&T and its merger partners may be greater than expected; expected cost savings or revenue growth associated with completed mergers and acquisitions may not be fully realized or realizedwithin the expected time frames; significant litigation could have a material adverse effect on BB&T; deposit attrition, customer loss and/or revenue loss following completed mergers and acquisitions may be greater than expected; and cyber-security risks, including “denial of service,” “hacking” and “identity theft,” could adversely affect our business and financial performance, or our reputation. Readers are cautioned not to place undue reliance on these forward-looking statements, which speak only as of the date of this report. Actual results may differ materially from those expressed in or implied by any forward-looking statement. Except to the extent required by applicable law or regulation, BB&T undertakes no obligation to revise or update publicly any forward-looking statements for any reason. Non-GAAP Information This presentation contains financial information and performance measures determined by methods other than in accordance withaccounting principles generally accepted in the United States of America (“GAAP”). BB&T’s management uses these “non-GAAP” measures in their analysis of the Corporation’s performance and the efficiency of its operations. Management believesthat these non-GAAP measures provide a greater understanding of ongoing operations and enhance comparability of results with prior periods as well as demonstrating the effects of significant gains and charges in the current period. The company believes that a meaningful analysis of its financial performance requires an understanding of the factors underlying that performance. BB&T’s management believes that investors may use these non-GAAP financial measures to analyze financial performance without the impact of unusual items that may obscure trends in the company’s underlying performance. These disclosures should not be viewed as a substitute for financial measures determined in accordance with GAAP, nor are they necessarily comparable to non-GAAP performance measures that may be presented by other companies. Below is a listing of the types of non-GAAP measures used in this presentation: Tangible common equity, Tier 1 common equity and related ratios are non-GAAP measures. The return on average risk-weighted assets is a non-GAAP measure. The Basel III common equity Tier I ratio reflects management’s interpretation of the regulatory requirements, which is subject to change. BB&T's management uses these measures to assess the quality of capital and believes that investors may find them useful in their analysis of the Corporation. Asset quality ratios have been adjusted to remove the impact of acquired loans and foreclosed property covered by FDIC loss sharing agreements from the numerator and denominator of these ratios. Management believes that their inclusion may result in distortion of these ratios such that they might not be comparable to other periods presented ortoother portfolios that were not impacted by purchase accounting. Fee income and efficiency ratios are non-GAAP in that they exclude securities gains (losses), foreclosed property expense, amortization of intangible assets, merger-related and restructuring charges, the impact of FDIC loss share accounting and other selected items. BB&T’s management uses these measures in their analysis of the Corporation’s performance. BB&T’s management believes these measures provide a greater understanding of ongoing operations and enhance comparability of results with prior periods, as well as demonstrating the effects of significant gainsand charges. Return on average tangible common shareholders’ equity is a non-GAAP measure that calculates the return on average common shareholders’ equity without the impact of intangible assets and their related amortization. This measure is useful for evaluating the performance of a business consistently, whether acquired or developed internally. Core net interest margin is a non-GAAP measure that adjusts net interest margin to exclude the impact of interest income and funding costs associated with loans and securities acquired in the Colonial acquisition. BB&T’s management believes that the exclusion of the generally higher yielding assets acquired in the Colonial acquisition from the calculation of net interest margin provides investors with useful information related to the relative performance of the remainder of BB&T’s earning assets. Net income available to common shareholders, diluted EPS, return on average assets, return on average risk-weighted assets, return on average common shareholders’ equity and return on average tangible common shareholders’ equity have been adjusted to exclude the impact of certain tax adjustments. BB&T’s management believes these adjustments increase comparability of period-to-period results and uses these measures to assess performance and believes investors may find them useful in their analysis of the Corporation. Adjusted net charge-offs and the adjusted ratio of net charge-offs to average loans are non-GAAP measures that adjust net charge-offs to exclude the impact of a process change that resulted in accelerated recognition of charge- offs in the non-prime automobile lending portfolio during the quarter ended March 31, 2014. BB&T’s management believes these adjustments increase comparability of period-to-period results and believes that investors may find them useful in their analysis of the Corporation. A reconciliation of these non-GAAP measures to the most directly comparable GAAP measure is included in BB&T’s First Quarter 2014 Quarterly Performance Summary, which is available on BB&T’s website at www.bbt.com/financials.html.

33 Earnings Highlights Loans Deposits Credit Quality 5 Revenues Expenses ▪ Net income 2 totaled $501 million vs. $210 million in 1Q13 ▪ Diluted EPS was $0.69, compared with $0.29 in 1Q13 ▪ Average CRE-Income Producing Properties balances grew 10.6% vs. 4Q13 ▪ Average CRE-Construction & Development balances grew 3.5% vs. 4Q13 ▪ Average C&I balances grew 3.6% vs. 4Q13 ▪ Average Sales Finance loan balances grew 7.3% vs. 4Q13 ▪ Average noninterest-bearing deposits increased $2.9 billion, or 8.8% vs. 1Q13 ▪ Average deposits decreased $188 million, or 0.6% vs. 4Q13 ▪ Deposit mix improved and cost declined 1 basis point to 0.27% ▪ Net charge-offs were 0.55% of average loans and leases; core net charge-offs were 0.47% 6 ▪ Loans past due 30-89 days and 90 days declined ▪ NPLs decreased $32 million, or 3.4% vs. 4Q13 ▪ NPAs decreased $67 million, or 6.4% vs. 4Q13 ▪ Total revenues 3 were $2.3 billion, seasonally lower vs. 4Q13 ▪ Results were driven by higher insurance revenues, lower net interest margin, and a decline in mortgage banking income ▪ Fee income ratio was strong at 43.2% 4 vs. 42.9% in 1Q13 ▪ Noninterest expense decreased 14.8% in total vs. 4Q13 ▪ Expense decline driven by lower personnel and professional expenses ▪ Efficiency ratio improved and BB&T produced positive operating leverage in 1Q14 7 ▪ Management expects continued improvement in the efficiency ratio throughout 2014 1 Linked quarter growth rates are annualized, except credit metrics 2 Available to common shareholders. 3 Fully taxable equivalent . 4 Excludes securities gains (losses), the impact of FDIC loss share accounting and other selected items. See non-GAAP reconciliations included in the attached Appendix 5 Excludes covered assets 6 Excludes the impact of $23 million related to a process change that resulted in accelerated recognition of charge-offs in the non-prime automobile lending portfolio 7 See non-GAAP reconciliation included in the attached Appendix 2014 First Quarter Performance Highlights 1
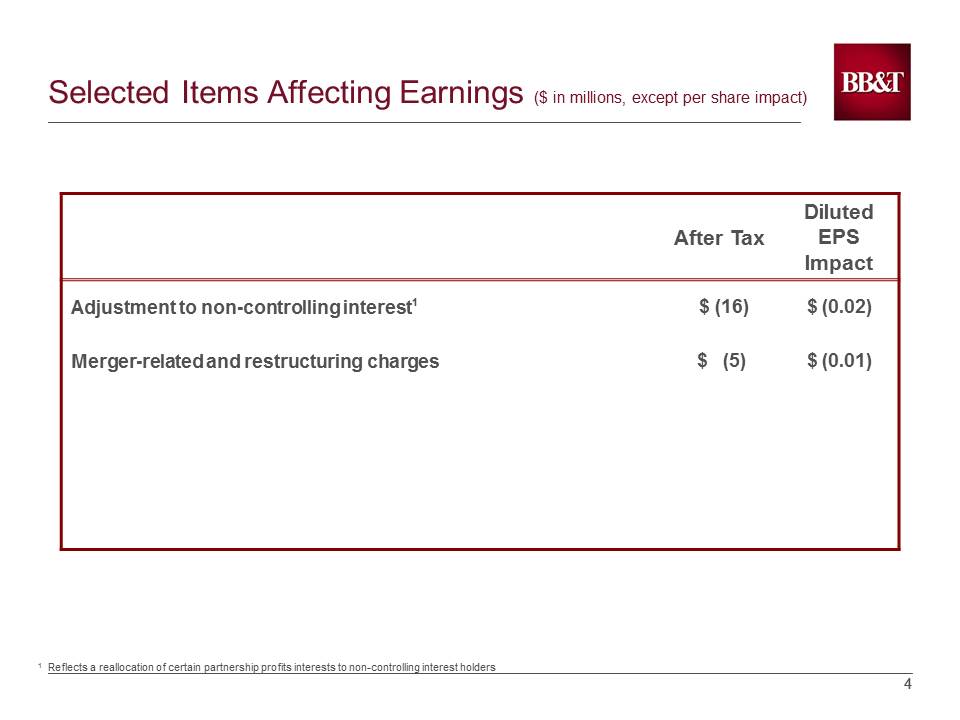
44 After Tax Diluted EPS Impact Adjustment to non-controlling interest 1 $ (16) $ (0.02) Merger-related and restructuring charges $ (5) $ (0.01) Selected Items Affecting Earnings($ in millions, except per share impact) 1 Reflects a reallocation of certain partnership profits interests to non-controlling interest holders

55 Enhanced Lending Strategies Gaining Traction ▪ Average total loan growth for 2Q14 is expected to be 3% -5% Driven by C&I, CRE-income producing properties, CRE- construction & development, Other Lending Subsidiaries, Sales Finance and Wealth lending Growth in Other Lending Subsidiaries expected to be seasonally stronger due to premium finance and small ticket consumer finance businesses ▪ Experienced strong annualized loan growth in key categories 10.6% growth in CRE –Income Producing Properties 3.5% growth in CRE –Construction & Development 7.3% growth in Sales Finance 3.6% growth in C&I ▪ Strong total commercial growth of 4.9% ▪ Other Lending Subsidiaries down 8.2% due to seasonality Equipment Finance up 26.8% $113.2 $114.3 $115.1 $114.8 $115.1 $111 $112 $113 $114 $115 $116 1Q13 2Q13 3Q13 4Q13 1Q14 Average Loans Held for Investment 2 ($ in billions) Average Loans ($ in millions) C&I $ 38,435 $ 334 3.6 % CRE-income producing properties 10,293 262 10.6 CRE-construction & development 2,454 21 3.5 Direct Retail 9,349 (6,649) (168.6) Sales Finance 9,428 166 7.3 Revolving Credit 2,357 - - Residential Mortgage 30,635 6,656 112.6 Other Lending Subsidiaries 2 10,236 (212) (8.2) Subtotal $ 113,187 $ 578 2.1% Covered loans 1,874 (312) (57.9) Total $ 115,061 $ 266 0.9% 1Q14 Average Balance 1Q14 v. 4Q13 $ Increase (Decrease) 1Q14 v. 4Q13 Annualized % Increase (Decrease) 1 Excludes loans held for sale. 2 Other Lending Subsidiaries consist of AFCO/CAFO/Prime Rate, BB&T Equipment Finance, Grandbridge Real Estate Capital, Sheffield Financial and Regional Acceptance.
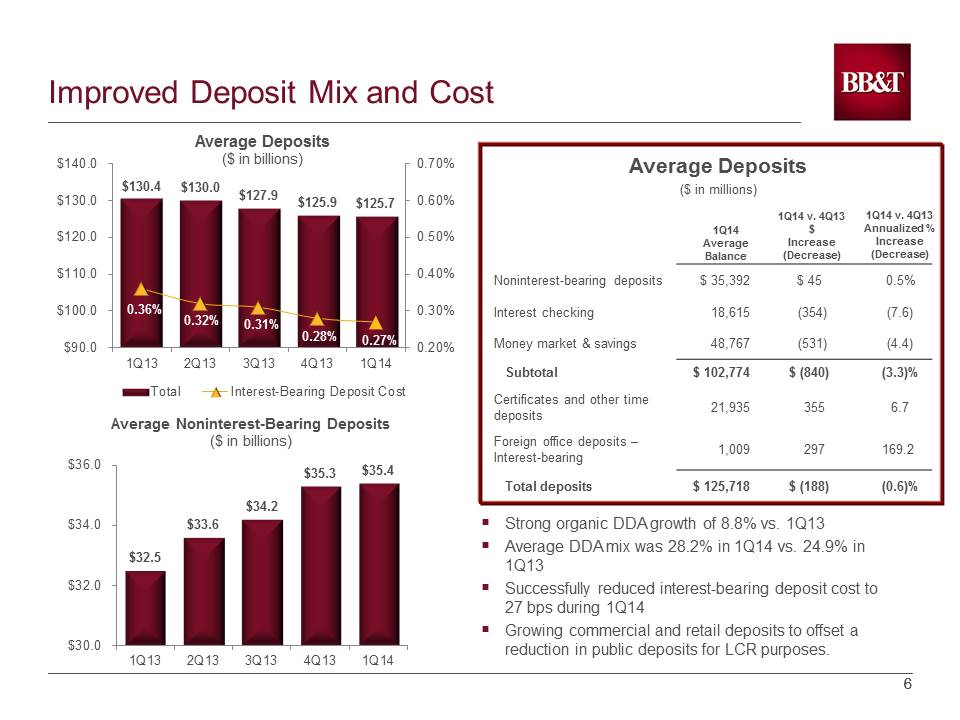
66 Improved Deposit Mix and Cost $130.4 $130.0 $127.9 $125.9 $125.7 0.36% 0.32% 0.31% 0.28% 0.27% 0.20% 0.30% 0.40% 0.50% 0.60% 0.70% $90.0 $100.0 $110.0 $120.0 $130.0 $140.0 1Q13 2Q13 3Q13 4Q13 1Q14 Total Interest-Bearing Deposit Cost Average Deposits ($ in billions) ▪ Strong organic DDA growth of 8.8% vs. 1Q13 ▪ Average DDA mix was 28.2% in 1Q14 vs. 24.9% in 1Q13 ▪ Successfully reduced interest-bearing deposit cost to 27 bps during 1Q14 ▪ Growing commercial and retail deposits to offset a reduction in public deposits for LCR purposes. $32.5 $33.6 $34.2 $35.3 $35.4 $30.0 $32.0 $34.0 $36.0 1Q13 2Q13 3Q13 4Q13 1Q14 Average Noninterest-Bearing Deposits ($ in billions) Average Deposits ($ in millions) Noninterest-bearing deposits $ 35,392 $ 45 0.5% Interest checking 18,615 (354) (7.6) Money market & savings 48,767 (531) (4.4) Subtotal $ 102,774 $ (840) (3.3)% Certificates and other time deposits 21,935 355 6.7 Foreign office deposits – Interest-bearing 1,009 297 169.2 Total deposits $ 125,718 $ (188) (0.6)% 1Q14 Average Balance 1Q14 v. 4Q13 $ Increase (Decrease) 1Q14 v. 4Q13 Annualized % Increase (Decrease)

77 Core Credit Quality Continues to Improve 1 0.98% 0.75% 0.49% 0.49% 0.47 2 % 0.20% 0.70% 1.20% 1Q13 2Q13 3Q13 4Q13 1Q14 Annualized Net Charge-offs / Average Loans Core Charge-offs Core NCOs Down 51.6% vs. 1Q13 ▪ 1Q14 net charge-offs include an additional $23 million in net charge-offs related to a process change that accelerated nonprime auto charge-offs ▪ Excluding the accelerated charge-offs, net charge-offs were 0.47% ▪ Management expects net charge-offs to remain modestly below our normalized range of 50-70 basis points for the next few quarters ▪ 6.4% reduction in NPAs vs. 4Q13 ▪ 3.4% reductionin NPLs Commercial NPLs down 8.7% Lowest NPAs as a % of total assets in 6 years ▪ Management expects NPAs to decline modestly in 2Q14 0.79% 0.71% 0.65% 0.58% 0.54% 0.40% 0.60% 0.80% 1.00% 1Q13 2Q13 3Q13 4Q13 1Q14 Total Nonperforming Assets as a Percentage of Total Assets NPAs Down 30.2% vs. 1Q13 1 Excludes covered assets 2 Excludes the impact of $23 million process change that resulted in accelerated recognition of charge-offs in the non-prime automobile lending portfolio. 0.55% Accelerated Charge-Offs

88 ALLL Coverage Ratios Remain Strong 1 ▪ Delinquencies improved during the quarter: 30-89 days past due decreased 14.0% vs. 4Q13 90 days past due decreased 13.9% vs. 4Q13 ▪ The ALLL release was $80 million for 1Q14 compared to $67 million in 4Q13 ▪ Management anticipates declining ALLL releases in future quarters 1.65x 2.07x 3.03x 2.88x 2.42x 1.43x 1.55x 1.66x 1.73x 1.70x 0.50 1.00 1.50 2.00 2.50 3.00 3.50 1Q13 2Q13 3Q13 4Q13 1Q14 ALLL to Net Charge-offs ALLL to NPLs HFI ALLL Coverage Ratios 1 Excludes covered assets and the reserve for unfunded lending commitments

99 Margin Lower Due to Investment Portfolio Growth 3.76% 3.70% 3.68% 3.56% 3.52% 3.43% 3.40% 3.39% 3.34% 3.29% 2.75% 3.25% 3.75% 4.25% 1Q13 2Q13 3Q13 4Q13 1Q14 Reported NIM Core NIM ▪ 1Q14 NIM declined 4 bps vs. 4Q13as a result of: Impact of larger investment portfolio to comply with liquidity regulations ▪ Margin expected to decline approximately 10 bps in 2Q14 driven by: Lower earning asset yields as credit spreads tighten Impact of covered asset runoff Partially offset by: Improved funding cost and mix change ▪ Core margin is expected to decline due to lower credit spreads on loan originations ▪ Became slightly less asset sensitive in 1Q14 due to funding and deposit mix changes ▪ Duration of equity is -0.55 Net Interest Margin 0.39% 0.51% 1.35% 2.27% 0.43% 0.44% 1.10% 1.70% 0.00% 1.00% 2.00% 3.00% Down 25 Up 50 Up 100 Up 200 Sensitivities as of 12/31/13 Sensitivities as of 03/31/14 Rate Sensitivities 1 Excludes covered assets. See non-GAAP reconciliations included in the attached Appendix. 1

1010 Fee Income Reflects Seasonality, Mortgage Impact ▪ Insurance income increased $56 million compared to 4Q13 primarily due to higher performance-based commission income, increased commissions on new and renewal business and an improved process for estimating commission income. Management expects similar insurance revenue in 2Q14. ▪ Mortgage income declined $26 million vs. 4Q13, primarily driven by lower production volumes. ▪ Trust and investment advisory revenues increased due to stronger production in Wealth management. ▪ Other income includes a net decline of $30 million in gains related to the sale of a consumer lending subsidiary in the 4 th quarter and a $19 million decrease in income from assets for certain post-employment benefits, which is offset in personnel expense. 42.9% 44.6% 41.6% 43.5% 43.2% 30.0% 35.0% 40.0% 45.0% 50.0% 1Q13 2Q13 3Q13 4Q13 1Q14 Fee Income Ratio 1 1Q14 1Q14 v. 4Q13 2 Increase (Decrease) 1Q14 v. 1Q13 Increase (Decrease) Insurance income $ 427 61.2% 17.0% Service charges on deposits 143 (21.5) 3.6 Mortgage banking income 74 (105.4) (58.9) Investment banking and brokerage fees and commissions 88 (52.2) (6.4) Bankcard fees and merchant discounts 62 (18.7) 5.1 Trust and investment advisory revenues 54 15.6 12.5 Checkcardfees 47 (24.3) - Income from bank-owned life insurance 27 (63.4) (3.6) FDIC loss share income, net (84) 48.7 42.4 Securities gains (losses), net 2 NM (91.3) Other income 71 (189.1) (9.0) Total noninterest income $ 911 (30.5)% (9.0)% Noninterest Income ($ in millions) 1 Excludes securities gains (losses), the impact of FDIC loss share accounting and other selected items. See non-GAAP reconciliations included in the attached Appendix. 2 Linked quarter percentages are annualized.

1111 Expenses Decrease 15% 2 ▪ Noninterest expense declined $53 million vs. 4Q13. Management continues to expect positive operating leverage for 2014 to drive down the efficiency ratio. ▪ Personnel expense decreased $45 million vs. 4Q13 due to decreased incentives and commissions and lower estimated qualified pension plan expense. Management expects a continued decline in personnel expensethis year. ▪ Professional services decreased $13 million driven by a decrease in legal expenses and a decline in costs associated with project-related expenses. ▪ 1Q14 effective tax rate was 27.3%; expecting similar rate in 2Q14. 56.4% 57.6% 60.1% 59.9% 59.3% 50.0% 55.0% 60.0% 65.0% 1Q13 2Q13 3Q13 4Q13 1Q14 Efficiency Ratio 1 1Q14 1Q14 v. 4Q13 2 Increase (Decrease) 1Q14 v. 1Q13 Increase (Decrease) Personnel expense $ 782 (22.1) % (4.3) % Occupancy and equipment expense 176 4.7 2.9 Loan-related expense 69 31.7 19.0 Foreclosed property expense 9 (73.7) (50.0) Regulatory charges 29 (49.2) (17.1) Professional services 33 (114.6) (8.3) Software expense 43 - 13.2 Amortization of intangibles 23 (46.8) (14.8) Merger-related and restructuring charges, net 8 (81.1) 60.0 Other expense 231 16.4 10.5 Total noninterest expense $ 1,403 (14.8)% (0.8)% Noninterest Expense ($ in millions) 1 Excludes securities gains (losses), foreclosed property expense, amortization of intangible assets, merger-related and restructuring charges, the impact of FDIC loss share accounting, and other selected items. See non-GAAP reconciliations included in the attached Appendix. 2 Linked quarter percentages are annualized.
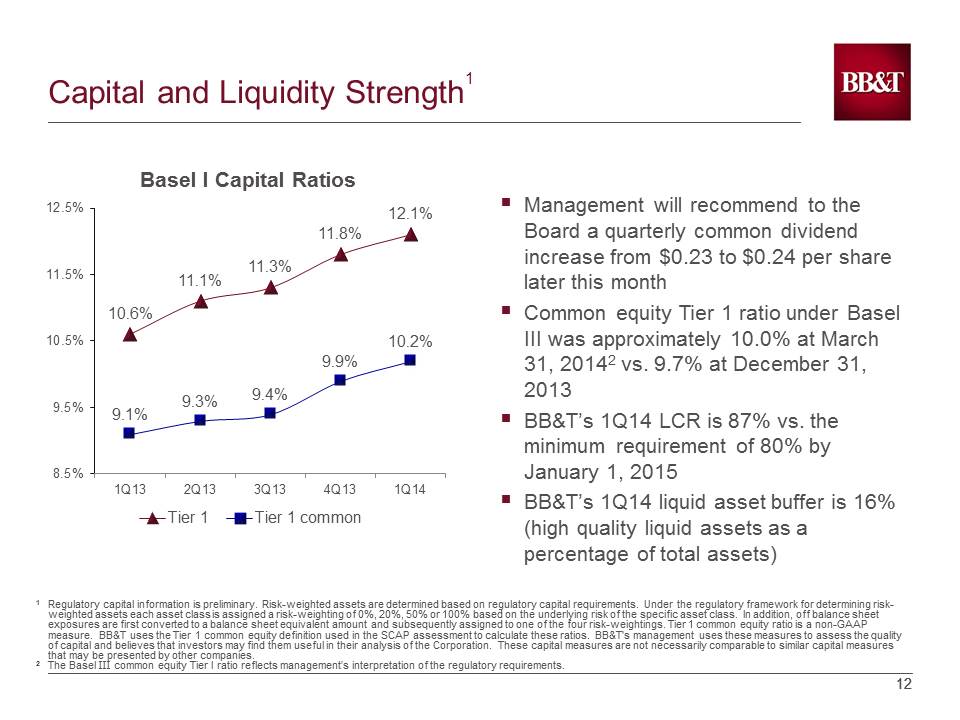
1212 Capital and Liquidity Strength 1 10.6% 11.1% 11.3% 11.8% 12.1% 9.1% 9.3% 9.4% 9.9% 10.2% 8.5% 9.5% 10.5% 11.5% 12.5% 1Q13 2Q13 3Q13 4Q13 1Q14 Basel I Capital Ratios Tier 1 Tier 1 common ▪ Management will recommend to the Board a quarterly common dividend increase from $0.23 to $0.24 per share later this month ▪ Common equity Tier 1 ratio under Basel III was approximately 10.0% at March 31, 2014 2 vs. 9.7% at December 31, 2013 ▪ BB&T’s 1Q14 LCR is 87% vs. the minimum requirement of 80% by January 1, 2015 ▪ BB&T’s 1Q14 liquid asset buffer is 16% (high quality liquid assets as a percentage of total assets) 1 Regulatory capital information is preliminary. Risk-weighted assets are determined based on regulatory capital requirements. Under the regulatory framework for determining risk- weighted assets each asset class is assigned a risk-weighting of 0%, 20%, 50% or 100% based on the underlying risk of the specific asset class. In addition, off balance sheet exposures are first converted to a balance sheet equivalent amount and subsequently assigned to one of the four risk -weightings.Tier 1 common equity ratio is a non-GAAP measure. BB&T uses the Tier 1 common equity definition used in the SCAP assessment to calculate these ratios. BB&T's management uses these measures to assess the quality of capital and believes that investors may find them useful in their analysis of the Corporation. These capital measures are not necessarily comparable to similar capital measures that may be presented by other companies. 2 The Basel IIIcommon equity Tier I ratio reflects management’s interpretation of the regulatory requirements.

1313 Community Banking Segment ▪ CRE –Income Producing Properties loans increased $471 million, or 4.8%, compared with 1Q13 and 10.7% annualized compared with 4Q13 ▪ Average dealer floor plan loans increased by $425 million, or 92.5%, compared with 1Q13 and 46.6% annualized compared with 4Q13 ▪ Retail Lines increased $47.3 million, or 3.6% annualized compared with 4Q13 ▪ Revolving Credit Lines increased $80 million, or 3.5%, compared with 1Q13 and 0.4% annualized compared with 4Q13 ▪ Retail loan production accelerated in late March into early April ▪ Average deposit balances (excluding time deposits) increased $2.4 billion, or 2.9%, compared with 1Q13 and 1.1% annualized compared with 4Q13 ▪ Expect to close on 21 Citi Texas branches late this quarter – Deposits -$1.6 billion Loans -$129 million ($ in millions) Inc/(Dec) 4Q13 Inc/(Dec) 1Q13 1Q14 Comments 4 Net Interest Income Noninterest Income 1 Loan Loss Provision Noninterest Expense 2 Income Tax Expense Segment Net Income Highlighted Metrics $ 723 321 16 686 125 $ 217 $ (27) (21) 8 4 (23) $ (37) $ (52) (20) (101) (9) 14 $ 24 ($ in billions) 1 Noninterest Income includes intersegment net referral fees 2 Noninterest Expense includes amortization of intangibles and allocated corporate expense 3 Current quarter over common quarter of prior year 4 Linked quarter growth rates annualized 1Q14 Like Noninterest-bearing Deposit Growth 3 Noninterest-bearing / Total Deposits C&I Loan Growth CRE Loan Growth Retail Loan Growth $31.5 29.9% $25.2 $12.7 $7.4 10.7% 3.1% (1.7%) 1.2% (1.6%) Link 3.7% 0.5% (2.2%) 9.4% 1.5% Change

1414 Residential Mortgage Banking Segment Retains and services mortgage loans originated by the Residential Mortgage Lending Division and through its referral relationship with the Community Bank and referral partners as well as those purchased from various correspondent originators ($ in millions) Inc/(Dec) 4Q13 Inc/(Dec) 1Q131Q14 Comments Net Interest Income Noninterest Income 1 Loan Loss Provision Noninterest Expense 2 Income Tax Expense Segment Net Income Highlighted Metrics 3 Retail Originations Correspondent Purchases Total Production Loan Sales Loans Serviced for others (EOP) 1Q14 Like $ 127 61 (20) 107 38 $ 63 $ (11) (15) (38) (9) 7 $ 14 $ (20) (100) (13) 13 (46) $ (74) ▪ Residential mortgage loan production of $3.8 billion, down 56.1% vs. 1Q13 ▪ The 1Q14 production mix was 34% refinance / 66% purchase vs. 68% / 32% in 1Q13 ▪ Gain on sale margins declined to 0.69% in 1Q14 from 1.65% in 1Q13, and up from 0.55% in 4Q13 ▪ Net servicing fee income grew 83% vs. 1Q13 due to slower prepay speeds and 14.9% growth in loans serviced for others ▪ Net interest income decline due to 65% decrease in LHFS and runoff of transferred portfolio from Community Bank ▪ 1Q14 noninterest expense includes costs associated with organizational realignment to be compliant with QM ▪ Credit quality remained strong with 30+ day delinquency of 2.77%, non-accruals of 0.97%, and net charge-offs of 0.27% of Loans HFI ($ in billions) 1 Noninterest Income includes intersegment net referral fees 2 Noninterest Expense includes amortization of intangibles and allocated corporate expense 3 Highlighted Metrics do not include operating statistics for loans transferred from Community Banking in 1Q14 Link $1.4 2.4 $3.8 $2.9 $88.2 (24.3%) (31.2%) (28.8%) (50.8%) 3.7% (55.3%) (56.6%) (56.1%) (63.6%) 14.9% Change

1515 Dealer Financial Services Segment ▪ Dealer Financial Services continued to generate strong loan production driven by increased auto sales and BB&T marketing efforts to dealers ▪ Additional market expansion for Regional Acceptance planned in Connecticut, Oregon, Tennessee, and California during 2014 ▪ Regional Acceptance’s underlying asset quality indicators continue to perform well within expectations and well by historical standards. Loans 30 days or more past due as a % of end of period loans decreased 9 bps compared to 1Q13 ▪ Focused on partnering with Community Banking to increase dealer wholesale lending, as well as indirect auto lending, through new and expanded relationships with franchise auto dealers throughout the BB&T footprint Primarily originates indirect loans to consumers on a prime and nonprime basis for the purchase of automobiles and other vehicles through approved dealers both in BB&T’s market and nationally (through Regional Acceptance Corporation) Comments 4 ($ in millions) Inc/(Dec) 4Q13 Inc/(Dec) 1Q131Q14 Net Interest Income Noninterest Income 1 Loan Loss Provision Noninterest Expense 2 Income Tax Expense Segment Net Income Highlighted Metrics 1Q14 Like $ 164 1 73 36 21 $ 35 $ (6) 1 15 3 (9) $ (14) $ - - 6 3 (4) $ (5) Loan Originations Loan Yield Operating Margin 3 Net Charge-offs 5 $ 1.5 7.23% 78.2% 1.81% 3.1% (1.02%) (1.8%) 0.01% 1 Noninterest Income includes intersegment net referral fees 2 Noninterest Expense includes amortization of intangibles and allocated corporate expense 3 Operating Margin excludes Loan Loss Provision 4 Linked quarter growth rates annualized except for production 5 Net Charge-offs metrics exclude the one-time 1Q14 impact of nonprime automobile lending process change ($ in billions) Link 26.5% (0.11%) (2.4%) 0.04% Change
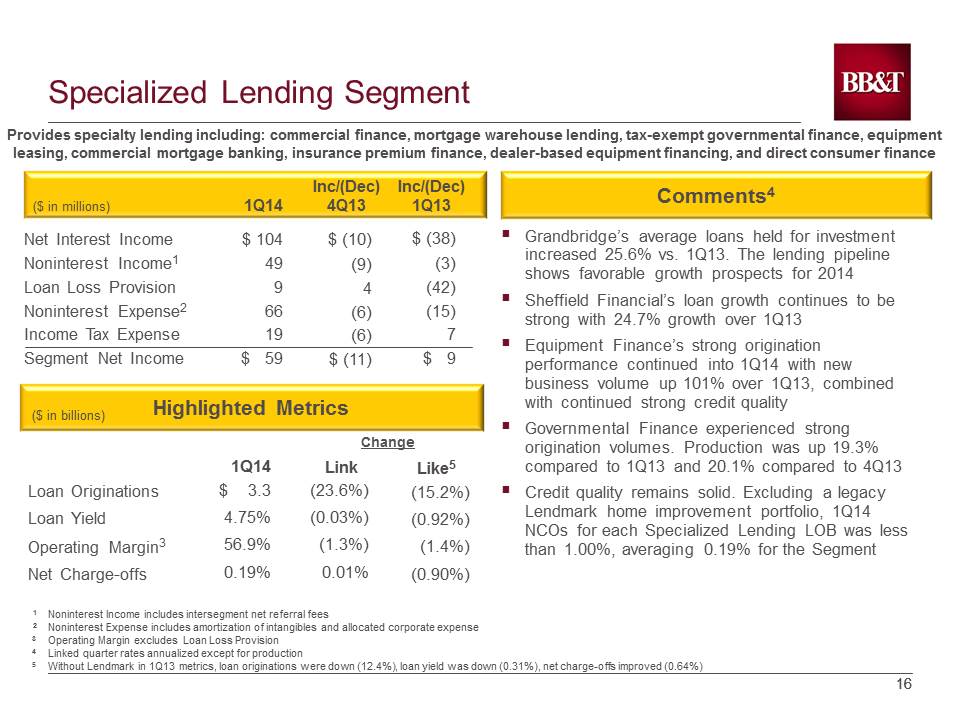
1616 Specialized Lending Segment Provides specialty lending including: commercial finance, mortgage warehouse lending, tax-exempt governmental finance, equipment leasing, commercial mortgage banking, insurance premium finance, dealer-based equipment financing, and direct consumer finance Comments 4 ($ in millions) Inc/(Dec) 4Q13 Inc/(Dec) 1Q131Q14 Net Interest Income Noninterest Income 1 Loan Loss Provision Noninterest Expense 2 Income Tax Expense Segment Net Income Highlighted Metrics 1Q14 Like 5 $ 104 49 9 66 19 $ 59 $ (10) (9) 4 (6) (6) $ (11) $ (38) (3) (42) (15) 7 $ 9 ($ in billions) Loan Originations Loan Yield Operating Margin 3 Net Charge-offs $ 3.3 4.75% 56.9% 0.19% (15.2%) (0.92%) (1.4%) (0.90%) ▪ Grandbridge’saverage loans held for investment increased 25.6% vs. 1Q13. The lending pipeline shows favorable growth prospects for 2014 ▪ Sheffield Financial’sloan growth continues to be strong with 24.7% growth over 1Q13 ▪ Equipment Finance’s strong origination performance continued into 1Q14 with new business volume up 101% over 1Q13, combined with continued strong credit quality ▪ Governmental Finance experienced strong origination volumes. Production was up 19.3% compared to 1Q13 and 20.1% compared to 4Q13 ▪ Credit quality remains solid. Excluding a legacy Lendmarkhome improvement portfolio, 1Q14 NCOs for each Specialized Lending LOB was less than 1.00%, averaging 0.19% for the Segment 1 Noninterest Income includes intersegment net referral fees 2 Noninterest Expense includes amortization of intangibles and allocated corporate expense 3 Operating Margin excludes Loan Loss Provision 4 Linked quarter rates annualized except for production 5 Without Lendmarkin 1Q13 metrics, loan originations were down (12.4%), loan yield was down (0.31%), net charge-offs improved (0.64%) (23.6%) (0.03%) (1.3%) 0.01% Link Change

1717 Insurance Segment Comments ($ in millions) Inc/(Dec) 4Q13 Inc/(Dec) 1Q131Q14 Net Interest Income Noninterest Income 1 Loan Loss Provision Noninterest Expense 2 Income Tax Expense Segment Net Income Highlighted Metrics Same Store Sales Growth 3 Noninterest Income Growth Number of Stores 4 EBITDA Margin 1Q14 Like Provides property and casualty, life, and health insurance to business and individual clients. It also provides workers compensation and professional liability, as well as surety coverage and title insurance $ 1 431 - 333 24 $ 75 $ (1) 46 - 29 (5) $ 21 $ (1) 65 - 15 9 $ 40 vs. $431 195 26.8 % 8.9% 17.7% (10) 1.8% 1 Noninterest Income includes intersegment net referral fees 2 Noninterest Expense includes amortization of intangibles and allocated corporate expense 3 Same store sales includes wholesale performance –based commissions 4 U.S. locations ▪ BB&T Insurance generated common quarter insurance revenue growth of 21.0% in Retail, 15.2% in Wholesale, and 17.7% for Total Insurance Segment ▪ Organic growth and strong performance-based commissions, plus $23 million due to a an improved process to estimate commission income drove like quarter results. The $23 million timing impact will be offset by reductions in later quarters this year ▪ Continued focus on implementing an expanded life insurance sales strategy involving current BB&T Wealth, Broker/Dealer and P&C client bases and expanding the employee benefits sales strategy ▪ BB&T announced acquisitions of Woodbury Insurance Group (Wilmington and Myrtle Beach) and Caledonian Insurance Group (aviation specialty) Change 21.1% 48.6% (1) 3.1% Link ($ in millions)

1818 Financial Services Segment ▪ Despite narrowing margins negatively impacting net interest income, volume was driven by: Corporate Banking, which generated 17.9% loan growth and 4.7% transaction deposit growth vs. 1Q13 BB&T Wealth, which generated 19.5% loan growth and 11.8% transaction deposit growth vs. 1Q13 ▪ Total invested assets increased to $114.4 billion, representing 11.8% annualized growth vs. 4Q13 driving invested asset noninterest income growth of 13.2% ▪ Decrease in noninterest income vs. 4Q13 was driven by lower investment banking and SBIC partnership income ▪ Strong momentum building in Wealth loan production Provides trust services, wealth management, investment counseling, asset management, estate planning, employee benefits, corporate banking, and capital market services to individuals, corporations, governments, and other organizations Comments ($ in millions) Inc/(Dec) 4Q13 Inc/(Dec) 1Q131Q14 Net Interest Income Noninterest Income 1 Loan Loss Provision Noninterest Expense 2 Income Tax Expense Segment Net Income Highlighted Metrics Average Loan Balances Average Deposits Total Invested Assets Invested Assets Noninterest Income Growth ($ in millions) Operating Margin 3 1Q14 Like $ 106 183 - 180 41 $ 68 $ (4) (31) 3 (6) (12) $ (20) $ (9) (1) (9) 3 (1) $ (3) $ 9.3 $ 27.1 $ 114.4 $ 118.8 37.7% 17.8% (13.6%) 11.3% 9.0% (3.1%) 1 Noninterest Income includes intersegment net referral fees 2 Noninterest Expense includes amortization of intangibles and allocated corporate expense 3 Operating Margin excludes Loan Loss Provision ($ in billions) Link 17.7% 10.8% 11.8% 13.2% (4.9%) Change

19

20
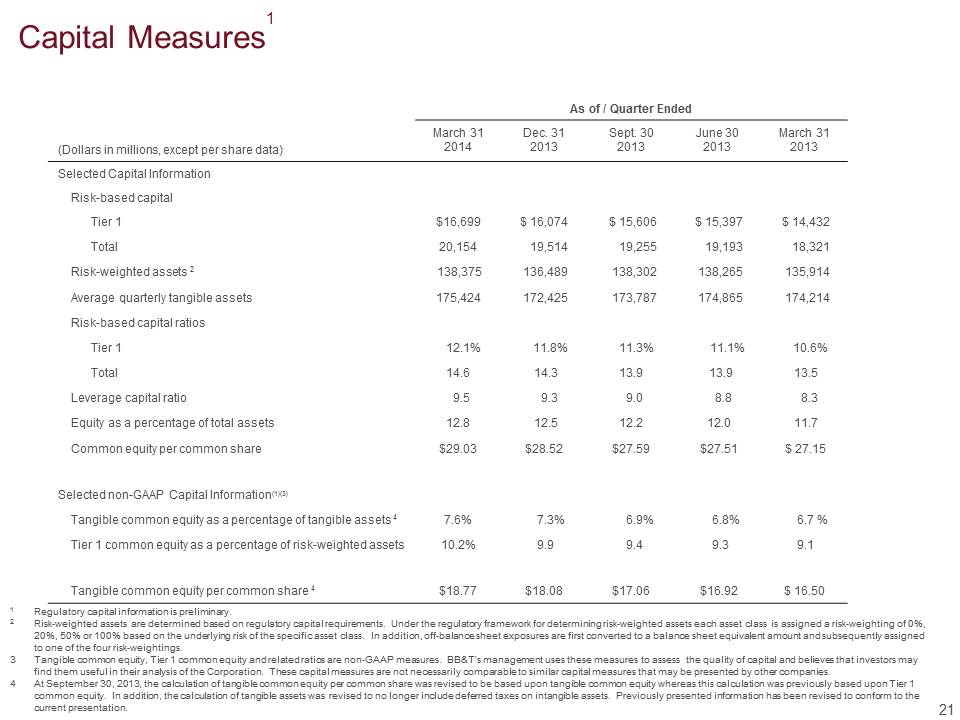
Capital Measures 1 As of / Quarter Ended (Dollars in millions, except per share data) March 31 2014 Dec. 31 2013 Sept. 30 2013 June 30 2013 March 31 2013 Selected Capital Information Risk-based capital Tier 1 $16,699 $ 16,074 $ 15,606 $ 15,397 $ 14,432 Total 20,154 19,514 19,255 19,193 18,321 Risk-weighted assets 2 138,375 136,489 138,302 138,265 135,914 Average quarterly tangible assets 175,424 172,425 173,787 174,865 174,214 Risk-based capital ratios Tier 1 12.1% 11.8% 11.3% 11.1% 10.6% Total 14.6 14.3 13.9 13.9 13.5 Leverage capital ratio 9.5 9.3 9.0 8.8 8.3 Equity as a percentage of total assets 12.8 12.5 12.2 12.0 11.7 Common equity per common share $29.03 $28.52 $27.59 $27.51 $ 27.15 Selected non-GAAP Capital Information (1)(3) Tangible common equity as a percentage of tangible assets 4 7.6% 7.3% 6.9% 6.8% 6.7 % Tier 1 common equity as a percentage of risk-weighted assets 10.2% 9.9 9.4 9.3 9.1 Tangible common equity per common share 4 $18.77 $18.08 $17.06 $16.92 $ 16.50 1 Regulatory capital information is preliminary. 2 Risk-weighted assets are determined based on regulatory capital requirements. Under the regulatory framework for determining risk-weighted assets each asset class is assigned a risk-weighting of 0%, 20%, 50% or 100% based on the underlying risk of the specific asset class. In addition, off-balance sheet exposures are first converted to a balance sheet equivalent amount and subsequently assigned to one of the four risk-weightings. 3 Tangible common equity, Tier 1 common equity and related ratios are non-GAAP measures. BB&T’s management uses these measures toassess the quality of capital and believes that investors may find them useful in their analysis of the Corporation. These capital measures are not necessarily comparable to similar capitalmeasures that may be presented by other companies. 4 At September 30, 2013, the calculation of tangible common equity per common share was revised to be based upon tangible common equity whereas this calculation was previously based upon Tier 1 common equity. In addition, the calculation of tangible assets was revised to no longer include deferred taxes on intangibleassets. Previously presented information has been revised to conform to the current presentation. 21

Basel III Common Equity Tier 1 Ratio 1 (Dollars in millions) March 31 2014 Tier 1 common equity under Basel Idefinition $ 14,096 Adjustments: Other adjustments 96 Common equity Tier 1 under Basel IIIdefinition $ 14,192 Estimated risk-weighted assets under Basel III definition $ 142,258 BaselIII common equity Tier 1 ratio 10.0% 1 Regulatory capital information is preliminary. The Basel IIIcommon equity Tier 1 ratio reflects management’s interpretation of the regulatory requirements and is subject to change. 22

Non-GAAP Reconciliations 1 (Dollars in millions, except per share data) As of / Quarter Ended March 31 2014 Dec. 31 2013 Sept. 30 2013 June 30 2013 March 31 2013 Calculations of tangible common equity, Tier 1 common equity, tangible assets and related measures: 3 Total shareholders’ equity $ 23,556 $ 22,809 $ 22,094 $ 21,996 $ 21,229 Less: Preferred stock 2,603 2,603 2,603 2,603 2,116 Noncontrolling interests 94 50 45 56 65 Intangible assets 7,370 7,383 7,418 7,444 7,470 Tangible common equity $13,489 $12,773 $12,028 $11,893 $11,578 Add: Regulatory adjustments 607 698 975 901 738 Tier 1 common equity (Basel I) $14,096 $13,471 $13,003 $12,794 $12,316 Total assets $184,651 $183,010 $181,708 $183,392 $181,504 Less: Intangible assets 7,370 7,383 7,418 7,444 7,470 Tangible assets 4 $177,281 $175,627 $174,290 $175,948 $174,034 Risk-weighted assets 2 $138,375 $136,489 $138,302 $138,265 $135,914 Tangible common equity as a percentage of tangible assets 3,4 7.6% 7.3% 6.9% 6.8% 6.7% Tier 1 common equity as a percentage of risk-weighted assets 3 10.2 9.9 9.4 9.3 9.1 Tangible common equity $13,489 $12,773 $12,028 $11,893 $11,578 Outstanding shares at end of period (in thousands) 718,497 706,620 704,925 702,995 701,440 Tangible common equity per common share 4 $18.77 $18.08 $17.06 $16.92 $ 16.50 1 Regulatory capital information is preliminary. 2 Risk-weighted assets are determined based on regulatory capital requirements. Under the regulatory framework for determining risk-weighted assets each asset class is assigned a risk-weighting of 0%, 20%, 50% or 100% based on the underlying risk of the specific asset class. In addition, off-balance sheet exposures are first converted to a balance sheet equivalent amount and subsequently assigned to one of the four risk-weightings. 3 Tangible common equity, Tier 1 common equity and related ratios are non-GAAP measures. BB&T's management uses these measures toassess the quality of capital and believes that investors may find them useful in their analysis of the Corporation. These capital measures are not necessarily comparable to similar capital measures that may be presented by other companies. 4 At September 30, 2013, the calculation of tangible common equity per common share was revised to be based upon tangible common equity whereas this calculation was previously based upon Tier 1 common equity. In addition, the calculation of tangible assets was revised to no longer include deferred taxes on intangible assets. Previously presented information has been revised to conform to the current presentation. 23
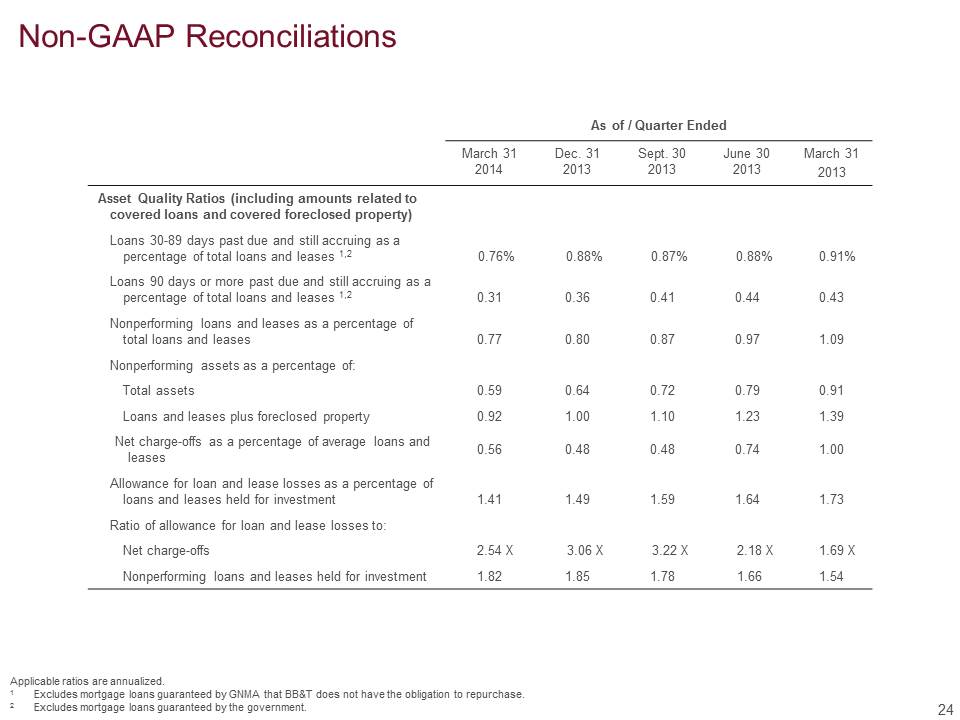
Non-GAAP Reconciliations As of / Quarter Ended March 31 2014 Dec. 31 2013 Sept. 30 2013 June 30 2013 March 31 2013 Asset Quality Ratios (including amounts related to covered loans and covered foreclosed property) Loans 30-89 days past due and still accruing as a percentage of total loans and leases 1,2 0.76% 0.88% 0.87% 0.88% 0.91% Loans 90 days or more past due and still accruing as a percentage of total loans and leases 1,2 0.31 0.36 0.41 0.44 0.43 Nonperforming loans and leases as a percentage of total loans and leases 0.77 0.80 0.87 0.97 1.09 Nonperforming assets as a percentage of: Total assets 0.59 0.64 0.72 0.79 0.91 Loans and leases plus foreclosed property 0.92 1.00 1.10 1.23 1.39 Net charge-offs as a percentage of average loans and leases 0.56 0.48 0.48 0.74 1.00 Allowance for loan and lease losses as a percentage of loans and leases held for investment 1.41 1.49 1.59 1.64 1.73 Ratio of allowance for loan and lease losses to: Net charge-offs 2.54 X 3.06 X 3.22 X 2.18 X 1.69 X Nonperforming loans and leases held for investment 1.82 1.85 1.78 1.66 1.54 24 Applicable ratios are annualized. 1 Excludes mortgage loans guaranteed by GNMA that BB&T does not have the obligation to repurchase. 2 Excludes mortgage loans guaranteed by the government.

Non-GAAP Reconciliations Applicable ratios are annualized. 1 Excludes mortgage loans guaranteed by GNMA that BB&T does not have the obligation to repurchase. 2 Excludes mortgage loans guaranteed by the government. 3 These asset quality ratios have been adjusted to remove the impact of covered loans and covered foreclosed property. Appropriate adjustments to the numerator and denominator have been reflected in the calculation of these ratios. Management believes the inclusion of covered loans in certain asset quality ratios that include nonperforming assets, past due loans or net charge-offs in the numerator or denominator results in distortion of these ratios and they may not be comparable to other pe riods presented or to other portfolios that were not impacted by loss share accounting. As of / Quarter Ended March 31 2014 Dec. 31 2013 Sept. 30 2013 June 30 2013 March 31 2013 Asset Quality Ratios (excluding amounts related to covered loans and covered foreclosed property) 3 Loans 30-89 days past due and still accruing as a percentage of total loans and leases 1,2 0.70% 0.82% 0.79% 0.81% 0.83% Loans 90 days or more past due and still accruing as a percentage of total loans and leases 1,2 0.09 0.11 0.10 0.11 0.12 Nonperforming loans and leases as a percentage of total loans and leases 0.78 0.81 0.89 0.99 1.12 Nonperforming assets as a percentage of: Total assets 0.54 0.58 0.65 0.71 0.79 Loans and leases plus foreclosed property 0.85 0.91 1.00 1.10 1.23 Net charge-offs as a percentage of average loans and leases 0.55 0.49 0.49 0.75 0.98 Allowance for loan and lease losses as a percentage of loans and leases held for investment 1.34 1.42 1.51 1.57 1.65 Ratio of allowance for loan and lease losses to: Net charge-offs 2.42 X 2.88 X 3.03 X 2.07 X 1.65 X Nonperforming loans and leases held for investment 1.70 1.73 1.66 1.55 1.43 25

Non-GAAP Reconciliations Quarter Ended Efficiency and Fee Income Ratios March 31 2014 Dec. 31 2013 Sept. 30 2013 June 30 2013 March 31 2013 Efficiency ratio –GAAP 61.2 % 61.1 % 62.4 % 59.9 % 57.5 % Effect of securities gains (losses), net - 0.1 - 0.5 0.5 Effect of merger-related and restructuring charges, net (0.3) (0.4) (0.2) (1.1) (0.2) Effect of gain on sale of subsidiary - 0.8 - - - Effect of FDIC loss share accounting (0.1) (0.2) - (0.2) 0.5 Effect of foreclosed property expense (0.4) (0.5) (0.6) (0.5) (0.8) Effect of owned real estate adjustments - - (0.5) - - Effect of amortization of intangibles (1.1) (1.0) (1.0) (1.0) (1.1) Efficiency ratio –reported 59.3 59.9 60.1 57.6 56.4 Fee income ratio –GAAP 39.7 % 41.4 % 38.4 % 41.9 % 40.7 % Effect of securities gains (losses), net - (0.1) - (0.5) (0.5) Effect of gain on sale of subsidiary - (0.8) - - - Effect of FDIC loss share accounting 3.5 3.0 3.2 3.2 2.7 Fee income ratio –reported 43.2 43.5 41.6 44.6 42.9 26
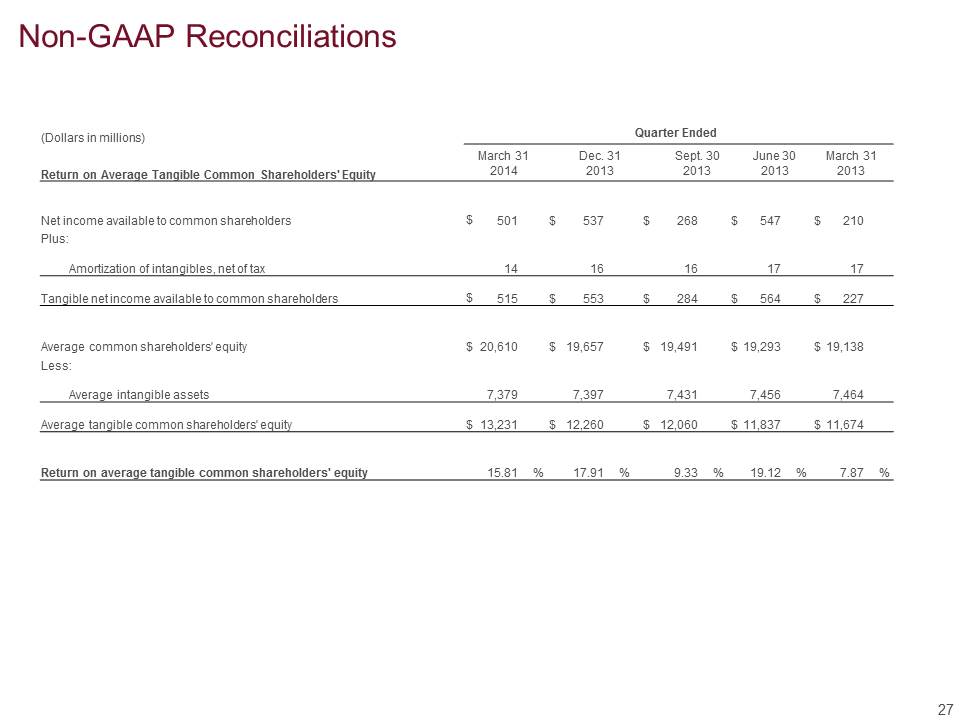
Non-GAAP Reconciliations (Dollars in millions) Quarter Ended March 31 Dec. 31 Sept. 30 June 30 March 31 Return on Average Tangible Common Shareholders' Equity 2014 2013 2013 2013 2013 Net income available to common shareholders $ 501 $ 537 $ 268 $ 547 $ 210 Plus: Amortization of intangibles, net of tax 14 16 16 17 17 Tangible net income available to common shareholders $ 515 $ 553 $ 284 $ 564 $ 227 Average common shareholders' equity $ 20,610 $ 19,657 $ 19,491 $ 19,293 $ 19,138 Less: Average intangible assets 7,379 7,397 7,431 7,456 7,464 Average tangible common shareholders' equity $ 13,231 $ 12,260 $ 12,060 $ 11,837 $ 11,674 Return on average tangible common shareholders' equity 15.81 % 17.91 % 9.33 % 19.12 % 7.87 % 27

Non-GAAP Reconciliations Quarter Ended Reported net interest margin vs. core net interest margin March 31 2014 Dec. 31 2013 Sept. 30 2013 June 30 2013 March 31 2013 Reported net interest margin -GAAP 3.52% 3.56 % 3.68 % 3.70% 3.76 % Adjustments to interest income for covered assets: Effect of covered securities (0.06) (0.05) (0.07) (0.06) (0.07) Effect of covered loans (0.18) (0.19) (0.24) (0.26) (0.28) Adjustments to interest expense: Effect of interest expense on covered assets 0.01 0.02 0.02 0.02 0.02 Core net interest margin 3.29% 3.34% 3.39% 3.40% 3.43 % 28