Attached files
| file | filename |
|---|---|
| 8-K - 8-K - ASSOCIATED BANC-CORP | d712732d8k.htm |
| EX-99.1 - EX-99.1 - ASSOCIATED BANC-CORP | d712732dex991.htm |
 ASSOCIATED
BANC-CORP
1Q 2014 EARNINGS PRESENTATION
APRIL 17, 2014
Exhibit 99.2
*
*
*
* |
 FORWARD-LOOKING
STATEMENTS
Important
note
regarding
forward-looking
statements:
Statements
made
in
this
presentation
which
are
not
purely
historical
are
forward-looking
statements,
as
defined
in
the
Private
Securities
Litigation
Reform
Act
of
1995.
This
includes
any
statements
regarding
management’s
plans,
objectives,
or
goals
for
future
operations,
products
or
services,
and
forecasts
of
its
revenues,
earnings,
or
other
measures
of
performance.
Such
forward-looking
statements
may
be
identified
by
the
use
of
words
such
as
“believe”,
“expect”,
“anticipate”,
“plan”,
“estimate”,
“should”,
“will”,
“intend”,
“outlook”,
or
similar
expressions.
Forward-
looking
statements
are
based
on
current
management
expectations
and,
by
their
nature,
are
subject
to
risks
and
uncertainties.
Actual
results
may
differ
materially
from
those
contained
in
the
forward-looking
statements.
Factors
which
may
cause
actual
results
to
differ
materially
from
those
contained
in
such
forward-looking
statements
include
those
identified
in
the
Company’s
most
recent
Form
10-K
and
subsequent
SEC
filings.
Such
factors
are
incorporated
herein
by
reference.
1 |
 2014
FIRST QUARTER HIGHLIGHTS 2
Balance Sheet Growth drives Solid Earnings
•
Average loans of $16.2 billion were up $416 million, or 3% from the fourth
quarter •
Net interest income net of interest recoveries of $164 million was up $1 million
from the fourth quarter
–
Net interest margin of 3.12% compared to 3.17% in the first quarter 2013
•
Quarterly dividend of $0.09 / common share
•
Repurchased 2.3 million shares of common stock during the first quarter
•
Capital
ratios
remain
very
strong
with
a
Tier
1
common
equity
ratio
of
11.20%
•
Noninterest income of $74 million was down $2 million compared to the fourth
quarter •
Noninterest expense of $168 million was down $12 million from the fourth
quarter •
Net income available to common shareholders of $44 million or $0.27 per share
•
Pretax income of $66 million was up $4 million, or 7% from the fourth
quarter •
Return on Tier 1 Common Equity of 9.4%
Net Interest Income
&
Net Interest Margin
Noninterest Income
&
Expenses
Capital
Balance Sheet
Net Income
&
ROT1CE
–
Total average commercial loans grew a record $420 million from the fourth
quarter –
Average mortgage loans grew 2% from the fourth quarter
–
Efficiency ratio improved from the fourth quarter to 69%
|
 LOAN
PORTFOLIO COMPOSITION 3
Average Loans of $16.2 billion for First Quarter of 2014
1Q 2014 Average Net Loan Change (+$416 mln)
Loan Mix –
1Q 2014 (Average)
($ in millions)
Home Equity & Installment
Commercial Real Estate
Residential Mortgage
Power & Utilities
Oil & Gas
Mortgage Warehouse
General Commercial Loans
Average Quarterly Loans ($ in billions)
+5%
% Chg
+3%
+21%
+2%
(21%)
(3%)
+7%
Total
Commercial &
Business
Lending
+4% |
 COMMERCIAL LINE UTILIZATION TRENDS
4
Line utilization increased in all Commercial lines of business
Increase from 4Q 13
CRE + 110 bps
Specialized + 170 bps
Commercial + 200 bps |
 GROWING
NET INTEREST INCOME WHILE MARGIN COMPRESSES
5
Yield on Interest-earning Assets
Cost of Interest-bearing Liabilities
Net Interest Income & Net Interest Margin
($ in millions)
Net Interest Margin |
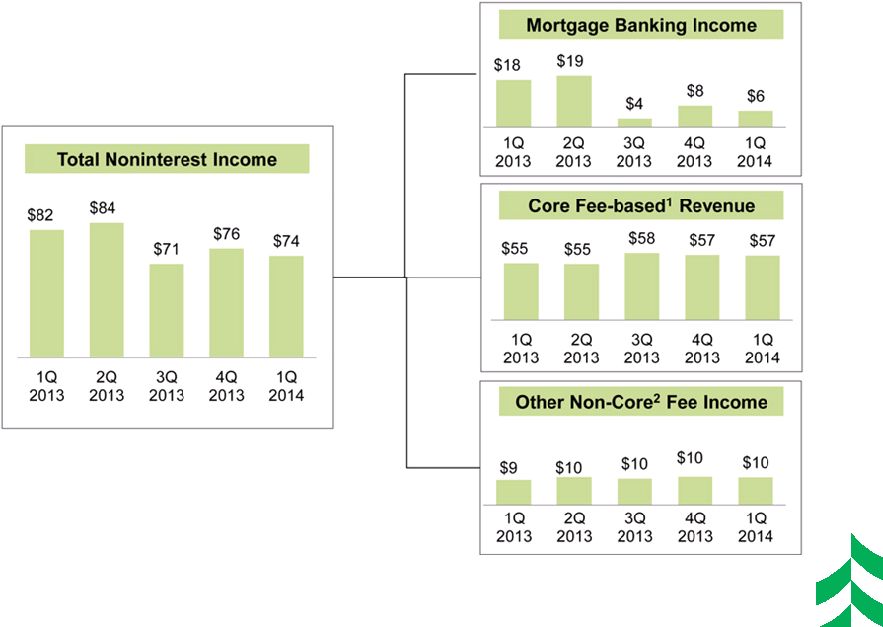 NONINTEREST INCOME TRENDS
($ IN MILLIONS)
6
1
–
Core
Fee-based
Revenue
=
Trust
service
fees
plus
Service
charges
on
deposit
accounts
plus
Card-based
and
other
non
deposit
fees
plus
Insurance
commissions
plus
Brokerage
and
annuity
commissions.
This
is
a
non-GAAP
measure.
Please
refer
to
press
release
tables
for
more
information.
2
–
Other
Non-core
Fee
Income
=
Total
Noninterest
Income
minus
Core
Fee-based
Revenue
minus
Mortgage
Banking
Income. |
 NONINTEREST EXPENSE TRENDS
($ IN MILLIONS)
7
1
–
Efficiency
ratio
=
Noninterest
expense,
excluding
amortization
of
intangibles,
divided
by
sum
of
taxable
equivalent
net
interest
income
plus
noninterest
income,
excluding
investment
securities
gains,
net,
and
asset
gains,
net.
This
is
a
non-GAAP
financial
measure.
Please
refer
to
the
appendix
for
a
reconciliation
of
this.
2
–
FTE
=
Average
Full
Time
Equivalent
Employees
3
–
Technology
Spend
=
Data
Processing
and
Equipment
expenses
4
–
Other
Non-Personnel
Spend
=
Total
Noninterest
Expense
less
Personnel
and
Technology
spend |
 IMPROVEMENT IN CREDIT QUALITY INDICATORS
($ IN MILLIONS)
8 |
 STRONG
CAPITAL PROFILE & SUSTAINED EARNINGS
•
Current capital levels are well in excess
of “well-capitalized”
regulatory
benchmarks
–
Existing capital levels are already
above Basel III capital levels
9
Tier 1 Common Equity Ratio
Net Income Available to Common & ROT1CE
Net Income Available
to Common
($ in millions)
Return on Tier 1
Common Equity
Definition of Tier 1 Common Equity:
Tier
1
Common
Equity
(T1CE),
a
non-GAAP
financial
measure,
is
used
by
banking
regulators,
investors
and
analysts
to
assess
and
compare
the
quality
and
composition of our capital with the capital of other financial services companies.
Management uses Tier 1 common equity, along with other capital measures, to assess
and
monitor
our
capital
position.
Tier
1
Common
Equity
is
Tier
1
capital
excluding
qualifying
perpetual
preferred
stock
and
qualifying
trust
preferred
securities. |
 2014
OUTLOOK 10
Asset Growth
Deposits / Funding
Mix
Margin
Noninterest
Income
Noninterest
Expense
Capital
Provision
•
Annual
average loan growth of 6-8%
•
High single digit average deposits and other funding growth
•
Continued modest NIM compression
•
NII down slightly. Mortgage banking income decline offset by
other fee categories growth
•
Flat compared to 2013 with continued focus on efficiency
initiatives
•
Continue to follow stated corporate priorities for capital
deployment
•
Provision will grow based on expected loan growth |
 APPENDIX
11
*
*
*
*
*
*
*
*
*
*
*
*
*
*
*
*
*
*
*
* |
 RECONCILIATION AND DEFINITIONS OF
NON-GAAP ITEMS
12
1Q 2013
2Q 2013
3Q 2013
4Q 2013
1Q 2014
Efficiency Ratio Reconciliation:
Efficiency ratio (1)
70.03%
69.01%
71.45%
73.70%
70.41%
Taxable equivalent adjustment
(1.46)
(1.38)
(1.50)
(1.49)
(1.35)
Asset gains (losses), net
0.24
(0.01)
0.59
0.80
0.22
Other intangible amortization
(0.42)
(0.41)
(0.44)
(0.42)
(0.42)
Efficiency ratio, fully taxable equivalent (1)
68.39%
67.21%
70.10%
72.59%
68.86%
(1)
Efficiency
ratio
is
defined
by
the
Federal
Reserve
guidance
as
noninterest
expense
divided
by
the
sum
of
net
interest
income
plus
noninterest
income, excluding investment securities gains / losses, net. Efficiency
ratio, fully taxable equivalent, is noninterest expense, excluding other
intangible amortization, divided by the sum of taxable equivalent net interest
income plus noninterest income, excluding investment securities gains /
losses, net and asset gains / losses, net. This efficiency ratio is presented on a taxable equivalent basis, which adjusts net interest
income for the tax-favored status of certain loans and investment
securities. Management believes this measure to be the preferred industry
measurement of net interest income as it enhances the comparability of net interest
income arising from taxable and tax-exempt sources and it excludes
certain specific revenue items (such as investment securities gains / losses, net and asset gains / losses, net). |