Attached files
| file | filename |
|---|---|
| 8-K - FORM 8-K - PROASSURANCE CORP | v374932_8k.htm |

PACE Meeting April 15, 2014 Eastern Alliance Insurance Group Bob Gilpin Senior Vice President, Field Operations / Marketing

Page 2 EAIG Workers’ Compensation Highlights • Direct Written Premium of $198.7 Million for the Year Ended December 31, 2013, and $182.9 Million for the Year Ended December 31, 2012 • GAAP Combined Ratio – 93.0% for the Year Ended December 31, 2013 • Net Income - $12.2 Million for the Year Ended December 31, 2013 • Focused State Expansion • Regional/Satellite Office Expansion: • Strong Capital Position – Net Written Premium to Surplus – 1.20 – A.M. Best “A” (Excellent) – Stable Outlook • Select Agency Partnerships – 171 Contracts / 477 Locations Mid - Atlantic Region Southeast Region Midwest Region Gulf South Region • Lancaster, PA • Wexford, PA • Charlotte, NC • Nashville, TN • Richmond, VA • Indianapolis, IN • Madison, MS

Page 3 EAIG Direct Written Premium Growth Rates 20.6% 13.6% 8.9% 7.7% 10.4% 8.0% 15.2% 22.8% 17.5% 8.6% $- $20.0 $40.0 $60.0 $80.0 $100.0 $120.0 $140.0 $160.0 $180.0 $200.0 $220.0

Page 4 Workers’ Compensation Key Operating Statistics for the Year Ended December 31, 2013 (1) Premium writings include Pennsylvania Employers Assessment (2) Claims occurring between October 1, 2007 and September 30, 2008 Underwriting (1) : Direct written premium $202.1 million Direct written premium growth 8.6% Premium renewal retention 84.2% Renewal pricing 4.8% New business writings $38.3 million Select business growth 11.1% Large Deductible / Retro premium writings $15.1 million Alternative Market writings $52.4 million High experience modifications writings $18.0 million ParalleyPay writings $28.8 million Combined ratio 93.0% Calendar year loss ratio 68.6% Claims (36 months average maturity) (2) : EAIG Pennsylvania Variance Average total cost per claim $ 4,990 $ 8,886 - 43.8% Average benefit payment per claim $ 4,257 $ 7,758 - 45.1% Average medical payment per claim $ 2,232 $ 3,485 - 35.9% Average indemnity benefit per loss time claim $ 16,403 $ 23,713 - 30.8% Average medical benefit per loss time claim $ 12,232 $ 14,791 - 17.0% Average ALAE per claim $ 714 $ 5,392 - 86.7% Average duration of disability 19.6 weeks 25.3 weeks - 5.7 weeks Risk Management • Traditional in - force exposure - $8.3 billion • Claims severity – 10 claims over $300,000 • Reported claims frequency reduced 2.6% on an exposure basis • Staffing model – 24 risk management professionals

Page 5 EAIG Workers’ Compensation Combined Ratio History 79.1% 65.6% 80.2% 87.7% 96.0% 89.7% 91.8% 93.0% 0.0% 20.0% 40.0% 60.0% 80.0% 100.0% • 2013 NCCI industry projected combined ratio of 106.0%

Page 6 EAIG Geographic Footprint ; ; ; ; ; • Direct Written Premium of $198.7 Million for the Year Ended 12.31.13, and $182.9 Million for the Year Ended 12.31.12 • Licensed – 30 states Alabama Arizona Arkansas District of Columbia Delaware Florida Georgia Illinois Indiana Iowa Kentucky Louisiana Maryland Michigan Minnesota Mississippi Missouri New Jersey New Mexico New York North Carolina Ohio Oklahoma Pennsylvania South Carolina Tennessee Texas Virginia West Virginia Wisconsin

Page 7 Workers’ Compensation Product Line Diversification Broad Product Spectrum • Guaranteed Cost Policies • Loss - Sensitive Dividend Plans • Large and Medium Deductible Plans • Retrospective Rating Plans • Alternative Market Programs • ParallelPay – “Pay as you Go” • TPA Services, including Claims Administration and Risk Management Guaranteed Cost, 57.1% Alternative Markets, 25.9% Policyholder Dividend, 9.4% Deductible Plans, 3.9% Retrospective Rating, 3.7% Percentages as of December 31, 2013

Page 8 EAIG Workers’ Compensation Geography Diversification • Opened Southeast regional office (Charlotte, NC) – February 2008 • Acquired Employers Security Insurance Company (Indianapolis, IN) – September 2008 to serve as Midwest regional office • Opened Nashville, TN satellite office – April 2010 • Opened Wexford, PA satellite office – June 2010 • Opened Richmond, VA satellite office – May 2011 • Opened Gulf South regional office (Madison, MS) – July 2012 Pennsylvania, 92.8% Delaware, 2.2% North Carolina, 2.2% Maryland, 2.0% Virginia, 0.5% South Carolina, 0.2% Pennsylvania, 58.4% Indiana, 11.7% North Carolina, 6.3% Virginia, 3.8% Delaware, 3.1% Maryland, 2.8% New Jersey, 2.6% South Carolina, 2.3% Tennessee, 1.9% Other, 7.0% Percentages as of December 31, 2008 Percentages as of December 31, 2013

Page 9 Review of 2013/ 2014 EIHI Strategic Plan Highlights 2014 Highlights • Grand Rapids, Michigan Satellite Office • Expand Healthcare Market Penetration in Partnership with ProAssurance • ProAssurance Integration • ParallelPay and uni te Expansion • Alternative Market Branding Initiative • Medical Cost Containment Initiatives • Gulf South Expansion • Reinsurance Structure 2013 Review • Gulf South Regional Office Expansion • ParallelPay Expansion • New Jersey / Western Michigan / Georgia Expansion • Alternative Markets, Select, Large Deductible and High Modification Growth Initiatives • Multi - Line Captive Product • Claim Service Center Expansion • Medical Cost Management

0 200 400 600 800 1,000 1,200 1998 1999 2000 2001 2002 2003 2004 2005 2006 2007 2008 2009 2010 2011 2012 1998 1999 2000 2001 2002 2003 2004 2005 2006 2007 2008 2009 2010 2011 2012 Claims Closed 65 205 382 595 691 687 827 686 842 775 879 952 1,051 1,130 1,083 Claims Open 0 0 0 1 0 3 3 3 3 5 13 22 34 90 190 Number of Net Claims Year Page 10 EAIG Workers’ Compensation Claim Closing Patterns - Traditional Results as of December 31, 2013

Page 11 Pennsylvania Workers’ Compensation Market Share (Top 10) (dollars in thousands) 2012 Gross Written Premium Ten Year Average Loss Ratio Five Year Average Loss Ratio Three Year Average Loss Ratio 1. State Workers’ Insurance Fund $ 191,850 112.27% 121.65% 134.95% 2. Liberty Mutual Insurance Companies 167,981 78.82% 79.91% 86.55% 3. Travelers Group 163,376 71.65% 61.26% 58.49% 4. Zurich Financial Services NA Group 163,262 73.63% 67.85% 63.36% 5. Old Republic Insurance Group 161,148 73.93% 72.54% 74.85% 6. Erie Insurance Group 124,794 56.93% 36.11% 33.07% 7. Eastern Alliance Insurance Group 119,281 50.64% 50.78% 56.07% 8. Hartford Insurance Group 116,000 70.38% 61.23% 65.48% 9. American International Group 105,644 78.09% 79.38% 79.14% 10. Lackawanna Insurance Group 95,736 57.83% 58.74% 63.99%

Page 12 Page 12 Indiana Workers’ Compensation Market Share (Top 10) (dollars in thousands) 2012 Gross Written Premium Five Year Average Loss Ratio Three Year Average Loss Ratio 1. Liberty Mutual Insurance Company $ 86,481 72.33% 77.61% 2. Travelers Group 68,510 63.40% 73.14% 3. American International Group 42,099 67.00% 69.24% 4. Accident Fund Group 38,246 77.12% 75.38% 5. Zurich Financial Services NA Group 33,696 60.84% 47.64% 6. Cincinnati Insurance Companies 29,944 74.54% 66.38% 7. Hartford Insurance Group 26,976 65.14% 76.06% 8. Auto - Owners Insurance Group 26,899 98.12% 93.74% 9. Amerisure Companies 26,162 58.18% 59.51% 10. W. R. Berkley Insurance Group 24,412 69.43% 78.89% 14. Eastern Alliance Insurance Group 16,816 59.52% 72.22%
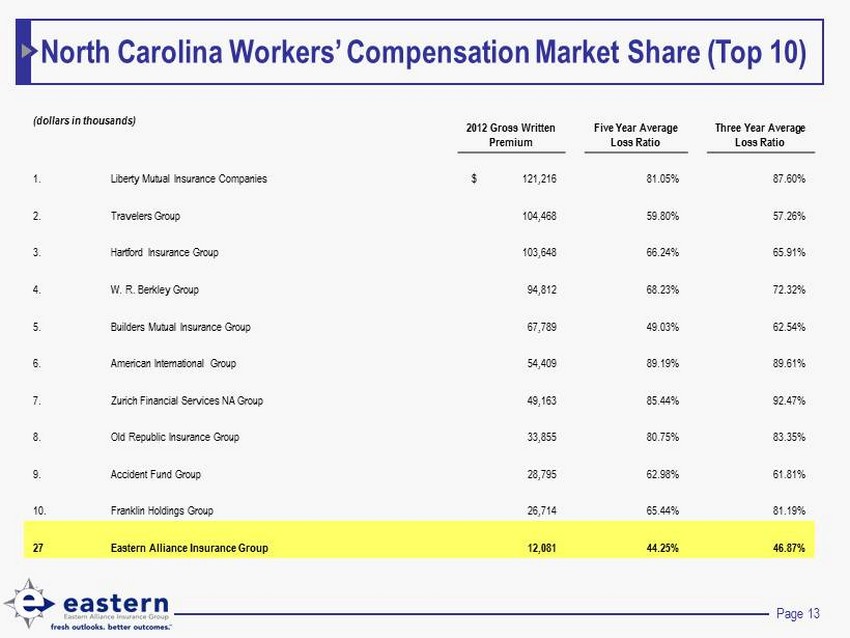
Page 13 North Carolina Workers’ Compensation Market Share (Top 10) (dollars in thousands) 2012 Gross Written Premium Five Year Average Loss Ratio Three Year Average Loss Ratio 1. Liberty Mutual Insurance Companies $ 121,216 81.05% 87.60% 2. Travelers Group 104,468 59.80% 57.26% 3. Hartford Insurance Group 103,648 66.24% 65.91% 4. W. R. Berkley Group 94,812 68.23% 72.32% 5. Builders Mutual Insurance Group 67,789 49.03% 62.54% 6. American International Group 54,409 89.19% 89.61% 7. Zurich Financial Services NA Group 49,163 85.44% 92.47% 8. Old Republic Insurance Group 33,855 80.75% 83.35% 9. Accident Fund Group 28,795 62.98% 61.81% 10. Franklin Holdings Group 26,714 65.44% 81.19% 27 Eastern Alliance Insurance Group 12,081 44.25% 46.87%

Page 14 Workers’ Compensation Alternative Markets…Alternative Options $847 $2,451 $5,082 $12,159 $17,257 $25,786 $28,512 $27,032 $26,912 $29,113 $28,790 $31,139 $38,517 $42,733 $51,125 $- $10,000 $20,000 $30,000 $40,000 $50,000 $60,000 1999 2000 2001 2002 2003 2004 2005 2006 2007 2008 2009 2010 2011 2012 2013 Year Alternative Market Growth DWP • Four new Alternative Markets programs in 2013.
Page 15 Page 15 EAIG Alternative Markets Highlights • Programs for construction, petroleum distribution, forestry, rehabilitation facilities and marina/recreation are open across all regions • Wrote direct written premium of $12.1 million in 2013 outside of Pennsylvania through geographic expansion initiatives • SPC combined ratio and net income of 93.5% and $3.1 million, respectively, in 2013 • Aggregate SPC net income of $27.6 million since inception of the Alternative Market operations • Excellent claim closure patterns resulted in aggregate favorable loss reserve development of $254,000 during 2013 • 97.6% of all 2012 and prior claims were closed as of December 31, 2013

Page 16 EAIG Workers’ Compensation Claim Closing Patterns – Alternative Markets 0 100 200 300 400 500 600 1999 2000 2001 2002 2003 2004 2005 2006 2007 2008 2009 2010 2011 2012 1999 2000 2001 2002 2003 2004 2005 2006 2007 2008 2009 2010 2011 2012 Claims Closed 45 72 116 213 334 503 507 355 323 334 385 395 481 427 Claims Open 0 0 0 0 0 0 1 0 3 2 3 13 17 70 Number of Net Claims Year Results as of December 31, 2013

Page 17 Page 17 2014 EAIG Financial and Strategic Plan 1. 2014 financial plan • Direct written premium - $211.9 million • Alternative market direct written premium - $55.6 million • Combined ratio – 90.5% • Net income (excludes investment income) - $12.2 million 2. Increase core workers’ compensation premium writings to $211.9 million across all regional offices in 2014 3. Diversify the revenue/earnings stream via geographic expansion 4. Expand Eastern’s Healthcare market penetration in partnership with ProAssurance across all operating regions 5. ProAssurance Integration and Organizational Excellence 6. Manage Profitability 7. Management Information Systems (MIS) Infrastructure Strategies

Page 18