Attached files
| file | filename |
|---|---|
| 8-K - FORM 8-K - PNC FINANCIAL SERVICES GROUP, INC. | d706940d8k.htm |
| EX-99.1 - EX-99.1 - PNC FINANCIAL SERVICES GROUP, INC. | d706940dex991.htm |
 The PNC
Financial Services Group, Inc. First Quarter 2014
Earnings Conference Call
April 16, 2014
Exhibit 99.2 |
 2
Cautionary Statement Regarding Forward-Looking
Information and Adjusted Information
Our earnings conference call presentation includes “snapshot” information about PNC
used by way of illustration. It is not intended as a full business or financial
review and should be viewed in the context of all of the information made available by PNC in its SEC filings. The presentation also
contains forward-looking statements regarding our outlook for earnings, revenues,
expenses, capital and liquidity levels and ratios, asset levels, asset quality,
financial position, and other matters regarding or affecting PNC and its future business and operations. Forward-looking statements are
necessarily subject to numerous assumptions, risks and uncertainties, which change over time.
The forward-looking statements in this presentation are qualified by the factors
affecting forward-looking statements identified in the more detailed Cautionary Statement included in the Appendix, which
is included in the version of the presentation materials posted on our corporate website at
www.pnc.com/investorevents, and in our SEC filings. We provide greater detail
regarding these as well as other factors in our 2013 Form 10-K, including in the Risk Factors and Risk Management sections
and in the Legal Proceedings and Commitments and Guarantees Notes of the Notes To Consolidated
Financial Statements in that report, and in our subsequent SEC filings. Our
forward-looking statements may also be subject to other risks and uncertainties, including those we may discuss in this
presentation or in SEC filings, accessible on the SEC’s website at www.sec.gov and on
PNC’s corporate website at www.pnc.com/secfilings. We have included web
addresses in this presentation as inactive textual references only. Information on those websites is not part of this presentation. Future
events or circumstances may change our outlook and may also affect the nature of the
assumptions, risks and uncertainties to which our forward- looking statements are
subject. Forward-looking statements in this presentation speak only as of the date of this presentation. We do not assume
any duty and do not undertake to update those statements. Actual results or future events
could differ, possibly materially, from those anticipated in forward-looking
statements, as well as from historical performance. In this presentation, we may sometimes refer to adjusted results to help illustrate the impact
of certain types of items. This information supplements our results as reported
in accordance with GAAP and should not be viewed in isolation from, or as a substitute for, our GAAP results. We believe that
this additional information and the reconciliations we provide may be useful to investors,
analysts, regulators and others to help evaluate the impact of these respective
items on our operations. We may also provide information on the components of net interest income (purchase accounting
accretion and the core remainder), on the impact of purchase accounting accretion on net
interest margin (core net interest margin (net interest margin less (annualized
purchase accounting accretion divided by average interest-earning assets)), on pretax pre-provision earnings (total revenue
less noninterest expense), and on tangible book value per common share (calculated based on
tangible common shareholders’ equity (common shareholders’ equity less
goodwill and other intangible assets, other than servicing rights, net of deferred tax liabilities on such intangible assets)
divided by common shares outstanding). Where applicable, we provide GAAP reconciliations for
such additional information, including in the slides, the Appendix and/or other
slides and materials on our corporate website at www.pnc.com/investorevents and in our SEC filings. In certain
discussions, we may also provide information on yields and margins for all
interest-earning assets calculated using net interest income on a taxable-
equivalent basis by increasing the interest income earned on tax-exempt assets to make it
fully equivalent to interest income earned on taxable investments. We believe
this adjustment may be useful when comparing yields and margins for all earning assets. We may also use annualized, pro
forma, estimated or third party numbers for illustrative or comparative purposes only. These
may not reflect actual results.
This presentation may also include discussion of other non-GAAP financial measures, which,
to the extent not so qualified therein or in the Appendix, is qualified by GAAP
reconciliation information available on our corporate website at www.pnc.com under “About PNC–Investor Relations.”
|
 3
1Q14 Highlights
1Q14 financial
summary
Net income
Diluted EPS from
net income
Return on average
assets
$1.1 billion
$1.82
1.35%
Successful first quarter
Stronger capital position
Executing on strategic priorities
–
Continued loan and deposit growth
–
Reduced expenses
–
Improved credit quality
–
Seasonal trends impact
–
Pro
forma
fully
phased-in
Basel
III
common
equity
Tier
1
capital
ratio
of
9.7%
(1)
–
Capital action
Increased quarterly common stock dividend by 9% to $0.48 for 2Q14
Plan to repurchase up to $1.5 billion of common stock over the four quarter
period starting in 2Q14
(2)
(1) Estimated as of March 31, 2014. We previously referred to the Basel III common equity Tier
1 capital ratio as the Basel III Tier 1 common capital ratio. Calculated on a pro
forma basis without the benefit of the Basel III phase-in provisions. For 1Q14, the resulting fully phased-in Basel III common equity Tier 1 capital ratio was calculated
based on the standardized approach RWAs. See Estimated Transitional Basel III and Pro forma
Fully Phased-In Basel III Common Equity Tier 1 Capital Ratios and related
information in the Appendix for further details. (2) Through 1Q15, subject to factors such as
market and general economic conditions, economic and regulatory capital
conditions, alternative uses of capital, regulatory and contractual limitations, and the
potential impact on credit ratings.
|
 4
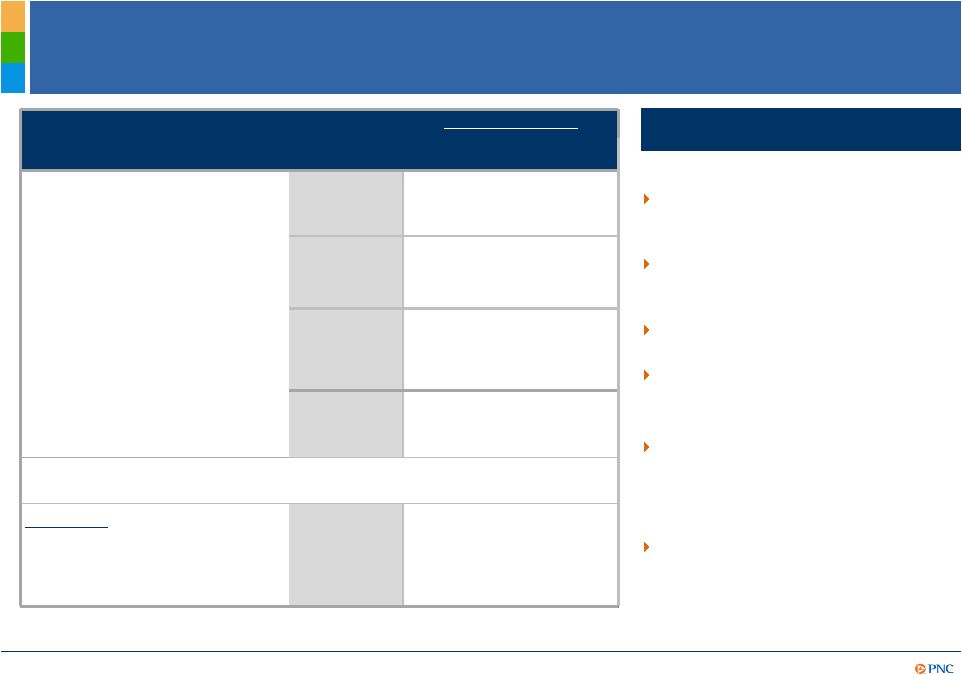
Continued Loan Growth and Capital Improvement
Investment securities declined by
$1.7 billion due to net payments
and maturities
Loans
increased $2.6 billion
Highlights
% change from:
Category (billions)
Mar. 31,
2014
Dec. 31,
2013
Mar. 31,
2013
Investment securities
$58.6
(2.7%)
(1.2%)
Total commercial lending
$120.8
3.1%
9.5%
Total consumer lending
77.4
(1.3%)
1.7%
Total loans
$198.2
1.3%
6.3%
Total assets
$323.4
1.0%
7.6%
Transaction deposits
$188.1
0.9%
7.2%
Total deposits
$222.4
0.7%
5.1%
Total shareholders’
equity
$43.3
2.3%
9.4%
Transitional
Basel
III
common
equity
Tier 1
(2,3)
10.8%
N/A
N/A
Pro forma Fully Phased-In Basel III
common equity Tier 1
(3,4)
9.7%
9.4%
8.0%
Tangible book value per common
share (TBV)
(5)
$56.33
$54.57
$50.30
Book value per common share
$73.73
$72.07
$68.10
Balances at period-end
Mar. 31,
2014
Dec. 31,
2013
Mar. 31,
2013
Capital
ratios:
(1,5)
Linked quarter:
Prior Year Quarter:
Loans grew $11.7 billion within
commercial and consumer
Deposits increased $10.8 billion
TBV growth of 12%
(5)
–
Commercial increased $3.6 billion
primarily in real estate, corporate
banking and business credit
–
Consumer decreased $1.0 billion
due to lower home equity,
residential mortgage, education
and credit card loans
Deposits grew $1.5 billion
Continued to enhance liquidity
position
Capital levels remained strong
(1) March 31, 2014 ratios estimated. (2) Calculated using the regulatory capital methodology
applicable to PNC during 2014. See Note A in the Appendix for further details. (3) We
previously referred to Basel III common equity Tier 1 capital ratio as the Basel III Tier 1 common capital ratio. (4) Calculated on a pro forma basis without the benefit
of the Basel III phase-in provisions. For both 1Q14 and 4Q13, the resulting pro forma fully
phased-in Basel III common equity Tier 1 ratios were calculated based on the
standardized approach RWAs. Advanced approaches RWAs were utilized for 1Q13. See Estimated
Transitional Basel III and Pro forma Fully Phased-In Basel III Common Equity Tier 1
Capital Ratios and related information in the Appendix for further details. (5) See Appendix for additional information related to capital ratios and TBV.
|
 5
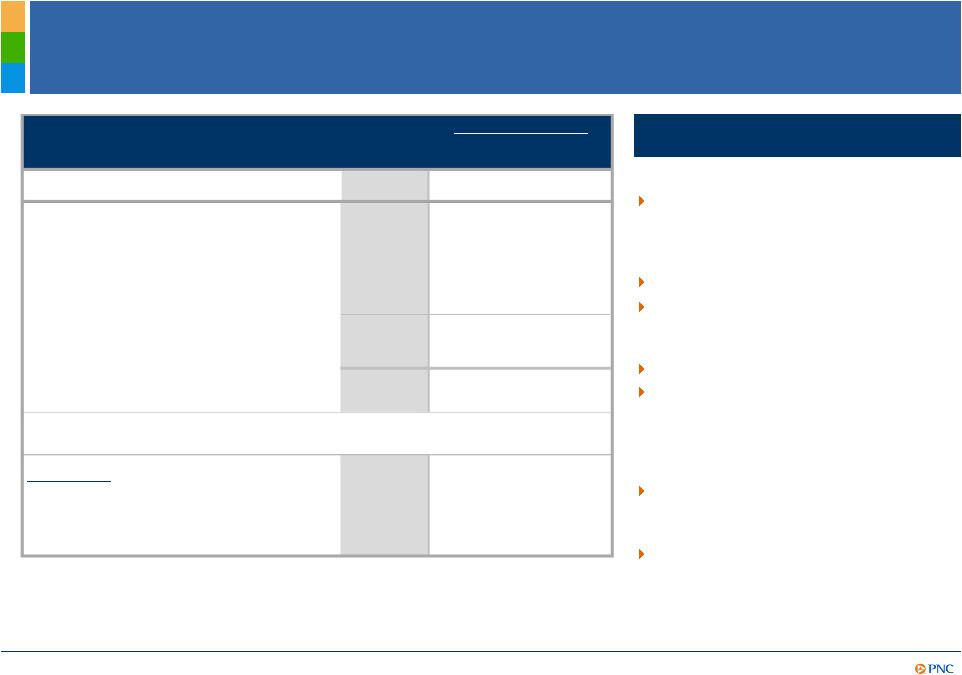
Seasonal Trends Impacted Results
Highlights
Revenue declined 7% due to lower
repurchase reserves release and
impact of seasonality, as expected
Noninterest expense decline of 10%
reflected overall disciplined expense
management and seasonality
Credit costs declined as overall
credit trends continued to improve
Strong returns
Prior Year Quarter:
Pretax pre-provision earnings
(2,5)
decreased 5% primarily due to net
interest income decline of 8%
partially offset by decreased
expenses of 4%
Net income increased 7%
Linked quarter:
$ change from:
(millions)
1Q14
4Q13
1Q13
Net interest income
$2,195
($71)
($194)
Noninterest income
1,582
(225)
16
Total revenue
$3,777
($296)
($178)
Noninterest
expense
(1)
$2,264
($250)
($104)
Pretax pre-provision
earnings
(2,5)
$1,513
($46)
($74)
Provision
94
(19)
(142)
Pretax
earnings
(3)
1,419
(27)
68
Net income
$1,060
($14)
$65
Returns
ROAA
(4)
1.35%
1.36%
1.33%
ROACE
(4)
10.36%
10.71%
10.58%
(1) Prior period amounts have been updated to reflect first quarter 2014 adoption of ASU
2014-01 related to low income housing tax credits. (2),(3),(4) See Notes B, C and D,
respectively, in the Appendix for additional details. (5) See Reconcilement section of the Appendix. |
 6
Core NII
(1)
$2,032
($43)
($108)
Scheduled accretion
134
(29)
(65)
Excess
cash
recoveries
(2)
29
1
(21)
Total purchase accounting
accretion (PAA)
163
(28)
(86)
Total NII
$2,195
($71)
($194)
Margins
Net interest margin (NIM)
3.26%
3.38%
3.81%
Core NIM
(3)
3.02%
3.10%
3.43%
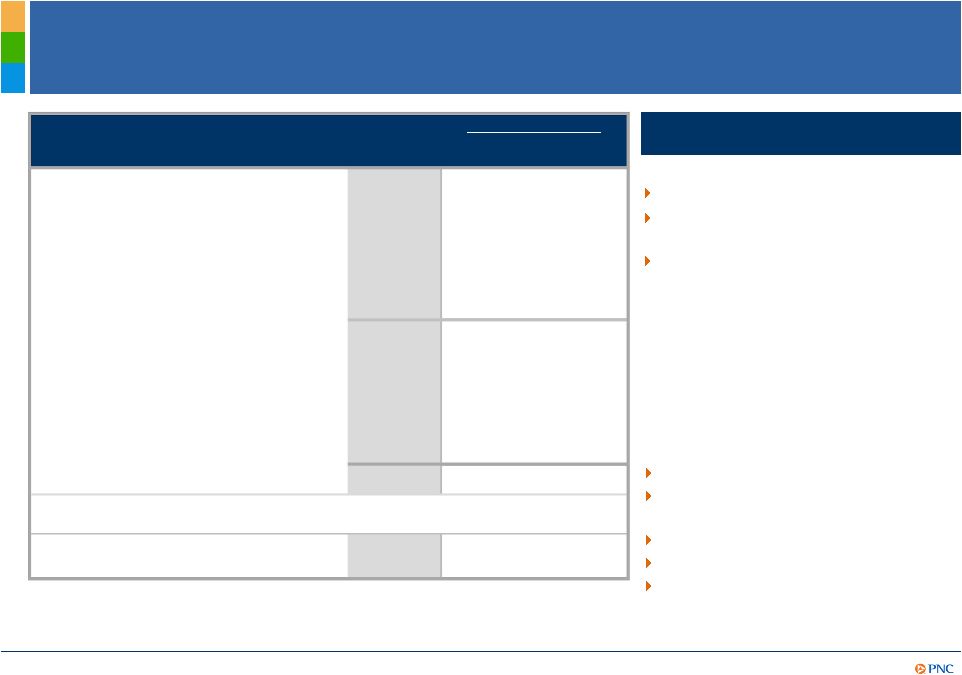
Loan Growth Delivered Stable Core NII
(1) Core net interest income (Core NII) is total net interest income (NII), as reported, less
related purchase accounting accretion (scheduled and
excess
cash
recoveries).
See
also
Note
F
in
the
Appendix.
(2)
See
Note
E
in
Appendix
for
further
details.
(3)
Net
interest
margin
less
(annualized PAA/average interest-earning assets). See Reconcilement in Appendix.
Highlights
Linked quarter:
Prior year quarter:
Average interest-earning assets
increased 2% due to investment
securities balance increase of 2%
and 1% loan growth
NII declined 3%
Core NII
(1)
impacted by lower day
count and otherwise relatively
consistent with 4Q13
PAA declined as expected
NIM declined largely due to lower
PAA and asset yields and actions
taken to improve our liquidity
Average interest-earning assets
growth of 8% driven by average
loan growth of 6%
Core NII
(1)
decreased primarily due
to lower asset yields
$
change
from:
(billions)
1Q14
4Q13
1Q13
Average interest-earning assets
$275.8
$5.3
$19.6
(millions) |
 7
Noninterest Income Reflected Repurchase Reserves
Release and Seasonality
Highlights
(1) Asset management includes the Asset Management Group (AMG) and BlackRock. (2) Credit
valuations associated with customer-related derivatives activities. (3) See
Reconcilement section of the Appendix. Fee income impacted by seasonality
Asset management and Corporate
Services fee income stable
Noninterest income declined 12%:
Linked quarter:
Prior Year Quarter:
Fee income increased 1%
(3)
Fee income adjusted for residential
mortgage increased 8%
(3)
Asset management grew 18%
Corporate services up 9%
Deposit service charges grew 8%
$
change
from:
(millions)
1Q14
4Q13
1Q13
Asset management
(1)
$364
$-
$56
Consumer services
290
(37)
(6)
Corporate services
301
-
24
Residential mortgage
161
(110)
(73)
Deposit service charges
147
(11)
11
Fee income
$1,263
($158)
$12
Net gains on sales of securities
less net OTTI
8
5
4
Gain on VISA sales
62
62
62
Other
249
(134)
(62)
Total noninterest income
$1,582
($225)
$16
Noninterest income to total
revenue
42%
44%
40%
–
Pre-tax benefit from repurchase
reserves release lower by $105
million
–
Lower mortgage originations
–
Other income decreased due to
lower revenues from private
equity investments and credit
valuations (CVA)
(2)
and loan sales |
 8
Disciplined Expense Management While Investing for
Growth
Continued progress on CIP
(2)
savings initiatives
Noninterest expense decline of 10%
reflected overall disciplined expense
management and seasonal impact
Highlights
Linked quarter:
(1)
See
Note
G
in
the
Appendix.
(2)
CIP
refers
to
PNC’s
Continuous
Improvement
Program.
(3)
As
required
on
adoption
of
Accounting
Standards Update 2014-1, the 2013 periods have been updated for adoption of ASU
2014-1. This includes a reduction in noninterest expense for
the
2013
periods.
The
efficiency
ratios
for
the
1Q13
and
4Q13
periods
listed
above
have
been
updated
to
reflect
the
adoption
of
this
ASU.
Prior Year Quarter:
Noninterest expense decline of 4%
largely reflected lower personnel
costs and the 1Q13 contribution to
the PNC Foundation as well as the
benefit of our continuous
improvement program
$ Change from
(millions)
1Q14
4Q13
1Q13
Personnel
$1,080
($127)
($89)
Occupancy
218
7
7
Equipment
201
4
18
Marketing
52
(14)
7
Other
713
(120)
(47)
Total noninterest expense
$2,264
($250)
($104)
Efficiency ratio
(1,3)
60%
62%
60%
–
Lower incentive compensation
costs as well as lower pension and
benefits costs
–
Contribution to PNC Foundation
occurred in 4Q13
–
Seasonally lower marketing costs |
 9
1Q14
4Q13
1Q13
4Q13
1Q13
Nonperforming
loans
(1,3)
$2,947
$3,088
$3,422
(5%)
(14%)
Total Past Due
(1,2)
$2,226
$2,490
$3,153
(11%)
(29%)
Net charge-offs
$186
$189
$456
(2%)
(59%)
Provision
$94
$113
$236
(17%)
(60%)
Loan loss reserves
to total loans
(4)
1.78%
1.84%
2.05%
Overall Credit Quality Continued to Improve
Highlights
(millions)
Continued credit quality
improvement
Maintained appropriate
reserves
% change from:
Linked quarter:
–
Overall delinquencies
declined 11%
–
Net charge-offs
(5)
were
stable and were .38%
of average loans
–
Provision for credit
losses declined
As of quarter end except net charge-offs and provision, which are for the quarter. (1)
Loans acquired from National City or RBC Bank (USA) that were impaired are not included
as they were recorded at estimated fair value when acquired and are currently considered performing loans due to the accretion of
interest in purchase accounting. Does not include loans held for sale. (2) Includes loans that
are government guaranteed/insured, primarily residential mortgages. Past due loans in
this category totaled $1.6 billion in 1Q14. (3) Does not include foreclosed and other assets. Excludes certain government insure
or guaranteed loans and loans accounted for under the fair value option. (4) See Note H in the
Appendix for additional details. (5) For the quarter and annualized.
|
 10
Outlook
(1)
–
2Q14 vs. 1Q14
(1) Refer to Cautionary Statement in the Appendix, including economic and other assumptions.
Does not take into account impact of potential legal and regulatory contingencies. (2)
Fee income refers to Noninterest income in the following categories: asset management, consumer
services, corporate services, residential mortgage, and service charges on deposits.
Balance sheet
Income
statement
Loans
Modest growth
Down modestly
Up low single digits
Up low single digits
$100-$150 million
Net interest income
Fee income
(2)
Noninterest expense
Loan loss provision |
 11
Cautionary Statement Regarding Forward-Looking
Information
Appendix
This presentation includes “snapshot” information about PNC used by way of
illustration and is not intended as a full business or financial review. It
should not be viewed in isolation but rather in the context of all of the information made available by PNC in its SEC filings.
We also make statements in this presentation, and we may from time to time make other
statements, regarding our outlook for earnings, revenues, expenses, capital and
liquidity levels and ratios, asset levels, asset quality, financial position, and other matters regarding or
affecting PNC and its future business and operations that are forward-looking statements
within the meaning of the Private Securities Litigation Reform Act.
Forward-looking statements are typically identified by words such as “believe,” “plan,” “expect,” “anticipate,” “see,”
“look,” “intend,” “outlook,” “project,”
“forecast,” “estimate,” “goal,” “will,” “should” and other similar words and expressions. Forward-looking
statements are subject to numerous assumptions, risks and uncertainties, which change over
time.
Forward-looking statements speak only as of the date made. We do not assume any duty
and do not undertake to update forward-looking statements. Actual results or
future events could differ, possibly materially, from those anticipated in forward-looking statements, as well as
from historical performance.
Our forward-looking statements are subject to the following principal risks and
uncertainties. Our businesses, financial results and balance sheet values are affected by business and
economic conditions, including the following:
– Changes in interest rates
and valuations in debt, equity and other financial markets.
–
Disruptions in the liquidity and other functioning of U.S. and global financial
markets.
–
The impact on financial markets and the economy of any changes in the credit
ratings of U.S. Treasury obligations and other U.S. government-backed debt, as
well as issues surrounding the levels of U.S. and European government debt and concerns
regarding the creditworthiness of certain sovereign governments, supranationals and financial
institutions in Europe.
–
Actions by the Federal Reserve, U.S. Treasury and other government agencies,
including those that impact money supply and market interest rates.
–
Changes in customers’, suppliers’ and other counterparties’
performance and creditworthiness.
–
Slowing or reversal of the current U.S. economic expansion.
–
Continued residual effects of recessionary conditions and uneven spread of
positive impacts of recovery on the economy and our counterparties, including adverse
impacts on levels of unemployment, loan utilization rates, delinquencies, defaults and
counterparty ability to meet credit and other obligations.
–
Changes in customer preferences and behavior, whether due to changing business
and economic conditions, legislative and regulatory initiatives, or other factors. Our forward-looking financial statements are subject to the risk that economic and
financial market conditions will be substantially different than we are currently
expecting. These statements are based on our current view that the U.S. economic expansion will
speed up to an above trend growth rate near 2.8 percent in 2014 as drags from Federal fiscal
restraint subside and that short-term interest rates will remain very low and bond
yields will rise only slowly in 2014. These forward-looking statements also do not,
unless otherwise indicated, take into account the impact of potential legal and regulatory
contingencies.
|
 12
Cautionary Statement Regarding Forward-Looking
Information (continued)
Appendix
•
PNC’s ability to take certain capital actions, including paying
dividends and any plans to increase common stock dividends, repurchase common stock
under current or future programs, or issue or redeem preferred stock or other regulatory capital
instruments, is subject to the review of such proposed actions by the Federal Reserve as part
of PNC’s comprehensive capital plan for the applicable period in connection with
the regulators’ Comprehensive Capital Analysis and Review (CCAR) process and to the
acceptance of such capital plan and non-objection to such capital actions by the Federal
Reserve.
•
PNC’s regulatory capital ratios in the future will depend on, among
other things, the company’s financial performance, the scope and terms of final
capital regulations then in effect (particularly those implementing the Basel Capital Accords), and management
actions affecting the composition of PNC’s balance sheet. In addition, PNC’s
ability to determine, evaluate and forecast regulatory capital ratios, and to take
actions (such as capital distributions) based on actual or forecasted capital ratios, will be dependent on
the ongoing development, validation and regulatory approval of related models.
•
Legal and regulatory developments could have an impact on our ability to
operate our businesses, financial condition, results of operations, competitive
position, reputation, or pursuit of attractive acquisition opportunities. Reputational impacts could affect
matters such as business generation and retention, liquidity, funding, and ability to attract
and retain management. These developments could include:
–
Changes resulting from legislative and regulatory reforms, including major reform of the
regulatory oversight structure of the financial services industry and changes to laws
and regulations involving tax, pension, bankruptcy, consumer protection, and other
industry aspects, and changes in accounting policies and principles. We will be impacted by
extensive reforms provided for in the Dodd-Frank Wall Street Reform and Consumer
Protection Act (the “Dodd-Frank Act”) and otherwise growing out of the
most recent financial crisis, the precise nature, extent and timing of which, and
their impact on us, remains uncertain.
–
Changes to regulations governing bank capital and liquidity standards, including due to the
Dodd-Frank Act and to Basel-related initiatives.
–
Unfavorable resolution of legal proceedings or other claims and regulatory and other
governmental investigations or other inquiries. In addition to matters relating
to PNC’s business and activities, such matters may include proceedings, claims,
investigations, or inquiries relating to pre-acquisition business and activities of acquired companies, such as
National City. These matters may result in monetary judgments or settlements or other
remedies, including fines, penalties, restitution or alterations in our business
practices, and in additional expenses and collateral costs, and may cause reputational
harm to PNC.
–
Results of the regulatory examination and supervision process, including our failure to
satisfy requirements of agreements with governmental agencies.
–
Impact on business and operating results of any costs associated with obtaining rights in
intellectual property claimed by others and of adequacy of our intellectual property
protection in general.
|
 13
Cautionary Statement Regarding Forward-Looking
Information (continued)
Appendix
Business and operating results are affected by our ability to identify and effectively manage
risks inherent in our businesses, including, where appropriate, through effective use
of third-party insurance, derivatives, and capital management techniques, and to
meet evolving regulatory capital and liquidity standards. In particular, our results currently depend on our ability to
manage elevated levels of impaired assets. Business and operating results also include impacts relating to our equity interest in
BlackRock, Inc. and rely to a significant extent on information provided to us by
BlackRock. Risks and uncertainties that could affect BlackRock are discussed in more
detail by BlackRock in its SEC filings. We grow our business in part by acquiring from time to time other financial services
companies, financial services assets and related deposits and other liabilities.
Acquisition risks and uncertainties include those presented by the nature of the business
acquired, including in some cases those associated with our entry into new businesses or new
geographic or other markets and risks resulting from our inexperience in those new
areas, as well as risks and uncertainties related to the acquisition transactions
themselves, regulatory issues, and the integration of the acquired businesses into PNC after closing.
Competition can have an impact on customer acquisition, growth and retention and on credit
spreads and product pricing, which can affect market share, deposits and
revenues. Industry restructuring in the current environment could also impact our
business and financial performance through changes in counterparty creditworthiness and
performance and in the competitive and regulatory landscape. Our ability to
anticipate and respond to technological changes can also impact our ability to respond
to customer needs and meet competitive demands. Business and operating results can also be affected by widespread natural and other
disasters, dislocations, terrorist activities, cyberattacks or international
hostilities through impacts on the economy and financial markets generally or on us or our
counterparties specifically. We provide greater detail regarding these as well as other factors in our 2013 Form 10-K,
including in the Risk Factors and Risk Management sections and the Legal Proceedings
and Commitments and Guarantees Notes of the Notes To Consolidated Financial Statements
in that report, and in our subsequent SEC filings. Our forward-looking statements may also be subject to other risks and
uncertainties, including those we may discuss elsewhere in this presentation or in SEC
filings, accessible on the SEC’s website at www.sec.gov and on our corporate
website at www.pnc.com/secfilings. We have included these web addresses as inactive textual
references only. Information on these websites is not part of this document.
Any annualized, pro forma, estimated, third party or consensus numbers in this presentation
are used for illustrative or comparative purposes only and may not reflect actual
results. Any consensus earnings estimates are calculated based on the earnings projections
made by analysts who cover that company. The analysts’ opinions, estimates or
forecasts (and therefore the consensus earnings estimates) are theirs alone, are not
those of PNC or its management, and may not reflect PNC’s or other company’s actual or
anticipated results.
|
 14
Notes
Appendix
Explanatory Notes
(H) The allowance for loan and lease losses includes impairment reserves attributable to
purchased impaired loans. (F) PNC believes that core net interest income, a
non-GAAP measure, is useful in evaluating components of net interest income. (A)
Transitional Basel III common equity Tier 1 capital ratio is common equity Tier 1 capital (using the definitions of, and deductions
from, capital under Basel III, as such definitions and deductions are phased-in for 2014)
divided by period-end Basel I risk- weighted assets with 2014 transition
adjustments as defined by the Basel III rules. (E) Excess cash recoveries represent cash
payments from customers that exceeded the recorded investment of the designated
impaired loans.
(C) Pretax earnings is income before income taxes and noncontrolling interests.
(G) Efficiency ratio calculated as noninterest expense divided by total revenue.
(B) Pretax pre-provision earnings is defined as total revenue less noninterest expense. We
believe that pretax pre-provision earnings, a non-GAAP measure, is useful as a
tool to help evaluate the ability to provide for credit costs through operations. (D)
ROAA is Return on Average Assets and ROACE is Return on Average Common Shareholders' Equity. |
 15
Estimated Transitional Basel III and Pro forma Fully Phased-In
Basel III Common Equity Tier 1 Capital Ratios
Appendix
As a result of the staggered effective dates of the final U.S. capital rules issued in July
2013, as well as the fact that PNC remains in the parallel run qualification phase for
the advanced approaches, PNC’s regulatory capital ratios during 2014 are based on
the definitions of, and deductions from, capital under Basel III (as such definitions
and deductions are phased-in for 2014) and Basel I risk-weighted assets (but subject to
certain adjustments as defined by the Basel III rules). We refer to the capital ratios
calculated using these Basel III phased-in provisions and Basel I
risk-weighted assets as the Transitional Basel III ratios. These capital ratios
became effective for PNC on January 1, 2014. We provide information on the next slide
regarding PNC’s Transitional Basel III common equity Tier 1 ratio and PNC’s
pro forma fully phased-in Basel III common equity Tier 1 ratio. We previously
referred to the Basel III common equity Tier 1 ratio as the Basel III Tier 1 common ratio. In
addition, on the next page we provide information regarding PNC’s Basel I Tier 1
common capital ratio, which was applicable to PNC through 2013 under the U.S.
regulatory capital rules. Common equity Tier 1 capital as defined under the Basel III
rules differs materially from Basel I. For example, under Basel III, significant
common stock investments in unconsolidated financial institutions, mortgage servicing
rights and deferred tax assets must be deducted from capital to the extent they
individually exceed 10%, or in the aggregate exceed 15%, of the institution’s adjusted
common equity Tier 1 capital. Also, under Basel III, regulatory capital includes adjustments
for accumulated other comprehensive income related to securities currently and
previously held as available for sale, as well as pension and other postretirement
plans, whereas under Basel I, those items were excluded.
|
 16
Estimated Transitional Basel III and Pro forma Fully Phased-In
Basel III Common Equity Tier 1 Capital Ratios
Appendix
Transitional Basel
III
Dollars in millions
Mar. 31, 2014
Mar. 31, 2014
Dec. 31, 2013(a)
Mar. 31, 2013(a)
Common stock, related surplus, and retained earnings, net of treasury
stock
$38,722
$38,722
$38,031
$35,305
Less regulatory capital adjustments:
Goodwill and disallowed intangibles, net of deferred tax liabilities
(8,932)
(9,291)
(9,321)
(9,412)
Basel III total threshold deductions
(215)
(1,193)
(1,386)
(2,076)
Accumulated other comprehensive income (b)
82
410
196
289
All other adjustments (c)
(17)
(108)
(64)
(580)
Estimated Common equity Tier 1 capital
29,640
28,540
27,456
23,526
Estimated Basel I risk-weighted assets calculated in accordance with
transition rules for 2014
275,574
N /A
N /A
N /A
Estimated Basel III standardized approach risk-weighted assets (d)
N /A
294,723
291,977
N /A
Estimated Basel III advanced approaches risk-weighted assets (e)
N /A
288,577
290,080
293,810
Estimated Basel III Common equity Tier 1 capital ratio
10.8%
9.7%
9.4%
8.0%
Risk-weighted assets utilized
Basel I (with transition
adjustments)
Standardized
Standardized
Advanced
2013 Basel I Tier 1 Common Capital Ratios (a) (b)
Dollars in millions
Dec. 31, 2013
Mar. 31, 2013
Basel I Tier 1 common capital
$28,484
$25,680
Basel I risk-weighted assets
272,169
261,491
Basel I Tier 1 common capital ratio
10.5%
9.8%
Pro forma Fully Phased-In Basel III
(a) Effective January 1, 2014, the Basel I Tier 1 common capital ratio no longer applies to PNC
(except for stress testing purposes). (b) Amounts have not been updated to
reflect the first quarter 2014 adoption of ASU 2014-01 related to low income housing tax credits.
PNC utilizes the pro forma fully phased-in capital ratio estimate to assess its Basel III
capital position (without the benefit of phase-ins), including comparison to
similar estimates made by other financial institutions. Our capital ratios and estimates may be impacted by additional regulatory guidance
or analysis of the rules, and, in the case of ratios calculated using the advanced approaches,
the ongoing evolution, validation and regulatory approval of PNC’s
models integral to the calculation of advanced approaches risk-weighted assets.
(a) Amounts have not been updated to reflect the first quarter 2014 adoption of ASU 2014-1
related to low income housing tax credits. (b) Represents net adjustments related
to accumulated other comprehensive income for securities currently and previously held as available for sale, as well as
pension and other postretirement plans.
(c) Includes adjustments as required based on whether the standardized approach
or advanced approaches are utilized.
(d) Basel III standardized approach risk-weighted assets were estimated based on the
standardized approach rules and include credit and market risk.
(e) Basel III advanced approaches risk-weighted assets were estimated based on the advanced
approaches rules, and include credit, market and operational risk. |
 17
Tangible Book Value per Common Share
Appendix
Tangible Book Value per Common Share Ratio
3/31/14 vs.
12/31/13
3/31/14 vs.
3/31/13
Dollars in millions, except per share data
Mar. 31, 2014
Dec. 31, 2013
Mar. 31, 2013
Book value per common share
73.73
$
72.07
$
68.10
$
2.3%
8.3%
Tangible book value per common share
Common shareholders' equity
39,378
$
38,392
$
36,006
$
Goodwill and Other Intangible Assets (a)
(9,621)
(9,654)
(9,763)
Deferred tax liabilities on Goodwill and Other Intangible Assets (a)
331
333
351
Tangible common shareholders' equity
30,088
$
29,071
$
26,594
$
Period-end common shares outstanding (in millions)
534
533
529
Tangible book value per common share (Non-GAAP)
56.33
$
54.57
$
50.30
$
3.2%
12.0%
Tangible book value per common share is a non-GAAP financial measure and is calculated
based on tangible common shareholders’ equity divided by period-end common
shares outstanding. We believe this non-GAAP financial measure serves as a useful tool to
help evaluate the strength and discipline of a company's capital management strategies and as
an additional, conservative measure of total company value.
(a) Excludes the impact from mortgage servicing rights of $1.6 billion at both March 31, 2014
and December 31, 2013 and $1.2 billion at March 31, 2013.
% Change |
 18
Non-GAAP to GAAP Reconcilement
Appendix
$ in millions
Mar. 31, 2014
Dec. 31, 2013
Mar. 31, 2013
Net interest margin, as reported
3.26%
3.38%
3.81%
Purchase accounting accretion (1)
$163
$191
$249
Purchase accounting accretion, if annualized
$661
$758
$1,010
Avg. interest earning assets
$275,778
$270,485
$256,180
Annualized purchase accounting accretion/Avg. interest-earning assets
0.24%
0.28%
0.38%
Core net interest margin (2)
3.02%
3.10%
3.43%
For the three months ended
(1) Purchase accounting accretion is scheduled purchase accounting accretion plus cash
recoveries. (2) PNC believes that core net interest margin, a non-GAAP measure, is
useful as a tool to help evaluate the impact of purchase accounting accretion on net
interest margin. The adjustment represents annualized purchase accounting
accretion divided by average interest-earning assets.
$ in millions
Mar. 31, 2014
Dec. 31, 2013
% Change
Mar. 31, 2013
% Change
Net interest income
$2,195
$2,266
-3%
$2,389
-8%
Noninterest income
$1,582
$1,807
-12%
$1,566
1%
Total revenue
$3,777
$4,073
-7%
$3,955
-5%
Noninterest expense
($2,264)
($2,514)
-10%
($2,368)
-4%
Pretax pre-provision earnings (1)
$1,513
$1,559
-3%
$1,587
-5%
Net income
$1,060
$1,074
-1%
$995
7%
(1) PNC believes that pretax, pre-provision earnings, a non-GAAP measure, is useful as
a tool to help evaluate the ability to provide for credit costs through
operations. For
the three months ended |
 19
Non-GAAP to GAAP Reconcilement
Appendix
$ in millions
Mar. 31, 2014
Dec. 31, 2013
% change
Mar. 31, 2013
% change
Asset management
$364
$364
$308
Consumer services
$290
$327
$296
Corporate services
$301
$301
$277
Residential mortgage
$161
$271
$234
Deposit service charges
$147
$158
$136
Total fee income, as reported
$1,263
$1,421
-11%
$1,251
1%
Residential mortgage
$161
$271
$234
$1,102
$1,150
-4%
$1,017
8%
Fee income, adjusted for residential mortgage
For
the three months ended |