Attached files
| file | filename |
|---|---|
| 8-K - 8-K - ITC Holdings Corp. | a14-10471_18k.htm |
| EX-99.1 - EX-99.1 - ITC Holdings Corp. | a14-10471_1ex99d1.htm |
Exhibit 99.2
|
|
ITC Holdings Corp. Investor Day April 15, 2014 |
|
|
This presentation contains certain statements that describe our management’s beliefs concerning future business conditions and prospects, growth opportunities and the outlook for our business and the electricity transmission industry based upon information currently available. Such statements are “forward-looking” statements within the meaning of the Private Securities Litigation Reform Act of 1995. Wherever possible, we have identified these forward-looking statements by words such as “anticipates”, “believes”, “intends”, “estimates”, “expects”, “projects” and similar phrases. These forward-looking statements are based upon assumptions our management believes are reasonable. Such forward-looking statements are subject to risks and uncertainties which could cause our actual results, performance and achievements to differ materially from those expressed in, or implied by, these statements, including, among other things, the risks and uncertainties disclosed in our annual report on Form 10-K and our quarterly reports on Form 10-Q filed with the Securities and Exchange Commission from time to time. Because our forward-looking statements are based on estimates and assumptions that are subject to significant business, economic and competitive uncertainties, many of which are beyond our control or are subject to change, actual results could be materially different and any or all of our forward-looking statements may turn out to be wrong. They speak only as of the date made and can be affected by assumptions we might make or by known or unknown risks and uncertainties. Many factors mentioned in our discussion in this presentation and in our annual and quarterly reports will be important in determining future results. Consequently, we cannot assure you that our expectations or forecasts expressed in such forward-looking statements will be achieved. Actual future results may vary materially. Except as required by law, we undertake no obligation to publicly update any of our forward-looking or other statements, whether as a result of new information, future events, or otherwise. Safe Harbor Language & Legal Disclosure 2 |

|
|
Table of Contents: Transformation of ITC Increasing System Requirements Evolution of Regulation Blueprint for the Future Financial Outlook 3 |

|
|
4 Transformation of ITC |

|
|
5 ITC Is An Established Industry Leader Inception statistics reflect year-end 2003; today statistics reflect year-end 2013. |

|
|
With Demonstrated Results Customer & Shareholder Value Innovative Model To Address Decades of Underinvestment Execution To Drive Strategic, Operational & Financial Performance + + = Advocacy To Develop 21st Century Transmission Grid 6 Capital Investments $’s in millions |

|
|
7 Including Best In Class Operations Reliability performance Top Decile reliability performance Sole focus yields operational efficiencies with projects on time & Rank in the FOR SAFETY PERFORMANCE TOP 10% Systems with STATE-OF-THE-ART COST-EFFICIENT SAFE RELIABLE Under Budget Application of Advanced Technology |

|
|
8 Achieved Expansion in Existing MISO Region Expanded to largest transmission owner in MISO North through acquisitions and system investments 2003 Acquired ITCTransmission and formed ITC; ~$1.4 billion invested 2006 Acquired METC; ~$1.0 billion invested 2007 Acquired transmission assets of IP&L and formed ITC Midwest; ~$1.4 billion invested |

|
|
While Entering New Markets & Advancing Regional Infrastructure Penetrated new market in SPP and championed first new regional projects in SPP and MISO 2006 Formed ITC Grid Development & ITC Great Plains 2008 Authorized to build KETA Project & awarded portion of Kansas V-Plan Project 2009 Launched concept of Green Power Express & awarded Hugo to Valliant Project 2011 Received MISO approval of MVP Projects 2013 Received SPP approval of Elm Creek to Summit Project 9 |

|
|
Execution Has Driven Value Improved reliability Lower cost power Meeting new system demands $4.2 billion of capital investments Model aligns interests of customers and shareholders Total shareholder returns for ITC based on ITC’s initial public offering in July 2005. 10 |

|
|
And Has Positioned ITC for the Future Proven Independent Model Operational Excellence Unbiased approach Long-term vested interest in the grid Leadership role with strong regulatory relations Improved system performance Operational efficiencies Effective project management Extensive regional development experience Promote cost effective regional solutions Enable more competitive wholesale markets Strong balance sheet and cash flows Solid investment grade credit ratings Dedication of capital resources Regional Approach Financial Strength 11 |

|
|
Increasing System Requirements 12 |

|
|
Multiple Requirements Impact System Needs Historical Underinvestment Evolving Market Structures & Forces Policy-Based Factors 1 2 3 Reliability Standards Physical/Cyber Security Changing generation mix Organized markets & economic dispatch RPS Standards 13 |

|
|
Decades of Historical Underinvestment Investment lagged while system stress increased Decline in Transmission Investment: From 1975-1999, transmission investment fell by $117 million per year Growth in Electricity Consumption: Annual demand doubled from 1980 to early 2000 14 Source: National Transmission Grid Study, US DOE, May 2002. |

|
|
15 Evolving Market Structures & Forces Evolution of wholesale markets creates need for efficient interconnection of areas and regions Flowgate Issues Price Differentials Load Pockets - Congestion - Line Losses - Monthly & Annual Range of Wholesale Electricity Prices Wholesale electric prices sourced from http://www.eia.gov/electricity/monthly/update/wholesale_markets.cfm. MISO locational marginal pricing contour map based on replication of MISO July 2011 contour map. MISO Locational Margin Pricing Contour Map Lowest LMP’s Highest LMP’s $/MWh |

|
|
Growing Policy-Based Factors 16 Emerging issues have heightened awareness to strength and security of the grid Compounded by shifts in generation mix which introduce new challenges and require more coordinated planning and transmission investment Physical/Cyber Security Storm Hardening New Technology & Operations Projected Cumulative Retirements Projected Cumulative Additions Projected retirements and additions based on EIA Annual Energy Outlook 2014 (Early Release) |

|
|
Including Rising Concerns About System Stability Edison Electric Institute, Transmission Projects at a Glance, March 2013 Sen. Lisa Murkowski, Powering the Future, Ensuring that Federal Policy Fully Supports Electric Reliability, February 2014 NERC 2013 Long-Term Reliability Assessment, December 2013 Statement of Acting Chairman Cheryl A. LaFleur on Senators’ Letter on Physical Security of U.S. Electric Grid, February 12, 2014 17 |

|
|
Recent Investments Are Just the Beginning Recent investments largely reliability driven; initial phase of addressing historical underinvestment Majority of regional infrastructure investment requirements have yet to be addressed 18 Source: The Brattle Group, Trends and Benefits of Transmission Investments: Identifying and Analyzing Value, January 2014 |

|
|
A Significant Investment Gap Remains Historical Underinvestment Aged infrastructure remains prevalent Regional Infrastructure Intra and inter-regional connectivity RPS Mandates & Intermittent Resource Integration Individual state needs Changing Generation Fleet EPA and coal plant implications, nuclear closures and plant outages In Infancy of Multi-Decade Investment Cycle – Projected System Needs Require $120 - $160 billion of Investment per Decade Through 2030 Reliability NERC requirements, FERC enforcement activities and storm hardening 19 Transmission investment needs sourced from The Brattle Group, Trends and Benefits of Transmission Investments: Identifying and Analyzing Value, January 2014. |

|
|
20 Evolution of Regulation |

|
|
FERC Objectives Aligned with Addressing System Needs 21 Transparent planning and development processes Enhanced system reliability requirements Security and compliance requirements Non-discriminatory access to transmission service and generation interconnections Cost-effective transmission infrastructure investments to achieve reliable and efficient wholesale electric markets while supporting state and federal requirements driven by: |

|
|
Which Has Guided Consistent Policy Advancement 22 Annual Transmission Investment sourced from The Brattle Group, Trends and Benefits of Transmission Investments: Identifying and Analyzing Value, January 2014. Energy Policy Act of 1992 mandated open access transmission tariffs Order 888 established regional planning and open transmission access Order 2000 provided voluntary RTO formation FERC adoption of independence incentives Order 2003 standardized generation interconnections Energy Policy Act directed FERC to provide financial incentives for transmission Order 679 established incentives for transmission investment Order 1000 established reforms to facilitate regional infrastructure Order 890 expanded regional planning mandate Policy Statement on Promoting Transmission Investment Through Pricing Reform 1992 – 1999 – 2003 – 2004 – 2005 – 2006 – 2007 – 2011 – 2012 – 1996 – |

|
|
Order 1000 Will Shape the Future Planning Cost Allocation Non-incumbent Developer Reforms Establishes framework for more comprehensive intra-regional planning and evaluation of inter-regional projects; broadens criteria for need by requiring regional planning processes to consider state and federal policy mandates Closes gaps in planning processes for regional infrastructure Provides guidance as to what constitutes reasonable cost allocation and reaffirmed support for a cost causation philosophy; beneficiaries of system enhancements should pay for a fair share of the costs Facilitates regional infrastructure with regional cost allocation principals for projects that have regional benefits Introduces non-incumbent developer reforms that require regions to remove the right of first refusal for projects that have regional cost allocation; such projects will now be bid out through a competitive solicitation process Changes the opportunity landscape through the introduction of competitive solicitations for Order 1000 projects Intra-regional and inter-regional planning, cost allocation and non-incumbent developer reforms designed to facilitate build-out of regional infrastructure $ 23 |

|
|
ENTRY At The Same Time Barriers to Entry Remain High Operating Challenges Planning, project management and system operations require substantial infrastructure, resources and industry knowledge Increasing system demands serve to compound these requirements Regulatory Complexities Recent escalation in compliance risk coupled with growing compliance costs; mandatory/criminal penalty standards in place for system violations New reliability challenges including cyber security & physical system hardening Varying statutes governing requirements for utility status and intricate state siting processes Order 1000 Requirements Developer qualification standards, processes and rules vary by region Requires long-term commitment of resources & industry knowledge 24 |

|
|
Creating An Environment Well Suited For ITC Broader Opportunity Space 25 Established industry knowledge, operational experience, and committed resources position ITC to be successful in new Order 1000 paradigm |

|
|
26 Blueprint for the Future |

|
|
27 At the Intersection of Key Factors Evolution of Regulation Transformation of ITC Increasing System Requirements Proven Independent Model Operational Excellence Regional Approach Financial Strength |

|
|
ITC Is Positioned for Growth 28 Significant Scale Singular Focus Proven Operational Capabilities Strong Balance Sheet Successful Development Track Record Top Tier System Performance Development in Existing and New Regions |

|
|
Investments In Existing Systems Drive Operational Performance 29 |

|
|
30 And Support Meeting Increasing System Demands ~15,400 miles of lines ~540 interconnected substations Historical Under Investment Evolving Market Structures & Forces Policy-Based Factors |

|
|
Our Disciplined Development Strategy Strategy premised on expansion within MISO North and SPP Strategic partnerships centered around project rights and local knowledge Aggressive, yet disciplined expansion in existing regions through Order 1000 projects Potential entrance into new regions with strategic execution around Order 1000 projects Strong competitive bidding position on a stand-alone basis which may be enhanced through strategic partnerships Order 1000 non-incumbent developer reforms potentially open new markets for future expansion Regional Presence National Developer & Operator 31 |

|
|
Prioritizes Regions Based on highest likelihood of success & ability to leverage skills Visibility on Order 1000 process implications Long-term planning process & identified need for transmission Existing presence & partnerships Ability to achieve financial objectives Ability to enter market through identification of new projects Identification of new strategic partnerships & strategic acquisitions 32 |

|
|
Resulting in A Tiered Focus For Expansion Tier One Tier Three SPP PJM ERCOT NYISO ISO-NE Tier Two Long-term planning processes create significant opportunity space Large transmission owner with leverageable scale and knowledge Expansive RTO footprint for further expansion MISO North MISO South Significant knowledge of system and opportunities Interconnection and integration with MISO North presents new opportunities Planning process offers opportunities for non-incumbent participation Order 1000 implementation rewards planning expertise Geographically contiguous with existing footprint; able to leverage existing scale CAISO Robust opportunity space given need for transmission investment Underlying RTO infrastructure with planning and cost allocation Partnership opportunities important to market entry Opportunistic projects may present additional opportunities as regions progress with Order 1000 and planning activities Continue to monitor other areas as well as they become Order 1000 compliant 33 History of identifying and building needed transmission infrastructure along with supporting non-incumbent entry into region North |

|
|
34 ITC Well Positioned for Competition Planning & Project Submissions ITC Midcontinent Development LLC ITC Mid-Atlantic Development LLC ITC South Central Development LLC western development company ITC Interconnection LLC Focused on non-traditional transmission investments RFP Process Western development company to be formed. Established planning processes support identification & submission of projects Strategic partnerships enhance knowledge in current regions and may support entry into new regions New ITC operating companies to qualify and participate in competitive solicitations Internal RFP process and team structured for efficient responses Evaluate opportunities based on likelihood of successful development (prioritization, not exclusion) |

|
|
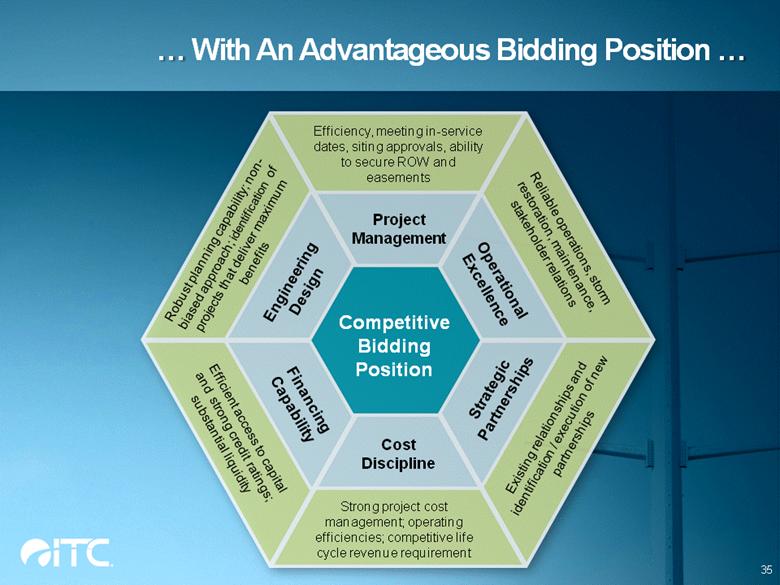
With An Advantageous Bidding Position 35 Competitive Bidding Position Engineering Design Project Management Operational Excellence Financing Capability Cost Discipline Strategic Partnerships Robust planning capability; non-biased approach; identification of projects that deliver maximum benefits Efficiency, meeting in-service dates, siting approvals, ability to secure ROW and easements Reliable operations, storm restoration, maintenance, stakeholder relations Strong project cost management; operating efficiencies; competitive life cycle revenue requirement Efficient access to capital and strong credit ratings; substantial liquidity Existing relationships and identification / execution of new partnerships |
|
|
36 As The New Competitive Process Begins 1Q14 MISO Determines Projects for RFPs MTEP 2014 MISO Issues RFPs MISO Selects Project Developers SPP Determines Projects for RFPs & Issues RFPs ITP10 & Annual Plan SPP Selects Project Developers PJM May Issue RFPs 2Q14 3Q14 4Q14 1Q15 2Q15 3Q15 4Q15 Cycle Continues PJM has no set schedule or timing for their sponsorship model approach which solicits solutions to identified concerns rather than bids on defined projects. CAISO Determines Projects for RFPs 2015 Planning Cycle CAISO Issues RFPs CAISO Selects Project Developers PJM May Issue RFPs PJM May Issue RFPs PJM May Issue RFP’s on a Quarterly Basis in 2015 |

|
|
Robust Opportunity Space Exists Within SPP & MISO 37 Significant opportunity for expansion both near-term and long-term Regional infrastructure needs drive meaningful opportunities Strategy and opportunities to aggressively expand in existing areas along with new states Competitive positioning with existing infrastructure and strategic partnerships Competitive positioning with existing systems and regional infrastructure Strong presence and significant scale Annual Near-Term Assessment & Ancillary Studies Inter-Regional Seams Planning Process (IPSAC) ITP 10 & 20 Ongoing integration of wind Economic projects to relieve congestion SPP expansion and integration into Dakotas with integration of WAPA Reliability projects, incremental load projects and integration of new generation through existing strategic partnerships and asset position Inter-Regional Seams Projects Annual MTEP Inter-Regional Seams Planning Process (IPSAC) Value Based Planning Process Seams projects interconnecting MISO North and MISO South Multi-Value Projects Market efficiency projects, economic projects Inter-Regional Seams Projects |

|
|
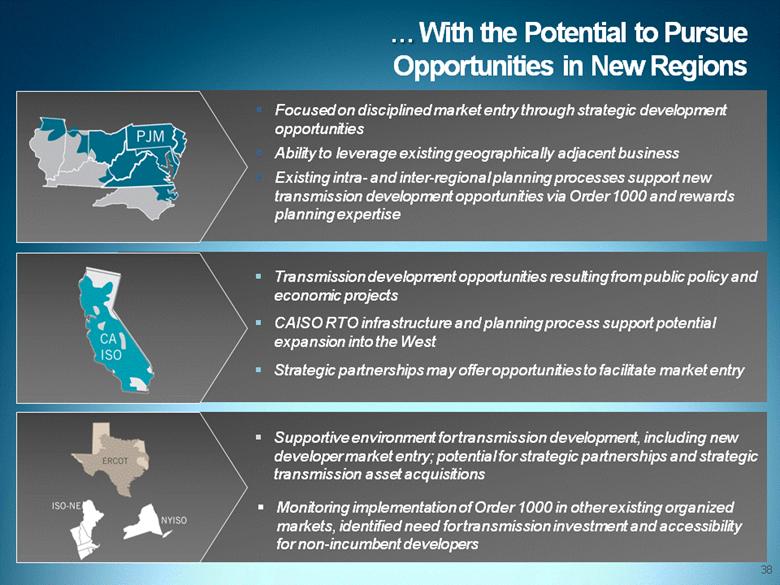
38 With the Potential to Pursue Opportunities in New Regions Transmission development opportunities resulting from public policy and economic projects CAISO RTO infrastructure and planning process support potential expansion into the West Strategic partnerships may offer opportunities to facilitate market entry Monitoring implementation of Order 1000 in other existing organized markets, identified need for transmission investment and accessibility for non-incumbent developers Supportive environment for transmission development, including new developer market entry; potential for strategic partnerships and strategic transmission asset acquisitions Focused on disciplined market entry through strategic development opportunities Ability to leverage existing geographically adjacent business Existing intra- and inter-regional planning processes support new transmission development opportunities via Order 1000 and rewards planning expertise |
|
|
M&A Could Further Augment Plan Remain open to pursuing M&A opportunities to augment growth and expand incumbency footprint Key M&A criteria remain intact, although underlying strategic rationale can shift based on Order 1000 implications Strategically compelling Value enhancing to stand-alone plan Maintains credit quality 39 KEY M&A CRITERIA |

|
|
40 Financial Outlook |

|
|
Core Financial Objectives Guide Outlook Cost Discipline Financial Flexibility Attractive Total Shareholder Return FINANCIAL OBJECTIVES Financial Outlook Superior EPS and dividend growth coupled with balanced capital allocation plan Solid investment- grade ratings and strong cash flow generation Cost efficiencies in project management and overall operations 41 |

|
|
As We Transition to An Established Growth Enterprise Significant scale provides financial flexibility and strong cash flow generation 42 Amounts at inception reflect year-end 2003 data; amounts for today reflect year-end 2013 results; cash from operations for year-end 2013 excludes ~$24.8 million of Entergy transaction expenses. |

|
|
Requiring A More Evolved Capital Allocation Strategy 43 Prioritize investing in growth opportunities while providing compelling total shareholder returns Maintain strong balance sheet and credit ratings to preserve financial flexibility Well positioned strategically and financially to execute on multiple priorities |

|
|
Five-Year Plan Is Compelling 44 Evolution of ITC and historical investment trajectory have created substantial levels of financial flexibility 2014 2018 Financial Highlights $4.5 billion of capital investments; ~75% from base capital and Robust Capital approved regional projects Investment Plan $7.6 billion of rate base plus CWIP in 2018 from $4.5 billion in 2013 EPS CAGR of 11% - 13% with potential upside Industry Leading Rate base and CWIP balances increase ~70% Growth Cash from operations (CFO) CAGR of ~10% Dividend growth of 10% - 15% per annum Substantial Cash Average CFO of ~$650 million per annum Flow Generation ~$3.3 billion in aggregate CFO, funds ~55% of cash requirements A- rated balance sheets for all debt issuing entities Strong Balance Sheet Stable to improving credit metrics over the plan period |

|
|
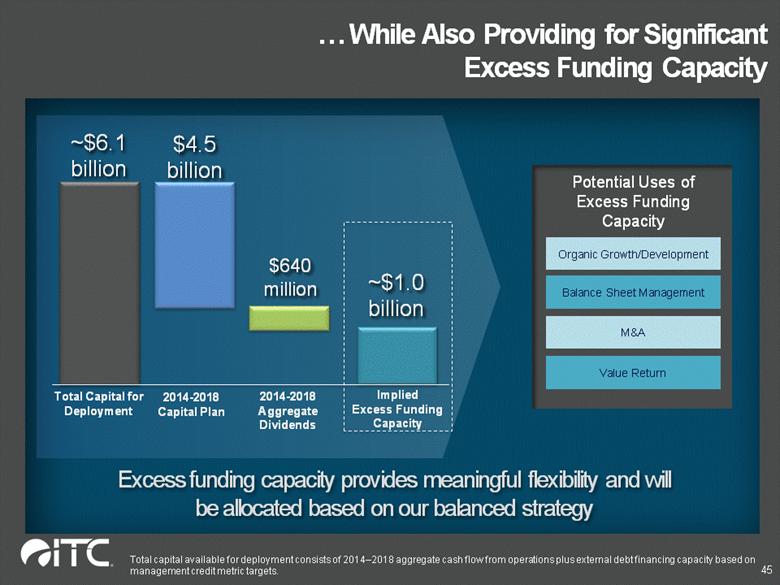
While Also Providing for Significant Excess Funding Capacity Total capital available for deployment consists of 2014–2018 aggregate cash flow from operations plus external debt financing capacity based on management credit metric targets. 45 Implied Excess Funding Capacity ~$1.0 billion $640 million 2014-2018 Aggregate Dividends ~$6.1 billion $4.5 billion 2014-2018 Capital Plan Total Capital for Deployment Potential Uses of Excess Funding Capacity Balance Sheet Management M&A Organic Growth/Development Value Return Excess funding capacity provides meaningful flexibility and will be allocated based on our balanced strategy |
|
|
46 Priority Remains Investing to Grow the Business Capital Investment Plan Generates Attractive Growth ~$6.1 billion of Capital Available for Deployment Base Capital $2.2 billion Regional Infrastructure$1.2 billion Development $1.1 billion ~2% 2013 EPS 2018 EPS 11-13% EPS CAGR $4.5 billion of Capital Investments ~2% ~8% Highly Probable Capital Investments ~$3.4 billion |

|
|
47 With Potential Upside if Expansion Opportunities Materialize ~$6.3 billion of Capital Available for Deployment Base Capital $2.2 billion Regional Infrastructure$1.2 billion Development $1.6 billion ~3% 2013 EPS 2018 EPS 12-14% EPS CAGR $5.0 billion of Capital Investments ~2% ~8% Highly Probable Capital Investments ~$3.4 billion |

|
|
Maintaining a Strategic Balance Sheet Positions Us Well for the Future Solid Investment-Grade Ratings Credit ratings reflect corporate credit ratings. ITC Holdings (A-/NA) ITCT (A-/A3) METC (A-/A3) MW (A-/A3) GP (A-/NA) Strong CFO Generation 2014 2018 2015 2016 2017 $3.3 billion in aggregate 48 ~$500 ~$630 ~$660 ~$710 ~$770 Strong cash flow generation and A- rated balance sheet offer significant financial flexibility in the years to come Management remains committed to solid investment-grade ratings and high credit quality to support ITC’s strategic objectives |

|
|
Optimizing Shareholder Returns Through Attractive & Sustainable Dividend Growth Annual dividend growth in 10-15% range over forecast period, maintains a payout ratio in mid-to-high 30% range 49 Dividend becomes more meaningful component of overall shareholder return Committed to growing dividend at attractive pace while balancing capital requirements of the business Measured with increases to ensure efficient capitalization and flexibility in capital allocation Quarterly Dividend Quarterly dividend amounts reflect 3 for 1 stock split; dividend was revised to $0.1425 upon stock split in February 2014. |

|
|
And Through Share Repurchases Board has authorized share repurchase program up to $250 million through the end of 2015 ~$750 million $250 million Share Repurchase Program Excess Funding Capacity – Post-Dividends Remaining Excess Funding Capacity ~$1.0 billion Can opportunistically execute over authorized period Preserves meaningful financial flexibility for: Organic Growth/Development Balance Sheet Management M&A Value Return 50 2014 – 2018 Plan $250 million repurchase program offers near-term shareholder returns, allows for stable and improving credit metrics and preserves ample capacity for future needs |

|
|
Compelling Investment Thesis Invest & Grow the Business Strategic Balance Sheet Optimize Shareholder Returns $4.5 billion of capital investments for 2014 through 2018 drives superior growth levels EPS CAGR of 11% to 13% with potential upside through incremental expansion opportunities $3.3 billion of aggregate cash flow from operations generated from 2014 to 2018 Solid investment-grade balance sheet with stable and improving credit metrics to support strategic objectives 10% to 15% annual dividend growth sustains mid-to-high 30% payout ratio Up to $250 million of share repurchases through the end of 2015 enhances total shareholder return 51 Capital allocation strategy to be assessed annually based on excess funding capacity, outlook for investment opportunities and desire to preserve flexibility for future needs |

|
|
Questions? 52 |

|
|
Appendix 53 |
|
|
Five-Year Capital Investment Plan 54 Operating Company / Five-Year Development Projects Capital Investment % of Total (2014 2018) $’s in millions OPERATING COMPANY CAPITAL PLAN BASE CAPITAL PLAN ITCTransmission $ 477 METC 546 ITC Midwest 1,194 Total Base Capital $ 2,217 49% REGIONAL INFRASTRUCTURE PROJECTS Thumb Loop $ 170 MVP’s 797 Kansas V-Plan 121 Elm Creek to Summit 73 Total Regional Infrastructure $ 1,161 26% TOTAL OPERATING COMPANY CAPITAL $ 3,378 75% TOTAL DEVELOPMENT CAPITAL $ 1,122 25% TOTAL CAPITAL PLAN $ 4,500 100% |

|
|
Five-Year Plan Capital Investment by Business Unit 55 Based on $4.5 billion of capital investments for 2014 – 2018. $’s in Millions |

|
|
Year-End Rate Base & CWIP 56 Based on $4.5 billion of capital investments for 2014 – 2018. $’s in Millions |

|
|
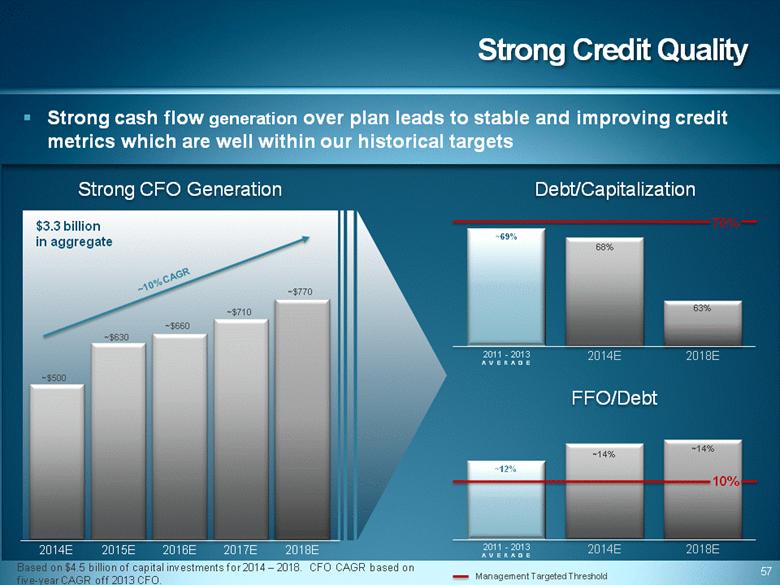
Strong Credit Quality Strong CFO Generation $3.3 billion in aggregate 57 ~$500 ~$630 ~$660 ~$710 ~$770 ~10% CAGR ~14% ~14% 2014E 2018E 68% 63% Debt/Capitalization FFO/Debt 2014E 2018E 2014E 2018E 2015E 2016E 2017E Strong cash flow generation over plan leads to stable and improving credit metrics which are well within our historical targets 70% 10% Management Targeted Threshold ~12% ~69% 2011 - 2013 AVERAGE 2011 - 2013 AVERAGE Based on $4.5 billion of capital investments for 2014 – 2018. CFO CAGR based on five-year CAGR off 2013 CFO. |
|
|
Sources & Uses of Cash Total cash requirements to execute five-year plan total approximately $6.0 billion Cash from operations funds ~55% of total cash requirements over plan period Remain committed to solid investment-grade credit metrics 58 Based on $4.5 billion of capital investments for 2014 – 2018. |

|
|
Formula Rate Mechanism 59 Differences between projected information and actual information are trued-up. |
