Attached files
| file | filename |
|---|---|
| EX-95 - MINE SAFETY DISCLOSURES - UNITED STATES ANTIMONY CORP | uamy_ex95.htm |
| EX-32.2 - CERTIFICATION - UNITED STATES ANTIMONY CORP | uamy_ex322.htm |
| EX-31.1 - CERTIFICATION - UNITED STATES ANTIMONY CORP | uamy_ex311.htm |
| EX-32.1 - CERTIFICATION - UNITED STATES ANTIMONY CORP | uamy_ex321.htm |
| EX-31.2 - CERTIFICATION - UNITED STATES ANTIMONY CORP | uamy_ex312.htm |
| EX-32.3 - CERTIFICATION - UNITED STATES ANTIMONY CORP | uamy_ex323.htm |
| EX-31.3 - CERTIFICATION - UNITED STATES ANTIMONY CORP | uamy_ex313.htm |
| EX-99.1 - REPORT FROM AUDIT COMMITTEE - UNITED STATES ANTIMONY CORP | uamy_ex991.htm |
| EX-21.01 - SUBSIDIARIES - UNITED STATES ANTIMONY CORP | uamy_ex2101.htm |
UNITED STATES
SECURITIES AND EXCHANGE COMMISSION
Washington, D.C. 20549
FORM 10-K /A
Amendment No, 1
(Mark One)
|
þ
|
ANNUAL REPORT UNDER SECTION 13 OR 15(d) OF THE SECURITIES EXCHANGE ACT OF 1934
|
For the fiscal year ended December 31, 2013
|
o
|
TRANSITION REPORT UNDER SECTION 13 OR 15(d) OF THE SECURITIES EXCHANGE ACT OF 1934
|
For the transition period to
Commission file number 001-08675
UNITED STATES ANTIMONY CORPORATION
(Exact name of registrant as specified in its charter)
|
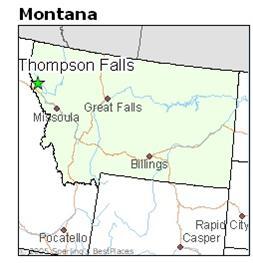
Montana
|
81-0305822
|
|
|
(State or other jurisdiction of incorporation or organization)
|
(I.R.S. Employer Identification No.)
|
|
P.O. Box 643, Thompson Falls, Montana
|
59873
|
|
(Address of principal executive offices)
|
(Zip Code)
|
Registrant's telephone number, including area code: (406) 827-3523
Securities registered pursuant to Section 12(b) of the Act: None
Securities registered pursuant to Section 12(g) of the Act: Common Stock, par value $.01 per share
Check whether the issuer (1) filed all reports required to be filed by Section 13 or 15(d) of the Exchange Act during the past 12 months (or for such shorter period that the registrant was required to file such reports), and (2) has been subject to such filing requirements for the past 90 days. Yes þ No o
Check if there is no disclosure of delinquent filers in response to Item 405 of Regulation S-K contained in this form and will not be contained, to the best of registrant's knowledge, in definitive proxy or information statements incorporated by reference in Part III of this Form 10-K or any amendment to this Form 10-K. þ
Indicate by check mark whether the registrant is a large accelerated filer, an accelerated filer, a non-accelerated filer, or a smaller reporting company. See definitions of “large accelerated filer,” “accelerated filer” and “small reporting company” in Rule 12b-2 of the Exchange Act.
Large Accelerated Filer o Accelerated Filer þ
Non-Accelerated Filer o Smaller reporting company o
Indicate by check mark whether the registrant is a shell company (as defined in Rule 12b-2 of the Exchange Act) Yes o No þ
The aggregate market value of the voting stock held by non-affiliates of the registrant, based on the average bid price of such stock, was $53,424,479 as of June 30, 2013.
At March 17, 2014, the registrant had 63,256,206 outstanding shares of par value $0.01 common stock.
Explanatory Note
United States Antimony Corporation (the Company) is filing this amendment (the Form 10-K/A) to our Annual Report on Form 10-K for the year ended December 31, 2013 (the Form 10-K), filed with the U.S. Securities and Exchange Commission on March 17, 2014, to update the certifications with conformed signatures.
This Form 10-K/A should be read in conjunction with the original Form 10-K, which continues to speak as of the date of the Form 10-K. Except as specifically noted above, this Form 10-K/A does not modify or update disclosures in the original Form 10-K. Accordingly, this Form 10-K/A does not reflect events occurring after the filing of the Form 10-K or modify or update any related or other disclosures.
TABLE OF CONTENTS
PART I
| Page | ||||
|
ITEM 1.
|
DESCRIPTION OF BUSINESS
|
3
|
||
|
General
|
3 | |||
|
History
|
3 | |||
|
Overview-2013
|
3
|
|||
|
Antimony Division
|
4
|
|||
|
Zeolite Division
|
6
|
|||
|
Environmental Matters
|
7
|
|||
|
Employees
|
8 | |||
|
Other
|
8 | |||
|
ITEM 1A.
|
RISK FACTORS
|
8
|
||
|
ITEM 1B.
|
UNRESOLVED STAFF COMMENTS
|
9
|
||
|
ITEM 2.
|
DESCRIPTION OF PROPERTIES
|
9
|
||
|
Antimony Division
|
9
|
|||
|
Zeolite Division
|
14
|
|||
|
ITEM 3.
|
LEGAL PROCEEDINGS
|
18
|
||
|
ITEM 4.
|
MINE SAFETY DISCLOSURES
|
18
|
||
|
PART II
|
||||
|
ITEM 5.
|
MARKET FOR COMMON EQUITY AND RELATED STOCKHOLDER MATTERS
|
18
|
||
|
ITEM 6.
|
SELECTED FINANCIAL DATA
|
19
|
||
|
ITEM 7.
|
MANAGEMENT'S DISCUSSION AND ANALYSIS OR PLAN OF OPERATIONS
|
20
|
||
|
ITEM 7A.
|
QUANTITATIVE AND QUALITATIVE DISCLOSURES ABOUT MARKET RISK
|
26
|
||
|
ITEM 7B.
|
CRITICAL ACCOUNTING ESTIMATES
|
26
|
||
|
ITEM 8.
|
FINANCIAL STATEMENTS
|
26
|
||
|
ITEM 9.
|
CHANGES IN AND DISAGREEMENTS WITH ACCOUNTANTS ON ACCOUNTING AND FINANCIAL DISCLOSURE
|
26
|
||
|
ITEM 9A.
|
CONTROLS AND PROCEDURES
|
27
|
||
|
ITEM 9B.
|
OTHER INFORMATION
|
31
|
||
|
PART III
|
||||
|
ITEM 10.
|
DIRECTORS, EXECUTIVE OFFICERS, PROMOTERS AND CONTROL PERSONS AND COMPLIANCE WITH SECTION 16(A) OF THE EXCHANGE ACT
|
32
|
||
|
ITEM 11.
|
EXECUTIVE COMPENSATION
|
34
|
||
|
ITEM 12.
|
SECURITY OWNERSHIP OF CERTAIN BENEFICIAL OWNERS AND MANAGEMENT
|
35
|
||
|
ITEM 13.
|
CERTAIN RELATIONSHIPS AND RELATED TRANSACTIONS
|
36
|
||
|
ITEM 14.
|
PRINCIPAL ACCOUNTANT FEES AND SERVICES
|
36
|
||
|
PART IV
|
||||
|
ITEM 15.
|
EXHIBITS AND REPORTS ON FORM 8-K
|
37
|
||
|
SIGNATURES
|
41 | |||
|
CERTIFICATIONS
|
||||
|
FINANCIAL STATEMENTS
|
F-1-F-23 | |||
2
Item 1. Description of Business
General
Explanatory Note: As used in this report, the terms "we," "us" and "our" are used to refer to United States Antimony Corporation and, as the context requires, its management.
Some of the information in this Form 10-K contains forward-looking statements that involve substantial risks and uncertainties. You can identify these statements by forward-looking words as "may," "will," "expect," "anticipate," "believe," "estimate" and "continue," or similar words. You should read statements that contain these words carefully because they:
|
|
●
|
discuss our future expectations;
|
|
|
●
|
contain projections of our future results of operations or of our financial condition; and
|
|
|
●
|
state other "forward-looking" information.
|
History
United States Antimony Corporation, or USAC, was incorporated in Montana in January 1970 to mine and produce antimony products. In December 1983, we suspended antimony mining operations but continued to produce antimony products from domestic and foreign sources. In April 1998, we formed United States Antimony SA de CV or USAMSA, to mine and smelt antimony in Mexico. Bear River Zeolite Company or BRZ, was incorporated in 2000, and it is mining and producing zeolite in southeastern Idaho. On August 19, 2005, USAC formed Antimonio de Mexico, S. A. de C. V. to explore and develop antimony and silver deposits in Mexico. Our principal business is the production and sale of antimony, silver, gold, and zeolite products. On May 16, 2012, we started trading on the NYSE MKT under the symbol UAMY.
Overview
Antimony Sales
Although the volume of antimony (metal contained) sold increased in 2013 from 2012, a decrease in the average sales price of antimony (metal contained basis) of approximately $0.94 per pound saw our gross sales of antimony decrease $378,291, and our gross profit from antimony decrease from $672,939 in 2012 to a loss of $492,926 in 2013. Overall production of antimony as metal contained was 1,780,134 lbs in 2013 compared to 1,423,280 in 2012 an increase of 25.1%. During 2013, sales of our antimony products increased approximately 176,000 lbs from 2012 due to an increase in volume of raw material received from Mexico. The raw material received from Mexico increased from approximately 372,000 lbs in 2012 to over 647,000 lbs in 2013. Total Mexico production was approximately 684,000 lbs, an increase of approximately 84% from 2012.
Zeolite Sales
Our sales volume of zeolite in 2013 was less than 2012, and our average sales price per ton decreased by approximately $20, from $216.78 per ton to $196.96 per ton, a decrease of 9.1%. The decrease in price was primarily due the mix of products sold. During 2013, total sales of zeolite decreased approximately $439,000, but the gross profit increased from $361,961 in 2012 to $451,956 in 2013 due to decreased operating and raw material costs. During 2013, sales of zeolite decreased approximately 16.62% from 2012 due to less demand.
3
Precious Metals Sales
Following is a schedule of our precious metals sales:
|
Precious Metals Sales
|
||||||||||||||||||||
|
Silver/Gold
|
2009
|
2010
|
2011
|
2012
|
2013
|
|||||||||||||||
|
Ounces Gold Shipped (Au)
|
31.797 | 101.127 | 161.711 | 102.319 | 61.517 | |||||||||||||||
|
Ounces Silver Shipped (Ag)
|
6,870.10 | 31,545.22 | 17,472.99 | 20,237.70 | 23,095.70 | |||||||||||||||
|
Total Revenues
|
$ | 39,494 | $ | 483,307 | $ | 667,813 | $ | 647,554 | $ | 369,706 | ||||||||||
Antimony Division
Our antimony smelter and precious metals plant is located in the Burns Mining District of Sanders County, Montana, approximately 15 miles west of Thompson Falls, MT. We hold 2 patented mill sites where the plant is located. We have no "proven reserves" or "probable reserves" of antimony, as these terms are defined by the Securities and Exchange Commission. Environmental restrictions preclude mining at this site.
Mining was suspended in December 1983, because antimony could be purchased more economically from foreign sources.
For 2013, and since 1983, we depended on foreign sources for raw materials, and there are risks of interruption in procurement from these sources and/or volatile changes in world market prices for these materials that are not controllable by us. We have developed sources of antimony in Mexico and, although we are still partially reliant on foreign companies for raw material, we expect that a majority of our raw materials will come from our own properties for 2014 and later years. We continue working with suppliers in North America, Central America, Europe, Australia, and South America.
We currently own 100% of the common stock, equipment, and the lease on real property of United States Antimony, Mexico S.A. de C.V. or USAMSA, which was formed in April 1998. We currently own 100% of the stock in Antimony de Mexico SA de CV (AM) which owns the San Miguel property. USAMSA has three divisions (1) the Madero smelter in Coahuila that started expanded operations in late 2012, (2) the Puerto Blanco flotation mill and oxide circuit in Guanajuato that started operating in late 2012, (3) the Los Juarez mineral deposit that includes concessions in Queretaro that began producing ore in late 2012 and the Soyatal mineral deposit that was starting production in 2013.
In our existing operations in Montana, we produce antimony oxide, sodium antimonate, antimony metal, and precious metals. Antimony oxide is a fine, white powder that is used primarily in conjunction with a halogen to form a synergistic flame retardant system for plastics, rubber, fiberglass, textile goods, paints, coatings and paper. Antimony oxide is also used as a color fastener in paint, as a catalyst for production of polyester resins for fibers and film, as a catalyst for production of polyethelene pterathalate in plastic bottles, as a phosphorescent agent in fluorescent light bulbs, and as an opacifier for porcelains. Sodium antimonate is primarily used as a fining agent (degasser) for glass in cathode ray tubes and as a flame retardant. We also sell antimony metal for use in bearings, storage batteries and ordnance.
We estimate (but have not independently confirmed) that our present share of the domestic market and international market for antimony oxide products is approximately 4% and<1%, respectively. We are the only significant U.S. producer of antimony products, while China supplies 92% of the world antimony demand. We believe we are competitive both domestically and world-wide due to the following:
|
●
|
We have a reputation for quality products delivered on a timely basis.
|
|
●
|
We are a non-Chinese producer of antimony products.
|
|
●
|
We have two of the three operating antimony smelters in North and South America.
|
|
●
|
We are the sole domestic producer of antimony products.
|
|
●
|
We can ship on short notice to domestic customers.
|
|
●
|
We are vertically integrated, with raw materials from our own mines, mills, and smelter in Mexico, along with the raw materials from exclusive supply agreements we have with numerous ore and raw material suppliers.
|
|
●
|
As a vertically integrated company, we will have more control over our raw material costs.
|
4
Following is a three year schedule of our antimony sales:
|
Metal
|
||||||||
|
Year
|
Contained
|
$ | ||||||
|
2013
|
1,579,182 | $ | 8,375,158 | |||||
|
2012
|
1,403,210 | $ | 8,753,449 | |||||
|
2011
|
1,401,423 | $ | 10,406,636 | |||||
Concentration of Sales:
During the three years ended December 31, 2013, the following sales were made to our three largest customers:
|
For the Year Ended
|
||||||||||||
|
Sales to Three
Largest Customers |
December 31,
2013
|
December 31,
2012
|
December 31,
2011
|
|||||||||
|
Alpha Gary Corporation
|
$ | 3,700,945 | $ | 3,245,612 | $ | 1,771,173 | ||||||
|
General Electric
|
781,200 | |||||||||||
|
Kohler Corporation
|
2,654,215 | 2,286,938 | 2,941,143 | |||||||||
|
Polymer Products Inc.
|
1,119,055 | 2,887,862 | ||||||||||
| $ | 7,136,360 | $ | 6,651,605 | $ | 7,600,178 | |||||||
|
% of Total Revenues
|
64.75 | % | 55.23 | % | 57.90 | % | ||||||
While the loss of one of our three largest customers would be a problem in the short term, we have numerous requests from potential buyers that we cannot fill, and we could quickly, in the present market conditions, be able to replace the lost sales. Loss of all three of our largest customers would be more serious and may affect our profitability.
Marketing: We employ full-time marketing personnel and have negotiated various commission-based sales agreements with other chemical distribution companies.
Antimony Price Fluctuations: Our operating results have been, and will continue to be, related to the market prices of antimony metal, which have fluctuated widely in recent years. The volatility of prices is illustrated by the following table, which sets forth the average prices of antimony metal per pound, as reported by sources deemed reliable by us.
|
USA
|
Rotterdam
|
|||||||
|
Average
|
Average
|
|||||||
|
Year
|
Price/Lb
|
Price/Lb
|
||||||
|
2013
|
$ | 4.73 | $ | 4.78 | ||||
|
2012
|
$ | 5.86 | $ | 5.71 | ||||
|
2011
|
$ | 6.97 | $ | 7.05 | ||||
|
2010
|
$ | 3.67 | $ | 4.05 | ||||
|
2009
|
$ | 2.37 | $ | 2.33 | ||||
|
2008
|
$ | 2.72 | $ | 2.72 | ||||
|
2007
|
$ | 2.52 | ||||||
|
2006
|
$ | 2.28 | ||||||
|
2005
|
$ | 1.58 | ||||||
|
2004
|
$ | 1.48 | ||||||
5
The ten year range of our sales prices for antimony oxide and antimony metal, per pound, was as follows:
|
Oxide
|
Metal
|
|||||||
|
Average
|
Average
|
|||||||
|
Year
|
Price/Lb
|
Price/Lb
|
||||||
|
2013
|
$ | 4.41 | $ | 4.69 | ||||
|
2012
|
5.14 | 5.58 | ||||||
|
2011
|
6.16 | 7.42 | ||||||
|
2010
|
3.67 | 4.42 | ||||||
|
2009
|
2.28 | 2.75 | ||||||
|
2008
|
2.88 | 3.47 | ||||||
|
2007
|
2.52 | 3.04 | ||||||
|
2006
|
2.28 | 2.75 | ||||||
|
2005
|
1.73 | 2.08 | ||||||
|
2004
|
1.32 | 1.59 | ||||||
Antimony metal prices are determined by a number of variables over which we have no control. These include the availability and price of imported metals, the quantity of new metal supply, and industrial and commercial demand. If metal prices decline and remain depressed, our revenues and profitability may be adversely affected.
We use various antimony raw materials to produce our products. We currently obtain antimony raw material from sources in North America, Mexico, Europe, South America, Central America, and Australia.
Zeolite Division
We own 100% of Bear River Zeolite Company, (BRZ), an Idaho corporation incorporated on June 1, 2000. BRZ has a lease with Webster Farm, L.L.C. that entitles BRZ to surface mine and process zeolite on property located near Preston, Idaho, in exchange for a royalty payment. In 2010 the royalty was adjusted to $10 per ton sold. The current minimum annual royalty is $60,000. In addition, BRZ has more zeolite on U.S. Bureau of Land Management land. A company controlled by the estate of Al Dugan, a significant stockholder and, as such, an affiliate of USAC, receives a payment equal to 3% of net sales on zeolite products. William Raymond and Nancy Couse are paid a royalty that varies from $1 to $5 per ton. On a combined basis, royalties vary from 8%-13%. BRZ has constructed a processing plant on the property and it has improved its productive capacity. In addition to a large amount of fully depreciated equipment that has been transferred from the USAC division, we have spent approximately $3,392,000 to purchase and construct the processing plant as of December 31, 2013.
We have no "proven reserves" or "probable reserves" of zeolite, as these terms are defined by the Securities and Exchange Commission.
"Zeolite" refers to a group of industrial minerals that consist of hydrated aluminosilicates that hold cations such as calcium, sodium, ammonium, various heavy metals, and potassium in their crystal lattice. Water is loosely held in cavities in the lattice. BRZ zeolite is regarded as one of the best zeolites in the world due to its high CEC of approximately 180 meq/100 gr., its hardness and high clinoptilolite content, its absence of clay minerals, and its low sodium content. BRZ's zeolite deposits’ characteristics which the mineral useful for a variety of purposes including:
|
|
●
|
Soil Amendment and Fertilizer. Zeolite has been successfully used to fertilize golf courses, sports fields, parks and common areas, and high value crops, including corn, potatoes, soybeans, red beets, acorn squash, green beans, sorghum sudangrass, brussel sprouts, cabbage, carrots, tomatoes, cauliflower, radishes, strawberries, wheat, lettuce and broccoli.
|
|
|
●
|
Water Filtration. Zeolite is used for particulate, heavy metal and ammonium removal in swimming pools, municipal water systems, fisheries, fish farms, and aquariums.
|
|
|
●
|
Sewage Treatment. Zeolite is used in sewage treatment plants to remove nitrogen and as a carrier for microorganisms.
|
6
|
|
●
|
Nuclear Waste and Other Environmental Cleanup. Zeolite has shown a strong ability to selectively remove strontium, cesium, radium, uranium, and various other radioactive isotopes from solution. Zeolite can also be used for the cleanup of soluble metals such as mercury, chromium, copper, lead, zinc, arsenic, molybdenum, nickel, cobalt, antimony, calcium, silver and uranium.
|
|
|
●
|
Odor Control. A major cause of odor around cattle, hog, and poultry feed lots is the generation of the ammonium in urea and manure. The ability of zeolite to absorb ammonium prevents the formation of ammonia gas, which disperses the odor.
|
|
|
●
|
Gas Separation. Zeolite has been used for some time to separate gases, to re-oxygenate downstream water from sewage plants, smelters, pulp and paper plants, and fish ponds and tanks, and to remove carbon dioxide, sulfur dioxide and hydrogen sulfide from methane generators as organic waste, sanitary landfills, municipal sewage systems and animal waste treatment facilities.
|
|
|
●
|
Animal Nutrition. Feeding up to 2% zeolite increases growth rates, decreases conversion rates, prevents worms, and increases longevity.
|
|
|
●
|
Miscellaneous Uses. Other uses include catalysts, petroleum refining, concrete, solar energy and heat exchange, desiccants, pellet binding, horse and kitty litter, floor cleaner and carriers for insecticides, pesticides and herbicides.
|
Environmental Matters
Our exploration, development and production programs conducted in the United States are subject to local, state and federal regulations regarding environmental protection. Some of our production and mining activities are conducted on public lands. We believe that our current discharge of waste materials from our processing facilities is in material compliance with environmental regulations and health and safety standards. The U.S. Forest Service extensively regulates mining operations conducted in National Forests. Department of Interior regulations cover mining operations carried out on most other public lands. All operations by us involving the exploration for or the production of minerals are subject to existing laws and regulations relating to exploration procedures, safety precautions, employee health and safety, air quality standards, pollution of water sources, waste materials, odor, noise, dust and other environmental protection requirements adopted by federal, state and local governmental authorities. We may be required to prepare and present data to these regulatory authorities pertaining to the effect or impact that any proposed exploration for, or production of, minerals may have upon the environment. Any changes to our reclamation and remediation plans, which may be required due to changes in state or federal regulations, could have an adverse effect on our operations. The range of reasonably possible loss in excess of the amounts accrued, by site, cannot be reasonably estimated at this time.
We accrue environmental liabilities when the occurrence of such liabilities is probable and the costs are reasonably estimable. The initial accruals for all our sites are based on comprehensive remediation plans approved by the various regulatory agencies in connection with permitting or bonding requirements. Our accruals are further based on presently enacted regulatory requirements and adjusted only when changes in requirements occur or when we revise our estimate of costs to comply with existing requirements. As remediation activity has physically commenced, we have been able to refine and revise our estimates of costs required to fulfill future environmental tasks based on contemporaneous cost information, operating experience, and changes in regulatory requirements. In instances where costs required to complete our remaining environmental obligations are clearly determined to be in excess of the existing accrual, we have adjusted the accrual accordingly. When regulatory agencies require additional tasks to be performed in connection with our environmental responsibilities, we evaluate the costs required to perform those tasks and adjust our accrual accordingly, as the information becomes available. In all cases, however, our accrual at year-end is based on the best information available at that time to develop estimates of environmental liabilities.
Antimony Processing Site
We have environmental remediation obligations at our antimony processing site near Thompson Falls, Montana ("the Stibnite Hill Mine Site"). We are under the regulatory jurisdiction of the U.S. Forest Service and subject to the operating permit requirements of the Montana Department of Environmental Quality. At December 31, 2013, we have accrued $100,000 to fulfill our environmental responsibilities.
7
BRZ
During 2001, we recorded a reclamation accrual for our BRZ subsidiary, based on an analysis performed by us and reviewed and approved by regulatory authorities for environmental bonding purposes. The accrual of $7,500 represents the our estimated costs of reclaiming, in accordance with regulatory requirements, the acreage disturbed by our zeolite operations remains unchanged at December 31, 2013.
General
Reclamation activities at the Thompson Falls Antimony Plant have proceeded under supervision of the U.S. Forest Service and Montana Department of Environmental Quality. We have complied with regulators' requirements and do not expect the imposition of substantial additional requirements.
We have posted cash performance bonds with a bank and the U.S. Forest Service in connection with our reclamation activities.
We believe we have accrued adequate reserves to fulfill our environmental remediation responsibilities as of December 31, 2013. We have made significant reclamation and remediation progress on all our properties over thirty years and have complied with regulatory requirements in our environmental remediation efforts.
Employees
As of December 31, 2013, we employed 24 full-time employees in Montana. In addition, we employed 16 people at our zeolite plant in Idaho, and more than 40 employees at our mining, milling and smelting operation in Mexico. The number of full-time employees may vary seasonally. None of our employees are covered by any collective bargaining agreement.
Other
We hold no material patents, licenses, franchises or concessions, however we consider our antimony processing plants proprietary in nature.
We are subject to the requirements of the Federal Mining Safety and Health Act of 1977, the Occupational Safety and Health Administration's regulations, requirements of the state of Montana and the state of Idaho, federal and state health and safety statutes and Sanders County, Montana and Franklin County, Idaho health ordinances.
Item 1A. Risk Factors
There may be events in the future that we are not able to accurately predict or over which we have no control. The risk factors listed below, as well as any cautionary language in this report, provide examples of risks, uncertainties and events that may cause our actual results to differ materially from the expectations we describe in our forward-looking statements.
If we were liquidated, our common stockholders could lose part, or all, of their investment.
In the event of our dissolution, the proceeds, if any, realized from the liquidation of our assets will be distributed to our stockholders only after the satisfaction of the claims of our creditors and preferred stockholders. The ability of a purchaser of shares to recover all, or any portion, of the purchase price for the shares, in that event, will depend on the amount of funds realized and the claims to be satisfied by those funds.
We may have unasserted liabilities for environmental reclamation.
Our research, development, manufacturing and production processes involve the controlled use of hazardous materials, and we are subject to various environmental and occupational safety laws and regulations governing the use, manufacture, storage, handling, and disposal of hazardous materials and some waste products. The risk of accidental contamination or injury from hazardous materials cannot be completely eliminated. In the event of an accident, we could be held liable for any damages that result and any liability could exceed our financial resources. We also have one ongoing environmental reclamation and remediation projects at our current production facility in Montana. Adequate financial resources may not be available to ultimately finish the reclamation activities if changes in environmental laws and regulations occur, and these changes could adversely affect our cash flow and profitability. We do not have environmental liability insurance now, and we do not expect to be able to obtain insurance at a reasonable cost. If we incur liability for environmental damages while we are uninsured, it could have a harmful effect on our financial condition and results of operations. The range of reasonably possible losses from our exposure to environmental liabilities in excess of amounts accrued to date cannot be reasonably estimated at this time.
8
We have accruals for asset retirement obligations and environmental obligations.
We have accruals totaling $257,580 on our balance sheet at December 31, 2013, for our environmental reclamation responsibilities and estimated asset retirement obligations. If we are not able to adequately perform these activities on a timely basis, we could be subject to fines and penalties from regulatory agencies.
Item 1B. Unresolved Staff Comments
There are no unresolved staff comments from the Securities and Exchange Commission at December 31, 2013.
Item 2. Description of Properties
Antimony Division
Our antimony smelter and precious metals plant is located in the Burns Mining District, Sanders County, Montana, approximately 14 miles west of Thompson Falls on Montana Highway 471. This highway is asphalt, and the property is accessed by cars and trucks. The property includes two five-acre patented mill sites that are owned in fee-simple by us. The claims are U. S. Antimony Mill Site No. 1 (Mineral Survey 10953) and U. S. Antimony Mill Site No. 2 (Mineral Survey 10953). We have been paying Sanders County property taxes on three patented mill site claims in the Burns Mining District of Montana since 1969 when we purchased the original block of claims. USAC was the registered owner of the claims at the Sanders County Courthouse. The claims include the Station Mill Site (4.994 acres), Excelsior Mill Site (4.972 acres), and the Mammoth Mill Site (5.000 acres) Patent Survey No. 9190A. We discovered that the BLM cancelled the patents on January 12, 2000, because “the claims were not filed with the BLM in accordance with the FLPMA and are deemed to be abandoned and void by operation of law.” Neither we, nor the Sanders County Court House, were ever notified of this decision, and we continue to pay taxes. Although we do not believe that this taking is valid, it does not have a substantial impact on us or our results of operations.
The U. S. Antimony Mill Sites were used to run a flotation mill and processing plant for antimony that we mined on adjacent claims that have been sold. Presently, we run a smelter that includes furnaces of a proprietary design to produce antimony metal, antimony oxide, and various other products. We also run a precious metals plant. The facility includes 6 buildings and our main office. There are no plans to resume mining on the claims that have been sold or abandoned, although the mineral rights have been retained on many of the patented mining claims. The U. S. Forest Service and Montana Department of Environmental Quality have told us that the resumption of mining would require an Environmental Impact Statement, massive cash bonding, and would be followed by years of law suits. The mill site is serviced with three-phase electricity from Northwest Power, and water is pumped from a well.
We claim no reserves on any of these properties.
9
Antimony mining and milling operations in the U.S. were curtailed during 1983 due to continued declines in the price of antimony. We are currently purchasing foreign raw antimony materials and producing our own raw materials from our properties in Mexico. We continue to produce antimony metal, oxide, sodium antimonite, and precious metals from our processing facility near Thompson Falls, Montana.
MINE PROPERTIES
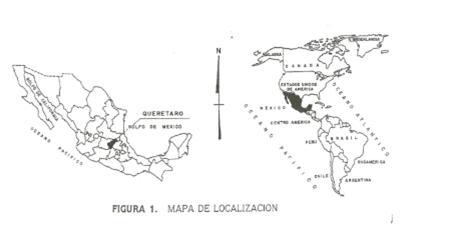
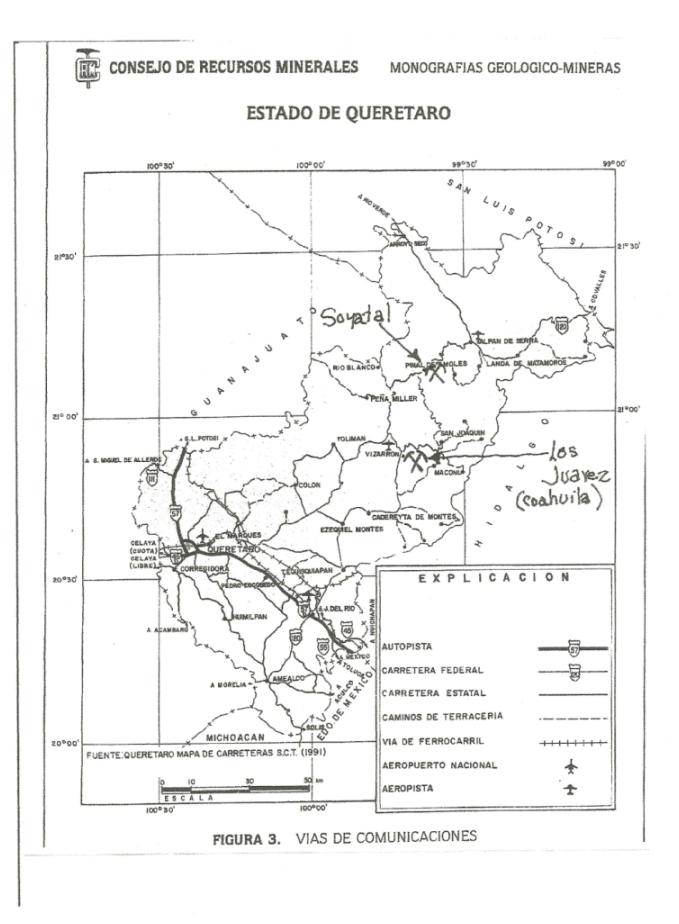
LOS JUAREZ GROUP
We hold properties that are collectively called the “Los Juarez” property, in Queretaro, as follows:
| 1. |
San Miguel I and II are being purchased by a USAC subsidiary, Antimonio de Mexico, S. A. de C. V (AM), for $1,480,500. To date, we have paid $1,030,000. The property consists of 40 hectares.
|
||
| 2. |
San Juan I and II are concessions owned by AM and include 466 hectares.
|
||
| 3. |
San Juan III is held by a lease agreement by AM in which we will pay a 10% royalty, based on the net smelter returns from another USAC Mexican subsidiary, named United States Antimony Mexico, S. A. de C. V. or USAMSA. It consists of 214 hectares.
|
||
The concessions collectively constitute 720 hectares. The claims are accessed by roads that lead to highways.
10
11
Part of the USAC Mexican property, including San Miguel I, II and part of San Juan III, was originally drilled by Penoles in 1970, when antimony metal prices were high. They did not proceed with the property, due to the complex metallurgy of antimony. Subsequently, the Mexican Government did additional work and reported a deposit of mineralized material of 1,000,000 metric tons (mt) grading 1.8% antimony and 8.1 ounces of silver per metric ton (opmt) in Consejo de Recursos Minerales (Publicacion M-4e). Such a report does not qualify as a comprehensive evaluation, such as a final or bankable feasibility study that concludes legal and technical viability, and economic feasibility. The Securities and Exchange Commission does not recognize this report, and the Company claims no reserves.
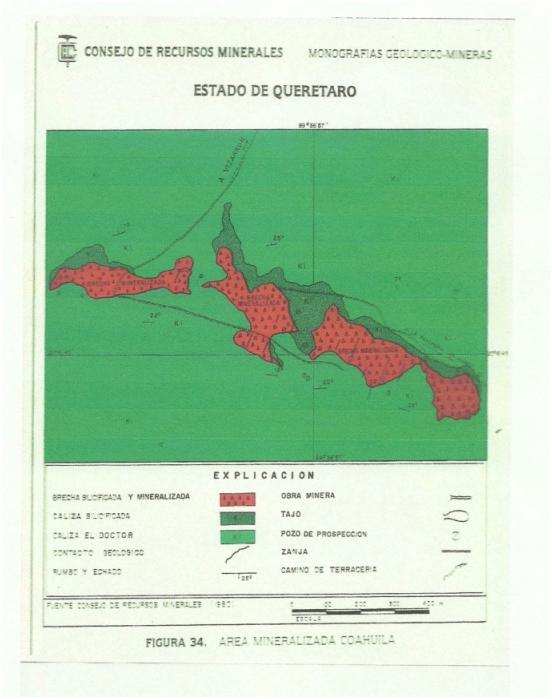
The mineralized zone is a classic jasperoid-type deposit in the Cretaceous El Doctor Limestone. The mineralization is confined to silicified jasperiods in limestone. The zone strikes north 70 degrees west. The dimension of the deposit is still conjectural. However, the strike length of the jasperoid is more than 3,500 meters.
The mineralization is typically very fine-grained stibnite with silver and gold. It is primarily sulfide in nature due to its encapsulation in silica. The mining for many years will be by open pit methods. Eventually it will be by underground methods. At the present time, mining has included hauling dump rock and rock from mine faces.
12
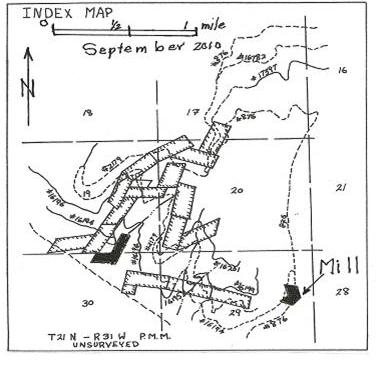
SOYATAL MINING DISTRICT, PINAL DE AMOLES, QUERETARO, MEXICO
In prior years, USAC, through USAMSA, had a supply agreement with Pinar de Amores S. A. de C. V. (Pinar) on four concessions in the Soyatal Mining District in the State of Queretaro, totaling 283 hectares. The concessions are the Chihuahua and the three Fox-1s. Part of this supply agreement was an option to purchase the properties for $1,500,000 in total payments (the net present value of the purchase price payments is $1,338,106). At December 31, 2012, we signed an agreement to exercise our option to purchase the mine properties, and we recorded the transaction in our general ledger and reported it in our financial statements for the year ended December 31, 2012. Due to complications encountered in preparing a final agreement, we renegotiated the purchase agreement, which resulted in a revised payment schedule and net cash payable. The original agreement was reversed on our general ledger, and the new agreement was recorded as of December 31, 2013. The basic agreement is that we will pay $1,500,000 in total payments for the property, payable at the rate of $200,000 per year through January 2, 2020, with a final payment of $100,000 due on January 2, 2021. During the year ended 2103 and prior, we made advance payments to Pinar for direct shipping rock and mine improvements. At December 31, 2013, we calculated that we had over advanced Pinar (due to recovery) on a metal contained basis by $420,411. This amount will be applied to the annual payments due at the rate of $100,000 per year until used.
Reportedly, the Soyatal District was the third largest producer of antimony in Mexico. U. S. Geological Survey Bulletin 960-B, 1948, Donald E. White, Antimony Deposits of Soyatal District, State of Queretaro, Mexico records the production from 1905-1943 at 25,600 tons of antimony metal content. In 1942, the mines produced ore containing 1,737 tons of metal, and in 1943, they produced ore containing 1,864 tons of metal. This mining was performed primarily all by hand labor, with no compressors or trammers, and the ore was transported by mules, in sacks, to the railroad. Recoveries were less than 40% of the values. Mining continued throughout World War II.
White remarks p. 84 and 85, “In the Soyatal Mines, as in practically all antimony mines, it is difficult to estimate the reserves, for the following reasons:
|
●
|
The individual deposits are so extremely irregular in size, shape, and grade that the amount of ore in any one of them is unknown until the ore has been mined.
|
|
●
|
As only the relatively high grade shipping ore is recovered, the ore bodies are not systematically sampled and assayed…The total reserves are thus unknown and cannot be estimated accurately, but they probably would suffice to maintain a moderate degree of activity in the district for at least 10 years. The mines may even contain enough ore (mineralized deposit) to equal the total past production.”
|
Minimal ore, primarily through hand mining and sorting methods, has continued at the Soyatal properties since 1943. USAMSA does not claim any reserves at Soyatal.
USAMSA PUERTO BLANCO FLOTATION MILL, GUANAJUATO, MEXICO
During the fourth quarter of 2012, the flotation mill was completed at San Luis de la Paz, Guanajuato, Mexico. All of the permits to construct and operate the plant have been obtained. The plant has a capacity of 140 metric tons per day. It includes a 30” x 42” jaw crusher, a 4’x 8’ double deck screen, a 36” cone crusher, an 8’x 36” Harding type ball mill, and eight No. 24 Denver sub A type flotation machines, an 8’ disc filter, front end loaders, tools and other equipment. In addition, the plant has a 50 ton per day oxide ore gravimetric circuit. The plant is used for the processing of rock from Los Juarez, Soyatal, and other properties. We are in the process of installing a 400-450 metric tons per day flotation mill that will be dedicated to processing ore from our Los Juarez property, starting in 2014. The current flotation mill will continue to process the feed from Soyatal and other properties. The crushing equipment currently in place is adequate for both flotation mills. During 2013, less than 10% of the mill capacity
was utilized.
13
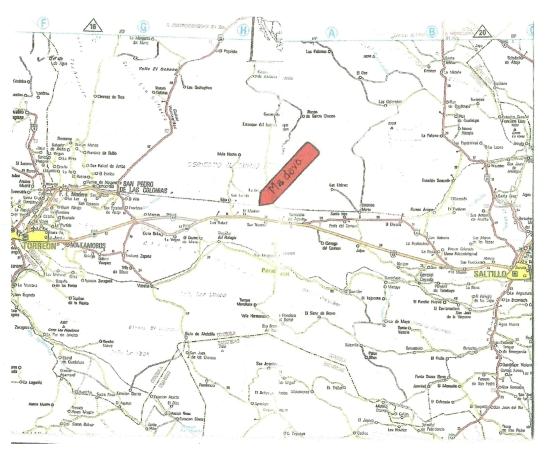
USAMSA MADERO SMELTER, ESTACION MADERO, PARRAS DE LA FUENTE, COAHUILA, MEXICO.
USAC, through its wholly owned subsidiary, USAMSA, owns and operates a smelting facility at Estacion Madero, in the Municipio of Parras de la Fuente, Coahuila, Mexico. The property includes 13.48 hectares. Four furnaces were operating during the year ended 2012, and four more furnaces were operational in January of 2013, for a total of eight furnaces. Other equipment includes cooling ducting, dust collectors, scrubber, laboratory, warehouse, slag vault, stack, jaw crusher, screen, hammer mill, and a 3.5’ x 8’ rod mill. The plant has a feed capacity of five to six metric tons of direct shipping ore or concentrates per day, depending on the quality of the feedstock. If the feedstock is in the mid range of 45% antimony, the smelter could produce approximately 1.4MM lbs of contained antimony annually. Concentrates from our flotation plant, and hand-sorted ore from Mexico sources and other areas, are being processed. The Madero production is shipped to our Montana plant to produce finished Antimony products and other derivative by-products. Access to the plant is by road and railroad. Set forth below are location maps:
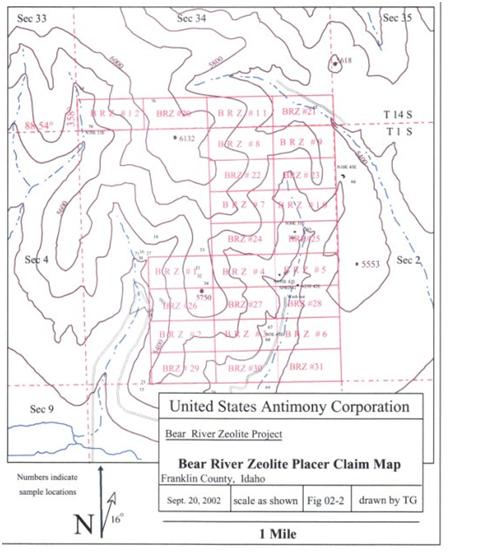
ZEOLITE DIVISION
Location
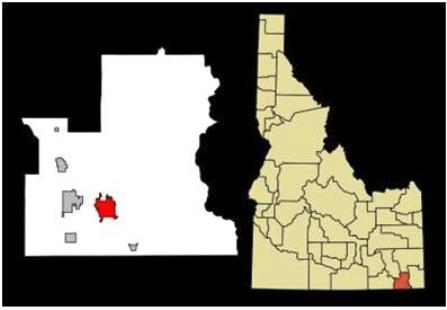
The property is located in the southeast corner of Idaho, approximately seven miles east of Preston, Idaho, 34 miles north of Logan, Utah, 79 miles south of Pocatello, Idaho, and 100 miles north of Salt Lake City, Utah.
The mine is located in the N ½ of section 10 and the W ½ of section 2, section 3, and the E ½ section 4, Township 15, Range 40 East of the Boise Meridian, Franklin County, Idaho. The plant and the initial pit is located on the Webster Farm, L.L.C., which is private land.
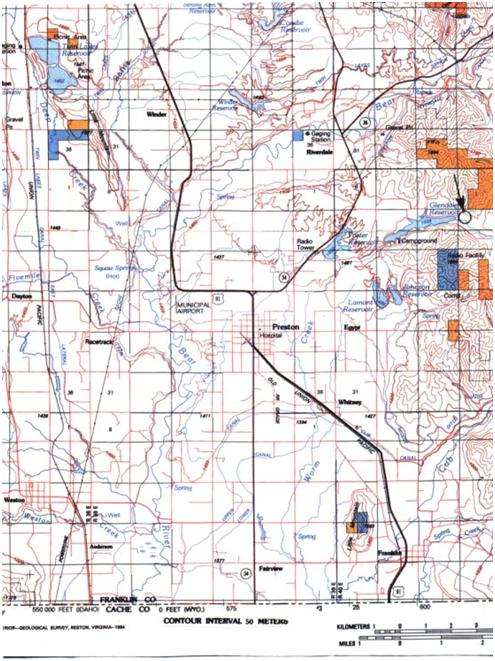
Transportation
The property is accessed by seven miles of paved road and about l mile of gravel road from Preston, Idaho. Preston is near the major north-south Interstate Highway 15 to Salt Lake City or Pocatello.
Several Union Pacific rail sidings may be available to the mine. Bonida is approximately 25 miles west of the mine and includes acreage out of town where bulk rock could be stored, possibly in existing silos or on the ground. Three-phase power is installed at this abandoned site. Finished goods can also be shipped from the Franklin County Grain Growers feed mill in the town of Preston on the Union Pacific.
The Burlington Northern Railroad can be accessed at Logan, Utah.
14
Location Map
15
Property and Ownership
BRZ leases 320 acres from the Webster Farm, L.L.C. The term of the lease is 15 years and it began on March 1, 2010. This includes the mill site and zeolite in the area of the open pit. The property is the NW ¼ and W ½ of the SW ¼ of section 3 and the N ½ of the W ¼ of section 10, Township 15 South, Range 40 East of the Boise Meridian, Franklin County, Idaho. The lease requires a payment of $10.00 per ton plus an additional annual payment of $10,000 on March 1st of each year. In addition, there are two other royalty holders. Nick Raymond and the estate of George Desborough each have a graduated royalty of $1.00 per ton to $5.00 per ton, depending on the sale price.
The balance of the property is on Bureau of Land Management property and includes 480 acres held by 24, 20-acre Placer claims. Should we drop our lease with Webster Farms LLC., we will retain these placer claims as follows:
|
BRZ 1 IMC 185308
BRZ 2 IMC 185309
BRZ 3 IMC 185310
BRZ 4 IMC 185311
BRZ 5 IMC 185312
BRZ 6 IMC 185313
BRZ 7 IMC 185314
BRZ 8 IMC 185315
BRZ 9 IMC 185316
BRZ 10 IMC 185317
BRZ 11 IMC 185318
BRZ 12 IMC 185319
|
BRZ 20 IMC 186183
BRZ 21 IMC 186184
BRZ 22 IMC 186185
BRZ 23 IMC 186186
BRZ 24 IMC 186187
BRZ 25 IMC 186188
BRZ 26 IMC 186189
BRZ 27 IMC 186190
BRZ 28 IMC 186191
BRZ 29 IMC 186192
BRZ 30 IMC 186193
BRZ 31 IMC 186194
|
16
Geology
The deposit is a very thick, sedimentary deposit of zeolitized volcanic ash of Tertiary age known as the Salt Lake Formation. The sedimentary interval in which the clinoptilolite occurs is more than 1000 feet thick in the area. Thick intervals of the zeolite are separated by thin limestone and sandstone beds deposited in the freshwater lake where the volcanic ash accumulated.
The deposit includes an 800- foot mountain. Zeolite can be sampled over a vertical extent of 800 feet and on more than 700 acres. The current pit covers more than 3 acres. Despite the apparent size of the deposit, we claim no reserves.
Exploration, Development, and Mining
Exploration has been limited to the examination and sampling of surface outcrops and mine faces.
Mining Methods
Depending on the location, the zeolite is overlain by 1 to 12 feet of zeolite-rich soil. On the ridges, the cover is very little, and in the draws the soil is thicker. The overburden is stripped using a tractor dozer, currently a Caterpillar D-8K. It is moved to the toe of the pit, and will eventually be dozed back over the pit for reclamation.
Although near-surface rock is easily ripped, it is more economical to drill and blast it. Holes are loaded with ammonium nitrate and primed with powder and easy det primers. Breakage is generally good. Initial benches were 20 to 30 foot, and each bench is accessed by a road.
Haulage is over approximately 4,000 foot of road on an uphill grade of 2.5% to the mill. On higher benches, the grade will eventually be downhill. Caterpillar 769 B rock trucks are used. They haul 18 to 20 tons per load, and the cycle time is about 30 minutes.
With the trucks and the other existing equipment, the mine is capable of producing 80 tons per hour.
MILLING
Primary Crusher
The primary crushing circuit is a conventional closed circuit, utilizing a Stephens-Adamson 42” x 12’ apron feeder, Pioneer 30” x 42” jaw crusher, Nordberg standard 3’ cone crusher, a 5’ by 12’ double deck Kohlberg screen, and has a self-cleaning dust collector. The rock is crushed to minus 1 inch and the circuit has a rated capacity of more than 50 tons per hour.
Dryer
There are two dryer circuits, one for lines one and two, and one for the Raymond mill. The dryer circuits include one 50 ton feed bin, and each dryer has a conveyor bypass around each dryer, a bucket elevator, and a dry rock bin. The dryers are 25 feet long, 5 feet in diameter and are fired with propane burners rated at 750,000 BTUs. One self-cleaning bag house services both dryers. Depending on the wetness of the feed rock, the capacity is in the range of 10 tons per hour per dryer. During most of the year, the dryers are not run.
Coarse Products Circuit
There are two lines to produce coarse products:
|
●
|
Line 1 is a closed circuit with a 100 HP vertical shaft impactor and a 5 deck Midwestern multivibe screen.
|
|
●
|
Line 2 includes a Jeffries 30” by 24” 60 HP hammer mill in a closed circuit with two 5’ x 12’ triple deck Midwestern Multi Vibe high frequency screens. The circuits also include bucket elevators, (3) 125 ton capacity product silos, a 6 ton capacity Crust Buster blender, augers, Sweco screens, and dust collectors.
|
17
Fine Products Circuit
The fine products circuit is in one building and it includes (2) 3.5’ x 10.5’ Derrick 2 deck high frequency (3450 RPM) screens and various bucket elevators, augers, bins, and Sweco screens for handling product. Depending on the screening sizes, the plants can generate approximately 150 tons of granules and 125 tons of fines per 24-hour day.
Raymond Mill Circuit
The Raymond mill circuit includes a 6058 high-side Raymond mill with a double whizzer, dust collector, two 100 ton product silos, feed bin, conveyors, air slide, bucket elevators, and control booth. The Raymond mill has a rated capacity of more than 10 tons per hour.
Item 3. Legal Proceedings
USAC is not a party to any material pending legal proceedings, and no such proceedings are known to be contemplated.
No director, officer or affiliate of USAC and no owner of record or beneficial owner of more than 5.0% of our securities or any associate of any such director, officer or security holder is a party adverse to USAC or has a material interest adverse to USAC in reference to pending litigation.
Item 4. Mine Safety Disclosures
The information concerning mine safety violations or other regulatory matters required by section 1503(a) of the Dodd-Frank Wall Street Reform and Consumer Protection Act and Item 104 of Regulation S-K is included in Exhibit 95 to this Annual Report.
PART II
Item 5. Market for Common Equity and Related Stockholder Matters
Currently, our common stock is traded on the NYSE-MKT under the symbol UAMY. Prior to May 16, 2012, our common stock was traded over the Counter Bulletin Board ("OTCBB") under the symbol "UAMY.OB." The following table sets forth the range of high and low bid prices as reported for the periods indicated. The quotations were taken from a website available to the public, and generally believed to be accurate. The quoted prices may not necessarily represent actual transactions.
|
2013
|
High
|
Low
|
||||||
|
First Quarter
|
$ | 2.34 | $ | 1.64 | ||||
|
Second Quarter
|
1.92 | 0.96 | ||||||
|
Third Quarter
|
1.73 | 0.90 | ||||||
|
Fourth Quarter
|
2.19 | 1.24 | ||||||
|
2012
|
High
|
Low
|
||||||
|
First Quarter
|
$ | 3.98 | $ | 2.06 | ||||
|
Second Quarter
|
4.95 | 2.70 | ||||||
|
Third Quarter
|
4.25 | 1.93 | ||||||
|
Fourth Quarter
|
2.42 | 1.36 | ||||||
|
2011
|
High
|
Low
|
||||||
|
First Quarter
|
$ | 1.90 | $ | 0.41 | ||||
|
Second Quarter
|
4.10 | 1.56 | ||||||
|
Third Quarter
|
3.45 | 2.05 | ||||||
|
Fourth Quarter
|
3.32 | 1.85 | ||||||
The approximate number of holders of record of our common stock at March 17, 2014, is 2,500.
We have not declared or paid any dividends to our stockholders during the last five years and do not anticipate paying dividends on our common stock in the foreseeable future. Instead, we expect to retain earnings for the operation and expansion of our business.
18
Item 6. Selected Financial Data
|
December 31,
|
2013
|
2012
|
2011
|
2010
|
2009
|
|||||||||||||||
|
Balance Sheet Data:
|
||||||||||||||||||||
|
Current assets
|
$ | 1,910,564 | $ | 3,103,128 | $ | 2,963,570 | $ | 1,848,825 | $ | 539,814 | ||||||||||
|
Property, plant, and equipment-net
|
12,395,645 | 9,508,975 | 6,047,004 | 3,845,000 | 3,404,154 | |||||||||||||||
|
Restricted cash
|
75,501 | 75,251 | 74,777 | 74,311 | 73,916 | |||||||||||||||
|
Other assets
|
509,281 | 688,123 | 54,766 | 94,766 | - | |||||||||||||||
|
Total assets
|
$ | 14,890,991 | $ | 13,375,477 | $ | 9,140,117 | $ | 5,862,902 | $ | 4,017,884 | ||||||||||
|
Current liabilities
|
$ | 2,479,341 | $ | 1,622,641 | $ | 1,742,022 | $ | 784,322 | $ | 848,443 | ||||||||||
|
Long-term debt, net of current portion
|
1,002,215 | 157,466 | 158,218 | 82,407 | 98,710 | |||||||||||||||
|
Stock payable to directors for services
|
150,000 | - | 230,004 | - | - | |||||||||||||||
|
Accrued reclamation costs
|
257,580 | 249,540 | 241,500 | 107,500 | 107,500 | |||||||||||||||
|
Total Liabilities
|
3,889,136 | 2,029,647 | 2,371,744 | 974,229 | 1,054,653 | |||||||||||||||
|
Shareholders' equity
|
11,001,855 | 11,345,830 | 6,768,373 | 4,888,673 | 2,963,231 | |||||||||||||||
|
Total liabilities and
|
||||||||||||||||||||
|
shareholders' equity
|
$ | 14,890,991 | $ | 13,375,477 | $ | 9,140,117 | $ | 5,862,902 | $ | 4,017,884 | ||||||||||
|
Income Statement Data:
|
||||||||||||||||||||
|
Revenues
|
$ | 11,020,829 | $ | 12,042,702 | $ | 13,118,090 | $ | 9,073,324 | $ | 4,103,340 | ||||||||||
|
Cost of revenues
|
11,061,799 | 11,007,802 | 11,443,892 | 7,699,592 | 3,734,294 | |||||||||||||||
|
Operating expenses
|
1,297,201 | 1,353,587 | 782,667 | 950,163 | 605,232 | |||||||||||||||
|
Other (income) expense
|
73,548 | 72,742 | 149,001 | 111,356 | 58,657 | |||||||||||||||
|
Total expenses
|
12,432,548 | 12,434,131 | 12,375,560 | 8,761,111 | 4,398,183 | |||||||||||||||
|
Income (loss) before income taxes
|
(1,411,719 | ) | (391,429 | ) | 742,530 | 312,213 | (294,843 | ) | ||||||||||||
|
Income tax benefit (expense)
|
(229,451 | ) | (167,107 | ) | (105,610 | ) | 493,000 | - | ||||||||||||
|
Net income (loss)
|
$ | (1,641,170 | ) | $ | (558,536 | ) | $ | 636,920 | $ | 805,213 | $ | (294,843 | ) | |||||||
|
Per Share Data:
|
||||||||||||||||||||
|
Net income (loss) per share:
|
||||||||||||||||||||
|
Basic
|
$ | (0.03 | ) | $ | (0.01 | ) | $ | 0.01 | $ | 0.01 | $ | (0.01 | ) | |||||||
|
Diluted
|
$ | (0.03 | ) | $ | (0.01 | ) | $ | 0.01 | $ | 0.01 | $ | (0.01 | ) | |||||||
|
Weighted average shares outstanding:
|
||||||||||||||||||||
|
Basic
|
62,281,449 | 61,235,365 | 58,855,348 | 54,356,693 | 49,855,229 | |||||||||||||||
|
Diluted
|
62,881,449 | 61,235,365 | 59,381,175 | 54,578,054 | 49,885,229 | |||||||||||||||
19
Item 7. Management's Discussion and Analysis or Plan of Operations
Certain matters discussed are forward-looking statements that involve risks and uncertainties, including the impact of antimony prices and production volatility, changing market conditions and the regulatory environment and other risks. Actual results may differ materially from those projected. These forward-looking statements represent our judgment as of the date of this filing. We disclaim, however, any intent or obligation to update these forward-looking statements.
|
Results of Operations by Division
|
||||||||||||
|
Antimony - Combined USA
|
||||||||||||
|
and Mexico
|
2013
|
2012
|
2011
|
|||||||||
|
Lbs of Antimony Metal USA
|
931,789 | 1,031,164 | 1,179,973 | |||||||||
|
Lbs of Antimony Metal Mexico:
|
647,393 | 372,046 | 221,450 | |||||||||
|
Total Lbs of Antimony Metal Sold
|
1,579,182 | 1,403,210 | 1,401,423 | |||||||||
|
Average Sales Price/Lb Metal
|
$ | 5.30 | $ | 6.24 | $ | 7.43 | ||||||
|
Net income (loss)/Lb Metal
|
$ | (1.30 | ) | $ | (0.62 | ) | $ | 0.37 | ||||
|
Gross antimony revenue - net of discount
|
$ | 8,375,158 | $ | 8,753,449 | $ | 10,406,636 | ||||||
|
Precious metals revenue
|
369,706 | 647,554 | 667,813 | |||||||||
|
Production costs - USA
|
(4,592,019 | ) | (5,665,806 | ) | (7,294,421 | ) | ||||||
|
Product cost - Mexico
|
(2,614,860 | ) | (1,677,927 | ) | (1,031,957 | ) | ||||||
|
Direct sales and freight
|
(285,274 | ) | (279,694 | ) | (281,089 | ) | ||||||
|
General and administrative - operating
|
(275,312 | ) | (353,656 | ) | (280,853 | ) | ||||||
|
Mexico non-production costs
|
(1,095,839 | ) | (678,053 | ) | (430,601 | ) | ||||||
|
General and administrative - non-operating
|
(1,325,902 | ) | (1,193,583 | ) | (936,873 | ) | ||||||
|
Non-operating gains
|
73,551 | |||||||||||
|
Net interest
|
(346 | ) | 6,059 | 5,205 | ||||||||
|
EBITDA
|
(1,371,137 | ) | (441,657 | ) | 823,860 | |||||||
|
Income taxes
|
(229,451 | ) | (167,107 | ) | (105,610 | ) | ||||||
|
Depreciation,& amortization
|
(448,036 | ) | (263,214 | ) | (199,515 | ) | ||||||
|
Net income (Loss) - antimony
|
$ | (2,048,624 | ) | $ | (871,978 | ) | $ | 518,735 | ||||
|
Zeolite
|
||||||||||||
|
Tons sold
|
11,182 | 12,189 | 12,105 | |||||||||
|
Average Sales Price/Ton
|
$ | 196.96 | $ | 216.73 | $ | 168.83 | ||||||
|
Net income (Loss)/Ton
|
$ | 36.44 | $ | 25.72 | $ | 9.76 | ||||||
|
Gross zeolite revenue
|
$ | 2,202,414 | $ | 2,641,699 | $ | 2,043,641 | ||||||
|
Production costs
|
(1,096,731 | ) | (1,618,816 | ) | (1,221,101 | ) | ||||||
|
Direct sales and freight
|
(162,143 | ) | (169,346 | ) | (183,333 | ) | ||||||
|
Royalties
|
(211,095 | ) | (234,343 | ) | (197,371 | ) | ||||||
|
General and administrative - operating
|
(62,133 | ) | (47,456 | ) | (59,371 | ) | ||||||
|
General and administrative - non-operating
|
(44,242 | ) | (47,819 | ) | (58,049 | ) | ||||||
|
Net interest
|
(260 | ) | (701 | ) | ||||||||
|
EBITDA
|
625,810 | 523,218 | 324,416 | |||||||||
|
Depreciation
|
(218,356 | ) | (209,776 | ) | (206,231 | ) | ||||||
|
Net income - Zeolite
|
$ | 407,454 | $ | 313,442 | $ | 118,185 | ||||||
|
Company-wide
|
2013 | 2012 | 2011 | |||||||||
|
Gross revenue
|
$ | 10,947,278 | $ | 12,042,702 | $ | 13,118,090 | ||||||
|
Production costs
|
(8,303,610 | ) | (8,962,549 | ) | (9,547,479 | ) | ||||||
|
Other operating costs
|
(2,091,796 | ) | (1,762,548 | ) | (1,432,618 | ) | ||||||
|
General and administrative - non-operating
|
(1,370,144 | ) | (1,241,402 | ) | (994,922 | ) | ||||||
|
Non-operating gains
|
73,551 | |||||||||||
|
Net interest
|
(606 | ) | 5,358 | 5,205 | ||||||||
|
EBITDA
|
(745,327 | ) | 81,561 | 1,148,276 | ||||||||
|
Income tax benefit (expense)
|
(229,451 | ) | (167,107 | ) | (105,610 | ) | ||||||
|
Depreciation & amortization
|
(666,392 | ) | (472,990 | ) | (405,746 | ) | ||||||
|
Net income (Loss)
|
$ | (1,641,170 | ) | $ | (558,536 | ) | $ | 636,920 | ||||
20
Overview
Our cost of production was elevated for the year ended December 31, 2013, because we were starting a major mining and production facility in Mexico. The same workers responsible for production were also a significant part of building and testing the manufacturing plants and equipment at Puerto Blanco and Madero, Mexico, which resulted in costs that won’t be incurred when construction and testing is complete. To a lesser degree, we incurred similar costs at our plant in Thompson Falls, Montana. There will still be some overlapping costs in the first quarter of 2014 because the plants are still in a start-up mode, but the production from Mexico should be significantly greater for 2014 than 2013.
The non-cash loss items totaled $1,076,229 for 2013 and included $688,738 for depreciation, $8,040 for accretion, $150,000 for director compensation, and $229,451 for an increase in the valuation allowance for deferred income taxes.
We are producing and buying raw materials, which will allow us to ensure a steady flow of products for sale. Our smelter at Madero, Mexico, was producing a significant portion of our raw materials in 2013. We will still purchase raw materials from suppliers for our smelter in Montana.
|
Lbs of Antimony
|
|
|
Mexico Production Activity:
|
Metal Contained
|
|
Direct Shipping Ore (DSO)
|
|
|
Wadley property
|
148,372
|
|
San Louis Potosi area
|
140,977
|
|
Guadalupana area
|
68,098
|
|
Miscellaneous mines
|
36,095
|
|
Concentrate from Mill
|
|
|
Guadalupe
|
121,986
|
|
Soyatal district
|
20,149
|
|
Inventory usage
|
148,255
|
|
Total production at smelter
|
683,932
|
We have almost completed installation of a natural gas pipeline to replace propane as the fuel used in our Mexico smelter. We expect the pipeline to be finished by March of 2014. We expect the pipeline to cost approximately $1.7 million dollars when completed, and that it will reduce our smelter fuel cost by approximately 75%. Our smelter fuel costs (propane) in Mexico were approximately $700,000 in 2013. We have spent approximately $1,438,000 on construction as of December 31, 2013.
We have initiated the installation of a 400 - 500 ton per day flotation mill to be completed by the end of 2014 that we expect to cost between $400,000 and $500,000 to install. The concrete work for the mill has been completed, and work will be ongoing as we generate cash from operations. This mill will be dedicated to processing ore from the Los Juarez mining property. We have adequate crushing capacity in place to feed the 500 ton per day mill and the existing mill.
The restart of production from Los Juarez will create a significant increase in our precious metals revenue for 2014 and years forward.
Our principal smelter, precious metals recovery operation, and our Company headquarters remain in Montana. With increased production, we expect to widen our base of customers.
21
Results of Operations
Comparison of Years ended December 31, 2013, 2012, and 2011
|
2013
|
2012
|
2011
|
||||||||||
|
Antimony Division - United States:
|
||||||||||||
|
Revenues - Antimony (net of discount)
|
$ | 8,375,158 | $ | 8,745,321 | $ | 10,406,636 | ||||||
|
Revenues - Other
|
73,551 | $ | 8,128 | |||||||||
|
Revenues - Precious metals
|
369,706 | 647,554 | 667,813 | |||||||||
| 8,818,415 | 9,401,003 | 11,074,449 | ||||||||||
|
Domestic cost of sales:
|
||||||||||||
|
Production costs
|
4,592,019 | 5,665,806 | 7,294,421 | |||||||||
|
Depreciation
|
61,574 | 40,979 | 29,963 | |||||||||
|
Freight and delivery
|
227,179 | 218,563 | 216,668 | |||||||||
|
General and administrative
|
275,313 | 370,838 | 280,853 | |||||||||
|
Direct sales expense
|
58,095 | 61,131 | 64,421 | |||||||||
|
Total domestic antimony cost of sales
|
5,214,180 | 6,357,317 | 7,886,326 | |||||||||
|
Cost of sales - Mexico
|
||||||||||||
|
Production costs
|
2,614,860 | 1,677,927 | 1,031,957 | |||||||||
|
Depreciation and amortization
|
386,462 | 222,235 | 169,552 | |||||||||
|
Freight and delivery
|
52,628 | 111,652 | 121,432 | |||||||||
|
Reclamation accrual
|
8,040 | 8,040 | ||||||||||
|
Land lease expense
|
202,364 | 27,720 | ||||||||||
|
Other non-production costs
|
644,993 | 174,852 | 150,773 | |||||||||
|
General and administrative
|
187,814 | 148,321 | 158,396 | |||||||||
|
Total Mexico antimony cost of sales
|
4,097,161 | 2,370,747 | 1,632,110 | |||||||||
|
Total revenues - antimony
|
8,818,415 | 9,401,003 | 11,074,449 | |||||||||
|
Total cost of sales - antimony
|
9,311,341 | 8,728,064 | 9,518,436 | |||||||||
|
Total gross profit (loss) - antimony
|
(492,926 | ) | 672,939 | 1,556,013 | ||||||||
|
Zeolite Division:
|
||||||||||||
|
Revenues
|
2,202,414 | 2,641,699 | 2,043,641 | |||||||||
|
Cost of sales:
|
||||||||||||
|
Production costs
|
1,096,731 | 1,618,816 | 1,221,101 | |||||||||
|
Depreciation
|
218,356 | 209,776 | 206,231 | |||||||||
|
Freight and delivery
|
83,618 | 93,260 | 103,630 | |||||||||
|
General and administrative
|
62,133 | 47,457 | 117,420 | |||||||||
|
Royalties
|
211,095 | 234,343 | 197,371 | |||||||||
|
Direct sales expense
|
78,525 | 76,086 | 79,703 | |||||||||
|
Total cost of sales
|
1,750,458 | 2,279,738 | 1,925,456 | |||||||||
|
Gross profit - zeolite
|
451,956 | 361,961 | 118,185 | |||||||||
|
Total revenues - combined
|
11,020,829 | 12,042,702 | 13,118,090 | |||||||||
|
Total cost of sales - combined
|
11,061,799 | 11,007,802 | 11,443,892 | |||||||||
|
Total gross profit (loss) - combined
|
$ | (40,970 | ) | $ | 1,034,900 | $ | 1,674,198 | |||||
22
|
●
|
During the three year period ended December 31, 2013, the most significant event affecting our financial performance was the decrease in the price of antimony (see table page 6). During the year ended December 31, 2013, the most significant event was the commencement of production at our Mexico operations which caused our reported operating costs to be elevated when compared to years when we were not initiating the start-up of a new production facility. Mexican production of antimony as metal contained was 683,932 pounds during 2013 compared to 372,047 pounds for 2012, up 83.8%. 2013 is regarded as a “start- up year” during which the holding costs, permitting, and metallurgical research was categorized as a “non-production” operating expense. Specifically Los Juarez was not produced, Soyatal oxide ore was in a research phase at the Puerto Blanco oxide circuit, Guadalupe had shipped dump material while they obtained an explosives license and prepared the underground for mining higher grade rock, and the Puerto Blanco mill circuits were utilized less than 10% of their capacity. Going forward, the increased supply of raw material from Mexico and the metal prices for both antimony and precious metals will be the most significant factors influencing our operations. The following are highlights of the significant changes during 2013 and the three year period then ended:
|
|
●
|
Revenues from antimony sales in 2013 were approximately $378,000 (4.3%) smaller than 2012 due to a decrease in the price of antimony. The average sale price for antimony contained in all products declined from $6.24 in 2012 to $5.30 in 2013, a decrease of $0.94 (17.7%). Our sales of antimony for 2013 increased by approximately 175,000 lbs from 2012. Our revenues from antimony decreased in 2012 by approximately $1,653,000 (16%) from 2011 primarily due to a decrease in the price of antimony metal.
|
|
●
|
The metallurgical problem with the Los Juarez feed has been solved, and mining, milling, and smelting will resume by the beginning of the 2nd quarter 0f 2014. This will also put the Puerto Blanco mill back in operation. During 2013, the Puerto Blanco mill was operating at less than 10% of capacity.
|
|
●
|
The Soyatal oxide ore recovery problem has been solved, and oxide concentrates are being produced. Oxide mineralized rock will be mined and underground development will be started.
|
|
●
|
Explosives have been permitted at Guadalupe, and underground development has started Q1 2014 that should provide a much higher feed for the Puerto Blanco mill.
|
|
●
|
Assuming that Guadalupe and Los Juarez feed are going to the Puerto Blanco mill, the 500 ton per day mill that is estimated at 40% of completion will need to be completed.
|
|
●
|
If the Mexican “non-production” holding expenses for properties that are being developed are excluded, the cost of production of 1,780,134 pounds of contained meal was $4.10 per pound for 2013. The average sale price during 2013 was $5.30 a pound
|
|
●
|
Our cost of goods sold for antimony for 2013 increased by approximately $583,000 from 2012 due to an increase in our raw materials cost, but was a greater percent of sales than in prior years primarily due to start-up costs in Mexico. During 2013, the average cost of production in Mexico per pound of metal contained was $3.50 per pound compared to $4.47 per pound for Montana. The combined cost for 2013 was $4.10 per pound. Our cost of goods sold for antimony for 2012 decreased by approximately $790,000 from 2011 due to a decrease in our raw materials cost, but was a greater per cent of sales than in prior years primarily due to costs associated with starting a major production facility in Mexico. For all three years, costs of goods sold include operating and non-operating production costs from Mexico operations. As production has increased in Mexico, we have seen an inordinate increase in our smelter costs due to the high cost of propane in Mexico. After we switch to natural gas as a fuel for our smelter at Madero in 2014, we will see a significant improvement in our operating costs. The cost of goods sold during all years has been impacted by an increase in the cost of operating supplies, such as fuel, trucking, insurance, refractory costs, steel, and propane.
|
|
●
|
Our volume of zeolite sold was down by approximately 8% in 2013, from 12,189 tons in 2012 to 11,182 tons in 2013, and total revenue decreased by approximately $439,000. In 2012, we sold more products with additives, which are higher priced, than we did in 2013. Our cost of goods sold for 2013 decreased by approximately $522,000 from 2012, primarily because we had a decrease in the volume of product sold, and because we did not pre-purchase as many supplies. We inventoried the cost of additives, drying, blending, and overall operating costs for a special product mix prepared in advance for winter sales in 2013 and 2014. Our volume of zeolite sold was nearly the same in 2012 as 2011, but total revenue increased by approximately $598,000. In 2012, we sold more products with additives, which are higher priced, than we did in 2011, and we raised prices for most products due to our increased operating costs. Our cost of goods sold for 2012 increased by approximately $354,000 from 2011, primarily due to the cost of additives, drying, blending, and overall operating cost increases. Although tons sold for 2011 was less than 2010, there was an increase in the sales price per ton which accounted for an increase in revenue of approximately $130,000. The increase in the price for 2011 was mainly due to an additive, drying, and blending for a customer, which also caused a similar increase in our cost of production for 2011.
|
23
|
Zeolite
|
2013
|
2012
|
2011
|
|||||||||
|
Tons sold
|
11,182 | 12,189 | 12,105 | |||||||||
|
Average Sales Price/Ton
|
$ | 196.96 | $ | 216.73 | $ | 168.83 | ||||||
|
Net income (Loss)/Ton
|
$ | 36.44 | $ | 25.72 | $ | 9.76 | ||||||
|
Gross zeolite revenue
|
$ | 2,202,414 | $ | 2,641,699 | $ | 2,043,641 | ||||||
|
Production costs
|
(1,096,731 | ) | (1,618,816 | ) | (1,221,101 | ) | ||||||
|
Direct sales and freight
|
(162,143 | ) | (169,346 | ) | (183,333 | ) | ||||||
|
Royalties
|
(211,095 | ) | (234,343 | ) | (197,371 | ) | ||||||
|
General and administrative - operating
|
(62,133 | ) | (47,456 | ) | (59,371 | ) | ||||||
|
General and administrative - non-operating
|
(44,242 | ) | (47,819 | ) | (58,049 | ) | ||||||
|
Net interest
|
(260 | ) | (701 | ) | ||||||||
|
EBITDA
|
625,810 | 523,218 | 324,416 | |||||||||
|
Depreciation
|
(218,356 | ) | (209,776 | ) | (206,231 | ) | ||||||
|
Net income - Zeolite
|
$ | 407,454 | $ | 313,442 | $ | 118,185 | ||||||
|
●
|
General and administrative costs, as reported in our statement of operations, include fees paid to directors through stock based compensation. In 2013 and 2012, we incurred $40,000 and $88,000, respectively, in fees to the NYSE MKT that were included in general and administrative expenses. General and administrative costs for 2013, 2012 and 2011 include general and administrative costs related to commencement of production at our facilities in Mexico. The combined general and administrative costs were 6.7%, 6.7% and 3.3% of sales for 2013, 2012 and 2011, respectively.
|
|
●
|
The decrease in professional fees for 2013 from 2012 (approximately $33,846) was primarily due to decreased costs related to our audits and financial statement preparation. The increase in professional fees for 2012 from 2011, (approximately $52,500) was primarily due to increased costs related to our audits and financial statement preparation during the year we became listed on the NYSE MKT.
|
|
●
|
Factoring costs were similar in 2013 to 2012. Factoring costs decreased in 2012 by approximately $76,100 as we were able to reduce our collection time for accounts receivable in that year. Our discount to customers for early payment increased by approximately $42,100 in 2012 from 2011. Factoring expense increased in 2011from 2010 by approximately $35,100 because of increased revenue and greater amounts of accounts receivable available for factoring.
|
|
●
|
For the year ended December 31, 2010, we determined that it was likely that we would be profitable in the future, and that it was appropriate to record a tax benefit of $493,000 for the value of tax losses from prior years that could be used to reduce income tax in future periods. For the years ended December 31, 2013, 2012, and 2011, this benefit was reduced by $229,451, $167,107, and $96,442, respectively, for increases in the valuation allowance due to changed expectations about when we would have taxable income, and changes in the components that made up the base for calculating the future tax benefit.
|
24
Subsidiaries
The Company has a 100% investment in two subsidiaries in Mexico, USAMSA and AM, whose carrying value was assessed at December 31, 2013, 2012, and 2011, for impairment. Management’s assessment of the subsidiaries’ fair value was based on their future benefit to us.
|
Financial Condition and Liquidity
|
||||||||||||
|
2013
|
2012
|
2011
|
||||||||||
|
Current Assets
|
$ | 1,910,564 | $ | 3,103,128 | $ | 2,963,570 | ||||||
|
Current liabilities
|
(2,479,341 | ) | (1,622,641 | ) | (1,742,022 | ) | ||||||
|
Net Working Capital
|
$ | (568,777 | ) | $ | 1,480,487 | $ | 1,221,548 | |||||
|
Cash provided (used) by operations
|
$ | 234,820 | $ | 526,419 | $ | 417,452 | ||||||
|
Cash used for capital outlay
|
(2,733,762 | ) | (3,513,901 | ) | (2,239,441 | ) | ||||||
|
Cash provided (used) by financing:
|
||||||||||||
|
Proceeds from notes payable to bank
|
138,520 | - | - | |||||||||
|
Principal paid on long-term debt
|
(273,405 | ) | (464,936 | ) | (124,722 | ) | ||||||
|
Proceeds from long-term debt
|
352,000 | - | - | |||||||||
|
Sale of Stock
|
1,147,194 | 4,624,763 | 1,242,780 | |||||||||
|
Other
|
154,165 | (176,961 | ) | 260,497 | ||||||||
|
Net change in cash
|
$ | (980,468 | ) | $ | 995,384 | $ | (443,434 | ) | ||||
Our net working capital, decreased for the year ended December 31, 2013, from a positive amount of $1,480,487 at the beginning of the year to a negative amount of $568,777 at the end of 2013. Our current assets decreased and our current liabilities increased primarily due to expenditures for capital improvements in Mexico. The capital improvements were mainly financed by the sale of stock and an increase in current liabilities. Our financial condition and liquidity improved for the two years ended December 31, 2012. This was due to an increase in our cash provided by operations and the sale of stock each year. We used most of our resources from operating cash flows and the sale of stock to complete our mine, mill, and smelter production facility in Mexico. Over the three year period, we raised approximately $6,932,000 from issuing restricted stock, and we used approximately $9,995,000, including $1,742,000 of assets purchased with debt, for capital improvements in Mexico ($8,617,000), Montana ($558,000), and at the Bear River Zeolite plant ($820,000). In Mexico, we completed the final installation of the crusher, ball mill and flotation circuit, four additional furnaces at Madero, started the installation of a 500 ton per day ball mill, and paid for partial construction of a natural gas pipeline that is nearly complete.
During the year ending December 31, 2014, we are planning to finance our improvements with operating cash flow. Our 2014 improvements are expected to include final installation of a natural gas pipeline to the Madero smelter and completing the installation of a 400 - 500 ton per day flotation mill that will increase our production from the Los Juarez mine.
In 2012, cash provided by operations was primarily due to the collection of approximately $978,000 of accounts receivable, which were approximately $1,438,000 at the beginning of the year, and approximately $460,000 as of December 31, 2012. In 2011, an increase in inventories due to raw materials purchased per supply agreements reduced cash flows from operations by approximately $923,000, and in 2011 and 2010, increases in accounts receivable due to December sales reduced cash flows from operations by approximately $693,000 and $583,000, respectively. An increase in accounts payable, not paid because of the increase in the amount of accounts receivable due at year end, increased our cash flow from operations by approximately $585,000 for 2011.
The current portion of our long term debt is serviceable from the cash generated by operations.
25
In 2013, cash provided by operations was primarily due to an increase in accounts payable and other accrued liabilities.
Our stockholders’ equity section makes note that we have a liquidation preference of $5,760,078 for our preferred stock. This consists of a liquidation payment of $5,247,009 due if we liquidate our company or sell substantially all our assets, and $513,069 of undeclared dividends. The Board of Directors’ does not intend to declare dividends on preferred stock as due and payable at any time in the near future. We do not feel that the liquidation preference and undeclared dividends related to our preferred stock will be an impediment to raising capital in the future by issuing additional shares of common stock, and are not going to affect our liquidity.
Item 7A. Quantitative and Qualitative Disclosures about Market Risk
We sell our antimony products based on a world market price. Our earnings and cash flow are significantly affected by changes in the price of antimony. The price of antimony can fluctuate widely and is influenced by numerous factors such as demand, production levels, and world political and economic events. During the past ten years, the price of antimony metal has ranged from a low of $1.48 per pound to a high of $6.97 per pound. Analysis of our costs indicate that, for the year ended December 31, 2013, raw material costs were approximately 50% of our cost of revenues (cost of goods sold). Most of our production costs are fixed in nature, and could not be decreased readily without decreasing our production. During the year ended December 31, 2013, a $2 per pound decrease in our sales price would have likely caused our gross profit to decrease by $1 per pound. As we produce more of our raw material from our Mexico operations and our raw material cost becomes less affected by world prices, a decrease in our sales price will have a smaller impact on our cost of revenues.
Item 7B. Critical Accounting Estimates
We have, besides our estimates of the amount of depreciation on our assets, two critical accounting estimates. The value of our unprocessed ore in inventory is assessed on assays taken at the time the ore is delivered, and may vary when the ore is processed and final settlement is made. Also, the asset recovery obligation on our balance sheet is base on an estimate of the future cost to recover and remediate our properties as required by our permits upon cessation of our operations, and may differ when we cease operations.
|
●
|
The value of unprocessed purchased ore in our inventory at the Puerto Blanco mill, primarily ore purchased from the Guadalupe mining concession, is based on assays taken at the time the ore is delivered, and may vary when the ore is processed and final settlement is made. We assay the purchased ore to estimate the amount of antimony contained per metric ton, and then make an advance payment based on the Rotterdam price of antimony and the % of antimony contained. Our payment scale incorporates a penalty for ore with a low percentage of antimony. After processing the ore and determining a final recovery of the amount of antimony metal in a lot of purchased ore, a final settlement is made, and any underpayment or overpayment is accounted for. It is reasonably likely that the initial assay used for advance payment will differ from the amount of metal recovered from a given lot. If the initial assay of a lot of ore on hand at the end of a reporting period were different, it would cause a change in our reported inventory and accounts payable amounts, but would not change our reported cost of goods sold or net income amounts. At December 31, 2013, if we had overestimated the per cent of antimony in our total inventory of purchased ore at our Puerto Blanco mill by 2.5%, (a 10% correction to the amount of antimony metal contained if we estimated 25.0% antimony per metric ton), the amount of our inventory and accounts payable would be smaller by approximately $24,000. Our net income would not be affected. Direct shipping ore (DSO) purchased at our Madero smelter is paid for at a fixed amount at the time of delivery and assaying, and is not subject to accounting estimates. The amount of the accounting estimate for purchased ore at our Puerto Blanco mill is in a constant state of change because the amount of purchased ore and the per cent of metal contained are constantly changing. Due to the amount of ore on hand at the end of a reporting period, as compared to the amount of total assets, liabilities, equity, and the ore processed during a reporting period, any change in the amount of estimated metal contained would likely not result in a material change to our financial condition.
|
|
●
|
The asset recovery obligation and asset on our balance sheet is based on an estimate of the future cost to recover and remediate our properties as required by our permits upon cessation of our operations, and may differ when we cease operations. As of December 31, 2011, we made an estimate that the cost of the machine and man hours probable to be needed to put our properties in the condition required by our permits once we cease operations would be $134,000. For purposes of the estimate, we used a probable life of 20 years and costs that, initially, are comparable to rates that we would incur at the present. We are adding to (an accretion of 6%) the liability each year by $8,040, and amortizing the asset over 20 years ($6,700 annually), which decreases our net income in total each year by $11,740. We will make periodic reviews of the remaining life of the mine and other operations, and the estimated remediation costs upon closure, and adjust our account balances accordingly. At this time, we think that an adjustment in our asset recovery obligation is not required, and an adjustment in future periods would not have a material impact in the year of adjustment, but would change the amount of the annual accretion and amortization costs charged to our expenses by an undetermined amount.
|
Item 8. Financial Statements
The consolidated financial statements of the registrant are included herein on pages F1-F22.
Item 9. Changes in and Disagreements with Accountants on Accounting and Financial Disclosure
None
26
Item 9A. Controls and Procedures
Evaluation of disclosure controls and procedures
We maintain disclosure controls and procedures that are designed to ensure that information required to be disclosed in our reports under the Securities Exchange Act of 1934 is recorded, processed, summarized and reported within the time periods specified in the SEC’s rules and forms, and that such information is accumulated and communicated to management, as appropriate, to allow timely decisions regarding required disclosure. Our Chief Financial Officer conducted an evaluation of the effectiveness of USAC’s disclosure controls and procedures (as defined in the Securities Exchange Act of 1934 Rules 13a-15(e) and 15d-15(e)) as of December 31, 2013. Based upon this evaluation, it was determined that there were material weaknesses affecting our internal control over financial reporting (described below) and, as a result of those weaknesses, our disclosure controls and procedures were ineffective as of December 31, 2013.
Management's annual report on internal control over financial reporting
The management of USAC is responsible for establishing and maintaining adequate internal control over financial reporting. This internal control system has been designed to provide reasonable assurance to our management and Board of Directors regarding the preparation and fair presentation of our published financial statements.
All internal control systems, no matter how well designed, have inherent limitations. Therefore, even those systems determined to be effective can provide only reasonable assurance with respect to financial statement preparation and presentation.
The management of USAC has assessed the effectiveness of our internal control over financial reporting as of December 31, 2013. To make this assessment, we used the criteria for effective internal control over financial reporting described in Internal Control-Integrated Framework, issued by the Committee of Sponsoring Organizations of the Treadway Commission (COSO).
As a result of our assessment, we concluded that we have material weaknesses in our internal control over financial reporting as of December 31, 2013. These weaknesses are as follows:
|
●
|
Inadequate documentation of controls and monitoring of internal controls over significant accounts and processes including controls associated with the period-end financial reporting process;
|
|
●
|
The absence of proper segregation of duties within significant accounts and processes and the absence of controls over management oversight, including antifraud programs and controls; and
|
We are aware of these material weaknesses and will develop procedures to ensure that independent review of material transactions is performed. The chief financial officer will develop internal control measures to mitigate the lack of inadequate documentation of controls and the monitoring of internal controls over significant accounts and processes including controls associated with the period-ending reporting processes, and to mitigate the segregation of duties within significant accounts and processes and the absence of controls over management oversight, including antifraud programs and controls.
27
We plan to consult with independent experts when complex transactions are entered into.
Because these material weaknesses exist, management has concluded that our internal control over financial reporting as of December 31, 2013, is ineffective.
Our internal control over financial reporting as of December 31, 2013, has been audited by DeCoria, Maichel & Teague, P.S., an independent registered public accounting firm, as stated in the attestation report which is included herein.
Changes in internal control over financial reporting
There were no changes in internal control over financial reporting for the year ended December 31, 2013.
28

REPORT OF INDEPENDENT REGISTERED PUBLIC ACCOUNTING FIRM
To the Board of Directors and Shareholders of United States Antimony Corporation:
We have audited United States Antimony Corporation’s internal control over financial reporting as of December 31, 2013, based on criteria established in Internal Control—Integrated Framework issued by the Committee of Sponsoring Organizations of the Treadway Commission 1992 (COSO), published in 1992. United States Antimony Corporation’s management is responsible for maintaining effective internal control over financial reporting and for assessing of the effectiveness of internal control over financial reporting, included in the Item 9A, Management’s Annual Report on Internal Control Over Financial Reporting. Our responsibility is to express an opinion on the company’s internal control over financial reporting based on our audit.
We conducted our audit in accordance with the standards of the Public Company Accounting Oversight Board (United States). Those standards require that we plan and perform the audit to obtain reasonable assurance about whether effective internal control over financial reporting was maintained in all material respects. Our audit of internal control over financial reporting included obtaining an understanding of internal control over financial reporting, assessing the risk that a material weakness exists, and testing and evaluating the design and operating effectiveness of internal control based on the assessed risk. Our audit also included performing such other procedures as we considered necessary in the circumstances. We believe that our audit provides a reasonable basis for our opinion.
A company’s internal control over financial reporting is a process designed to provide reasonable assurance regarding the reliability of financial reporting and the preparation of financial statements for external purposes in accordance with generally accepted accounting principles. A company’s internal control over financial reporting includes those policies and procedures that (1) pertain to the maintenance of records that, in reasonable detail, accurately and fairly reflect the transactions and dispositions of the assets of the company; (2) provide reasonable assurance that transactions are recorded as necessary to permit preparation of financial statements in accordance with generally accepted accounting principles, and that receipts and expenditures of the company are being made only in accordance with authorizations of management and directors of the company; and (3) provide reasonable assurance regarding prevention or timely detection of unauthorized acquisition, use, or disposition of the company’s assets that could have a material effect on the financial statements.
Because of its inherent limitations, internal control over financial reporting may not prevent or detect misstatements. Also, projections of any evaluation of effectiveness to future periods are subject to the risk that controls may become inadequate because of changes in conditions, or that the degree of compliance with the policies or procedures may deteriorate.
A material weakness is a control deficiency, or combination of deficiencies, in internal control over financial reporting, such that there is a reasonable possibility that a material misstatement of the Company’s annual or interim financial statements will not be prevented or detected on a timely basis. The following material weaknesses have been identified and included in management’s assessment:
|
●
|
Inadequate design of internal control over the preparation of the financial statements and financial reporting processes;
|
|
●
|
Inadequate monitoring of internal controls over significant accounts and processes including controls associated with domestic and Mexican subsidiary operations and the period-end financial reporting process;
|
29
|
●
|
The absence of proper segregation of duties within significant processes and ineffective controls over management oversight, including antifraud programs and controls; and
|
|
●
|
Ineffective controls over the application of accounting principles that are in conformity with generally accepted accounting principles.
|
These material weaknesses were considered in determining the nature, timing, and extent of audit tests applied in our audit of the 2013 consolidated financial statements, and this report does not affect our report dated March 12, 2014, on those financial statements.
In our opinion, United States Antimony Corporation did not maintain effective internal control over financial reporting as of December 31, 2013, based on criteria established in Internal Control—Integrated Framework issued by the Committee of Sponsoring Organizations of the Treadway Commission 1992.
We have also audited, in accordance with the standards of the Public Company Accounting Oversight Board (United States), the consolidated balance sheets of United States Antimony Corporation as of December 31, 2013 and 2012, and the related consolidated statements of operations, changes in stockholders’ equity and cash flows for each of the three years in the period ended December 31, 2013, and our report dated March 12, 2014, expressed an unqualified opinion thereon.
/s/: DeCoria, Maichel & Teague, P.S.
DeCoria, Maichel & Teague, P.S.
Spokane, Washington
March 12, 2014
30
Item 9b. Other Information
We file the following reports with the Securities and Exchange Commission, or SEC:
|
●
|
Form 10K Annual Report Under Section 13 or 15(d) of the Securities and Exchange Act of 1934
|
|
●
|
Form 10Q Quarterly Report Under Section 13 or 15(d) of the Securities and Exchange Act of 1934
|
|
●
|
Form 8K Current Report Pursuant to Section 13 or 15(d) of the Securities and Exchange Act of 1934
|
The public may read and copy any materials that we file with SEC at the SEC’s Public Reference Room at 100 F Street, NE, Washington, Dc 20549. The public may obtain information on the operation of the Public Reference Room by calling the SEC at 1-800-SEC-0330. We file electronically with the SEC. The SEC maintains an internet site (http:/www.sec.gov), that contains reports, proxy and information statements, and other information regarding issuers that file electronically.
Our internet address is www.usantimony.com. Our annual report on Form 10K, quarterly report on Form 10Q, current reports on Form 8K, and any amendments to these reports is available, free of charge, as soon as practicable after such material is electronically filed with the SEC.
On February 9, 2012, as reported on SEC Form 8K, the Company accepted the resignation of Patrick W. Dugan, Esq., from the Board of Directors. Mr. Whitney Ferer was appointed to the Board of Directors in place of Mr. Dugan on February 22, 2012.
On May 15, 2012, as reported on SEC Form 8K, the Company accepted the resignation of Leo Jackson, from the Board of Directors. Mr. Bernard J.Guarnera was appointed to the Board of Directors in place of Mr. Jackson on May 15, 2012.
On January 7, 2012, the Company issued 1,102,500 shares of common stock at a price of $2.00 per share. Each share is accompanied by a warrant to purchase an additional share for $2.50 for two years.
On June 28, 2012, the Company issued 953,834 shares of common stock at a price of $3.00 per share. Each share is accompanied by a warrant to purchase an additional one-half share for $4.50 per share for two years.
On June 28, 2013, the Company issued 725,000 shares of common stock at a price of $1.00 per share. Each share is accompanied by a warrant to purchase an additional one-half share for $1.20 per share for one year.
On December 27, 2013, the Company issued 534,480 shares of common stock at a price of $1.25 per share. Each share is accompanied by a warrant to purchase an additional one-half share for $1.60 per share for one year.
31
PART III
Item 10. Directors, Executive Officers, Promoters and Control Persons, Compliance with Section 16(a) of the Exchange Act
Identification of directors and executive officers at December 31, 2013, is as follows:
|
Name
|
Age
|
Affiliation
|
Expiration of Term
|
||||
|
John C. Lawrence
|
75 |
Chairman, President,
Treasurer; Director
|
Annual meeting
|
||||
|
John C. Gustavsen
|
65 |
First Vice-President
|
Annual meeting
|
||||
|
Russell C. Lawrence
|
45 |
Second Vice-President
And Director
|
Annual meeting | ||||
|
Matthew Keane
|
59 |
Third Vice-President
|
Annual meeting
|
||||
|
Daniel L. Parks
|
65 |
Chief Financial Officer
|
Annual meeting
|
||||
|
Alicia Hill
|
32 |
Secretary and Controller
|
Annual meeting
|
||||
|
Bernard Guarnera
|
70 |
Director
|
Annual meeting
|
||||
|
Gary D. Babbitt
|
68 |
Director
|
Annual meeting
|
||||
|
Whitney Ferer
|
55 |
Director
|
Annual meeting
|
||||
|
Hart W. Baitis
|
64 |
Director
|
Annual meeting
|
||||
Business Experience of Directors and Executive Officers
John C. Lawrence. Mr. Lawrence has been the president and a director since our inception. Mr. Lawrence was the president and a director of AGAU Mines, Inc., our corporate predecessor, since the inception of AGAU Mines, Inc. in 1968. He is a member of the Society of Mining Engineers and a recipient of the Uuno Sahinen Silver Medallion Award presented by Butte Tech, University of Montana. He has a vast background in mining, milling, smelting, chemical processing and oil and gas.
Gary D. Babbitt. Mr. Babbitt has experience in mining industry with approximately 30 years dealing with joint ventures, purchases, royalty leases and contracts. He has a working knowledge of Spanish and has negotiated supply and mining agreements in Mexico. Mr. Babbitt has a B.A. from the Albertson College of Idaho, and earned his J.D. from the University of Chicago.
Bernard J. Guarnera. Mr. Guarnera, who was nominated to the Board in May 2012, has more than 40 years of experience in the global mining industry. Most recently he served as Chairman and CEO of Behre Dolbear & Company, an internationally recognized mining consulting firm which was founded in 1991. He previously served with Texaco’s Minerals Group, Daymes & Moore, and Boise Cascade, firms where he worked in the coal and uranium, precious and base metals and industrial minerals sectors. Mr. Guarnera has degrees from the Michigan College of Mining & Technology (B.Sc. Geological Engineering (mining emphasis) and M.Sc. Economic Geology). Mr. Guarnera resigned his position on the Board of Directors in January of 2014.
Russell C. Lawrence. Mr. Lawrence has experience in the lines of applied physics, mining, refining, excavation, electricity, electronics, and building contracting. He graduated from the University of Idaho in 1994 with a degree in physics, and worked for the Physics Department at the University of Idaho for a period of 10 years. He has also worked as a building contractor and for USAC at the smelter and laboratory at Thompson Falls, for USAMSA in the construction and operation of the USAMSA smelter in Mexico, and for Antimonio de Mexico, S. A. de C. V. at the San Miguel Mine and the Cadereyta mill site in Mexico.
32
Hart W. Baitis. Mr. Baitis graduated from the University of Oregon in 1971 with a B.S. in Geology, and was awarded a Ph. D. in Geology in 1976. He has 35 years of experience as an exploration geologist in the United States, Canada, Central America, and Mexico. Mr. Baitis is experienced in numerous geologic environments and terrains, and has been involved in all phases of exploration, ranging from field geologist, consultant, management, and acquisition team director.
Whitney Ferer. Mr. Ferer, who was nominated to the board in February 2012, has worked for 34 years for Aaron Ferer & Sons, or AF&S, headquartered in Omaha, Nebraska, where he is currently the Vice President of Trading and Operations and Vice Chairman of the Board of AF&S. He has been involved in the patenting of various processes for the breakdown of plastics and metal recovery, and was Vice President of the Lead & Zinc Division of AF&S. In addition, Mr. Ferer has been active in the trading of all metals, and facilitated the opening of eight offices in the Far East and China. He is one of the largest traders of antimony metal and oxide in the United States.
Daniel L. Parks. Mr. Parks graduated from the University of Idaho in 1974 with a B.S. in Accounting, and was licensed as a certified public accountant in 1976. He worked as an auditor for Coopers & Lybrand for three years, as controller for a lumber manufacturing company for one year, and owned his own accounting practice for thirty years. Mr. Parks was extensively involved in auditing and financial statement preparation during this time.
We are not aware of any involvement by our directors or executive officers during the past five years in legal proceedings that are material to an evaluation of the ability or integrity of any director or executive officer.
Board Meetings and Committees. Our Board of Directors held four (4) regular meetings during the 2013 calendar year. Each incumbent director, except for Bernard Guarnera, attended all of the meetings held during the 2013 calendar year, in the aggregate, by the Board and each committee of the Board of which he was a member.
Our Board of Directors established an Audit Committee on December 10, 2011. It consists of three members, Gary Babbitt (Chairman), Whitney Ferer, and Hart Baitis. None of the Audit Committee members are involved in our day-to-day financial management. Hart Baitis is considered a financial expert.
During 2011, the Board also established a Compensation Committee and a Nominating Committee.
Board Member Compensation. We paid directors' fees in the form of 26,000 shares of our common stock per director during 2010. In January of 2012, we issued the directors 149,500 shares, of which 95,835 shares were for services during 2011. The remaining shares were part of the directors’ compensation for 2012. Following is a summary of fees, cash payments, stock awards, and other reimbursements to Directors during the year ended December 31, 2013:
Directors Compensation
|
Name and Principal Position
|
Fees Earned or paid in Cash
|
Stock Awards
|
Total Fees, Awards, and Other Compensation
|
|||||||||
|
John C. Lawrence, Chairman
|
$ | 25,000 | $ | 25,000 | ||||||||
|
Bernard Guarnera, Director
|
$ | 25,000 | $ | 25,000 | ||||||||
|
Gary D. Babbitt, Director
|
$ | 36,000 | $ | 25,000 | $ | 61,000 | ||||||
|
Russell Lawrence, Director
|
$ | 25,000 | $ | 25,000 | ||||||||
|
Hartmut Baitis, Director
|
$ | 25,000 | $ | 25,000 | ||||||||
|
Whitney Ferer, Director
|
$ | 25,000 | $ | 25,000 | ||||||||
|
Totals
|
$ | 36,000 | $ | 150,000 | $ | 186,000 | ||||||
Section 16(a) Beneficial Ownership Reporting Compliance. Section 16(a) of the Securities Exchange Act of 1934 requires our directors and executive officers and the holders of 10% or more of our common stock to file reports of ownership and changes in ownership with the Securities and Exchange Commission. Officers, directors and stockholders holding more than 10% of our common stock are required by the regulation to furnish us with copies of all Section 16(a) forms they have filed. Based solely on our review of copies of Forms 3, 4 and 5 furnished to us, Mr.John Lawrence, Mr. Baitis, Mr. Babbitt, Mr. Ferer, Mr. Guarnera, and Mr. Russell Lawrence did not file timely Forms 3, 4 or Form 5 reports during 2013, 2012, or 2011.
Code of Ethics
The Company has adopted a Code of Ethics that applies to the Company's executive officers and its directors. The Company will provide, without charge, a copy of the Code of Ethics on the written request of any person addressed to the Company at: United States Antimony Corporation, P.O. Box 643, Thompson Falls, MT 59873.
33
Item 11. Executive Compensation
Summary Compensation Table
The Securities and Exchange Commission requires the following table setting forth the compensation paid by USAC to its principal executive officer for fiscal years ended December 31, 2013, 2012, and 2011.
|
Name and Principal Position
|
Year
|
Salary
|
Bonus
|
Stock Awards (2)
|
All Other Compensation (1)
|
Total
|
||||||||||||||||||
|
John C. Lawrence,
President and Chief Executive Officer
|
2013
2012
2011
|
$126,000
$126,000
$126,000
|
N/A |
$25,000
$25,000
$40,001
|
$5,538
$5,538
$5,538
|
$156,538
$156,538
$171,539
|
||||||||||||||||||
|
John C. Gustaven,
Executive Vice President
|
2013
2012
2011
|
$100,000
$100,000
$85,000
|
N/A |
$100,000
$100,000
$85,000
|
||||||||||||||||||||
|
Russell Lawrence,
Vice President for Latin America
|
2013
2012
2011
|
$100,000
$100,000
$85,000
|
N/A |
$25,000
$25,000
$40,001
|
$125,000
$125,000
$125,001
|
|||||||||||||||||||
(1) Represents earned but unused vacation.
(2) These figures represent the fair values, as of the date of issuance, of the annual director's fee payable to Mr. Lawrence in the form of shares of USAC's common stock.
Compensation for all executive officers, except for the President/CEO position, is recommended to the compensation committee of the Board of Directors by the President/CEO. The compensation committee makes the recommendation for the compensation of the President/CEO. The compensation committee has identified a peer group of mining companies to aid in reviewing the President’s compensation recommendations for executives, and for reviewing the compensation of the President/CEO. The full Board approves the compensation amounts recommended by the compensation committee. Currently, the executive managements’ compensation only includes base salary and health insurance. The Company does not have annual performance based salary increases, long term performance based cash incentives, deferred compensation, retirement benefits, or disability benefits. For the year ended December 31, 2011, The Chief Executive Officer (CEO) received an increase in base compensation of $24,000 annually. The Board of Directors determined that the CEO’s compensation for the prior year ended December 31, 2010, was substantially less than that of Chief Executive Officers for similar companies, and that a raise was appropriate to compensate the CEO for management of a Company with the complexities of United States Antimony Corporation.
Two executive officers, the President/CEO and the Vice-President for the Latin American operations, receive restricted stock awards for their services as Board members
The following table sets forth information concerning the outstanding equity awards at December 31, 2013, held by our principal executive officer. There were not any other outstanding equity awards or plan based awards to officers or directors as of December 31, 2013.
|
Outstanding Equity Awards at
|
|||||||||||||||||
|
Fiscal Year End
|
|||||||||||||||||
|
Name
|
Number of Securities Underlying
Unexercised Options
|
Number of Securities
Underlying Unexercised
Unearned Options
|
Average
Exercise
Price
|
Option
Exercise
Dates
|
|||||||||||||
|
Exercisable
|
Unexercisable
|
||||||||||||||||
| # | # | ||||||||||||||||
|
John C. Lawrence
|
250,000 | 0 | 0 | $ | 0.25 |
None
|
|||||||||||
|
(Chairman of the Board Of
|
|||||||||||||||||
|
Directors and Chief Executive
|
|||||||||||||||||
|
Officer)
|
|||||||||||||||||
34
Item 12. Security Ownership of Certain Beneficial Owners and Management
The following table sets forth information regarding beneficial ownership of our common stock as of March 17, 2014, by (i) each person who is known by us to beneficially own more than 5% of our Series B, C, and D preferred stock or common stock; (ii) each of our executive officers and directors; and (iii) all of our executive officers and directors as a group. Unless otherwise stated, each person's address is c/o United States Antimony Corporation, P.O. Box 643, 47 Cox Gulch, Thompson Falls, Montana 59873.
|
Title of Class
|
Name and Address of
Beneficial Owners (1)
|
Amount and
Nature of
Beneficial Ownership
|
Percent of
Class (1)
|
Percent of all
Voting Stock
|
||||||||
| Common Stock |
Cardinal capital Management LLC
Four Greenwich Office Park
Greenwich CT 06831
|
4,008,694 | 6.40 | % | 6.20 | % | ||||||
|
Common Stock
|
Reed Family Limited Partnership
328 Adams Street Milton, MA
02186
|
4,018,335 | 6.60 | % | 6.40 | % | ||||||
|
Common Stock
|
The Dugan Family
c/o A.W.Dugan
1415 Louisana Street, Suite 3100
Houston, TX 77002
|
6,362,927 | (3) | 10.70 | % | 10.40 | % | |||||
|
Series B Preferred
|
Excel Mineral Company
P.O. Box 3800
Santa Barbara, CA 93130
|
750,000 | (5) | 100.00 | % | N/A | ||||||
|
Series C Preferred
|
Richard A. Woods
59 Penn Circle West
Penn Plaza Apts.
Pittsburgh, PA 15206
|
48,305 | (4) | 27.10 | % | * | ||||||
|
Series C Preferred
|
Dr. Warren A. Evans
69 Ponfret Landing Road
Brooklyn, CT 06234
|
32,203 | (4) | 18.10 | % | * | ||||||
|
Series C Preferred
|
Edward Robinson
1007 Spruce Street, 1st floor
Philadelphia, PA 19107
|
32,203 | (4) | 18.10 | % | * | ||||||
|
Series C Preferred
|
All Series C Preferred Shareholders as a Group
|
177,904 | (4) | 100.00 | % | * | ||||||
|
Common Stock
|
John C. Lawrence
Russell Lawrence
Hart Baitis
Garry Babbitt
Bernard Guarnera
Whitney Ferer
Mathew Keane
Daniel Parks
|
4,128,346
165,693
20,526
134,167
87,725
58,026
10,300
40,000
|
(2) |
6.50
*
*
*
*
*
*
|
% |
6.30
*
*
*
*
*
*
|
% | |||||
|
Common Stock
|
All Directors and Executive Officers as a Group
|
4,644,783 | 7.30 | % | 7.10 | % | ||||||
|
Series D Preferred
|
John C. Lawrence
Leo Jackson
Garry Babbitt
|
1,590,672
102,000
58,333
|
(4) |
90.80%
5.80%
3.40%
|
2.40
*
*
|
% | ||||||
|
Series D Preferred
|
All Series D Preferred Shareholders as a Group
|
1,751,005 | (4) | 100.00 | % | 2.70 | % | |||||
|
Common Stock and
Preferred Stock w/voting rights
|
All Directors and Executive Officers as a Group
All preferred Shareholders that are officers or directors
|
4,644,783
-
1,751,005(4)
|
(2) |
7.30%
-
90.80%
|
7.10%
-
2.80%
|
|||||||
|
Common and Preferred Voting Stock
|
All Directors and Executive
Officers as a Group
|
6,395,798 | 9.80 | % | 9.80 | % | ||||||
|
(1)
|
Beneficial Ownership is determined in accordance with the rules of the Securities and Exchange Commission and generally includes voting or investment power with respect to securities. Shares of common stock subject to options or warrants currently exercisable or convertible, or exercisable or convertible within 60 days of March 17, 2014, are deemed outstanding for computing the percentage of the person holding options or warrants but are not deemed outstanding for computing the percentage of any other person. Percentages are based on a total of 61,896,726 shares of common stock, 750,000 shares of Series B Preferred Stock, 177,904 shares of Series C Preferred Stock, and 1,751,005 shares of Series D Preferred Stock outstanding on March 17, 2014. Total voting stock of 63,825,635 shares is a total of all the common stock issued, and all of the Series C and Series D Preferred Stock.
|
|
(2)
|
Includes 3,801,653 shares of common stock and 250,000 stock purchase warrants. Excludes 183,324 shares owned by Mr. Lawrence's sister, as to which Mr. Lawrence disclaims beneficial ownership.
|
35
|
(3)
|
Includes shares owned by the estate of Al W. Dugan and shares owned by companies owned and controlled by the estate of Al W. Dugan. Excludes 183,333 shares owned by Lydia Dugan as to which the estate of Mr. Dugan disclaims beneficial ownership.
|
|
(4)
|
The outstanding Series C and Series D preferred shares carry voting rights equal to the same number of shares of common stock.
|
|
(5)
|
The outstanding Series B preferred shares carry voting rights only if the Company is in default in the payment of declared dividends. The Board of Directors has not declared any dividends as due and payable for the Series B preferred stock.
|
Item 13. Certain Relationships and Related Transactions
Described below are transactions during the last three years to which we are a party and in which any director, executive officer or beneficial owner of five percent (5%) or more of any class of our voting securities or relatives of our directors, executive officers or five percent (5%) beneficial owners has a direct or indirect material interest. See also transactions described in notes 4, 9, 10, 11, 12, 15 and 19 to our Financial Statements as of December 31, 2013.
We reimbursed John C. Lawrence, a director and Chief Executive Officer, for operational and maintenance expenses incurred in connection with our use of equipment owned by Mr. Lawrence, including welding trucks, backhoes, and an aircraft. Reimbursements for 2013, 2012 and 2011, totaled $65,502, $74,490, and $86,508, respectively.
During 2013, the Company awarded, but did not issue, common stock with a value at December 31, 2013 of $150,000 to its Board of Directors as compensation for their services as directors. In connection with the issuances, the Company recorded $150,000 in director compensation expense. At a closing price of $1.97 per share on December 31, 2013, the directors will be issued 76,142 shares.
During the year ended 2012, we issued 100,000 shares to Herbert Denton for services provided related to the private issuance of stock in January and June of 2012. The value of the shares issued to Mr. Denton was treated as a cost of issuance and did not affect net income. In January of 2012, we also issued 165,827 shares to Directors for services, with a value at time of issuance of $451,232. $211,818 was treated as an expense for 2012, $230,004 was expensed in 2011, and $9,410 was expensed in 2013.
During 2011, the Company awarded 95,835 shares of its common stock to its Board of Directors as compensation for their services as directors. In connection with the issuances, the Company recorded $230,004 in director compensation expense. The shares were issued in January of 2012.
Item 14. Principal Accountant Fees and Services
The Company's Board of Directors and audit committee reviews and approves audit and permissible non-audit services performed by DeCoria, Maichel & Teague P.S., as well as the fees charged by DeCoria, Maichel & Teague P.S. for such services. In its review of non-audit service fees and its appointment of DeCoria, Maichel & Teague P.S. as the Company's independent accountants, the Board of Directors considered whether the provision of such services is compatible with maintaining DeCoria, Maichel & Teague P.S. independence. All of the services provided and fees charged by DeCoria, Maichel & Teague P.S. in 2013 were pre-approved by the Board of Directors and its audit committee.
Audit Fees
The aggregate fees billed by DeCoria, Maichel & Teague P.S. for professional services for the audit of the annual financial statements of the Company and the reviews of the financial statements included in the Company's quarterly reports on Form 10-Q for 2013, 2012, and 2011 were$161,631, $172,991, and $102,728, respectively, net of expenses.
Audit-Related Fees
There were no other fees billed by DeCoria, Maichel & Teague P.S. during the last three fiscal years for assurance and related services that were reasonably related to the performance of the audit or review of the Company's financial statements and not reported under "Audit Fees" above.
36
Tax Fees
The aggregate fees billed by DeCoria, Maichel & Teague P.S. during the last two fiscal years for professional services rendered by DeCoria, Maichel & Teague P.S. for tax compliance for 2013, 2012 and 2011 were $16,578, $4,082, and $7,408, respectively.
All Other Fees
There were no other fees billed by DeCoria, Maichel & Teague P.S. during the last two fiscal years for products and services provided by DeCoria, Maichel & Teague P.S
Item 15. Exhibits and Reports on Form 8-K
|
Exhibit Number
|
Description
|
|
3.01
|
Articles of Incorporation of USAC, filed as an exhibit to USAC's Form 10-KSB for the fiscal year ended December 31, 1995 (File No.001-08675), are incorporated herein by this reference.
|
|
3.02
|
Amended and Restated Bylaws of USAC, filed as an exhibit to amendment No. 2 to USAC's Form SB-2 Registration Statement (Reg. No. 333-45508) are incorporated herein by this reference.
|
|
3.03
|
Articles of Correction of Restated Articles of Incorporation of USAC.
|
|
3.04
|
Articles of Amendment to the Articles of Incorporation of United States Antimony Corporation, filed as an exhibit to USAC's Form 10-QSB for the quarter ended September 30, 2002 (File No. 001-08675), are incorporated herein by this reference.
|
|
4.01
|
Key Employees 2000 Stock Plan, filed as an exhibit to USAC's Form S-8 Registration Statement filed on March 10, 2000 (File No. 333-32216) is incorporated herein by this reference.
|
Documents filed with USAC's Annual Report on Form 10-KSB for the year ended December 31, 1995 (File No. 001-08675), are incorporated herein by this reference:
|
10.10
|
Yellow Jacket Venture Agreement
|
|
10.11
|
Agreement Between Excel-Mineral USAC and Bobby C. Hamilton
|
|
10.12
|
Letter Agreement
|
|
10.13
|
Columbia-Continental Lease Agreement Revision
|
|
10.14
|
Settlement Agreement with Excel Mineral Company
|
|
10.15
|
Memorandum Agreement
|
|
10.16
|
Termination Agreement
|
37
|
10.17
|
Amendment to Assignment of Lease (Geosearch)
|
|
10.18
|
Series B Stock Certificate to Excel-Mineral Company, Inc.
|
|
10.19
|
Division Order and Purchase and Sale Agreement
|
|
10.20
|
Inventory and Sales Agreement
|
|
10.21
|
Processing Agreement
|
|
10.22
|
Release and settlement agreement between Bobby C. Hamilton and United States Antimony Corporation
|
|
10.23
|
Columbia-Continental Lease Agreement
|
|
10.24
|
Release of Judgment
|
|
10.25
|
Covenant Not to Execute
|
|
10.26
|
Warrant Agreements filed as an exhibit to USAC's Annual Report on Form 10-KSB for the year ended December 31, 1996 (File No. 001-08675), are incorporated herein by this reference
|
|
10.27
|
Letter from EPA, Region 10 filed as an exhibit to USAC's Quarterly Report on Form 10-QSB for the quarter ended September 30, 1997 (File No. 001-08675) is incorporated herein by this reference
|
|
10.28
|
Warrant Agreements filed as an exhibit to USAC's Annual Report on Form 10-KSB for the year ended December 31, 1997 (File No. 001-08675) are incorporated herein by this reference
|
|
10.30
|
Answer, Counterclaim and Third-Party Complaint filed as an exhibit to USAC's Quarterly Report on Forms 10-QSB for the quarter ended September 30, 1998 (File No. 001-08675) is incorporated herein by this reference
|
Documents filed with USAC's Annual Report on Form 10-KSB for the year ended December 31, 1998 (File No. 001-08675), are incorporated herein by this reference:
|
10.31
|
Warrant Issue-Al W. Dugan
|
|
10.32
|
Amendment Agreement
|
38
Documents filed with USAC's Quarterly Report on Form 10-QSB for the quarter ended March 31, 1999 (File No. 001-08675) is incorporated herein by this reference:
|
10.33
|
Warrant Issue-John C. Lawrence
|
|
10.34
|
PVS Termination Agreement
|
Documents filed as an exhibit to USAC's Form 10-KSB for the year ended December 31, 1999 (File No. 001-08675) are incorporated herein by this reference:
|
10.35
|
Maguire Settlement Agreement
|
|
10.36
|
Warrant Issue-Carlos Tejada
|
|
10.37
|
Warrant Issue-Al W. Dugan
|
|
10.38
|
Memorandum of Understanding with Geosearch Inc.
|
|
10.39
|
Factoring Agreement-Systran Financial Services Company
|
|
10.40
|
Mortgage to John C. Lawrence
|
|
10.41
|
Warrant Issue-Al W. Dugan filed as an exhibit to USAC's Quarterly Report on Form 10-QSB for the quarter ended March 31, 2000 (File No. 001-08675) is incorporated herein by this reference
|
|
10.42
|
Agreement between United States Antimony Corporation and Thomson Kernaghan & Co., Ltd. filed as an exhibit to USAC form 10-QSB for the quarter ended June 30, 2000 (File No. 001-08675) are incorporated herein by this reference
|
|
10.43
|
Settlement agreement and release of all claims between the Estate of Bobby C. Hamilton and United States Antimony Corporation filed as an exhibit to USAC form 10-QSB for the quarter ended June 30, 2000 (File No. 001-08675) are incorporated herein by this reference.
|
|
10.44
|
Supply Contracts with Fortune America Trading Ltd. filed as an exhibit to USAC form 10-QSB for the quarter ended June 30, 2000 (File No. 001-08675) are incorporated herein by this reference
|
|
10.45
|
Amended and Restated Agreements with Thomson Kernaghan & Co., Ltd, filed as an exhibit to amendment No. 3 to USAC's Form SB-2 Registration Statement (Reg. No. 333-45508), are incorporated herein by this reference
|
|
10.46
|
Purchase Order from Kohler Company, filed as an exhibit to amendment No. 4 to USAC's Form SB-2 Registration Statement (Reg. No. 333-45508) are incorporated herein by this reference
|
39
Documents filed as an exhibit to USAC's Form 10-QSB for the quarter ended June 30, 2002 (File No. 001-08675) are incorporated herein by this reference:
|
10.47
|
Bear River Zeolite Company Royalty Agreement, dated May 29, 2002
|
|
10.48
|
Grant of Production Royalty, dated June 1, 2002
|
|
10.49
|
Assignment of Common Stock of Bear River Zeolite Company, dated May 29, 2002
|
|
10.50
|
Agreement to Issue Warrants of USA, dated May 29, 2002
|
|
10.51
|
Secured convertible note payable - Delaware Royalty Company dated December 22, 2003*
|
|
10.52
|
Convertible note payable - John C. Lawrence dated December 22, 2003*
|
|
10.53
|
Pledge, Assignment and Security Agreement dated December 22, 2003*
|
|
10.54
|
Note Purchase Agreement dated December 22, 2003*
|
|
14.0
|
Code of Ethics*
|
|
31.1
|
Rule 13a-14(a)/15d-14(a) Certifications
Certification of John C. Lawrence*
|
|
32.1
|
Section 1350 Certifications
Certification of John C. Lawrence*
|
|
44.1
|
CERCLA Letter from U.S. Forest Service filed as an exhibit to USAC form 10-QSB for the quarter ended June 30, 2000 (File No. 001-08675) are incorporated herein by this reference and filed as an exhibit to USAC's Form 10-KSB for the year ended December 31, 1995 (File No. 1-8675) is incorporated herein by this reference
|
| 99.1 | Report from Audit Committee |
______________________
* Filed herewith.
Reports on Form 8-K
Item 5. Other Events - October 10, 2003.
40
SIGNATURES
Pursuant to the requirements of Section 13 or 15(b) of the Securities Exchange Act of 1934, the Registrant has duly caused this report to be signed on its behalf by the undersigned, thereunto duly authorized.
UNITED STATES ANTIMONY CORPORATION
(Registrant)
|
Date: March 17, 2014
|
By:
|
/s/ John C. Lawrence | |
| John C. Lawrence, President, Director, | |||
|
and Principal Executive Officer
|
|||
|
Date: March 17, 2014
|
By:
|
/s/ Daniel L. Parks | |
|
Daniel L. Parks, Chief Financial Officer
|
|||
|
Date: March 17, 2014
|
By:
|
/s/ Alicia Hill | |
|
Alicia Hill, Controller
|
|||
Pursuant to the requirements of the Securities Exchange Act of 1934, this report has been signed below by the following persons on behalf of the Registrant and in the capacities and on the dates indicated.
|
Date: March 17, 2014
|
By:
|
/s/ John C. Lawrence | |
|
John C. Lawrence, Director and President
|
|||
|
(Principal Executive)
|
|||
|
Date: March 17, 2014
|
By:
|
/s/ Whitney Ferer | |
|
Whitney Ferer, Director
|
|||
|
Date: March 17, 2014
|
By:
|
/s/ Gary D. Babbitt | |
|
Gary D. Babbitt, Director
|
|||
|
Date: March 17, 2014
|
By:
|
/s/ Hart Baitis | |
|
Hart Baitis, Director
|
|||
|
Date: March 17, 2014
|
By:
|
/s/ Russell Lawrence | |
|
Russell Lawrence, Director
|
|||
41
REPORT OF INDEPENDENT REGISTERED PUBLIC ACCOUNTING FIRM
To the Board of Directors and Shareholders of United States Antimony Corporation:
We have audited the accompanying consolidated balance sheets of United States Antimony Corporation and subsidiaries (“the Company”) as of December 31, 2013 and 2012, and the related consolidated statements of operations, changes in stockholders’ equity and cash flows for each of the three years in the period ended December 31, 2013. These consolidated financial statements are the responsibility of the Company’s management. Our responsibility is to express an opinion on the consolidated financial statements based on our audits.
We conducted our audits in accordance with the standards of the Public Company Accounting Oversight Board (United States). Those standards require that we plan and perform the audit to obtain reasonable assurance about whether the consolidated financial statements are free of material misstatement. An audit includes examining, on a test basis, evidence supporting the amounts and disclosures in the consolidated financial statements. An audit also includes assessing the accounting principles used and significant estimates made by management, as well as evaluating the overall financial statement presentation. We believe that our audits provide a reasonable basis for our opinion.
In our opinion, the consolidated financial statements referred to above present fairly, in all material respects, the consolidated financial position of United States Antimony Corporation and Subsidiaries as of December 31, 2013 and 2012, and the results of their consolidated operations and cash flows for each of the three years in the period ended December 31, 2013, in conformity with accounting principles generally accepted in the United States of America.
We also have audited, in accordance with the standards of the Public Company Accounting Oversight Board (United States), United States Antimony Corporation’s internal control over financial reporting as of December 31, 2013, based on criteria established in Internal Control – Integrated Framework issued by the Committee of Sponsoring Organizations of the Treadway Commission 1992 (COSO) and our report dated March 12, 2014, expressed an adverse opinion thereon.
/s/: DeCoria, Maichel & Teague, P.S.
DeCoria, Maichel & Teague, P.S.
Spokane, Washington
March 12, 2014
F-1
United States Antimony Corporation and Subsidiaries
Consolidated Balance Sheets
December 31, 2013 and 2012
|
ASSETS
|
||||||||
|
2013
|
2012
|
|||||||
|
Current assets:
|
||||||||
|
Cash and cash equivalents
|
$ | 20,343 | $ | 1,000,811 | ||||
|
Certificates of deposit
|
246,565 | 243,616 | ||||||
|
Accounts receivable, net
|
576,021 | 456,159 | ||||||
|
Inventories
|
1,034,770 | 1,192,189 | ||||||
|
Other current assets
|
32,865 | 170,529 | ||||||
|
Deferred tax asset
|
- | 39,824 | ||||||
|
Total current assets
|
1,910,564 | 3,103,128 | ||||||
|
Properties, plants and equipment, net
|
12,395,645 | 9,508,975 | ||||||
|
Restricted cash for reclamation bonds
|
75,501 | 75,251 | ||||||
|
Deferred tax asset
|
- | 189,627 | ||||||
|
Other assets
|
509,281 | 498,496 | ||||||
|
Total assets
|
$ | 14,890,991 | $ | 13,375,477 | ||||
|
LIABILITIES AND STOCKHOLDERS' EQUITY
|
||||||||
|
Current liabilities:
|
||||||||
|
Accounts payable
|
$ | 1,734,767 | $ | 1,181,225 | ||||
|
Due to factor
|
177,701 | 23,536 | ||||||
|
Accrued payroll, taxes and interest
|
124,937 | 89,541 | ||||||
|
Other accrued liabilities
|
50,745 | 30,220 | ||||||
|
Payables to related parties
|
15,549 | 17,522 | ||||||
|
Deferred revenue
|
110,138 | - | ||||||
|
Notes payable to bank
|
138,520 | - | ||||||
|
Long-term debt, current
|
126,984 | 280,597 | ||||||
|
Total current liabilities
|
2,479,341 | 1,622,641 | ||||||
|
Long-term debt, net of discount and current portion
|
1,002,215 | 157,466 | ||||||
|
Stock payable to directors for services
|
150,000 | - | ||||||
|
Asset retirement obligations and accrued reclamation costs
|
257,580 | 249,540 | ||||||
|
Total liabilities
|
3,889,136 | 2,029,647 | ||||||
|
Commitments and contingencies (Note 4 and 15)
|
||||||||
|
Stockholders' equity:
|
||||||||
|
Preferred stock $0.01 par value, 10,000,000 shares authorized:
|
||||||||
|
Series A: -0- shares issued and outstanding
|
- | - | ||||||
|
Series B: 750,000 shares issued and outstanding
|
||||||||
|
(liquidation preference $892,500 and $885,000,
|
||||||||
|
respectively)
|
7,500 | 7,500 | ||||||
|
Series C: 177,904 shares issued and outstanding
|
||||||||
|
(liquidation preference $97,847 both years)
|
1,779 | 1,779 | ||||||
|
Series D: 1,751,005 shares issued and outstanding
|
||||||||
|
(liquidation preference $4,796,731 and $4,755,582,
|
||||||||
|
respectively)
|
17,509 | 17,509 | ||||||
|
Common stock, $0.01 par value, 90,000,000 shares authorized;
|
||||||||
|
63,156,206 and 61,896,726 shares issued and outstanding, respectively
|
631,562 | 618,966 | ||||||
|
Additional paid-in capital
|
32,030,249 | 30,745,650 | ||||||
|
Accumulated deficit
|
(21,686,744 | ) | (20,045,574 | ) | ||||
|
Total stockholders' equity
|
11,001,855 | 11,345,830 | ||||||
|
Total liabilities and stockholders' equity
|
$ | 14,890,991 | $ | 13,375,477 | ||||
The accompanying notes are an integral part of these consolidated financial statements.
F-2
United States Antimony Corporation and Subsidiaries
Consolidated Statements of Operations
For the years ended December 31, 2013, 2012 and 2011
|
2013
|
2012
|
2011
|
||||||||||
|
REVENUES
|
$ | 11,020,829 | $ | 12,042,702 | $ | 13,118,090 | ||||||
|
COST OF REVENUES
|
11,061,799 | 11,007,802 | 11,443,892 | |||||||||
|
GROSS PROFIT (LOSS)
|
(40,970 | ) | 1,034,900 | 1,674,198 | ||||||||
|
OPERATING EXPENSES:
|
||||||||||||
|
General and administrative
|
736,312 | 810,369 | 428,092 | |||||||||
|
Salaries and benefits
|
336,000 | 284,483 | 149,671 | |||||||||
|
Professional fees
|
224,889 | 258,735 | 204,904 | |||||||||
|
TOTAL OPERATING EXPENSES
|
1,297,201 | 1,353,587 | 782,667 | |||||||||
|
INCOME (LOSS) FROM OPERATIONS
|
(1,338,171 | ) | (318,687 | ) | 891,531 | |||||||
|
OTHER INCOME (EXPENSE):
|
||||||||||||
|
Interest income
|
3,923 | 8,049 | 5,205 | |||||||||
|
Interest expense
|
(4,529 | ) | (2,691 | ) | - | |||||||
|
Bad debts
|
(1,170 | ) | - | - | ||||||||
|
Factoring expense
|
(71,772 | ) | (78,100 | ) | (154,206 | ) | ||||||
|
TOTAL OTHER INCOME (EXPENSE)
|
(73,548 | ) | (72,742 | ) | (149,001 | ) | ||||||
|
INCOME (LOSS) BEFORE INCOME TAXES
|
(1,411,719 | ) | (391,429 | ) | 742,530 | |||||||
|
INCOME TAXES:
|
||||||||||||
|
Income tax (expense) - current
|
- | - | (9,168 | ) | ||||||||
|
Income tax (expense) - deferred
|
(229,451 | ) | (167,107 | ) | (96,442 | ) | ||||||
|
TOTAL INCOME TAXES
|
(229,451 | ) | (167,107 | ) | (105,610 | ) | ||||||
|
NET INCOME (LOSS)
|
(1,641,170 | ) | (558,536 | ) | 636,920 | |||||||
|
Preferred dividends
|
(48,649 | ) | (48,649 | ) | (48,649 | ) | ||||||
|
Net income (loss) available to
|
||||||||||||
|
common stockholders
|
$ | (1,689,819 | ) | $ | (607,185 | ) | $ | 588,271 | ||||
|
Net income (loss) per share of
|
||||||||||||
|
common stock:
|
||||||||||||
|
Basic
|
$ | (0.03 | ) | $ | (0.01 | ) | $ | 0.01 | ||||
|
Diluted
|
$ | (0.03 | ) | $ | (0.01 | ) | $ | 0.01 | ||||
|
Weighted average shares outstanding:
|
||||||||||||
|
Basic
|
62,281,449 | 61,235,365 | 58,855,348 | |||||||||
|
Diluted
|
62,281,449 | 61,235,365 | 59,381,175 | |||||||||
The accompanying notes are an integral part of these consolidated financial statements.
F-3
United States Antimony Corporation and Subsidiaries
Consolidated Statements of Changes in Stockholders' Equity
For the years ended December 31, 2013, 2012, and 2011
|
Stock
|
Additional
|
|||||||||||||||||||||||||||||||
|
Total Preferred Stock
|
Common Stock
|
Subscriptions
|
Paid
|
Accumulated
|
||||||||||||||||||||||||||||
|
Shares
|
Amount
|
Shares
|
Amount
|
Receivable
|
In Capital
|
Deficit
|
Total
|
|||||||||||||||||||||||||
|
Balances, December 31, 2010
|
2,678,909 | $ | 26,788 | 56,307,382 | $ | 563,073 | $ | (82,563 | ) | $ | 24,505,331 | $ | (20,123,958 | ) | $ | 4,888,671 | ||||||||||||||||
|
Issuance of common stock for cash,
net of offering costs
|
3,041,918 | 30,419 | 1,129,798 | 1,160,217 | ||||||||||||||||||||||||||||
|
Payment received for outstanding stock subscriptions
|
82,563 | 82,563 | ||||||||||||||||||||||||||||||
|
Net income
|
636,920 | 636,920 | ||||||||||||||||||||||||||||||
|
Balances, December 31, 2011
|
2,678,909 | 26,788 | 59,349,300 | 593,492 | - | 25,635,129 | (19,487,038 | ) | 6,768,371 | |||||||||||||||||||||||
|
Issuance of common stock and warrants for cash, net of offering costs
|
2,156,334 | 21,563 | 4,603,200 | 4,624,763 | ||||||||||||||||||||||||||||
|
Issuance of common stock to Directors for services:
|
||||||||||||||||||||||||||||||||
|
Accrued in prior year
|
95,835 | 958 | 229,046 | 230,004 | ||||||||||||||||||||||||||||
|
For current year
|
69,992 | 700 | 220,528 | 221,228 | ||||||||||||||||||||||||||||
|
Issuance of common stock for cash
through exercise of warrants
|
225,265 | 2,253 | 57,747 | 60,000 | ||||||||||||||||||||||||||||
|
Net loss
|
(558,536 | ) | (558,536 | ) | ||||||||||||||||||||||||||||
|
Balances, December 31, 2012
|
2,678,909 | 26,788 | 61,896,726 | 618,966 | - | 30,745,650 | (20,045,574 | ) | 11,345,830 | |||||||||||||||||||||||
|
Issuance of common stock and warrants for cash, net of offering costs
|
1,139,480 | 11,396 | 1,135,799 | 1,147,195 | ||||||||||||||||||||||||||||
|
Issuance of common stock and
warrants for notes payable
|
120,000 | 1,200 | 148,800 | 150,000 | ||||||||||||||||||||||||||||
|
Net loss
|
(1,641,170 | ) | (1,641,170 | ) | ||||||||||||||||||||||||||||
|
Balances, December 31, 2013
|
2,678,909 | $ | 26,788 | 63,156,206 | $ | 631,562 | $ | - | $ | 32,030,249 | $ | (21,686,744 | ) | $ | 11,001,855 | |||||||||||||||||
The accompanying notes are an integral part of these consolidated financial statements.
F-4
United States Antimony Corporation and Subsidiaries
Consolidated Statements of Cash Flows
For the years ended December 31, 2013, 2012, and 2011
|
Cash Flows From Operating Activities:
|
2013
|
2012
|
2011
|
|||||||||
|
Net income (loss)
|
$ | (1,641,170 | ) | $ | (558,536 | ) | $ | 636,920 | ||||
|
Adjustments to reconcile net income (loss) to net cash provided (used) by operating activities:
|
||||||||||||
|
Depreciation and amortization
|
688,738 | 472,990 | 405,746 | |||||||||
|
Accretion of asset retirement obligation
|
8,040 | 8,040 | - | |||||||||
|
Common stock issued for services
|
- | 221,228 | - | |||||||||
|
Common stock payable to directors for services
|
150,000 | - | 230,004 | |||||||||
|
Deferred income taxes
|
229,451 | 167,107 | 96,442 | |||||||||
|
Change in:
|
||||||||||||
|
Accounts receivable, net
|
(119,862 | ) | 982,405 | (693,146 | ) | |||||||
|
Inventories
|
157,419 | (125,376 | ) | (923,522 | ) | |||||||
|
Other current assets
|
137,664 | (114,321 | ) | (37,953 | ) | |||||||
|
Other assets
|
(13,984 | ) | (443,730 | ) | 40,000 | |||||||
|
Accounts payable
|
474,438 | 186,283 | 584,698 | |||||||||
|
Accrued payroll, taxes and interest
|
35,396 | (52,387 | ) | 51,425 | ||||||||
|
Other accrued liabilities
|
20,525 | (89,072 | ) | (100,836 | ) | |||||||
|
Deferred revenue
|
110,138 | (43,760 | ) | 43,760 | ||||||||
|
Payables to related parties
|
(1,973 | ) | (84,452 | ) | 83,914 | |||||||
|
Net cash provided by operating activities
|
234,820 | 526,419 | 417,452 | |||||||||
|
Cash Flows From Investing Activities:
|
||||||||||||
|
Purchase of certificates of deposit
|
- | (244,090 | ) | (466 | ) | |||||||
|
Purchase of properties, plants and equipment
|
(2,733,762 | ) | (3,269,811 | ) | (2,238,975 | ) | ||||||
|
Net cash used by investing activities
|
(2,733,762 | ) | (3,513,901 | ) | (2,239,441 | ) | ||||||
|
Cash Flows From Financing Activities:
|
||||||||||||
|
Net proceeds from (payments to) factor
|
154,164 | (123,053 | ) | 146,589 | ||||||||
|
Proceeds from sale of common stock and warrants, net of offering costs
|
1,147,195 | 4,624,763 | 1,160,217 | |||||||||
|
Issuance of common stock pursuant to exercise of warrants
|
- | 60,000 | - | |||||||||
|
Proceeds from notes payable to bank
|
138,520 | - | - | |||||||||
|
Principal payments of long-term debt
|
(273,405 | ) | (464,936 | ) | (124,722 | ) | ||||||
|
Proceeds from long term debt
|
352,000 | - | - | |||||||||
|
Payments received on stock subscription agreements
|
- | - | 82,563 | |||||||||
|
Change in checks issued and payable
|
- | (113,908 | ) | 113,908 | ||||||||
|
Net cash provided by financing activities
|
1,518,474 | 3,982,866 | 1,378,555 | |||||||||
|
NET INCREASE (DECREASE) IN CASH AND CASH EQUIVALENTS
|
(980,468 | ) | 995,384 | (443,434 | ) | |||||||
|
Cash and cash equivalents at beginning of year
|
1,000,811 | 5,427 | 448,861 | |||||||||
|
Cash and cash equivalents at end of year
|
$ | 20,343 | $ | 1,000,811 | $ | 5,427 | ||||||
|
SUPPLEMENTAL DISCLOSURE OF CASH FLOW INFORMATION:
|
||||||||||||
|
Interest paid in cash (net of amount capitailzed)
|
$ | 2,529 | $ | 2,691 | $ | - | ||||||
|
Noncash investing and financing activities:
|
||||||||||||
|
Properties, plants & equipment acquired with long-term debt
|
$ | 762,541 | $ | 665,150 | $ | 234,775 | ||||||
|
Properties, plants & equipment acquired with accounts payable
|
$ | 79,105 | $ | - | $ | - | ||||||
|
Common stock and warrants issued for note payable
|
$ | 150,000 | $ | - | $ | - | ||||||
The accompanying notes are an integral part of these consolidated financial statements.
F-5
United States Antimony Corporation and Subsidiaries
Notes to Consolidated Financial Statements
December 31, 2013, 2012 and 2011
1.Background of Company and Basis of Presentation
AGAU Mines, Inc., predecessor of United States Antimony Corporation ("USAC" or "the Company"), was incorporated in June 1968 as a Delaware corporation to mine gold and silver. USAC was incorporated in Montana in January 1970 to mine and produce antimony products. In June 1973, AGAU Mines, Inc. was merged into USAC. In December 1983, the Company suspended its antimony mining operations when it became possible to purchase antimony raw materials more economically from foreign sources. The principal business of the Company has been the production and sale of antimony products.
During 2000, the Company formed a 75% owned subsidiary, Bear River Zeolite Company ("BRZ"), to mine and market zeolite and zeolite products from a mineral deposit in southeastern Idaho. In 2001, an operating plant was constructed at the zeolite site and zeolite production and sales commenced. During 2002, the Company acquired the remaining 25% of BRZ and continued to produce and sell zeolite products.
During 2005, the Company formed a 100% owned subsidiary, Antimonio de Mexico S.A. de C.V. (“AM”), to explore and develop potential antimony properties in Mexico.
During 2006, the Company acquired 100% ownership in United States Antimony, Mexico S.A. de C.V. (“USAMSA”), which became a wholly-owned subsidiary of the Company.
2.Concentrations of Risk
|
Sales to Three
|
For the Year Ended
|
|||||||||||
|
Largest Customers
|
December 31,
2013
|
December 31,
2012
|
December 31,
2011
|
|||||||||
|
Alpha Gary Corporation
|
$ | 3,700,945 | $ | 3,245,612 | $ | 1,771,173 | ||||||
|
General Electric
|
781,200 | - | - | |||||||||
|
Kohler Corporation
|
2,654,215 | 2,286,938 | 2,941,143 | |||||||||
|
Polymer Products Inc.
|
- | 1,119,055 | 2,887,862 | |||||||||
| $ | 7,136,360 | $ | 6,651,605 | $ | 7,600,178 | |||||||
|
% of Total Revenues
|
64.75 | % | 55.23 | % | 57.94 | % | ||||||
|
Three Largest
|
For the Year Ended
|
|||||||||||
|
Accounts Receivable
|
December 31,
2013
|
December 31,
2012
|
December 31,
2011
|
|||||||||
|
Kohler Corporation
|
$ | 202,019 | $ | 299,273 | ||||||||
|
Alpha Gary Corporation
|
42,778 | $ | 194,005 | 254,940 | ||||||||
|
GE Lighting (LPC)
|
- | - | 252,000 | |||||||||
|
Teck American Inc
|
88,329 | - | - | |||||||||
|
Quantum Remediation
|
- | 101,149 | - | |||||||||
|
Scutter Enterprises
|
- | 41,512 | - | |||||||||
| $ | 333,126 | $ | 336,666 | $ | 806,213 | |||||||
|
% of Total Receivables
|
57.83 | % | 73.80 | % | 64.20 | % | ||||||
The Company's revenues from antimony sales are strongly influenced by world prices for such commodities, which fluctuate and are affected by numerous factors beyond the Company's control, including inflation and worldwide forces of supply and demand. The aggregate effect of these factors is not possible to predict accurately.
F-6
United States Antimony Corporation and Subsidiaries
Notes to Consolidated Financial Statements
December 31, 2013, 2012 and 2011
3.Summary of Significant Accounting Policies
Principles of Consolidation
The Company's consolidated financial statements include the accounts of BRZ, USAMSA and AM, all wholly-owned subsidiaries. Intercompany balances and transactions are eliminated in consolidation.
Use of Estimates
The preparation of financial statements in conformity with accounting principles generally accepted in the United States of America requires management to make estimates and assumptions that affect the reported amounts of assets and liabilities and disclosure of contingent assets and liabilities at the date of the financial statements and the reported amounts of revenues and expenses during the reporting period. Significant and critical estimates include property, plant and equipment impairment, accounts receivable allowance, deferred income taxes, environmental remediation liabilities and asset retirement obligations. Actual results could differ from those estimates.
Reclassifications
Certain reclassifications have been made to the 2012 and 2011 financial statements in order to conform to the 2013 presentation. These reclassifications have no effect on net income (loss), cash flows, total assets or stockholders' equity as previously reported.
Cash and Cash Equivalents
The Company considers cash in banks and investments with original maturities of three months or less when purchased to be cash equivalents.
Restricted Cash
Restricted cash at December 31, 2013 and 2012 consists of cash held for reclamation performance bonds, and is held as certificates of deposit with financial institutions.
Accounts Receivable
Accounts receivable are stated at the amount that management expects to collect from outstanding balances. Management provides for probable uncollectible amounts through an allowance for doubtful accounts. Changes to the allowance for doubtful accounts are based on management’s judgment, considering historical write-offs, collections and current credit conditions. Balances which remain outstanding after management has used reasonable collection efforts are written off through a charge to the allowance for doubtful accounts and a credit to the applicable accounts receivable. Payments received on receivables subsequent to being written off are considered a bad debt recovery.
Inventories
Inventories at December 31, 2013 and 2012, consisted primarily of finished antimony products, antimony metal, antimony concentrates, antimony ore, and finished zeolite products that are stated at the lower of first-in, first-out cost or estimated net realizable value. Finished antimony products, antimony metal and finished zeolite products costs include raw materials, direct labor and processing facility overhead costs and freight allocated based on production quantity. Stockpiled ore is carried at the lower of average cost or net realizable value. Since the Company's antimony inventory is a commodity with a sales value that is subject to world prices for antimony that are beyond the Company's control, a significant change in the world market price of antimony could have a significant effect on the net realizable value of inventories. The Company periodically reviews its inventories to identify excess and obsolete inventories and to estimate reserves for obsolete inventories as necessary to reflect inventories at net realizable value.
F-7
United States Antimony Corporation and Subsidiaries
Notes to Consolidated Financial Statements
December 31, 2013, 2012 and 2011
3.Summary of Significant Accounting Policies, continued:
Properties, Plants and Equipment
Properties, plants and equipment are stated at historical cost and are depreciated using the straight-line method over estimated useful lives of five to twenty-five years. Vehicles and office equipment are stated at cost and are depreciated using the straight-line method over estimated useful lives of three to seven years. Maintenance and repairs are charged to operations as incurred. Betterments of a major nature are capitalized. Expenditures for new property, plant, equipment, and improvements that extend the useful life or functionality of the asset are capitalized. The Company capitalized $3,575,408 and $3,934,961 in plant construction and other capital costs for the years ended December 31, 2013 and 2012, respectively. These amounts include capitalized interest of $24,395 and $14,313, respectively. When assets are retired or sold, the costs and related accumulated depreciation are eliminated from the accounts and any resulting gain or loss is reflected in operations.
Mineral properties are amortized over the estimated economic life of the mineral resource using the straight-line method or the units-of-production method, based upon estimated units of mineral resource.
Management of the Company periodically reviews the net carrying value of all of its long-lived assets. These reviews consider the net realizable value of each asset or group to determine whether a permanent impairment in value has occurred and the need for any asset write-down. An impairment loss is recognized when the estimated future cash flows (undiscounted and without interest) expected to result from the use of an asset are less than the carrying amount of the asset. Measurement of an impairment loss is based on the estimated fair value of the asset if the asset is expected to be held and used.
Translations of Foreign Currencies
All amounts are presented in United States (US) Dollars, and the US Dollar is the functional currency of the Company and its foreign subsidiaries. All transactions are carried out in US Dollars, or translated at the time of the transaction. There are no material accounts carried in foreign currencies that would require translation at year end.
Mineral Rights
The cost to obtain the legal right to explore, extract and retain at least a portion of the benefits from mineral deposits are capitalized as mineral rights in the year of acquisition. These capitalized costs will be amortized on the statement of operations using a straight line method over the expected life when placed into production. Mineral rights are assessed for impairment when facts and circumstances indicate that the potential for impairment exists. No impairment has been indicated for the years ended December 31, 2013 or 2012 as a result of this assessment. Mineral rights are subject to write down in the period the property is abandoned.
Exploration and Development
The Company records exploration costs as operating expenses in the period they occur, and capitalizes development costs on discrete mineralized bodies that have proven reserves in compliance with SEC Industry Guide 7, and are in development or production.
Reclamation and Remediation
All of the Company's mining operations are subject to reclamation and remediation requirements. Minimum standards for mine reclamation have been established by various governmental agencies. Costs are estimated based primarily upon environmental and regulatory requirements and are accrued. The liability for reclamation is classified as current or noncurrent based on the expected timing of expenditures. Reclamation differs from an asset retirement obligation in that no associated asset is recorded in the case of reclamation liabilities.
F-8
United States Antimony Corporation and Subsidiaries
Notes to Consolidated Financial Statements
December 31, 2013, 2012 and 2011
3.Summary of Significant Accounting Policies, continued:
It is reasonably possible that because of uncertainties associated with defining the nature and extent of environmental contamination, application of laws and regulations by regulatory authorities, and changes in remediation technology, the ultimate cost of remediation and reclamation could change in the future. The Company continually reviews its accrued liabilities for such remediation and reclamation costs as evidence becomes available indicating that its remediation and reclamation liability has changed.
The Company records the fair value of an asset retirement obligation as a liability in the period in which the Company incurs a legal obligation for the retirement of long-lived assets, it is probable that such costs will be incurred, and they are reasonably estimable. A corresponding asset is also recorded and depreciated over the life of the assets on a straight line basis. After the initial measurement of the asset retirement obligation, the liability will be adjusted at the end of each reporting period to reflect changes in the estimated future cash flows underlying the obligation. Determination of any amounts recognized upon adoption is based upon numerous estimates and assumptions, including future retirement costs, future inflation rates, and the credit-adjusted risk-free interest rates.
Revenue Recognition
Sales of antimony and zeolite products are recorded upon shipment and when title passes to the customer. Prepayments received from customers prior to the time that products are processed and shipped are recorded as deferred revenue. When the related products are shipped, the amount recorded as deferred revenue is recognized as revenue. The Company's sales agreements provide for no product returns or allowances.
Sales of precious metals are recognized when pervasive evidence of an arrangement exists, the price is reasonably determinable, the product has been delivered, no obligations remain, and collection is reasonably assured.
Common Stock Issued for Consideration Other than Cash
All transactions in which goods or services are received for the issuance of shares of the Company’s common stock are accounted for based on the fair value of the consideration received or the fair value of the common stock issued, whichever is more readily determinable.
Income Taxes
Income taxes are accounted for under the liability method. Under this method, deferred income tax liabilities or assets are determined at the end of each period using the tax rate expected to be in effect when the taxes are actually paid or recovered. A valuation allowance is recognized on deferred tax assets when it is more likely than not that some or all of these deferred tax assets will not be realized.
The Company applies generally accepted accounting principles for recognition of uncertainty in income taxes and prescribing a recognition threshold and measurement attribute for the recognition and measurement of a tax position taken or expected to be taken in a tax return.
Allowance for Doubtful Accounts
The allowance for doubtful accounts is based on management’s regular evaluation of individual customer’s receivables and consideration of a customer’s financial condition and credit history. Trade receivables are written off when deemed uncollectible. Recoveries of trade receivables previously written off are recorded when received. Interest is not charged on past due accounts.
F-9
United States Antimony Corporation and Subsidiaries
Notes to Consolidated Financial Statements
December 31, 2013, 2012 and 2011
3.Summary of Significant Accounting Policies, continued:
Income (Loss) Per Common Share
Basic earnings per share is calculated by dividing net income (loss) available to common stockholders by the weighted average number of common shares outstanding during the period. Diluted earnings per share is calculated based on the weighted average number of common shares outstanding during the period plus the effect of potentially dilutive common stock equivalents, including warrants to purchase the Company's common stock and convertible preferred stock. Management has determined that the calculation of diluted earnings per share for the years ended December 31, 2013, 2012 and 2011, adds none, none, and 525,827 shares, respectively, to basic weighted average shares, related to common stock purchase warrants. Shares related to warrants and convertible preferred stock were not added to the weighted average of common stock for 2013 and 2012 because the results would have been anti-dilutive.
As of December 31, 2013, 2012 and 2011, potentially dilutive common stock equivalents not included in the calculation of diluted earnings per share are as follows:
|
December 31,
2013
|
December 31,
2012
|
December 31,
2011
|
||||||||||
|
Warrants
|
2,489,407 | 1,934,667 | 74,173 | |||||||||
|
Convertible preferred stock
|
1,751,005 | 1,751,005 | 1,751,005 | |||||||||
|
Total possible dilution
|
4,240,412 | 3,685,672 | 1,825,178 | |||||||||
The following table represents the calculation of basic and diluted weighted average shares outstanding for December 31, 2013, 2012 and 2011:
|
December 31,
2013
|
December 31,
2012
|
December 31,
2011
|
||||||||||
|
Warrants
|
2,489,407 | 1,934,667 | 600,000 | |||||||||
|
Convertible preferred stock
|
1,751,005 | 1,751,005 | 1,751,005 | |||||||||
|
Total possible dilution
|
4,240,412 | 3,685,672 | 2,351,005 | |||||||||
|
Anti - dilutive shares
|
(4,240,412 | ) | (3,685,672 | ) | (1,825,178 | ) | ||||||
|
Dilutive effect for earnings per share
|
0 | 0 | 525,827 | |||||||||
|
Weighted average shares outstanding-basic
|
62,281,449 | 61,235,365 | 58,855,348 | |||||||||
|
Weighted average shares outstanding-diluted
|
62,281,449 | 61,235,365 | 59,381,175 | |||||||||
Fair Value of Financial Instruments
The Company’s financial instruments include cash and cash equivalents, certificates of deposits, restricted cash, due to factor, and long-term debt. The carrying value of certificates of deposit, restricted cash, and due to factor approximates fair value based on the contractual terms of those instruments.
Fair Value Measurements
ASC 820, “Fair Value Measurements and Disclosures”, requires an entity to maximize the use of observable inputs and minimize the use of unobservable inputs when measuring fair value. ASC 820 establishes a fair value hierarchy based on the level of independent, objective evidence surrounding the inputs used to measure fair value. A financial instrument’s categorization within the fair value hierarchy is based upon the lowest level of input that is significant to the fair value measurement. ASC 820 prioritizes the inputs into three levels that may be used to measure fair value.
F-10
United States Antimony Corporation and Subsidiaries
Notes to Consolidated Financial Statements
December 31, 2013, 2012 and 2011
3.Summary of Significant Accounting Policies, continued:
|
●
|
Level 1: Applies to assets or liabilities for which there are quoted prices in active markets for identical assets or liabilities.
|
|
●
|
Level 2: Applies to assets or liabilities for which there are inputs other than quoted prices that are observable for the asset or liability such as quoted prices for similar assets or liabilities in active markets; quoted prices for identical assets or liabilities in markets with insufficient volume or infrequent transactions (less active markets); or model-derived valuations in which significant inputs are observable or can be derived principally from, or corroborated by, observable market data.
|
|
●
|
Level 3: Applies to assets or liabilities for which there are unobservable inputs to the valuation methodology that are significant to the measurement of the fair value of the assets or liabilities.
|
The table below sets forth our financial assets that were accounted for at fair value on a recurring basis as of December 31, 2013 and 2012, respectively, and the fair value calculation input hierarchy level that we have determined applies to each asset category.
|
Input
|
|||||||||
|
Hierarchy
|
|||||||||
|
Assets:
|
2013
|
2012
|
Level
|
||||||
|
Cash and cash equivalents
|
$ | 20,343 | $ | 1,000,811 |
Level I
|
||||
|
Certificates of deposit
|
246,565 | 243,616 |
Level I
|
||||||
|
Restricted cash
|
75,501 | 75,251 |
Level I
|
||||||
|
Total Cash
|
$ | 342,409 | $ | 1,319,678 | |||||
4. Accounts Receivable and Due to Factor
The Company factors designated trade receivables pursuant to a factoring agreement with LSC Funding Group L.C., an unrelated factor (the “Factor”). The agreement specifies that eligible trade receivables are factored with recourse. The performance of all obligations and payments to the factoring company is personally guaranteed by John C. Lawrence, the Company’s President and Chairman of the Board of Directors. Selected trade receivables are submitted to the factor, and the Company receives 85% of the face value of the receivable by wire transfer. Upon payment by the customer, the remainder of the amount due is received from the Factor, less a one-time servicing fee of 2% for the receivables factored. This servicing fee is recorded on the consolidated statement of operations in the period of sale to the factor.
Trade receivables assigned to the Factor are carried at the original invoice amount less an estimate made for doubtful accounts. Under the terms of the recourse provision, the Company is required to reimburse the Factor, upon demand, for factored receivables that are not paid on time. Accordingly, these receivables are accounted for as a secured financing arrangement and not as a sale of financial assets.
Receivables, net of allowances, are presented as current assets and the amount potentially due to the Factor is presented as a secured financing in current liabilities.
|
Accounts Receivble
|
December 31,
2013
|
December 31,
2012
|
||||||
|
Accounts receivable - non factored
|
$ | 402,351 | $ | 436,654 | ||||
|
Accounts receivable - factored with recourse
|
177,701 | 23,536 | ||||||
|
less allowance for doubtful accounts
|
(4,031 | ) | (4,031 | ) | ||||
|
Accounts receivable - net
|
$ | 576,021 | $ | 456,159 | ||||
F-11
United States Antimony Corporation and Subsidiaries
Notes to Consolidated Financial Statements
December 31, 2013, 2012 and 2011
4. Accounts Receivable and Due to Factor, continued:
The factoring agreement requires the Company to pay a financing fee equal to 2% of the face amount of receivables sold. Factoring fees paid by the Company during the years ended December 31, 2013, 2012 and 2011 were $71,772, $78,100, and $154,206, respectively. For the years ended December 31, 2013, 2012, and 2011, net accounts receivable of approximately $3.28 million, $3.80 million, and $7.39 million, respectively, were sold under the agreement.
Proceeds from the sales were used to fund inventory purchases and operating expenses. The agreement is for a term of one year with automatic renewal for additional one-year terms.
5.Inventories
The major components of the Company's inventories at December 31, 2013 and 2012 were as follows:
|
2013
|
2012
|
|||||||
|
Antimony Metal
|
$ | 33,850 | $ | 152,821 | ||||
|
Antimony Oxide
|
535,251 | 295,613 | ||||||
|
Antimony Concentrates
|
93,190 | 46,008 | ||||||
|
Antimony Ore
|
106,519 | 500,192 | ||||||
|
Total antimony
|
768,810 | 994,634 | ||||||
|
Zeolite
|
265,960 | 197,555 | ||||||
| $ | 1,034,770 | $ | 1,192,189 | |||||
At December 31, 2013 and 2012, antimony metal consisted principally of recast metal from antimony-based compounds, and metal purchased from foreign suppliers. Antimony oxide inventory consisted of finished product oxide held at the Company's plant. Antimony concentrates and ore was held primarily at sites in Mexico and is essentially raw material, carried at cost. The Company's zeolite inventory consists of salable zeolite material held at BRZ's Idaho mining and production facility, and is carried at cost.
6.Properties, Plants and Equipment
The major components of the Company's properties, plants and equipment at December 31, 2013 and 2012 are shown below. Approximately $2.14 million and $1.40 million of capitalized costs at December 31, 2013 and 2012, respectively, related primarily to the construction of a natural gas pipeline and an antimony mill in Mexico, have not yet been placed in service and, therefore, have not been subject to depreciation for those years.
|
2013
|
USAC
|
MEXICO
|
BRZ
|
TOTAL
|
||||||||||||
|
Equipment
|
$ | 749,493 | $ | 4,952,524 | $ | 3,041,934 | $ | 8,743,951 | ||||||||
|
Buildings
|
242,186 | 787,917 | 349,946 | 1,380,049 | ||||||||||||
|
Mineral Rights
|
- | 916,522 | - | 916,522 | ||||||||||||
|
Land & Other
|
3,270,248 | 3,123,067 | - | 6,393,315 | ||||||||||||
| 4,261,927 | 9,780,030 | 3,391,880 | 17,433,837 | |||||||||||||
|
Accumulated Depreciation
|
(2,333,484 | ) | (987,621 | ) | (1,717,087 | ) | (5,038,192 | ) | ||||||||
| $ | 1,928,443 | $ | 8,792,409 | $ | 1,674,793 | $ | 12,395,645 | |||||||||
|
2012
|
USAC
|
MEXICO
|
BRZ
|
TOTAL
|
||||||||||||
|
Equipment
|
$ | 668,811 | $ | 3,086,510 | $ | 2,870,773 | $ | 6,626,094 | ||||||||
|
Buildings
|
241,297 | 776,374 | 344,884 | 1,362,555 | ||||||||||||
|
Mineral Rights
|
- | 786,088 | - | 786,088 | ||||||||||||
|
Land & Other
|
3,251,660 | 1,832,032 | - | 5,083,692 | ||||||||||||
| 4,161,768 | 6,481,004 | 3,215,657 | 13,858,429 | |||||||||||||
|
Accumulated Depreciation
|
(2,271,910 | ) | (578,812 | ) | (1,498,732 | ) | (4,349,454 | ) | ||||||||
| $ | 1,889,858 | $ | 5,902,192 | $ | 1,716,925 | $ | 9,508,975 | |||||||||
F-12
United States Antimony Corporation and Subsidiaries
Notes to Consolidated Financial Statements
December 31, 2013, 2012 and 2011
7. Asset Retirement Obligation
During 2011, the Company assessed the obligation for removal and remediation costs relating to its plants and mine in Mexico. Management assigned a cost to the expected work involved in complying with the requirements of the Mexico operating permits. Management applied, based on a 20 year life, a cost inflation factor, and then discounted that cost to a current net present value based on a discount rate of 6% (management’s estimate of its credit-adjusted interest rate). Management determined a future cost in 2031 of approximately $430,000 with a net present value of $134,000.
|
Balance December 31, 2010
|
$ | - | ||
|
Incurred during 2011
|
134,000 | |||
|
Balance December 31, 2011
|
134,000 | |||
|
Accretion during 2012
|
8,040 | |||
|
Balance December 31, 2012
|
142,040 | |||
|
Accretion during 2013
|
8,040 | |||
|
Balance December 31, 2013
|
$ | 150,080 |
The asset retirement obligation liability is combined with reclamation obligations for Idaho and Montana operations of $107,500 at December 31, 2013.
8.Other Assets
Guadalupe
On March 7, 2012 and on April 4, 2012 the Company entered into a supply agreement and a loan agreement, respectively, (“the Agreements”) with several individuals collectively referred to as ‘Grupo Roga’ or ‘Guadalupe.’ The individuals are the holders of mining concessions located in Mexico in which the Company is interested. The supply agreement specified that the Company would advance monies to Guadalupe for specific expenses, including repairs of road and payment of mining taxes. In addition, the Company agreed to purchase antimony ore mined at Guadalupe and pay for mining and trucking costs incurred with the condition that the ore maintain a grade of 3% or more of recoverable antimony. The advances are to be repaid by deducting 10% from the value of each antimony ore shipment. During 2012 and 2013, the recoverable grade of antimony was less than 3% and the amounts due the Company from Guadalupe increased as a result of recoverable antimony shortfalls.
The Agreements with Guadalupe granted the Company an option to purchase the concessions outright for $2,000,000. The Agreements also provide that in event of a breach of the terms by Guadalupe that the Company has a right to enter the property and take possession of the mining concessions. The advances are collateralized by a mortgage on the concessions. As of December 31, 2013 and 2012, the Company had cumulative loans and advances due from Guadalupe of $489,281 and $271,036, respectively, included in its other assets.
Soyatal
On October 30, 2009, the Company entered into a supply agreement with the owners of the Soyatal concessions similar to that of Guadalupe. During the term of the supply agreement the Company funded certain of Soyatal’s equipment purchases, tax payments, labor costs, milling and trucking costs and other expenses incurred in the Soyatal mining operations that totaled approximately $140,000. In addition to the advances for mining costs, the Company purchased antimony ore from Soyatal that failed to meet agreed upon antimony metal recoveries and resulted in approximately $320,000 of excess advances paid to Soyatal. On April 4, 2012, the Company negotiated an option to purchase the Soyatal properties for $1,500,000, and made a deposit on the option of $55,000. At December 31, 2012, the Company had recorded a cumulative total of $379,460 due from Soyatal in its current and long-term other assets.
F-13
United States Antimony Corporation and Subsidiaries
Notes to Consolidated Financial Statements
December 31, 2013, 2012 and 2011
8.Other Assets, continued:
Soyatal, continued:
At December 31, 2012, the Company recorded a note payable liability based upon the present value of the non-interest bearing payments due Soyatal in connection with an option the Company had to purchase the Soyatal property for $1.5 million. In connection with finalizing the Company’s exercise of its option to purchase the Soyatal property and the pending definitive Purchase and Sale Agreement, management determined during the third quarter of 2013, that no recourse note payable would be executed and the payments to Soyatal will be recognized as they become due in accordance with the final agreement, and are paid. As a result, the Company’s interest in the Soyatal mineral property reflects only the payments made to date in accordance with the terms of the option agreement. This change in the terms of the agreement resulted in a reversal of the note payable and a corresponding reduction of mineral property assets of $1,067,431 at December 31, 2012. The December 31, 2012 balance sheet has been revised to reflect such.
On August 5, 2013, the Company notified the owners of Soyatal that it was exercising the option to purchase the Soyatal property. The option exercise agreement allowed the Company to apply all amounts previously due the Company (the “Purchase Price Credits”) by Soyatal of $420,411 to the purchase price consideration. At December 31, 2013, the Company had Purchase Price Credits of approximately $325,000 which can be used as payments on the note at the rate of $100,000 per year until gone. The Company is obligated to make payments of $200,000 annually through 2020, and a final payment of $100,000 is due in 2021. The debt payable for the Soyatal mine is non-interest bearing. The Company recorded the debt and the related Soyatal mine asset by determining the net present value of the contractual stream of payments due using a 6% discount rate. The resulting discount on the Soyatal debt is approximately $212,000 at December 31, 2013, and is netted against the debt payable resulting in a discounted amount of $762,541, at December 31, 2013. The discount will be amortized to interest expense using the effective interest method over the life of the debt.
9. Notes Payable to Bank
At December 31, 2013, the Company had the following notes payable to the bank:
|
Promissory note payable to First Security Bank of Missoula,
bearing interest at 3.150%, maturing February 27, 2014,
payable on demand, collateralized by a lien on Certificate of Deposit number 48614
|
$ | 70,952 | ||
|
Promissory note payable to First Security Bank of Missoula,
bearing interest at 3.150%, maturing February 27, 2014,
payable on demand, collateralized by a lien on Certificate of Deposit number 48615
|
$ | 67,568 | ||
|
Total notes payable to bank
|
$ | 138,520 |
These notes are personally guaranteed by John C. Lawrence the Company’s President and Chairman of the Board of Directors. The Company did not have any notes payable to bank at December 31, 2012.
F-14
United States Antimony Corporation and Subsidiaries
Notes to Consolidated Financial Statements
December 31, 2013, 2012 and 2011
10. Long-Term Debt:
|
Long-Term debt at December 31, 2013 and 2012, is as follows:
|
||||||||
|
2013
|
2012
|
|||||||
|
Note payable to Thermo Fisher Financial Co., bearing interest
at 5.67%; payable in monthly installments of $3,522; maturing
September 2013; collateralized by equipment.
|
$ | - | $ | 34,310 | ||||
|
Note payable to Thermo Fisher Financial Co., bearing interest
at 8.54%; payable in monthly installments of $2,792; maturing
December 2013; collateralized by equipment.
|
5,583 | 30,708 | ||||||
|
Note payable to Stearns Bank, bearing interest
at 6.9%; payable in monthly installments of $3,555; maturing
December 2014; collateralized by equipment.
|
41,117 | 79,500 | ||||||
|
Note payable to Western States Equipment Co., bearing interest
at 6.15%; payable in monthly installments of $2,032; maturing
June 2015; collateralized by equipment.
|
34,861 | 56,390 | ||||||
|
Note payable to CNH Capital America, LLC, bearing interest at 4.5%;
payable in monthly installments of $505; maturing June 2013; collateralized by equipment.
|
- | 3,478 | ||||||
|
Note payable to Catepillar Financial, bearing interest at 5.95%;
payable in monthly installments of $827; maturing September 2015;
collateralized by equipment.
|
16,440 | 25,823 | ||||||
|
Note payable to GE Capital, bearing interest at 2.25%; payable in
monthly installments of $359; maturing July 2013; collateralized by
equipment.
|
- | 2,847 | ||||||
|
Note payable toDe Lage Landen Financial Services, bearing interest at 5.30%;
payable in monthly installments of $549; maturing March 2016; collateralized by equipment.
|
13,945 | 19,629 | ||||||
|
Note payable to Phyllis Rice, bearing interest at 1%; payable in monthly installments of $2,000; maturing
March 2015; collateralized by equipment.
|
33,808 | 55,365 | ||||||
|
Note payable to De Lage Landen Financial Services,
bearing interest at 5.12%; payable in monthly installments of $697;
maturing December 2014; collateralized by equipment.
|
8,797 | 16,496 | ||||||
|
Note payable to Catepillar Financial, bearing interest
at 6.15%; payable in monthly installments of $766; maturing
August 2014; collateralized by equipment.
|
5,921 | 14,535 | ||||||
|
Note payable to De Lage Landen Financial Services,
bearing interest at 5.28%; payable in monthly installments of $709;
maturing June 2014; collateralized by equipment.
|
4,186 | 12,235 | ||||||
|
Note payable for Corral Blanco Land, bearing interest at 6.0%,
due May 1, 2013; collateralized by land.
|
- | 86,747 | ||||||
|
Obligation payable for Soyatal Mine, non-interest bearing, annual payments of $200,000 through 2019.
|
762,541 | - | ||||||
|
Note payable to Robert Detwiler, a shareholder, bearing interest at 10.0%,
due January 2, 2015; collateralized by equipment.
|
82,000 | - | ||||||
|
Note payable to Betsy Detwiler, a shareholder, bearing interest at 10.0%,
due January 2, 2015; monthly payments of $1,000;
collateralized by equipment.
|
120,000 | - | ||||||
| 1,129,199 | 438,063 | |||||||
|
Less current portion
|
(126,984 | ) | (280,597 | ) | ||||
|
Long-term portion
|
$ | 1,002,215 | $ | 157,466 | ||||
F-15
United States Antimony Corporation and Subsidiaries
Notes to Consolidated Financial Statements
December 31, 2013, 2012 and 2011
10. Long-Term Debt, continued:
At December 31, 2013, principal payments on debt are due as follows:
|
Year Ending December 31,
|
||||
|
2014
|
$ | 126,984 | ||
|
2015
|
292,288 | |||
|
2016
|
59,135 | |||
|
2017
|
60,952 | |||
|
2018
|
139,199 | |||
|
2019
|
172,962 | |||
|
2020
|
183,339 | |||
|
2021
|
94,340 | |||
| $ | 1,129,199 | |||
11.Stockholders' Equity
Issuance of Common Stock for Cash
In 2013, 2012, and 2011, the Company sold an aggregate of 1,139,480, 2,156,334, and 3,041,918 shares, respectively, of its unregistered common stock to existing stockholders and other parties for $1,147,195, $4,624,763, and $1,160,217, respectively. In connection with sales of the Company’s common stock in 2013 and 2012, there were 629,740 and 1,734,667 warrants issued, respectively, to purchase shares of the Company’s common stock. No warrants to purchase shares of the Company’s common stock were granted in 2011.
Issuance of Common Stock for Notes Payable
In the fourth quarter of 2013, the Company borrowed $150,000 from Mr. and Mrs. Robert Detwiler, stockholders of the Company. Prior to the end of 2013, the Detwiler’s converted their notes into 120,000 shares common stock and 60,000 stock purchase warrants. The terms of the conversion were identical to those offered other investors that purchased common stock and warrants near the time of the conversion and no gain or loss on the conversion resulted.
Issuance of Common Stock for Services
On December 27, 2013, the Company declared, but did not issue 76,142 shares of unregistered common stock to be paid to its directors for services during 2013, having a fair value of $150,000, based on the current stock price at the date declared. These shares will be paid in 2014.
During 2012, the Company issued 100,000 shares to Herbert Denton for services provided related to the private issuance of stock in January and June of 2012. The value of the shares issued to Mr. Denton was treated as a cost of issuance and was deducted from proceeds received. We also issued 165,827 shares to Directors for services, with a total value at time of issuance of $451,232, which was expensed over three years. The Company expensed $9,410, $211,818, and $230,004 for the years ended December 31, 2013, 2012 and 2011, respectively.
During 2011, the Company declared, but did not issue 95,835 shares of unregistered common stock to be paid to its directors for services, having a fair value of $230,004, based on the current stock price at the date declared. This expense was classified with general and administrative expense in the consolidated statement of operations. Shares were issued subsequent to December 31, 2011, and are therefore included as stock payable to directors as of that date.
F-16
United States Antimony Corporation and Subsidiaries
Notes to Consolidated Financial Statements
December 31, 2013, 2012 and 2011
11.Stockholders' Equity, continued:
Common Stock Warrants
The Company's Board of Directors has the authority to issue stock warrants for the purchase of preferred or unregistered common stock to directors and employees of the Company.
Transactions in common stock warrants are as follows:
|
Number of Warrants
|
Exercise Prices
|
|||||||
|
Balance, December 31, 2010
|
725,000 | $ | .20 - $.75 | |||||
|
Warrants exercised
|
(125,000 | ) | $ | .30 - $.40 | ||||
|
Balance, December 31, 2011
|
600,000 | $ | .30 - $.60 | |||||
|
Warrants issued
|
1,734,667 | $ | 2.50 - $4.50 | |||||
|
Warrants exercised
|
(250,000 | ) | $ | .30 - $2.50 | ||||
|
Warrants expired
|
(150,000 | ) | $ | .30 - $.40 | ||||
|
Balance, December 31, 2012
|
1,934,667 | $ | .25 - $4.50 | |||||
|
Warrants issued
|
629,740 | $ | 1.20-$1.60 | |||||
|
Warrants exercised
|
(25,000 | ) | $ | 1.20 | ||||
|
Warrants expired
|
(50,000 | ) | $ | 4.50 | ||||
|
Balance, December 31, 2013
|
2,489,407 | $ | 0.60 - $4.50 | |||||
|
The above common stock
|
||||||||
|
warrants expire as follows:
|
||||||||
|
Year ended December 31:
|
||||||||
|
2014
|
1,207,750 | |||||||
|
2015
|
1,031,657 | |||||||
|
Thereafter
|
250,000 | |||||||
| 2,489,407 | ||||||||
F-17
United States Antimony Corporation and Subsidiaries
Notes to Consolidated Financial Statements
December 31, 2013, 2012 and 2011
Preferred Stock
The Company's Articles of Incorporation authorize 10,000,000 shares of $0.01 par value preferred stock available for issuance with such rights and preferences, including liquidation, dividend, conversion, and voting rights, as the Board of Directors may determine.
Series B
During 1993, the Board established a Series B preferred stock, consisting of 750,000 shares. The Series B preferred stock has preference over the Company's common stock and Series A preferred stock; has no voting rights (absent default in payment of declared dividends); and is entitled to cumulative dividends of $0.01 per share per year, payable if and when declared by the Board of Directors. In the event of dissolution or liquidation of the Company, the preferential amount payable to Series B preferred stockholders is $1.00 per share plus dividends in arrears. No dividends have been declared or paid with respect to the Series B preferred stock. The Series B Preferred stock is no longer convertible to shares of the Company’s common stock. At December 31, 2013 and 2012, cumulative dividends in arrears on the outstanding Series B shares were $135,000 and $127,500, respectively.
11. Stockholders' Equity, continued:
Series C
During 2000, the Board established a Series C preferred stock, consisting of 205,996 shares. In 2002, 28,092 shares were converted to common stock and cancelled, leaving 177,904 Series C preferred shares authorized and outstanding. The Series C preferred stock has preference over the Company’s common stock and has voting rights equal to that number of shares outstanding, but no conversion or dividend rights. In the event of dissolution or liquidation of the Company, the preferential amount payable to Series C preferred stockholders is $0.55 per share.
Series D
During 2002, the Board established a Series D preferred stock, authorizing the issuance of up to 2,500,000 shares. The Series D preferred stock has preference over the Company’s common stock but is subordinate to the liquidation preferences of the holders of the Company’s outstanding Series A, Series B and Series C preferred stock. Series D preferred stock carries voting rights and is entitled to annual dividends of $0.0235 per share. The dividends are cumulative and payable after payment and satisfaction of the Series A, B and C preferred stock dividends. No dividends have been declared or paid with respect to the Series D preferred stock. At December 31, 2013 and 2012, cumulative dividends in arrears on the 1,751,005 outstanding Series D shares were $ 392,218 and $378,069, respectively, payable if and when declared by the Board of Directors. In the event of dissolution or liquidation of the Company, the preferential amount payable to Series D preferred stockholders is $2.50 per share. At December 31, 2013 and 2012, the liquidation preference for Series D preferred stock was $4,796,731 and $4,755,582, respectively. Holders of the Series D preferred stock have the right, subject to the availability of authorized but unissued common stock, to convert their shares into shares of the Company's common stock on a one-to-one basis without payment of additional consideration and are not redeemable unless by mutual consent. The majority of Series D preferred shares are held by John Lawrence, president of the Company.
12. 2000 Stock Plan
In January 2000, the Company's Board of Directors resolved to create the United States Antimony Corporation 2000 Stock Plan ("the Plan"). The purpose of the Plan is to attract and retain the best available personnel for positions of substantial responsibility and to provide additional incentive to employees, directors and consultants of the Company to promote the success of the Company's business. The maximum number of shares of common stock or options to purchase common stock that may be issued pursuant to the Plan is 500,000. At December 31, 2013 and 2012, 300,000 shares of the Company's common stock had been previously issued and are outstanding under the Plan. There were no issuances under the Plan during 2013 and 2012.
F-18
United States Antimony Corporation and Subsidiaries
Notes to Consolidated Financial Statements
December 31, 2013, 2012 and 2011
13. Income Taxes
The Company’s income tax provisions (benefit) for the years ended December 31, 2013, 2012, and 2011, were as follows:
|
2013
|
2012
|
2011
|
||||||||||
|
Federal
|
||||||||||||
|
Current
|
$ | - | $ | - | $ | - | ||||||
|
Deferred
|
196,113 | 151,915 | 87,675 | |||||||||
|
Total
|
$ | 196,113 | $ | 151,915 | $ | 87,675 | ||||||
|
State
|
||||||||||||
|
Current
|
$ | - | $ | - | $ | 9,168 | ||||||
|
Deferred
|
33,338 | 15,192 | 8,767 | |||||||||
|
Total
|
$ | 33,338 | $ | 15,192 | $ | 17,935 | ||||||
|
Foreign
|
$ | - | $ | - | $ | - | ||||||
|
Total provision (benefit)
|
$ | 229,451 | $ | 167,107 | $ | 105,610 | ||||||
Domestic and foreign components of income (loss) from operations before income taxes for the years ended December 31, 2013, 2012, and 2011 are as follows:
|
2013
|
2012
|
2011
|
||||||||||
|
Domestic
|
$ | 163,632 | $ | 301,391 | $ | 1,342,530 | ||||||
|
Foreign
|
(1,575,351 | ) | (692,820 | ) | (600,000 | ) | ||||||
|
Total
|
(1,411,719 | ) | $ | (391,429 | ) | $ | 742,530 | |||||
At December 31, 2013 and 2012, the Company had net deferred tax assets as follows:
|
2013
|
2012
|
|||||||
|
Deferred tax asset:
|
||||||||
|
Other
|
$ | - | $ | 11,151 | ||||
|
Foreign exploration costs
|
168,401 | 208,855 | ||||||
|
Foreign net operating loss carry forward
|
232,723 | 374,110 | ||||||
|
Foreign other
|
42,612 | 217,887 | ||||||
|
Federal and state net operating
|
||||||||
|
loss carry forward
|
35,424 | 39,824 | ||||||
|
Deferred tax asset
|
479,160 | 851,827 | ||||||
|
Valuation allowance (foreign)
|
(279,235 | ) | (605,496 | ) | ||||
|
Valuation allowance (federal)
|
(71,786 | ) | - | |||||
|
Total deferred tax asset
|
128,139 | 246,331 | ||||||
|
Deferred tax liability:
|
||||||||
|
Property, plant, and equipment
|
(128,139 | ) | (16,880 | ) | ||||
|
Total deferred tax liability
|
(128,139 | ) | (16,880 | ) | ||||
|
Net Deferred Tax Asset
|
$ | - | $ | 229,451 | ||||
F-19
United States Antimony Corporation and Subsidiaries
Notes to Consolidated Financial Statements
December 31, 2013, 2012 and 2011
13.Income Taxes, continued:
Using the guidelines contained in ASC 740, management believes that it is more likely than not that both the foreign and United States deferred tax assets will not be utilized. Therefore a valuation allowance equal to 100% of the deferred tax assets has been recorded.
At December 31, 2013, the Company has United States net operating loss carry forwards of approximately $51,000 that expire at various dates between 2026 and 2029. In addition, the company has unexpired Montana state net operating loss carry forwards of approximately $479,000 which expire between 2016 and 2020, and unexpired Idaho state net operating loss carry forwards of approximately $23,000, which expire at various dates between 2026 and 2032. The company has approximately $776,000 of Mexican net operating loss carry forwards which expire between 2019 and 2022.
The income tax provision (benefit) differs from the amount of income tax determined by applying the U.S. federal income tax rate to pretax income (loss) for the years ended December 31, 2013, 2012 and 2011 due to the following:
|
2013
|
2012
|
2011
|
|||||||||||||||||
|
Computed expected tax provision (benefit)
|
$ | (494,102 | ) | -35.0 | % | $ | (137,000 | ) | -35.0 | % | $ | 259,886 | 35.0 | % | |||||
|
Effect of permanent differences
|
- | 0.0 | % | 4,662 | 0.6 | % | |||||||||||||
|
Foreign taxes
|
78,768 | 5.6 | % | 34,641 | 8.9 | % | 24,000 | 3.2 | % | ||||||||||
|
Other (1)
|
899,260 | 63.7 | % | 61,770 | 15.8 | % | 126,062 | 17.0 | % | ||||||||||
|
Increase in valuation allowance foreign
|
207,696 | 53.1 | % | ||||||||||||||||
|
Increase in valuation allowance U.S.
|
71,786 | 5.1 | % | - | - | ||||||||||||||
|
Release of valuation allowance U.S.
|
(309,000 | ) | -41.6 | % | |||||||||||||||
|
Release of valuation allowance Foreign
|
(326,261 | ) | -23.1 | % | - | 0.0 | % | ||||||||||||
|
Total
|
$ | 229,451 | 16 | % | $ | 167,107 | 42.7 | % | $ | 105,610 | 14.2 | % | |||||||
|
(1) In 2013 there were revisions to estimates of foreign net operating loss carry forwards.
|
|||||||||||||||||||
During the years ended December 31, 2013, 2012, and 2011, there were no material uncertain tax positions taken by the Company. The Company’s United States income tax filings are subject to examination for the years 2011 through 2013, and 2011 and 2013 in Mexico. In the event that the Company is assessed penalties and or interest, penalties will be charged to other operating expense and interest will be charged to interest expense.
14.Related-Party Transactions
Amounts due to (due from) related parties at December 31, 2013 and 2012 were as follows:
|
2013
|
2012
|
|||||||
|
John C. Lawrence, president and chairman(1)
|
$ | 15,549 | $ | 17,522 | ||||
|
Net related party liabilities
|
$ | 15,549 | $ | 17,522 | ||||
Transactions affecting the payable to Mr. Lawrence during 2013, 2012 and 2011 were as follows:
|
2013
|
2012
|
2011
|
||||||||||
|
Balance, beginning of year
|
$ | 17,522 | $ | 47,843 | $ | 18,060 | ||||||
|
Aircraft rental charges
|
65,502 | 74,490 | 86,058 | |||||||||
|
Payments and advances, net
|
(67,475 | ) | (104,811 | ) | (56,275 | ) | ||||||
|
Balance, end of year
|
$ | 15,549 | $ | 17,522 | $ | 47,843 | ||||||
F-20
United States Antimony Corporation and Subsidiaries
Notes to Consolidated Financial Statements
December 31, 2013, 2012 and 2011
14.Related-Party Transactions, continued:
The Chairman of the audit committee and compensation committee received $36,000 in cash during 2013 for services performed. The Chairman of the audit committee and compensation committee and one other audit committee member received a total of $56,000 in cash during 2012 for services performed.
In addition to transactions described above, during 2013, 2012, and 2011, the Company had the following transactions with related parties:
|
●
|
During 2013, 2012, and 2011, the Company paid $81,642, $89,204, and $107,359, respectively, to a former director for development of Mexican mill sites and consulting fees.
|
|
●
|
A director of the Company acted on behalf of the Company as liaison to Mexican officials through 2011. During the year ended December 31, 2011, fees and expenses paid to this director were $37,083.
|
|
●
|
Royalty expense, based on sales of zeolite, of $52,576, $61,678, and $45,515, was incurred for the years ended December 31, 2013, 2012 and 2011, respectively, to a company controlled by the estate of Al Dugan, formerly a significant stockholder and the father of a former director.
|
15.Commitments and Contingencies
In 2005, AM signed an option agreement that gives AM the exclusive right to explore and develop the San Miguel I and San Miguel II concessions for annual payments. Total payments will not exceed $1,430,344, reduced by taxes paid. During the years ended December 31, 2013, 2012, and 2011, $130,434, $86,956, and $186,956, respectively, was paid and capitalized as mineral rights in accordance with the Company’s accounting policies. At December 31, 2013, approximately $450,000 of option payments are scheduled to be paid in June 2014.
From time to time, the Company is assessed fines and penalties by the Mine Safety and Health Administration (“MSHA”). Using appropriate regulatory channels, management may contest these proposed assessments, and has accrued $7,909, $0 and $27,503 in other accrued liabilities as of December 31, 2013, 2012, and 2011, respectively, related to these settled claims. We are subject to the income tax laws of foreign income laws of foreign countries. We are not aware of any liabilities for foreign income taxes that should be accrued at year end, and to the best of our knowledge none exist.
16.Business Segments
The Company is currently organized and managed by three segments, which represent our operating units: United States antimony operations, Mexican antimony operations and United States zeolite operations. The Company’s Other operating costs include, general and administrative expenses, freight and delivery, and other non-production related costs. Other income and expense consists primarily of interest income and expense and factoring expense.
The Madero smelter and Puerto Blanco mill at the Company’s Mexico operation brings antimony up to an intermediate stage, which is then shipped to the United States operation for finishing and sales at the Thompson Falls, Montana plant. The Zeolite operation produces Zeolite near Preston, Idaho. Almost all of the sales of products from the United States antimony and Zeolite operations are to customers in the United States.
Segment disclosures regarding sales to major customers and for property, plant, and equipment are located in Notes 2 and 6, respectively.
F-21
United States Antimony Corporation and Subsidiaries
Notes to Consolidated Financial Statements
December 31, 2013, 2012 and 2011
|
For the year ended
|
||||||||||||
|
Capital expenditures:
|
December 31, 2013
|
December 31, 2012
|
December 31, 2011
|
|||||||||
|
Antimony
|
||||||||||||
|
United States
|
$ | 100,158 | $ | 288,364 | $ | 160,536 | ||||||
|
Mexico
|
3,299,027 | 3,318,552 | 1,988,345 | |||||||||
|
Subtotal Antimony
|
3,399,185 | 3,606,916 | 2,148,881 | |||||||||
|
Zeolite
|
176,223 | 328,045 | 324,869 | |||||||||
|
Total
|
$ | 3,575,408 | $ | 3,934,961 | $ | 2,473,750 | ||||||
|
Total Assets:
|
As of December 31, 2013
|
As of December 31, 2012
|
||||||
|
Antimony
|
||||||||
|
United States
|
$ | 3,017,768 | $ | 3,712,008 | ||||
|
Mexico
|
9,668,998 | 7,328,339 | ||||||
|
Subtotal Antimony
|
12,686,766 | 11,040,347 | ||||||
|
Zeolite
|
2,204,225 | 2,335,130 | ||||||
|
Total
|
$ | 14,890,991 | $ | 13,375,477 | ||||
|
Segment Operations for the
|
Antimony
|
Antimony
|
Bear River
|
|||||||||||||
|
Year ended December 31, 2013
|
USAC
|
Mexico
|
Zeolite
|
Totals
|
||||||||||||
|
Total revenues
|
$ | 8,786,415 | $ | 32,000 | $ | 2,202,414 | $ | 11,020,829 | ||||||||
|
Production costs
|
4,592,019 | 2,662,780 | 1,096,731 | 8,351,530 | ||||||||||||
|
Depreciation and amortization
|
61,574 | 386,462 | 218,356 | 666,392 | ||||||||||||
|
Other operating costs
|
1,699,846 | 1,171,234 | 469,998 | 3,341,078 | ||||||||||||
|
Total operating expenses
|
6,353,439 | 4,220,476 | 1,785,085 | 12,359,000 | ||||||||||||
|
Income (loss) from operations
|
2,432,976 | (4,188,476 | ) | 417,329 | (1,338,171 | ) | ||||||||||
|
Other income (expense):
|
(61,937 | ) | (1,735 | ) | (9,876 | ) | (73,548 | ) | ||||||||
|
Income (loss) before income taxes
|
2,371,039 | (4,190,211 | ) | 407,453 | (1,411,719 | ) | ||||||||||
|
Deferred income tax provision
|
(229,451 | ) | - | - | (229,451 | ) | ||||||||||
|
NET INCOME (LOSS)
|
$ | 2,141,588 | $ | (4,190,211 | ) | $ | 407,453 | $ | (1,641,170 | ) | ||||||
F-22
United States Antimony Corporation and Subsidiaries
Notes to Consolidated Financial Statements
December 31, 2013, 2012 and 2011
|
Segment Operations for the
|
Antimony
|
Antimony
|
Bear River
|
|||||||||||||
|
Year ended December 31, 2012
|
USAC
|
Mexico
|
Zeolite
|
Totals
|
||||||||||||
|
Total revenues
|
$ | 9,398,003 | $ | 3,000 | $ | 2,641,699 | $ | 12,042,702 | ||||||||
|
Production costs
|
5,665,806 | 1,880,499 | 1,618,816 | 9,165,121 | ||||||||||||
|
Depreciation and amortization
|
40,979 | 222,235 | 209,776 | 472,990 | ||||||||||||
|
Other operating costs
|
1,852,289 | 382,713 | 488,276 | 2,723,278 | ||||||||||||
|
Total operating expenses
|
7,559,074 | 2,485,447 | 2,316,868 | 12,361,389 | ||||||||||||
|
Income (loss) from operations
|
1,838,929 | (2,482,447 | ) | 324,831 | (318,687 | ) | ||||||||||
|
Other income (expense):
|
(61,321 | ) | (30 | ) | (11,391 | ) | (72,742 | ) | ||||||||
|
Income (loss) before income taxes
|
1,777,608 | (2,482,477 | ) | 313,440 | (391,429 | ) | ||||||||||
|
Deferred income tax provision
|
(167,107 | ) | - | - | (167,107 | ) | ||||||||||
|
NET INCOME (LOSS)
|
$ | 1,610,501 | $ | (2,482,477 | ) | $ | 313,440 | $ | (558,536 | ) | ||||||
|
Segment Operations for the
|
Antimony
|
Antimony
|
Bear River
|
|||||||||||||
|
Year ended December 31, 2011
|
USAC
|
Mexico
|
Zeolite
|
Totals
|
||||||||||||
|
Total revenues
|
$ | 11,074,449 | $ | - | $ | 2,043,641 | $ | 13,118,090 | ||||||||
|
Production costs
|
7,294,421 | 1,031,957 | 1,221,101 | 9,547,479 | ||||||||||||
|
Depreciation and amortization
|
29,963 | 169,552 | 206,231 | 405,746 | ||||||||||||
|
Other operating costs
|
1,358,575 | 430,601 | 484,158 | 2,273,334 | ||||||||||||
|
Total operating expenses
|
8,682,959 | 1,632,110 | 1,911,490 | 12,226,559 | ||||||||||||
|
Income (loss) from operations
|
2,391,490 | (1,632,110 | ) | 132,151 | 891,531 | |||||||||||
|
Other income (expense):
|
(135,035 | ) | - | (13,966 | ) | (149,001 | ) | |||||||||
|
Income (loss) before income taxes
|
2,256,455 | (1,632,110 | ) | 118,185 | 742,530 | |||||||||||
|
Deferred income tax provision
|
(105,610 | ) | - | - | (105,610 | ) | ||||||||||
|
NET INCOME (LOSS)
|
$ | 2,150,845 | $ | (1,632,110 | ) | $ | 118,185 | $ | 636,920 | |||||||
F-23