Attached files
| file | filename |
|---|---|
| EX-99.1 - EX-99.1 - WELLS FARGO & COMPANY/MN | d709398dex991.htm |
| 8-K - FORM 8-K - WELLS FARGO & COMPANY/MN | d709398d8k.htm |
 1Q14 Quarterly Supplement
April 11, 2014
©
2014 Wells Fargo & Company. All rights reserved.
Exhibit 99.2 |
 Wells Fargo
1Q14 Supplement 1
Appendix
-
Non-strategic/liquidating loan portfolio
20
-
Purchased credit-impaired (PCI) portfolios
21
-
Residential mortgage trends
22
-
Real estate 1-4 family first mortgage portfolio
23
-
Home equity portfolio
24
-
Consumer credit card portfolio
25
-
Auto portfolios
26
-
Student lending portfolio
27
Common Equity Tier 1 under Basel III (General
Approach)
28
Common Equity Tier 1 under Basel III (Advanced
Approach, fully phased-in)
29
Forward-looking statements and
additional information
30
Table of contents
1Q14 Results
-
1Q14 Results
Page 2
-
Year-over-year results
3
-
Strong revenue diversification
4
-
Balance Sheet and credit overview (linked quarter)
5
-
Income Statement overview (linked quarter)
6
-
Loans
7
-
Broad-based, year-over-year loan growth
8
-
Deposits
9
-
Net interest income
10
-
Noninterest income
11
-
Noninterest expense and efficiency ratio
12
-
Community Banking
13
-
Wholesale Banking
14
-
Wealth, Brokerage and Retirement
15
-
Credit quality
16
-
Capital
17
-
Summary
18
Pages 19-30
Amounts for prior periods have been revised to reflect our determination that certain
factoring arrangements previously included within commercial loans, which were recorded
with a corresponding obligation in other liabilities, did not qualify as loan purchases under ASC Topic 860 (Transfers and Servicing of Financial Assets) based on
interpretations of the specific arrangements. Accordingly, we revised our commercial loan
balances for year-end 2012 and each of the quarters in 2013 in order to
appropriately present the Company’s lending trends over this period. This revision, which
resulted in a reduction to total commercial loans and a corresponding decrease to other
liabilities, did not impact the Company’s consolidated net income or total cash flows. We reduced our commercial loans by $3.5 billion, $3.2 billion, $2.1 billion,
$1.6 billion, and $1.2 billion at December 31, 2013, September 30, 2013, June 30, 2013, March
31, 2013, and December 31, 2012, respectively, which represented less than 1% of total
commercial loans and less than 0.5% of our total loan portfolio. Other affected financial information, including ratios, has been appropriately revised to
reflect this revision. |
 Wells Fargo
1Q14 Supplement 2
1Q14 Results
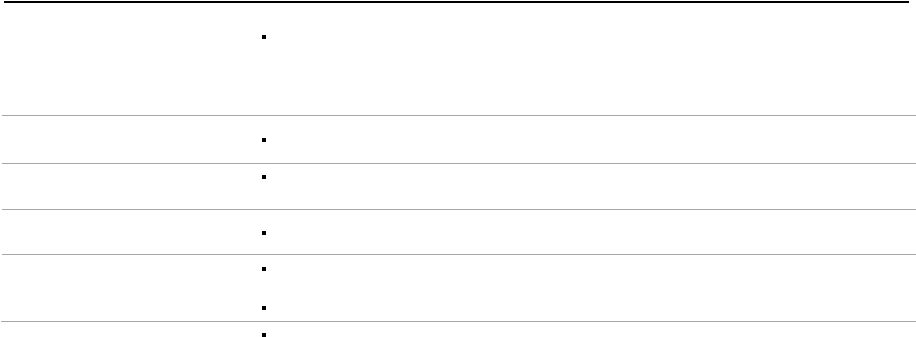
Record earnings of $5.9 billion, up $722 million,
or 14% year-over-year (YoY), and up 5% linked
quarter (LQ)
Record diluted earnings per common share of
$1.05, up 14% YoY and 5% LQ
Strong returns
–
ROA
(1)
= 1.57%, up 8 bps YoY and 9 bps LQ
–
ROE = 14.35%, up 76 bps YoY and 54 bps LQ
Solid loan and deposit growth
–
Period-end loans
(1)
up $28.0 billion, or 4%, YoY
and up 2% annualized LQ
–
Period-end deposits up $83.8 billion, or 8%,
YoY and up 6% annualized LQ
Credit continued to improve
–
Net charge-offs of 41 bps, down 31 bps YoY and
6 bps LQ
Efficiency ratio of 57.9%
(2)
, down 40 bps YoY
and 60 bps LQ
Capital levels continued to increase
–
11.36% Common Equity Tier 1 ratio under
Basel III (General Approach) and Common
Equity Tier 1 ratio of 10.04% under Basel III
(Advanced
Approach,
fully
phased-in)
(3)
Wells Fargo Net Income
($ in millions)
(1) Prior period financial information has been revised to reflect our determination
that certain factoring arrangements did not qualify as loans. See page 1 for more
information. (2) Efficiency ratio defined as noninterest expense divided by total
revenue (net interest income plus noninterest income). (3) Estimated based on
final rules adopted July 2, 2013, by the*Federal Reserve Board establishing a new comprehensive capital framework for U.S. banking
organizations that would implement the Basel III capital framework and certain provisions of
the Dodd-Frank Act. See pages 28-29 for additional information regarding common
equity ratios. Diluted earnings per common share
5,171
5,519
5,578
5,610
5,893
1Q13
2Q13
3Q13
4Q13
1Q14
$0.92
$0.98
$0.99
$1.00
$1.05 |
 Wells Fargo
1Q14 Supplement 3
Year-over-year results
Pre-tax Pre-provision Profit
(1)
($ in billions)
Net Income
($ in billions, except EPS)
Diluted earnings per common share
Period-end Loans
(2)
($ in billions)
Return on Assets
(2)
Return on Equity
Period-end Core Deposits
($ in billions)
(1)
Pre-tax pre-provision profit (PTPP) is total revenue less noninterest expense.
Management believes PTPP is a useful financial measure because it enables investors and
others to assess the Company’s ability to generate capital to cover credit losses through a credit cycle.
(2)
Please see page 1 for information on prior period revisions.
8.9
8.7
1Q13
1Q14
798.4
826.4
1Q13
1Q14
1.49%
1.57%
1Q13
1Q14
5.2
5.9
1Q13
1Q14
$0.92
$1.05
939.9
994.2
1Q13
1Q14
13.59%
14.35%
1Q13
1Q14 |
 Wells Fargo
1Q14 Supplement 4
Balanced Spread and
Fee Income
Diversified Fee Generation
Deposit Service Charges
12%
Card Fees
8%
Total Mortgage Banking
15%
Insurance
4%
Net Gains from Trading
4%
All data is for 1Q14.
(1) Other noninterest income includes net gains on debt securities, lease income,
life insurance investment income and all other noninterest income.
Strong revenue diversification
Total Trust & Investment Fees
34%
Total Other Fees
11%
Net Gains from Equity Inv.
9%
Brokerage advisory,
commissions and other
Mortgage Orig./
Sales, net
Mortgage Servicing, net
Trust and investment
management
Investment banking
Charges and fees on loans
2% Merchant processing
1% Cash network
1% CRE brokerage commissions
1% Letters of credit
Card fees
Deposit service charges
Other
noninterest
income
(1)
Net gains from trading
Insurance
Net Interest
Income
Noninterest
Income
2% All other fees
Net gains from equity
investments
Other
Noninterest
Income
(1)
3%
51%
49%
3%
4%
4%
6%
9%
4%
8%
3%
9%
22%
9%
12% |
 Wells Fargo
1Q14 Supplement 5
Balance Sheet and credit overview (linked quarter)
Loans
(1)
Total period-end loans up $4.1 billion
-
Core
loans
(2)
increased
$7.0
billion,
up
4%
annualized
LQ,
on
broad-based
growth
-
Non-strategic/liquidating
portfolio
(2)
decreased
$2.9
billion
Short-term investments/
Fed funds sold
Up $9.0 billion primarily due to deposit growth
Investment securities
Investment
securities
up
$6.0
billion
as
gross
purchases
of
~$13
billion
were
partially offset by run-off
Deposits
Up $15.4 billion on strong consumer and small business growth
Common stock
repurchases
Common shares outstanding up 8.6 million on annual employee benefit plan
issuances
Purchased 33.5 million common shares in the quarter
Credit
Provision expense of $325 million, down $38 million
-
Net charge-offs of $825 million, or 41 bps, down $138 million
-
$500
million
reserve
release
(3)
vs.
$600
million
in
4Q13
on
continued
strong
credit performance and improved economic conditions
Period-end balances. All comparisons are 1Q14 compared with 4Q13.
(1) Please see page 1 for information on prior period revisions.
(2)
(3) Provision expense minus net charge-offs.
See pages 7 and 20 for additional information regarding core loans and the
non-strategic/liquidating portfolio, which comprises the Pick-a-Pay, liquidating home
equity,*legacy*WFF*indirect*auto,*legacy*WFF*debt*consolidation,*Education
*Finance-government*guaranteed,*and*legacy*Wachovia*commercial*&*industrial, commercial*real*estate,*foreign*and*other*PCI*loan*portfolios. |
 Wells Fargo
1Q14 Supplement 6
Income Statement overview (linked quarter)
All comparisons are 1Q14 compared with 4Q13.
(1) Please see page 1 for information on prior period revisions.
(2) Consists of net gains from trading activities, debt securities and equity
investments. Total
revenue
Stable revenue of $20.6 billion
Net interest
income
variable sources and mortgages held for sale
4Q13 liquidity funding
Noninterest income
Noninterest income up $148 million
-
Service charges on deposit accounts and card fees down $111 million reflecting
seasonality
-
partially offset by higher retail brokerage asset-based fees
-
Mortgage
banking down $60 million as $229 million of higher servicing income
was more than offset by lower production revenue
-
•
Net gains from trading up $107 million on strong customer
accommodation results
•
Net gains from equity investments up $193 million reflecting strong
equity markets
Noninterest expense
Noninterest expense down $137 million
-
incentive compensation and employee benefits expense, partially offset by $133
million
lower
deferred
compensation
expense
(P&L
neutral),
lower
salaries
-
Equipment, professional services and advertising expenses down $319 million
from elevated 4Q13 levels
Income tax
Tax expense down $227 million
NII down $188 million reflecting 2 fewer days in the quarter, and lower income from
NIM
(1)
down 7 bps to 3.20% reflecting lower variable income, deposit growth and
Market sensitive revenue
(2)
up $397 million
Personnel expense up $198 million; included $661 million in seasonally higher
expense on 2 fewer days and lower revenue-based incentive compensation
27.9%
effective
income
tax
rate
included
a
$423
million
discrete
tax
benefit
Trust and investment fees down $46 million as lower investment banking was
|
 Wells Fargo
1Q14 Supplement 7
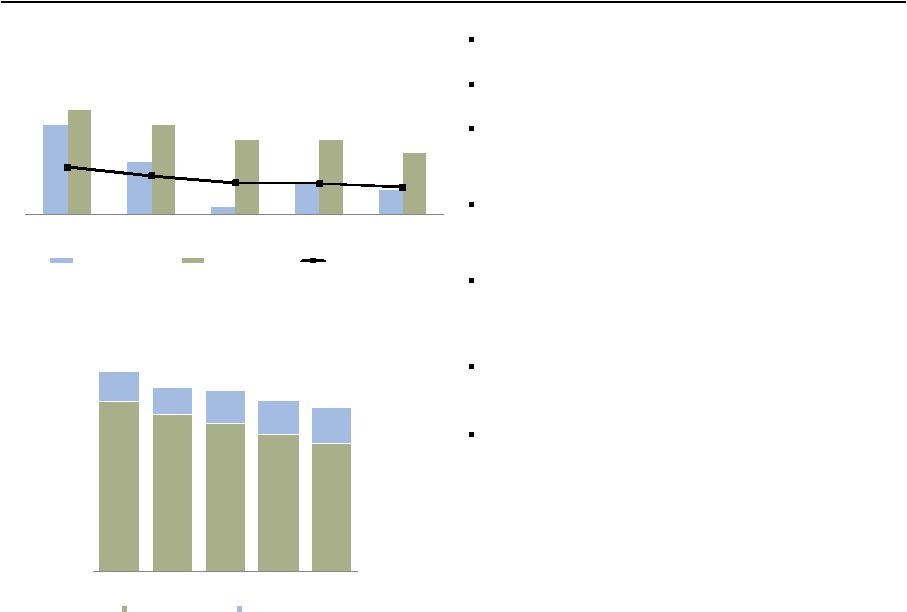
Loans
(1)
Period-end loans up $28.0 billion YoY and $4.1
billion LQ
–
Commercial loans up $4.0 billion LQ
•
$3.0 billion increase in C&I on growth in
Corporate Banking, Capital Finance and
Government and Institutional Banking
•
$0.8 billion increase in CRE reflecting new
originations
–
Consumer loans stable LQ as growth in
nonconforming mortgage and auto was offset
by lower home equity and seasonally lower
credit card
Core loans grew $40.8 billion, or 6%, YoY and
$7.0 billion LQ
Non-strategic/liquidating
loans
(2)
down
$12.8
billion YoY and $2.9 billion from 4Q13
Total average loans of $823.8 billion up $27.1
billion YoY and $10.5 billion LQ
Total average loan yield of 4.29%, down
7 bps LQ
-
Core loan yield excluding the non-strategic/
liquidating portfolio was down 3 bps
-
Non-strategic/liquidating portfolio yield
of 4.96%
(1) Please see page 1 for information on prior period revisions.
(2) See page 20 for additional information regarding the non-strategic/liquidating
portfolio, which comprises the Pick-a-Pay, liquidating home equity, legacy WFF indirect
Period–end Loans Outstanding
($ in billions)
(2)
Total average loan yield
auto, legacy WFF debt consolidation, Education Finance-government guaranteed, and legacy
Wachovia commercial & industrial, commercial real estate, foreign and other PCI
loan portfolios. 4.49%
4.47%
4.42%
4.36%
4.29%
707.6
712.3
725.0
741.4
748.4
90.8
87.6
84.1
80.9
78.0
798.4
799.9
809.1
822.3
826.4
1Q13
2Q13
3Q13
4Q13
1Q14
Core loans
Non-strategic/liquidating loans |
 Wells Fargo
1Q14 Supplement 8
175.0
180.0
185.0
190.0
195.0
200.0
1Q13
1Q14
Commercial and Industrial
238.0
242.0
246.0
250.0
254.0
258.0
262.0
1Q13
1Q14
Real Estate 1-4 Family First
Mortgage
44.0
45.0
46.0
47.0
48.0
49.0
50.0
51.0
52.0
53.0
54.0
1Q13
1Q14
Automobile
23.0
23.5
24.0
24.5
25.0
25.5
26.0
26.5
1Q13
1Q14
Credit Card
35.0
37.0
39.0
41.0
43.0
45.0
47.0
49.0
51.0
53.0
55.0
1Q13
1Q14
Foreign
Broad-based, year-over-year loan
(1)
growth
Period-end loans up $28.0 billion, or 4% year-over-year
Growth in nonconforming mortgage
Record originations, up 15%
Record new account growth, up 6%
($ in billions)
Growth in Asset Backed Finance,
Corporate Banking and Government
and Institutional Banking
Trade finance growth and 3Q13 U.K.
CRE acquisition
(1) Please see page 1 for information on prior period revisions.
|
 Wells Fargo
1Q14 Supplement 9
Deposits
Average deposits up $91.1 billion YoY and $16.9
billion LQ on solid consumer and commercial
growth and an increase in liquidity-related term
deposits in 4Q13
Average core deposits of $973.8 billion up $47.9
billion, or 5%, YoY and up $8.0 billion, or 3%
annualized LQ
–
118% of average loans
–
Average retail core deposits up 4% YoY and
7% annualized LQ
•
Primary consumer checking customers
(1)
up a net
5.1% YoY
Stable funding costs of 11 bps
Average Deposits and Rates
($ in billions)
Average deposit cost
Average Core Deposits
($ in billions)
925.9
965.8
973.8
1Q13
4Q13
1Q14
(1)
Metrics reported on a one-month lag from reported quarter-end; for example 1Q14
cross-sell is as of February 2014. Checking customer growth is 12-months ending
for each respective period. Customers who actively use their checking account with transactions such as debit card purchases, online bill payments, and
direct deposit.
711.9
773.0
793.2
274.3
287.4
284.1
986.2
1,060.4
1,077.3
1Q13
4Q13
1Q14
Noninterest-bearing deposits
Interest-bearing deposits
0.15%
0.11%
0.11% |
 Wells Fargo
1Q14 Supplement 10
Net interest income (TE)
(1)
up $157 million YoY
reflecting lower funding costs
Net interest income (TE)
(1)
down $190 million LQ
on 2 fewer days in the quarter, lower variable
income (PCI loan recoveries and loan fees), and
lower income from mortgages held for sale
Average earning assets up $20.2 billion, or
2%, LQ
-
Short-term investments/fed funds sold up
$8.0 billion
-
Loans up $10.5 billion
-
Investment securities up $3.8 billion
NIM
(2)
of 3.20% down 7 bps from 4Q13 on:
-
Variable income = (4) bps
-
Customer-driven deposit growth = (2) bps
-
Liquidity–related activity = (1) bps
-
Balance sheet repricing, growth and mix = 0 bps
Net interest income
Net Interest Income (TE)
(1)
($ in millions)
Net Interest Margin (NIM)
(2)
10,675
10,946
10,949
11,022
10,832
1Q13
2Q13
3Q13
4Q13
1Q14
3.49%
3.47%
3.39%
3.27%
3.20%
(1)
(2) Please see page 1 for information on prior period revisions.
Tax-equivalent net interest income is based on the federal statutory rate of 35% for the
periods presented. Net interest income was $10,499 million, $10,750 million, $10,748
million, $10,803 million and $10,615 million for 1Q13, 2Q13, 3Q13, 4Q13 and 1Q14 respectively.
|
 Wells Fargo
1Q14 Supplement 11
7,966
7,826
8,122
8,292
8,500
2,794
2,802
1,608
1,570
1,510
10,760
10,628
9,730
9,862
10,010
1Q13
2Q13
3Q13
4Q13
1Q14
Noninterest income
Deposit service charges down $68 million LQ on
seasonality
Trust and investment fees down $46 million, or
1%, LQ as lower investment banking was
partially offset by higher retail brokerage asset-
based fees
Mortgage banking down $60 million
-
Gain on sale revenue down $289 million reflecting a
28% decline in originations and a 16 bps decline in
gain on sale margin to 1.61%
-
Net servicing income up $229 million reflecting
higher MSR hedge performance
Equity gains up $193 million on continued
strength in business line results reflecting gains
from multiple investments on strong public and
private equity markets
Mortgage banking Noninterest income excluding Mortgage banking
vs
vs
($ in millions)
1Q14
4Q13
1Q13
Noninterest income
Service charges on deposit accounts
$
1,215
(5)
%
-
Trust and investment fees
Brokerage advisory, commissions
and other fees
2,241
4
9
Trust and investment management
844
(1)
6
Investment banking
327
(29)
(7)
Card fees
784
(5)
6
Other fees
1,047
(6)
1
Mortgage banking
1,510
(4)
(46)
Insurance
432
(5)
(7)
Net gains from trading activities
432
33
(24)
Net gains on debt securities
83
n.m.
84
Net gains from equity investments
847
30
n.m.
Lease income
133
(10)
2
Other
115
n.m.
(75)
Total noninterest income
$
10,010
2
%
(7)
Card fees down $43 million on seasonality
Other fees down $72 million on lower commercial
real estate brokerage commissions from a strong
4Q13
Trading gains up $107 million on strong customer
accommodation trading |
 Wells Fargo
1Q14 Supplement 12
Noninterest expense and efficiency ratio
(1)
Noninterest expense down $137 million LQ
-
Personnel expense up $198 million
•
Salaries down $83 million reflecting 2 fewer
days in the quarter
•
Commission and incentive compensation up
$69 million as $221 million in annual equity
awards to retirement-eligible employees was
partially offset by lower revenue-based
compensation
•
Benefits expense up $212 million as $440
million in seasonally higher payroll taxes and
401(k) matching expenses were partially
offset by $133 million lower deferred
compensation
-
Equipment expense down $77 million from a
4Q13 that included annual license renewals
-
Outside professional services
(2)
down $195
million from elevated 4Q13 levels
-
Other expense
(2)
down $86 million
•
Advertising down $47 million from elevated
4Q13 levels
Efficiency ratio down 60 bps LQ to 57.9%
Expect to operate within targeted efficiency ratio
range of 55%-59% in 2Q14
12,400
12,255
12,102
12,085
11,948
58.3%
57.3%
59.1%
58.5%
57.9%
1Q13
2Q13
3Q13
4Q13
1Q14
Efficiency Ratio
vs
vs
($ in millions)
1Q14
4Q13
1Q13
Noninterest expense
Salaries
$
3,728
(2)
%
2
Commission and incentive compensation
2,416
3
(6)
Employee benefits
1,372
18
(13)
Equipment
490
(14)
(7)
Net occupancy
742
1
3
Core deposit and other intangibles
341
(9)
(10)
FDIC and other deposit assessments
243
24
(17)
Outside
professional
services
(2)
559
(26)
4
Other
(2)
2,057
(4)
(3)
Total noninterest expense
$
11,948
(1)
%
(4)
(1)
(2)
The sum of Outside professional services expense and Other expense ties to Other noninterest
expense in the Consolidated Statement of Income, pages 19 and 21 of the press release.
Efficiency ratio defined as noninterest expense divided by total revenue (net interest
income plus noninterest income). Noninterest expense and our efficiency ratio may be
affected by a variety of factors, including business and economic cyclicality, seasonality, changes in our business composition and operating environment,
growth in our business and/or acquisitions, and unexpected expenses relating to, among other
things, litigation and regulatory matters. |
 Wells Fargo
1Q14 Supplement 13
vs
vs
($ in millions)
1Q14
4Q13
1Q13
Net interest income
$
7,275
1
%
2
Noninterest income
5,318
6
(8)
Provision for credit losses
419
(14)
(67)
Noninterest expense
6,774
(4)
(8)
Income tax expense
1,376
-
7
Segment net income
$
3,844
19
%
31
($ in billions)
Avg loans, net
$
505.0
-
1
Avg core deposits
626.5
1
1
1Q14
4Q13
1Q13
Regional Banking
Primary consumer checking customers
(1)(2)(3)
5.1
%
4.7
2.1
Primary business checking customers
(1)(2)(3)
5.1
4.7
Retail Bank household cross-sell
(1)
6.17
6.16
6.10
vs
vs
($ in billions)
1Q14
4Q13
1Q13
Consumer Lending
Credit card payment volumes (POS)
$
13.3
(7)
%
14
Credit card penetration
(1)(4)
38.0
%
94
bps
389
Home Lending
Applications
$
60
(8)
%
(57)
Application pipeline
27
8
(64)
Originations
36
(28)
(67)
Gain on sale margin
1.61
%
(16)
bps
(95)
Community Banking
Net income of $3.8 billion, up 31% YoY
and 19% LQ
Regional Banking
Continued franchise and cross-sell growth
(1)
–
Primary consumer checking customers
(2) (3)
up
a net 5.1% YoY
–
Primary business checking customers
(2) (3)
up a
net 5.1% YoY
–
Retail bank cross-sell of 6.17 products per
household up from 6.10 in 1Q13
Consumer Lending
Credit card penetration
(1) (4)
rose to 38.0%, up
from 37.0% in 4Q13 and 34.1% in 1Q13
Record consumer auto originations of $7.8 billion,
up 16% LQ and 15% YoY
Mortgage originations of $36 billion down 28%
LQ and 67% YoY
-
7% of originations were from HARP
(5)
vs. 6% in 4Q13
and 10% in 1Q13
-
66% of originations were purchases, up from 31% in
1Q13
(1) Metrics reported on a one-month lag from reported quarter-end; for example
1Q14 cross-sell is as of February 2014. (2) Checking customer growth is
12-months ending for each respective period. (3)
Customers
who
actively
use
their
checking
account
with
transactions
such
as
debit
card
purchases,
online
bill
payments,
and
direct
deposit.
(4) Household penetration as of February 2014 and defined as the percentage of retail
bank households that have a credit card with Wells Fargo. (5) Home Affordable
Refinance Program. |
 Wells Fargo
1Q14 Supplement 14
vs
vs
($ in millions)
1Q14
4Q13
1Q13
Net interest income
$
2,891
(8)
%
(4)
Noninterest income
2,689
(5)
(13)
Reversal of provision for
credit losses
(93)
(26)
60
Noninterest expense
3,215
6
4
Income tax expense
714
(26)
(29)
Segment net income
$
1,742
(17)
%
(15)
($ in billions)
Avg loans, net
(1)
$
301.9
2
7
Avg core deposits
259.0
-
16
vs
vs
($ in billions)
1Q14
4Q13
1Q13
Key Metrics:
Cross-sell
7.2
1
%
6
Commercial card spend
volume
$
5.3
4
21
U.S. investment banking
market share %
(3)
4.0
%
(160)
bps
(60)
Total AUM
$
478.8
(2)
%
3
Advantage Funds AUM
233.9
(4)
5
Wholesale Banking
Net income of $1.7 billion, down 15% YoY and
17% LQ
Net interest income down 8% LQ on lower PCI
loan recoveries; average loans
(1)
up 2% on
broad-based growth
Noninterest income down 5% LQ on lower
investment banking, commercial brokerage fees,
and corporate banking energy capital gains
Cross-sell
Cross-sell
of
7.2
products
per
relationship
(2)
up
from 6.8 in 1Q13
Treasury Management
Commercial card spend volume of $5.3 billion up
4% LQ and 21% YoY
Wholesale treasury management revenue up 3%
LQ and 4% YoY reflecting new product sales
Investment Banking
U.S. investment banking market share
(3)
of 4.0%
Asset Management
Total AUM up $16 billion YoY on growth in equity
assets driven by higher market valuations
partially offset by money market outflows
(1) Please see page 1 for information on prior period revisions.
(2) Cross-sell reported on a one-quarter lag.
(3) Source: Dealogic U.S. investment banking fee market share.
(2) |
 Wells Fargo
1Q14 Supplement 15
Wealth, Brokerage and Retirement
Net income up 41% YoY and down 3% LQ
Net interest income flat LQ; average loans up 3%
and average core deposits up 1% LQ
Noninterest income up 1% LQ as higher asset-
based fees were largely offset by lower gains on
deferred compensation plan investments
Noninterest expense up 2% LQ and included
seasonally higher personnel costs and lower
deferred compensation plan expense
Retail Brokerage
Managed account assets of $388 billion, up 4%
LQ and 19% YoY driven by net flows and market
performance
Wealth Management
Wealth Management client assets
up 1% LQ and
6% YoY
Retirement
IRA assets up 1% LQ and 9% YoY
Institutional Retirement plan assets up 1% LQ
and 8% YoY
(1) Includes deposits.
(2) Data as of February 2014.
vs
vs
($ in millions)
1Q14
4Q13
1Q13
Net interest income
$
768
-
%
15
Noninterest income
2,700
1
7
Reversal of provision for
credit losses
(8)
(27)
n.m.
Noninterest expense
2,711
2
3
Income tax expense
290
(4)
40
Segment net income
$
475
(3)
%
41
($ in billions)
Avg loans, net
$
50.0
3
14
Avg core deposits
156.0
1
4
vs
vs
($ in billions, except where noted)
1Q14
4Q13
1Q13
Key Metrics:
WBR Client Assets
(1)
($ in trillions)
$
1.6
1
%
8
Cross-sell
(2)
10.42
-
1
Retail Brokerage
Financial Advisors
15,146
(1)
(1)
Managed account assets
388
4
19
Client assets
(1)
($ in trillions)
1.4
1
8
Wealth Management
Client assets
(1)
217
1
6
Retirement
IRA Assets
344
1
9
Institutional Retirement
Plan Assets
310
1
8 |
 Wells Fargo
1Q14 Supplement 16
1.2
0.7
0.1
0.4
0.3
1.4
1.2
1.0
1.0
0.8
0.72%
0.58%
0.48%
0.47%
0.41%
1Q13
2Q13
3Q13
4Q13
1Q14
Provision Expense
Net Charge-offs
Net charge-off rate
19.5
19.5
16.9
15.7
14.7
3.4
3.2
3.8
3.9
4.1
22.9
21.1
20.7
19.6
18.8
1Q13
2Q13
3Q13
4Q13
1Q14
Nonaccrual loans
Foreclosed assets
Credit quality
Provision expense of $325 million, down $38
million from 4Q13
Net charge-offs of $825 million, down $138 million,
or 14%, LQ
0.41% net charge-off rate
(1)
-
Commercial losses of 0.01%
(1)
, down 5 bps LQ
-
Consumer losses of 0.75%, down 7 bps LQ
NPAs declined $840 million LQ
-
$1.0 billion decline in nonaccrual loans
-
$178 million increase in foreclosed assets
Reserve release
(3)
of $500 million vs. $600 million
in 4Q13
-
Continue to expect future reserve releases,
absent significant deterioration in the economy
Allowance for credit losses = $14.4 billion
-
Allowance covered 4.3x annualized 1Q14
net charge-offs
PCI nonaccretable = 20.5% of remaining UPB
(4)
(1) Please see page 1 for information on prior period revisions.
(2) 30-89 days and 90 days or more past due and still accruing, and nonperforming
loans, include held for sale loans reported on Balance Sheet.
(3) Provision expense minus net charge-offs.
(4) Unpaid principal balance for PCI loans that have not had a UPB
charge-off. Provision Expense and Net Charge-offs
($ in billions)
Nonperforming Assets
(2)
($ in billions)
(1) |
 Wells Fargo
1Q14 Supplement 17
Capital
Capital continued to strengthen
Common Equity Tier 1 ratio under Basel III
(General Approach) of 11.36%
Common Equity Tier 1 ratio under Basel III
(Advanced Approach, fully phased-in) of
10.04% at 3/31/14
(1)
Period-end common shares outstanding up 8.6
million LQ on annual employee benefit plan
issuances
-
Purchased 33.5 million common shares
in 1Q14
Board approved an additional 350 million
shares in our repurchase authority
Expect share count to decline in the remainder
of 2014 on anticipated share repurchase
activity
See pages 28-29 for additional information regarding common equity ratios.
1Q14 capital ratios are preliminary estimates.
Common Equity Tier 1 Ratio
Under Basel I
Basel III
(General Approach)
10.39%
10.71%
10.60%
10.82%
11.36%
1Q13
2Q13
3Q13
4Q13
1Q14
(1)
Estimated based on final rules adopted July 2, 2013, by the Federal Reserve Board establishing
a new comprehensive capital framework for U.S. banking organizations that would
implement the Basel III capital framework and certain provisions of the Dodd-Frank Act.
|
 Wells Fargo
1Q14 Supplement 18
Summary
1Q14
Record
earnings
of
$5.9
billion,
up
$722
million,
or
14%
from
1Q13
Record diluted EPS of $1.05, up 14%
-
17 consecutive quarters of EPS growth
Strong returns
-
ROA
(1)
= 1.57%, up 8 bps
-
ROE = 14.35%, up 76 bps
Improved efficiency
-
Expenses down $452 million, or 4%
-
Efficiency ratio of 57.9%, down 40 bps
Solid loan and deposit growth
-
Loans
(1)
up $28.0 billion, or 4%, on broad-based growth
-
Deposits up $83.8 billion, or 8%
Improved credit quality
-
Net charge-offs of 0.41%, down 31 bps
Capital continued to strengthen
-
Returned $2.6 billion to shareholders through dividends and share repurchases
(1) Please see page 1 for information on prior period revisions.
|
 Appendix |
 Wells Fargo
1Q14 Supplement 20
(1) Net of purchase accounting adjustments.
-$100.0
Non-strategic/liquidating loan portfolio
-$3.2
-$112.8
-$3.5
-$3.2
-$2.9
($ in billions)
1Q14
4Q13
3Q13
2Q13
1Q13
4Q08
Pick-a-Pay mortgage
(1)
$
49.5
51.0
52.8
54.8
56.6
95.3
Liquidating home equity
3.5
3.7
3.9
4.2
4.4
10.3
Legacy WFF indirect auto
0.1
0.2
0.3
0.5
0.6
18.2
Legacy WFF debt consolidation
12.6
12.9
13.3
13.7
14.1
25.3
Education Finance -
gov't guaranteed
10.2
10.7
11.1
11.5
11.9
20.5
Legacy WB C&I, CRE and foreign PCI loans
(1)
1.7
2.0
2.3
2.5
2.8
18.7
Legacy WB other PCI loans
(1)
0.4
0.4
0.4
0.4
0.4
2.5
Total
$
78.0
80.9
84.1
87.6
90.8
190.8 |
 Wells Fargo
1Q14 Supplement 21
Purchased credit-impaired (PCI) portfolios
Legacy Wachovia PCI loans continued to perform better than originally expected
Nonaccretable difference
$5.1 billion remains to absorb losses on PCI loans
-
Nonaccretable
=
20.5%
of
remaining
unpaid
principal
balance
(UPB)
(3)
•
Pick-a-Pay
nonaccretable
=
21.1%
of
Pick-a-Pay
UPB
(3)
Accretable yield
$17.1
billion
expected
to
accrete
to
income
over
the
remaining
life
of
the
underlying
loans
-
Commercial accretable yield balance of $501 million; weighted average life of portfolio is 2.1
years -
Pick-a-Pay accretable yield balance of $16.2 billion; weighted average life of 12.5
years Balance decreased $306 million LQ and included $375 million accreted into interest
income in 1Q14 -
$110 million reclassified from nonaccretable difference
(1)
Includes write-downs taken on loans where severe delinquency (normally 180 days) or other
indications of severe borrower financial stress exist that indicate there will be a loss
of contractually due amounts upon final resolution of the loan. (2)
Reflects releases of $1.9 billion for loan resolutions and $6.4 billion from the
reclassification of nonaccretable difference to the accretable yield, which will result
in increasing income over the remaining life of the loan or pool of loans.
(3)
Unpaid principal balance of loans without write-downs. ($ in billions)
(1)
December 31, 2008
$
29.2
62.5
6.5
98.2
December 31, 2013
3.1
28.8
0.8
32.7
March 31, 2014
2.7
28.2
0.8
31.7
12/31/08 Nonaccretable difference
$
10.4
26.5
4.0
40.9
Addition of nonaccretable difference due to acquisitions
0.2
-
-
0.2
Losses from loan resolutions and write-downs
(6.9)
(17.9)
(2.9)
(27.7)
Release of nonaccretable difference since merger
(3.5)
(3.9)
(0.9)
(8.3)
(2)
3/31/14 Remaining nonaccretable difference
0.2
4.7
0.2
5.1
Life-to-date net performance
Additional provision since 2008 merger
$
(1.6)
-
(0.1)
(1.7)
Release of nonaccretable difference since 2008 merger
3.5
3.9
0.9
8.3
(2)
Net performance
1.9
3.9
0.8
6.6
Commercial
Pick-a-Pay
Other
consumer
Total
Adjusted unpaid principal balance
Nonaccretable difference rollforward |
  Wells Fargo 1Q14
Supplement 22
Residential mortgage trends
Mortgage production
$36 billion of mortgage originations, down 28% LQ
-
66%
of
originations
were
purchases,
down
from
68%
in
4Q13
but
up
from
31%
in
1Q13
Announced team member reductions of approximately 1,100 FTEs in 1Q14
Servicing portfolio
Residential servicing portfolio of $1.8 trillion
-
Wells Fargo servicing portfolio’s total delinquency and foreclosure ratio for 1Q14 was
5.56%, down 84 bps LQ and 98 bps YoY
(1) Net gains on mortgage loan origination/or sales activities less repurchase reserve
build divided by total originations. Residential mortgage production trends
($ in billions)
1Q14
4Q13
3Q13
2Q13
1Q13
Applications
$
60
65
87
146
140
Pipeline
27
25
35
63
74
Originations
36
50
80
112
109
Refinance %
34
%
32
41
56
69
Purchase %
66
68
59
44
31
Gain on Sale
(1)
1.61
1.77
1.42
2.21
2.56
|
 Wells Fargo
1Q14 Supplement 23
Real estate 1-4 family first mortgage portfolio
First lien mortgage loans up modestly as growth
in core first lien mortgage was partially offset by
continued run-off in the liquidating portfolio
–
Core first lien up $2.8 billion, or 1%, reflecting
nonconforming mortgage originations
•
Nonconforming mortgages increased $5.8
billion
to
$87.4
billion
(4)
–
Pick-a-Pay non-PCI portfolio down 3%
–
PCI portfolio down 2%
–
Debt consolidation first lien down 3%
Pick-a-Pay non-PCI portfolio
•
$184 million of nonaccrual TDRs reclassified to
accruing TDR status based on borrower
payment performance
•
$3.3 billion in nonaccruals included $1.7 billion
of nonaccruing TDRs
Core net charge-offs down $3 million LQ
–
Loans down 3% LQ driven by loans paid-in-full
–
87% of portfolio current
–
Nonaccrual loans decreased $195 million,
or 6%, LQ
–
Net charge-offs of $24 million down $10 million
LQ on improved portfolio performance and lower
severities
(1) The carrying value, which does not reflect the allowance for loan losses, includes
purchase accounting adjustments, which, for PCI loans, are the nonaccretable
difference and the accretable yield, and for all other loans, an adjustment to mark the loans to a market yield at date of merger less
any subsequent charge-offs. (2)
Ratios on Legacy WFF debt consolidation first mortgage loan portfolio only.
(3) Ratios on non run-off first lien mortgage loan portfolio only. (4)
Nonconforming mortgages originated post February 2009.
($ in millions)
1Q14
4Q13
Total real estate 1-4 family first mortgage
$
259,478
258,497
Less consumer non-strategic/liquidating portfolios:
Pick-a-Pay non-PCI first lien mortgage
26,241
27,123
PCI first lien mortgage
23,530
24,100
Debt consolidation first mortgage portfolio
12,292
12,621
Core first lien mortgage
197,415
194,653
Non-PCI loans
Carrying value
(1)
26,241
27,123
Nonaccrual loans
$
3,253
3,448
as % of loans
12.40
%
12.71
Net charge-offs
$
24
34
as % of average loans
0.36
%
0.49
90+ days past due as % of loans
8.57
8.79
PCI loans carrying value
(1)
23,292
23,848
Nonaccrual loans
$
2,092
2,156
as % of loans
17.02
%
17.08
Net charge-offs
$
65
77
as % of average loans
2.13
%
2.38
Nonaccrual loans
$
4,012
4,195
as % of loans
2.03
%
2.16
Net charge-offs
$
81
84
as % of loans
0.17
%
0.17
Pick-a-Pay first lien mortgage
Legacy
WFF
debt
consolidation
first
mortgage
loan
performance
(2)
Core
first
lien
mortgage
loan
performance
(3) |
 Wells Fargo
1Q14 Supplement 24
Home equity portfolio
Core Portfolio
(1)
Outstandings
down 3%
-
High quality new originations with weighted
average CLTV of 61%, 778 FICO, and 32% total
debt service ratio
1Q14 losses decreased $34 million
2+ delinquencies decreased $85 million
Delinquency rate for loans with a CLTV >100%
decreased 18 bps
Liquidating Portfolio
Outstandings of $3.5 billion down 5%
Credit performance continued to improve
Total home equity portfolio = $82 billion
22%
in
1
lien
position
39% in junior lien position behind WFC owned or
serviced
1
lien
-
Current
1
lien,
Current
junior
lien
=
96.7%
-
Current
1
lien,
Delinquent
junior
lien
=
1.0%
-
Delinquent
1
lien,
Current
junior
lien
=
1.0%
-
Delinquent
1
lien,
Delinquent
junior
lien
=
1.3%
39%
in
junior
lien
position
behind
third
party
1
lien
Excludes purchased credit-impaired loans.
($ in millions)
1Q14
4Q13
Core Portfolio
(1)
Outstandings
78,342
80,434
Net charge-offs
181
215
as % of avg loans
0.92
%
1.05
2+ payments past due
1,941
2,026
as % loans
2.49
%
2.53
% CLTV > 100%
(2)
23
23
2+ payments past due
3.05
3.23
% Unsecured balances
(3)
9
9
% 1st lien position
23
23
(1) Includes equity lines of credit and closed-end junior liens associated with the
Pick- a-Pay portfolio totaling $1.2 billion at March 31, 2014 and $1.2 billion
at December 31, 2013. (2)
CLTV is calculated based on outstanding balance plus unused lines of credit divided by
estimated home value. Estimated home values are determined predominantly based on
automated valuation models updated through March 2014.
(3) Unsecured balances, representing the percentage of outstanding balances above the
most recent home value. st
st
st
st
st
st
st |
 Wells Fargo
1Q14 Supplement 25
Consumer credit card portfolio
Credit card outstandings down 3% LQ on
seasonality and up 8% YoY reflecting continued
new account growth
-
Record new accounts
(1)
up 8% LQ and up
6% YoY
-
Credit Card household penetration
(2)
of 38.0%,
up from 37.0% in 4Q13
-
Purchase dollar volume down 7% LQ on
seasonality and up 14% YoY reflecting growth in
the account base
-
POS transactions down 7% LQ on seasonality
and up 16% YoY reflecting new accounts and
active account growth
Net charge-offs up $11 million, or 19 bps, LQ
(1)
Consumer credit card new account openings, excludes private label.
(2)
Household penetration as of February 2014 and defined as the percentage of retail banking
deposit households that have a credit card with Wells Fargo. ($ in millions)
1Q14
4Q13
Credit card outstandings
$
26,061
26,870
Net charge-offs
231
220
as % of avg loans
3.57
%
3.38
Key Metrics:
Purchase volume
$
13,280
14,355
POS transactions (millions)
188
202
New accounts
(1)
613,157
565,277
Penetration
(2)
38.0
%
37.0 |
 Wells Fargo
1Q14 Supplement 26
Auto
portfolios
(1)
Consumer Portfolio
Auto outstandings of $52.6 billion up 4% LQ and
12% YoY
–
Record 1Q14 originations of $7.8 billion up 16% LQ
and up 15% YoY
Nonaccrual loans declined $12 million LQ and $59
million YoY
Net charge-offs were down $18 million LQ reflecting
seasonality, and up $14 million YoY
–
March Manheim index of 124.4 down 2% LQ and
3% from March 2013
30+ days past due decreased $300 million
LQ reflecting seasonality and increased $113
million YoY
Commercial Portfolio
Loans of $8.5 billion up 1% LQ and 12% YoY
(1)
The consumer auto portfolio includes the liquidating legacy Wells Fargo Financial indirect
portfolio of $132 million. ($ in millions)
1Q14
4Q13
Auto outstandings
$
50,058
48,335
Nonaccrual loans
150
159
as % of loans
0.30
%
0.33
Net charge-offs
$
89
105
as % of avg loans
0.73
%
0.87
30+ days past due
$
737
1,030
as % of loans
1.47
%
2.13
Auto outstandings
$
2,549
2,473
Nonaccrual loans
11
14
as % of loans
0.43
%
0.57
Net charge-offs
$
1
3
as % of avg loans
0.22
%
0.51
30+ days past due
$
9
16
as % of loans
0.35
%
0.65
Commercial Portfolio
Auto outstandings
$
8,477
8,424
Nonaccrual loans
19
2
as % of loans
0.22
%
0.02
Net charge-offs
$
-
-
as % of avg loans
n.m.
%
n.m.
Indirect Consumer Portfolio
Direct Consumer Portfolio |
 Wells Fargo
1Q14 Supplement 27
Student lending portfolio
$21.9 billion student lending outstandings down
1% LQ
Private Portfolio
$11.7 billion private loan outstandings up 3% LQ
and 7% YoY
Net charge-offs down $6 million LQ, due to
repayment seasonality
30+ days past due declined $35 million LQ on
seasonality
Government Portfolio
$10.2 billion liquidating government guaranteed
outstandings declined 5% LQ and 14% YoY
-
Average FICO of 749 and 80% of the total
outstandings have been co-signed
-
Originations increased 157% LQ due to seasonality,
up 12% YoY
($ in millions)
1Q14
4Q13
Education Finance
Total outstandings
$
21,907
22,073
Private Portfolio
Private outstandings
$
11,703
11,361
Net charge-offs
33
39
as % of avg loans
1.14
%
1.36
30 days past due
$
223
258
as % of loans
1.90
%
2.27
Government Guaranteed Portfolio
Government outstandings
$
10,204
10,712 |
 Wells Fargo
1Q14 Supplement 28
Common Equity Tier 1 under Basel III (General Approach)
Wells Fargo & Company
FIVE QUARTER RISK-BASED CAPITAL COMPONENTS
Under Basel III
Mar. 31,
Dec. 31,
Sept 30,
June 30,
Mar. 31,
(in billions)
2014
2013
2013
2013
2013
Total equity
$
176.5
171.0
168.8
163.8
163.4
Noncontrolling interests
(0.8)
(0.9)
(1.6)
(1.4)
(1.3)
Total Wells Fargo stockholders' equity
175.7
170.1
167.2
162.4
162.1
Adjustments:
Preferred stock
(15.2)
(15.2)
(14.3)
(12.6)
(12.6)
Cumulative other comprehensive income (2)
(2.2)
(1.4)
(2.2)
(1.8)
(5.1)
Goodwill and other intangible assets (2)(3)
(25.6)
(29.6)
(29.8)
(30.0)
(30.2)
Investment in certain subsidiaries and other
-
(0.4)
(0.6)
(0.5)
(0.6)
Common Equity Tier 1 (1)(4)
(A)
132.7
123.5
120.3
117.5
113.6
Preferred stock
15.2
15.2
14.3
12.6
12.6
Qualifying hybrid securities and noncontrolling interests
-
2.0
2.9
2.9
2.9
Other
(0.3)
-
-
-
-
Total Tier 1 capital
147.6
140.7
137.5
133.0
129.1
Long-term debt and other instruments qualifying as Tier 2
21.7
20.5
18.9
18.0
18.4
Qualifying allowance for credit losses
14.0
14.3
14.3
13.8
13.8
Other
0.2
0.7
0.6
0.2
0.3
Total Tier 2 capital
35.9
35.5
33.8
32.0
32.5
Total qualifying capital
(B)
183.5
176.2
171.3
165.0
161.6
Basel I (General Approach) RWAs (5)(6):
Credit risk
$
1,118.7
1,105.2
1,099.2
1,061.1
1,056.5
Market risk
49.7
36.3
35.9
36.3
37.8
Total Basel I (General Approach) RWAs
(C)
1,168.4
1,141.5
1,135.1
1,097.4
1,094.3
Capital Ratios (6):
Common equity tier 1 to total RWAs
(A)/(C)
11.36
%
10.82
10.60
10.71
10.39
Total capital to total RWAs
(B)/(C)
15.70
15.43
15.09
15.03
14.76
(1)
(2)
(3)
(4)
(5)
(6)
Under the regulatory guidelines for risk-based capital,
on-balance sheet assets and credit equivalent amounts of derivatives and off-balance sheet items
are assigned to one of several broad risk categories according to the
obligor, or, if relevant, the guarantor or the nature of any collateral. The aggregate
dollar amount in each risk category is then multiplied by the risk
weight associated with that category. The resulting weighted values from each of the
risk categories are aggregated for determining total RWAs.
Under Basel I
The Company's March 31, 2014, RWA and capital ratios are
preliminary. (General
Approach) (1)
Under transition provisions to Basel III, cumulative other
comprehensive income (previously deducted under Basel I) is included in Common Equity
Tier 1 over a specified phase-in period. In addition, certain
intangible assets includable in Common Equity Tier 1 are phased out over a specified
period.
Goodwill and other intangible assets are net of any associated deferred
tax liabilities. Common Equity Tier 1 (formerly Tier 1 common
equity under Basel I) is a non-GAAP financial measure that is used by investors, analysts and bank
regulatory agencies to assess the capital position of financial
services companies. Management reviews Common Equity Tier 1 along with other
Basel III revises the definition of capital, increases minimum capital
ratios, and introduces a minimum Common Equity Tier 1 ratio. These changes are
being phased in effective January 1, 2014 through the end of 2021 and
the capital ratios will be determined using Basel I (General Approach) RWAs
during 2014.
$
$
measures of capital as part of its financial analyses and has included
this non-GAAP financial information, and the corresponding
reconciliation to total equity, because of current interest in such
information on the part of market participants. |
 Wells Fargo
1Q14 Supplement 29
Common Equity Tier 1 under Basel III (Advanced Approach, fully
phased-in)
Wells Fargo & Company
COMMON EQUITY TIER 1 UNDER BASEL III (ADVANCED APPROACH, FULLY
PHASED-IN) (1)(2) (in billions)
Mar. 31, 2014
Common Equity Tier 1 (transition amount) under Basel III
132.7
$
Adjustments from transition amount to fully phased-in under Basel
III (3): Cumulative other comprehensive income
2.8
Other
(3.4)
Total adjustments
(0.6)
Common Equity Tier 1 (fully phased-in) under Basel III
(C)
132.1
$
Total RWAs anticipated under Basel III (4)
(D)
1,315.2
$
Common Equity Tier 1 to RWAs anticipated under Basel III (Advanced
Approach, fully phased-in) (C)/(D)
10.04
%
(1)
Common Equity Tier 1 is a non-GAAP financial measure that is used
by investors, analysts and bank regulatory agencies to assess the
capital position of financial services companies. Management reviews
Common Equity Tier 1 along with other measures of capital as part
of its financial analyses and has included this non-GAAP financial
information, and the corresponding reconciliation to total equity,
because of current interest in such information on the part of market
participants. (2)
The Basel III Common Equity Tier 1 and RWA are estimated
based on the Basel III capital rules adopted July 2, 2013, by the FRB. The
rules establish a new comprehensive capital framework for U.S. banking
organizations that implement the Basel III capital framework and
certain provisions of the Dodd-Frank Act. The rules are being
phased in effective January 1, 2014 through the end of 2021.
(3)
Assumes cumulative other comprehensive income is fully phased in and
certain other intangible assets are fully phased out under Basel III
capital rules.
(4)
The final Basel III capital rules provide for two capital frameworks:
the Standardized Approach intended to replace Basel I, and the
Advanced Approach applicable to certain institutions. Under the final
rules, we will be subject to the lower of our Common Equity Tier 1
ratio calculated under the Standardized Approach and under the
Advanced Approach in the assessment of our capital adequacy.
Accordingly, the estimate of RWAs has been determined under the
Advanced Approach because management expects RWAs to be higher
using the Advanced Approach, and thus result in a lower Common Equity
Tier 1, compared with the Standardized Approach. Basel III
capital rules adopted by the Federal Reserve Board incorporate
different classification of assets, with risk weights based on Wells Fargo's
internal models, along with adjustments to address a combination of
credit/counterparty, operational and market risks, and other Basel III
elements. |
| Wells Fargo
1Q14 Supplement 30
Forward-looking statements and additional information
Forward-looking statements:
This document contains “forward-looking statements”
within the meaning of the Private Securities Litigation Reform Act of 1995. In addition, we
may make forward-looking statements in our other documents filed or furnished with
the SEC, and our management may make forward-looking statements orally to analysts,
investors, representatives of the media and others. Forward-looking statements can
be identified by words such as “anticipates,”
“intends,”
“plans,”
“seeks,”
“believes,”
“estimates,”
“expects,”
“target,”
“projects,”
“outlook,”
“forecast,”
“will,”
“may,”
“could,”
“should,”
“can”
and similar references to future periods. In particular, forward-looking statements
include, but are not limited to, statements we make about: (i) the future operating or
financial performance of the Company, including our outlook for future growth; (ii) our
noninterest expense and efficiency ratio; (iii) future credit quality and performance,
including our expectations regarding future loan losses and allowance releases; (iv)
the appropriateness of the allowance for credit losses; (v) our expectations regarding net
interest income and net interest margin; (vi) loan growth or the reduction or
mitigation of risk in our loan portfolios; (vii) future capital levels and our estimated Common Equity Tier 1 ratio under Basel III
capital standards; (viii) the performance of our mortgage business and any related exposures;
(ix) the expected outcome and impact of legal, regulatory and legislative developments,
as well as our expectations regarding compliance therewith; (x) future common stock dividends, common
share repurchases and other uses of capital; (xi) our targeted range for return on assets and
return on equity; (xii) the outcome of contingencies, such as legal proceedings; and
(xiii) the Company’s plans, objectives and strategies. Forward-looking statements are not based on historical facts
but instead represent our current expectations and assumptions regarding our business, the
economy and other future conditions. Investors are urged to not unduly rely on
forward-looking statements as actual results could differ materially from expectations. Forward-looking statements
speak only as of the date made, and we do not undertake to update them to reflect changes or
events that occur after that date. For more information about factors that could cause
actual results to differ materially from expectations, refer to the “Forward-Looking Statements”
discussion in Wells Fargo’s press release announcing our first quarter 2014 results and
in our most recent Quarterly Report on Form 10-Q, as well
as to Wells Fargo’s other reports filed with the Securities and Exchange Commission,
including the discussion under “Risk Factors” in our Annual
Report on Form 10-K for the year ended December 31, 2013.
Purchased credit-impaired loan portfolio:
Loans that were acquired from Wachovia that were considered credit impaired were written down
at acquisition date in purchase accounting to an amount estimated to be collectible and
the related allowance for loan losses was not carried over to Wells Fargo’s
allowance. In addition, such purchased credit-impaired loans are not classified as
nonaccrual or nonperforming, and are not included in loans that were contractually 90+ days
past due and still accruing. Any losses on such loans are charged against the nonaccretable
difference established in purchase accounting and are not reported as charge-offs
(until such difference is fully utilized). As a result of accounting for purchased loans with evidence of credit
deterioration, certain ratios of the combined company are not comparable to a portfolio that
does not include purchased credit-impaired loans. In certain cases, the purchased
credit-impaired loans may affect portfolio credit ratios and trends. Management believes that the presentation of
information adjusted to exclude the purchased credit-impaired loans provides useful
disclosure regarding the credit quality of the non-impaired loan portfolio.
Accordingly, certain of the loan balances and credit ratios in this document have been adjusted to exclude the purchased credit-impaired
loans. References in this document to impaired loans mean the purchased credit-impaired
loans. Please see pages 31-33 of the press release announcing our 1Q14 results for
additional information regarding the purchased credit-impaired loans.
|