Attached files
| file | filename |
|---|---|
| 8-K - FORM 8-K - Sprouts Farmers Market, Inc. | d710795d8k.htm |
 Investor Deck
April 2014
April 2014
Exhibit 99.1 |
 Forward-Looking Statements and Non-
GAAP Financial Measures
GAAP Financial Measures
1
Certain
statements
in
this
presentation
are
forward-looking
as
defined
in
the
Private
Securities
Litigation
Reform
Act
of
1995.
Any
statements
contained
herein
(including,
but
not
limited
to,
statements
to
the
effect
that
Sprouts
Farmers
Market,
Inc.
(the
“Company”)or
its
management
"anticipates,"
"plans,"
"estimates,"
"expects,"
"believes,"
or
the
negative
of
these
terms
and
other
similar
expressions)
that
are
not
statements
of
historical
fact
should
be
considered
forward-looking
statements,
including,
without
limitation,
statements
regarding
the
Company’s
estimated
growth,
expected
results
and
long-
term
financial
targets.
These
statements
involve
certain
risks
and
uncertainties
that
may
cause
actual
results
to
differ
materially
from
expectations
as
of
the
date
of
this
presentation.
These
risks
and
uncertainties
include,
without
limitation,
risks
associated
with
the
Company’s
ability
to
successfully
compete
in
its
intensely
competitive
industry;
the
Company’s
ability
to
successfully
open
new
stores;
the
Company’s
ability
to
manage
its
rapid
growth;
the
Company’s
ability
to
maintain
or
improve
its
operating
margins;
the
Company’s
ability
to
identify
and
react
to
trends
in
consumer
preferences;
product
supply
disruptions;
general
economic
conditions;
and
other
factors
as
set
forth
from
time
to
time
in
the
Company’s
Securities
and
Exchange
Commission
filings.
The
Company
intends
these
forward-looking
statements
to
speak
only
as
of
the
date
of
this
presentation
and
does
not
undertake
to
update
or
revise
them
as
more
information
becomes
available,
except
as
required
by
law.
In
addition
to
reporting
financial
results
in
accordance
with
GAAP,
the
Company
has
presented
adjusted
net
income,
adjusted
diluted
earnings
per
share
and
adjusted
EBITDA.
These
measures
are
not
in
accordance
with,
or
an
alternative
to
GAAP.
The
Company's
management
believes
that
these
presentations
provide
useful
information
to
management,
analysts
and
investors
regarding
certain
additional
financial
and
business
trends
relating
to
its
results
of
operations
and
financial
condition.
In
addition,
management
uses
these
measures
for
reviewing
the
financial
results
of
the
Company
as
well
as
a
component
of
incentive
compensation.
In
addition,
in
comparing
its
results
to
the
comparable
periods
of
2012,
the
Company
has
presented
2012
financial
results
on
a
pro
forma
basis
as
if
the
May
2012
business
combination
with
Sunflower
Farmers
market,
Inc.
(“Sunflower
Transaction”)
had
occurred
on
the
first
day
of
the
Company’s
2012
fiscal
year.
See
the
Appendix
for
unaudited
supplemental
pro
forma
condensed
consolidated
financial
information.
The
Company
defines
adjusted
net
income
as
net
income
excluding
store
closure
and
exit
costs,
one-time
costs
associated
with
its
April
2011
combination
(the
Henry’s
Transaction)
with
Henry’s
Holdings,
LLC
(“Henry’s”)
and
the
Sunflower
Transaction
(collectively,
the
“Transactions”),
gain
and
losses
from
disposal
of
assets,
the
loss
on
extinguishment
of
debt
and
the
related
tax
impact
of
those
adjustments.
The
Company
defines
adjusted
diluted
earnings
per
share
as
adjusted
net
income
divided
by
the
weighted
average
diluted
shares
outstanding.
The
Company
defines
EBITDA
as
net
income
before
interest
expense,
provision
for
income
tax,
and
depreciation
and
amortization,
and
defines
adjusted
EBITDA
as
EBITDA
excluding
store
closure
and
exit
costs,
one-time
costs
associated
with
the
Transactions,
gains
and
losses
from
disposal
of
assets
and
the
loss
on
extinguishment
of
debt.
These
non-GAAP
measures
are
intended
to
provide
additional
information
only
and
do
not
have
any
standard
meanings
prescribed
by
GAAP.
Use
of
these
terms
may
differ
from
similar
measures
reported
by
other
companies.
Because
of
their
limitations,
none
of
these
non-GAAP
measures
should
be
considered
as
a
measure
of
discretionary
cash
available
to
use
to
reinvest
in
growth
of
the
Company’s
business,
or
as
a
measure
of
cash
that
will
be
available
to
meet
the
Company’s
obligations.
Each
of
these
non-GAAP
measures
has
its
limitations
as
an
analytical
tool,
and
you
should
not
consider
them
in
isolation
or
as
a
substitute
for
analysis
of
the
Company’s
results
as
reported
under
GAAP.
See
the
Appendix
for
reconciliation
for
these
non-GAAP
measure
to
the
comparable
GAAP
measures. |
 Overview of Sprouts
2 |
 Sprouts at a Glance
High-growth, value-oriented
fresh, natural and organic food
retailer
Broad consumer appeal
One of the largest natural and
organic retailers
Significant momentum
Significant white space
opportunity
3 |
 Benefitting from Long-Term Macro
Trends
Trends
Strong Market Opportunity
1
Supported by Strong Macro Tailwinds
Sprouts is Outpacing Relevant Segments
2
Sprouts growing at 7x U.S.
Supermarkets
2008-2012
CAGR:
2.4%
6.1%
8.6%
10.3%
17.1%
U.S.
Supermarkets
Vitamins &
Supplements
Natural &
Organic
Value
Health & Wellness
Value
1
Source:
Nutrition
Business
Journal.
4
$600B U.S. Supermarket Industry
Natural & Organic Sales Projected to Grow
by 11% Annually Through 2020
Greater
focus
on
preventative
health
Childhood
obesity
Specialty
diets
(e.g.,
gluten-free)
Increasingly
cost-conscious
consumers
Persistent
shift
in
shopping
behaviors
Sprouts
makes
healthy
choices
affordable
2
Chart
data
represents
the
multiple
of
average
annual
U.S.
Grocery
sales
growth
(“CAGR”)
from
2008
through
2012
for
each
respective
category
or
entity.
Value
segment
defined
as
dollar
stores
(Dollar
General,
Dollar
Tree,
Family
Dollar).
Source:
Progressive
Grocer
(U.S.
Supermarket
Industry),
Nutrition
Business
Journal
(Vitamins
&
Supplements;
Natural
&
Organic),
and
company filings
(Value). |
 Sprouts Targets the Conventional
Supermarket Customer
Supermarket Customer
Middle income and up
Educated
Wide spectrum of demographic
and ethnic makeups
Wanting to eat healthier
Looking for value
Broad Customer Demographics
“Natural / lifestyle”
markets and
more “traditional”
states
Densely populated, urban areas
as well as smaller metropolitan
markets
Successful Across Markets
Sprouts Proves
That Eating
Healthy Can
Be Affordable.
5 |
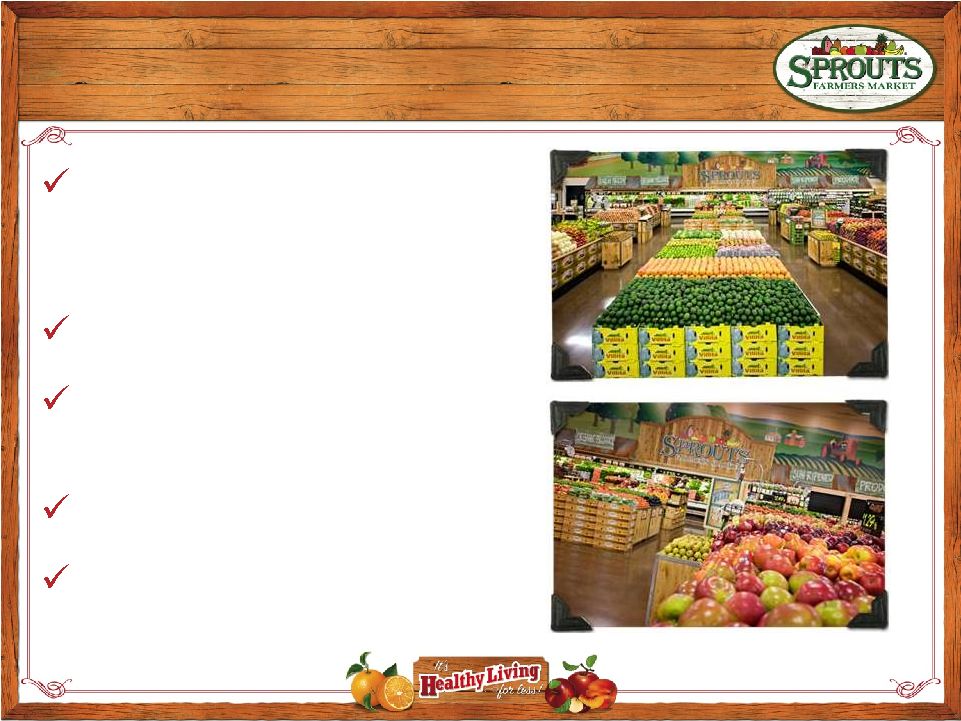
 Sprouts has a Differentiated
Go-to-Market Strategy
Go-to-Market Strategy
Complete Natural &
Organic Offering
6
HEALTH
SELECTION
VALUE
SERVICE
An Engaged, Loyal Customer Base Leading to Strong Financial
Performance and Significant New Unit Growth Opportunity
|
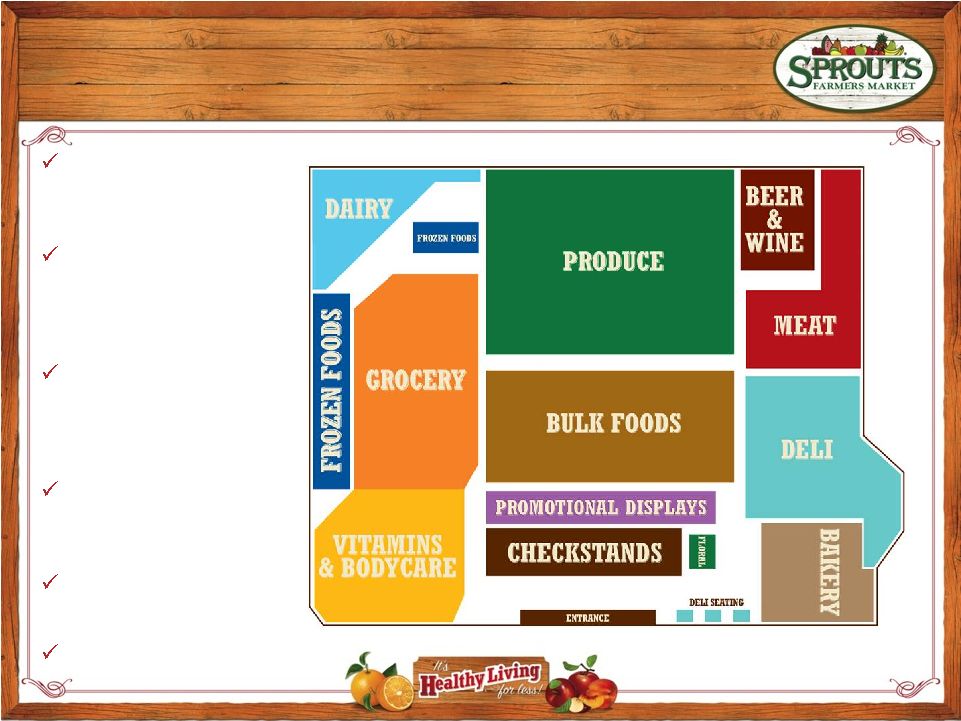 Sprouts “Flips”
the Conventional
the Conventional
Grocery Store Model
Grocery Store Model
Produce surrounded by
a complete grocery
offering
Differentiated
assortment of high-
quality, healthy
alternatives
Farmers market
inspired, open store
layout with low profile
displays
Convenient,
small-box:
25 –
28k sq. ft.
Comfortable, easy to
shop environment
Full grocery store
7 |
 8
Produce is a common denominator among
customers
Supply chain system scalable to support
growth
Focus on freshness, speed-to-market and
value
Prices significantly below competitors drive
trial and traffic
8
Fresh Produce is at the Core of Sprouts’
Fresh Produce is at the Core of Sprouts’
Offering
Offering |
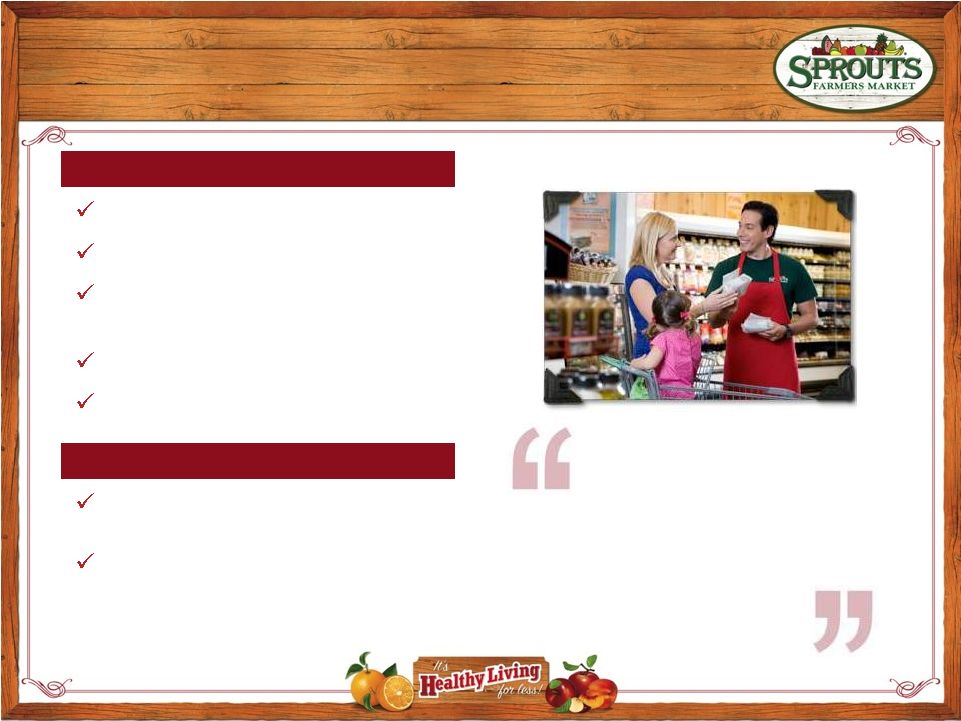
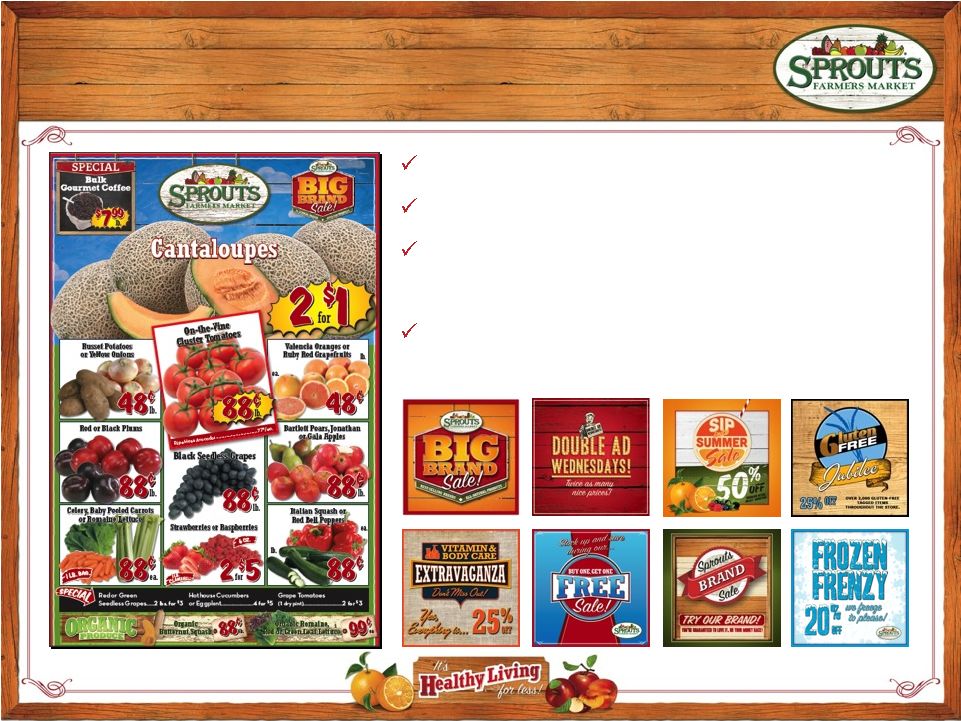 Reaching a Broad Base of Consumers in
Both Traditional and Digital Mediums
Both Traditional and Digital Mediums
More than 12 million weekly circulars
Reinforces value offering
30+ annual department promotions¹, which drive
transition to increased basket size and higher
margin
Digital platform for relevance today and tomorrow
¹
Represents planned promotions at each store during FY 2014.
9 |
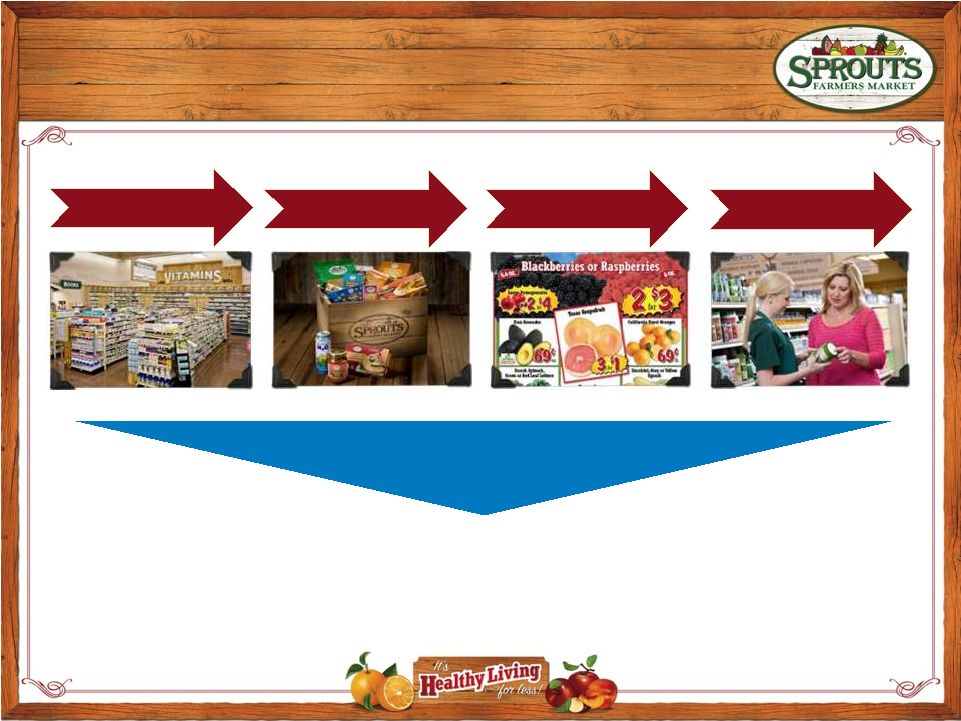
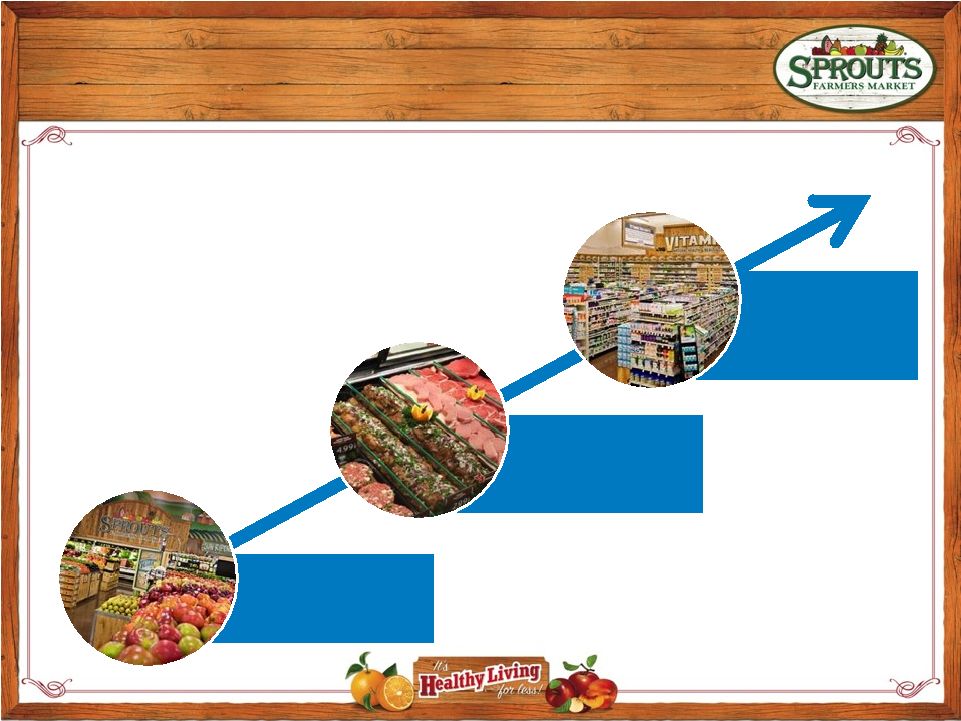    Sprouts Grows its Share of Consumers’
“Food Retail Wallet”
“Food Retail Wallet”
Consumers Start with
High Quality Produce
10
Increasing Average Basket Size and Gross Margin Over Time
TRIAL
TRANSITION
LIFESTYLE
Then Shop an Increasing
Number of Departments
Over Time Make
Sprouts Their Primary
Grocery Store |
 Estimated 15+ Years of New Store
Growth
Growth
Potential
U.S.
Store
Count
¹
1 Based on an assumed new store growth rate of 12% per year and
research conducted by Buxton Company in 2012. Proven
Concept:
171
stores
in
nine
states
Strong
performance
across
all
markets,
demographics
and
real
estate
venues
Plan
to
open
22-24
new
stores
in
2014
Demographics
allow
for
deep
penetration
in
markets
New
Mexico
Texas
Colorado
Utah
Arizona
Nevada
California
5
29
26
6
75
2
3
24
Existing Market
Oklahoma
Target Near Term New Market
Kansas
Georgia
Florida
Louisiana
Missouri
Arkansas
Tennessee
North
Carolina
South
Carolina
Alabama
Mississippi
Oregon
Washington
11
1 |
 Sprouts’
Consistent Growth in
Consistent Growth in
Competitive Markets
Competitive Markets
12
Case Study of a Sprouts Phoenix Location
Broad Appeal Makes Sprouts a Formidable Competitor
1 Not indicative of every store location.
Whole Foods
opened 2002
Wal-Mart
opened
Trader Joe’s
opened
Frys
Marketplace
re-opened
Target added
P-Fresh
Costco
opened |
 Business & Financial
Performance
Performance
13 |
 A
Powerful Long-Term Growth Engine A Powerful Long-Term Growth
Engine High, balanced sales growth
Margin expansion in existing stores
Operating leverage from scale and infrastructure
Deleverage capital structure
14
Long-Term Net Earnings Growth
Target of 20%+ |
 Compelling Unit Economics
¹
Includes store build-out (net of contributions from landlords),
inventory (net of payables) and cash pre-opening expenses. Target New
Store Economics Store Size
25 –
28k sq. ft.
Net Cash Investment¹
$2.8 million
First Year Sales
~$10 –
$12 million
Initial Sales Growth
20-30% over 3 –
4 years
15
Pre-Tax Cash-on-Cash Returns
35%-40% within 3-4 years |
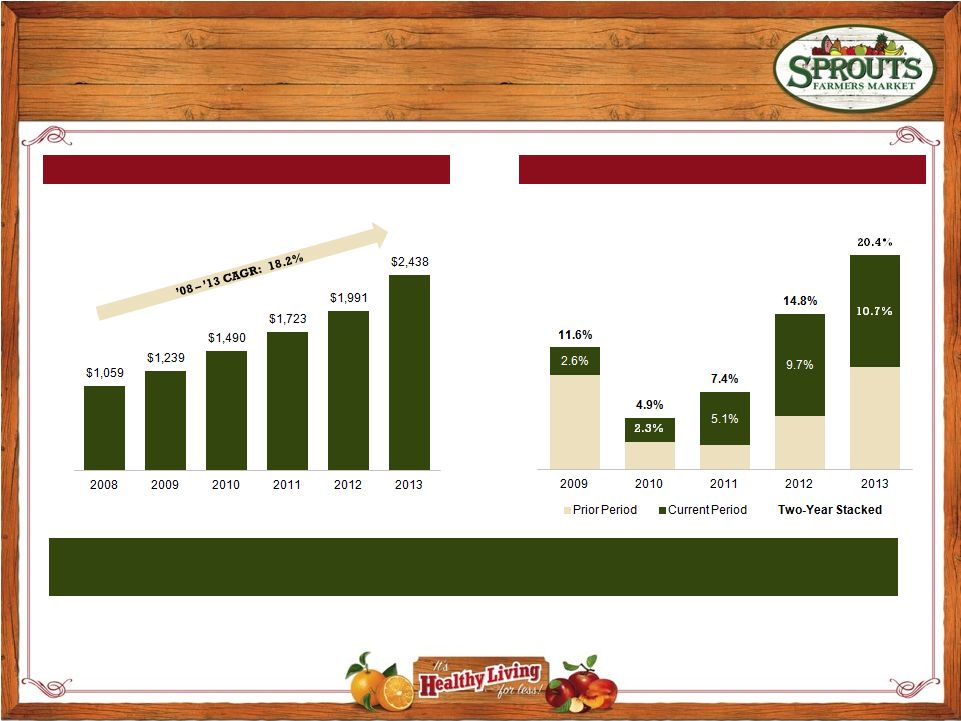 History of Organic Growth
Pro
Forma
Comparable
Store
Sales
Growth
2
Pro
Forma
Net
Sales
1
¹
Pro
forma
net
sales
reflect
the
net
sales
of
our
predecessor
entity
and
Sunflower
as
if
the
Henry’s
Transaction
and
Sunflower
Transaction
had
been
consummated
on
the
first
day
of
fiscal
2008.
2
“Comparable
store
sales
growth”
refers
to
the
percentage
change
in
our
comparable
store
sales
as
compared
to
the
prior
comparable
period.
Pro
forma
comparable
store
sales
growth
reflects
comparable
store
sales
growth
calculated
as
if
the
Henry’s
Transaction
and
the
Sunflower
Transaction
had
been
consummated
on
the
first
day
of
fiscal
2007.
Comparable
store
sales
growth
on
a
“two-year
stacked
basis”
is
computed
by
adding
the
pro
forma
comparable
store
sales
growth
of
the
period
referenced
and
that
of
the
same
fiscal
period
ended
twelve
months
prior.
Balanced Sales Growth Across Comparable Store Sales Growth and New Store
Openings
16
($ in mm) |
 Robust Earnings Growth
Adj. EBITDA
¹
Adj. Net Income
²
Note:
Financial
information
on
this
slide
for
fiscal
2012
gives
pro
forma
effect
to
the
Sunflower
Transaction
as
if
it
had
been
consummated
on
the
first
day
of
fiscal
2012.
¹
See
the
Appendix
to
this
presentation
for
a
reconciliation
of
adjusted
EBTIDA
to
net
income.
²
See
the
Appendix
to
this
presentation
for
a
reconciliation
of
adjusted
net
income
to
net
income.
17
($ in mm)
($ in mm)
% Margin
7.4%
8.0% |
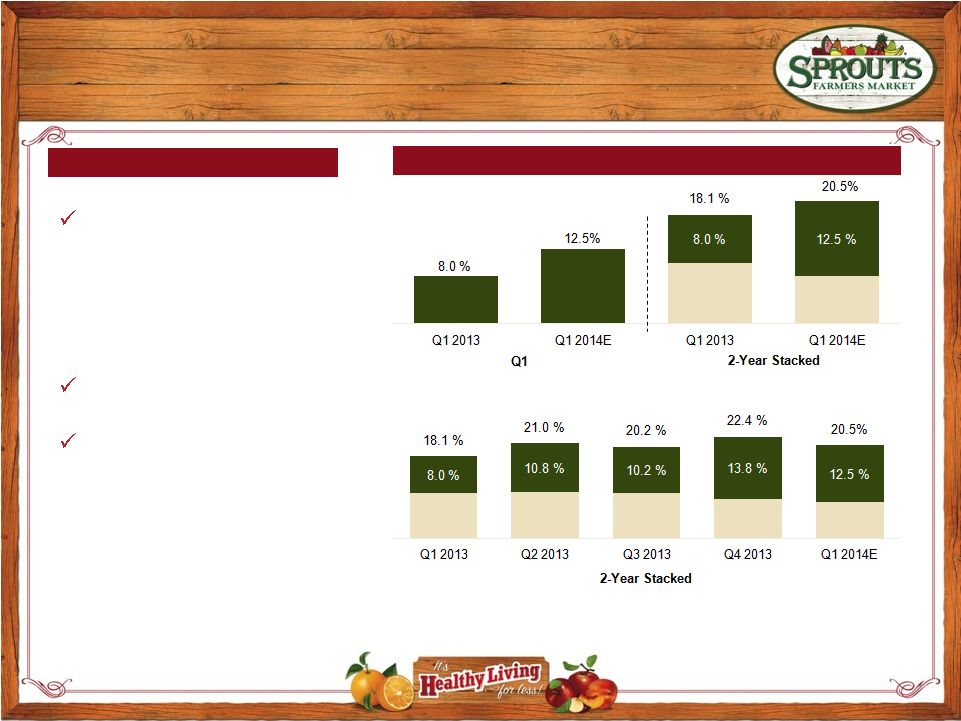 Momentum
Continued Through Q1
Continued Through Q1
1.
“Comparable
store
sales
growth”
refers
to
the
percentage
change
in
our
comparable
store
sales
as
compared
to
the
prior
comparable
period.
Pro
forma
comparable
store
sales
growth
is
calculated
including
all
stores
acquired
in
the
Henry’s
Transaction
and
the
Sunflower
Transaction
for
all
periods
presented.
Pro
forma
comparable
store
sales
growth
on
a
“two-year
stacked
basis”
is
computed
by
adding
the
pro
forma
comparable
store
sales
growth
of
the
period
referenced
and
that
of
the
same
fiscal
period
ended
twelve
months
prior.
This
preliminary
estimated
financial
information
is
unaudited,
and
does
not
present
all
information
necessary
for
an
understanding
of
our
financial
condition
as
of
March
30,
2014.
This
preliminary
estimated
financial
information
is
subject
to
the
completion
of
financial
closing
procedures.
Accordingly,
actual
results
may
be
different.
Pro
Forma
Comparable
Store
Sales
Growth
1
Opened 4
new stores in
Q1 as of March 30,
2014, on track for
annual target of 22-24
openings
Expected 25.5% Q1
2014E Sales Growth
Expected continued
double-digit comp growth
18
Highlights |
 Long-Term Financial Targets
Unit Growth
~12%
Comparable Store Sales Growth
6%+
Total Sales Growth
~15%
EBIT Growth
17 –
20%
Net Income Growth
20%+
19
Note:
These
targets
are
forward-looking
statements,
are
subject
to
significant
business,
economic,
regulatory
and
competitive
risks,
uncertainties
and
contingencies,
many
of
which
are
beyond
the
control
of
the
Company
and
its
management,
and
are
based
upon
assumptions
with
respect
to
future
decisions,
which
are
subject
to
change.
Actual
results
will
vary
and
those
variations
may
be
material.
For
discussion
of
some
of
the
important
factors
that
could
cause
these
variations,
see
the
Forward-Looking
Statements
disclaimer
to
this
presentation,
as
well
as
the
risks
and
uncertainties
described
under
the
caption
“Risk
Factors”
in
the
Company’s
Annual
Report
on
Form
10-K
for
the
fiscal
year
ended
December
29,
2013
and
the
Company’s
other
filings
with
the
Securities
and
Exchange
Commission.
Nothing
in
this
presentation
should
be
regarded
as
a
representation
by
any
person
that
these
targets
will
be
achieved,
and
the
Company
undertakes
no
duty
to
update
its
targets. |
 Why Sprouts is a Compelling Investment
Authentic Natural and Organic Food Offering at
Great Value
Fast Growing Segment of the U.S. Supermarket
Industry with Strong Macro Tailwinds
Significant New Store Growth Opportunity
Supported by Broad Demographic Appeal
Proven and Replicable Store Model with
Compelling Unit Economics
Resilient Business Model
Delivering Strong
Financial Performance and Strong Comparable
Store Sales Growth
Passionate Team with a Customer-Focused
Culture
20
Significantly lower prices
11% CAGR to $113B in
2020
1,200 potential stores
(7.2x current base)
Target 35 –
40% cash-on-
cash returns
20% 2-year comps |
 Appendix: Supplemental
Materials
21 |
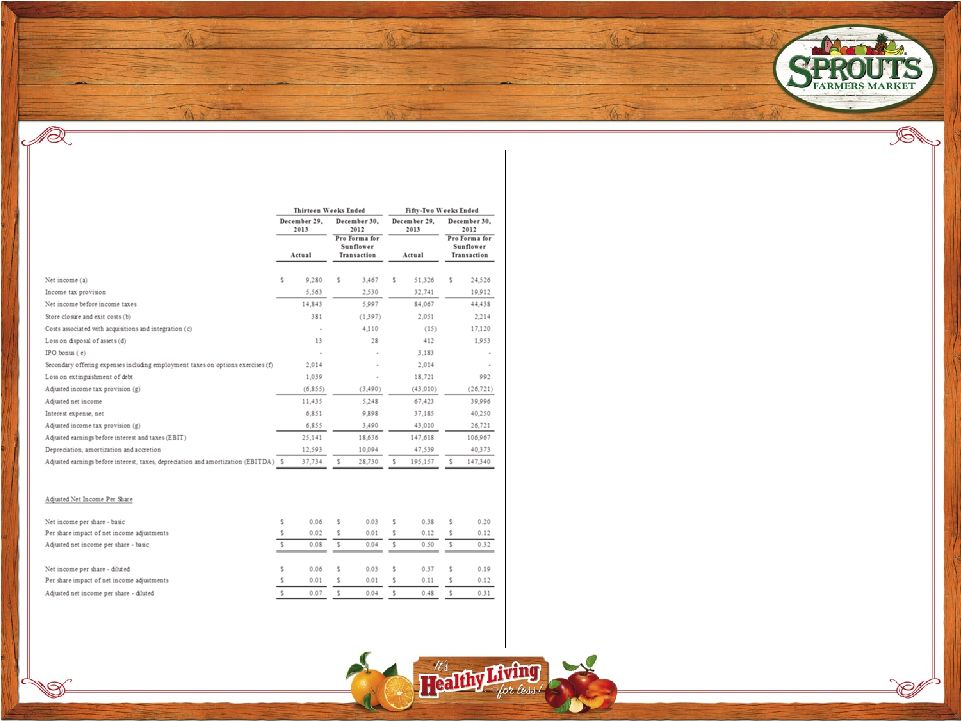 Non-GAAP Reconciliation
22
The
following
table
shows
a
reconciliation
of
adjusted
and
pro
forma
adjusted
net
income
,
and
adjusted
and
pro
forma
adjusted
EBITDA
to
net
income
for
the
thirteen
and
fifty-two
weeks
ended
December
29,
2013
and
pro
forma
net
income
for
the
thirteen
and
fifty-two
weeks
ended
December
30,
2012:
(a)
See
the
Pro
Forma
Reconciliation
included
in
this
Appendix
for
a
reconciliation
of
pro
forma
net
income
to
net
income
for
the
thirteen
and
fifty-two
weeks
ended
December
30,
2012.
(b)
Store
closure
and
exit
costs
have
been
excluded
from
adjusted
and
pro
forma
adjusted
EBITDA,
and
from
adjusted
and
pro
forma
adjusted
net
income.
In
fiscal
2013
these
costs
included
the
costs
related
to
the
closure
of
a
former
Sunflower
warehouse
facility
and
adjustments
to
sublease
assumptions
on
other
properties.
In
fiscal
2012
these
consist
primarily
of
the
costs
to
close
a
Sunflower
administrative
facility
following
the
Sunflower
Transaction
and
one
store
location
and
in
the
thirteen
weeks
ended
December
30,
2012
included
a
benefit
from
a
landlord’s
voluntary
release
of
a
lease
obligation
for
a
previously
closed
location.
(c)
Costs
associated
with
acquisitions
and
integration
represent
the
costs
to
integrate
the
combined
businesses
resulting
from
the
Sunflower
and
Henry’s
Transactions.
These
expenses
include
professional
fees
and
severance,
which
the
Company
excludes
from
its
pro
forma
adjusted
EBITDA
and
pro
forma
adjusted
net
income
to
provide
period-to-period
comparability
of
the
Company’s
operating
results
because
management
believes
these
costs
do
not
directly
reflect
the
ongoing
performance
of
its
store
operations.
(d)
Gain/Loss
on
disposal
of
assets
represents
the
gains
and
losses
recorded
in
connection
with
the
disposal
of
property
and
equipment.
The
Company
excludes
gains
and
losses
on
disposals
of
assets
from
its
adjusted
and
pro
forma
adjusted
EBITDA
and
adjusted
and
pro
forma
adjusted
net
income
to
provide
period-to-period
comparability
of
its
operating
results
because
management
believes
these
costs
do
not
directly
reflect
the
ongoing
performance
of
its
store
operations.
The
loss
recorded
in
fiscal
2012
primarily
relates
to
the
loss
on
the
sale
leaseback
of
a
store
property.
(e)
IPO
bonus
represents
the
bonuses
paid
to
certain
employees
in
connection
with
the
Company’s
initial
public
offering.
The
Company
excludes
the
IPO
bonus
from
its
adjusted
and
pro
forma
adjusted
EBITDA
and
adjusted
and
pro
forma
adjusted
net
income
to
provide
period-to-period
comparability
of
its
operating
results
because
management
believes
these
costs
do
not
directly
reflect
the
ongoing
performance
of
its
store
operations.
(f)
Secondary
offering
expenses
including
employment
taxes
on
options
exercises
represents
expenses
the
Company
incurred
in
its
second
public
offering
and
employment
taxes
paid
by
the
Company
in
connection
with
options
exercised
in
that
offering.
The
Company
has
excluded
these
items
from
its
adjusted
and
pro
forma
adjusted
EBITDA
and
adjusted
and
pro
forma
adjusted
net
income
to
provide
period-to-period
comparability
of
its
operating
results
because
management
believes
these
costs
do
not
directly
reflect
the
performance
of
its
store
operations.
(g)
Pro
forma
adjusted
and
adjusted
income
tax
provision
for
all
periods
presented
represents
the
income
tax
provision
and
pro
forma
income
tax
provision
plus
the
tax
effect
of
the
adjustments
described
in
notes
(b)
through
(e)
above
based
on
statutory
tax
rates
for
the
period.
For
the
fifty-two
weeks
ended
December
30,
2012,
this
amount
was
further
adjusted
to
reflect
a
$1.9
million
reduction
in
pro
forma
income
tax
provision
for
the
effects
of
certain
items
related
to
the
Sunflower
Transaction.
Of
the
adjustment,
$2.3
million
relates
to
the
tax
effects
of
$3.3
million
and
$2.9
million
of
non-deductible
transaction
costs
incurred
by
the
Company
and
Sunflower,
respectively,
based
on
statutory
tax
rates
for
the
period.
This
adjustment
was
partially
offset
by
a
$0.4
million
adjustment
related
to
tax
benefits
from
Sunflower
stock
option
exercises.
The
Company
has
excluded
these
items
from
its
pro
forma
adjusted
income
tax
provision
because
management
believes
they
do
not
directly
reflect
the
ongoing
performance
of
its
store
operations
and
are
not
reflective
of
its
ongoing
income
tax
provision. |
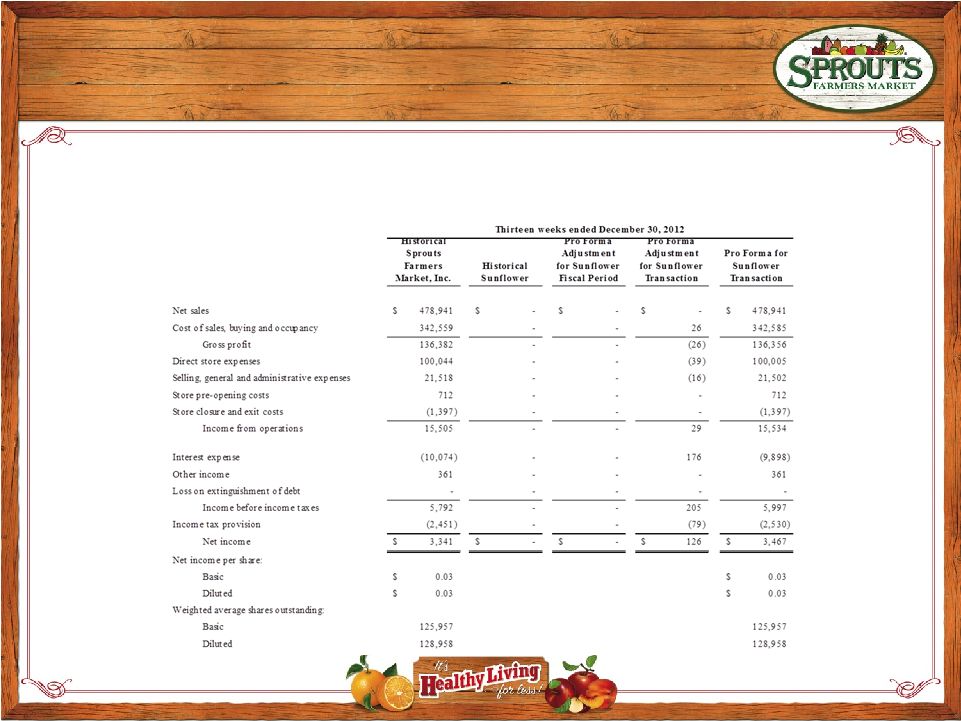 Pro Forma Reconciliation
23
SPROUTS FARMERS MARKET, INC.
UNAUDITED PRO FORMA CONDENSED CONSOLIDATED STATEMENT OF OPERATIONS
For the Thirteen Weeks Ended December 30, 2012
(in thousands, except per share amounts) |
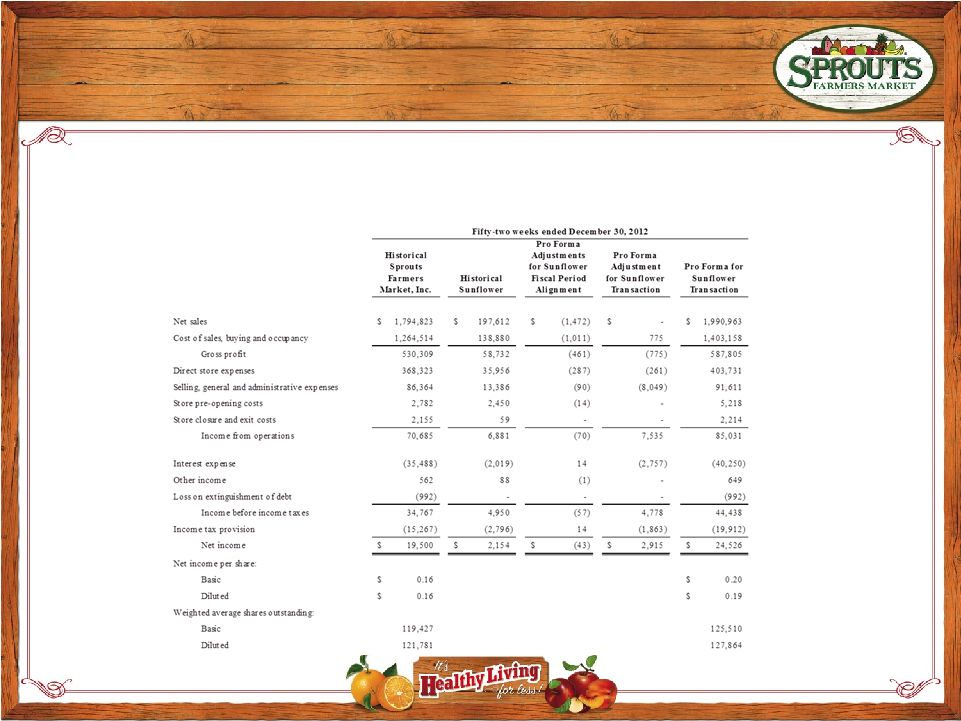 Pro Forma Reconciliation
24
SPROUTS FARMERS MARKET, INC.
UNAUDITED PRO FORMA CONDENSED CONSOLIDATED STATEMENT OF OPERATIONS
For the Fifty-two Weeks Ended December 30, 2012
(in thousands, except per share amounts) |
 Pro Forma Reconciliation
25
SPROUTS FARMERS MARKET, INC.
NOTES TO UNAUDITED PRO FORMA CONDENSED CONSOLIDATED FINANCIAL
INFORMATION 1. Basis of Presentation and Description of
Transactions Effective May 29, 2012, the Company acquired
all of the outstanding common and preferred stock of Sunflower in the Sunflower
Transaction, a transaction accounted for as a business combination,
which was financed through the issuance of debt and 14.9 million shares of
common stock.
The historical Sprouts Farmers Market, Inc. results of operations for
the thirteen and fifty-two weeks ended December 30, 2012 are
derived from its unaudited consolidated financial statements for the
periods then ended. The historical Sunflower results of operations for the
period January 1, 2012 to May 28, 2012, were derived from the
Sunflower pre-combination unaudited financial statements. Certain amounts from
the Sunflower pre-combination unaudited financial statements have
been reclassified to conform to the Company’s presentation.
2. Pro Forma for Sunflower Transaction
The historical results of operations have been adjusted to give pro
forma effect to events that are (i) directly attributable to the
Sunflower Transaction, (ii) factually supportable and (iii) expected
to have a continuing impact on the combined results, as if the Sunflower
Transaction occurred on the first day of fiscal 2012 (referred to as
“Pro Forma Adjustments for Sunflower Transaction”). Below is a description
of the types of adjustments represented in the Sunflower Fiscal Period
Alignment and Sunflower Transaction Adjustments columns.
Sunflower Fiscal Period Alignment - Sunflower’s fiscal 2012
commenced one day earlier than the Company’s fiscal 2012. Pro forma
adjustments for Sunflower Fiscal Period Alignment reflect the pro
forma impact of deducting one day from the historical Sunflower results of
operations.
Cost of Sales, Buying and Occupancy – Adjustments attributable to
the application of acquisition accounting including straight-line rent
adjustments and adjustments to the amortization of favorable lease
intangible assets and unfavorable lease liabilities. Direct
Store Expenses – Adjustments to historical Sunflower depreciation related to changes in value and estimated useful lives of
property plant and equipment.
Selling, General and Administrative Expenses – Adjustments
related to Sunflower Transaction fees recorded by both Sprouts and
Sunflower, accelerated share-based compensation recorded by
Sunflower, adjustments to depreciation related to changes in value and estimated
useful lives of property, plant and equipment and amortization of the
Sunflower trade name. Interest Expense – Adjustments
related to the reversal of historical Sunflower interest expense, incremental interest expense related to
the proceeds from additional term loan and senior subordinated notes
that were used to effectuate the transaction and interest related to Sunflower
capital and financing lease obligations.
Income Tax Provision – Adjustment to the income tax provision for
the items listed above. Net income per share – Net income
per share has been adjusted to reflect those items listed above and the change in weighted average
shares outstanding – basic and diluted as described below.
Weighted average shares outstanding – basic and diluted –
The weighted average shares outstanding basic and diluted have been
adjusted for the effect of the additional shares issued in the
Sunflower Transaction. |
 |