Attached files
| file | filename |
|---|---|
| 8-K - 8-K - SOUTH JERSEY INDUSTRIES INC | sjiwilliamscapitalpresenta.htm |

Williams Capital Conference Chicago, IL April 10, 2014

Certain statements contained in this presentation may qualify as “forward-looking statements” within the meaning of Section 27A of the Securities Act of 1933 and Section 21E of the Securities Exchange Act of 1934. All statements other than statements of historical fact included in this Report should be considered forward- looking statements made in good faith by South Jersey Industries (SJI or the Company) and are intended to qualify for the safe harbor from liability established by the Private Securities Litigation Reform Act of 1995. When used in this presentation, or any other of the Company's documents or oral presentations, words such as “anticipate,” “believe,” “expect,” “estimate,” “forecast,” “goal,” “intend,” “objective,” “plan,” “project,” “seek,” “strategy” and similar expressions are intended to identify forward-looking statements. Such forward-looking statements are subject to risks and uncertainties that could cause actual results to differ materially from those expressed or implied in the statements. These risks and uncertainties include, but are not limited to the risks set forth under “Risk Factors” in Part I, Item 1A of our Annual Report on Form 10-K. These cautionary statements should not be construed by you to be exhaustive and they are made only as of the date of this Report. While the Company believes these forward-looking statements to be reasonable, there can be no assurance that they will approximate actual experience or that the expectations derived from them will be realized. Further, SJI undertakes no obligation to update or revise any of its forward-looking statements whether as a result of new information, future events or otherwise. 2

Organization of Business Lines South Jersey Industries South Jersey Energy Solutions South Jersey Gas 3

SJES Regroups South Jersey Energy Solutions South Jersey Energy Services Marina Energy South Jersey Energy Service Plus Millennium South Jersey Energy Group South Jersey Resources Group South Jersey Energy SJ Exploration 4

Senior Management Team 5 Edward J. Graham Chairman & CEO SJI David A. Kindlick Executive Vice President SJI Stephen H. Clark CFO & Treasurer SJI & SJG Michael J. Renna President & COO SJI Jeffrey DuBois President SJG Gina Merritt-Epps, Esq. General Counsel & Corporate Secretary SJI Kathleen McEndy VP, Human Resources SJI

*Board review of dividend typically occurs at November meeting Year Increase Per Share SJI Payout Ratio Percentage Increase Peer Percentage Increase 2009 13¢ 51.4% 10.9% 4.6% 2010 14¢ 50.2% 10.6% 6.4% 2011 15¢ 51.8% 10.3% 5.0% 2012 16¢ 54.5% 9.9% 1.8% 2013 12¢ 62.4% 6.8% 4.6% Long Term Performance - Dividend Growth 6

Total Shareholder Return – 10 Yr. % 50% 100% 150% 200% 250% 300% 350% S&P 500 S&P Utilities Index Peer Group SJI Return 7 Reflects 2004-2013 Performance

Near-Term Performance 8 Economic Earnings $70 $80 $90 $100 $110 Economic Earnings ($M) 2012 2013 $93.3 $97.1 Economic Earnings Per Share* $2.00 $2.50 $3.00 $3.50 $4.00 Economic Earnings Per Share 2012 2013 $3.03 $3.03 *Includes dilutive impact of $54 million of equity raised in 2013

Near-Term Performance 9 Utility 64% Economic Earnings $97.1 Million 2013 Actual Economic Earnings Contribution Total Non-Utility 36% Utility - $62.2M Non-Utility - $34.9M

Near-Term Performance 2014 Guidance 6-12% EPS growth ($3.21 to $3.39) • Utility – Customer growth/Conversion goal – Rate case • Non-utility – Natural gas transmission capacity – Energy project portfolio 10

2014 Preview 2014 EXPECTED CONTRIBUTIONS TO EARNINGS 11 Business Segment Expected Contribution to 2014 Earnings Gas Utility Operations 60% - 65% Energy Group 6% - 15% Energy Services 20 - 30%

2014 Preview Non-Utility $128M 12 Utility $182M Planned Capital Expenditures - $310M

The Future of SJI South Jersey Gas South Jersey Energy Solutions Base Rate Case CHP/Thermal Project Development and Operation Customer Growth Renewable Project Development and Operation Accelerated Infrastructure Replacement Program (AIRP) Wholesale Marketing Opportunities Storm Hardening Asset Replacement Program (SHARP) Retail Marketing Growth Opportunities BL England Liquefaction Facility CNG Vehicle fueling 13

14

SJG Service Area 15 24” 12” 12” 12” 16” 16” 20” 20” 12” 12” 10” 24” 24” 10” 24” 16” 16” 12” • Serve the 7 southern-most counties of New Jersey • 362,000+ customers – 93% Residential – 7% Commercial/Industrial • 1.4% customer growth in 2013 • System: – 123 miles transmission – 6,250 miles distribution

Utility Growth Drivers • Rate Case – Core Filing – B.L. England – Liquefaction • Accelerated Infrastructure Replacement Program (AIRP) • Storm Hardening Asset Replacement Program (SHARP) • Customer Growth 16

Base Rate Case • Filed 11/29/13 • Covers projected $553M of infrastructure spending since last case • Requesting $62M increase in operating revenue, equating to $27.1M increase in net income • Filing requested 11% ROE and 54% Equity/Cap – Currently receiving 10.3% and 51.2% • Anticipate case settlement to benefit Q4, 2014 net income • BL England 17

Utility Capital Investment 18 $20 $40 $60 $80 $100 $120 $140 $160 $180 $200 2004 2006 2008 2010 2012 2014 E Capital Spending 2004 – 2014 ($M)

Utility Capital Investment AIRP - $38M 19 LNG - $2M* CNG- $5M* Base Capital- $116M *SHARP, LNG & CNG are special projects - $28M SHARP - $21M* 2014 SJG Projected Capital Expenditures - $182M

Utility Regulatory Proposals Valuation Methodology AIRP SHARP (as proposed) $35.3M Potential Annual Capital Investment $40.0M 51.2% X Equity/Cap Ratio 51.2% 9.75% X Current ROE 9.75% $1.8M Estimated Incremental Annual Net Income Benefit* $2.0M 20 *Generic value analysis

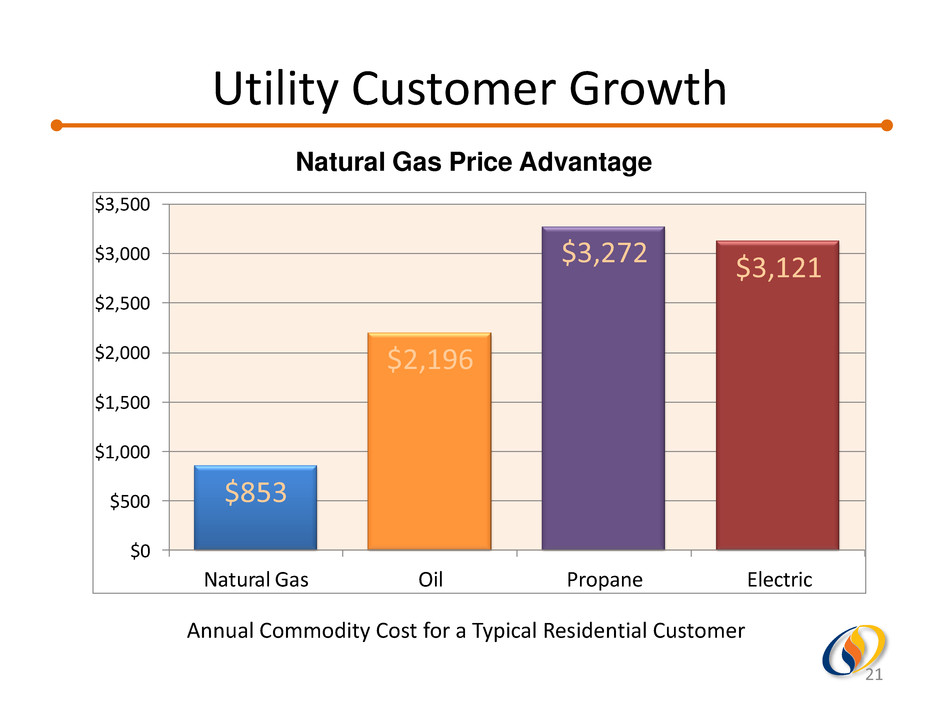
Utility Customer Growth 21 $853 $2,196 $3,272 $3,121 $0 $500 $1,000 $1,500 $2,000 $2,500 $3,000 $3,500 Natural Gas Oil Propane Electric Natural Gas Price Advantage Annual Commodity Cost for a Typical Residential Customer

Compressed Natural Gas • Station Construction – CNG pilot station announcement – Two SJG-owned stations operating, two more planned for 2014 – 5 third party owned stations in service area • Current Use – Service area throughput doubled from 2012 to 2013 • Fleet Market – Significant fleet potential as high as 90,000 vehicles – Targeting local public and private fleets • Bottom Line Impacts – Longer term 22

Utility Growth Summary Investment 2014 Incremental Net Income Benefit ($M’s) 2015 Incremental Net Income Benefit ($M’s) Rate Case - Core Filing $3.9 $8.8 - BL England 0.2 1.8 - Liquefaction – Phase II 0.4 1.7 AIRP 1.8 1.8 SHARP 0.0 2.0 Customer Growth 2.0 2.0 Total $8.3 $18.1 23 Projections are not intended to forecast total earnings for the utility, and are not inclusive of factors that may negatively impact total earnings for the future periods indicated. Projections are incremental to 2013 base year actual net income.

24

Non-Utility Growth Drivers South Jersey Energy Services • On-site energy project development • HVAC Service • Meter reading subsidiary South Jersey Energy Group • Marcellus marketing o Wholesale o Retail • Merchant generation fuel supply • Marcellus royalty interests 25

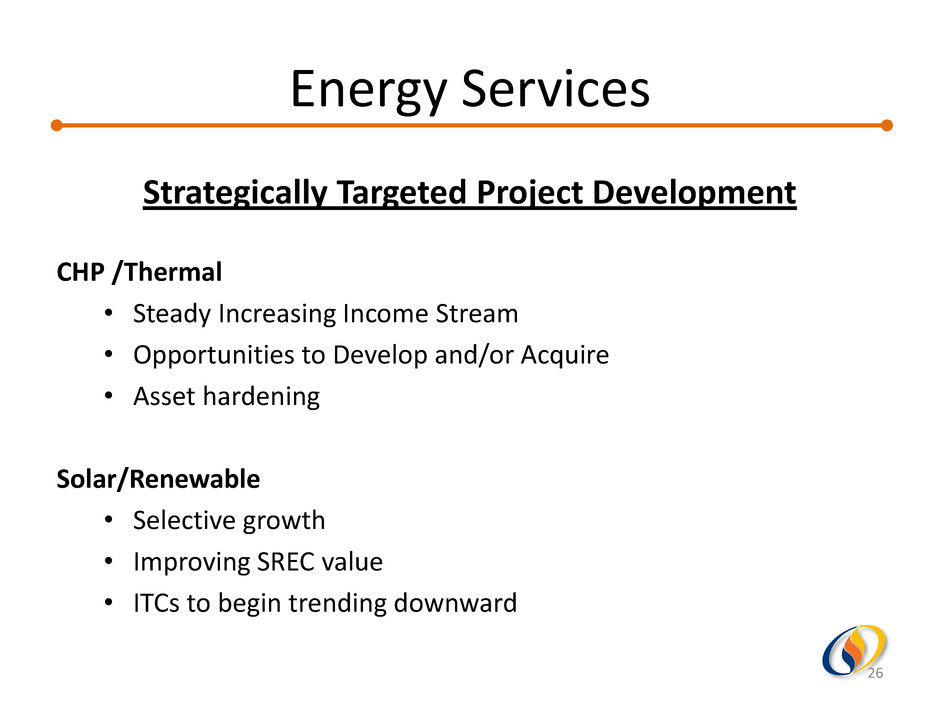
Energy Services Strategically Targeted Project Development CHP /Thermal • Steady Increasing Income Stream • Opportunities to Develop and/or Acquire • Asset hardening Solar/Renewable • Selective growth • Improving SREC value • ITCs to begin trending downward 26

Energy Services - CHP/Thermal CHP/Thermal Project Analytics • Modeled as: – 20% - 30% equity component – ROE of 15% - 20% – Joint venture ownership with long-time partner – Project financing • Target adding 1-2 new projects per year 27

Energy Services - Solar Markets • Sharp decline in construction costs • NJ Positive Trends – Slowed build rate – Strengthening SREC market – Selective grid-based development • Increasing Attractiveness of MA market – Proposed extension of solar incentive program through 2024 – Strong / Liquid SREC Market • Impact of ITC Contribution – Overall declining trend in ITC – 2014-2016 increased contribution from MA based solar projects – 2014 ITC Target - $36M 28

Energy Group – Commodity Marketing Wholesale • Merchant Generation Supply • Valuable transportation capacity • Evolving Markets • Organic Growth Retail • Organic Growth / Cross Selling • Geographic Expansion 29

Merchant Generation Contract Components Reservation Fee Fixed monthly demand charge Volume Throughput Index-based commodity price Contract Term Long-term Includes margin with significant upside from optimization of contract load against our assets and Marcellus position 30

Energy Group - Wholesale Business repositioning as fuel manager for merchant electric generating facilities • Actively negotiating multiple fuel management contract opportunities Actions taken to improve profitability • Increased capacity in region • Newly procured capacity • Restructured contracts Valuable existing relationships on supply and demand sides • Early involvement in Marcellus region • Acreage royalty rights 31

Energy Group - Retail Competitive third party electric/natural gas commodity retailer • Active in 8 states • Focus on organic growth • Geographic expansion 32

33

Liquidity & Capitalization • Target average equity/cap ratio of 50% • $54 million equity capital raised in 2013 through dividend reinvestment & optional cash purchases • Deferred tax assets of $223 million to support further investment • Moody’s Upgrade of SJG 34

Wrap Up The Future of SJI • Utility – Safety & Reliability – B.L. England – CNG – Customer Growth • Non-utility – CHP / Asset hardening – Renewable – Commodity impacts (retail and wholesale) • Capital Investment 35
