Attached files
| file | filename |
|---|---|
| EX-99.1 - EXHIBIT 99.1 - MSC INDUSTRIAL DIRECT CO INC | v374288_ex99-1.htm |
| 8-K - FORM 8-K - MSC INDUSTRIAL DIRECT CO INC | v374288_8k.htm |
Exhibit 99.2

1 Fiscal 2Q’14 Earnings Presentation April 9, 2014

2 Risks and Non - GAAP Disclosures This presentation contains forward - looking statements within the meaning of U.S. securities laws, including guidance about expec ted future results, expectations regarding our ability to gain market share, expected benefits from our investment and strategic plans, including the Barnes Distribution North America acquisition and expectations regarding future revenue and margin growth. These forward - looking statements involve risks and uncertainties that could cause actual results to differ materially from those antic ipated by these statements; are based on our current expectations; and we assume no obligation to update them. These risks include the Company’s ability to timely and efficiently integrate its recent acquisition of the business of Barnes Distribution North Ame ric a (“BDNA”) and realize the anticipated synergies from the transaction ; current economic, political, and social conditions; general economic conditions in the markets in which the Company operates ; changing customer and product mixes ; competition; industry consolidation and other changes in the industrial distribution sector ; volatility in commodity and energy prices ; the outcome of potential government or regulatory proceedings or future litigation ; credit risk of our customers ; risk of cancellation or rescheduling of customer orders ; work stoppages or other business interruptions (including those due to extreme weather conditions) at transportation centers or shipping ports ; risk of loss of key suppliers, key brands or supply chain disruptions ; dependence on our information systems ; retention of key personnel; risk of delays in opening or expanding our customer fulfillment centers or customer service centers; goodwill and intangible assets recorded as a result of our acquisitions could be impaired; disclosing our use of “conflict minerals” in certain of the products we distribute cou ld raise certain reputational and other risks; and the Company’s ability to enhance its information technology systems without disruption to o ur business operations. Information about these risks is noted in the earnings press release and in the Risk Factors and MD&A sections of our latest annual and quarterly reports filed with the SEC, as well as in our other SEC filings. Investors are cautioned not to place undue relianc e o n these forward - looking statements . Throughout this conference call we will reference both GAAP and adjusted financial results, which are non - GAAP financial measure s. Please refer to the reconciliation tables at the end of this presentation and at the end of our earnings release for a reconciliation of the adjusted financial measures to the most directly comparable GAAP measures .
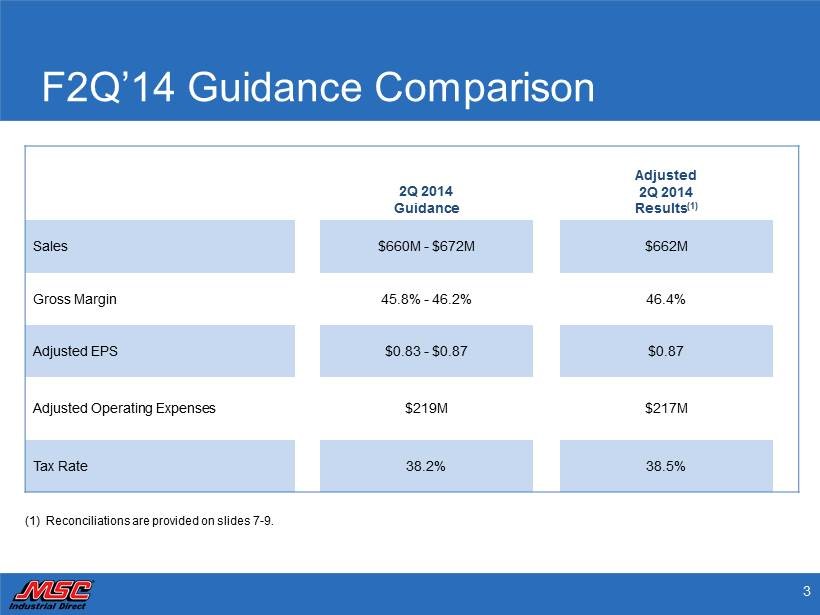
3 F2Q’14 Guidance Comparison 2Q 2014 Guidance Adjusted 2Q 2014 Results (1) Sales $660M - $672M $662M Gross Margin 45.8% - 46.2% 46.4% Adjusted EPS $0.83 - $0.87 $0.87 Adjusted Operating Expenses $219M $217M Tax Rate 38.2% 38.5% (1) Reconciliations are provided on slides 7 - 9.
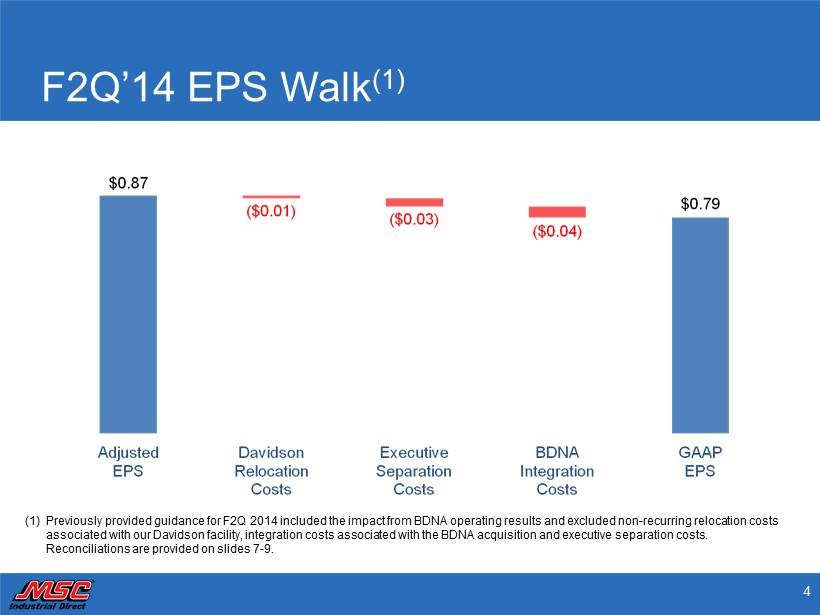
4 F2Q’14 EPS Walk (1) (1) Previously provided guidance for F2Q 2014 included the impact from BDNA operating results and excluded non - recurring relocation costs associated with our Davidson facility, integration costs associated with the BDNA acquisition and executive separation costs. Reconciliations are provided on slides 7 - 9.
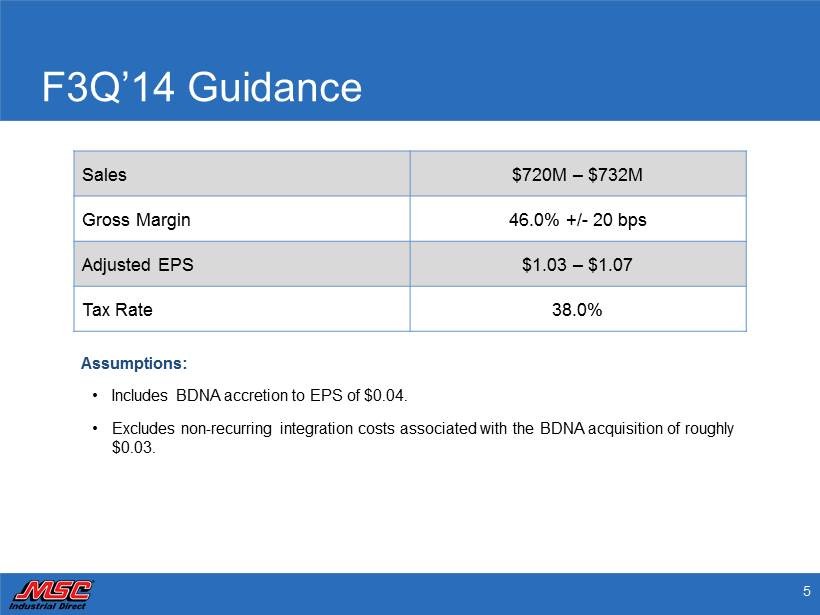
5 F3Q’14 Guidance Sales $720M – $732M Gross Margin 46.0% +/ - 20 bps Adjusted EPS $1.03 – $1.07 Tax Rate 38.0% Assumptions: • Includes BDNA accretion to EPS of $0.04. • Excludes non - recurring integration costs associated with the BDNA acquisition of roughly $0.03.
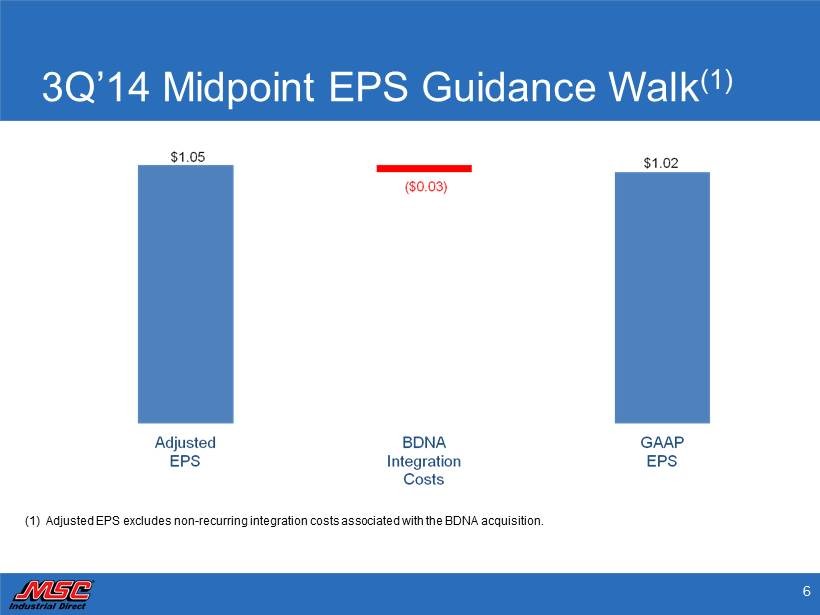
6 3Q’14 Midpoint EPS Guidance Walk (1) (1) Adjusted EPS excludes non - recurring integration costs associated with the BDNA acquisition.
7 Reconciliations Non - GAAP Financial Measures To supplement MSC’s unaudited selected financial data presented on a basis consistent with Generally Accepted Accounting Prin cip les (“GAAP”), the Company discloses certain non - GAAP financial measures, including adjusted operating income, adjusted net income, and adjusted ne t income per diluted share. The adjusted supplemental measures exclude non - recurring costs associated with the Barnes Distribution North America (“BD NA”) acquisition, the co - location of our corporate headquarters in Davidson, North Carolina and executive separation costs and the related tax effects . T hese non - GAAP measures are not in accordance with or an alternative for GAAP, and may be different from non - GAAP measures used by other companies. We believe that these non - GAAP measures have limitations in that they do not reflect all of the amounts associated with MSC's results of operations as det ermined in accordance with GAAP and that these measures should only be used to evaluate MSC’s results of operations in conjunction with the correspondin g G AAP measures. The presentation of this additional information is not meant to be considered in isolation or as a substitute for the most direct ly comparable GAAP measures. We compensate for the limitations of non - GAAP financial measures by relying upon GAAP results to gain a complete picture of Company performance. In calculating “adjusted” non - GAAP financial measures, we exclude the non - recurring costs described above to facilitate a review of the comparability of the Company’s operating performance on a period - to - period basis because such costs are not, in our view, related to the Company’s on going operational performance. We use the “adjusted” non - GAAP measures to evaluate the operating performance of our business, for comparison with forecasts and strategic plans, and for benchmarking performance externally against competitors. In addition, we use the “adjusted” non - GAAP f inancial measures as performance metrics for management incentive programs. Since we find these measures to be useful, we believe that investors ben efit from seeing results “through the eyes” of management in addition to seeing GAAP results. We believe that the “adjusted” non - GAAP measures, when rea d in conjunction with the Company’s GAAP financials, provide useful information to investors by offering: • the ability to make more meaningful period - to - period comparisons of the Company’s on - going operating results; • the ability to better identify trends in the Company’s underlying business and perform related trend analyses; and • a better understanding of how management plans and measures the Company’s underlying business. The following tables reconcile GAAP operating income, GAAP net income and GAAP net income per diluted share (“EPS”) to non - GAAP adjusted operating income, adjusted net income, and adjusted net income per diluted share.
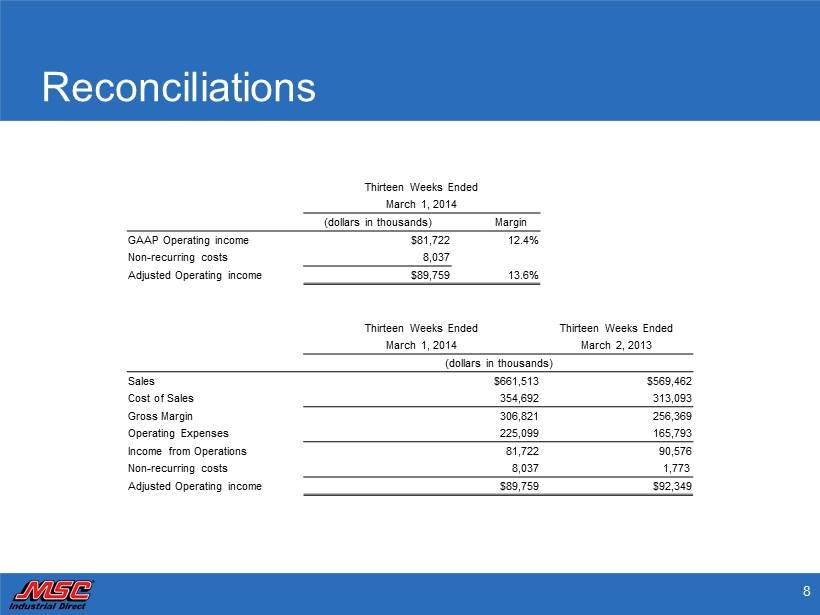
8 Reconciliations Thirteen Weeks Ended March 1, 2014 (dollars in thousands) Margin GAAP Operating income $81,722 12.4% Non - recurring costs 8,037 Adjusted Operating income $89,759 13.6% Thirteen Weeks Ended Thirteen Weeks Ended March 1, 2014 March 2, 2013 (dollars in thousands) Sales $661,513 $569,462 Cost of Sales 354,692 313,093 Gross Margin 306,821 256,369 Operating Expenses 225,099 165,793 Income from Operations 81,722 90,576 Non - recurring costs 8,037 1,773 Adjusted Operating income $89,759 $92,349
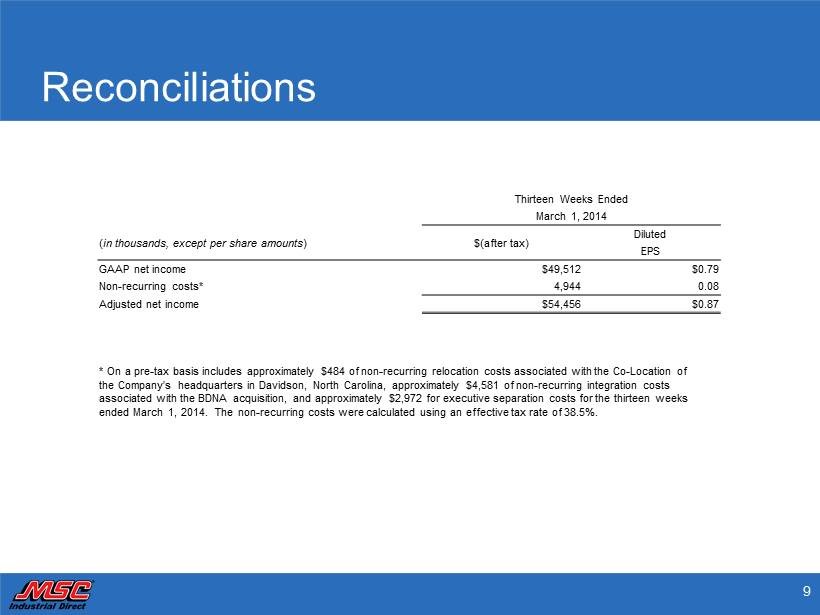
9 Reconciliations Thirteen Weeks Ended March 1, 2014 ( in thousands, except per share amounts ) $(after tax) Diluted EPS GAAP net income $49,512 $0.79 Non - recurring costs* 4,944 0.08 Adjusted net income $54,456 $0.87 * On a pre - tax basis includes approximately $484 of non - recurring relocation costs associated with the Co - Location of the Company’s headquarters in Davidson, North Carolina, approximately $4,581 of non - recurring integration costs associated with the BDNA acquisition, and approximately $2,972 for executive separation costs for the thirteen weeks ended March 1, 2014. The non - recurring costs were calculated using an effective tax rate of 38.5%.