Attached files
| file | filename |
|---|---|
| 8-K - FORM 8-K - MOSAIC CO | d707712d8k.htm |
 Sulphur World Symposium 2014
Long Beach, CA
April 7-9, 2014
Dr. Michael R. Rahm
Vice President
Market and Strategic Analysis
Phosphate Outlook
Exhibit 99.1 |
 Topics
Current Situation and Near Term Outlook
–
The Rally
–
The Sky Really is Falling
–
The Inverse
–
The Fundamentals
Long Term Outlook
–
The Demand Drivers and Forecasts
–
The New Supply Ballgame
–
The Likely Scenario: Positive and More Stable
–
The Key Factors to Watch |
 3
Safe Harbor Statement
This presentation contains forward-looking statements within the meaning of the Private Securities
Litigation Reform Act of 1995. Such statements include, but are not limited to, statements
about the acquisition and assumption of certain related liabilities of the Florida phosphate
assets of CF Industries, Inc. (“CF”) and the ammonia supply agreements with CF; the benefits of the transactions with CF;
repurchases of stock; other proposed or pending future transactions or strategic plans and other
statements about future financial and operating results. Such statements are based upon the
current beliefs and expectations of The Mosaic Company’s management and are subject to
significant risks and uncertainties. These risks and uncertainties include but are not limited to risks and uncertainties arising from
difficulties with realization of the benefits of the transactions with CF, including the risks that
the acquired assets may not be integrated successfully or that the cost or capital savings from
the transactions may not be fully realized or may take longer to realize than expected, or the
price of natural gas or ammonia changes to a level at which the natural gas based pricing under one of the long term ammonia supply
agreements with CF becomes disadvantageous to Mosaic; customer defaults; the effects of Mosaic’
decisions to exit business operations or locations; the predictability and volatility of, and
customer expectations about, agriculture, fertilizer, raw material, energy and transportation
markets that are subject to competitive and other pressures and economic and credit market conditions;
the level of inventories in the distribution channels for crop nutrients; changes in foreign
currency and exchange rates; international trade risks and other risks associated with
Mosaic’s international operations and those of joint ventures in which Mosaic participates, including the risk that protests against
natural resource companies in Peru extend to or impact the Miski Mayo mine; changes in government
policy; changes in environmental and other governmental regulation, including greenhouse
gas regulation, implementation of numeric water quality standards for the discharge of
nutrients into Florida waterways or possible efforts to reduce the flow of excess nutrients into the Mississippi River basin or the
Gulf of Mexico; further developments in judicial or administrative proceedings, or complaints that
Mosaic’s operations are adversely impacting nearby farms, business operations or
properties; difficulties or delays in receiving, increased costs of or challenges to necessary
governmental permits or approvals or increased financial assurance requirements; resolution of global
tax audit activity; the effectiveness of the Company’s processes for managing its
strategic priorities; the ability of the Northern Promise joint venture among Mosaic, Ma’aden and
SABIC to obtain project financing in acceptable amounts and upon acceptable terms, the future success
of current plans for the joint venture and any future changes in those plans; adverse
weather conditions affecting operations in Central Florida, the Mississippi River basin
or the Gulf Coast of the United States, and including potential hurricanes, excess rainfall or drought; actual costs of various items
differing from management’s current estimates, including, among others, asset retirement,
environmental remediation, reclamation or other environmental regulation, Canadian resources
taxes and royalties, the liabilities Mosaic is assuming in the proposed phosphate assets
acquisition or the cost of Mosaic’s commitments to repurchase its stock; reduction of
Mosaic’s available cash and liquidity, and increased leverage, due to its use of cash
and/or available debt capacity to fund share repurchases, financial assurance requirements and strategic
investments; brine inflows at Mosaic’s Esterhazy, Saskatchewan, potash mine or other potash shaft
mines; other accidents and disruptions involving Mosaic’s operations, including potential
mine fires, floods, explosions, seismic events or releases of hazardous or volatile
chemicals, as well as other risks and uncertainties reported from time to time in The Mosaic
Company’s reports filed with the Securities and Exchange Commission. Actual results may
differ from those set forth in the forward-looking statements. |
 Current Situation and Near Term Outlook:
The Rally |
 The Phosphate Market
Catches Fire 5
The price of DAP loaded on a barge in New Orleans (NOLA)
increased from about $330 per ton at the end of November to
about $500 ton at the end of March.
The price of DAP loaded on a vessel in Tampa increased from
about $340 per tonne at the end of November to the $490-500
tonne range at the end of March.
200
300
400
500
600
700
05
06
07
08
09
10
11
12
13
14
$ MT
Weekly DAP Prices
fob Tampa
Source: Fertecon
100
200
300
400
500
600
05
06
07
08
09
10
11
12
13
14
$ ST
Weekly DAP Prices
NOLA Barge
Source: Green Markets |
 A
Combination of Factors Fueled the Rally
Continued good end-user demand and lean channel inventories
Several small planned and unplanned production outages
Supply disruptions due to severe logistical problems
Raw materials cost pressure
A rush of purchases once buyers perceived the bottom was in
|
 Continued Good End-User Demand
7 |
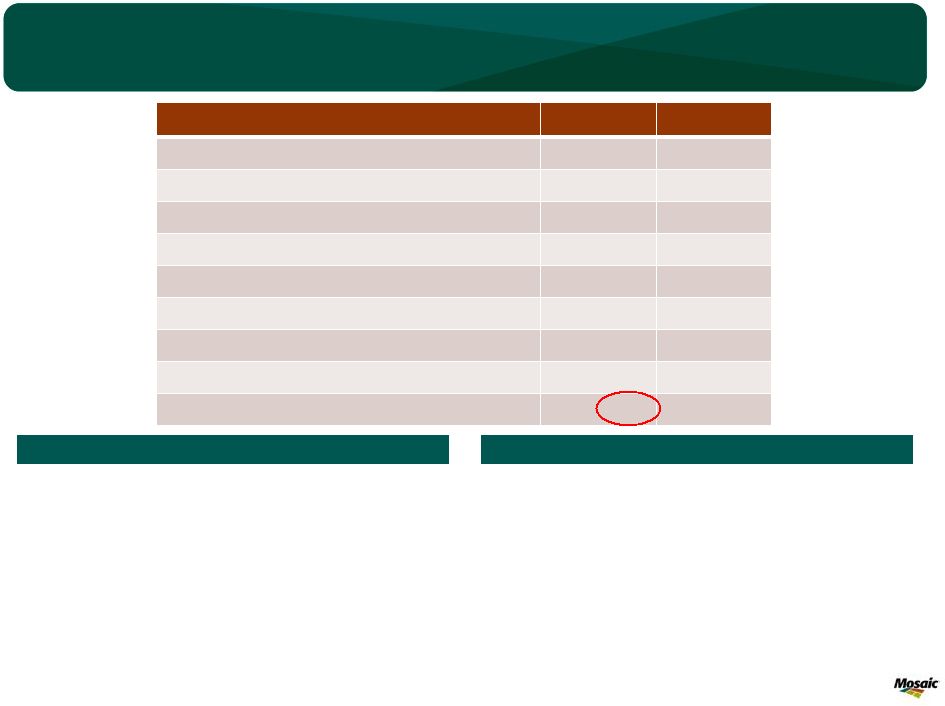 Lean
Channel Inventories: India Example 8
Million Tonnes DAP
2013/14E
2014/15F
Producer/Importer Beginning Inventory
1.45
1.60
Production
3.60
3.70
Imports
3.45
5.35
Producer/Importer Sales to Retailer Dealers
6.90
9.20
Retail Dealer Sales to Farmers
9.40
9.60
Retail Inventory Change
-2.50
-0.40
Producer/Importer Ending Inventory
1.60
1.45
Producer/Importer Inventory Change
0.15
-0.15
Total Pipeline Inventory Change
-2.35
-0.55
DAP use by farmers is projected to increase about 2% in 2014/15.
This assumes another good monsoon and continued profitable farm
economics.
Even if channel inventories are drawn down another 550,000 tonnes
and production increases to 3.7 million tonnes, producer/importer
sales to retailers would need to increase 33% to 9.20 million tonnes
and imports would need to increase 55% to 5.35 million tonnes in
order to meet projected demand.
These projections no doubt will change due to several factors such as
the
level
of
phosphoric
acid
prices,
the
quality
of
the
monsoon,
etc.,
but it looks likely that India’s appetite for DAP imports will increase
significantly in 2014/15 with a potential rebound of ~2.0 million
tonnes. 2014/15
2013/14
Our
Delhi
team
estimates
that
DAP
use
by
farmers
remained
strong
in
2013/14 due to an outstanding monsoon, record acreage and
profitable farm economics. The government raised minimum support
prices for major crops, retail urea prices stayed stable at the
extremely low level of $80-$85 per tonne, and retail P&K prices, while
up sharply from pre-reform levels, declined modestly in 2013/14.
As a result, retail dealer sales to farmers are projected to total 9.4
million tonnes for the fertilizer year ending March 31, 2014. Producer
and importer sales to retailer dealers, however, are projected to drop
to 6.9 million tonnes, implying a retail inventory decline of 2.5 million
tonnes. Producer/importer inventories are projected to increase
slightly in 2013/14.
Source: FAI and Mosaic |
 Cumulative Impact of Several Production Outages
9
Producer
Estimated Q1 Loss
Notes
OCP
200,000 DAP/MAP
Product loading and raw materials discharge delays
ICL
25,000 TSP
Intermittent labor disputes (a strike began March 13)
GCT
30,000 DAP
Gabes still running at ~50% of capacity
Fauji
75,000 DAP
Re-starts after gas supply shortage
Ma’aden
10,000 DAP
Fire aftermath and heavy rains at mines
Uralchem
50,000 MAP
Rock supply issues from Apatit in Q1 and into Q2
Incitec
20,000 DAP
Running below capacity and 35 day turnaround in Q2
Foskor
15,000 MAP
Technical disruptions for approximately three weeks
Mosaic
150,000 DAP/MAP
Planned Riverview #5 plant conversion
PotashCorp
40,000 DAP
Aurora turnaround in March
MissPhos
15,000 DAP
Conversion from DAP to MAP
Total
~630,000
DAP/MAP/TSP
Significant cumulative impact |
 Raw Materials Cost
Pressure 10
Now from ammonia
First from sulphur (especially in China)
0
50
100
150
200
250
300
350
06
07
08
09
10
11
12
13
14
$ MT
Sulphur Prices
c&f China
Source: Fertecon
100
200
300
400
500
600
700
800
05
06
07
08
09
10
11
12
13
14
$ MT
Ammonia Prices
c&f Tampa
Source: Fertecon |
 A
Buyers Rush: Picking Up the Knife (and starting a fight)
11
Once distributors perceived that prices had bottomed, or that
knives had hit the floor, they rushed to position product.
Based on the recent spikes in nitrogen and phosphate prices,
distributors not only have picked up the knives, but they have
started a few fights as they compete to position product for the
upcoming application season.
In the case of phosphate, the combination of continued strong
end-user demand, a lean distribution pipeline and the
cumulative impact of several small planned and unplanned
production outages has tightened the global market and
changed sentiment overnight. As a result, phosphate prices
are staging a powerful and earlier-than-expected rally during
what typically is a seasonally slow period.
So, how will this knife fight end? The phosphate market no
doubt is tight due to recent developments, and our
assessment is that there is more upside than downside price
risk in the near term. However, Chinese export economics
likely will set a ceiling later in 2014. In the meantime, a fight
for tonnage rages on.
Available on Mosaicco.com |
 Current Situation and Near Term Outlook:
The Sky Really is Falling |
 The Sky Really is Falling
The Annual Spring Ritual
–
Warnings of transportation bottlenecks, rail car/truck shortages
and shipping delays
–
Warnings of stock-outs and lost demand
–
But the Sky Never Falls
The Sky Really is Falling this Year
–
Serious disruptions in Q1
–
Morocco –
OCP
•
Flagship
facility
at
Jorf
Lasfar
battered
by
heavy
rain,
high
winds
and
25’
sea
swells
in
Q1
•
Reports of ~40 vessels waiting to unload raw materials or load finished product at
one point •
Long shipping delays to key destinations such as Brazil and USA
–
North America –
The Perfect Storm
•
Lock and dam maintenance at key points on the Mississippi River
(Mel Price L&D at 50% until August) •
Record
NA
harvest
boosts
demand
for
rail
cars,
power
and
crews
(Canada
prioritizing
grain)
•
Heavy demand on rail assets for other commodities as well (e.g.
oil, fracking sand) •
Extreme weather exacerbates the problem (snowed-in trains to a late river open April 15-23)
•
Fall-out and implications |
 The
Problem in Pictures 14
0
50,000
100,000
150,000
200,000
250,000
300,000
350,000
400,000
450,000
06
06
06
06
06
06
06
06
06
06
06
06
07
07
07
07
07
07
07
07
07
07
07
07
08
08
08
08
08
08
08
08
08
08
08
08
09
09
09
09
09
09
09
09
09
09
09
09
10
10
10
10
10
10
10
10
10
10
10
10
11
11
11
11
11
11
11
11
11
11
11
11
12
12
12
12
12
12
12
12
12
12
12
12
13
Carloads
Originated Carloads of Crude Oil
on U.S. Class I Railroads
Source: AAR
The Canadian government introduced regulations aimed at easing the grain logistics
bottleneck. These require CN and CP to ship at least 500,000 tonnes
of grains (~5,500 railcars) each week, about double their current
volume. If
the
railways
fail
to
meet
the
minimum
shipments,
they
will
be
charged
C$100,000
each
day
they
are
not
in
compliance
(though
there
is
a
‘catch
up’
period). |
 A
Silver Lining - Latitudinal Stratification?
15
A More Normal/Orderly Spring Application Season? |
 Current Situation and Near Term Outlook:
The Inverse |
 The
Inverse 17
Long List of Reasons for the Large Inverse
Source: Cleartrade Exchange via INTL FCStone
March 31, 2014 DAP SWAPs Bid-Offer Indications
Current Spot Values
NOLA Barge: ~$500 ton (prompt loading)
Tampa Export: ~$490 tonne
Logistical bottlenecks ease
Between seasons in the Americas
Uncertainties about India’s import appetite
China export window opens May 16
Ramp-up of production in key regions
Lower raw materials costs
2014/15 demand uncertainties |
 Current Situation and Near Term Outlook:
The Fundamentals |
 The Fundamentals
Record Global Shipments and Import Demand
–
Positive demand drivers
–
Lower
channel
inventories
worldwide
–
India
poster
child
–
Continued strong demand in the America
–
Rebound in Indian imports
Ongoing Supply Uncertainties
–
Raw materials costs?
–
How much will China export?
–
When will Ma’aden Phase I ramp up to capacity?
–
How much will OCP produce and export?
–
When will the first Jorf Phosphate Hub come online?
–
How much will Tifert produce and when will Jifco start up?
Most Likely Scenario
–
Balanced during the next six months (average U.S. producer stocks)
–
Tighter situation by September/October (less than average U.S. producer
stocks) |
 Record Global
Shipments and Import Demand 20
30
35
40
45
50
55
60
65
70
00
01
02
03
04
05
06
07
08
09
10
11
12
13E
14F
Global Phosphate Shipments
Likely Scenario
MMT Product
DAP/MAP/MES/TSP
Source:
Fertecon
&
Mosaic
0
5
10
15
20
25
00
01
02
03
04
05
06
07
08
09
10
11
12
13E
14F
MMT
Source: CRU/FRC and Mosaic
Global
Phosphate
Import
Demand
Likely
Scenario
excluding
China
Asia and Oceania
Latin America
Europe
Mideast
Africa
North America
FSU |
 Positive Demand
Drivers 21
Recent Rally Drivers/Comments
3.50
4.00
4.50
5.00
5.50
6.00
6.50
7.00
7.50
8.00
J
A
S
O
N
D
J
F
M
A
M
J
US$ BU
New Crop Corn Prices
Daily
Close
of
the
New
Crop
Option
(Jul
1
-
Jun
30)
2008
2012
2013
2014
Source: CME
8.0
9.0
10.0
11.0
12.0
13.0
14.0
15.0
16.0
17.0
J
A
S
O
N
D
J
F
M
A
M
J
US$ BU
New Crop Soybean Prices
Daily
Close
of
the
New
Crop
Option
(Jul
1
-
Jun
30)
2008
2012
2013
2014
Source: CME
4.00
5.00
6.00
7.00
8.00
9.00
10.00
11.00
12.00
13.00
J
A
S
O
N
D
J
F
M
A
M
J
US$ BU
New Crop Hard Red Winter Wheat Prices
Daily
Close
of
the
New
Crop
Option
(Jul
1
-
Jun
30)
2008
2012
2013
2014
Source: CME
Wheat: strong demand, severe NA winter and
deteriorating crop conditions, drought in parts of USA,
and recent developments in Ukraine
Corn: strong demand rebound in all major use
categories, smaller second crop in Brazil this year,
and concerns about late planting in NA
Soybeans: strong demand, drought in parts of Brazil
(smaller than expected but still record soybean crop),
and concerns about late planting in NA
Soybean/corn new crop price ratio was 2.38 on
March 31. Will that result in more corn acres than the
Prospective Plantings indication? |
 Price Rally Despite a
Blockbuster 2013 Crop 22
The USDA projects that 2013/14 global grain and oilseed
production
will
surge
to
a
record-smashing
2.95
billion
tonnes
due to record harvested area and a record average yield.
Global grain and oilseed use increased at a compound annual
growth rate of 2.4% during the five years prior to 2012. Use
increased just 0.4% in 2012 due to the short crop last year (but
still the second largest ever produced!). USDA projects that
global use will jump 4.5% in 2013 due to ample supplies, more
moderate prices, and an unleashing of pent-up demand.
If current supply and demand projections are on target, global
grain and oilseed stocks will increase significantly this year and
make up all of the declines during the last three years.
Crop prices drop in 2013/14 to
unleash pent up demand, but the
decline is less than expected by
some analysts (i.e. no sub $3 corn)
Crop prices surge in 2012/13 to allocate the
smaller than expected crop to its highest
valued uses, but increases are less than
expected by some analysts (i.e. no $10 corn).
2.0
2.1
2.2
2.3
2.4
2.5
2.6
2.7
2.8
2.9
3.0
00
01
02
03
04
05
06
07
08
09
10
11
12
13E
Bil Tonnes
World Grain and Oilseed Production
Production
Use
Source: USDA
15%
18%
20%
23%
25%
28%
30%
350
400
450
500
550
600
650
00
01
02
03
04
05
06
07
08
09
10
11
12
13E
Percent
Mil Tonnes
World Grain & Oilseed Stocks
Stocks
Percent of Use
Source: USDA
2.40
2.50
2.60
2.70
2.80
2.90
3.00
3.10
3.20
800
820
840
860
880
900
920
940
00
01
02
03
04
05
06
07
08
09
10
11
12
13E
MT Ha
Mil Ha
World Grain and Oilseed Area and Yields
Harvested Area
Yield
Trend
Source: USDA |
 Wide Range of Potential Outcomes in 2014/15
23
606
579
494
407
470
463
426
438
514
570
549
536
519
571
350
400
450
500
550
600
650
00
01
02
03
04
05
06
07
08
09
10
11
12
13E
14F
Mil Tonnes
World Grain & Oilseed Stocks
Historical
2014/15 Range
2014/15 Medium Scenario
Source: USDA and Mosaic |
 Positive Farm
Economics and Affordable Nutrients 24
0
20
40
60
80
100
120
140
80
83
86
89
92
95
98
01
04
07
10
13F
Bil $
U.S. Net Cash Income
Government Payments
Market
Source: USDA
0.50
0.75
1.00
1.25
1.50
1.75
05
06
07
08
09
10
11
12
13
14
Plant Nutrient Affordability
Plant Nutrient Price Index / Crop Price Index
Affordability Metric
Average
Source:
Weekly
Price
Publications,
CME,
USDA, AAPFCO, Mosaic |
 Strong Rebound in
Indian DAP Imports 25
Source: FAI and Mosaic
Million Tonnes
DAP
2013/14E
2014/15F
Producer/Importer
Beginning
Inventory
1.45
1.60
Production
3.60
3.70
Imports
3.45
5.35
Producer/Importer Sales to Retailer Dealers
6.90
9.20
Retail Dealer Sales to Farmers
9.40
9.60
Retail Inventory Change
-2.50
-0.40
Producer/Importer
Ending
Inventory
1.60
1.45
Producer/Importer
Inventory
Change
0.15
0.15
Total
Pipeline
Inventory
Change
-2.35
-0.55
1.2
1.8
1.3
3.3
3.6
5.5
3.8
4.2
2.6
3.3
1.2
1.0
1.5
3.0
2.2
2.1
3.4
1.5
0.9
2.0
0.0
1.0
2.0
3.0
4.0
5.0
6.0
7.0
8.0
06
07
08
09
10
11
12
13
14F
15F
Mil Tonnes
Fertilizer Year Ending March 31
India DAP Imports
Kariff (Apr 1-Sep 30)
Rabi (Oct 1-Mar 31)
Source: FAI and Mosaic India |
 Supply Uncertainties
– How Much . . .
26
. . . phosphate will China export?
. . . phosphate will Saudi Arabia export?
Key Issues
Key Issues
0.0
0.5
1.0
1.5
2.0
2.5
3.0
00
01
02
03
04
05
06
07
08
09
10
11
12
13E
14F
Mil Tonnes
DAP
Saudi Arabia Phosphate Exports
Export
Production Capacity
Source: CRU February 2014
0.0
1.0
2.0
3.0
4.0
5.0
6.0
7.0
00
01
02
03
04
05
06
07
08
09
10
11
12
13E
14F
China Phosphate Exports
Source: CRU February 2014
Mil Tonnes
DAP/MAP/TSP
Indian import demand
Domestic off-take
Raw materials costs
Less costly 2014 export tax
Indian import demand
Mine and plant ramp-up |
 Long Term Outlook:
The Demand Drivers and Forecasts |
 Solid Demand Drivers
– The Food Story
28
Available on Mosaicco.com
1.75
2.00
2.25
2.50
2.75
3.00
3.25
3.50
3.75
775
800
825
850
875
900
925
950
975
80
85
90
95
00
05
10
15
20
25
30
MT Ha
Mil Ha
Source: USDA and Mosaic
World Harvested Area and Average Yield
Actual Area
Forecast Area
Actual Yield
Required Yield
1980-10 Yield Trend
1,000
1,500
2,000
2,500
3,000
3,500
80
85
90
95
00
05
10
20
30
Mil Tonnes
Source: USDA and Mosaic
World Grain and Oilseed Use
Actual for Biofuels
Actual
Forecast for Biofuels
Forecast |
 Positive Demand
Outlook 29
Key Assumptions
More moderate but sill elevated crop prices
Profitable farm economics worldwide
More moderate and less volatile phosphate prices
Drive for more balanced nutrient use especially in
China and India
Continued strong growth of phosphate intensive
crops such as soybeans, palm oil and fruits &
vegetables.
20
30
40
50
60
70
80
95
97
99
01
03
05
07
09
11
13E
15F
17F
19F
Mil Tonnes
Global DAP/MAP/TSP Shipment Forecasts
Actual
Low Forecast
High Forecast
Likely Forecast
CRU
-
Feb
2014 |
 Key Demand Features
Brazil
–
Continued strong demand prospects
–
Modest increases in domestic production capabilities
–
Still
largely
dependent
on
imports
(~6
million
tonnes
DAP/MAP/MES/TSP
in
2020)
India
–
Demand gets back on track
–
Inevitable changes in subsidy policies
–
DAP shipments of nearly 14 million tonnes by 2020
–
DAP imports of nearly 10 million tonnes by 2020 |
 Long Term Outlook:
The New Supply Ballgame |
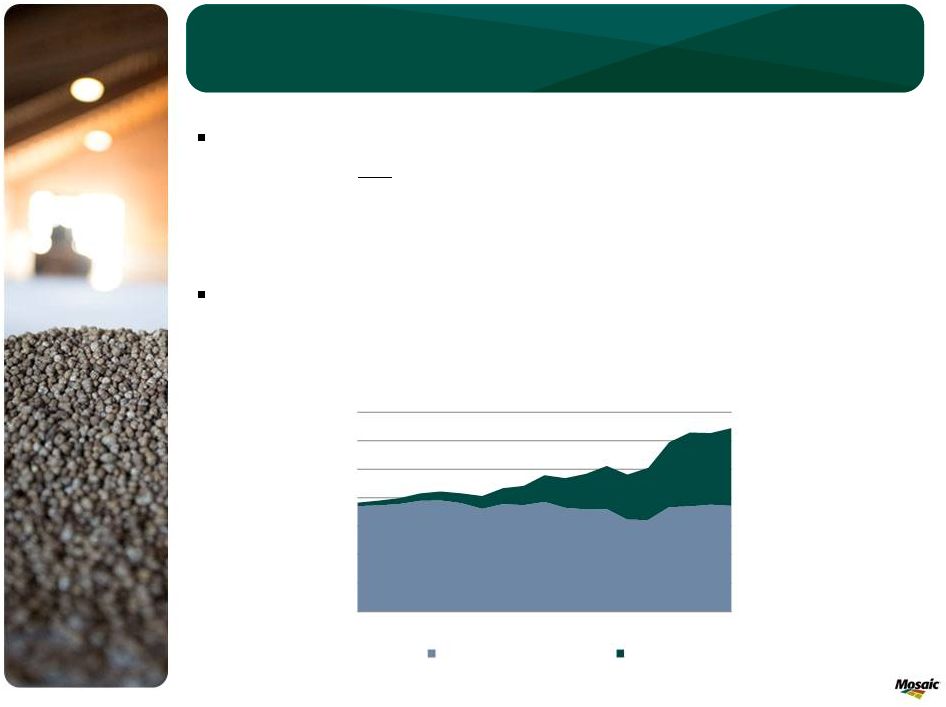 Key Supply
Feature China
–
Accounted
for
ALL
of
the
net
growth
in
phosphate
supply
since
1995
–
Massive 15-year expansion program expected to come to an end
–
Domestic industry consolidation
–
Transition from low-analysis to high-analysis phosphate products
Future Supply Growth Largely from New Low Cost Capacity
–
Morocco
–
Saudi Arabia
0
10
20
30
40
50
60
70
95
97
99
01
03
05
07
09
11
13E
MMT
Global DAP/ MAP/ TSP Production
Rest of World
China
Source: Fertecon, IFA and Mosaic |
 Long Term Outlook:
The Likely Scenario: Positive and More Stable |
 Positive and More Stable Outlook
34
50%
55%
60%
65%
70%
75%
80%
85%
90%
95%
100%
0
10
20
30
40
50
60
70
80
90
100
2000
2004
2008
2012
2016
2020
Op Rate
MMT
Source: CRU/FRC and Mosaic
Global Phosphate Capacity, Production and Oper Rate
Likely Scenario
Capacity
Production
Acid Op Rate
Based on our likely demand scenario and capacity estimates, global phosphoric acid
operating rates are projected to remain relatively stable at about 85% of
effective capacity from 2014 through 2020. This is in line with the
average since 2000, but projected rates do not exhibit as much volatility as
during the last decade. |
 Long Term Outlook:
The Key Factors to Watch |
 The Key Factors to Watch
Demand Drivers
–
Macroeconomic
environment
(e.g.
global
growth
and
exchange
rates)
–
Agricultural commodity prices and farm economics
–
Biofuels policies
–
Indian subsidy policies
–
Technological change (e.g. biologicals)
–
Social Change (e.g. dietary habits in both developed and developing countries)
Supply Developments
–
Chinese industrial and export policies
–
Corporate strategies (e.g. Jorf Phosphate Hub developments and Ma’aden expansions)
–
Political developments (e.g. How will the Arab Spring play out)
–
Environmental regulations (right to operate issues worldwide) |
 Sulphur World Symposium 2014
Long Beach, CA
April 7-9, 2014
Dr. Michael R. Rahm
Vice President
Market and Strategic Analysis
Phosphate Outlook
Thank You! |