Attached files
| file | filename |
|---|---|
| 8-K - 8-K - CHRISTOPHER & BANKS CORP | form8-kdoughertyrsx0414.htm |

Charting Our Path to Growth and Long-Term Profitability April, 2014

Certain statements on the slides which follow may be forward-looking statements about Christopher & Banks Corporation (the “Company”). Such forward-looking statements involve risks and uncertainties which may cause actual results to differ. These forward-looking statements may be identified by such terms as “will”, “expect”, “believe”, “anticipate”, “outlook”, “target”, “plan”, “initiatives”, “estimated”, “strategy” and similar terms. You are directed to the cautionary statements regarding risks or uncertainties described in the Company’s filings with the Securities and Exchange Commission, including our most recent Annual Report on Form 10-K and other SEC filings made since the date of that 10-K report. Participants are cautioned not to place undue reliance on such forward-looking statements, which reflect management’s views only as of April 7, 2014. The Company undertakes no obligation to update or revise the forward-looking statements. 2 Safe Harbor

Our Vision & Mission Vision: To be her trusted brand by delivering style and value every day. Mission: To provide women of all sizes with apparel and accessories with style and versatility that reflects who she is, lasting quality and the affordable value she expects, delivered with the personalized attention she deserves. 3

4 An established brand targeting the 45-60 age group with fashionable assortments that meet our customers’ needs for style, versatility and value 547 stores in two primary brand concepts: 319 Christopher & Banks stores – missy & petite – average size of 3,300 square feet 127 CJ Banks stores – women - average size of 3,600 square feet 70 missy, petite, women (MPW) stores 31 outlet stores E-commerce sites for each brand Company Overview

Target women 45-60 years Avg. household income $70k-$75k More than 50% higher than US avg. 70% work outside of the home Two-thirds married Purchases 3.4 times annually Self-reports that she visits more frequently Spends $157 annually On average, $46 per purchase 5 Our Core Customer

Name Title Year Joined CBK Years in Industry LuAnn Via President and CEO 2012 30+ Peter Michielutti SVP and CFO 2012 20+ Michelle Rice SVP, Store Operations 2008 20+ Monica Dahl SVP, Marketing 2004 20+ Ann McDermott VP, Divisional Merchandise Manager 2011 20+ Tricia Perket VP, Divisional Merchandise Manager 2010 20 Brad Smith VP, eCommerce and Digital Marketing 2013 20+ Lisa Klein VP, Information Technology & P&A 2008 20 Belinda Meier VP, Controller 2013 15+ 6 Experienced Management Team

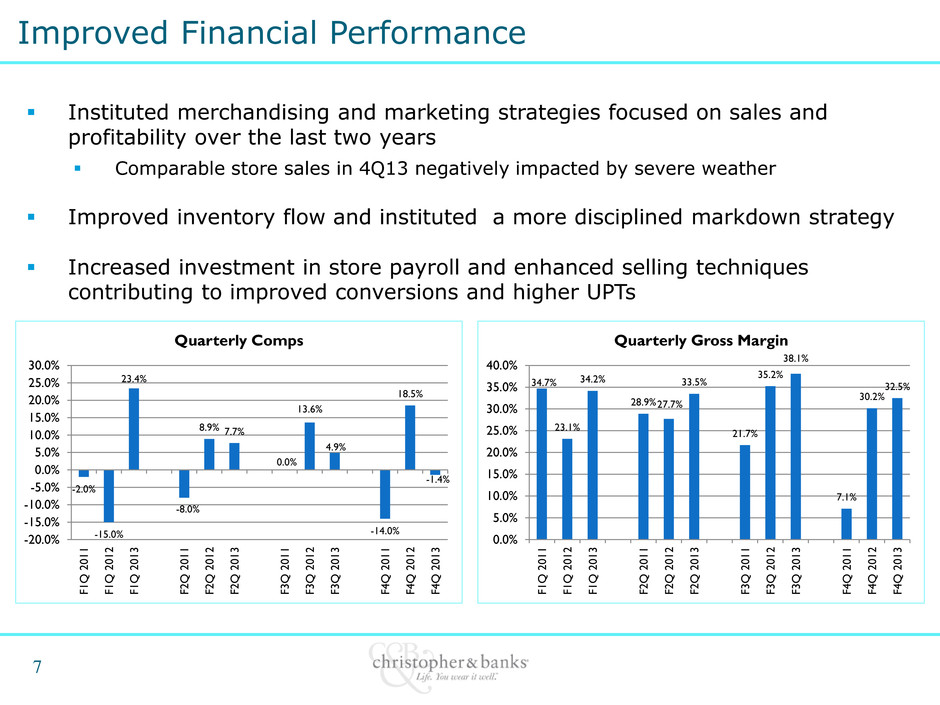
7 Improved Financial Performance Instituted merchandising and marketing strategies focused on sales and profitability over the last two years Comparable store sales in 4Q13 negatively impacted by severe weather Improved inventory flow and instituted a more disciplined markdown strategy Increased investment in store payroll and enhanced selling techniques contributing to improved conversions and higher UPTs -2.0% -15.0% 23.4% -8.0% 8.9% 7.7% 0.0% 13.6% 4.9% -14.0% 18.5% -1.4% -20.0% -15.0% -10.0% -5.0% 0.0% 5.0% 10.0% 15.0% 20.0% 25.0% 30.0% F1 Q 2 0 1 1 F1 Q 2 0 1 2 F1 Q 2 0 1 3 F2 Q 2 0 1 1 F2 Q 2 0 1 2 F2 Q 2 0 1 3 F3 Q 2 0 1 1 F3 Q 2 0 1 2 F3 Q 2 0 1 3 F4 Q 2 0 1 1 F4 Q 2 0 1 2 F4 Q 2 0 1 3 Quarterly Comps 34.7% 23.1% 34.2% 28.9% 27.7% 33.5% 21.7% 35.2% 38.1% 7.1% 30.2% 32.5% 0.0% 5.0% 10.0% 15.0% 20.0% 25.0% 30.0% 35.0% 40.0% F1 Q 2 0 1 1 F1 Q 2 0 1 2 F1 Q 2 0 1 3 F2 Q 2 0 1 1 F2 Q 2 0 1 2 F2 Q 2 0 1 3 F3 Q 2 0 1 1 F3 Q 2 0 1 2 F3 Q 2 0 1 3 F4 Q 2 0 1 1 F4 Q 2 0 1 2 F4 Q 2 0 1 3 Quarterly Gross Margin

Over the Next 3 Fiscal Years, Expect to Deliver Mid-Single- Digit Comp Growth 300-400 bps of Gross Margin Expansion SG&A Leverage 2% - 3% Annual Net Square Footage Growth High-Single-Digit Operating Margin by End of Fiscal 2016 8 Long-Range Financial Targets

Elements of Strategic Initiatives Focused Assortments and Merchandising Compelling Price/Value Equation Targeted Messaging and Marketing Engaged and Easy to Shop Store Experience Operational Excellence 9 Corporate Strategic Initiatives

10 Consistently deliver a balanced, compelling and versatile fashion assortment Offer fashion-right, age-appropriate options Continue to maximize sales and margin with year round core basic programs and appropriate depth of key styles Increase wear-to-work options including jackets, blouses, essential cardigans and year round pants Provide easy, complete outfitting with complementing accessories Focused Merchandise Assortments

Expand core programs of Everyday Denim and Layer Your Look knit tees Introduce new fit solutions and easy care fabrics Signature slimming pants Wrinkle-resistant shirts Introduce weekend wear Expand soft knit dressing Focused Merchandise Assortments 11

12 Offer a price/value proposition that resonates with customers Provide attractive opening price points in all categories Drive key sales and margin at compelling price points Plan promotional buys to maximize margin Continue to offer a well-balanced good / better / best product mix Consistently deliver on quality Compelling Price/Value Equation

13 Leverage Customer Relationship Management (CRM) Programs Friendship Loyalty Program at 4 million in total and 2.2 million Active customers generating 97% of our 12-month sales as of February 1, 2014 Increase analytics around customer segments Continue to expand Private Label Credit Card Program (launched in April 2012) Ended the fiscal year with more than 550,000 card holders Cardholders represent 20% of active customers and 23% of overall sales for fiscal 2013 VIP cardholder events and in-store payments Targeted Messaging and Marketing

14 Invest in marketing programs that increase customer growth and loyalty while driving measurable returns Continue investment in direct mail Increase investments in social media and select PR Support new store formats with enhanced grand opening events Refine promotional strategy Targeted and pre-planned category promotions versus all-store promotions Store signage and messaging, balancing product features & promotions to drive traffic Targeted Messaging and Marketing

Establishing direct foundation that keeps up with the changing needs of our customer Ongoing enhancements and updates to improve her shopping experience Leverage growing mobile usage among our target customer Increase our use of digital media to extend the reach of our brands and acquire a new kind of customer Leverage growth in paid search Expand use of targeted, data-driven display advertising Grow multi-channel customer base Enhanced Ecommerce Experience 15

Refreshed “Selling with Care” program Refining selling techniques through additional videos and tools Reinforce clientelling as key to selling culture Increased selling hours at select stores Upgraded Talent Aligning store personnel capabilities with real estate strategy Enhanced on-boarding program Enhanced Visual Merchandising Increased outfitting displays Create consistency from store to store by maintaining brand standards Greater use of mannequins, tables and visual props for increased flexibility and visual appeal Maintain Strong Personal Relationships with Our Customer In-store seasonal Fashion Events Maximize grassroots opportunities i.e. women’s conventions, leadership conferences and women’s clubs 16 Engaged and Easy-to-Shop In-Store Experience

17 In Fiscal 2014 we plan on: Adding CJ product to 50 CB stores and converting them to the MPW format Closing 20 CB/CJ stores and converting them into 10 MPW stores in the existing space Closing 16 CB/CJ stores and relocating to 8 new MPW stores Closing 10 CB stores and replacing each with a MPW store in a new, larger location Expect to end fiscal 2014 with at least 150 MPW stores, up from 61 at the end of fiscal 2013. Real Estate Strategy

Map of Current Store Base Highly Midwest, Northeast concentrated store base with opportunity for geographic expansion 18

19 Unique customer niche largely underserved by others Multi-channel strategy with small market focus Strategic initiatives driving improved sales and merchandise margin performance Significant operating margin expansion opportunity Enhanced balance sheet with improved liquidity and flexibility Strong and experienced management team and Board of Directors Investment Highlights

Financial Highlights

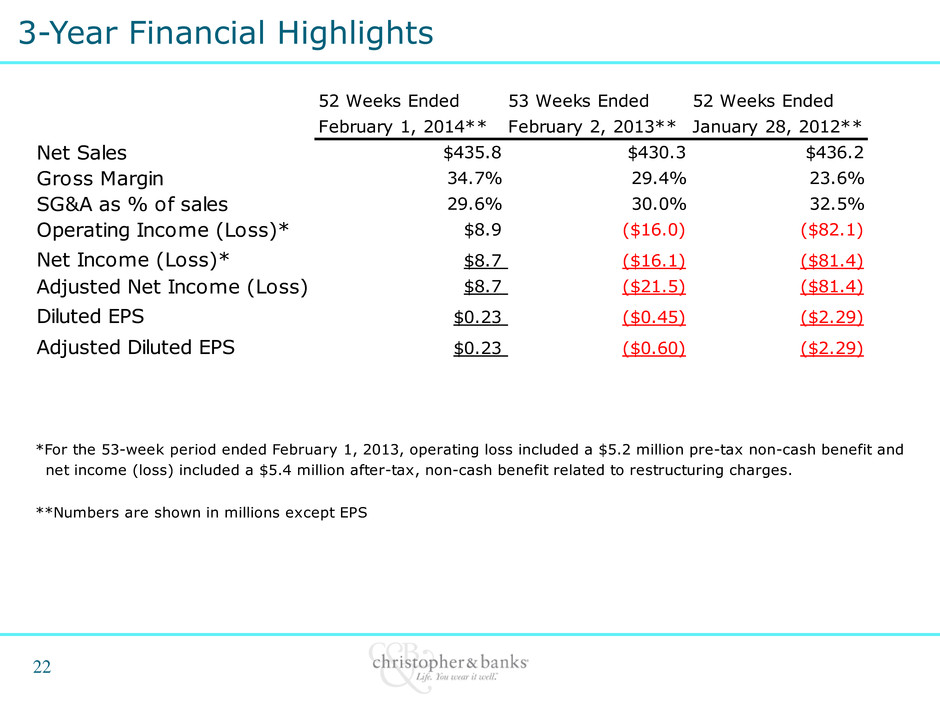
Total comparable sales for fiscal 2013 were up 8.1% Improved conversion rates, higher units per transactions, and an increase in the AUR led to a 6.7% increase in average dollar sale Despite operating an average of 8.5% fewer stores, sales for fiscal 2013 grew 1.3% as compared to fiscal 2012 Gross margin for fiscal 2013 was 34.7% compared to 29.4% for fiscal 2012 Merchandise margin rate improved on a year-over-year basis Lower markdowns Improving IMU Occupancy leverage Improved inventory flow contributed to stronger sell-through Improved Financial Performance 21

52 Weeks Ended 53 Weeks Ended 52 Weeks Ended February 1, 2014** February 2, 2013** January 28, 2012** Net Sales $435.8 $430.3 $436.2 Gross Margin 34.7% 29.4% 23.6% SG&A as % of sales 29.6% 30.0% 32.5% Operating Income (Loss)* $8.9 ($16.0) ($82.1) Net Income (Loss)* $8.7 ($16.1) ($81.4) Adjusted Net Income (Loss) $8.7 ($21.5) ($81.4) Diluted EPS $0.23 ($0.45) ($2.29) Adjusted Diluted EPS $0.23 ($0.60) ($2.29) *For the 53-week period ended February 1, 2013, operating loss included a $5.2 million pre-tax non-cash benefit and net income (loss) included a $5.4 million after-tax, non-cash benefit related to restructuring charges. **Numbers are shown in millions except EPS 3-Year Financial Highlights 22

EBITDA Performance Since Turnaround Began Embarked on a turnaround in December 2011 and have since made significant changes across various functions This has led to a swift and dramatic improvement in EBITDA performance (37,231) (39,254) (22,620) (2,531) 11,009 16,330 19,656 22,184 (50,000) (40,000) (30,000) (20,000) (10,000) 0 10,000 20,000 30,000 F1Q 2012R F2Q 2012R F3Q 2012R F4Q 2012R F1Q 2013 F2Q 2013 F3Q 2013 F4Q 2013 EBITDA Trailing 4-Quarters (excluding Restructure) $,000 23

February 1, 2014 (In Millions) February 2, 2013 (In Millions) Cash and Investments $57.2 $40.7 Merchandise Inventories 44.9 42.7 Property and Equipment, net 36.5 41.2 Total Assets $149.0 $135.9 Long -Term Debt — — Stockholders’ Equity $86.9 $75.5 Balance Sheet and Cash Flow Summary No outstanding borrowings under revolving credit facility 24

Q1 Guidance Update For the first quarter of fiscal 2014 the Company expects: Same-store sales to be relatively flat to last year. Gross margin improvement of 50 to 70 bps, as compared to last year’s first fiscal quarter driven by improved merchandise margins. SG&A dollars to be flat compared to $32.7 million of SG&A expense reported in the first quarter last year. To recognize a nominal amount of tax expense, as the Company’s tax provisions will continue to be affected by the valuation allowance on our deferred tax assets. Inventory to remain higher than the levels from the comparable prior year period at a level similar to the increase at the end of fiscal 2013. To open 2 new outlet stores, convert 16 CB and CJ stores to 8 MPW stores, and close 3 CB stores and replace them with 3 new MPW stores. 25

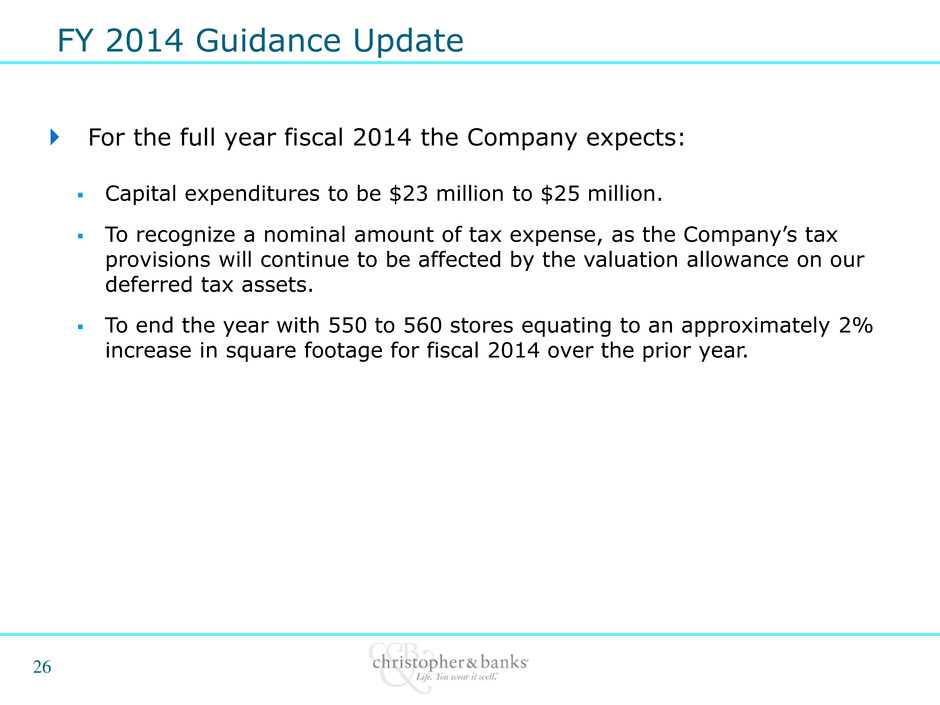
FY 2014 Guidance Update For the full year fiscal 2014 the Company expects: Capital expenditures to be $23 million to $25 million. To recognize a nominal amount of tax expense, as the Company’s tax provisions will continue to be affected by the valuation allowance on our deferred tax assets. To end the year with 550 to 560 stores equating to an approximately 2% increase in square footage for fiscal 2014 over the prior year. 26

27
