Attached files
| file | filename |
|---|---|
| 8-K - FORM 8-K - ABRAXAS PETROLEUM CORP | axas8kipaa040714.htm |
Abraxas Petroleum Corporate Update April 2014 Exhibit 99.1
* The information presented herein may contain predictions, estimates and other forward-looking statements within the meaning of Section 27A of the Securities Act of 1933 and Section 21E of the Securities Exchange Act of 1934. Although the Company believes that its expectations are based on reasonable assumptions, it can give no assurance that its goals will be achieved. Important factors that could cause actual results to differ materially from those included in the forward-looking statements include the timing and extent of changes in commodity prices for oil and gas, the need to develop and replace reserves, environmental risks, competition, government regulation and the ability of the Company to meet its stated business goals. Forward-Looking Statements
* I. Abraxas Petroleum Overview
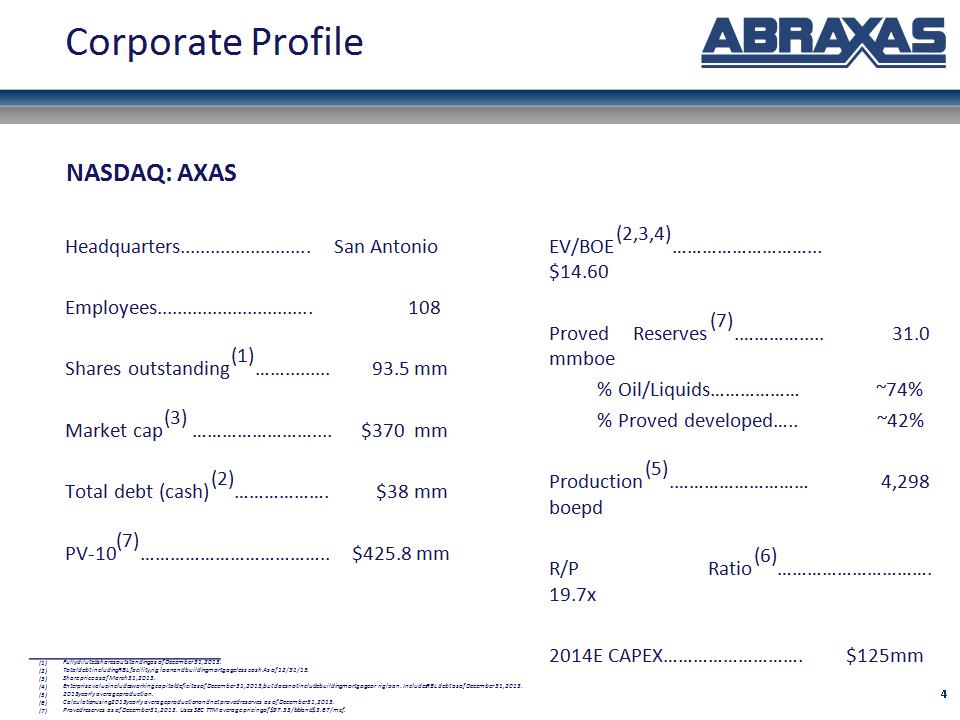
* Headquarters.......................... San Antonio Employees............................... 108 Shares outstanding(1)……......... 93.5 mm Market cap(3) …………………….... $370 mm Total debt (cash)(2)………………. $38 mm PV-10(7)……………………………….. $425.8 mm Fully diluted shares outstanding as of December 31, 2013. Total debt including RBL facility, rig loan and building mortgage less cash. As of 12/31/13. Share price as of March 31, 2013. Enterprise value includes working capital deficit as of December 31, 2013, but does not include building mortgage or rig loan. Includes RBL debt as of December 31, 2013. 2013 yearly average production. Calculation using 2013 yearly average production and net proved reserves as of December 31, 2013. Proved reserves as of December 31, 2013. Uses SEC TTM average pricing of $97.33/bbl and $3.67/mcf. EV/BOE(2,3,4)………………………... $14.60 Proved Reserves(7).…………..... 31.0 mmboe % Oil/Liquids……………… ~74% % Proved developed….. ~42% Production(5).……………………… 4,298 boepd R/P Ratio(6)…………………………. 19.7x 2014E CAPEX………………………. $125mm NASDAQ: AXAS Corporate Profile
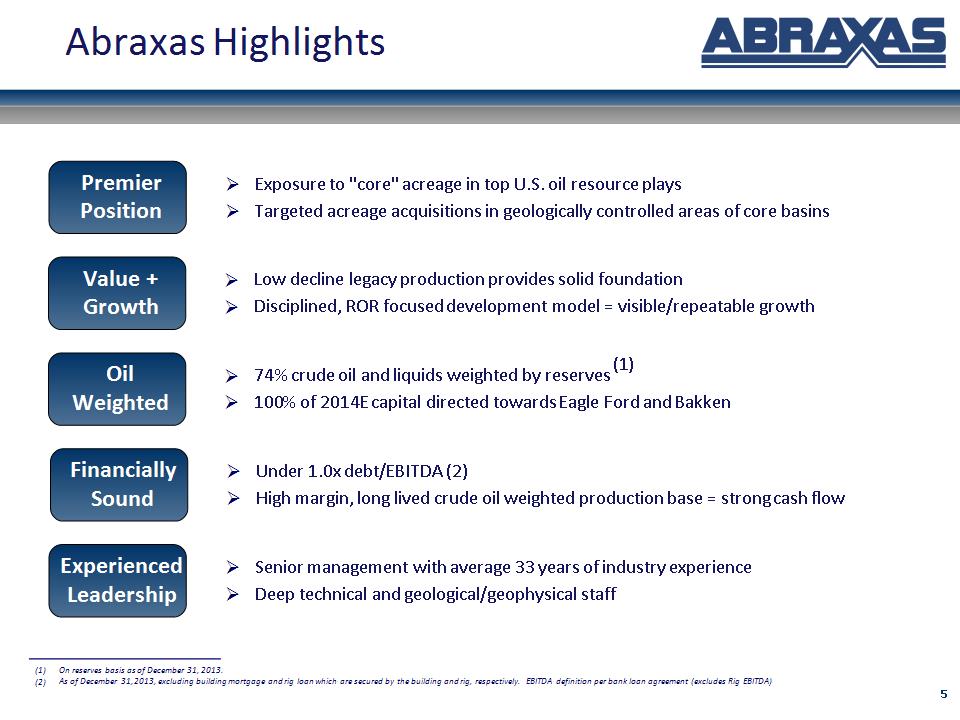
* Exposure to "core" acreage in top U.S. oil resource plays Targeted acreage acquisitions in geologically controlled areas of core basins Premier Position Value + Growth Low decline legacy production provides solid foundation Disciplined, ROR focused development model = visible/repeatable growth Oil Weighted 74% crude oil and liquids weighted by reserves (1) 100% of 2014E capital directed towards Eagle Ford and Bakken Financially Sound Under 1.0x debt/EBITDA (2) High margin, long lived crude oil weighted production base = strong cash flow On reserves basis as of December 31, 2013. As of December 31, 2013, excluding building mortgage and rig loan which are secured by the building and rig, respectively. EBITDA definition per bank loan agreement (excludes Rig EBITDA) Experienced Leadership Senior management with average 33 years of industry experience Deep technical and geological/geophysical staff Abraxas Highlights
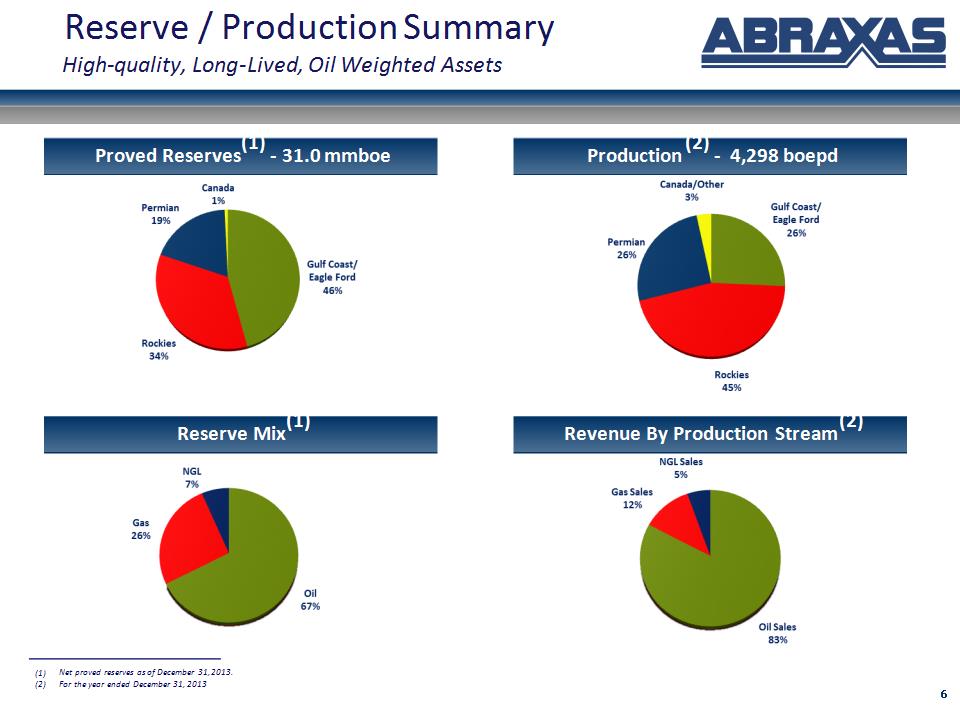
* Proved Reserves(1) – 31.0 mmboe Production(2) – 4,298 boepd Reserve Mix(1) Revenue By Production Stream(2) Reserve / Production Summary High-quality, Long-Lived, Oil Weighted Assets Net proved reserves as of December 31, 2013. For the year ended December 31, 2013
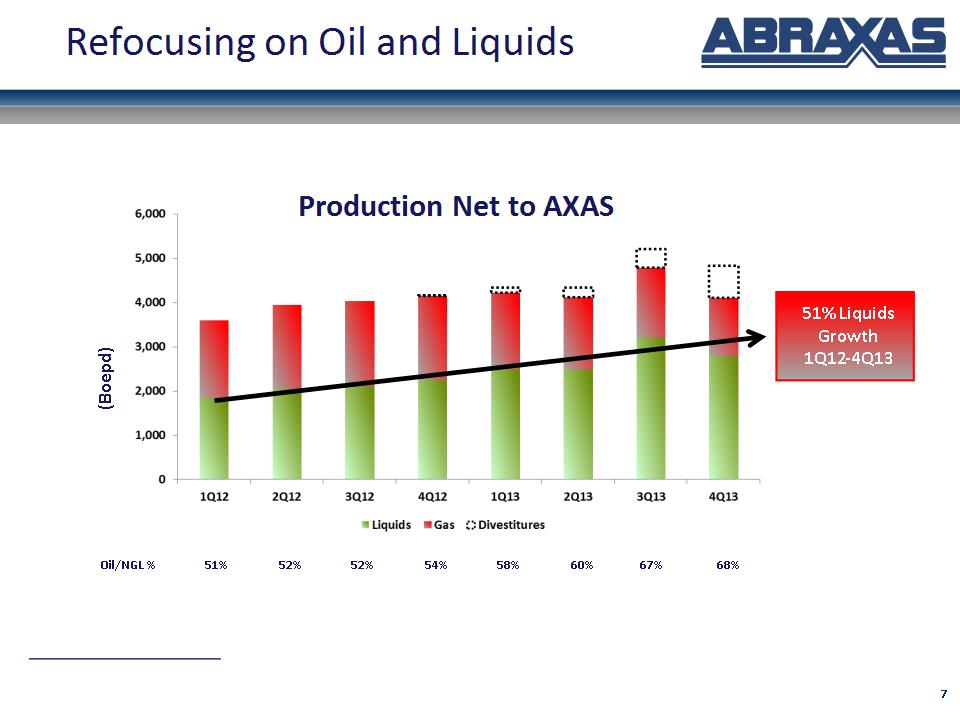
* (Boepd) Oil/NGL % 51% 52% 52% 54% 58% 60% 67% 68% Production Net to AXAS 51% Liquids Growth 1Q12-4Q13 Refocusing on Oil and Liquids
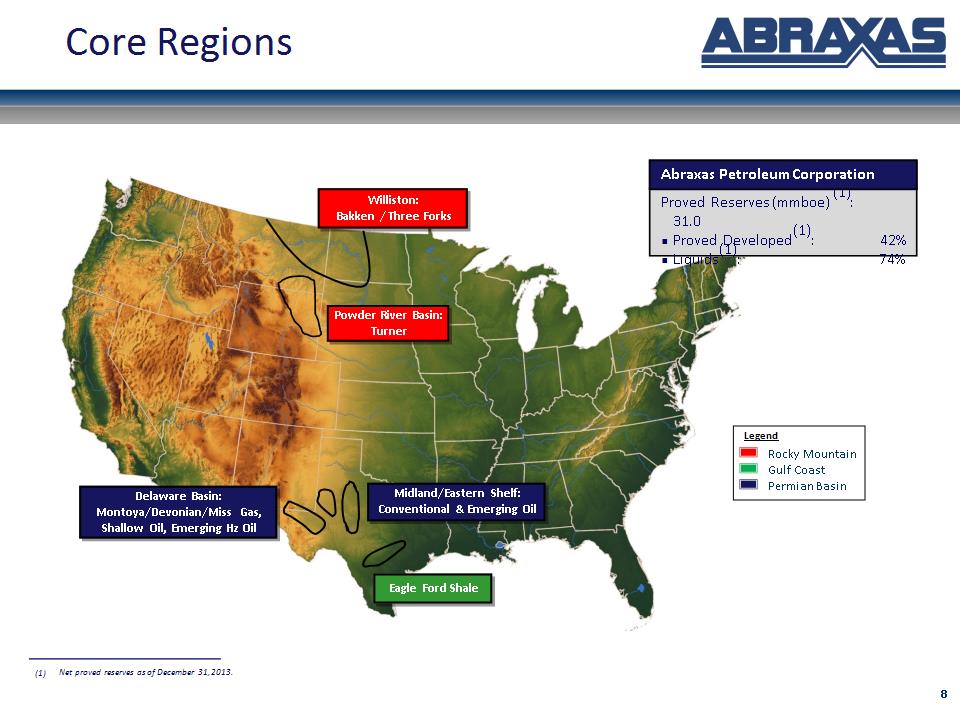
* Williston: Bakken / Three Forks Powder River Basin: Turner Midland/Eastern Shelf: Conventional & Emerging Oil Eagle Ford Shale Delaware Basin: Montoya/Devonian/Miss Gas, Shallow Oil, Emerging Hz Oil Proved Reserves (mmboe)(1): 31.0 Proved Developed(1): 42% Liquids(1): 74% Abraxas Petroleum Corporation Core Regions Net proved reserves as of December 31, 2013.
* II. Abraxas Petroleum Financial Overview
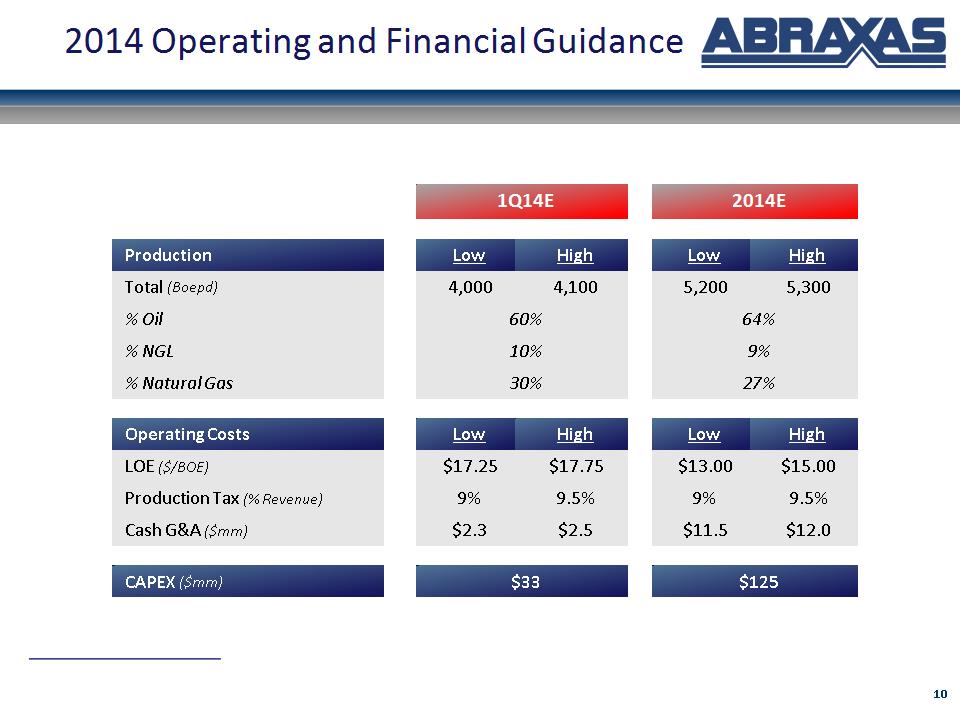
* 2014 Operating and Financial Guidance 1Q14E 1Q14E 2014E 2014E Production Low High Low High Total (Boepd) 4,000 4,100 5,200 5,300 % Oil 60% 60% 64% 64% % NGL 10% 10% 9% 9% % Natural Gas 30% 30% 27% 27% Operating Costs Low High Low High LOE ($/BOE) $17.25 $17.75 $13.00 $15.00 Production Tax (% Revenue) 9% 9.5% 9% 9.5% Cash G&A ($mm) $2.3 $2.5 $11.5 $12.0 CAPEX ($mm) $33 $33 $125 $125
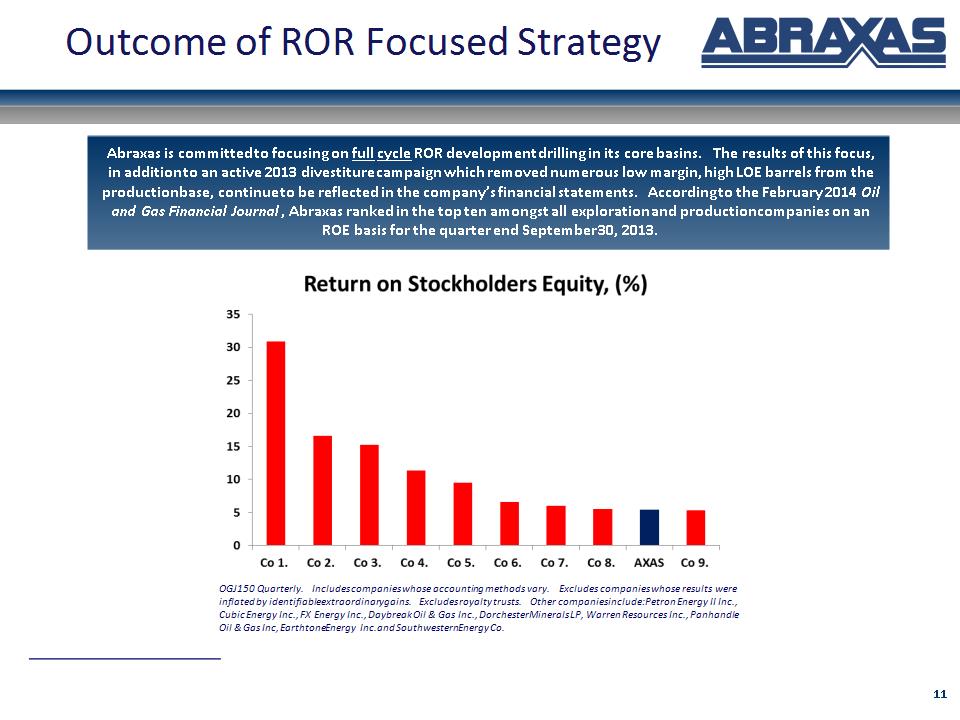
* OGJ150 Quarterly. Includes companies whose accounting methods vary. Excludes companies whose results were inflated by identifiable extraordinary gains. Excludes royalty trusts. Other companies include: Petron Energy II Inc., Cubic Energy Inc., FX Energy Inc., Daybreak Oil & Gas Inc., Dorchester Minerals LP, Warren Resources Inc., Panhandle Oil & Gas Inc, Earthtone Energy Inc. and Southwestern Energy Co. Outcome of ROR Focused Strategy Abraxas is committed to focusing on full cycle ROR development drilling in its core basins. The results of this focus, in addition to an active 2013 divestiture campaign which removed numerous low margin, high LOE barrels from the production base, continue to be reflected in the company’s financial statements. According to the February 2014 Oil and Gas Financial Journal, Abraxas ranked in the top ten amongst all exploration and production companies on an ROE basis for the quarter end September 30, 2013.
* III. Strategic Plan
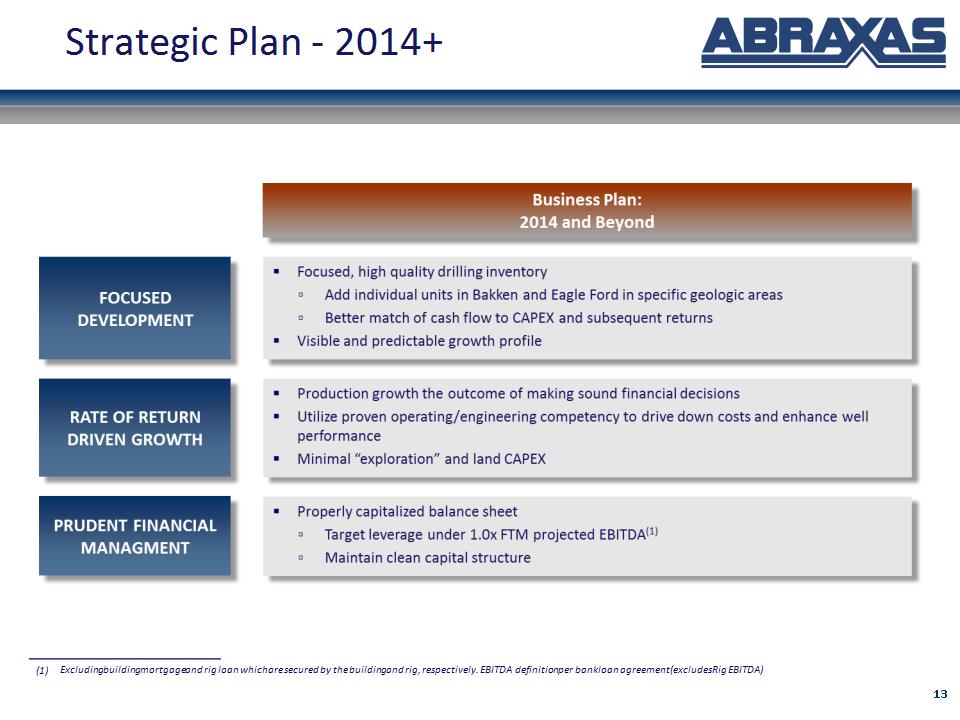
* Strategic Plan – 2014+ Excluding building mortgage and rig loan which are secured by the building and rig, respectively. EBITDA definition per bank loan agreement (excludes Rig EBITDA)
* IV. Asset Base Overview
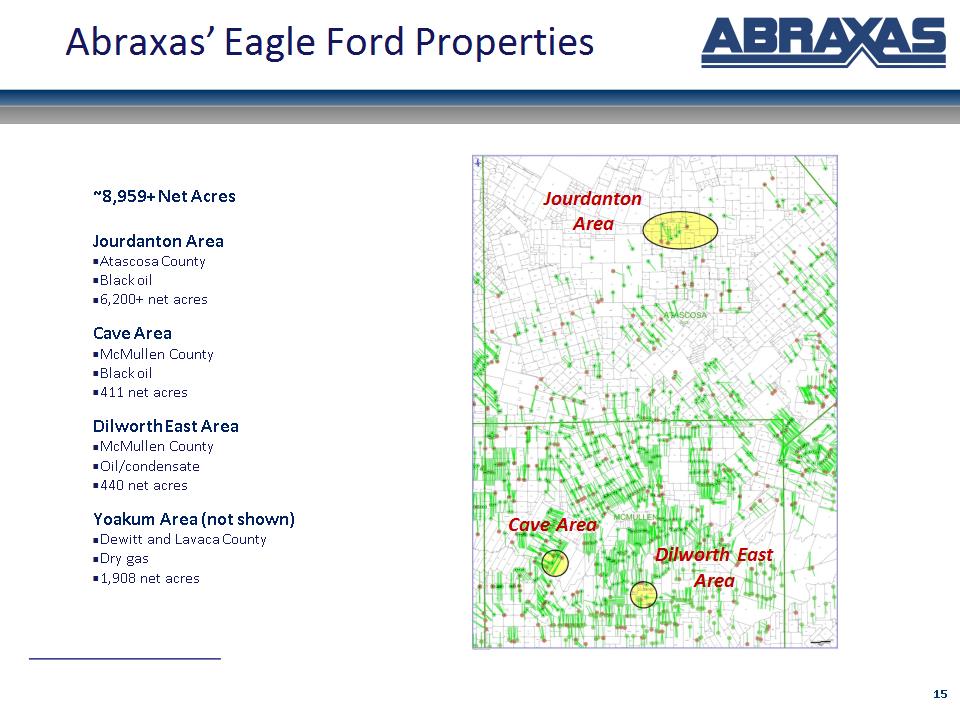
* Abraxas’ Eagle Ford Properties ~8,959+ Net Acres Jourdanton Area Atascosa County Black oil 6,200+ net acres Cave Area McMullen County Black oil 411 net acres Dilworth East Area McMullen County Oil/condensate 440 net acres Yoakum Area (not shown) Dewitt and Lavaca County Dry gas 1,908 net acres Jourdanton Area Cave Area Dilworth East Area
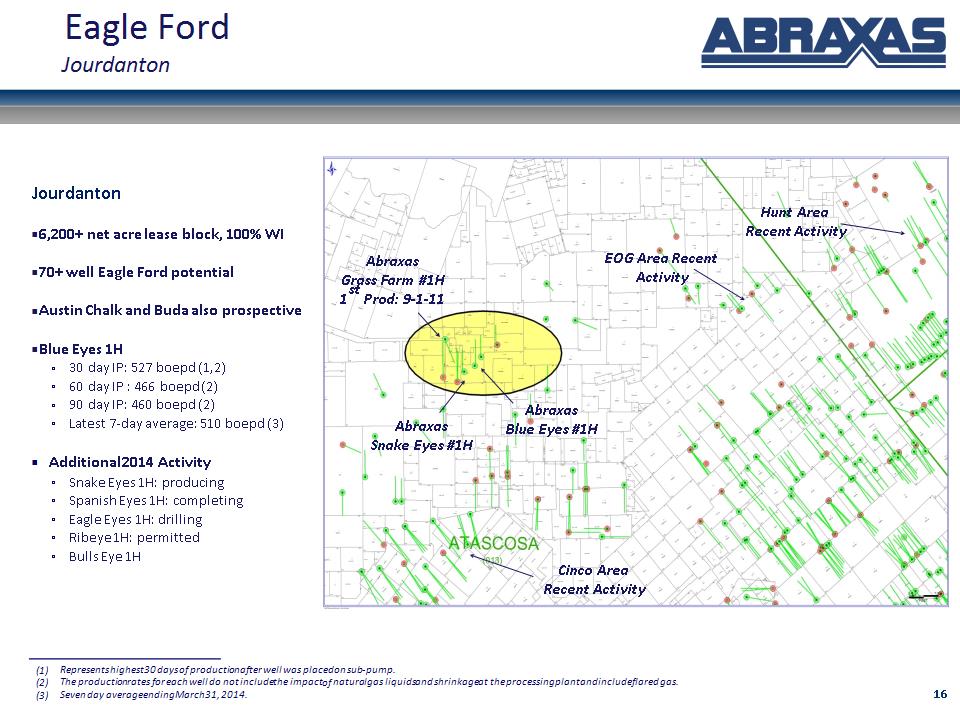
* Eagle Ford Jourdanton Jourdanton 6,200+ net acre lease block, 100% WI 70+ well Eagle Ford potential Austin Chalk and Buda also prospective Blue Eyes 1H 30 day IP: 527 boepd (1,2) 60 day IP : 466 boepd (2) 90 day IP: 460 boepd (2) Latest 7-day average: 510 boepd (3) Additional 2014 Activity Snake Eyes 1H: producing Spanish Eyes 1H: completing Eagle Eyes 1H: drilling Ribeye 1H: permitted Bulls Eye 1H Represents highest 30 days of production after well was placed on sub-pump. The production rates for each well do not include the impact of natural gas liquids and shrinkage at the processing plant and include flared gas. Seven day average ending March 31, 2014. Abraxas Grass Farm #1H 1st Prod: 9-1-11 Abraxas Blue Eyes #1H Cinco Area Recent Activity Hunt Area Recent Activity EOG Area Recent Activity Abraxas Snake Eyes #1H
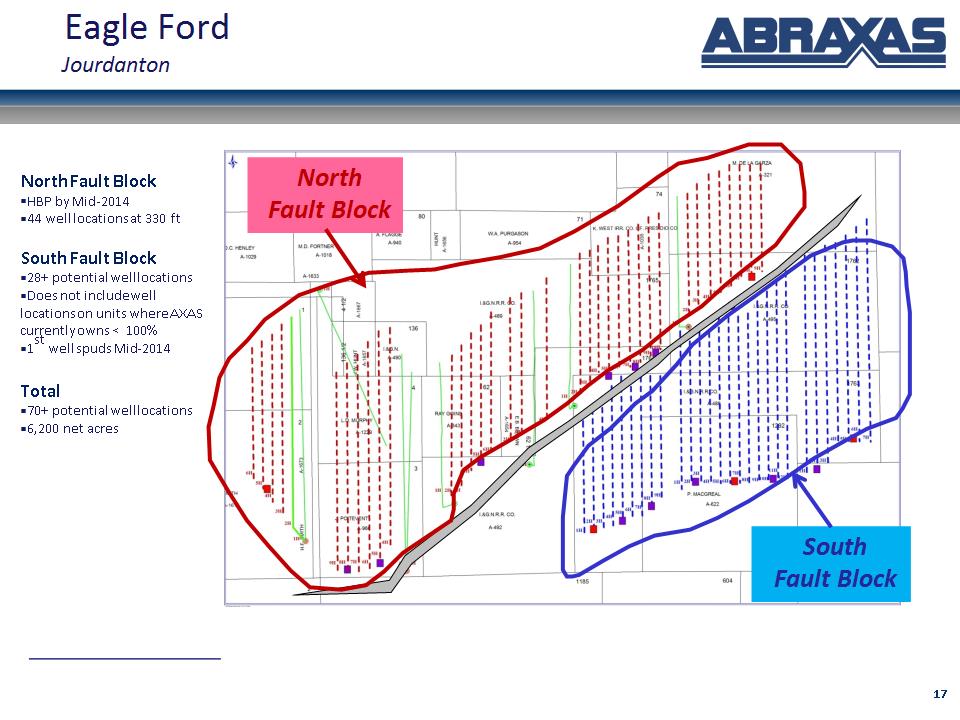
* Eagle Ford Jourdanton North Fault Block South Fault Block North Fault Block HBP by Mid-2014 44 well locations at 330 ft South Fault Block 28+ potential well locations Does not include well locations on units where AXAS currently owns < 100% 1st well spuds Mid-2014 Total 70+ potential well locations 6,200 net acres
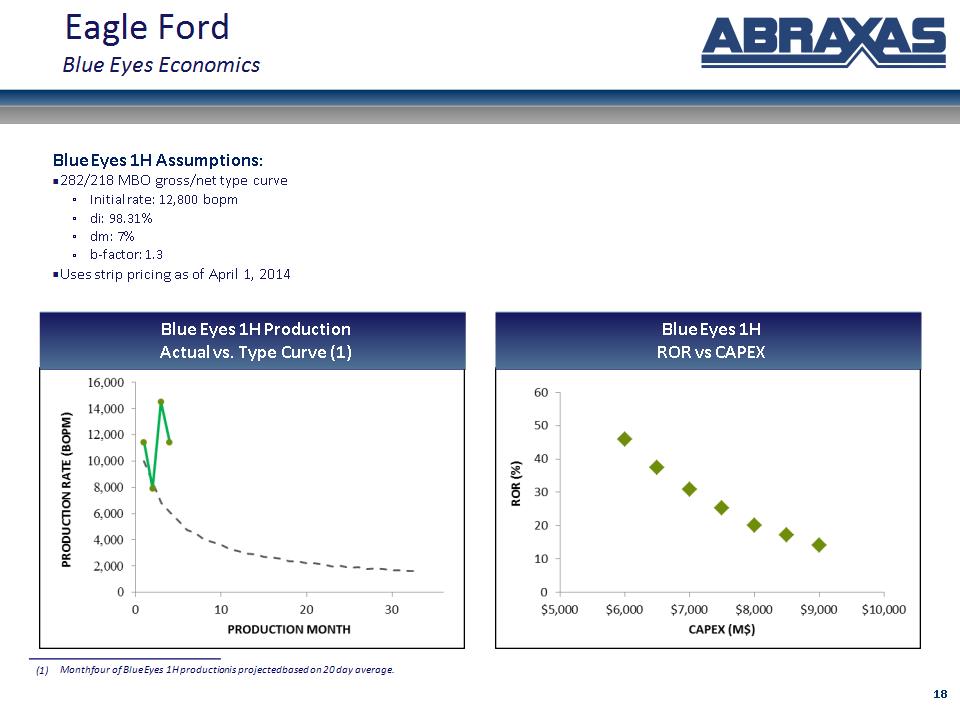
* Eagle Ford Blue Eyes Economics Blue Eyes 1H Production Actual vs. Type Curve (1) Blue Eyes 1H ROR vs CAPEX Blue Eyes 1H Assumptions: 282/218 MBO gross/net type curve Initial rate: 12,800 bopm di: 98.31% dm: 7% b-factor: 1.3 Uses strip pricing as of April 1, 2014 Month four of Blue Eyes 1H production is projected based on 20 day average.
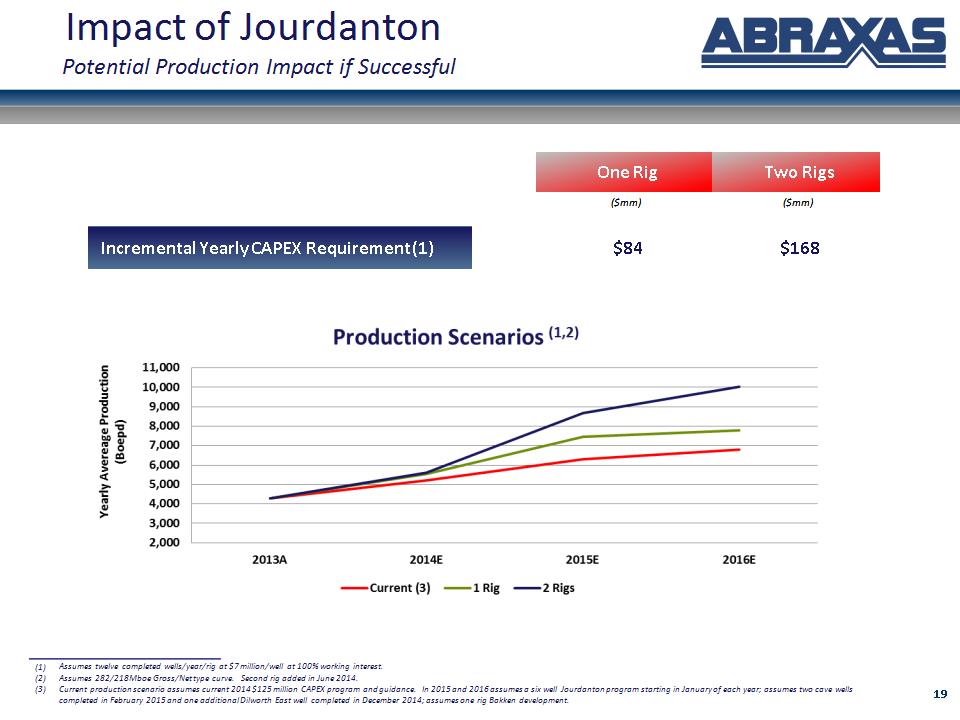
* Impact of Jourdanton Potential Production Impact if Successful Assumes twelve completed wells/year/rig at $7 million/well at 100% working interest. Assumes 282/218 Mboe Gross/Net type curve. Second rig added in June 2014. Current production scenario assumes current 2014 $125 million CAPEX program and guidance. In 2015 and 2016 assumes a six well Jourdanton program starting in January of each year; assumes two cave wells completed in February 2015 and one additional Dilworth East well completed in December 2014; assumes one rig Bakken development. One Rig Two Rigs ($mm) ($mm) Incremental Yearly CAPEX Requirement (1) $84 $168
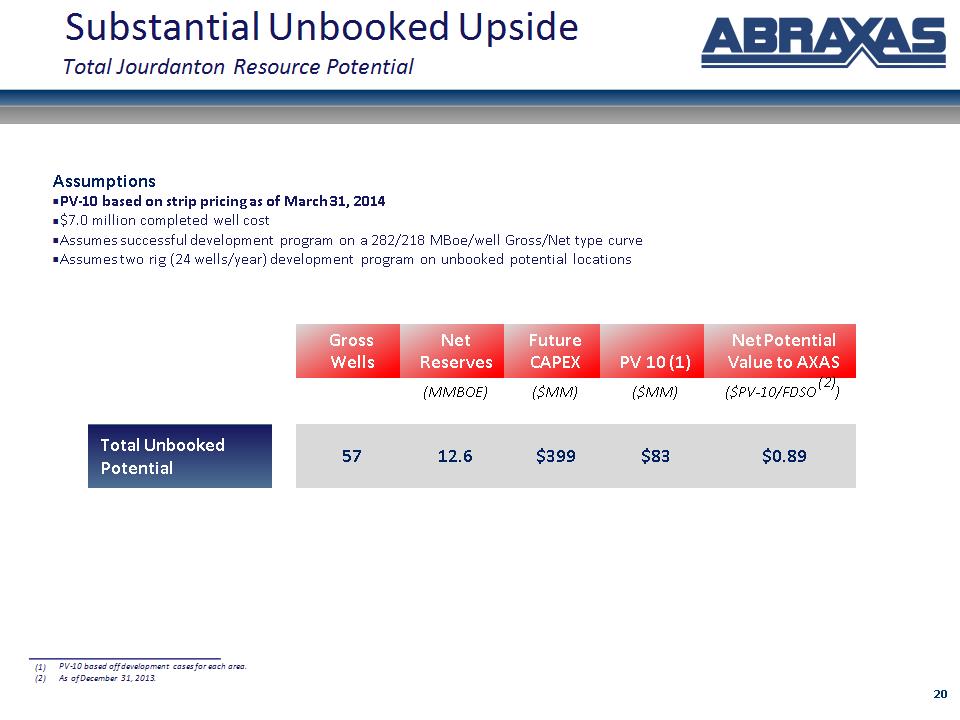
* Substantial Unbooked Upside Total Jourdanton Resource Potential PV-10 based off development cases for each area. As of December 31, 2013. Assumptions PV-10 based on strip pricing as of March 31, 2014 $7.0 million completed well cost Assumes successful development program on a 282/218 MBoe/well Gross/Net type curve Assumes two rig (24 wells/year) development program on unbooked potential locations Gross Wells Net Reserves Future CAPEX PV 10 (1) Net Potential Value to AXAS (MMBOE) ($MM) ($MM) ($PV-10/FDSO(2)) Total Unbooked Potential 57 12.6 $399 $83 $0.89
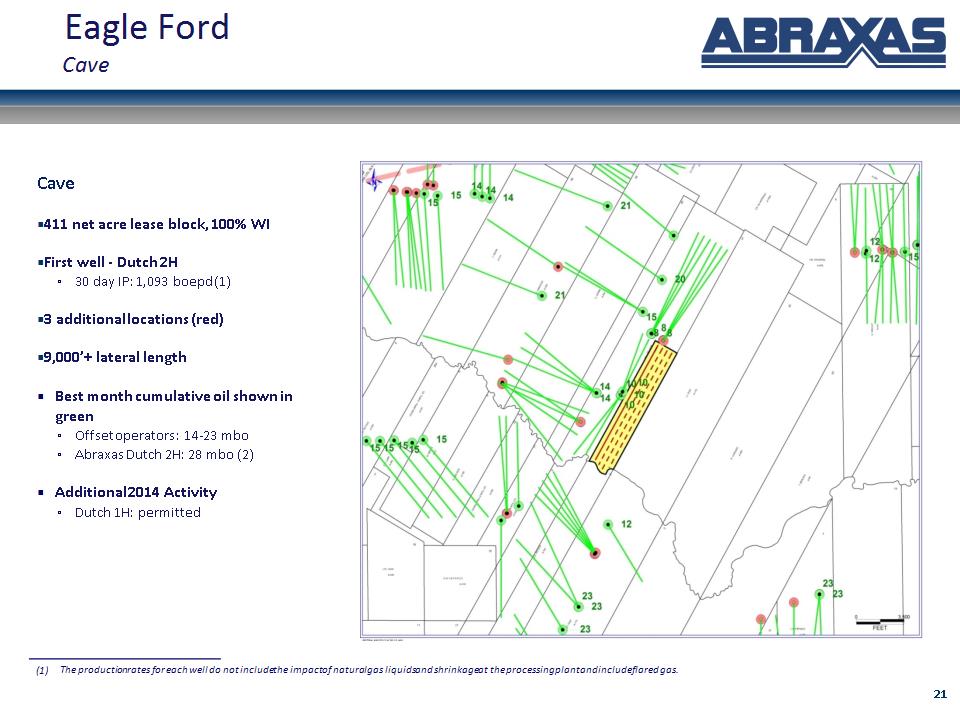
* Eagle Ford Cave Cave 411 net acre lease block, 100% WI First well – Dutch 2H 30 day IP: 1,093 boepd (1) 3 additional locations (red) 9,000’+ lateral length Best month cumulative oil shown in green Offset operators : 14-23 mbo Abraxas Dutch 2H: 28 mbo (2) Additional 2014 Activity Dutch 1H: permitted The production rates for each well do not include the impact of natural gas liquids and shrinkage at the processing plant and include flared gas.
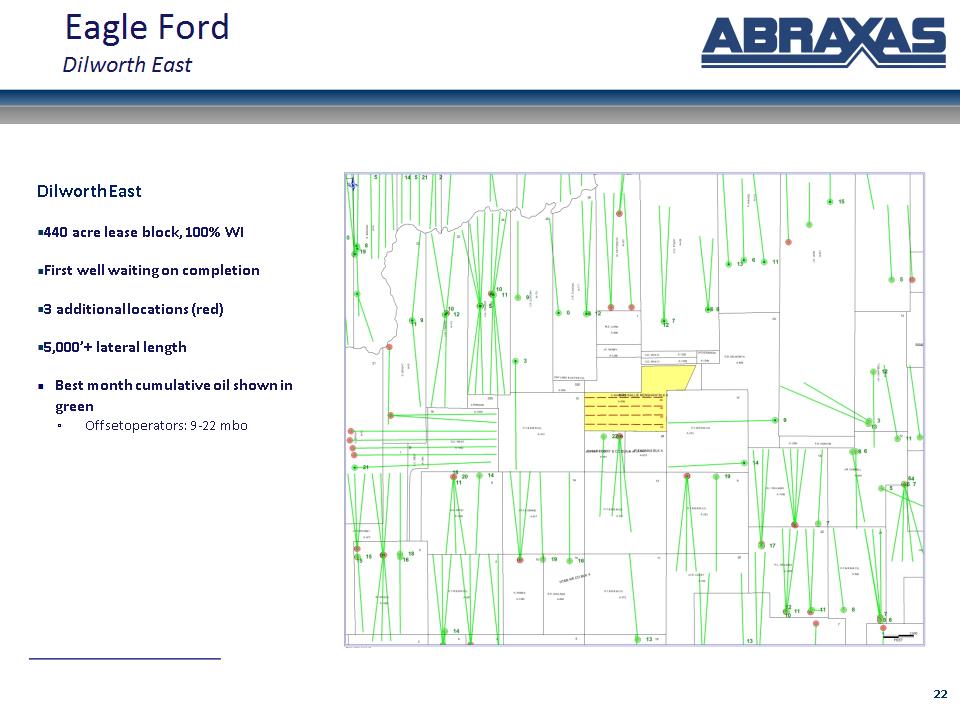
* Eagle Ford Dilworth East Dilworth East 440 acre lease block, 100% WI First well waiting on completion 3 additional locations (red) 5,000’+ lateral length Best month cumulative oil shown in green Offset operators: 9-22 mbo
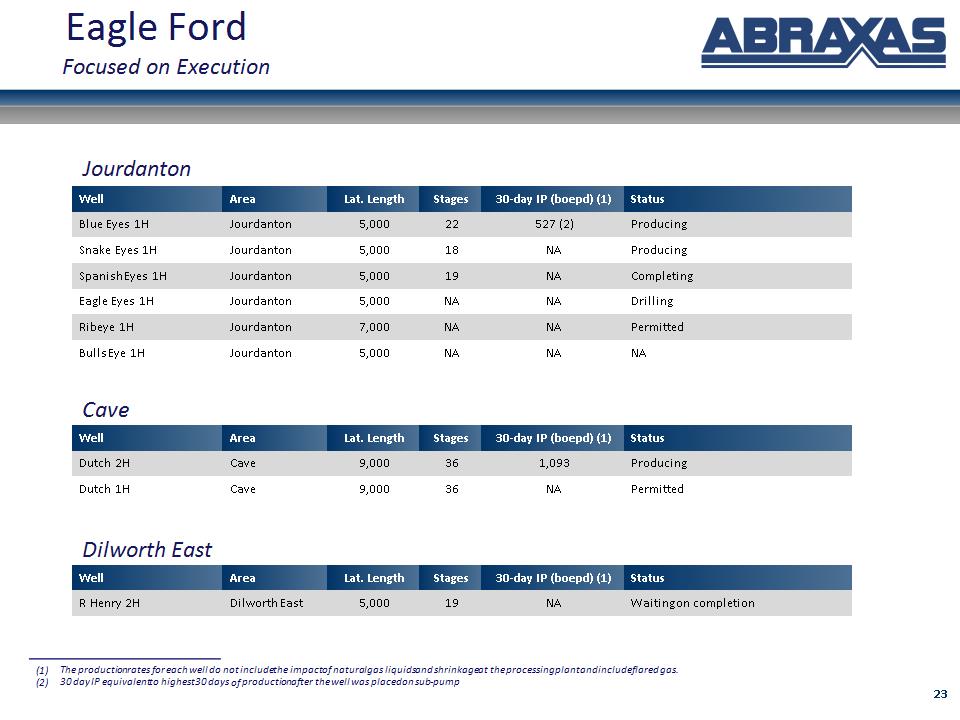
* Well Area Lat. Length Stages 30-day IP (boepd) (1) Status Blue Eyes 1H Jourdanton 5,000 22 527 (2) Producing Snake Eyes 1H Jourdanton 5,000 18 NA Producing Spanish Eyes 1H Jourdanton 5,000 19 NA Completing Eagle Eyes 1H Jourdanton 5,000 NA NA Drilling Ribeye 1H Jourdanton 7,000 NA NA Permitted Bulls Eye 1H Jourdanton 5,000 NA NA NA Eagle Ford Focused on Execution Well Area Lat. Length Stages 30-day IP (boepd) (1) Status Dutch 2H Cave 9,000 36 1,093 Producing Dutch 1H Cave 9,000 36 NA Permitted Well Area Lat. Length Stages 30-day IP (boepd) (1) Status R Henry 2H Dilworth East 5,000 19 NA Waiting on completion Jourdanton Cave Dilworth East The production rates for each well do not include the impact of natural gas liquids and shrinkage at the processing plant and include flared gas. 30 day IP equivalent to highest 30 days of production after the well was placed on sub-pump
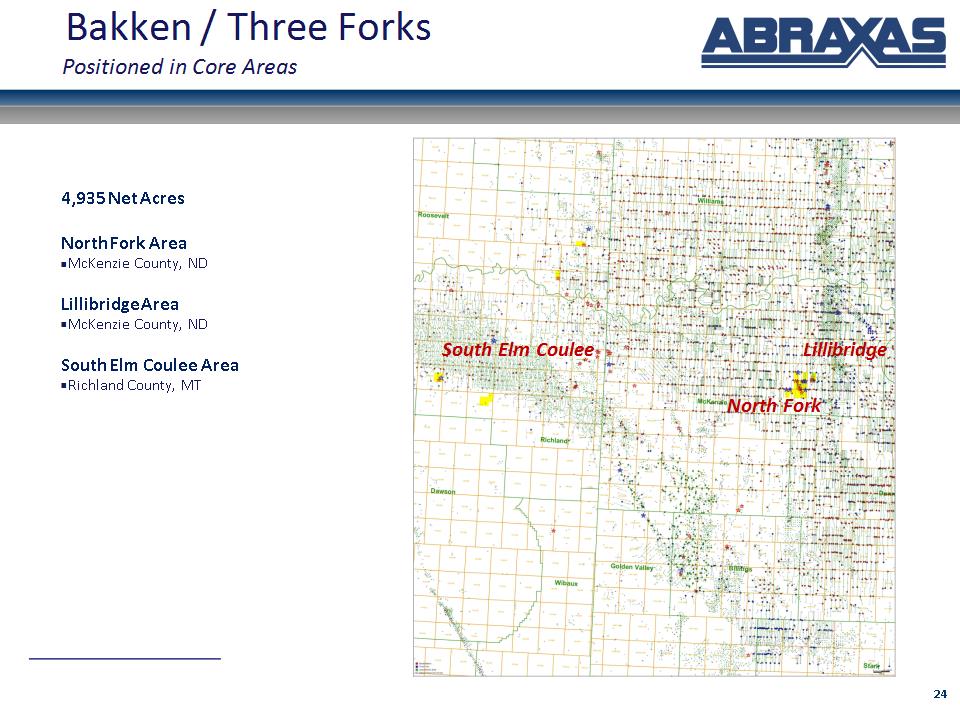
* Bakken / Three Forks Positioned in Core Areas North Fork 4,935 Net Acres North Fork Area McKenzie County, ND Lillibridge Area McKenzie County, ND South Elm Coulee Area Richland County, MT Lillibridge South Elm Coulee
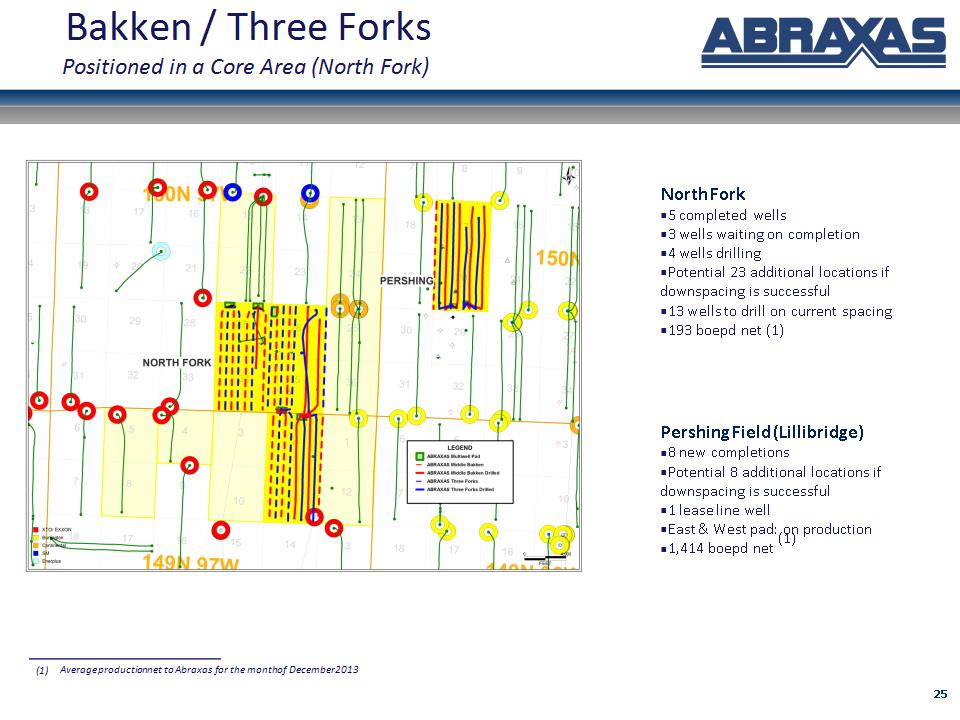
* North Fork 5 completed wells 3 wells waiting on completion 4 wells drilling Potential 23 additional locations if downspacing is successful 13 wells to drill on current spacing 193 boepd net (1) Pershing Field (Lillibridge) 8 new completions Potential 8 additional locations if downspacing is successful 1 lease line well East & West pad: on production 1,414 boepd net (1) Bakken / Three Forks Positioned in a Core Area (North Fork) Average production net to Abraxas for the month of December 2013
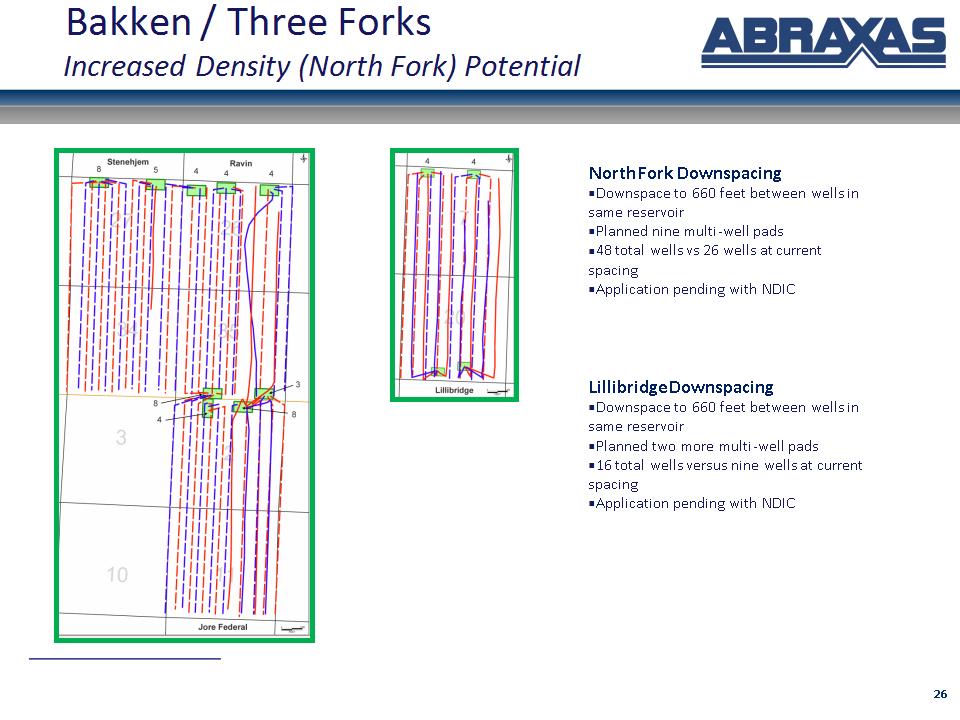
* North Fork Downspacing Downspace to 660 feet between wells in same reservoir Planned nine multi-well pads 48 total wells vs 26 wells at current spacing Application pending with NDIC Lillibridge Downspacing Downspace to 660 feet between wells in same reservoir Planned two more multi-well pads 16 total wells versus nine wells at current spacing Application pending with NDIC Bakken / Three Forks Increased Density (North Fork) Potential
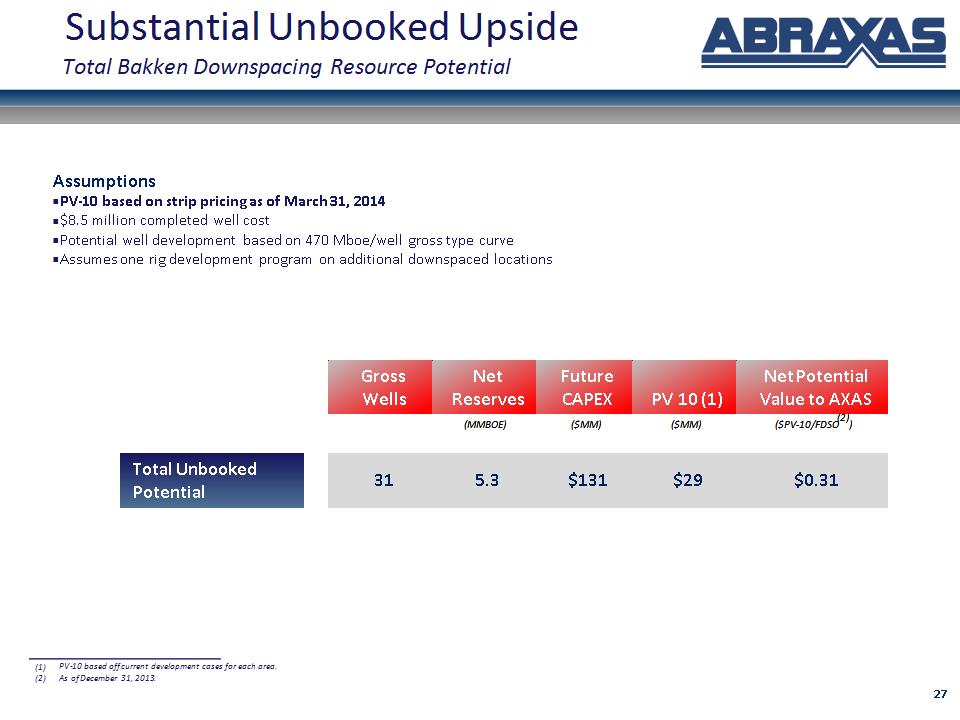
* Substantial Unbooked Upside Total Bakken Downspacing Resource Potential Gross Wells Net Reserves Future CAPEX PV 10 (1) Net Potential Value to AXAS (MMBOE) ($MM) ($MM) ($PV-10/FDSO(2)) Total Unbooked Potential 31 5.3 $131 $29 $0.31 PV-10 based off current development cases for each area. As of December 31, 2013. Assumptions PV-10 based on strip pricing as of March 31, 2014 $8.5 million completed well cost Potential well development based on 470 Mboe/well gross type curve Assumes one rig development program on additional downspaced locations
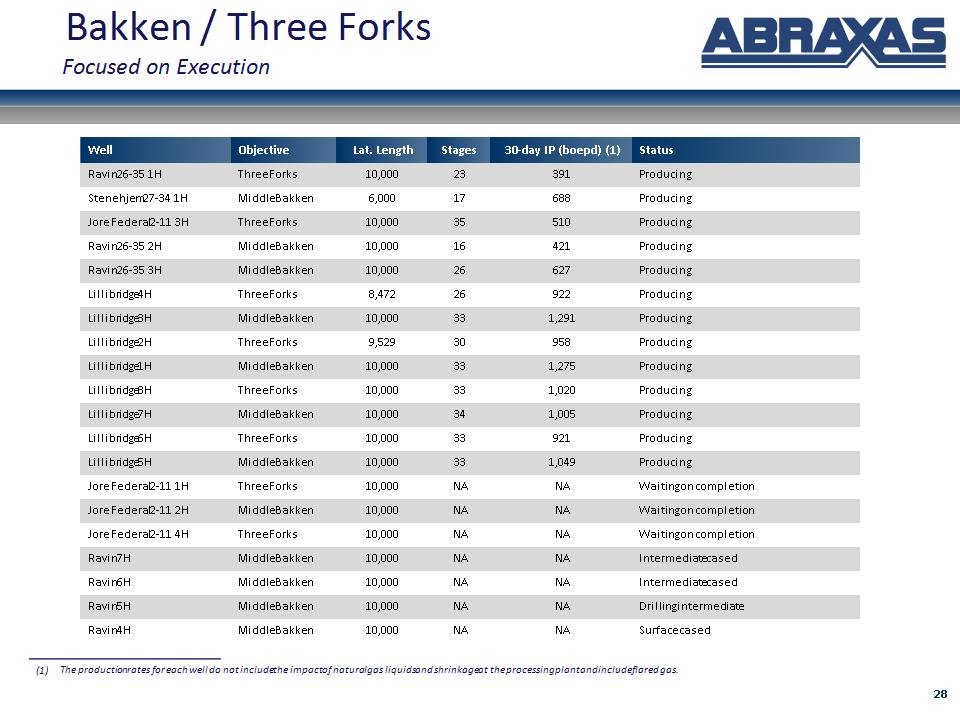
* Well Objective Lat. Length Stages 30-day IP (boepd) (1) Status Ravin 26-35 1H Three Forks 10,000 23 391 Producing Stenehjem 27-34 1H Middle Bakken 6,000 17 688 Producing Jore Federal 2-11 3H Three Forks 10,000 35 510 Producing Ravin 26-35 2H Middle Bakken 10,000 16 421 Producing Ravin 26-35 3H Middle Bakken 10,000 26 627 Producing Lillibridge 4H Three Forks 8,472 26 922 Producing Lillibridge 3H Middle Bakken 10,000 33 1,291 Producing Lillibridge 2H Three Forks 9,529 30 958 Producing Lillibridge 1H Middle Bakken 10,000 33 1,275 Producing Lillibridge 8H Three Forks 10,000 33 1,020 Producing Lillibridge 7H Middle Bakken 10,000 34 1,005 Producing Lillibridge 6H Three Forks 10,000 33 921 Producing Lillibridge 5H Middle Bakken 10,000 33 1,049 Producing Jore Federal 2-11 1H Three Forks 10,000 NA NA Waiting on completion Jore Federal 2-11 2H Middle Bakken 10,000 NA NA Waiting on completion Jore Federal 2-11 4H Three Forks 10,000 NA NA Waiting on completion Ravin 7H Middle Bakken 10,000 NA NA Intermediate cased Ravin 6H Middle Bakken 10,000 NA NA Intermediate cased Ravin 5H Middle Bakken 10,000 NA NA Drilling intermediate Ravin 4H Middle Bakken 10,000 NA NA Surface cased Bakken / Three Forks Focused on Execution The production rates for each well do not include the impact of natural gas liquids and shrinkage at the processing plant and include flared gas.
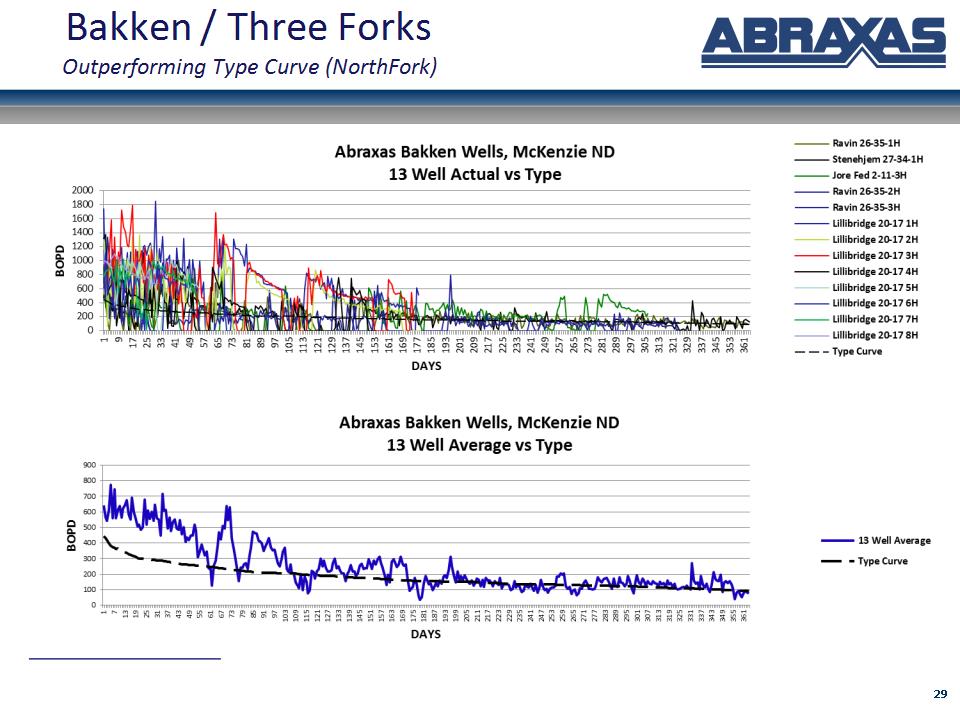
* Bakken / Three Forks Outperforming Type Curve (NorthFork)
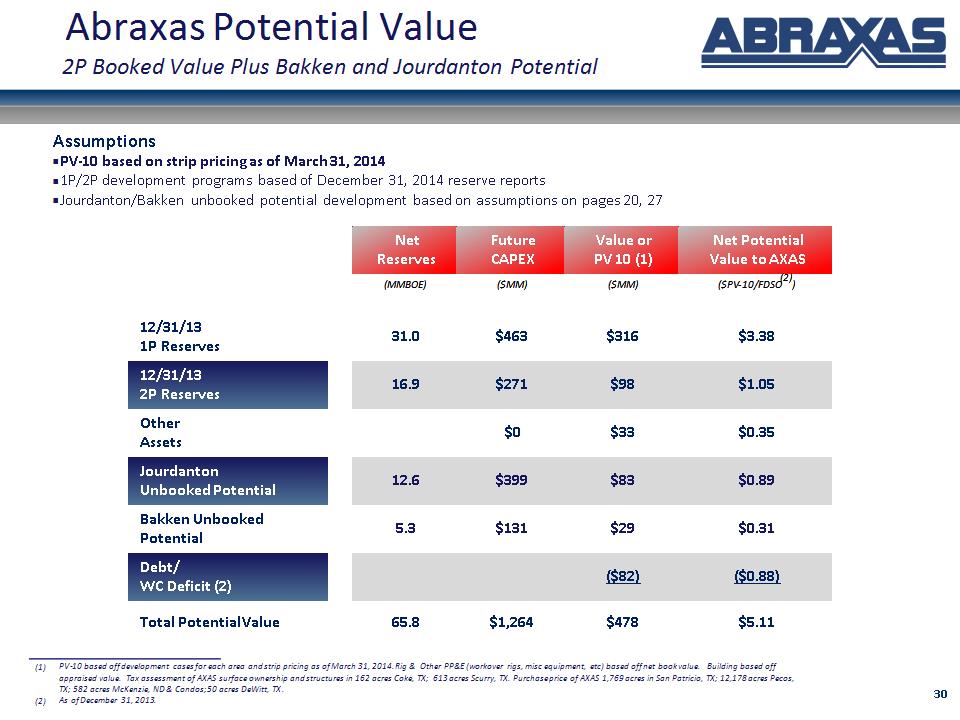
* Abraxas Potential Value 2P Booked Value Plus Bakken and Jourdanton Potential Net Reserves Future CAPEX Value or PV 10 (1) Net Potential Value to AXAS (MMBOE) ($MM) ($MM) ($PV-10/FDSO(2)) 12/31/13 1P Reserves 31.0 $463 $316 $3.38 12/31/13 2P Reserves 16.9 $271 $98 $1.05 Other Assets $0 $33 $0.35 Jourdanton Unbooked Potential 12.6 $399 $83 $0.89 Bakken Unbooked Potential 5.3 $131 $29 $0.31 Debt/ WC Deficit (2) ($82) ($0.88) Total Potential Value 65.8 $1,264 $478 $5.11 PV-10 based off development cases for each area and strip pricing as of March 31, 2014. Rig & Other PP&E (workover rigs, misc equipment, etc) based off net book value. Building based off appraised value. Tax assessment of AXAS surface ownership and structures in 162 acres Coke, TX; 613 acres Scurry, TX. Purchase price of AXAS 1,769 acres in San Patricio, TX; 12,178 acres Pecos, TX; 582 acres McKenzie, ND & Condos; 50 acres DeWitt, TX. As of December 31, 2013. Assumptions PV-10 based on strip pricing as of March 31, 2014 1P/2P development programs based of December 31, 2014 reserve reports Jourdanton/Bakken unbooked potential development based on assumptions on pages 20, 27
* Why Abraxas?
* Appendix
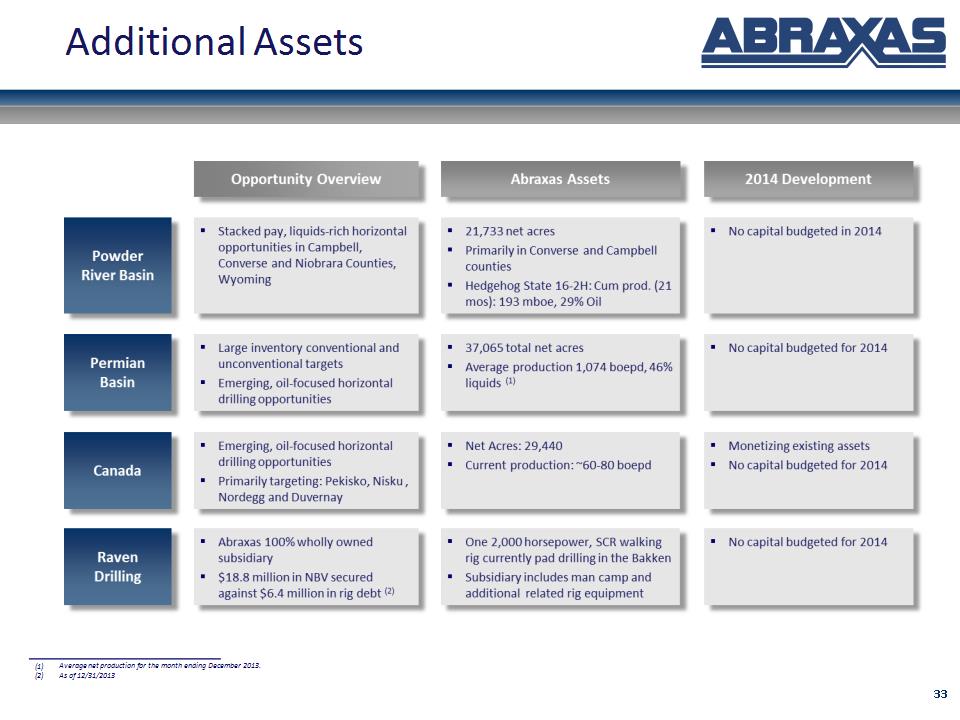
* Additional Assets Average net production for the month ending December 2013. As of 12/31/2013
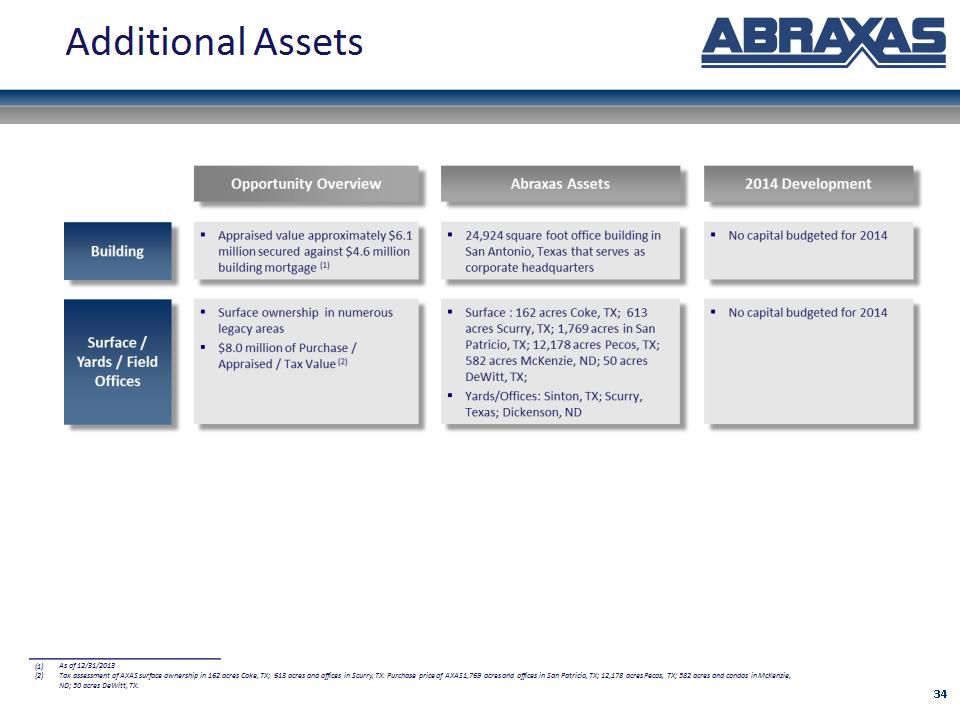
* Additional Assets As of 12/31/2013 Tax assessment of AXAS surface ownership in 162 acres Coke, TX; 613 acres and offices in Scurry, TX. Purchase price of AXAS 1,769 acres and offices in San Patricio, TX; 12,178 acres Pecos, TX; 582 acres and condos in McKenzie, ND; 50 acres DeWitt, TX.
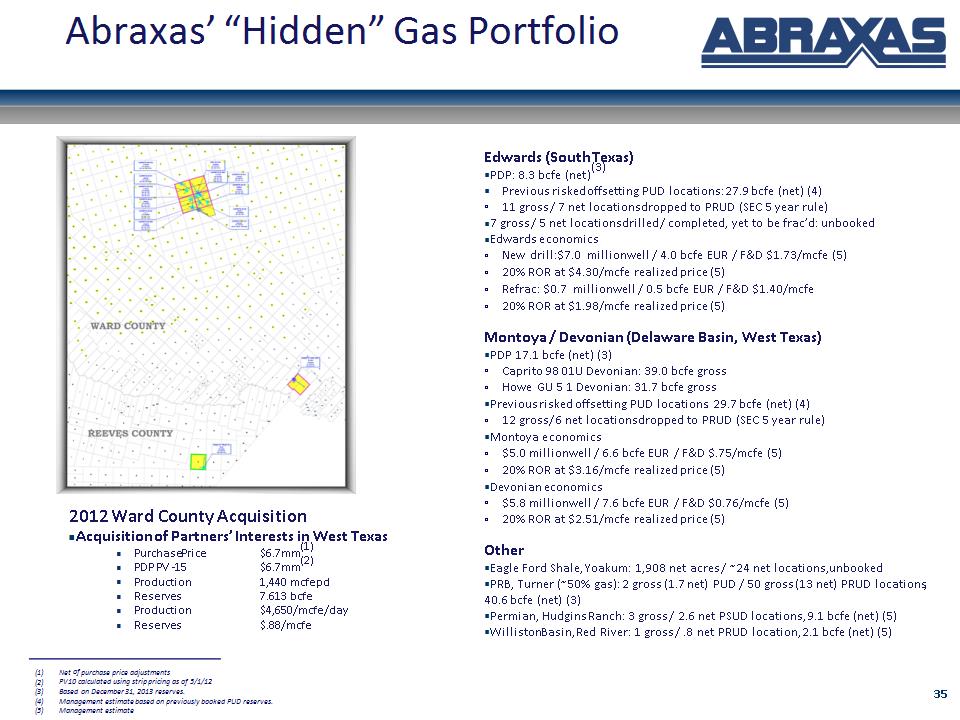
* Edwards (South Texas) PDP: 8.3 bcfe (net)(3) Previous risked offsetting PUD locations: 27.9 bcfe (net) (4) 11 gross / 7 net locations dropped to PRUD (SEC 5 year rule) 7 gross / 5 net locations drilled / completed, yet to be frac’d: unbooked Edwards economics New drill: $7.0 million well / 4.0 bcfe EUR / F&D $1.73/mcfe (5) 20% ROR at $4.30/mcfe realized price (5) Refrac: $0.7 million well / 0.5 bcfe EUR / F&D $1.40/mcfe 20% ROR at $1.98/mcfe realized price (5) Montoya / Devonian (Delaware Basin, West Texas) PDP 17.1 bcfe (net) (3) Caprito 98 01U Devonian: 39.0 bcfe gross Howe GU 5 1 Devonian: 31.7 bcfe gross Previous risked offsetting PUD locations: 29.7 bcfe (net) (4) 12 gross/ 6 net locations dropped to PRUD (SEC 5 year rule) Montoya economics $5.0 million well / 6.6 bcfe EUR / F&D $.75/mcfe (5) 20% ROR at $3.16/mcfe realized price (5) Devonian economics $5.8 million well / 7.6 bcfe EUR / F&D $0.76/mcfe (5) 20% ROR at $2.51/mcfe realized price (5) Other Eagle Ford Shale, Yoakum: 1,908 net acres / ~24 net locations, unbooked PRB, Turner (~50% gas): 2 gross (1.7 net) PUD / 50 gross (13 net) PRUD locations, 40.6 bcfe (net) (3) Permian, Hudgins Ranch: 3 gross / 2.6 net PSUD locations, 9.1 bcfe (net) (5) Williston Basin, Red River: 1 gross / .8 net PRUD location, 2.1 bcfe (net) (5) Net of purchase price adjustments PV10 calculated using strip pricing as of 5/1/12 Based on December 31, 2013 reserves. Management estimate based on previously booked PUD reserves. Management estimate 2012 Ward County Acquisition Acquisition of Partners’ Interests in West Texas Purchase Price $6.7mm(1) PDP PV -15 $6.7mm(2) Production 1,440 mcfepd Reserves 7.613 bcfe Production $4,650/mcfe/day Reserves: $.88/mcfe Abraxas’ “Hidden” Gas Portfolio
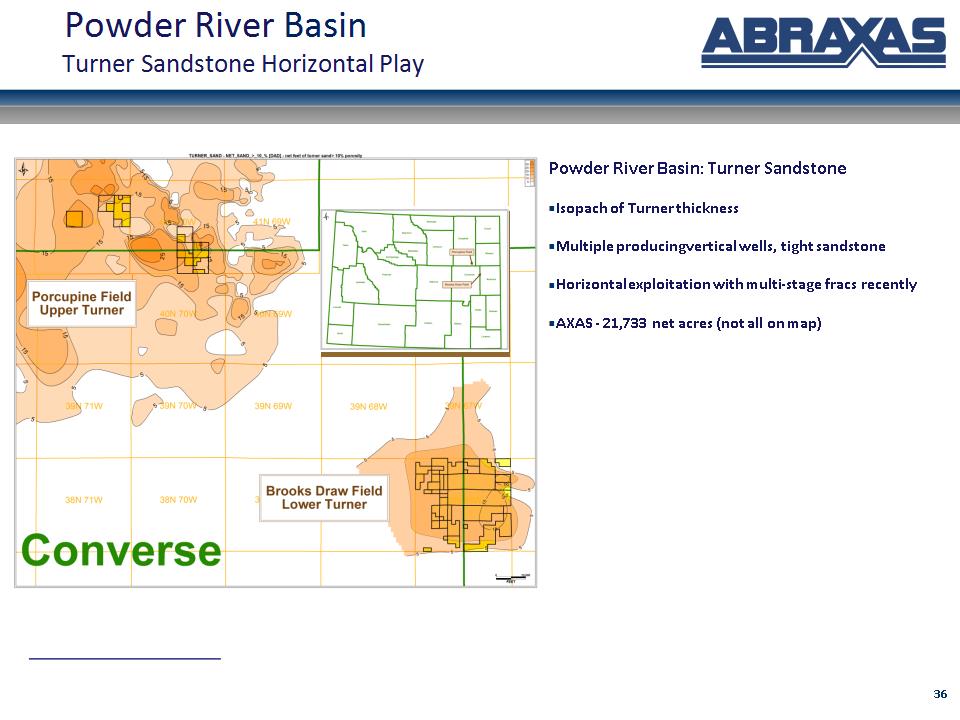
* Powder River Basin Turner Sandstone Horizontal Play Powder River Basin: Turner Sandstone Isopach of Turner thickness Multiple producing vertical wells, tight sandstone Horizontal exploitation with multi-stage fracs recently AXAS – 21,733 net acres (not all on map)
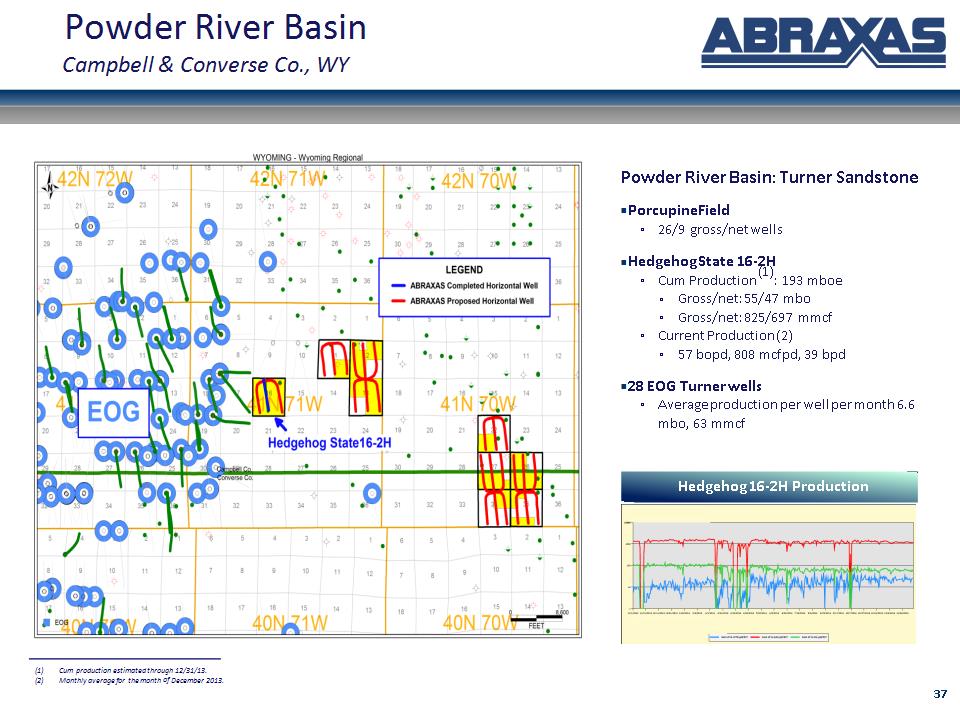
* Powder River Basin Campbell & Converse Co., WY Powder River Basin: Turner Sandstone Porcupine Field 26/9 gross/net wells Hedgehog State 16-2H Cum Production (1): 193 mboe Gross/net: 55/47 mbo Gross/net: 825/697 mmcf Current Production (2) 57 bopd, 808 mcfpd, 39 bpd 28 EOG Turner wells Average production per well per month 6.6 mbo, 63 mmcf Hedgehog 16-2H Production Cum production estimated through 12/31/13. Monthly average for the month of December 2013.
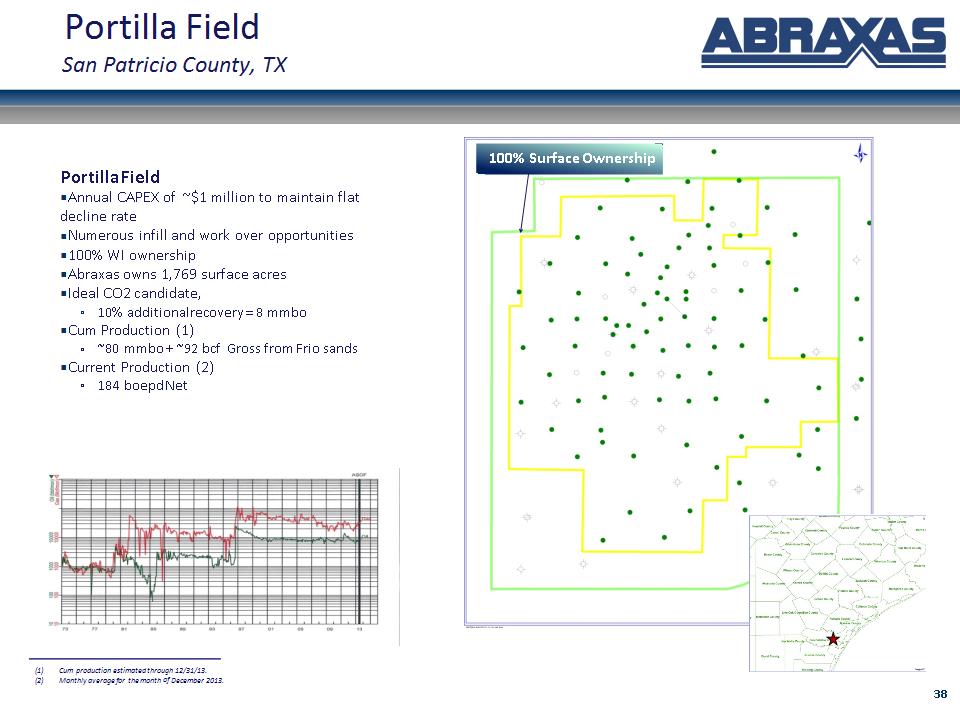
* Portilla Field San Patricio County, TX Portilla Field Annual CAPEX of ~$1 million to maintain flat decline rate Numerous infill and work over opportunities 100% WI ownership Abraxas owns 1,769 surface acres Ideal CO2 candidate, 10% additional recovery = 8 mmbo Cum Production (1) ~80 mmbo + ~92 bcf Gross from Frio sands Current Production (2) 184 boepd Net 100% Surface Ownership Cum production estimated through 12/31/13. Monthly average for the month of December 2013.
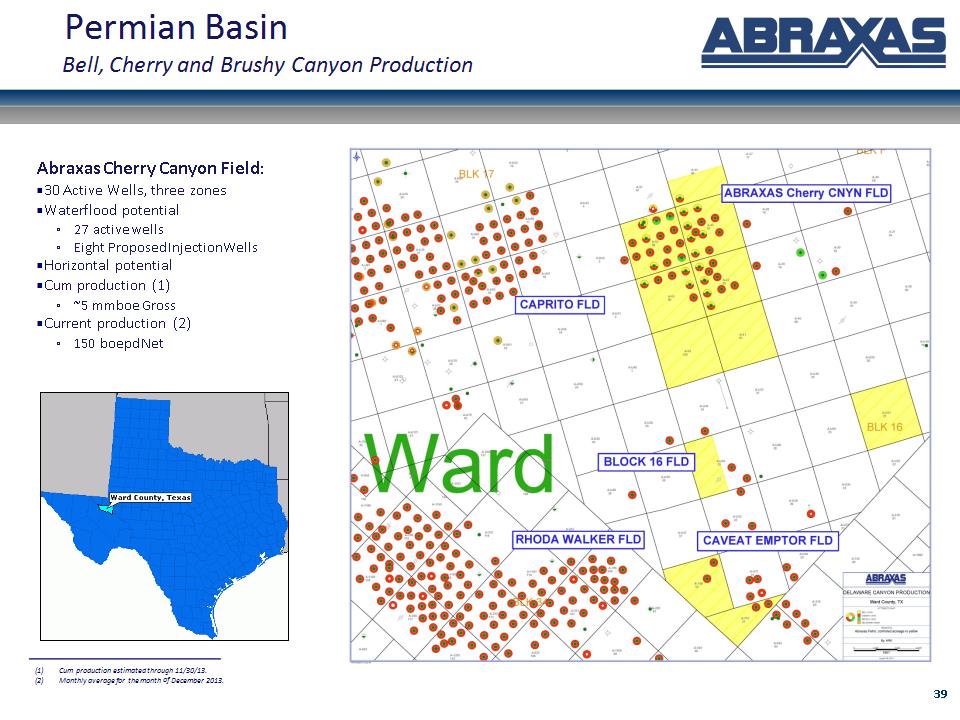
* Abraxas Cherry Canyon Field: 30 Active Wells, three zones Waterflood potential 27 active wells Eight Proposed Injection Wells Horizontal potential Cum production (1) ~5 mmboe Gross Current production (2) 150 boepd Net Permian Basin Bell, Cherry and Brushy Canyon Production Cum production estimated through 11/30/13. Monthly average for the month of December 2013.
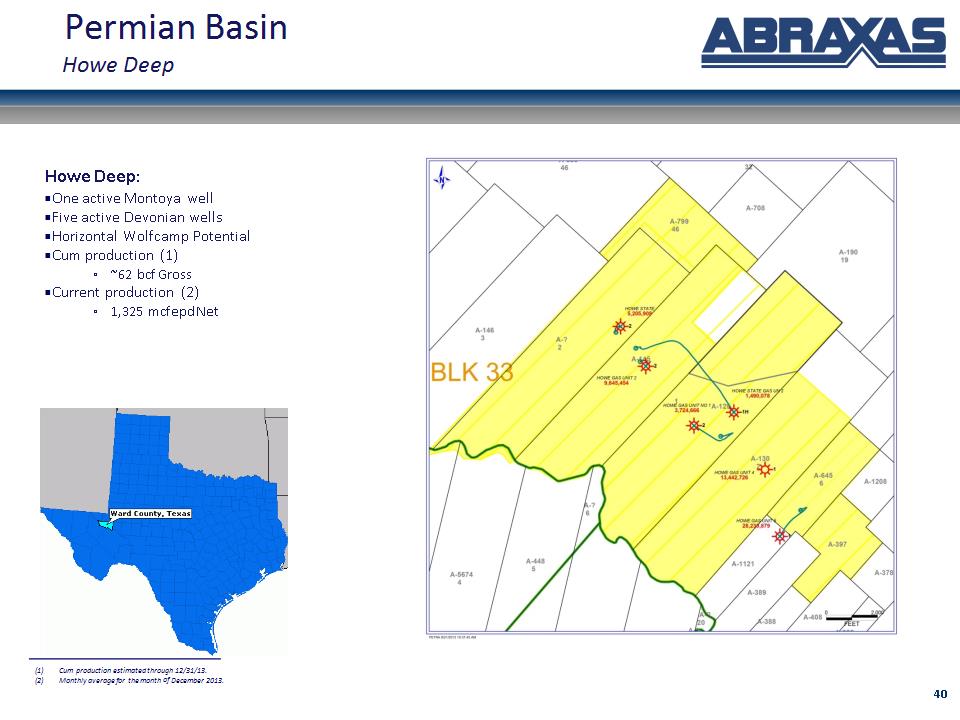
* Howe Deep: One active Montoya well Five active Devonian wells Horizontal Wolfcamp Potential Cum production (1) ~62 bcf Gross Current production (2) 1,325 mcfepd Net Permian Basin Howe Deep Cum production estimated through 12/31/13. Monthly average for the month of December 2013.
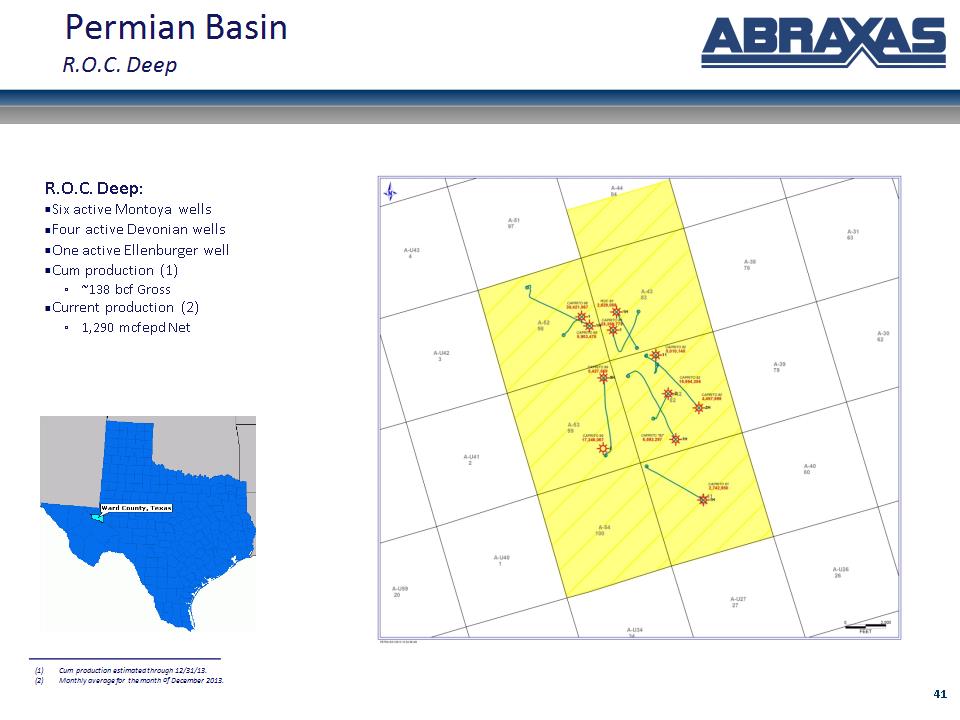
* R.O.C. Deep: Six active Montoya wells Four active Devonian wells One active Ellenburger well Cum production (1) ~138 bcf Gross Current production (2) 1,290 mcfepd Net Permian Basin R.O.C. Deep Cum production estimated through 12/31/13. Monthly average for the month of December 2013.
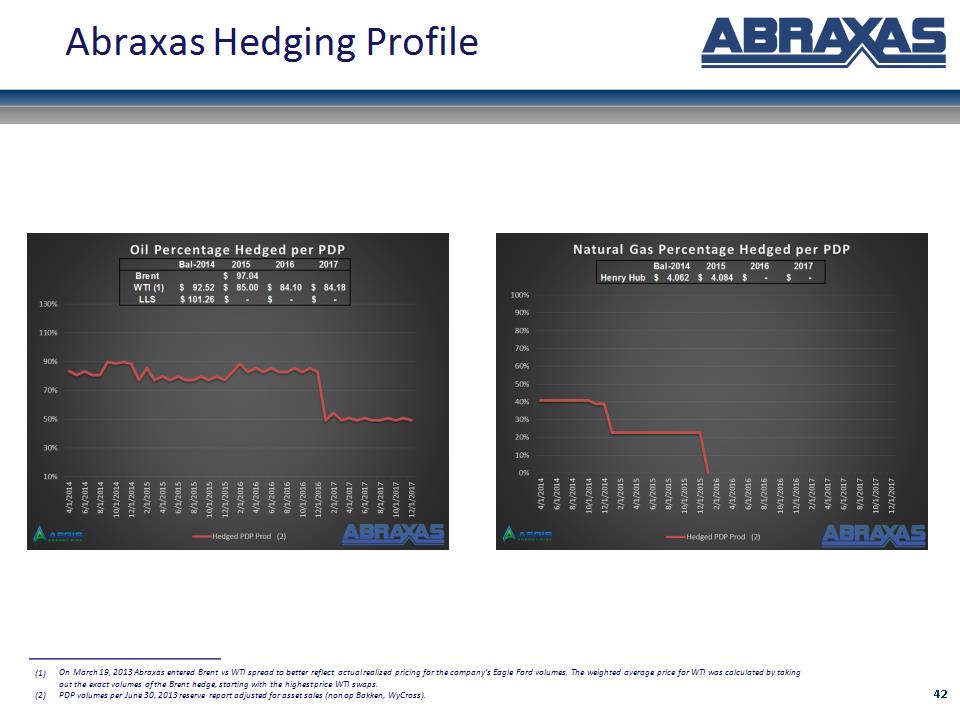
* Abraxas Hedging Profile On March 19, 2013 Abraxas entered Brent vs WTI spread to better reflect actual realized pricing for the company’s Eagle Ford volumes. The weighted average price for WTI was calculated by taking out the exact volumes of the Brent hedge, starting with the highest price WTI swaps. PDP volumes per June 30, 2013 reserve report adjusted for asset sales (non op Bakken, WyCross).
* NASDAQ: AXAS