Attached files
| file | filename |
|---|---|
| 8-K - CURRENT REPORT - POWERSECURE INTERNATIONAL, INC. | d703427d8k.htm |
 April 2014
Exhibit 99.1 |
 2 | ©
2014 PowerSecure. All rights reserved.
Forward Looking Statements
Safe Harbor
All
forward-looking
statements
made
in
this
presentation
are
made
under
the
safe
harbor
provisions
of
the
Private
Securities
Litigation
Reform
Act
of
1995.
Forward-looking
statements,
which
are
all
statements
other
than
statements
of
historical
facts
and
include
beliefs,
opinions,
estimates,
and
projections
about
future
business
developments
and
opportunities
and
financial
guidance,
are
not
guarantees
of
future
performance
or
events
but
are
subject
to
risks,
uncertainties
and
other
factors
that
could
cause
actual
results
to
differ
materially
from
those
expressed,
projected
or
implied,
including
risks
and
uncertainties
set
forth
in
the
Company's
SEC
filings,
including
but
not
limited
to
the
Company’s
most
recent
Form
10-K
and
subsequent
filings
on
Form
8-K
and
10-Q.
Any
forward-looking
statements
in
this
presentation
speak
only
as
of
the
date
hereof,
and
the
Company
assumes
no
duty
or
obligation
to
update
or
revise
any
forward-looking
statements. |
 3 | ©
2014 PowerSecure. All rights reserved.
NYSE:
POWR
PowerSecure: Who We Are Today
Backlog:
$248M
(36% YoY Growth)
>750
Employees
Growing
Operating
Margins,
E.P.S.,
Adjusted EBITDA
Strong
Balance Sheet
TTM Revenues:
$270M
(67% YoY Growth)
Headquarters:
Wake Forest, NC |
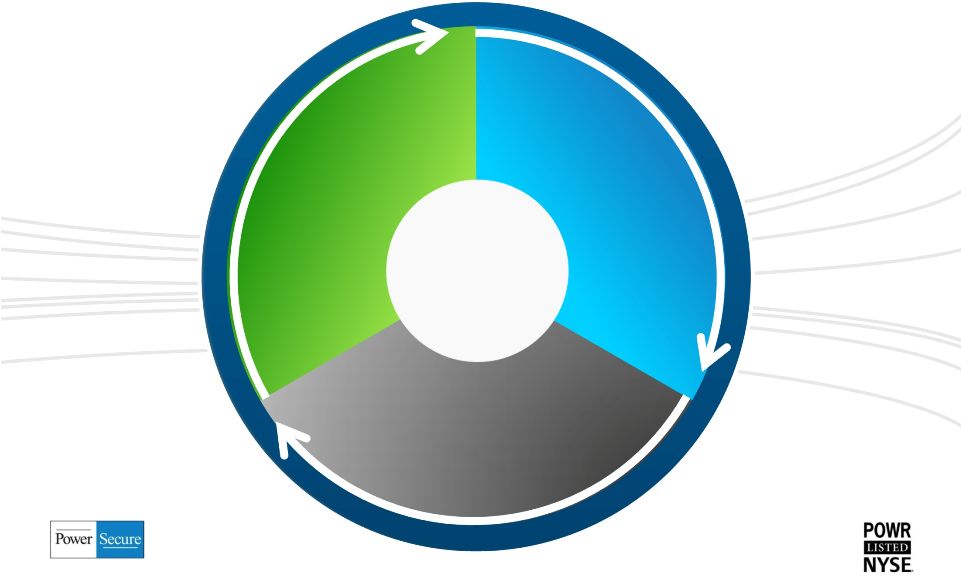
 PowerSecure: Utility Focused
4 | ©
2014 PowerSecure. All rights reserved.
Distributed
Generation
Systems
Utility
Infrastructure
Solutions
Energy Efficiency
Products/Services
Utilities
and Their
Large
Customers |
       FY13
FY12
%
Revenue
Distributed Generation
111.5
76.4
46%
Utility Infrastructure
111.7
60.7
84%
Energy Efficiency
47.0
25.0
89%
Total Revenue
270.2
162.0
67%
GAAP Gross Profit
71.6
51.1
40%
GAAP Gross Profit % Revenue
26.5%
31.5%
-5.0 pp
non-GAAP Gross Profit
75.3
51.1
47%
non-GAAP Gross Profit % Revenue
27.8%
31.5%
-3.7 pp
GAAP Operating Income
8.6
1.9
362%
GAAP Operating Profit % Revenue
3.2%
1.2%
2.0 pp
non-GAAP Operating Income
14.5
4.7
211%
non-GAAP Operating Profit % Revenue
5.4%
2.9%
2.5 pp
GAAP E.P.S.
$0.22
$0.16
38%
Non-GAAP E.P.S.
$0.38
$0.22
73%
Adjusted EBITDA
22.1
11.2
97%
See non-GAAP discussion and reconciliation
5 | ©
2014 PowerSecure. All rights reserved.
FY 2013 Results
(in millions)
Y-O-Y Variance |
       4Q 2013
Results (in millions)
4Q13
4Q12
%
Revenue
Distributed Generation
26.4
22.6
16%
Utility Infrastructure
37.5
20.7
82%
Energy Efficiency
9.7
3.4
182%
Total Revenue
73.6
46.8
57%
GAAP Gross Profit
16.5
15.5
7%
GAAP Gross Profit % Revenue
22.4%
33.0%
-10.6 pp
non-GAAP Gross Profit
20.2
15.5
31%
non-GAAP Gross Profit % Revenue
27.4%
33.0%
-5.6 pp
GAAP Operating Income
-1.8
2.0
N/M
GAAP Operating Profit % Revenue
-2.5 %
4.3%
-6.8 pp
non-GAAP Operating Income
3.5
3.1
12%
non-GAAP Operating Profit % Revenue
4.8%
6.7%
-1.9 pp
GAAP E.P.S.
-$0.09
$0.08
N/M
Non-GAAP E.P.S.
$0.13
$0.13
0%
Y-O-Y Variance
See non-GAAP discussion and reconciliation
6 | ©
2014 PowerSecure. All rights reserved. |
 7 | ©
2014 PowerSecure. All rights reserved.
•
2013 GAAP EPS of $0.22 (+37.5% y-o-y)
•
2013 non-GAAP EPS of $0.38 (+72.7% y-o-y)
•
2013 operating margins increase
o
+ 2.0 pp on a GAAP basis
o
+ 2.5 pp on a non-GAAP basis
•
2013 Adjusted EBITDA increases 97% to $22.1M
•
Decreasing OpEx as percentage of revenue
•
Increasing scale across all business lines
Meaningful Bottom Line Leverage
See non-GAAP discussion and reconciliation |
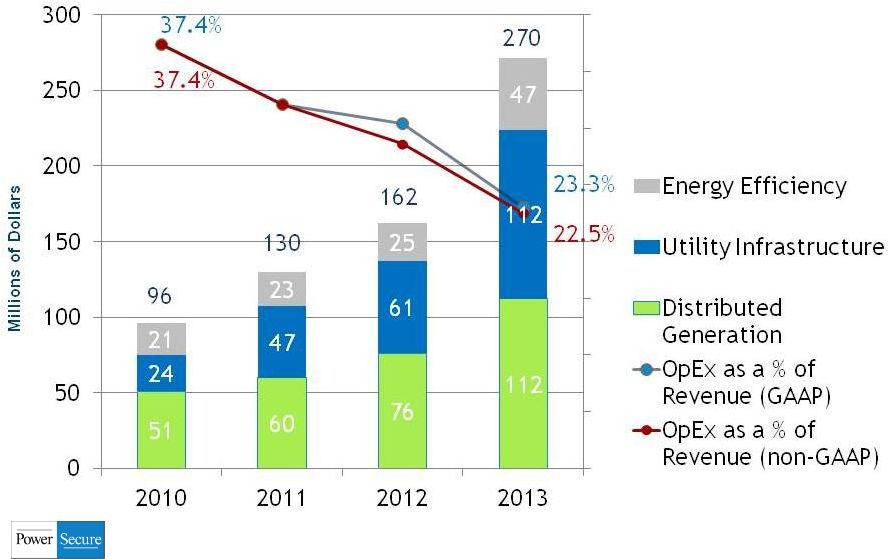 8 | ©
2013 PowerSecure. All rights reserved.
Revenue Scaling and Diversifying:
Driving OpEx Leverage
See non-GAAP discussion and reconciliation |
 9 | ©
2014 PowerSecure. All rights reserved.
2011 Progression
Revenue
E.P.S. --
Non-GAAP
E.P.S. --
GAAP
$0.25 $0.90
$0.05 $0.06 See non-GAAP
discussion and reconciliation |
 See non-GAAP discussion and reconciliation
10 | ©
2014 PowerSecure. All rights reserved. |
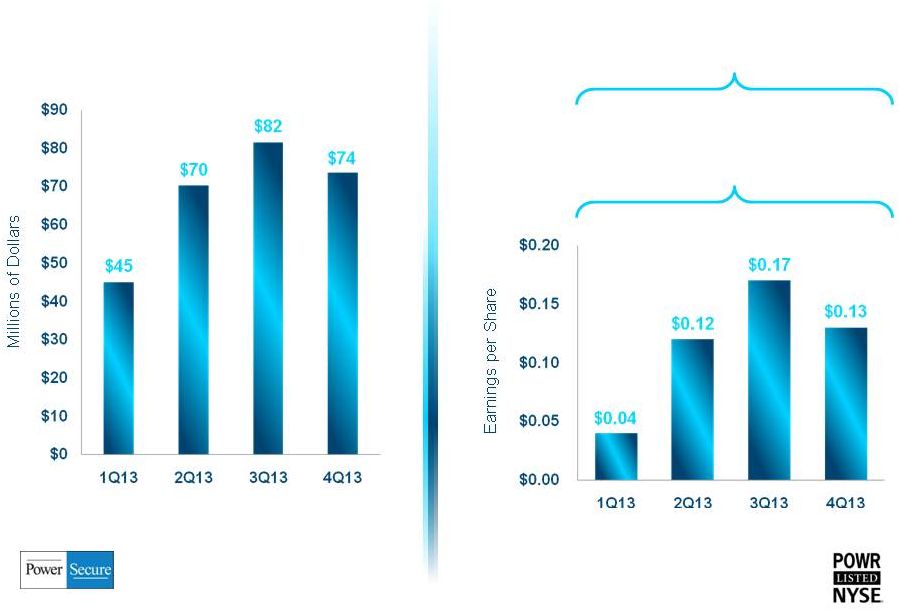 Revenue
2013 Progression
E.P.S. --
Non-GAAP
E.P.S. --
GAAP
See non-GAAP discussion and reconciliation
$0.04
$0.11 $0.17 ($0.09)
11 | ©
2014 PowerSecure. All rights reserved. |
 •
At end of Q4 2013:
-
$50.9 M in Cash
-
$27 M term debt (majority hedged at 3.73%)
-
Untapped $20 M revolver
•
Potential uses of capital:
-
Additional investment in company-owned DG projects
-
Potential acquisitions
-
Working capital
-
Equipment to support growth in UI
Robust Balance Sheet
12 | ©
2014 PowerSecure. All rights reserved. |
  •
Provides cyber security and NERC-CIP
compliance consulting services to
utility industry
•
Opportunity for PowerSecure to expand
UI service offerings to world-class Encari
customer base
•
PowerSecure can bring Encari’s
expertise to existing UI customers
•
Accretive to UI gross margin
Recent Acquisitions Add Value
Purchased
Encari for $4.8M
October 2013
13 | ©
2014 PowerSecure. All rights reserved. |
  Recent
Acquisitions Add Value •
Successful 20-yr old business serving
major ESCOs with lighting, mechanical,
water and building envelope solutions
to deliver energy efficiency savings
•
Significantly expands our Energy
Efficiency offerings
•
Opens new customer channels for
LED lighting and peak shaving
•
Delivered $2.3M in profit in 2013
Purchased
ESCO services
business
for $5.5M
February 2013
14 | ©
2014 PowerSecure. All rights reserved. |
 Recent Acquisitions Add Value
•
Solais has significant sourcing and
manufacturing expertise
•
Adds substantial efficiencies to
manufacturing of PowerSecure’s
existing LED solutions
•
Outstanding proprietary portfolio of LED
lamps and fixtures for commercial and
Industrial applications
•
Superior light output, thermal
management, optics, light quality and
aesthetics
Purchased
Solais lighting
business
for $15 M
April 2013
15 | ©
2014 PowerSecure. All rights reserved. |
 16 | ©
2014 PowerSecure. All rights reserved.
2014 Goal: >$300M in Revenues
16 | ©
2014 PowerSecure. All rights reserved.
Distributed
Generation
Utility
Infrastructure
Energy
Efficiency |
 DG:
Hospital & Data Center Growth Drivers •
Hospital revenues +144% in 2013
•
Data center revenues +86% in 2013
•
Average DG project size up 28%
from 2012 to 2013
•
Focused hospital and data center
sales teams
•
Proprietary PowerBlock solution
drivers higher ROI for customers
•
70% bi-fuel capability delivers
environmental & economic benefits
•
18-24 month sales cycle
17
|
2013
PowerSecure.
All
rights
reserved.
© |
 PowerSecure Distributed Generation:
Differentiated Solution=Superior Reliability & ROI
•
24/7 monitoring: standby and peak shaving
•
Proprietary internet-based monitoring, dispatch and control
•
“No Pain”
demand response
•
98.2% reliability
•
Utility tariff and interconnect experts
•
Solar DG capability
Interactive
Distributed
Generation
®
System
Electric
Utility
Customer
Facility
18
|
2014
PowerSecure.
All
rights
reserved.
© |
 •
T&D maintenance and construction
•
Substation products and services
•
Advanced metering and lighting
installation
•
Storm repair and restoration
•
Utility engineering and design
•
Regulatory consulting and rate design
Utility Infrastructure:
Direct Service to our Utility Customers
19
|
2014
PowerSecure.
All
rights
reserved.
© |
 •
Department store/high-end retail lighting
-
Solais product line adds new customers
•
Utility lighting
•
Grocery, drug, and convenience stores
-
Best-in-class lights for freezer/refrigerated cases
•
Commercial & industrial lighting
-
New targeted/niche product recently launched
Energy Efficiency: LED Solutions
-
Utilities and municipalities
-
Energy and maintenance savings drive payback
-
Opportunity: millions of lights across U.S.
20
|
2014
PowerSecure.
All
rights
reserved.
© |
 PowerSecure: Utility Focused
Energy Efficiency
Products/Services
Utility
Infrastructure
Solutions
Distributed
Generation
Systems
Utilities
And Their
Large
Customers
©
21
|
2014
PowerSecure.
All
rights
reserved.
© |
 Thank you |
 Non-GAAP Financial Measures
23 | ©
2014 PowerSecure. All rights reserved.
Our references to our fourth quarter and full year 2013, and fourth quarter and full year 2012
“non- GAAP pro forma” financial measures of cost of sales, gross margins, gross
margins as a percentage of revenue, operating expenses, operating expenses as a percentage of
revenue, operating income, operating income as a percentage of revenue, net income from
continuing operations, net income, net income attributable to PowerSecure International, Inc.,
diluted E.P.S. from continuing operations, and diluted E.P.S. discussed and shown in this report
constitute non-GAAP financial measures. For the fourth quarter of 2013, our
non-GAAP financial measures refer to our GAAP results, excluding a $4.9 million charge
primarily related to the restructuring of the Company’s Energy Efficiency LED lighting
operations to position its product lines for enhanced future growth and profitability. The
restructuring was implemented to realize the manufacturing and sourcing synergies contemplated
by the Company in its 2013 acquisition of Solais Lighting. The actions taken included
eliminating certain duplicative facilities, resourcing from new lower cost suppliers, reducing
the number of product offerings, and reducing personnel and overhead. $3.7 million of
this charge relates to inventory and was recorded in cost of sales, and $1.2 million relates to
severance, facilities and equipment expenses which was recorded as “restructuring
charge” in operating expense. The Company expects to record an additional charge
related to these actions in the first quarter of 2014 in an amount of $0.3-1.0 million.
Fourth quarter 2013 non-GAAP financial measures also exclude a one-time expense of $0.5
million to upgrade an annuity that underpins the post-retirement compensation of its chief
executive officer to fully guarantee future payments. |
 24 | ©
2014 PowerSecure. All rights reserved.
Non-GAAP Financial Measures
For the fourth quarter of 2012, our non-GAAP financial measures refer to our GAAP results,
excluding a $1.1 million pre-tax charge related to a restructuring and cost reduction plan that was
initiated during the third quarter of 2012, and extended into the fourth quarter of 2012, to
position the company to lower its operating expenses as a percentage of revenue in future
periods. For the full year 2013, our non-GAAP financial measures refer to our GAAP results,
excluding a $4.9 million charge primarily related to the restructuring of the Company’s
Energy Efficiency LED lighting operations to position its product lines for enhanced future
growth and profitability. $3.7 million of this charge relates to inventory and was
recorded in cost of sales, and $1.2 million relates to severance, facilities, and equipment
expenses which was recorded as “restructuring charge” in operating expense. Our full
year 2013 non-GAAP financial measures also exclude a one-time expense of $0.5 million
to upgrade an annuity that underpins the post-retirement compensation of its chief executive
officer to fully guarantee future payments, and acquisition expenses of $0.6 million related to
the Solais, ESCO, and PowerLine transactions. For the full year 2012, our non-GAAP financial measures refer to our GAAP results, excluding: 1)
$2.7 million in charges related to restructuring and cost reduction actions taken in 2012, 2)
acquisition expenses of $0.1 million related to the PowerSecure Solar transaction, and 3) gain
on the sale of the company’s WaterSecure investment of $1.4 million. We believe providing
non-GAAP measures which show our pro forma results with these items adjusted is valuable
and useful as it allows our management and our board of directors to measure, monitor and
evaluate our operating performance in 2012, 2013, and in future periods with the same
consistent financial context as the business was managed in those periods. Additionally,
because these items were non-recurring, our non-GAAP pro forma measures are more
comparable to our prior period and future period results. |
 25 | ©
2014 PowerSecure. All rights reserved.
Non-GAAP Financial Measures
References to our fourth quarter and full year 2012 and 2013 Adjusted EBITDA, which we define as
our earnings before interest, taxes, depreciation and amortization, as discussed and shown in this
release, constitutes a non-GAAP “pro forma” financial measure.
We believe that Adjusted EBITDA, as a non-GAAP pro forma financial measure, provides
meaningful information to investors in terms of enhancing their understanding of our operating
performance and results, as it allows investors to more easily compare our financial
performance on a consistent basis compared to the prior year periods. This non-GAAP
financial measure also corresponds with the way we expect investment analysts to evaluate and
compare our results. Any non-GAAP pro forma financial measures should be considered
only as supplements to, and not as substitutes for or in isolation from, or superior to, our
other measures of financial information prepared in accordance with GAAP, such as net income
attributable to PowerSecure International, Inc. We define and calculate Adjusted EBITDA as net income attributable to PowerSecure International,
Inc., minus: 1) the gain on the sale of our unconsolidated affiliate, 2) discontinued
operations and 3) interest income and other income, plus: 4) restructuring charges, 5)
acquisition expenses, 6) income tax expense (or minus an income tax benefit), 7) interest
expense, 8) depreciation and amortization and 9) stock compensation expense. We disclose
Adjusted EBITDA because we believe it is a useful metric by which to compare the performance of
our business from period to period. We understand that measures similar to Adjusted
EBITDA are broadly used by analysts, rating agencies, investors and financial institutions in
assessing our performance. Accordingly, we believe that the presentation of Adjusted
EBITDA provides useful information to investors. The table below provides a
reconciliation of Adjusted EBITDA to net income attributable to PowerSecure International, Inc., the
most directly comparable GAAP financial measure. |
 26 | ©
2014 PowerSecure. All rights reserved. |
 27 | ©
2014 PowerSecure. All rights reserved. |
 28 | ©
2014 PowerSecure. All rights reserved. |
 29 | ©
2013 PowerSecure. All rights reserved.
Non-GAAP Financial Measures
Our references to our quarterly and full year 2012, and quarterly and full year 2011 “Non-GAAP
Pro forma” financial measures of operating expenses, operating expenses as a percentage of
revenue, operating income, operating income as a percentage of revenue, net income from
continuing operations, net income, net income attributable to PowerSecure International, Inc.,
diluted E.P.S. from continuing operations, and diluted E.P.S. discussed and shown in this
report constitute non- GAAP financial measures. For our quarterly and full year
2012 results, they refer to our GAAP results, adjusted to show them 1) excluding charges
related to our restructuring and cost reduction initiative, 2) gains related to the 2011 sale
of our WaterSecure operations, and 3) results of our discontinued PowerPackages business exited
in 2011. For our fourth quarterly and full year 2011 results, they refer to our GAAP
results, adjusted to show them 1) excluding gains and income related to our WaterSecure
operations, 2) the results of our discontinued PowerPackages business, and 3) gains and income
related to our discontinued Southern Flow business sold in 2011. We believe providing non-GAAP measures which show our pro forma results with these items
adjusted is valuable and useful as it allows our management and our board of directors to measure,
monitor and evaluate our operating performance in 2011, 2012, and in future periods with
the same consistent financial context as the business was managed in those periods.
Additionally, because these items were non-recurring, our non-GAAP pro forma measures
are more comparable to our prior period and future period results. |
 30 | ©
2013 PowerSecure. All rights reserved.
Non-GAAP Financial Measures
We believe providing non-GAAP measures which show our pro forma results with these items
adjusted is valuable and useful as it allows our management and our board of directors to measure,
monitor and evaluate our operating performance in 2011, 2012, and in future periods with
the same consistent financial context as the business was managed in those periods.
Additionally, because these items were non-recurring, our non-GAAP pro forma measures
are more comparable to our prior period and future period results.
We believe these Non-GAAP Pro forma measures also provide meaningful information to investors
in terms of enhancing their understanding of our fourth quarter and full year 2012, and fourth
quarter and full year 2011 operating performance and results, as they allow investors to more
easily compare our financial performance on a consistent basis compared to the prior year
periods. These Non-GAAP Pro forma measures also correspond with the way we expect
investment analysts to evaluate and compare our results. Our Non-GAAP Pro forma
measures should be considered only as supplements to, and not as substitutes for or in
isolation from, or superior to, our other measures of financial information prepared in
accordance with GAAP, such as GAAP revenue, operating expenses, operating expenses as a
percentage of revenue, operating income, operating income as a percentage of revenue, net
income from continuing operations, net income, net income attributable to PowerSecure
International, Inc., diluted E.P.S. from continuing operations, diluted E.P.S. from
discontinued operations, and diluted E.P.S.
The following table provides a reconciliation of these non-GAAP financial measures to the most
directly comparable GAAP financial measures. |
 Non-GAAP Financial Measures |
 32 | ©
2014 PowerSecure. All rights reserved. |