Attached files
| file | filename |
|---|---|
| EX-23.2 - EX-23.2 - Range Resources - Louisiana, Inc. | d658814dex232.htm |
| EX-99.3 - EX-99.3 - Range Resources - Louisiana, Inc. | d658814dex993.htm |
| EX-23.1 - EX-23.1 - Range Resources - Louisiana, Inc. | d658814dex231.htm |
Table of Contents
As filed with the Securities and Exchange Commission on April 4, 2014
Registration No. 333-
UNITED STATES
SECURITIES AND EXCHANGE COMMISSION
WASHINGTON, D.C. 20549
FORM S-1
REGISTRATION STATEMENT
UNDER
THE SECURITIES ACT OF 1933
MEMORIAL RESOURCE DEVELOPMENT CORP.
(Exact name of registrant as specified in its charter)
| Delaware | 1311 | 46-4710769 | ||
| (State or other jurisdiction of incorporation or organization) |
(Primary Standard Industrial Classification Code Number) |
(I.R.S. Employer Identification Number) |
1301 McKinney Street, Suite 2100
Houston, Texas 77010
(713) 588-8300
(Address, including zip code, and telephone number, including area code, of registrants’ principal executive offices)
Kyle N. Roane
Vice President, General Counsel and Corporate Secretary
Memorial Resource Development Corp.
1301 McKinney Street, Suite 2100
Houston, Texas 77010
(713) 588-8300
(Name, address, including zip code, and telephone number, including area code, of agent for service)
With copies to:
| John Goodgame Shar Ahmed Akin Gump Strauss Hauer & Feld LLP 1111 Louisiana Street, 44th Floor Houston, TX 77002 (713) 220-5800 |
Douglas E. McWilliams Vinson & Elkins L.L.P. 1001 Fannin, Suite 2500 Houston, TX 77002 (713) 758-2222 |
Approximate date of commencement of proposed sale of the securities to the public: As soon as practicable after this Registration Statement becomes effective.
If any of the securities being registered on this form are to be offered on a delayed or continuous basis pursuant to Rule 415 under the Securities Act of 1933, check the following box: ¨
If this Form is filed to register additional securities for an offering pursuant to Rule 462(b) under the Securities Act, check the following box and list the Securities Act registration statement number of the earlier effective registration statement for the same offering. ¨
If this Form is a post-effective amendment filed pursuant to Rule 462(c) under the Securities Act, check the following box and list the Securities Act registration statement number of the earlier effective registration statement for the same offering. ¨
If this Form is a post-effective amendment filed pursuant to Rule 462(d) under the Securities Act, check the following box and list the Securities Act registration statement number of the earlier effective registration statement for the same offering. ¨
Indicate by check mark whether the registrant is a large accelerated filer, an accelerated filer, a non-accelerated filer, or a smaller reporting company. See the definitions of “large accelerated filer,” “accelerated filer” and “smaller reporting company” in Rule 12b-2 of the Exchange Act.
| Large Accelerated filer | ¨ | Accelerated filer | ¨ | |||
| Non-accelerated filer | x (Do not check if a smaller reporting company) | Smaller reporting company | ¨ | |||
CALCULATION OF REGISTRATION FEE
|
| ||||
| Title of each class of securities to be registered |
Proposed maximum aggregate offering price(1)(2) |
Amount of registration fee | ||
| Common Stock, $0.01 par value per share |
$700,000,000 | $90,160 | ||
|
| ||||
| (1) | Estimated solely for the purpose of calculating the registration fee pursuant to Rule 457(o) under the Securities Act of 1933, as amended. |
| (2) | Includes shares issuable upon the underwriters’ exercise of its overallotment option. |
The Registrant hereby amends this Registration Statement on such date or dates as may be necessary to delay its effective date until the Registrant shall file a further amendment which specifically states that this Registration Statement shall thereafter become effective in accordance with Section 8(a) of the Securities Act of 1933, as amended, or until this Registration Statement shall become effective on such date as the Commission, acting pursuant to said Section 8(a), may determine.
Table of Contents
The information in this preliminary prospectus is not complete and may be changed. We may not sell these securities until the registration statement filed with the Securities and Exchange Commission is effective. This preliminary prospectus is not an offer to sell securities and it is not soliciting an offer to buy these securities in any state where the offer or sale is not permitted.
SUBJECT TO COMPLETION, DATED APRIL 4, 2014
PRELIMINARY PROSPECTUS
Shares

Memorial Resource Development Corp.
Common Stock
$ per share
This is our initial public offering. We are selling shares of common stock, and Memorial Resource Development LLC is selling shares of our common stock. We expect the public offering price to be between $ and $ per share. Memorial Resource Development LLC has granted the underwriters a 30-day option to purchase up to an additional shares of common stock. We will not receive any proceeds from the sale of shares by Memorial Resource Development LLC, including any shares that it may sell pursuant to the underwriters’ option to purchase additional shares of common stock.
Currently, no public market exists for our common stock. We intend to apply to list our common stock on the NASDAQ Global Market under the symbol “MRD.” Following the completion of this offering, we will be a “controlled company” as defined under the NASDAQ listing rules because the group consisting of affiliates of Natural Gas Partners will beneficially own over 50% of our shares of outstanding common stock. See “Principal and Selling Stockholders.”
Investing in our common stock involves risks that are described in the “Risk Factors” section beginning on page 24 of this prospectus.
We are an emerging growth company as that term is used in the Jumpstart Our Business Startups Act of 2012, and as such, we have elected to take advantage of certain reduced public company reporting requirements for this prospectus and future filings. See “Risk Factors” and “Summary—Emerging Growth Company Status.”
Neither the Securities and Exchange Commission nor any state securities commission has approved or disapproved of these securities or passed upon the adequacy or accuracy of this prospectus. Any representation to the contrary is a criminal offense.
| Per Share | Total | |||||||
| Initial Public Offering Price |
$ | $ | ||||||
| Underwriting Discounts and Commissions |
$ | $ | ||||||
| Proceeds, Before Expenses, to Us |
$ | $ | ||||||
| Proceeds, Before Expenses, to Memorial Resource Development LLC |
$ | $ | ||||||
The underwriters expect to deliver the shares of common stock on or about , 2014.
Citigroup
The date of this prospectus is , 2014.
Table of Contents
[Inside cover art to be provided]
Table of Contents
| Page | ||||
| 1 | ||||
| 24 | ||||
| 50 | ||||
| 52 | ||||
| 53 | ||||
| 54 | ||||
| 55 | ||||
| 57 | ||||
| MANAGEMENT’S DISCUSSION AND ANALYSIS OF FINANCIAL CONDITION AND RESULTS OF OPERATIONS |
60 | |||
| 86 | ||||
| 120 | ||||
| 130 | ||||
| 132 | ||||
| 136 | ||||
| 140 | ||||
| 144 | ||||
| 146 | ||||
| 150 | ||||
| 155 | ||||
| 155 | ||||
| 156 | ||||
| F-1 | ||||
| A-1 | ||||
| B-1 | ||||
| B-14 | ||||
You should rely only on the information contained in this prospectus. Neither we, Memorial Resource Development LLC, nor the underwriters have authorized any person to provide you with any information or represent anything about us or this offering that is not contained in this prospectus. If given or made, any such other information or representation should not be relied upon as having been authorized by us. Neither we nor Memorial Resource Development LLC are making an offer in any jurisdiction where an offer or sale is not permitted. The information contained in this prospectus is current only as of its date.
i
Table of Contents
Commonly Used Defined Terms
As used in this prospectus, unless we indicate otherwise:
| • | “the Company,” “we,” “our,” “us” and “our company” or like terms refer collectively to (i) Memorial Resource Development Corp. and its subsidiaries (other than MEMP and its subsidiaries) for periods after the restructuring transactions described below and (ii) our predecessor (as described below) other than MEMP and its subsidiaries for periods prior to the restructuring transactions; |
| • | “Memorial Production Partners,” “MEMP” and “the Partnership” refer to Memorial Production Partners LP individually and collectively with its subsidiaries, as the context requires. Following the restructuring transactions described below, we will own the general partner of MEMP as well as 5,360,912 subordinated units representing an 8.7% limited partner interest in MEMP and 50% of MEMP’s incentive distribution rights; |
| • | “MEMP GP” refers to Memorial Production Partners GP LLC, the general partner of the Partnership, which we will own following completion of the restructuring transactions described below; |
| • | “MRD LLC” refers to Memorial Resource Development LLC, which has historically owned our predecessor’s business and will own shares of our common stock following completion of the restructuring transactions described below; |
| • | “WildHorse Resources” refers to WildHorse Resources, LLC and its subsidiaries, which owns our interest in the Terryville Complex and will be our 100% owned subsidiary following completion of the restructuring transactions described below; |
| • | “our predecessor” refers collectively to MRD LLC and its consolidated subsidiaries, consisting of Classic Hydrocarbons Holdings, L.P., Classic Hydrocarbons GP Co., L.L.C., Black Diamond Minerals, LLC, Beta Operating Company, LLC, MEMP GP, BlueStone, MRD Operating LLC, WildHorse Resources and each of their respective subsidiaries, including MEMP and its subsidiaries; |
| • | “the Funds” refers collectively to Natural Gas Partners VIII, L.P., Natural Gas Partners IX, L.P. and NGP IX Offshore Holdings, L.P., which collectively own MRD LLC; |
| • | “restructuring transactions” means the transactions described beginning on page 13 that will take place in connection with the closing of this offering and pursuant to which we will acquire assets of MRD LLC (not including its interests in BlueStone, MRD Royalty or MRD Midstream) that comprise substantially all of the assets of MRD LLC; |
| • | “BlueStone” refers to BlueStone Natural Resources Holdings, LLC, which sold substantially all of its assets in July 2013 for approximately $117.9 million; |
| • | “NGP” refers to Natural Gas Partners, a family of private equity investment funds organized to make direct equity investments in the energy industry, including the Funds; |
| • | “MRD Royalty” refers to MRD Royalty LLC, which owns certain immaterial leasehold interests and overriding royalty interests in Texas and Montana; and |
| • | “MRD Midstream” refers to MRD Midstream LLC, which owns an indirect interest in certain immaterial midstream assets in North Louisiana. |
Industry and Market Data
The market data and certain other statistical information used throughout this prospectus are based on independent industry publications, government publications or other published independent sources. Some data is also based on our good faith estimates. Although we believe these third-party sources are reliable and that the information is accurate and complete, neither we nor MRD LLC have independently verified the information.
Equivalency
This prospectus presents certain production and reserves-related information on an “equivalency” basis. When we refer to oil and natural gas in “equivalents,” we are doing so to compare quantities of oil with quantities of natural gas. In calculating equivalents, we use a generally recognized standard in which one Bbl of oil and/or NGLs is equivalent to six Mcf of natural gas. This calculation is based on an approximate energy equivalency and does not imply or reflect a value or price relationship.
ii
Table of Contents
This summary highlights information appearing elsewhere in this prospectus. You should read the entire prospectus carefully, including “Risk Factors” beginning on page 24 and the historical and pro forma financial statements and the related notes to those financial statements. Certain oil and gas industry terms, including the terms proved reserves, probable reserves and possible reserves, used in this prospectus are defined in the “Glossary of Oil and Natural Gas Terms” in Appendix A of this prospectus.
Because we control MEMP through our ownership of its general partner, we are required to consolidate MEMP for accounting and financial reporting purposes even though we only own a minority of its limited partner interests. Our financial statements include two reportable business segments: (i) the MRD Segment, which reflects all of our operations except for MEMP and its subsidiaries, and (ii) the MEMP Segment, which reflects the operations of MEMP and its subsidiaries. Except with respect to our consolidated and combined financial statements or as otherwise indicated, the description of our business, properties, strategies and other information in this summary does not include the business, properties or results of operations of BlueStone, MRD Royalty, MRD Midstream (the assets of which are included in our predecessor but will not be conveyed to us in the restructuring transactions) or MEMP. Our proved reserves as of December 31, 2013 have been prepared by Netherland, Sewell & Associates, Inc., our independent reserve engineers (“NSAI”), and our probable and possible reserves as of December 31, 2013 have been prepared by our internal reserve engineers and audited by NSAI, all of which are reflected in our reserve reports (which we collectively refer to as our “reserve report”), summaries of which are included in Appendices B-1 and B-2 of this prospectus.
Information expressed on a pro forma basis in this summary gives effect to certain transactions as if they had occurred on December 31, 2013 for pro forma balance sheet purposes and on January 1, 2013 for pro forma statements of operations purposes. For a description of these transactions, please read “Summary Historical Consolidated and Combined Pro Forma Financial Data” and “—Our Structure and Restructuring Transactions.” Where applicable, we have assumed an initial public offering price of per share, the midpoint of the price range set forth on the cover page of this prospectus.
Overview
We are an independent natural gas and oil company focused on the exploitation, development, and acquisition of natural gas, NGL and oil properties with a majority of our activity in the Terryville Complex of North Louisiana, where we are targeting overpressured, liquids-rich natural gas opportunities in multiple zones in the Cotton Valley formation. Our total leasehold position is 347,458 gross (205,818 net) acres, of which 60,041 gross (51,522 net) acres are in what we believe to be the core of the Terryville Complex. We are focused on creating shareholder value primarily through the development of our sizeable horizontal inventory. As of December 31, 2013, we had 1,297 gross (892 net) identified horizontal drilling locations, of which over 1,146 gross (796 net) identified horizontal drilling locations are located in the Terryville Complex. These total net identified horizontal drilling locations represent an inventory of over 26 years based on our expected 2014 drilling program. We believe our inventory to be repeatable and capable of generating high returns based on the extensive production history in the area, the results of our horizontal wells drilled to date, and the consistent reservoir quality across multiple target formations.
As of December 31, 2013, we had estimated proved, probable and possible reserves of approximately 1,126 Bcfe, 800 Bcfe and 1,034 Bcfe, respectively. As of such date, we operated 98% of our proved reserves, 71% of which were natural gas. For the three months ended December 31, 2013, 45% of our pro forma MRD Segment revenues were attributable to natural gas production, 28% to NGLs and 27% to oil. For the year ended December 31, 2013, we generated pro forma MRD Segment Adjusted EBITDA of $173 million and pro forma net income of $ million, and made pro forma total capital expenditures of $204 million, including $70 million
1
Table of Contents
for wells coming online in 2014. Please see “—Summary Historical Consolidated and Combined Pro Forma Financial Data—Adjusted EBITDA” for an explanation of the basis for the pro forma presentation and our use of Adjusted EBITDA to measure the MRD Segment’s profitability.
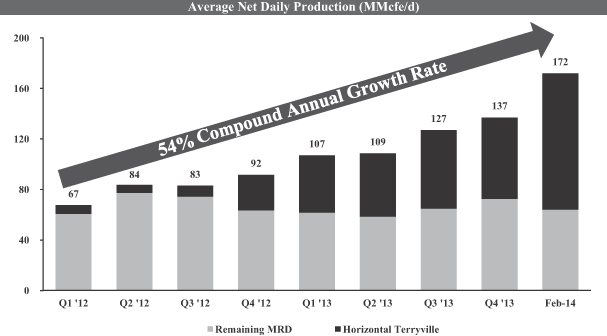
Our average net daily production for the three months ended December 31, 2013 was 137 MMcfe/d (approximately 70% natural gas, 22% NGLs and 8% oil) and our reserve life was 23 years. As of December 31, 2013, we produced from 95 horizontal wells and 800 vertical wells. The Terryville Complex represented 83% of our total net production for the three months ended December 31, 2013. Our estimated average net daily production for the period from February 1 through February 28, 2014 was 172 MMcfe/d, of which 69% was from natural gas. Our estimated average net daily production from our properties in the Terryville Complex for the same period was 150 MMcfe/d, or 87% of our total production. In the Terryville Complex, we completed and brought online two additional horizontal wells during the first quarter of 2014, bringing our total number of producing horizontal wells to 23 in our primary formations. The 30-day initial production rates of our two most recent wells averaged 15.9 MMcfe/d, which compares to an average 30-day initial production rate of 15.1 MMcfe/d for all of our Terryville Complex horizontal wells drilled to date.
The following chart provides information regarding our production growth and the increasing proportion of our horizontal well production since the beginning of 2012.
Our Properties
Cotton Valley—Overview
The Cotton Valley formation extends across East Texas, North Louisiana and Southern Arkansas. The formation has been under development since the 1930s and is characterized by thick, multi-zone natural gas and oil reservoirs with well-known geologic characteristics and long-lived, predictable production profiles. Over 21,000 vertical wells have been completed throughout the play. In 2005, operators started redeveloping the
2
Table of Contents
Cotton Valley using horizontal drilling and advanced hydraulic fracturing techniques. To date, operators have drilled over 600 horizontal Cotton Valley wells. Some large, analogous redevelopment projects in the Cotton Valley include the Nan-Su-Gail Field in Freestone County, East Texas, where over 40 horizontal wells have been drilled by operators such as Devon Energy Corporation and Marathon Oil Corporation, and the Carthage Complex in Panola County, East Texas, where operators such as ExxonMobil Corporation, ConocoPhillips and Anadarko Petroleum Corporation have drilled over 153 horizontal wells.
Cotton Valley—Terryville Complex Horizontal Redevelopment
We are currently engaged in the horizontal redevelopment of the Terryville Complex in Lincoln Parish, Louisiana utilizing horizontal drilling and completion techniques similar to those employed at the Nan-Su-Gail Field, Carthage Complex in East Texas and other major resource plays across the United States. We have assembled a largely contiguous acreage position in the Terryville Complex of approximately 60,041 gross (51,522 net) acres as of December 31, 2013. The majority of our current and planned development is focused in and around what we believe to be the core of the Terryville Complex.
We entered the Terryville Complex via an acquisition from Petrohawk Energy Corporation in April 2010, with the goal of redeveloping the field with horizontal drilling and modern completion techniques. Since that acquisition, we have completed multiple bolt-on acquisitions and in-fill leases to build our current position. We believe the Terryville Complex, which has been producing since 1954, is one of North America’s most prolific natural gas fields, characterized by high recoveries relative to drilling and completion costs, high initial production rates with high liquids yields, long reserve life, multiple stacked producing zones, available infrastructure and a large number of service providers.
After initially drilling eight vertical pilot wells in the Terryville Complex, we commenced a horizontal drilling program in 2011 to further delineate and define our position. In 2013, we shifted our operational focus to full-scale horizontal redevelopment of the Terryville Complex, going from two rigs to four rigs by the end of that year. Additionally, in the fourth quarter of 2013, we moved to drilling on multi-well pads that allow us to more efficiently drill wells and control costs as we develop our stacked pay zones. We intend to dedicate approximately $264 million of our $316 million drilling and completion budget in 2014 to develop multiple zones within the Terryville Complex, where we expect to drill and complete 35 gross (30 net) wells. Our horizontal redevelopment program in the Terryville Complex will be focused on increasing our well performance and recoveries.
Within the Terryville Complex, as of December 31, 2013, we had 945 Bcfe, 688 Bcfe and 966 Bcfe of estimated proved, probable and possible reserves, respectively, and a drilling inventory consisting of 1,146 gross (796 net) identified horizontal drilling locations, including 91 gross (72 net) drilling locations to which we have attributed proved undeveloped reserves as of December 31, 2013. Since initiating our horizontal drilling program in 2011, we have drilled 23 gross (18.4 net) horizontal wells, growing our gross daily production in the Terryville Complex by 294% from 53.0 MMcfe/d for the three months ended March 31, 2010 to 208.6 MMcfe/d for the month ended February 28, 2014. For the three months ended December 31, 2013, 42% of our revenues from the Terryville Complex were attributable to natural gas, 29% to NGLs and 29% to oil. Within the Terryville Complex, on a proved reserves basis, we operate approximately 99% of our existing acreage and hold an average working interest of approximately 74% across our acreage. Our high operating control allows us to more efficiently and economically manage the redevelopment of this extensive resource.
We believe seismic data, as well as information gathered from the results of our existing 275 vertical and 23 horizontal wells throughout the field, support the existence of at least ten stacked pay zones across the Terryville Complex. Our redevelopment program currently targets four of the stacked pay zones in the Cotton Valley formation—zones we term the Upper Red, Lower Red, Lower Deep Pink and Upper Deep Pink, all of which we
3
Table of Contents
are developing with horizontal wells through pad drilling. These four zones have an overall thickness ranging from 400 to 890 feet across our acreage position. We believe the overpressured nature of this section of the Cotton Valley formation is highly productive when accessed through horizontal drilling and fracture stimulation technologies. These qualities, when combined with the liquids-rich nature of the natural gas, high initial rates of production and competitive well costs, produce what we believe to be amongst the highest rate of return wells in the nation.
The table below details certain information on estimated ultimate recoveries and production for the 23 horizontal wells currently producing in the Terryville Complex. Our well results have shown consistency in initial production, decline rates and estimated ultimate recovery. The consistency of these results gives us confidence that the full-scale redevelopment of the Terryville Complex we began in 2013 will be successful as we move from four to five rigs in 2014. Please see “Business—Our Properties—Cotton Valley—Terryville Complex Horizontal Redevelopment” for more detail on our properties in the Terryville Complex and the table on page 92 for more detail on the average EUR and cumulative production of our properties in the Terryville Complex.
| Lateral Length (Feet) |
Producing Wells | First Production |
Days Producing |
Cumulative Production (Bcfe) |
Gross Wellhead Flow Rates After Processing (MMcfe/d) (3)(4) |
D&C ($MM) |
||||||||||||||||||||||||||||||||||||||
| Well Name (1) |
EUR Bcfe(2) |
EUR Bcfe/ 1,000’ |
0-30 | 0-90 | 91-180 | 181-360 | ||||||||||||||||||||||||||||||||||||||
| Upper Red Zone |
||||||||||||||||||||||||||||||||||||||||||||
| LD Barnett 23H-2 |
4,015 | 13.6 | 3.4 | 1/30/12 | 761 | 4.2 | 14.5 | 12.0 | 7.7 | 5.5 | 6.7 | |||||||||||||||||||||||||||||||||
| Colquitt 20 17H-1 |
4,357 | 11.2 | 2.6 | 7/30/12 | 579 | 3.6 | 17.5 | 12.6 | 7.2 | 5.1 | 7.7 | |||||||||||||||||||||||||||||||||
| Dowling 22 15H-1 |
5,376 | 16.8 | 3.1 | 9/22/12 | 525 | 4.8 | 16.3 | 15.6 | 11.1 | 8.2 | 8.8 | |||||||||||||||||||||||||||||||||
| Nobles 13H-1 |
4,216 | 11.6 | 2.8 | 11/17/12 | 469 | 3.9 | 21.5 | 16.7 | 9.9 | 6.5 | 7.8 | |||||||||||||||||||||||||||||||||
| Sidney McCullin 16 21H-1 |
4,604 | 16.9 | 3.7 | 1/19/13 | 406 | 4.1 | 17.4 | 14.2 | 10.8 | 8.2 | 8.1 | |||||||||||||||||||||||||||||||||
| Wright 14 11 HC-1 |
5,250 | 18.0 | 3.4 | 5/27/13 | 278 | 4.0 | 19.6 | 18.1 | 16.1 | 8.8 | ||||||||||||||||||||||||||||||||||
| BF Fallin 22 15H-1 |
5,122 | 15.6 | 3.0 | 6/17/13 | 257 | 2.8 | 14.8 | 13.7 | 11.8 | 7.5 | ||||||||||||||||||||||||||||||||||
| Dowling 20 17H-1 |
4,327 | 8.9 | 2.1 | 7/22/13 | 222 | 1.7 | 15.2 | 11.0 | 5.6 | 10.7 | ||||||||||||||||||||||||||||||||||
| Gleason 31H-1 |
3,692 | 2.5 | 0.7 | 8/12/13 | 201 | 0.4 | 3.5 | 2.7 | 1.8 | 9.4 | ||||||||||||||||||||||||||||||||||
| Burnett 26H-1 |
2,405 | 4.2 | 1.7 | 9/22/13 | 160 | 0.7 | 6.9 | 5.5 | 6.6 | |||||||||||||||||||||||||||||||||||
| Drewett 17 8H-1 |
4,010 | 14.0 | 3.5 | 11/13/13 | 108 | 1.9 | 22.1 | 18.7 | 7.7 | |||||||||||||||||||||||||||||||||||
| Wright 13 12 HC-2 |
6,009 | 18.1 | 3.0 | 12/21/13 | 70 | 1.5 | 24.0 | 7.9 | ||||||||||||||||||||||||||||||||||||
| LA Minerals 15 22H-2 |
5,814 | N/A | N/A | 1/21/14 | 39 | 0.7 | 18.0 | 8.4 | ||||||||||||||||||||||||||||||||||||
| Lower Red Zone |
||||||||||||||||||||||||||||||||||||||||||||
| TL McCrary 14H-1 |
4,544 | 12.8 | 2.8 | 5/1/12 | 669 | 3.9 | 14.4 | 11.7 | 8.3 | 5.4 | 7.7 | |||||||||||||||||||||||||||||||||
| Nobles 13H-2 |
4,060 | 9.2 | 2.3 | 11/17/12 | 469 | 2.9 | 16.0 | 11.9 | 8.4 | 5.2 | 7.8 | |||||||||||||||||||||||||||||||||
| LA Methodist Orphanage 14H-1 |
3,637 | 12.1 | 3.3 | 2/15/13 | 379 | 3.3 | 14.0 | 13.0 | 9.7 | 6.3 | 9.1 | |||||||||||||||||||||||||||||||||
| Dowling 21 16H-1 |
4,590 | 9.4 | 2.0 | 3/18/13 | 348 | 2.3 | 13.0 | 10.1 | 6.5 | 6.6 | ||||||||||||||||||||||||||||||||||
| Drewett 17 8H-2 |
3,700 | 3.7 | 1.0 | 11/13/13 | 108 | 0.6 | 8.7 | 6.2 | 6.8 | |||||||||||||||||||||||||||||||||||
| Wright 13 12 HC-1 |
5,409 | 8.2 | 1.5 | 12/21/13 | 70 | 0.9 | 15.6 | 9.0 | ||||||||||||||||||||||||||||||||||||
| LA Minerals 15 22H-1 |
5,926 | N/A | N/A | 1/21/14 | 39 | 0.5 | 13.8 | 7.9 | ||||||||||||||||||||||||||||||||||||
| Lower Deep Pink Zone |
||||||||||||||||||||||||||||||||||||||||||||
| LA Methodist Orphanage 14H-2 |
3,550 | 12.2 | 3.4 | 2/15/13 | 379 | 2.8 | 14.3 | 11.6 | 7.6 | 5.7 | 6.1 | |||||||||||||||||||||||||||||||||
| Wright 13 12 HC-3 |
5,706 | 6.3 | 1.1 | 12/21/13 | 70 | 0.8 | 13.2 | 7.1 | ||||||||||||||||||||||||||||||||||||
| Wright 13 12 HC-4 |
5,010 | 5.0 | 1.0 | 12/21/13 | 70 | 0.7 | 12.6 | 6.0 | ||||||||||||||||||||||||||||||||||||
| Averages |
||||||||||||||||||||||||||||||||||||||||||||
| All Wells |
4,580 | 11.0 | 2.5 | 290 | 2.3 | 15.1 | 12.1 | 8.8 | 6.2 | 7.8 | ||||||||||||||||||||||||||||||||||
| Upper Red |
4,554 | 12.6 | 2.7 | 313 | 2.6 | 16.3 | 12.8 | 9.1 | 6.7 | 8.2 | ||||||||||||||||||||||||||||||||||
| Lower Red |
4,552 | 9.2 | 2.2 | 297 | 2.1 | 13.6 | 10.6 | 8.2 | 5.6 | 7.8 | ||||||||||||||||||||||||||||||||||
| Lower Deep Pink |
4,755 | 7.8 | 1.8 | 173 | 1.4 | 13.4 | 11.6 | 7.6 | 5.7 | 6.4 | ||||||||||||||||||||||||||||||||||
| (1) | The wells in this table are included within our proved developed producing reserve category in our reserve report as of December 31, 2013. LA Minerals 15 22H-1 and LA Minerals 15 22H-2 both started producing in January 2014 so they have not been included in the year-end reserve report. |
| (2) | EUR represents the Estimated Ultimate Recovery or sum of total gross remaining reserves attributable to each location in our reserve report and cumulative sales from such location. EUR is shown on a combined basis for oil/condensates, gas and NGLs after the effects of processing. |
4
Table of Contents
| (3) | Production data is as of February 28, 2014 and shown gross on a combined basis after the effects of processing. |
| (4) | Periodic flow rates start on day 4, with days 1 through 3 used to allow clean up associated with well completion. The 30-day flow rates therefore start on day 4 and continue 30 days to day 33 and the 90-day flow rates go from day 4 to day 93. |
East Texas
We own and operate approximately 24,458 gross (19,776 net) acres as of December 31, 2013 in Panola and Shelby Counties in Texas, where we are currently producing primarily from the Cotton Valley, Travis Peak and Bossier formations and targeting the Cotton Valley formation for future development. From January 1, 2011 through December 31, 2013, we have drilled and completed 28 gross (10.3 net) wells and are operating one rig in East Texas as of December 31, 2013. In 2014, we plan to invest $36 million to drill and complete 8 gross (6 net) wells in East Texas in the Joaquin Field of Panola and Shelby Counties. As of December 31, 2013, we had approximately 108 gross identified horizontal drilling locations in East Texas, including 54 gross (43 net) drilling locations to which we have attributed proved undeveloped reserves as of December 31, 2013. For the three months ended December 31, 2013, our average net daily production from our East Texas properties was 21 MMcfe/d, of which 76% was natural gas. Within our East Texas properties, on a proved reserves basis, we operate approximately 94% of our existing properties.
Rockies & Other
We own approximately 162,375 gross (66,191 net) acres as of December 31, 2013 in our Rockies & Other region and for the three months ended December 31, 2013 our average net daily production from this region was 1 MMcfe/d. In 2014, we plan to operate one rig and invest $12 million to drill 3 gross (3 net) vertical wells in the Tepee Field of the Piceance Basin targeting the Mancos and Williams Fork formations. We also plan to invest $4 million to participate in 12 gross horizontal wells (1.1 net) operated by SandRidge Energy Inc. in the Mississippian oil play of Northern Oklahoma. As of December 31, 2013, we had approximately 174 gross identified vertical drilling locations in the Tepee Field in our Rockies & Other area.
5
Table of Contents
Reserves
Our estimates of proved reserves are prepared by NSAI, and our estimates of probable and possible reserves are prepared by our management and audited by NSAI. As of December 31, 2013, we had 1,126 Bcfe, 800 Bcfe and 1,034 Bcfe of estimated proved, probable and possible reserves, respectively. As of this date, our proved reserves were 71% gas and 29% NGLs and oil. Additionally, the PV-10 of our proved reserves was $1,469 million, the PV-10 for our probable reserves was $1,052 million and the PV-10 for our possible reserves was $1,342 million. The following table provides summary information regarding our estimated proved, probable and possible reserves data by area based on our reserve report and our average net daily production by area for the three months ended December 31, 2013:
| Proved Total (Bcfe) |
% Gas | % Developed |
Proved PV-10 (in millions)(1) |
Probable Total (Bcfe)(2) |
Probable PV-10 (in millions)(1) |
Possible Total (Bcfe)(2) |
Possible PV-10 (in millions)(1) |
Average Net Daily Production (MMcfe/d) |
||||||||||||||||||||||||||||
| Terryville Complex |
945 | 71 | % | 33 | % | $ | 1,341 | 688 | $ | 1,032 | 966 | $ | 1,339 | 115 | ||||||||||||||||||||||
| East Texas |
175 | 75 | % | 29 | % | 110 | 109 | 18 | 66 | 3 | 21 | |||||||||||||||||||||||||
| Rockies & Other |
6 | 49 | % | 100 | % | 18 | 2 | 2 | 2 | 1 | 1 | |||||||||||||||||||||||||
|
|
|
|
|
|
|
|
|
|
|
|
|
|
|
|
|
|
|
|||||||||||||||||||
| Total |
1,126 | 71 | % | 33 | % | $ | 1,469 | 800 | $ | 1,052 | 1,034 | $ | 1,342 | 137 | ||||||||||||||||||||||
|
|
|
|
|
|
|
|
|
|
|
|
|
|
|
|||||||||||||||||||||||
| (1) | In this prospectus, we have disclosed our PV-10 based on our reserve report. PV-10 is a non-GAAP financial measure and represents the period-end present value of estimated future cash inflows from our natural gas and crude oil reserves, less future development and production costs, discounted at 10% per annum to reflect timing of future cash flows and using SEC pricing assumptions in effect at the end of the period. SEC pricing for natural gas and oil of $3.67 per Mcf and $93.42 per Bbl was based on the unweighted average of the first-day-of-the-month prices for each of the twelve months preceding December 2013. PV-10 differs from standardized measure, the most directly comparable GAAP financial measure, because it does not include the effects of income taxes. Moreover, GAAP does not provide a measure of estimated future net cash flows for reserves other than proved reserves. Because PV-10 estimates of probable and possible reserves are more uncertain than PV-10 and standardized estimates of proved reserves, but have not been adjusted for risk due to that uncertainty, they may not be comparable with each other. Nonetheless, we believe that PV-10 estimates for reserve categories other than proved present useful information for investors about the future net cash flows of our reserves in the absence of a comparable GAAP measure such as standardized measure. Because of this, PV-10 can be used within the industry and by creditors and securities analysts to evaluate estimated net cash flows from proved reserves on a more comparable basis. In addition, investors should be cautioned that estimates of PV-10 for probable and possible reserves, as well as the underlying volumetric estimates, are inherently more uncertain of being recovered and realized than comparable measures for proved reserves, and that the uncertainty for possible reserves is even more significant. Our PV-10 estimates of proved reserves and our standardized measure are equivalent because, prior to the completion of this offering, we were not subject to entity level taxation. Accordingly, no provision for federal income taxes has been provided because taxable income has been passed through to our equity holders. After this offering, we will be treated as a taxable entity for federal income tax purposes and our future income taxes will be dependent upon our future taxable income. Neither PV-10 nor standardized measure represents an estimate of fair market value of our natural gas and oil properties. We and others in the industry use PV-10 as a measure to compare the relative size and value of estimated reserves held by companies without regard to the specific tax characteristics of such entities. |
| (2) | Substantially all of our estimated probable and possible reserves are classified as undeveloped. |
6
Table of Contents
Drilling Inventory and Capital Budget
We intend to develop our multi-year drilling inventory by utilizing our significant expertise in horizontal drilling and fracture stimulation to grow our production, reserves and cash flow. For 2014, we have budgeted a total of $316 million to drill and complete 49 gross (39 net) operated wells and to participate in 12 gross (1.1 net) non-operated wells. We expect to fund our 2014 development primarily from cash flows from operations. The majority of our drilling locations and our 2014 development program are focused on the Terryville Complex, where we plan to invest $264 million on drilling and completing 33 gross (28 net) horizontal wells and 2 gross (2 net) vertical wells. Approximately $5.0 million of our Terryville Complex budget is allocated towards the drilling of vertical wells and routine facilities maintenance. In East Texas, we plan to invest $36 million on drilling and completing 8 gross (6 net) horizontal wells. In our Rockies & Other area we plan to invest $12 million on drilling and completing 3 gross (3 net) vertical wells in the Tepee Field and $4 million to participate in 12 gross (1.1 net) horizontal wells operated by SandRidge Energy Inc. in the Mississippian oil play of Northern Oklahoma.
The following table provides information regarding our acreage and drilling locations by area as of December 31, 2013, except for projected 2014 information:
| Net Acreage |
WI% | Gross Horizontal Drilling Locations(1)(2) | Net Horizontal Drilling Inventory (years) |
2014 Projected Operated Net Wells to be Drilled(3) |
2014 Projected Capital Budget ($MM) |
|||||||||||||||||||||||||||||||||||||||
|
|
|
|
|
Total | ||||||||||||||||||||||||||||||||||||||||
| Proved | Probable | Possible | Management | Gross | Net | |||||||||||||||||||||||||||||||||||||||
| Terryville Complex |
96,733 | 74 | % | 91 | 147 | 165 | 743 | 1,146 | 796 | 28 | 30 | $ | 264 | |||||||||||||||||||||||||||||||
| East Texas |
42,894 | 79 | % | 54 | 39 | 15 | — | 108 | 92 | 15 | 6 | 36 | ||||||||||||||||||||||||||||||||
| Rockies & Other |
66,191 | 41 | % | — | 23 | 20 | — | 43 | 4 | — | 3 | 16 | ||||||||||||||||||||||||||||||||
|
|
|
|
|
|
|
|
|
|
|
|
|
|
|
|
|
|
|
|
|
|
|
|||||||||||||||||||||||
| Total |
205,818 | 59 | % | 145 | 209 | 200 | 743 | 1,297 | 892 | 26 | 39 | $ | 316 | |||||||||||||||||||||||||||||||
| (1) | The above table excludes 192 proved vertical drilling locations in our reserve report in the Terryville Complex and 174 identified vertical locations based on management estimates in the Rockies & Other region. |
| (2) | Please see “Business—Our Operations—Drilling Locations” for more information regarding the process and criteria through which these drilling locations were identified. The drilling locations on which we actually drill will depend on the availability of capital, regulatory approval, commodity prices, costs, actual drilling results and other factors. Please see “Risk Factors—Risks Related to Our Business—Our identified drilling locations, which are scheduled out over many years, are susceptible to uncertainties that could materially alter the occurrence or timing of their drilling.” Proved, probable and possible locations are based on our reserve report. Management locations are based on management estimates of additional identified drilling locations. |
| (3) | Represents net operated wells only. Excludes 12 gross (1.1 net) non-operated wells to be drilled in our Rockies & Other area in 2014. |
7
Table of Contents
Our extensive inventory and horizontal drilling program in the Terryville Complex is currently focused on four zones within the Cotton Valley formation—the Upper Red, Lower Red, Lower Deep Pink and Upper Deep Pink. The table below sets forth our drilling locations by zone as of December 31, 2013 along with the average results for the wells we have drilled within each zone. Please see “Business—Our Properties—Cotton Valley—Terryville Complex Horizontal Redevelopment” for more detail on our properties in the Terryville Complex and the table on page 92 for the 30 day initial production rate and EUR condensate volumes.
| Average Historical Results(2) | ||||||||||||||||||||||||||||||||
| Lower Cotton Valley Zone |
Gross Horizontal Drilling Locations(1) | Producing Wells Drilled(1) |
EUR (Bcfe)(3) |
Drilling and Completion Costs ($MM) |
||||||||||||||||||||||||||||
| Proved | Probable | Possible | Management | Total | ||||||||||||||||||||||||||||
| Upper Red |
47 | 42 | 40 | 313 | 442 | 13 | 12.6 | $ | 8.2 | |||||||||||||||||||||||
| Lower Red |
40 | 40 | 36 | 276 | 392 | 7 | 9.2 | $ | 7.8 | |||||||||||||||||||||||
| Lower Deep Pink |
4 | 28 | 47 | 79 | 158 | 3 | 7.8 | $ | 6.4 | |||||||||||||||||||||||
| Upper Deep Pink |
— | 37 | 42 | 75 | 154 | — | — | — | ||||||||||||||||||||||||
|
|
|
|
|
|
|
|
|
|
|
|
|
|
|
|
|
|||||||||||||||||
| Total Terryville Complex |
91 | 147 | 165 | |
743 |
|
1,146 | 23 | 11.0 | $ | 7.8 | |||||||||||||||||||||
| (1) | Please see “Business—Our Operations—Drilling Locations” for more information regarding the process and criteria through which these drilling locations were identified. The drilling locations on which we actually drill will depend on the availability of capital, regulatory approval, commodity prices, costs, actual drilling results and other factors. Please see “Risk Factors—Risks Related to Our Business—Our identified drilling locations, which are scheduled out over many years, are susceptible to uncertainties that could materially alter the occurrence or timing of their drilling.” Proved, probable and possible locations are based on our reserve report. Management locations are based on management estimates of additional identified drilling locations. |
| (2) | Relates to the 21 horizontal wells in the Terryville Complex included in our reserve report as proved developed reserves as of December 31, 2013. Drilling and completion costs include costs associated with two additional wells that have come online since year-end. |
| (3) | EUR represents the Estimated Ultimate Recovery or the sum of total gross remaining reserves attributable to each location in our reserve report and cumulative sales from such location. EUR is shown at the wellhead on a combined basis for oil/condensates and wet gas. |
Our Terryville horizontal development program in 2014 has an average working interest of 87% and our total horizontal development inventory has an average working interest of 69%.
For the Terryville Complex, our 2014 budget assumes an average cost of $8.6 million for gross horizontal wells ($7.5 million per net well) and is based on an average lateral length of 6,270 feet. As part of our long-term development plan, the lateral length of our planned wells is expected to increase and we expect wells within the Terryville Complex to cost on average $9.3 million for gross wells ($8.1 million per net well) drilled with a 7,000 foot lateral length.
8
Table of Contents
Business Strategies
Our primary objective is to build shareholder value through growth in reserves, production and cash flows by developing and expanding our significant portfolio of drilling locations. To achieve our objective, we intend to execute the following business strategies:
Grow production, reserves and cash flow through the development of our extensive drilling inventory. We believe our extensive inventory of low-risk drilling locations, combined with our operating expertise, will enable us to continue to deliver production, reserve and cash flow growth and create shareholder value. As of December 31, 2013, we had assembled an aggregate drilling inventory of 1,297 gross identified horizontal drilling locations, 88% of which are in the Terryville Complex, representing a drilling inventory of over 28 years based on our expected 2014 drilling program. We believe that the risk and uncertainty associated with our core acreage positions in the Terryville Complex has been largely reduced through our development activity, and because those positions are in areas with extensive drilling and production history. Since initiating our horizontal drilling program with one rig in 2011, we have invested over $288 million in the Terryville Complex through December 31, 2013. With four rigs running in the Terryville Complex as of December 31, 2013, we are one of the most active drillers in the Cotton Valley formation. We intend to dedicate approximately $264 million of our $316 million drilling and completion budget in 2014 to develop the overpressured liquids-rich Terryville Complex through multi-well pad drilling. We believe multiple vertically stacked producing horizons in the Terryville Complex can be developed using horizontal drilling techniques, thus enhancing the economics of this field.
Enhance returns through prudent capital allocation and continued improvements in operational and capital efficiencies. We continually monitor and adjust our drilling program with the objective of achieving the highest total returns on our portfolio of drilling opportunities. We believe we will achieve this objective by (i) minimizing the capital costs of drilling and completing horizontal wells through knowledge of the target formations, (ii) maximizing well production and recoveries by optimizing lateral length, the number of frac stages, perforation intervals and the type of fracture stimulation employed, (iii) targeting specific zones within our leasehold position to maximize our hydrocarbon mix based on the existing commodity price environment and (iv) minimizing operating costs through efficient well management.
Exploit additional development opportunities on current acreage. Our existing asset base provides numerous opportunities for our highly experienced technical team to create shareholder value by increasing our inventory beyond our currently identified drilling locations and ultimately by growing our estimated proved reserves. In the Terryville Complex, we are currently targeting multiple stacked horizons. We also believe our East Texas region has a significant inventory of low-risk, liquids-rich horizontal drilling locations. Finally, we continue to evaluate our leasehold positions in the Rocky Mountains and have preliminarily evaluated over 170 potential vertical locations.
Maintain a disciplined, growth oriented financial strategy. We intend to fund our growth primarily with internally generated cash flows while maintaining ample liquidity and access to the capital markets. Furthermore, we plan to hedge a significant portion of our expected production to reduce our exposure to downside commodity price fluctuations and enable us to protect our cash flows and maintain liquidity to fund our drilling program. Since approximately 76% of our acreage in the Terryville Complex was held by production as of December 31, 2013 and no significant drilling commitments are needed to hold our remaining acreage in the near term, we are able to allocate capital among projects in a manner that optimizes both costs and returns, resulting in a highly efficient drilling program.
Make opportunistic acquisitions that meet our strategic and financial objectives. We will seek to acquire oil and gas properties that we believe complement our existing properties in our core areas of operation. In
9
Table of Contents
addition to our focus on the Terryville Complex, we are pursuing other properties that provide opportunities for the addition of reserves and production through a combination of exploitation, development, high-potential exploration and control of operations. We follow a technology driven strategy to establish large, contiguous leasehold positions in the core of prolific basins and opportunistically add to those positions through bolt-on acquisitions over time. We entered into the Terryville Complex through strategic acquisitions and grassroots leasing efforts, amassing a land position of 96,733 net acres, 51,522 net acres of which we believe to be in the core of the play. We will continue to identify and opportunistically acquire additional acreage and producing assets to complement our multi-year drilling inventory.
Competitive Strengths
We believe that the following strengths will allow us to successfully execute our business strategies.
Large, concentrated position in one of North America’s leading plays. We own approximately 60,041 gross (51,522 net) acres in what we believe to be the core of the Terryville Complex in Lincoln Parish, which we believe to be one of North America’s most prolific liquids-rich natural gas fields, characterized by consistent and predictable geology and multiple stacked pay formations confirmed by extensive vertical well control. Through December 31, 2013, our drilling program in the Terryville Complex has produced some of the top performing gas wells in the United States in the previous two years, with single horizontal well results having achieved average 30-day initial production rates of 15.1 MMcfe/d, EURs averaging 11.0 Bcfe and average drilling and completion costs of $7.8 million per well. Approximately 76% of our acreage in the Terryville Complex was held by production at December 31, 2013 and there are no significant lease expirations until 2017. Additionally, all of our acreage in this play can be held by running a one rig program over the next 18 months.
De-risked acreage position with multi-year inventory of liquids-rich drilling opportunities. As of December 31, 2013, we had a drilling inventory consisting of 1,297 gross identified horizontal drilling locations, of which approximately 145 are gross proved undeveloped locations. Based on our expected 2014 drilling program and net identified drilling locations, we have over 26 years of liquids-rich drilling inventory. The majority of our drilling activity has been and will continue to be focused in the Terryville Complex, where we produce liquids-rich natural gas from the overpressured Cotton Valley formation. We have used subsurface data from our vertical wells coupled with 3-D seismic data to identify and prioritize our inventory based on returns. This liquids-rich gas formation allows for NGL processing that, when coupled with the condensate produced, results in strong well economics. For the three months ended December 31, 2013, 45% of our pro forma MRD Segment revenues were attributable to natural gas, 28% to NGLs and 27% to oil.
Significant operational control with low cost operations. On a proved reserves basis, we operate 99% of our properties and have operational control of all of our drilling inventory in the Terryville Complex. We believe maintaining operational control will enable us to enhance returns by implementing more efficient and cost-effective operating practices, through the selection of economic drilling locations, opportunistic timing of development, continuous improvement of drilling, completion and stimulation techniques and development on multi-well pads. As a result of the contiguous nature of our leasehold in the Terryville Complex and its geologic continuity, we are able to drill consistently long laterals, averaging over 4,200 lateral feet, which helps us to reduce costs on a per-lateral foot basis and increase our returns. We expect the average lateral length of the 35 gross wells that we expect to drill in the Terryville Complex in 2014 to be 6,400 feet per well. Operating in mature basins in North Louisiana and East Texas allows us to take advantage of the available and extensive midstream infrastructure and accelerate our development plan without encountering significant constraints in either takeaway or processing capacity. Our operational control allows us to focus on operating efficiency, which has resulted in our MRD Segment lease operating costs declining 31% from $0.77 per Mcfe for the year ended December 31, 2012 to $0.53 per Mcfe for the year ended December 31, 2013.
10
Table of Contents
Proven and incentivized executive and technical team. We believe our management and technical teams are one of our principal competitive strengths due to our team’s significant industry experience and long history of working together in the identification, execution and integration of acquisitions, cost efficient management of profitable, large scale drilling programs and a focus on rates of return. Additionally, our technical team has substantial expertise in advanced drilling and completion technologies and decades of expertise in operating in the North Louisiana and East Texas regions. The members of our management team collectively have an average of 22 years of experience in the oil and natural gas industry. John A. Weinzierl, our Chief Executive Officer, has 24 years of oil and natural gas industry experience as a petroleum engineer, a strong commercial and technical background and extensive experience acquiring and managing oil and natural gas properties. Our management team has a significant economic interest in us directly and through its equity interests in our controlling stockholder, MRD LLC. We believe our management team is motivated to deliver high returns, create shareholder value and maintain safe and reliable operations.
Our relationship with MEMP. We currently own 5,360,912 subordinated units representing a 8.7% limited partner interest in MEMP and a 0.1% general partner interest in MEMP through our ownership of its general partner. We also own 50% of MEMP’s incentive distribution rights. MEMP’s objective as a master limited partnership is to generate stable cash flows, allowing it to make quarterly distributions to its limited partners and, over time, to increase those quarterly distributions. As a result of its familiarity with our management team and our asset base and our track record of prior “drop-down” transactions, we believe that MEMP is a natural purchaser of properties from us that meet its acquisition criteria. We believe this mutually beneficial relationship enhances MEMP’s ability to generate consistent returns on its oil and natural gas properties, provides us with a growing source of cash flow from our partnership interests in MEMP and allows us to monetize producing non-core properties. Since MEMP’s initial public offering, we have consummated “drop-down” transactions with MEMP totaling approximately $376 million. In addition, we may have the opportunity to work jointly with MEMP to pursue certain acquisitions of oil and natural gas properties that may not otherwise be attractive acquisition candidates for either of us individually. While we believe that MEMP would be a preferred acquirer of our mature, non-core assets, we are under no obligation to offer to sell, and it is under no obligation to offer to buy, any of our properties.
Financial strength and flexibility. During 2013, we generated $173 million of pro forma MRD Segment Adjusted EBITDA and made pro forma total capital expenditures of $204 million, including $70 million on wells coming online in 2014. We intend to continue to fund our organic growth predominantly with internally generated cash flows while maintaining ample liquidity for opportunistic acquisitions. We will continue to maintain a disciplined approach to spending whereby we allocate capital in order to optimize returns and create shareholder value. We seek to protect these future cash flows and liquidity levels by maintaining a three-to-five year rolling hedge program. Pro forma as of December 31, 2013 for this offering and the restructuring transactions (including the redemption of the PIK notes for approximately $363 million 30 days after the closing of this offering), we expect our total liquidity, consisting of cash on hand and available borrowing capacity under our new revolving credit facility, to be in excess of $ million.
Recent Developments
In December 2013, MRD LLC issued $350,000,000 of its 10.00%/10.75% Senior PIK toggle notes due 2018, which we refer to as the PIK notes. MRD LLC used the net proceeds from that issuance to repay outstanding indebtedness, to fund a debt service reserve account for the payment of interest on the PIK notes, to pay a distribution to the Funds, and for general company purposes. In connection with the closing of this offering, we will assume the PIK notes and use a portion of the proceeds of this offering to redeem the PIK notes in their entirety, to pay any applicable premium in connection with such redemption and to pay accrued and unpaid interest, if any, to the date of redemption. MRD LLC will receive the cash released upon the termination of the debt service reserve account in connection with the redemption of the PIK notes.
11
Table of Contents
In April 2014, we sold approximately 15 Bcfe of proved reserves located in East Texas to MEMP for cash consideration of approximately $34.0 million, subject to customary post-closing adjustments.
In connection with the closing of this offering, we intend to enter into a new $ million revolving credit facility. Immediately prior to the closing of this offering, we will borrow approximately $ million from our new revolving credit facility to pay off and terminate in their entirety WildHorse Resources’ revolving credit facility and second lien term loan, which we refer to collectively as WildHorse Resources’ credit agreements.
Acquisition History
We built out our leasehold positions in North Louisiana, East Texas and the Rocky Mountains primarily through the following acquisition activities:
| • | In November 2007, we acquired interests in the Joaquin Field, which is the core of our East Texas acreage; |
| • | In December 2007, we acquired interests in the Tepee Field in the Piceance Basin in Colorado; |
| • | In April and May 2010, we acquired interests in the Terryville Complex and other North Louisiana fields, which are the core of our North Louisiana acreage; |
| • | In November 2010, we acquired interests in the Spider and E. Logansport Fields in North Louisiana; |
| • | In May 2012, we acquired interests in the Terryville Complex and Double A Field in North Louisiana and East Texas; |
| • | In April 2013, we acquired interests in the West Simsboro and Simsboro Fields of the Terryville Complex in North Louisiana; |
| • | In November 2013, we acquired the remaining equity interests in Classic Hydrocarbons Holdings, L.P., Classic Hydrocarbons GP Co., L.L.C. and Black Diamond Minerals, LLC, which hold oil and natural gas properties in East Texas, North Louisiana and the Rocky Mountains; and |
| • | In February 2014, we repurchased net profits interests in the Terryville Complex from an affiliate of NGP for $63.4 million after customary adjustments. These net profits interests were originally sold to the NGP affiliate upon the completion of certain acquisitions in 2010 by WildHorse Resources. |
Our Principal Stockholder
Our principal stockholder is MRD LLC, which is controlled by the Funds, which are three of the private equity funds managed by NGP. Upon completion of this initial public offering, MRD LLC, the selling stockholder in this offering, will own approximately % of our common stock (or approximately % if the underwriters’ option to purchase additional shares from MRD LLC is exercised in full). The Funds also collectively indirectly own 50% of MEMP’s incentive distribution rights. We are also a party to certain other agreements with MRD LLC, the Funds and certain of their affiliates. For a description of these agreements, please read “Certain Relationships and Related Party Transactions.”
Founded in 1988, NGP is a family of private equity investment funds, with cumulative committed capital of approximately $10.5 billion since inception, organized to make investments in the natural resources sector. NGP is part of the investment platform of NGP Energy Capital Management, a premier investment franchise in the natural resources industry, which together with its affiliates has managed approximately $13 billion in cumulative committed capital since inception.
12
Table of Contents
Our Interest in Memorial Production Partners LP
Through our ownership of its general partner, we control MEMP. We also own 5,360,912 subordinated units representing an 8.7% limited partner interest in MEMP and 50% of its incentive distribution rights. MEMP is a publicly traded limited partnership engaged in the acquisition, exploitation, development and production of oil and natural gas properties in the United States, with assets consisting primarily of producing oil and natural gas properties that are located in East Texas/North Louisiana, the Permian Basin, offshore Southern California, the Rockies, the Eagle Ford and South Texas. Most of MEMP’s properties are located in large, mature oil and natural gas reservoirs with well-known geologic characteristics and long-lived, predictable production profiles and modest capital requirements. Because we control MEMP, we are required to consolidate MEMP for accounting and financial reporting purposes, even though we and MEMP have independent capital structures.
During the year ended December 31, 2013, we received approximately $11.2 million in cash distributions from our ownership of the subordinated units in MEMP. Less than $0.1 million of distributions were made in respect of the MEMP incentive distribution rights during the year ended December 31, 2013. Please see “Business—Relationship with Memorial Production Partners LP” for further information on our interest in MEMP.
Risk Factors
Investing in our common stock involves risks that include the speculative nature of oil and natural gas exploration, competition, volatile commodity prices and other material factors. For a discussion of these risks and other considerations that could negatively affect us, including risks related to this offering and our common stock, please read “Risk Factors” beginning on page 24 of this prospectus and “Cautionary Note Regarding Forward-Looking Statements.”
Our Structure and Restructuring Transactions
We are a Delaware corporation formed by MRD LLC to own and acquire oil and natural gas properties. In connection with the closing of this offering, the following transactions, which we refer to as the restructuring transactions, will occur:
| • | MRD LLC will contribute to us substantially all of its assets, comprised of: |
| • | 100% of the ownership interests in Classic Hydrocarbons Holdings, L.P., Classic Hydrocarbons GP Co., L.L.C., Black Diamond Minerals, LLC, Beta Operating Company, LLC and MRD Operating LLC; |
| • | 99.9% of the membership interests in WildHorse Resources, the owner of our properties in the Terryville Complex; and |
| • | MEMP GP (including MEMP GP’s ownership of 50% of MEMP’s incentive distribution rights) and 5,360,912 subordinated units representing an 8.7% limited partner interest in MEMP; |
| • | We will issue shares of our common stock to MRD LLC; |
| • | Certain former management members of WildHorse Resources will contribute to us their outstanding incentive units in WildHorse Resources, as well as the remaining 0.1% of the membership interests in WildHorse Resources, and we will issue shares of our common stock and pay cash consideration of $ to such former management members of WildHorse Resources; and |
| • | We will enter into a registration rights agreement and a voting agreement with MRD LLC and certain former management members of WildHorse Resources, and a services agreement with an entity managed by certain former management members of WildHorse Resources. |
13
Table of Contents
In connection with the restructuring transactions, MRD LLC will retain:
| • | BlueStone, which sold substantially all of its assets in July 2013 for $117.9 million; MRD Royalty, which owns certain immaterial leasehold interests and overriding royalty interests in Texas and Montana; and MRD Midstream, which owns an indirect interest in certain immaterial midstream assets in North Louisiana; and |
| • | The $32 million in cash (net of $18 million to be used to pay accrued interest on the PIK notes on June 15, 2014) to be released from its debt service reserve account in connection with the redemption of the PIK notes (which we expect will be 30 days after the closing of this offering). |
Contemporaneous with the restructuring transactions, we will assume the PIK notes and use a portion of the net proceeds from this offering to redeem all outstanding PIK notes, including paying any applicable premium and accrued and unpaid interest, if any, to the date of redemption (which we expect will be 30 days after the closing of this offering). We will use any remaining proceeds, together with borrowings under our new revolving credit facility, to repay and terminate WildHorse Resources’ credit agreements. Please read “Use of Proceeds” and “Restructuring Transactions” for more information about the application of the net proceeds from this offering and the restructuring transactions. For more information regarding BlueStone, see “Management’s Discussion and Analysis of Financial Condition and Results of Operations—Results of Operations—MRD Segment.”
14
Table of Contents
The following diagram shows our ownership structure after giving effect to the restructuring transactions and this offering, assuming no exercise of the underwriters’ option to purchase additional shares from MRD LLC and does not give effect to shares of common stock reserved for future issuance under the Memorial Resource Development Corp. 2014 Incentive Award Plan (described in “Management—2014 Incentive Award Plan”). For information regarding our ownership structure before giving effect to the restructuring transactions and this offering, see the diagram on page 138 in “Restructuring Transactions.”
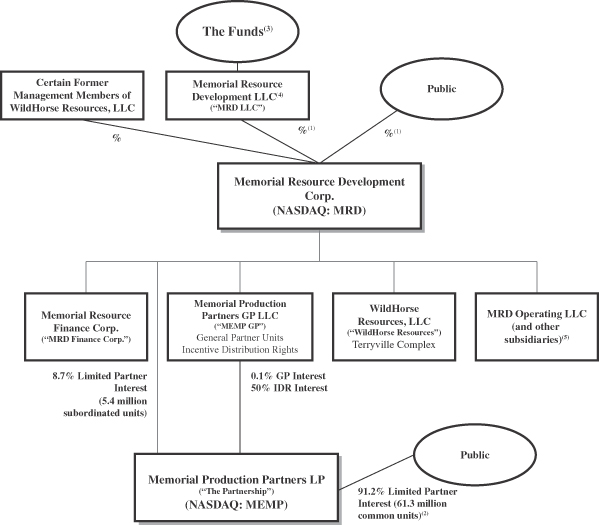
| (1) | If the underwriters exercise in full their option to purchase additional shares of common stock from MRD LLC, the ownership interest of the public stockholders will increase to shares of common stock, representing an aggregate % ownership interest in us, and MRD LLC will own shares of common stock, representing an aggregate % ownership interest in us. |
| (2) | As of December 31, 2013. |
| (3) | “The Funds” refer collectively to Natural Gas Partners VIII, L.P., Natural Gas Partners IX, L.P. and NGP IX Offshore Holdings, L.P., which collectively own all of the membership interests in MRD LLC. Please read “Principal and Selling Stockholders” for information regarding beneficial ownership. The Funds collectively indirectly own 50% of the Partnership’s incentive distribution rights. |
| (4) | Subsidiaries of MRD LLC following the restructuring transactions will include BlueStone Natural Resources Holdings, LLC (“BlueStone”), MRD Royalty LLC (“MRD Royalty”) and MRD Midstream LLC (“MRD Midstream”). Also, please see the “Principal and Selling Stockholders” table on page 130 for the beneficial ownership of our shares by our executive officers and directors. |
| (5) | Includes Classic Hydrocarbons Holdings, L.P. (“Classic”), Classic Hydrocarbons GP Co., L.L.C. (“Classic GP”), Black Diamond Minerals, LLC (“Black Diamond”), and Beta Operating Company, LLC (“Beta Operating”). |
15
Table of Contents
Corporate Information
Our principal executive offices are located at 1301 McKinney St., Suite 2100, Houston, Texas 77010, and our phone number is (713) 588-8300. Our website address is www.memorialrd.com. We expect to make our periodic reports and other information filed with or furnished to the Securities and Exchange Commission, which we refer to as the SEC, available free of charge through our website as soon as reasonably practicable after those reports and other information are electronically filed with or furnished to the SEC. Information on our website or any other website is not incorporated by reference into, and does not constitute a part of, this prospectus.
Emerging Growth Company Status
We are an “emerging growth company” as defined in the Jumpstart Our Business Startups Act (the “JOBS Act”). For as long as we are an emerging growth company, unlike other public companies that are not emerging growth companies, we are not required to:
| • | provide an auditor’s attestation report on management’s assessment of the effectiveness of our system of internal control over financial reporting pursuant to Section 404 of the Sarbanes-Oxley Act of 2002; |
| • | provide more than two years of audited financial statements and related management’s discussion and analysis of financial condition and results of operations; |
| • | comply with any new requirements adopted by the Public Company Accounting Oversight Board, or the “PCAOB,” requiring mandatory audit firm rotation or a supplement to the auditor’s report in which the auditor would be required to provide additional information about the audit and the financial statements of the issuer; |
| • | provide certain disclosure regarding executive compensation required of larger public companies or hold shareholder advisory votes on executive compensation required by the Dodd-Frank Wall Street Reform and Consumer Protection Act (the “Dodd-Frank Act”); or |
| • | obtain shareholder approval of any golden parachute payments not previously approved. |
We will cease to be an “emerging growth company” upon the earliest of:
| • | the last day of the fiscal year in which we have $1.0 billion or more in annual revenues; |
| • | the date on which we become a “large accelerated filer” (the fiscal year-end on which the total market value of our common equity securities held by non-affiliates is $700 million or more as of June 30); |
| • | the date on which we issue more than $1.0 billion of non-convertible debt over a three-year period; or |
| • | the last day of the fiscal year following the fifth anniversary of our initial public offering. |
In addition, Section 107 of the JOBS Act provides that an emerging growth company can take advantage of the extended transition period provided in Section 7(a)(2)(B) of the Securities Act of 1933, as amended, or the Securities Act, for complying with new or revised accounting standards, but we have irrevocably opted out of the extended transition period and, as a result, we will adopt new or revised accounting standards on the relevant dates in which adoption of such standards is required for other public companies.
16
Table of Contents
The Offering
| Common stock offered by us |
shares. |
| Common stock offered by MRD LLC |
shares (or shares, if the underwriters exercise in full their option to purchase additional shares). |
| Common stock to be outstanding immediately after the offering |
shares. |
| Option to purchase additional shares |
MRD LLC has granted the underwriters a 30-day option to purchase up to an aggregate of additional shares of our common stock held by MRD LLC to cover over-allotments. |
| Common stock voting rights |
Each share of our common stock will entitle its holder to one vote. |
| Use of proceeds |
We intend to use the estimated net proceeds of approximately $ million from this offering, based upon the assumed initial public offering price of $ per share (the midpoint of the price range set forth on the cover of this prospectus), after deducting underwriting discounts and commissions and fees and expenses associated with this offering and the restructuring transactions, to redeem the PIK notes in their entirety and to pay any applicable premium in connection with such redemption and accrued and unpaid interest, if any, to the date of redemption (which we expect will be 30 days after the closing of this offering); together with borrowings of approximately $ million under our new revolving credit facility, to make a cash payment to certain former management members of WildHorse Resources in connection with their contribution to us of their membership interests and incentive units in WildHorse Resources; to repay borrowings outstanding under WildHorse Resources’ credit agreements; and for general corporate purposes. Until the redemption date of the PIK notes, we will use the amount to be paid to the holders of those notes to temporarily reduce amounts outstanding under our new revolving credit facility. See “Use of Proceeds.” |
| We will not receive any of the proceeds from the sale of shares of our common stock by MRD LLC, including pursuant to any exercise by the underwriters of their option to purchase additional shares of our common stock. MRD LLC is deemed under federal securities laws to be an underwriter with respect to the common stock it may sell in connection with this offering. |
| Dividend policy |
We currently intend to retain all future earnings, if any, for use in the operation of our business and to fund future growth. The decision whether to pay dividends in the future will be made by our board of directors (our “Board”) in light of conditions then existing, including factors such as our financial condition, earnings, available cash, business opportunities, legal requirements, restrictions in our debt agreements and other contracts and other factors our Board deems relevant. See “Dividend Policy.” |
17
Table of Contents
| Risk factors |
You should carefully read and consider the information set forth under “Risk Factors” beginning on page 24 of this prospectus and all other information set forth in this prospectus before deciding to invest in our common stock. |
| Listing and trading symbol |
We intend to list our common stock on the NASDAQ Global Market (“NASDAQ”) under the trading symbol “MRD.” |
18
Table of Contents
Summary Historical Consolidated and Combined Pro Forma Financial Data
MRD LLC and its consolidated subsidiaries, our accounting predecessor, controls MEMP through its ownership of MEMP GP, the general partner of MEMP. Because MRD LLC controls MEMP through its ownership of the general partner, MRD LLC is required to consolidate MEMP for accounting and financial reporting purposes even though MRD LLC owns a minority of its partner interests and MRD LLC and MEMP have independent capital structures. MRD LLC receives cash distributions from MEMP as a result of its partner interests and incentive distribution rights in MEMP, when declared and paid by MEMP. In connection with the closing of this offering, MRD LLC will contribute substantially all of its existing assets to us in exchange for shares of our common stock. Through our ownership of MEMP GP, we will continue to control MEMP and therefore will continue to consolidate the results of MEMP into our consolidated financial statements in future periods.
Our predecessor has two reportable business segments, both of which are engaged in the acquisition, exploitation, development and production of oil and natural gas properties:
| • | MRD—reflects all of MRD LLC’s consolidating subsidiaries except for MEMP and its subsidiaries. |
| • | MEMP—reflects the consolidated and combined operations of MEMP and its subsidiaries. |
We will continue to have two reportable segments following the completion of this offering. For more information regarding reportable business segments, please see the predecessor’s audited historical financial statements and related notes.
The following tables include the summary historical financial data of our predecessor, as well as the MRD Segment as of and for the periods indicated. The summary historical financial data of our predecessor as of and for the years ended December 31, 2013 and 2012 were derived from the audited historical financial statements of our predecessor included elsewhere in this prospectus. The summary historical financial data of the MRD Segment as of and for the years ended December 31, 2013 and 2012 were derived from certain financial information used in the preparation of our predecessor’s audited financial statements.
The summary unaudited pro forma data as of and for the year ended December 31, 2013 has been prepared to give pro forma effect to: (i) the exclusion of BlueStone, which is not being conveyed to us in connection with this offering, (ii) the offering of our shares of common stock contemplated hereby and the use of the net proceeds therefrom as described in “Use of Proceeds,” (iii) incremental federal income tax expense, and (iv) the restructuring transactions.
19
Table of Contents
We derived the data in the following tables from, and the following tables should be read together with and is qualified in its entirety by reference to, our predecessor’s historical financial statements and our pro forma financial statements and the accompanying notes included elsewhere in this prospectus. You should also read “Restructuring Transactions,” “Use of Proceeds,” “Management’s Discussion and Analysis of Financial Condition and Results of Operations,” and our pro forma and historical consolidated financial statements, all included elsewhere in this prospectus. Among other things, those historical consolidated and combined financial statements and pro forma financial statements include more detailed information regarding the basis of presentation for the following data.
| MRD LLC (Predecessor) |
Memorial Resource Development Corp. Pro Forma |
|||||||||||
| Year
Ended December 31, |
Year Ended December 31, |
|||||||||||
| 2013 | 2012 | 2013 | ||||||||||
| (unaudited) | ||||||||||||
| (in thousands) | ||||||||||||
| Statement of Operations Data: |
||||||||||||
| Revenues: |
||||||||||||
| Oil and natural gas sales |
$ | 571,948 | $ | 393,631 | $ | 554,819 | ||||||
| Other revenues |
3,075 | 3,237 | 3,075 | |||||||||
|
|
|
|
|
|
|
|||||||
| Total revenues |
575,023 | 396,868 | 557,894 | |||||||||
| Costs and expenses: |
||||||||||||
| Lease operating |
113,640 | 103,754 | 111,035 | |||||||||
| Pipeline operating |
1,835 | 2,114 | 1,835 | |||||||||
| Exploration |
2,356 | 9,800 | 2,356 | |||||||||
| Production and ad valorem taxes |
27,146 | 23,624 | 26,316 | |||||||||
| Depreciation, depletion and amortization |
184,717 | 138,672 | 175,786 | |||||||||
| Impairment of proved oil and gas properties |
6,600 | 28,871 | 4,201 | |||||||||
| General and administrative |
125,358 | 69,187 | 101,098 | |||||||||
| Accretion of asset retirement obligations |
5,581 | 5,009 | 5,523 | |||||||||
| (Gain) loss on commodity derivatives |
(29,294 | ) | (34,905 | ) | (29,311 | ) | ||||||
| (Gain) loss on sale of property |
(85,621 | ) | (9,761 | ) | 3,927 | |||||||
| Other, net |
649 | 502 | 649 | |||||||||
|
|
|
|
|
|
|
|||||||
| Total costs and expenses |
352,967 | 336,867 | 403,415 | |||||||||
|
|
|
|
|
|
|
|||||||
| Operating income |
222,056 | 60,001 | 154,479 | |||||||||
|
|
|
|
|
|
|
|||||||
| Other income (expense) |
||||||||||||
| Interest expense, net |
(69,250 | ) | (33,238 | ) | ||||||||
| Amortization of investment premium |
— | (194 | ) | — | ||||||||
| Other, net |
145 | 535 | 143 | |||||||||
|
|
|
|
|
|
|
|||||||
| Total other income (expense) |
(69,105 | ) | (32,897 | ) | ||||||||
| Income tax expense |
(1,619 | ) | (107 | ) | ||||||||
|
|
|
|
|
|
|
|||||||
| Net income (loss) |
$ | 151,332 | $ | 26,997 | ||||||||
|
|
|
|
|
|
|
|||||||
| Cash Flow Data: |
||||||||||||
| Net cash provided by operating activities |
$ | 277,823 | $ | 240,404 | ||||||||
| Net cash used in investing activities |
367,443 | 606,738 | ||||||||||
| Net cash provided by financing activities |
117,950 | 361,761 | ||||||||||
| Balance Sheet Data (at period end): |
||||||||||||
| Working capital |
$ | 48,256 | $ | 63,054 | ||||||||
| Total assets |
2,829,161 | 2,459,304 | ||||||||||
| Total debt |
1,663,217 | 939,382 | ||||||||||
| Total equity (including noncontrolling interests) |
858,132 | 1,276,709 | ||||||||||
20
Table of Contents
| MRD Segment | MRD Segment Pro Forma |
|||||||||||
| Year Ended December 31, |
Year Ended December 31, |
|||||||||||
| 2013 | 2012 | 2013 | ||||||||||
| (unaudited) | ||||||||||||
| (in thousands) |
||||||||||||
| Statement of Operations Data: |
||||||||||||
| Revenues: |
||||||||||||
| Oil and natural gas sales |
$230,751 | $138,032 | $ | 213,622 | ||||||||
| Other revenues |
807 | 782 | 807 | |||||||||
|
|
|
|
|
|
|
|||||||
| Total revenues |
|
231,558 |
|
|
138,814 |
|
214,429 | |||||
| Costs and expenses: |
||||||||||||
| Lease operating |
25,006 | 24,438 | 22,401 | |||||||||
| Exploration |
1,226 | 7,337 | 1,226 | |||||||||
| Production and ad valorem taxes |
9,362 | 7,576 | 8,532 | |||||||||
| Depreciation, depletion and amortization |
87,043 | 62,636 | 78,112 | |||||||||
| Impairment of proved oil and gas properties |
2,527 | 18,339 | 128 | |||||||||
| General and administrative |
81,758 | 38,414 | 57,498 | |||||||||
| Accretion of asset retirement obligations |
728 | 632 | 670 | |||||||||
| (Gain) loss on commodity derivatives |
(3,013) | (13,488 | ) | (3,030 | ) | |||||||
| (Gain) loss on sale of property |
(82,773) | (2 | ) | 6,775 | ||||||||
| Other, net |
2 | 364 | 2 | |||||||||
|
|
|
|
|
|
|
|||||||
| Total costs and expenses |
|
121,866 |
|
|
146,246 |
|
172,314 | |||||
|
|
|
|
|
|
|
|||||||
| Operating income |
109,692 | (7,432 | ) | 42,115 | ||||||||
|
|
|
|
|
|
|
|||||||
| Other income (expense) |
||||||||||||
| Interest expense, net |
(27,349) | (12,802 | ) | |||||||||
| Earnings from equity investments |
1,066 | 4,880 | 1,066 | |||||||||
| Other, net |
145 | 535 | 143 | |||||||||
|
|
|
|
|
|
|
|||||||
| Total other income (expense) |
(26,138 | ) | (7,387 | ) | ||||||||
| Income tax (expense) benefit |
(1,311 | ) | 178 | |||||||||
|
|
|
|
|
|
|
|||||||
| Net income (loss) |
$ | 82,243 | $ | (14,641 | ) | |||||||
|
|
|
|
|
|
|
|||||||
| Cash Flow Data (Unaudited): |
||||||||||||
| Net cash provided by operating activities |
$ | 83,910 | $ | 84,172 | ||||||||
| Net cash used in investing activities |
5,533 | 230,471 | ||||||||||
| Net cash provided by (used in) financing activities |
(38,963 | ) | 133,271 | |||||||||
| Other Financial Data: |
||||||||||||
| Adjusted EBITDA (unaudited) |
$ | 197,903 | $ | 132,105 | $ | 173,135 | ||||||
| Balance Sheet Data (at period end): |
||||||||||||
| Working capital (unaudited) |
$ | 51,214 | $ | 2,424 | ||||||||
| Total assets |
1,281,134 | 1,102,406 | ||||||||||
| Total debt |
871,150 | 309,200 | ||||||||||
| Total equity (unaudited) |
279,412 | 682,644 | ||||||||||
21
Table of Contents
Adjusted EBITDA
Our reportable business segments are organized in a manner that reflects how management manages those business activities.
We evaluate segment performance based on Adjusted EBITDA. The definition and calculation of Adjusted EBITDA and the reconciliation of total reportable segments’ Adjusted EBITDA to net income (loss) is included in the notes to our predecessor’s consolidated and combined financial statements found elsewhere in this prospectus.
Adjusted EBITDA (either in total or by individual segment) is an important performance measure of the core profitability of our operations. This measure forms the basis of our internal financial reporting and is used by our management in evaluating segment performance. We believe that investors benefit from having access to the same financial measures that our management uses in evaluating segment results.
Adjusted EBITDA should not be considered an alternative to, or more meaningful than, net income (loss). Our computation of Adjusted EBITDA may not be comparable to similarly titled measures of other companies. We believe that Adjusted EBITDA is a widely followed measure of operating performance and may also be used by investors to measure our ability to meet debt service requirements.
Summary Reserve, Production and Operating Data for the MRD Segment
The following tables present summary data with respect to the estimated historical net proved oil and natural gas reserves and production and operating data for the MRD Segment as of the dates presented.
The proved reserve estimates presented in the table below were prepared by NSAI, and the probable and possible reserve estimates were prepared by our management and audited by NSAI. Regarding our properties, estimates comprising 100% of the total proved reserves in the reserve report were prepared by NSAI. These reserve estimates were prepared in accordance with current SEC rules regarding oil and natural gas reserve reporting. The following tables also contain certain summary information regarding production and sales of oil and natural gas with respect to such properties.
Please read “Business—Our Operations” as well as “Management’s Discussion and Analysis of Financial Condition and Results of Operations” and the summaries of our reserve report included herein as Appendix B-1 and Appendix B-2 in evaluating the material presented below.
Reserve Data
| Estimated Proved Reserves |
As of December 31, 2013 |
|||
| Natural gas (MMcf) |
802,254 | |||
| Oil/Condensate (MBbls) |
11,311 | |||
| NGLs (MBbls) |
42,577 | |||
|
|
|
|||
| Total estimated net proved reserves (MMcfe) |
1,125,577 | |||
|
|
|
|||
| Proved developed producing (MMcfe) |
323,351 | |||
| Proved developed non-producing (MMcfe) |
44,290 | |||
| Proved undeveloped (MMcfe) |
757,936 | |||
| Proved developed reserves as a percentage of total proved reserves |
33 | % | ||
| PV-10 of proved reserves (in millions)(1) |
$ | 1,469 | ||
22
Table of Contents
| Estimated Probable Reserves(2) | ||||
| Natural Gas (MMcf) |
535,185 | |||
| Oil/Condensate (MBbls) |
10,480 | |||
| NGLs (MBbls) |
33,709 | |||
|
|
|
|||
| Total estimated net probable reserves (MMcfe) |
800,317 | |||
|
|
|
|||
| PV-10 of probable reserves (in millions)(1) |
$ | 1,052 | ||
| Estimated Possible Reserves(2) | ||||
| Natural Gas (MMcf) |
688,701 | |||
| Oil/Condensate (MBbls) |
14,072 | |||
| NGLs (MBbls) |
43,517 | |||
|
|
|
|||
| Total estimated net possible reserves (MMcfe) |
1,034,233 | |||
|
|
|
|||
| PV-10 of possible reserves (in millions)(1) |
$ | 1,342 | ||
| (1) | PV-10 is a non-GAAP financial measure and differs from standardized measure, the most directly comparable GAAP financial measure. Please see “—Reserves.” |
| (2) | Substantially all of our estimated probable and possible reserves are classified as undeveloped. |
Production and Operating Data
| Historical MRD Segment(1) |
MRD Segment Pro Forma |
|||||||||||
| Year Ended December 31, |
Year
Ended December 31, |
|||||||||||
| 2013 | 2012 | 2013 | ||||||||||
| Production and operating data: |
||||||||||||
| Oil (MBbls) |
665 | 369 | 533 | |||||||||
| NGLs (MBbls) |
1,457 | 898 | 1,454 | |||||||||
| Natural gas (MMcf) |
34,092 | 24,130 | 33,205 | |||||||||
|
|
|
|
|
|
|
|||||||
| Total (MMcfe) |
46,819 | 31,731 | 45,129 | |||||||||
| Average net production (MMcfe/d) |
128.3 | 86.7 | 123.6 | |||||||||
| Average sales price: |
||||||||||||
| Oil (per Bbl) |
$ | 100.76 | $ | 95.56 | $ | 100.08 | ||||||
| NGLs (per Bbl) |
36.99 | 40.78 | 36.93 | |||||||||
| Natural gas (per Mcf) |
3.22 | 2.74 | 3.21 | |||||||||
|
|
|
|
|
|
|
|||||||
| Average price per Mcfe |
$ | 4.93 | $ | 4.35 | $ | 4.73 | ||||||
| Average unit costs per Mcfe: |
||||||||||||
| Lease operating expenses |
$ | 0.53 | $ | 0.77 | $ | 0.50 | ||||||
| Production and ad valorem taxes |
$ | 0.20 | $ | 0.24 | $ | 0.19 | ||||||
| General and administrative(2) |
$ | 1.75 | $ | 1.21 | $ | 1.27 | ||||||
| Depletion, depreciation and amortization |
$ | 1.86 | $ | 1.97 | $ | 1.73 | ||||||
| (1) | Includes production and operating data for BlueStone, which will not be contributed to us in connection with the closing of this offering. The MRD Segment Pro Forma production and operating data has been adjusted to exclude the production and operating data for BlueStone. |
| (2) | Includes $0.92 and $0.30 per Mcfe of incentive unit compensation expense for the historical MRD Segment for the years ended December 31, 2013 and 2012. The pro forma general and administrative expense for the year ended December 31, 2013 includes $0.50 per Mcfe of incentive unit compensation expense. |
23
Table of Contents
Investing in our common stock involves a high degree of risk. You should carefully consider the risks and uncertainties described below, as well as other information contained in this prospectus, before investing in our common stock. If any of the following risks actually occur, our business, financial condition, operating results or cash flow could be materially and adversely affected.
Risks Related to Our Business
Oil, natural gas and NGL prices are volatile, due to factors beyond our control, and will greatly affect our business, results of operations, liquidity and financial condition.
Our revenues, operating results, profitability, liquidity, future growth and the value of our properties depend primarily on prevailing commodity prices. Historically, oil and natural gas prices have been volatile and fluctuate in response to changes in supply and demand, market uncertainty, and other factors that are beyond our control, including:
| • | the regional, domestic and foreign supply of oil, natural gas and NGLs; |
| • | the level of commodity prices and expectations about future commodity prices; |
| • | the level of global oil and natural gas exploration and production; |
| • | localized supply and demand fundamentals, including the proximity and capacity of pipelines and other transportation facilities, and other factors that result in differentials to benchmark prices from time to time; |
| • | the cost of exploring for, developing, producing and transporting reserves; |
| • | the price and quantity of foreign imports; |
| • | political and economic conditions in oil producing countries; |
| • | the ability of members of the Organization of Petroleum Exporting Countries to agree to and maintain oil price and production controls; |
| • | speculative trading in crude oil and natural gas derivative contracts; |
| • | the level of consumer product demand; |
| • | weather conditions and other natural disasters; |
| • | risks associated with operating drilling rigs; |
| • | technological advances affecting exploration and production operations and overall energy consumption; |
| • | domestic and foreign governmental regulations and taxes; |
| • | the continued threat of terrorism and the impact of military and other action; |
| • | the price and availability of competitors’ supplies of oil and natural gas and alternative fuels; and |
| • | overall domestic and global economic conditions. |
These factors and the volatility of the energy markets make it extremely difficult to predict future oil, natural gas and NGL price movements with any certainty. For example, for the five years ended December 31, 2013, the NYMEX-WTI oil future price ranged from a high of $113.93 per Bbl to a low of $33.98 per Bbl, while the NYMEX-Henry Hub natural gas future price ranged from a high of $7.50 per MMBtu to a low of $1.82 per MMBtu. Any substantial decline in commodity prices will likely have a material adverse effect on our operations and financial condition, as well as on our level of expenditures for the development of our reserves.
24
Table of Contents
NGLs comprised 23% of our estimated proved reserves at December 31, 2013 and accounted for 22% of our production on a volume equivalent basis for the three months ended December 31, 2013. Realized NGL prices have decreased recently principally due to significant supply. NGLs are made up of ethane, propane, isobutane, normal butane and natural gasoline, all of which have different uses and different pricing characteristics. A further or extended decline in NGL prices could materially and adversely affect our future business, financial condition and results of operations.
The prices that we receive for our oil and natural gas production often reflect a regional discount, based on the location of production, to the relevant benchmark prices, such as NYMEX or ICE, that are used for calculating hedge positions. The prices we receive for our production are also affected by the specific characteristics of the production relative to production sold at benchmark prices. These discounts, if significant, could adversely affect our results of operations and financial condition.
We may have difficulty managing growth in our business, which could adversely affect our financial condition and results of operations.
As a recently formed company, growth in accordance with our business plan, if achieved, could place a significant strain on our financial, technical, operational and management resources. As we expand our activities and increase the number of projects we are evaluating or in which we participate, there will be additional demands on our financial, technical, operational and management resources. We depend on the services of certain former management members of WildHorse Resources for supervising and managing our drilling operations in the Terryville Complex, and in connection with the closing of the offering, we will enter into a services agreement with an entity managed by them for these same services. See “Certain Relationships and Related Party Transactions—Services Agreement.” Under certain circumstances, this agreement may be terminated by the parties thereto and we may be unable to find replacement services, which could materially and adversely affect our ability to execute our plans for the development of the Terryville Complex. In addition, the failure to continue to upgrade our technical, administrative, operating and financial control systems or the occurrences of unexpected expansion difficulties, including the failure to recruit and retain experienced managers, geologists, engineers and other professionals in the oil and natural gas industry, could have a material adverse effect on our business, financial condition and results of operations and our ability to timely execute our business plan.
Unless we replace the oil and natural gas reserves we produce, our revenues and production will decline, which would adversely affect our business, results of operations, liquidity and financial condition.
Producing oil and natural gas reservoirs are characterized by declining production rates that vary depending upon reservoir characteristics and other factors. Our future oil and natural gas reserves and production and therefore our cash flow and financial condition are highly dependent on our success in efficiently developing and exploiting our current reserves. Our production decline rates may be significantly higher than currently estimated if our wells do not produce as expected. Further, our decline rate may change when we drill additional wells or make acquisitions. We may not be able to develop, find or acquire additional reserves to replace our current and future production on economically acceptable terms, which would adversely affect our business, financial condition and results of operations.
If commodity prices decline, a significant portion of our development projects may become uneconomic and cause write downs of the value of our oil and natural gas properties, which may adversely affect our financial condition and liquidity.
Significantly lower oil prices, or sustained lower natural gas prices, would render many of our development and production projects uneconomic and result in a reduction of our estimated reserves, which would reduce the borrowing base under our new revolving credit facility and our ability to finance planned or desired capital expenditures or acquisitions.
25
Table of Contents
Deteriorating commodity prices may cause us to recognize impairments in the value of our properties. In addition, if our estimates of development costs increase, production data factors change or drilling results deteriorate, accounting rules may require us to write down, as a non-cash charge to earnings, the carrying value of our properties for impairments. We may incur impairment charges in the future, which could have a material adverse effect on our results of operations in the period taken.
Drilling for and producing oil and natural gas are high-risk activities with many uncertainties that may result in a total loss of investment or otherwise adversely affect our business, financial condition or results of operations.
Our drilling activities are subject to many risks. For example, we cannot assure you that wells drilled by us will be productive or that we will recover all or any portion of our investment in such wells. Drilling for oil and natural gas often involves unprofitable efforts, not only from dry holes but also from wells that are productive but do not produce sufficient oil or natural gas to return a profit at then-realized prices after deducting drilling, operating and other costs. The seismic data and other technologies we use do not allow us to know conclusively prior to drilling a well that oil or natural gas is present or that it can be produced economically. The costs of exploration, exploitation and development activities are subject to numerous uncertainties beyond our control, and increases in those costs can adversely affect the economics of a project. Further, our drilling and producing operations may be curtailed, delayed, canceled or otherwise negatively impacted as a result of other factors, including:
| • | unusual or unexpected geological formations; |
| • | loss of drilling fluid circulation; |
| • | loss of well control; |
| • | title problems; |
| • | facility or equipment malfunctions; |
| • | unexpected operational events; |
| • | shortages or delivery delays or increases in the cost of equipment and services; |
| • | reductions in oil, natural gas and NGL prices; |
| • | lack of proximity to and shortage of capacity of transportation facilities; |
| • | the limited availability of financing at acceptable rates; |
| • | delays imposed by or resulting from compliance with environmental and other governmental or regulatory requirements, which may include limitations on hydraulic fracturing or the discharge of greenhouse gases; and |
| • | adverse weather conditions. |
Any of these risks can cause substantial losses, including personal injury or loss of life, damage to or destruction of property, natural resources and equipment, pollution, environmental contamination or loss of wells and other regulatory penalties.
Part of our strategy involves using horizontal drilling and completion techniques, which involve risks and uncertainties in their application.
Our operations involve utilizing some of the latest drilling and completion techniques as developed by us and our service providers. Risks that we face while drilling horizontal wells include, but are not limited to, the following:
| • | landing our wellbore in the desired drilling zone; |
| • | staying in the desired drilling zone while drilling horizontally through the formation; |
26
Table of Contents
| • | running our casing the entire length of the wellbore; |
| • | being able to run tools and other equipment consistently through the horizontal wellbore. |
Risks that we face while completing our wells include, but are not limited to, the following:
| • | the ability to fracture stimulate the planned number of stages; |
| • | the ability to run tools the entire length of the wellbore during completion operations; and |
| • | the ability to successfully clean out the wellbore after completion of the final fracture stimulation stage. |
If our drilling results are less than anticipated, the return on our investment for a particular project may not be as attractive as we anticipated and we could incur material write-downs of unevaluated properties and the value of our undeveloped acreage could decline in the future.
Our development and exploratory drilling efforts and our well operations may not be profitable or achieve our targeted returns.
We own a significant amount of unproved property, which we expect to further our development efforts. We intend to continue to undertake acquisitions of unproved properties in the future. Development and exploratory drilling and production activities are subject to many risks, including the risk that no commercially productive reservoirs will be discovered. We acquire unproved properties and lease undeveloped acreage that we believe will enhance our growth potential and increase our results of operations over time. However, we cannot assure you that all prospects will be economically viable or that we will not abandon our investments. Additionally, we cannot assure you that unproved property acquired by us or undeveloped acreage leased by us will be profitably developed, that wells drilled by us in prospects that we pursue will be productive or that we will recover all or any portion of our investment in such unproved property or wells.
Our acreage must be drilled before lease expiration, generally within three to five years, in order to hold the acreage by production. In a highly competitive market for acreage, failure to drill sufficient wells to hold acreage may result in a substantial lease renewal cost, or if renewal is not feasible, loss of our lease and prospective drilling opportunities.
Leases on oil and natural gas properties typically have a term of three to five years, after which they expire unless, prior to expiration, production is established within the spacing units covering the undeveloped acres. As of December 31, 2013, we had 10,825 gross (6,985 net) acres scheduled to expire in 2014, 20,078 gross (12,015 net) acres scheduled to expire in 2015, 31,215 gross (20,875 net) acres scheduled to expire in 2016 and 28,228 gross (19,649 net) acres scheduled to expire in 2017. The cost to renew such leases may increase significantly, and we may not be able to renew such leases on commercially reasonable terms or at all. Moreover, many of our leases require lessor consent to pool, which may make it more difficult to hold our leases by production. Any reduction in our current drilling program, either through a reduction in capital expenditures or the unavailability of drilling rigs, could result in the loss of acreage through lease expirations. In addition, in order to hold our current leases scheduled to expire in 2014 and 2015, we will need to operate at least a one-rig program. We cannot assure you that we will have the liquidity to deploy these rigs when needed, or that commodity prices will warrant operating such a drilling program. Any such losses of leases could materially and adversely affect the growth of our asset base, cash flows and results of operations.
We may incur losses as a result of title defects in the properties in which we invest.
The existence of a material title deficiency can render a lease worthless and can adversely affect our results of operations and financial condition. While we typically obtain title opinions prior to commencing drilling operations on a lease or in a unit, the failure of title may not be discovered until after a well is drilled, in which case we may lose the lease and the right to produce all or a portion of the minerals under the property.
27
Table of Contents
Our project areas, which are in various stages of development, may not yield oil or natural gas in commercially viable quantities.
Our project areas are in various stages of development, ranging from project areas with current drilling or production activity to project areas that consist of recently acquired leasehold acreage or that have limited drilling or production history. At December 31, 2013, 10 gross (9.4 net) wells were in various stages of completion. If the wells in the process of being completed do not produce sufficient revenues to return a profit or if we drill dry holes in the future, our business may be materially affected. From January 2011 through December 31, 2013, we have drilled 83 gross (51.9 net) wells and, out of these wells, 3 gross (1.5 net) wells were dry holes.
Our identified drilling locations, which are scheduled out over many years, are susceptible to uncertainties that could materially alter the occurrence or timing of their drilling.
As of December 31, 2013, we had identified 1,297 gross (892 net) horizontal drilling locations on our existing acreage. Only 145 of these gross identified drilling locations had proved undeveloped reserves attributed to them in our reserve report. These drilling locations, including those with attributed proved undeveloped reserves, represent a significant part of our growth strategy. Our ability to drill and develop these locations depends on a number of factors, including the availability of capital, seasonal conditions, regulatory changes and approvals, negotiation of agreements with third parties, commodity prices, costs, the generation of additional seismic or geological information, the availability of drilling rigs, drilling results, construction of infrastructure, inclement weather, and lease expirations.
Further, our identified potential drilling locations are in various stages of evaluation, ranging from locations that are ready to drill to locations that will require substantial additional analysis of data. We cannot predict in advance of drilling and testing whether any particular drilling location will yield production in sufficient quantities to recover drilling or completion costs or to be economically viable. Even if sufficient amounts of oil or natural gas reserves exist, we may damage the potentially productive hydrocarbon bearing formation or experience mechanical difficulties while drilling or completing the well, possibly resulting in a reduction in production from the well or abandonment of the well. If we drill dry holes in our current and future drilling locations, our drilling success rate may decline and materially harm our business. We cannot assure you that the analogies we draw from available data from other wells, more fully explored locations or producing fields will be applicable to our drilling locations. Further, initial production rates reported by us or other operators in our areas of operations may not be indicative of future or long-term production rates.
Our 1,146 gross horizontal drilling locations are identified within four distinct zones within the Terryville Complex, with such gross horizontal drilling locations being roughly evenly distributed amongst such four zones. To date, we have drilled 23 horizontal wells within the key formations in Terryville Complex. Accordingly, we have limited experience in drilling horizontal wells in the zones of the Terryville Complex to which we have ascribed a substantial majority of our net identified drilling locations. Please see “Business—Our Operations—Drilling Locations” for more information on our net identified drilling locations.
Because of these uncertainties, we do not know if the potential drilling locations we have identified will ever be drilled or if we will be able to produce oil or natural gas reserves from these or any other potential drilling locations. As such, our actual drilling activities may materially differ from those presently identified, which could adversely affect our business, financial condition and results of operations.
We have identified drilling, recompletion and development locations and prospects for future drilling, recompletion and development. These drilling, recompletion and development locations represent a significant part of our future drilling and enhanced recovery opportunity plans. Our ability to drill, recomplete and develop these locations depends on a number of factors, including the availability of capital, seasonal conditions, regulatory approvals, negotiation of agreements with third parties, commodity prices, costs, the generation of additional seismic or geological information, the availability of drilling rigs, and drilling results. Because of these
28
Table of Contents
uncertainties, we cannot be certain of the timing of these activities or that they will ultimately result in the realization of estimated proved reserves or meet our expectations for success. As such, our actual drilling and enhanced recovery activities may materially differ from our current expectations, which could have a significant adverse effect on our estimated reserves, financial condition and results of operations.
The development of our proved undeveloped and unproved reserves may take longer and may require higher levels of capital expenditures than we anticipate and may not be economically viable.
Approximately 67% of our total proved reserves at December 31, 2013 were proved undeveloped reserves; those reserves may not be ultimately developed or produced. Recovery of proved undeveloped reserves requires significant capital expenditures and successful drilling operations. Moreover, the development of probable and possible reserves will require additional capital expenditures and such reserves are less certain to be recovered than proved reserves. The reserve data included in our reserve report assumes that substantial capital expenditures are required to develop such undeveloped reserves. We cannot be certain that the estimated costs of the development of these reserves are accurate, that development will occur as scheduled or that the results of such development will be as estimated. Delays in the development of our reserves or increases in costs to drill and develop such reserves will reduce future net revenues of our estimated proved undeveloped reserves and may result in some projects becoming uneconomic. In addition, delays in the development of reserves could cause us to have to reclassify our proved reserves as proved undeveloped reserves.
Our acquisition and development operations require substantial capital expenditures.
The development and production of our oil and natural gas reserves requires substantial capital expenditures. If our revenues decrease, as a result of lower oil or natural gas prices or for any other reason, we may not be able to obtain the capital necessary to sustain our operations at our current level. In addition, our ability to acquire additional properties will be adversely affected if we are unable to fund such acquisitions from cash flow from operations or other sources.
Shortages of rigs, equipment and crews could delay our operations, increase our costs and delay forecasted revenue.
Higher oil and natural gas prices generally increase the demand for rigs, equipment and crews and can lead to shortages of, and increasing costs for, development equipment, services and personnel. Shortages of, or increasing costs for, experienced development crews and oil field equipment and services could restrict our ability to drill the wells and conduct the operations that we currently have planned. Any delay in the development of new wells or a significant increase in development costs could reduce our revenues and thus the results of our operations.
Our hedging strategy may not effectively mitigate the impact of commodity price volatility from our cash flows, and our hedging activities could result in cash losses and may limit potential gains.
We intend to maintain a portfolio of commodity derivative contracts. These commodity derivative contracts include natural gas, oil and NGL financial swaps and collar contracts and natural gas basis financial swaps. The prices and quantities at which we enter into commodity derivative contracts covering our production in the future will be dependent upon oil and natural gas prices and price expectations at the time we enter into these transactions, which may be substantially higher or lower than current or future oil and natural gas prices. Accordingly, our price hedging strategy may not protect us from significant declines in oil and natural gas prices received for our future production. In addition, we expect that our new revolving credit facility will limit our ability to enter into commodity hedges covering greater than 85% of our reasonably anticipated projected production. Many of the derivative contracts to which we will be a party will require us to make cash payments to the extent the applicable index exceeds a predetermined price, thereby limiting our ability to realize the benefit of increases in oil and natural gas prices. If our actual production and sales for any period are less than our hedged production and sales for that period (including reductions in production due to operational delays) or if
29
Table of Contents
we are unable to perform our drilling activities as planned, we might be forced to satisfy all or a portion of our hedging obligations without the benefit of the cash flow from our sale of the underlying physical commodity, which may materially impact our liquidity.
Our hedging transactions expose us to counterparty credit risk.
Our hedging transactions expose us to risk of financial loss if a counterparty fails to perform under a derivative contract. Disruptions in the financial markets or other unforeseen events could lead to sudden changes in a counterparty’s liquidity, which could impair its ability to perform under the terms of the derivative contract and, accordingly, prevent us from realizing the benefit of the derivative contract.
Reserve estimates depend on many assumptions that may turn out to be inaccurate. Any material inaccuracies in our reserve estimates or underlying assumptions will materially affect the quantities and present value of our reserves.
The process of estimating natural gas and oil reserves is complex. It requires interpretations of available technical data and many assumptions, including assumptions relating to current and future economic conditions and commodity prices. Any significant inaccuracies in these interpretations or assumptions could materially affect our estimated quantities and present value of our reserves.
In order to prepare our estimates, we must project production rates and timing of development expenditures. We must also analyze available geological, geophysical, production and engineering data. The extent, quality and reliability of this data can vary.
The process also requires economic assumptions about matters such as natural gas prices, oil prices, drilling and operating expenses, capital expenditures, taxes and availability of funds.
Actual future production, oil prices, natural gas prices, revenues, taxes, development expenditures, operating expenses and quantities of recoverable reserves will vary from our estimates. Any significant variance could materially affect the estimated quantities and present value of our reserves. In addition, we may adjust our reserve estimates to reflect production history, results of exploration and development, existing commodity prices and other factors, many of which are beyond our control.
You should not assume that the present value of future net revenues from our reserves is the current market value of our estimated reserves. We generally base the estimated discounted future net cash flows from our reserves on prices and costs on the date of the estimate. Actual future prices and costs may differ materially from those used in the present value estimate.
Any material inaccuracies in these reserve estimates or underlying assumptions will materially affect the quantities and present value of our reserves, which could adversely affect our business, results of operations and financial condition.
SEC rules could limit our ability to book additional PUDs in the future.
SEC rules require that, subject to limited exceptions, PUDs may only be booked if they relate to wells scheduled to be drilled within five years after the date of booking. This requirement has limited and may continue to limit our ability to book additional PUDs as we pursue our drilling program. Moreover, we may be required to write down our PUDs if we do not drill those wells within the required five-year timeframe.
The PV-10 of our estimated proved, probable and possible reserves is not necessarily the same as the current market value of our estimated proved oil and natural gas reserves.
The present value of future net cash flows from our proved, probable and possible reserves shown in this report, or PV-10, may not be the current market value of our estimated natural gas and oil reserves. In accordance
30
Table of Contents
with rules established by the SEC and the Financial Accounting Standards Board (“FASB”), we base the estimated discounted future net cash flows from our proved reserves on the 12-month average oil and gas index prices, calculated as the unweighted arithmetic average for the first-day-of-the-month price for each month and costs in effect on the date of the estimate, holding the prices and costs constant throughout the life of the properties. Actual future prices and costs may differ materially from those used in the net present value estimate, and future net present value estimates using then current prices and costs may be significantly less than the current estimate. In addition, the 10% discount factor we use when calculating discounted future net cash flows may not be the most appropriate discount factor based on interest rates in effect from time to time and risks associated with us or the natural gas and oil industry in general.
Our producing properties are concentrated in North Louisiana and East Texas, making us vulnerable to risks associated with operating in one major geographic area.
Our producing properties are geographically concentrated in North Louisiana and East Texas. At December 31, 2013, 99% of our total estimated proved reserves and for the three months ended December 31, 2013, 99% of our net average daily production were attributable to properties located in this area. As a result of this concentration, we may be disproportionately exposed to the impact of regional supply and demand factors, delays or interruptions of production from wells in this area caused by governmental regulation, processing or transportation capacity constraints, market limitations, availability of equipment and personnel, water shortages or other drought related conditions or interruption of the processing or transportation of oil, natural gas or NGLs.
Expenses not covered by our insurance could have a material adverse effect on our financial position, results of operations and cash flows.
Our operations are subject to all of the hazards and operating risks associated with drilling for and production of oil and natural gas, including natural disasters, the risk of fire, explosions, blowouts, surface cratering, uncontrollable flows of natural gas, oil and formation water, pipe or pipeline failures, abnormally pressured formations, casing collapses and environmental hazards such as oil spills, natural gas leaks, ruptures or discharges of toxic gases. In addition, our operations are subject to risks associated with hydraulic fracturing, including any mishandling, surface spillage or potential underground migration of fracturing fluids, including chemical additives. The location of any properties and other assets near populated areas, including residential areas, commercial business centers and industrial sites, could significantly increase the level of damages resulting from these risks. The occurrence of any of these events could result in substantial losses to us due to injury or loss of life, severe damage to or destruction of property, natural resources and equipment, pollution or other environmental damage, clean-up responsibilities, regulatory investigation and penalties, suspension of operations, substantial revenue losses and repairs to resume operations.
We maintain insurance coverage against potential losses that we believe is customary in the industry. However, these policies may not cover all liabilities, claims, fines, penalties or costs and expenses that we may incur in connection with our business and operations, including those related to environmental claims. Pollution and environmental risks generally are not fully insurable. In addition, we cannot assure you that we will be able to maintain adequate insurance at rates we consider reasonable. We may elect not to obtain insurance if we believe that the cost of available insurance is excessive relative to the perceived risks presented. A loss not fully covered by insurance could have a material adverse effect on our financial position, results of operations and cash flows.
We may be unable to make attractive acquisitions or successfully integrate acquired businesses, and any inability to do so may disrupt our business and hinder our ability to grow.
In the future we may make acquisitions of businesses that complement or expand our current business. We may not be able to identify attractive acquisition opportunities. Even if we do identify attractive acquisition opportunities, we may not be able to complete the acquisition or do so on commercially acceptable terms.
31
Table of Contents
Any acquisition involves potential risks, including, among other things:
| • | the validity of our assumptions about estimated proved reserves, future production, revenues, capital expenditures, operating expenses and costs; |
| • | the assumption of unknown liabilities, losses or costs for which we are not indemnified or for which any indemnity we receive is inadequate; |
| • | an inability to obtain satisfactory title to the assets we acquire; and |
| • | potential lack of operating experience in the geographic market where the acquired assets or business are located. |
The success of any completed acquisition will depend on our ability to integrate effectively the acquired business into our existing operations. The process of integrating acquired businesses may involve unforeseen difficulties and may require a disproportionate amount of our managerial and financial resources. In addition, possible future acquisitions may be larger and for purchase prices significantly higher than those paid for earlier acquisitions. No assurance can be given that we will be able to identify additional suitable acquisition opportunities, negotiate acceptable terms, obtain financing for acquisitions on acceptable terms or successfully acquire identified targets. Our failure to achieve consolidation savings, to integrate the acquired businesses and assets into our existing operations successfully or to minimize any unforeseen operational difficulties could have a material adverse effect on our financial condition and results of operations.
NGP, the Funds and their affiliates are not limited in their ability to compete with us, which could cause conflicts of interest and limit our ability to acquire additional assets or businesses.
Our governing documents provide that NGP and the Funds and their respective affiliates (including NGP and its affiliates’ portfolio investments) are not restricted from owning assets or engaging in businesses that compete directly or indirectly with us. In addition, NGP and the Funds and their respective affiliates may acquire, develop or dispose of additional oil and natural gas properties or other assets in the future, without any obligation to offer us the opportunity to purchase or develop any of those assets.
NGP and the Funds are established participants in the oil and natural gas industry, and have resources greater than ours, which factors may make it more difficult for us to compete with them with respect to commercial activities as well as for potential acquisitions. As a result, competition from these affiliates could adversely impact our results of operations.
We sell most of our production to a limited number of significant purchasers. The loss of one or more of these purchasers could, among other factors, limit our access to suitable markets for the hydrocarbons we produce.
The availability of a ready market for any hydrocarbons we produce depends on numerous factors beyond the control of our management, including but not limited to the extent of domestic production and imports of oil, the proximity and capacity of natural gas pipelines, the availability of skilled labor, materials and equipment, the effect of state and federal regulation of oil and natural gas production and federal regulation of natural gas sold in interstate commerce. In addition, we sell most of our production to a limited number of significant purchasers, and our contracts with those customers typically are on a month- to-month basis. The loss of these customers could adversely affect our revenues and have a material adverse effect on our financial condition and results of operations. We cannot assure you that any of our customers will continue to do business with us or that we will continue to have ready access to suitable markets for our future production. Additionally, our reliance on the limited number of significant purchasers exposes us to risk of financial loss if a significant purchaser fails to perform under a contract.
32
Table of Contents
We may be unable to compete effectively with larger companies.
The oil and natural gas industry is intensely competitive with respect to acquiring prospects and productive properties, marketing oil and natural gas, and securing equipment and trained personnel. Our ability to acquire additional properties and to discover reserves in the future will depend on our ability to evaluate and select suitable properties and to consummate transactions in a highly competitive environment. Many of our larger competitors not only drill for and produce oil and natural gas but also carry on refining operations and market petroleum and other products on a regional, national or worldwide basis, and many of our competitors have access to capital at a lower cost than that available to us. These companies may be able to pay more for oil and natural gas properties and evaluate, bid for and purchase a greater number of properties than our financial, technical or personnel resources permit. In addition, there is substantial competition for investment capital in the oil and natural gas industry. These larger companies may have a greater ability to continue development activities during periods of low oil and natural gas prices and to absorb the burden of present and future federal, state, local and other laws and regulations. Furthermore, we may not be able to aggregate sufficient quantities of production to compete with larger companies that are able to sell greater volumes of production to intermediaries, thereby reducing the realized prices attributable to our production. Any inability to compete effectively with larger companies could have a material adverse impact on our business activities, financial condition and results of operations.
We require substantial capital expenditures to conduct our operations, engage in acquisition activities and replace our production, and we may be unable to obtain needed financing on satisfactory terms necessary to execute our operating strategy.
We require substantial capital expenditures to conduct our exploration, development and production operations, engage in acquisition activities and replace our production. We have established a capital budget for 2014 of approximately $316 million and we intend to rely on cash flow from operating activities as our primary sources of liquidity. We also may engage in asset and equity sale transactions to, among other things, fund capital expenditures when market conditions permit us to complete transactions on terms we find acceptable. There can be no assurance that such sources will be sufficient to fund our exploration, development and acquisition activities. If our revenues and cash flows decrease in the future as a result of a decline in commodity prices or a reduction in production levels, however, and we are unable to obtain additional equity or debt financing in the capital markets or access alternative sources of funds, we may be required to reduce the level of our capital expenditures and may lack the capital necessary to replace our reserves or maintain our production levels.
Our business depends in part on pipelines, gathering systems and processing facilities owned by us or others. Any limitation in the availability of those facilities could interfere with our ability to market our oil and natural gas production.
The marketability of our oil and natural gas production depends in part on the availability, proximity and capacity of pipelines and other transportation methods, gathering systems and processing facilities owned by third parties. The amount of oil and natural gas that can be produced and sold is subject to curtailment in certain circumstances, such as pipeline interruptions due to scheduled and unscheduled maintenance, excessive pressure, physical damage or lack of contracted capacity on such systems. Our access to transportation options can also be affected by U.S. federal and state regulation of oil and natural gas production and transportation, general economic conditions and changes in supply and demand. The curtailments arising from these and similar circumstances may last from a few days to several months. In many cases, we are provided with only limited, if any, notice as to when these circumstances will arise and their duration. Any significant curtailment in gathering system or transportation or processing facility capacity could reduce our ability to market our oil and natural gas production and harm our business.
33
Table of Contents
Our use of 2-D and 3-D seismic data is subject to interpretation and may not accurately identify the presence of oil and natural gas, which could adversely affect the results of our drilling operations.
Even when properly used and interpreted, 2-D and 3-D seismic data and visualization techniques are only tools used to assist geoscientists in identifying subsurface structures and hydrocarbon indicators and do not enable the interpreter to know whether hydrocarbons are, in fact, present in those structures. In addition, the use of 3-D seismic and other advanced technologies requires greater predrilling expenditures than traditional drilling strategies, and we could incur losses as a result of such expenditures. As a result, our drilling activities may not be successful or economical.
Conservation measures and technological advances could reduce demand for oil and natural gas.
Fuel conservation measures, alternative fuel requirements, increasing consumer demand for alternatives to oil and natural gas, technological advances in fuel economy and energy generation devices could reduce demand for oil and natural gas. The impact of the changing demand for oil and natural gas services and products may have a material adverse effect on our business, financial condition, results of operations and cash flows.
We are subject to complex federal, state, local and other laws and regulations that could adversely affect the cost, manner or feasibility of conducting our operations.
Our natural gas and oil exploration, production, and transportation operations are subject to complex and stringent laws and regulations. To conduct our operations in compliance with these laws and regulations, we must obtain and maintain numerous permits, approvals and certificates from various federal, state and local governmental authorities. We may incur substantial costs in order to maintain compliance with these existing laws and regulations. In addition, the trend in environmental regulation is to place more restrictions and limitations on activities that may affect the environment and thus, our costs of compliance may increase if existing laws and regulations are revised or reinterpreted, or if new laws and regulations become applicable to our operations. Failure to comply with laws and regulations applicable to our operations, including any evolving interpretation and enforcement by governmental authorities, could have a material adverse effect on our business, financial condition, and results of operations.
Our oil and natural gas development and production operations are also subject to stringent and complex federal, state and local laws and regulations governing the discharge of materials into the environment, health and safety aspects of our operations, or otherwise relating to environmental protection. These laws and regulations may impose numerous obligations applicable to our operations including the acquisition of a permit before conducting regulated drilling activities; the restriction of types, quantities and concentration of materials that can be released into the environment; the limitation or prohibition of drilling activities on certain lands lying within wilderness, wetlands and other protected areas; the application of specific health and safety criteria addressing worker protection; and the imposition of substantial liabilities for pollution resulting from our operations. Numerous governmental authorities, such as the U.S. Environmental Protection Agency, or the EPA, and analogous state agencies have the power to enforce compliance with these laws and regulations and the permits issued under them. Such enforcement actions often involve taking difficult and costly compliance measures or corrective actions. Failure to comply with these laws and regulations may result in the assessment of sanctions, including administrative, civil or criminal penalties, the imposition of investigatory or remedial obligations, and the issuance of orders limiting or prohibiting some or all of our operations. In addition, we may experience delays in obtaining or be unable to obtain required permits, which may delay or interrupt our operations and limit our growth and revenue.
Certain environmental laws impose strict as well as joint and several liability for costs required to remediate and restore sites where hazardous substances, hydrocarbons, or solid wastes have been stored or released. We may be required to remediate contaminated properties currently or formerly operated by us or facilities of third parties that received waste generated by our operations regardless of whether such contamination resulted from
34
Table of Contents
the conduct of others or from consequences of our own actions that were in compliance with all applicable laws at the time those actions were taken. In addition, claims for damages to persons or property, including natural resources, may result from the environmental, health and safety impacts of our operations. Moreover, public interest in the protection of the environment has increased dramatically in recent years. The trend of more expansive and stringent environmental legislation and regulations applied to the crude oil and natural gas industry could continue, resulting in increased costs of doing business and consequently affecting profitability. To the extent laws are enacted or other governmental action is taken that restricts drilling or imposes more stringent and costly operating, waste handling, disposal and cleanup requirements, our business, prospects, financial condition or results of operations could be materially adversely affected.
Please read “Business—Regulation of Environmental and Occupational Health and Safety Matters” for a further description of the laws and regulations that affect us.
Climate change legislation or regulations restricting emissions of “greenhouse gases,” or GHGs could result in increased operating costs and reduced demand for the oil and natural gas that we produce.
Recent scientific studies have suggested that emissions of certain gases, commonly referred to as GHGs, including carbon dioxide and methane, may be contributing to warming of the earth’s atmosphere and other climatic changes. In December 2009, the EPA published its findings that emissions of GHGs present an endangerment to public health and the environment because emissions of such gases are, according to the EPA, contributing to the warming of the earth’s atmosphere and other climatic changes. Based on these findings, the EPA adopted regulations under existing provisions of the federal Clean Air Act that establish Prevention of Significant Deterioration, or PSD, and Title V permit reviews for GHG emissions from certain large stationary sources. Facilities required to obtain PSD permits for their GHG emissions also will be required to meet “best available control technology” standards that will be established by the states or, in some cases, by the EPA on a case-by-case basis. The EPA has also adopted rules requiring the monitoring and reporting of GHG emissions from specified sources in the United States, including, among others, certain oil and natural gas production facilities on an annual basis, which includes certain of our operations. In addition, in August 2012, the EPA established new source performance standards for volatile organic compounds and sulfur dioxide and an air toxic standard for oil and natural gas production, transmission, and storage. The rules include the first federal air standards for natural gas wells that are hydraulically fractured, or refractured, as well as requirements for several other sources, such as storage tanks and other equipment, and limits methane emissions from these sources in an effort to reduce GHG emissions.
While Congress has from time to time considered legislation to reduce emissions of GHGs, there has not been significant activity in the form of adopted legislation to reduce GHG emissions at the federal level in recent years. In the absence of such federal climate legislation, a number of state and regional efforts have emerged that are aimed at tracking and/or reducing GHG emissions by means of cap and trade programs that typically require major sources of GHG emissions, such as electric power plants, to acquire and surrender emission allowances in return for emitting those GHGs. If Congress undertakes comprehensive tax reform in the coming year, it is possible that such reform may include a carbon tax, which could impose additional direct costs on operations and reduce demand for refined products. In any event, the Obama administration has announced its Climate Action Plan, which, among other things, directs federal agencies to develop a strategy for the reduction of methane emissions, including emissions from the oil and gas industry. As part of the Climate Action Plan, the Obama Administration also announced that it intends to adopt additional regulations to reduce emissions of GHGs and to encourage greater use of low carbon technologies in the coming years. Although it is not possible at this time to predict how legislation or new regulations that may be adopted to address GHG emissions would impact our business, any such future laws and regulations that require reporting of GHGs or otherwise limit emissions of GHGs from our equipment and operations could require us to incur costs to monitor and report on GHG emissions or reduce emissions of GHGs associated with our operations, and such requirements also could adversely affect demand for the oil and natural gas that we produce. Finally, it should be noted that some scientists have concluded that increasing concentrations of GHGs in the Earth’s atmosphere may produce climate
35
Table of Contents
changes that have significant physical effects, such as increased frequency and severity of storms, droughts and floods and other climatic events. If any such effects were to occur, they could have an adverse effect on our financial condition and results of operations. Please read “Business—Regulation of Environmental and Occupational Health and Safety Matters” for a further description of the laws and regulations that affect us.
The third parties on whom we rely for gathering and transportation services are subject to complex federal, state and other laws that could adversely affect the cost, manner or feasibility of conducting our business.
The operations of the third parties on whom we rely for gathering and transportation services are subject to complex and stringent laws and regulations that require obtaining and maintaining numerous permits, approvals and certifications from various federal, state and local government authorities. These third parties may incur substantial costs in order to comply with existing laws and regulations. If existing laws and regulations governing such third-party services are revised or reinterpreted, or if new laws and regulations become applicable to their operations, these changes may affect the costs that we pay for such services. Similarly, a failure to comply with such laws and regulations by the third parties on whom we rely could have a material adverse effect on our business, financial condition and results of operations. See “Business—Regulation of Environmental and Occupational Health and Safety Matters” and “Business—Regulation of the Oil and Natural Gas Industry” for a description of the laws and regulations that affect the third parties on whom we rely.
Derivatives reform legislation and related regulations could have an adverse effect on our ability to hedge risks associated with our business.
The July 2010 Dodd-Frank Wall Street Reform and Consumer Protection Act, or the Dodd-Frank Act, provides for federal oversight of the over-the-counter derivatives market and entities that participate in that market and mandates that the Commodity Futures Trading Commission, or CFTC, adopt rules or regulations implementing the Dodd-Frank Act and providing definitions of terms used in the Dodd-Frank Act. The Dodd-Frank Act establishes margin requirements and requires clearing and trade execution practices for certain market participants and may result in certain market participants needing to curtail or cease their derivatives activities. Although many of the rules necessary to implement the Dodd-Frank Act remain to be adopted, the CFTC has issued a large number of rules to implement the Dodd-Frank Act, including a rule establishing an “end-user” exception to mandatory clearing, referred to herein as the “End-User Exception,” and a rule imposing position limits, referred to herein as the Position Limit Rule.
We qualify as a “non-financial entity” for purposes of the End-User Exception and, as such, we will be eligible for and expect to utilize such exception and, as a result, our hedging activity will not be subject to mandatory clearing or the margin requirements imposed in connection with mandatory clearing. However, most if not all of our hedge counterparties will be subject to mandatory clearing in connection with their hedging activities with parties who do not qualify for the End-User Exception. The Position Limit Rule was vacated and remanded to the CFTC for further proceedings by order of the United States District Court for the District of Columbia on September 28, 2012. The Dodd-Frank Act, the rules which have been adopted and not vacated, and, to the extent that a position limit rule is ultimately effected, could significantly increase the cost of derivative contracts (including through requirements to post collateral), materially alter the terms of derivative contracts, reduce the availability of derivatives to protect against risks we encounter, reduce our ability to monetize or restructure our existing derivative contracts, and increase our exposure to less creditworthy counterparties. If we reduce our use of derivatives as a result of the Dodd-Frank Act and regulations, our results of operations may become more volatile and our cash flows may be less predictable, which could adversely affect our ability to plan for and fund capital expenditures. Finally, the Dodd-Frank Act was intended, in part, to reduce the volatility of oil and natural gas prices, which some legislators attributed to speculative trading in derivatives and commodity contracts related to oil and natural gas. Our revenues could therefore be adversely affected if a consequence of the Dodd-Frank Act and regulations is to lower commodity prices. Any of these consequences could have a material adverse effect on us, our financial condition, and our results of operations.
36
Table of Contents
Federal and state legislative and regulatory initiatives relating to hydraulic fracturing could result in increased costs and additional operating restrictions or delays, and adversely affect our production.
Hydraulic fracturing is an essential and common practice in the oil and gas industry used to stimulate production of natural gas and/or oil from dense subsurface rock formations. Hydraulic fracturing involves using water, sand, and certain chemicals to fracture the hydrocarbon-bearing rock formation to allow flow of hydrocarbons into the wellbore. We routinely apply hydraulic fracturing techniques in our drilling and completion programs. While hydraulic fracturing has historically been regulated by state oil and natural gas commissions, the practice has become increasingly controversial in certain parts of the country, resulting in increased scrutiny and regulation. For example, the EPA has asserted federal regulatory authority over certain hydraulic-fracturing activities under the Safe Drinking Water Act, or the SDWA, involving the use of diesel fuels and published permitting guidance in February 2014 addressing the use of diesel in fracturing operations. Although the EPA is not the permitting authority for the SDWA’s Underground Injection Control Class II programs in Louisiana, Texas, Wyoming, New Mexico, or Colorado, where we or MEMP maintain operational acreage, the EPA is encouraging state programs to review and consider use of such draft guidance. Also, in October 2011, the EPA announced its plan to propose federal pre-treatment standards for wastewater generated during the hydraulic fracturing process. Hydraulic fracturing stimulation requires the use of a significant volume of water with some resulting “flowback,” as well as “produced water.” If adopted, the new pretreatment rules will require shale gas operations to pretreat wastewater before transferring it to treatment facilities. Proposed rules are expected sometime in 2014. Moreover, the EPA has indicated that it may develop and issue regulations under the Toxic Substances Control Act to require companies to disclose information regarding the chemicals used in hydraulic fracturing; however, to date, it has taken no action to do so.
In August 2012, the EPA adopted rules that subject oil and natural gas production, processing, transmission, and storage operations to regulation under the New Source Performance Standards, or NSPS, and National Emission Standards for Hazardous Air Pollutants programs. In April 2013 EPA issued a proposed revision which may impact the scope of these rules. The EPA’s final rule includes NSPS standards for completions of hydraulically fractured wells and establishes specific new requirements for emissions from compressors, controllers, dehydrators, storage vessels, natural gas processing plants and certain other equipment. The rule is designed to limit emissions of volatile organic compounds, or VOCs, sulfur dioxide, and hazardous air pollutants from a variety of sources within natural gas processing plants, oil and natural gas production facilities, and natural gas transmission compressor stations. The EPA’s rule requires the reduction of VOC emissions from oil and natural gas production facilities by mandating the use of “green completions” for hydraulic fracturing, which requires the operator to recover rather than vent the gas and natural gas liquids that come to the surface during completion of the fracturing process. Under the rule, green completions will be phased in, and are not mandatory until January 2015. This rule could require a number of modifications to our operations including the installation of new equipment. Compliance with such rules could result in significant costs, including increased capital expenditures and operating costs, and could adversely impact our business.
In addition, in May 2013, the federal Bureau of Land Management published a supplemental notice of proposed rulemaking governing hydraulic fracturing on federal and Indian lands that replaces a prior draft of proposed rulemaking issued by the agency in May 2012. The revised proposed rule would continue to require public disclosure of chemicals used in hydraulic fracturing on federal and Indian lands, confirmation that wells used in fracturing operations meet appropriate construction standards, and development of appropriate plans for managing flowback water that returns to the surface.
There are also certain governmental reviews either underway or being proposed that focus on environmental aspects of hydraulic fracturing practices. The EPA has commenced a study of the potential environmental effects of hydraulic fracturing on drinking water and groundwater. A draft report is expected to be released for public comment and review in late 2014 with the final report expected to be completed sometime in 2016. The EPA’s study could spur initiatives to further regulate hydraulic fracturing under the SDWA or other regulatory mechanisms. Other governmental agencies, including the U.S. Department of Energy and the U.S. Department of
37
Table of Contents
the Interior, have evaluated or are evaluating various other aspects of hydraulic fracturing. These ongoing or proposed studies, depending on their degree of pursuit and any meaningful results obtained, could spur initiatives to further regulate hydraulic fracturing under the federal Safe Drinking Water Act or other regulatory mechanisms.
Additionally, Congress from time to time has considered the adoption of legislation to provide for federal regulation of hydraulic fracturing and to require disclosure of the chemicals used in the hydraulic fracturing process. Certain states, including Texas and Colorado, have adopted, and other states are considering adopting, regulations that could impose more stringent permitting, public disclosure, and well construction requirements on hydraulic-fracturing operations or otherwise seek to ban fracturing activities altogether. For example in May 2013, the Texas Railroad Commission adopted new rules governing well casing, cementing and other standards for ensuring that hydraulic fracturing operations do not contaminate nearby water resources. In addition to state laws, local land use restrictions, such as city ordinances, may restrict or prohibit the performance of well drilling in general and/or hydraulic fracturing in particular. In the event state, local, or municipal legal restrictions are adopted in areas where we are currently conducting, or in the future plan to conduct operations, we may incur additional costs to comply with such requirements that may be significant in nature, experience delays or curtailment in the pursuit of exploration, development, or production activities, and perhaps even be precluded from the drilling of wells.
If these or any other new laws or regulations that significantly restrict hydraulic fracturing are adopted at the state and local level, such laws could make it more difficult or costly for us to perform fracturing to stimulate production from dense subsurface rock formations and, in the event of local prohibitions against commercial production of natural gas, may preclude our ability to drill wells. In addition, if hydraulic fracturing becomes regulated at the federal level as a result of federal legislation or regulatory initiatives by the EPA or other federal agencies, our fracturing activities could become subject to additional permitting requirements and result in permitting delays as well as potential increases in costs. Restrictions on hydraulic fracturing could also reduce the amount of oil and natural gas that we are ultimately able to produce from our reserves.
Oil and natural gas producers’ operations, especially those using hydraulic fracturing, are substantially dependent on the availability of water. Restrictions on the ability to obtain water may impact our operations.
Water is an essential component of oil and natural gas production during the drilling, and in particular, hydraulic fracturing, process. Our inability to locate sufficient amounts of water, or dispose of or recycle water used in our exploration and production operations, could adversely impact our operations. Moreover, the imposition of new environmental initiatives and regulations could include restrictions on our ability to conduct certain operations such as hydraulic fracturing or disposal of waste, including, but not limited to, produced water, drilling fluids and other wastes associated with the exploration, development or production of natural gas. The Federal Water Pollution Control Act (the “CWA”) imposes restrictions and strict controls regarding the discharge of produced waters and other natural gas and oil waste into navigable waters. Permits must be obtained to discharge pollutants to waters and to conduct construction activities in waters and wetlands. The CWA and similar state laws provide for civil, criminal and administrative penalties for any unauthorized discharges of pollutants and unauthorized discharges of reportable quantities of oil and other hazardous substances. State and federal discharge regulations prohibit the discharge of produced water and sand, drilling fluids, drill cuttings and certain other substances related to the natural gas and oil industry into coastal waters. Also, the EPA has adopted regulations requiring certain natural gas and oil exploration and production facilities to obtain permits for storm water discharges. Compliance with current and future environmental regulations and permit requirements governing the withdrawal, storage and use of surface water or groundwater necessary for hydraulic fracturing of wells may increase our operating costs and cause delays, interruptions or termination of our operations, the extent of which cannot be predicted.
38
Table of Contents
We are not the only partners in MEMP, and MEMP’s partnership agreement requires it to distribute all available cash to its partners, including public unitholders.
MEMP is a publicly traded limited partnership. We own MEMP GP, the sole general partner of MEMP, and are entitled to 50% of any cash distributed in respect of MEMP’s incentive distribution rights. We also own 5,360,912 subordinated units representing a 8.7% limited partner interest in MEMP. The remainder of the outstanding limited partner interests in MEMP are common units owned by public unitholders. MEMP’s partnership agreement requires it to distribute, on a quarterly basis, 100% of its available cash to its partners. We receive only our proportionate share of cash distributions from MEMP based on our partner interests in it. The remainder of the quarterly cash distributions is distributed, pro rata, to the public unitholders (and, in the case of 50% of the incentive distribution rights, to the Funds).
For MEMP, available cash is generally all cash on hand at the end of each quarter, after payment of fees and expenses and the establishment of cash reserves by its general partner. MEMP GP determines the amount and timing of cash distributions by MEMP and has broad discretion to establish and make additions to MEMP’s reserves in amounts the general partner determines to be necessary or appropriate:
| • | to provide for the proper conduct of partnership business, which could include, but is not limited to, amounts reserved for capital expenditures, working capital and operating expenses; |
| • | to comply with applicable law, any of MEMP’s debt instruments or other agreements; and |
| • | to provide funds for distributions to the unitholders and the general partner for any one or more of the next four calendar quarters. |
Accordingly, cash distributions we receive on our MEMP partner interests may be reduced at any time, or we may not receive any cash distributions from MEMP.
Generally, our MEMP subordinated units will remain subordinated, and will not convert into MEMP common units, if and until MEMP has earned and paid aggregate distributions from operating surplus equal to or in excess of the minimum quarterly distribution for twelve consecutive quarters.
The amount of cash that MEMP will be able to distribute to us principally depends upon the amount of cash it can generate from its oil and natural gas production business.
A significant decline in MEMP’s earnings or cash distributions would have a negative impact on its distributions to its partners, including us. The amount of cash that MEMP will be able to distribute to its partners, including us, each quarter principally depends upon the amount of cash it can generate from its oil and natural gas production business. That amount of cash will fluctuate from quarter to quarter based on, among other things:
| • | the amount of oil, natural gas and NGLs MEMP produces; |
| • | the prices at which MEMP sells its oil, natural gas and NGL production; |
| • | the amount and timing of settlements of its commodity derivatives; |
| • | the level of MEMP’s operating costs, including maintenance capital expenditures and payments to MEMP GP and its affiliates; and |
| • | the level of MEMP’s interest expense, which depends on the amount of its indebtedness and the interest payable thereon. |
Because of these factors, MEMP may not have sufficient available cash each quarter to continue paying distributions at their current level or at all. In addition, our subordinated units in MEMP are only entitled to distributions from MEMP in any quarter if MEMP has paid at least the minimum quarterly distribution of $0.4750 on each outstanding common unit for such quarter, and our 50% incentive distribution rights are only
39
Table of Contents
entitled to distributions from MEMP in any quarter if MEMP has paid at least $0.54625 on each outstanding common unit and subordinated unit for such quarter. Furthermore, if MEMP is unable to pay its minimum quarterly distributions, the common units will accrue arrearages and such arrearages must be paid before we can receive distributions with respect to our subordinated units. If MEMP reduces its per unit distribution below such amounts, we will receive less cash.
Conflicts of interest may arise because the board of directors of MEMP GP has a fiduciary duty to manage the general partner in a manner that is beneficial to the owner of MEMP GP, and at the same time, to manage MEMP in a manner that is beneficial to the MEMP unitholders.
We own MEMP GP, the sole general partner of MEMP. MEMP is a publicly traded limited partnership. The board of directors of MEMP GP owes specified duties to the MEMP unitholders, and also owes specified duties to us as owner of MEMP GP. As a result of these conflicts, the board of directors of MEMP GP may favor the interests of the MEMP public unitholders over our interests.
If MEMP’s unitholders remove MEMP GP, we would lose our general partner interest and incentive distribution rights in MEMP and the ability to manage MEMP.
We currently manage our investment in MEMP through our ownership interest in MEMP GP. MEMP’s partnership agreement, however, gives unitholders of MEMP the right to remove its general partner upon the affirmative vote of holders of 66 2/3% of the MEMP’s outstanding units. If MEMP GP were removed as general partner of MEMP, it would receive cash or common units in exchange for its 0.1% general partner interest and incentive distribution rights and would also lose its ability to manage MEMP. While the cash or common units the general partner would receive are intended under the terms of MEMP’s partnership agreement to fully compensate MEMP GP in the event such an exchange is required, the value of the investments we make with the cash or the common units may not over time be equivalent to the value of the general partner interest and the incentive distribution rights had MEMP GP retained them.
Restrictions in our existing and future debt agreements could limit our growth and our ability to engage in certain activities.
We have, and after the consummation of this offering will continue to have, a substantial amount of indebtedness. As of December 31, 2013, on a pro forma basis and after giving effect to this offering, the transactions described in “Restructuring Transactions” and the application of the net proceeds therefrom, we would have had aggregate indebtedness of approximately $ million. The terms and conditions governing our indebtedness:
| • | require us to dedicate a substantial portion of our cash flow from operations to service our existing debt, thereby reducing the cash available to finance our operations and other business activities and could limit our flexibility in planning for or reacting to changes in our business and the industry in which we operate; |
| • | increase our vulnerability to economic downturns and adverse developments in our business; |
| • | limit our ability to access the capital markets to raise capital on favorable terms or to obtain additional financing for working capital, capital expenditures or acquisitions or to refinance existing indebtedness; |
| • | place restrictions on our ability to obtain additional financing, make investments, lease equipment, sell assets and engage in business combinations; |
| • | place us at a competitive disadvantage relative to competitors with lower levels of indebtedness in relation to their overall size or less restrictive terms governing their indebtedness; and |
| • | limit management’s discretion in operating our business. |
40
Table of Contents
Our ability to meet our expenses and debt obligations will depend on our future performance, which will be affected by financial, business, economic, regulatory and other factors. We will not be able to control many of these factors, such as economic conditions and governmental regulation. We cannot be certain that our cash flow will be sufficient to allow us to pay the principal and interest on our debt and meet our other obligations. If we do not have enough money, we may be required to refinance all or part of our existing debt, sell assets, borrow more money or raise equity. We may not be able to refinance our debt, sell assets, borrow more money or raise equity on terms acceptable to us, if at all. For example, our existing and future debt agreements will require that we satisfy certain conditions, including coverage and leverage ratios, to borrow money. Our existing and future debt agreements will also restrict the payment of dividends and distributions by certain of our subsidiaries to us, which could affect our access to cash. In addition, our ability to comply with the financial and other restrictive covenants in our indebtedness will be affected by the levels of cash flow from our operations and future events and circumstances beyond our control. Failure to comply with these covenants would result in an event of default under our indebtedness, and such an event of default could adversely affect our business, financial condition and results of operations.
We may not be able to generate enough cash flow to meet our debt obligations and may be forced to take other actions to satisfy our debt obligations which may not be successful.
We expect our earnings and cash flow to vary significantly from year to year due to the cyclical nature of our industry. As a result, the amount of debt that we can service in some periods may not be appropriate for us in other periods. Moreover, and subject to certain limitations, we and our subsidiaries may be able to incur substantial additional indebtedness in the future. Additionally, our future cash flow may be insufficient to meet our debt obligations and commitments. Any insufficiency could negatively impact our business. A range of economic, competitive, business and industry factors will affect our future financial performance, and, as a result, our ability to generate cash flow from operations and from our subsidiaries and to pay our debt. Many of these factors, such as oil and natural gas prices, economic and financial conditions in our industry and the global economy or competitive initiatives of our competitors, are beyond our control.
If we do not generate enough cash flow from operations and from our subsidiaries to satisfy our debt obligations, we may have to undertake alternative financing plans, such as:
| • | refinancing or restructuring our debt; |
| • | selling assets; |
| • | reducing or delaying capital investments; or |
| • | seeking to raise additional capital. |
However, we cannot assure you that undertaking alternative financing plans, if necessary, would allow us to meet our debt obligations. Our inability to generate sufficient cash flow to satisfy our debt obligations or to obtain alternative financing, could materially and adversely affect our ability to make payments on our indebtedness and our business, financial condition and results of operations.
Furthermore, our ability to restructure or refinance our indebtedness will depend on the condition of the capital markets and our financial condition at such time. Any refinancing of our indebtedness could be at higher interest rates and may require us to comply with more onerous covenants, which could further restrict our business operations. The terms of existing or future debt instruments, including our new revolving credit facility, may restrict us from adopting some of these alternatives. In addition, any failure to make payments of interest and principal on our outstanding indebtedness on a timely basis would likely result in a reduction of our credit rating, which could harm our ability to incur additional indebtedness. In the absence of sufficient cash flows and capital resources, we could face substantial liquidity problems and might be required to dispose of material assets or operations to meet our debt service and other obligations. Our existing debt instruments currently restrict, and we expect our new revolving credit facility will restrict, our ability to dispose of assets and our use of the
41
Table of Contents
proceeds from such disposition. We may not be able to consummate those dispositions, and the proceeds of any such disposition may not be adequate to meet any debt service obligations then due. These alternative measures may not be successful and may not permit us to meet our scheduled debt service obligations.
Risks Relating to this Offering and Our Common Stock
There is no existing market for our common stock, and we do not know if one will develop, which could impede your ability to sell your shares and may depress the market price of our common stock.
There has not been a public market for our common stock prior to this offering. We cannot predict the extent to which investor interest in us will lead to the development of an active trading market or how liquid that market might become. If an active trading market does not develop, you may have difficulty selling any of our common stock that you buy. The initial public offering price for the common stock will be determined by negotiations between us, MRD LLC and the underwriters and may not be indicative of prices that will prevail in the open market following this offering. See “Underwriting.” Consequently, you may be unable to sell our common stock at prices equal to or greater than the price you pay in this offering.
The underwriters of this offering may waive or release parties to the lock-up agreements entered into in connection with this offering, which could adversely affect the price of our common stock.
MRD LLC, certain former management members of WildHorse Resources and our directors and executive officers have entered into lock-up agreements with respect to their common stock, pursuant to which they are subject to certain resale restrictions for a period of 180 days following the date of this prospectus. Citigroup Global Markets Inc., at any time, may release all or any portion of the common stock subject to the foregoing lock-up agreements. If the restrictions under the lock-up agreements are waived, then common stock will be available for sale into the public markets, which could cause the market price of our common stock to decline and impair our ability to raise capital.
If securities or industry analysts do not publish research or reports about our business, if they adversely change their recommendations regarding our common stock or if our operating results do not meet their expectations, our stock price could decline.
The trading market for our common stock will be influenced by the research and reports that industry or securities analysts publish about us or our business. If one or more of these analysts cease coverage of our company or fail to publish reports on us regularly, we could lose visibility in the financial markets, which in turn could cause our stock price or trading volume to decline. Moreover, if one or more of the analysts who cover our company downgrades our common stock or if our operating results do not meet their expectations, our stock price could decline.
NGP controls more than a majority of our common stock, and its interests may conflict with those of our other stockholders.
Upon completion of this offering, NGP, through the Funds, will beneficially own in the aggregate approximately % of the combined voting power of our common stock (or approximately % if the underwriters option to purchase additional shares of common stock from MRD LLC is exercised in full). In connection with the completion of this offering, MRD LLC and certain former management members of WildHorse Resources will enter into a voting agreement, pursuant to which, they will agree, among other things, to vote all of their shares in a manner consistent with the shares voted by MRD LLC. As a result, NGP will be able to control matters requiring stockholder approval, including the election of directors, changes to our organizational documents and significant corporate transactions. This concentration of ownership makes it unlikely that any other holder or group of holders of our common stock will be able to affect the way we are managed or the direction of our business. The interests of NGP with respect to matters potentially or actually
42
Table of Contents
involving or affecting us, such as future acquisitions, financings and other corporate opportunities and attempts to acquire us, may conflict with the interests of our other stockholders. Given this concentrated ownership, NGP would have to approve any potential acquisition. In addition, certain of our directors are currently employees of NGP. These directors’ duties as employees of NGP may conflict with their duties as our directors, and the resolution of these conflicts may not always be in our or your best interest.
Many of the directors and all of the officers who have responsibility for our management have significant duties with, and spend significant time serving, entities that may compete with us in seeking acquisitions and business opportunities and, accordingly, may have conflicts of interest in allocating time or pursuing business opportunities.
All of our officers hold similar positions with MRD LLC and MEMP GP, and many of our directors, who are responsible for managing the direction of our operations and acquisition activities, hold positions of responsibility with other entities (including NGP-affiliated entities) that are in the business of identifying and acquiring oil and natural gas properties. For example, the Funds and their affiliates (including NGP) are in the business of investing in oil and natural gas companies with independent management teams that also seek to acquire oil and natural gas properties, and MRD LLC and MEMP are both in the business of acquiring and developing oil and natural gas properties. Mr. Hersh, one of our directors, is a managing partner of NGP; Mr. Gieselman, one of our directors, is a managing director of NGP; Mr. Weber, one of our directors, is a managing partner of NGP and serves as Chief Operating Officer for NGP; and Mr. Weinzierl, our Chief Executive Officer and one of our directors, is the Chief Executive Officer and Chairman of MEMP GP, and was a managing director and operating partner of NGP and continues to hold ownership interests in the Funds and certain of their affiliates. Our officers will continue to devote significant time to the business of MEMP and MRD LLC. We cannot assure you that any conflicts that may arise between us and our stockholders, on the one hand, and MRD LLC, MEMP, or the Funds, on the other hand, will be resolved in our favor. The existing positions held by these directors and officers may give rise to fiduciary or other duties that are in conflict with the duties they owe to us. These officers and directors may become aware of business opportunities that may be appropriate for presentation to us as well as to the other entities with which they are or may become affiliated. Due to these existing and potential future affiliations, they may present potential business opportunities to other entities prior to presenting them to us, which could cause additional conflicts of interest. They may also decide that certain opportunities are more appropriate for other entities with which they are affiliated, and as a result, they may elect not to present those opportunities to us. These conflicts may not be resolved in our favor. For additional discussion of our management’s business affiliations and the potential conflicts of interest of which our stockholders should be aware, see “Certain Relationships and Related Party Transactions.”
The corporate opportunity provisions in our amended and restated certificate of incorporation could enable NGP and the Funds to benefit from corporate opportunities that might otherwise be available to us.
Subject to the limitations of applicable law, our amended and restated certificate of incorporation, among other things:
| • | permits us to enter into transactions with entities in which one or more of our officers or directors are financially or otherwise interested; |
| • | permits any of our stockholders, officers or directors to conduct business that competes with us and to make investments in any kind of property in which we may make investments; and |
| • | provides that if any director or officer of one of our affiliates who is also one of our officers or directors becomes aware of a potential business opportunity, transaction or other matter (other than one expressly offered to that director or officer in writing solely in his or her capacity as our director or officer), that director or officer will have no duty to communicate or offer that opportunity to us, and will be permitted to communicate or offer that opportunity to such affiliates and that director or officer will not be deemed to have (1) acted in a manner inconsistent with his or her fiduciary or other duties to us regarding the opportunity or (2) acted in bad faith or in a manner inconsistent with our best interests. |
43
Table of Contents
As a result, NGP, the Funds or their affiliates may become aware, from time to time, of certain business opportunities (such as acquisition opportunities) and may direct such opportunities to other businesses in which they have invested, in which case we may not become aware of or otherwise have the ability to pursue such opportunity. Further, such businesses may choose to compete with us for these opportunities. As a result, our renouncing our interest and expectancy in any business opportunity that may be from time to time presented to NGP or the Funds and their affiliates could adversely impact our business or prospects if attractive business opportunities are procured by such parties for their own benefit rather than for ours. Please read “Description of Capital Stock.”
We will be a “controlled company” within the meaning of the NASDAQ rules and, as a result, will qualify for, and intend to rely on, exemptions from certain corporate governance requirements.
Upon the closing of this offering, MRD LLC and certain former management members of WildHorse Resources, as a group, will continue to control a majority of our voting common stock. As a result, we will be a “controlled company” within the meaning of applicable corporate governance standards. Under the NASDAQ rules, a company of which more than 50% of the voting power is held by an individual, group or another company is a “controlled company” and may elect not to comply with certain corporate governance requirements, including:
| • | the requirement that we have a majority of independent directors on our Board; |
| • | the requirement that we have a nominating committee that is composed entirely of independent directors with a written charter addressing the committee’s purpose and responsibilities; |
| • | the requirement that we have a compensation committee that is composed entirely of independent directors; and |
| • | the requirement for an annual performance evaluation of the nominating and compensation committees. |
Following this offering, we intend to utilize the foregoing exemptions from the applicable corporate governance requirements. As a result, we will not have a majority of independent directors. In addition, our compensation committee will not consist entirely of independent directors and we will not be required to have an annual performance evaluation of the compensation committee. See “Management.” Accordingly, you will not have the same protections afforded to stockholders of companies that are subject to all of the applicable corporate governance requirements.
The price of our common stock may fluctuate significantly and you could lose all or part of your investment.
Volatility in the market price of our common stock may prevent you from being able to sell your common stock at or above the price you paid for your common stock. The market price for our common stock could fluctuate significantly for various reasons, including:
| • | our operating and financial performance and prospects; |
| • | changes in earnings estimates or recommendations by securities analysts who track our common stock or industry; |
| • | market and industry perception of our success, or lack thereof, in pursuing our growth strategy; and |
| • | sales of common stock by us, our stockholders (including the Funds), or members of our management team. |
In addition, the stock market has experienced significant price and volume fluctuations in recent years. This volatility has had a significant impact on the market price of securities issued by many companies, including companies in our industries. The changes frequently appear to occur without regard to the operating performance of the affected companies. Hence, the price of our common stock could fluctuate based upon factors that have little or nothing to do with us, and these fluctuations could materially reduce our share price.
44
Table of Contents
We currently have no plans to pay regular dividends on our common stock, so you may not receive funds without selling your common stock.
We currently have no plans to pay regular dividends on our common stock. Any payment of dividends in the future will be at the discretion of our Board and will depend on, among other things, our earnings, financial condition and business opportunities, the restrictions in our debt agreements, and other considerations that our Board deems relevant. Accordingly, you may have to sell some or all of your common stock in order to generate cash flow from your investment.
Future sales or the possibility of future sales of a substantial amount of our common stock may depress the price of shares of our common stock.
We may sell additional shares of common stock in subsequent public offerings or otherwise, including to finance acquisitions. Our amended and restated certificate of incorporation which we will adopt in connection with the closing of this offering will authorize us to issue shares of common stock, of which shares will be outstanding upon consummation of this offering. The outstanding share number includes shares that we and MRD LLC are selling in this offering, which may be resold immediately in the public market. The remaining outstanding shares are restricted from immediate resale under the lock-up agreements with the underwriters described in “Underwriting,” but may be sold into the market in the near future. Following the expiration of the applicable lock-up period, which is 180 days after the date of this prospectus, shares of our common stock will be freely transferable without restriction or further registration under the Securities Act, except for any such shares which are held or may be acquired by any of our “affiliates” as that term is defined in Rule 144 under the Securities Act, which will be subject to the resale limitations of Rule 144. See “Shares Eligible for Future Sale” for a discussion of the shares of our common stock that may be sold into the public market in the future.
MRD LLC and certain former management members of WildHorse Resources will be party to the Registration Rights Agreement, which will require us to effect the registration of their shares in certain circumstances no earlier than the expiration of the lock-up period contained in the underwriting agreement entered into in connection with this offering. Upon the effectiveness of such a registration statement, all shares covered by the registration statement would be freely transferable without restriction or further registration under the Securities Act, except for any such shares which are acquired by any of our “affiliates” as that term is defined in Rule 144 under the Securities Act, which will be subject to the resale limitations of Rule 144. See “Certain Relationships and Related Party Transactions—Registration Rights Agreement.”
As soon as practicable after this offering, we intend to file a registration statement with the SEC on Form S-8 providing for the registration of shares of our common stock issued or reserved for issuance under our Memorial Resource Development Corp. 2014 Incentive Award Plan that we plan to adopt prior to the completion of this offering. Subject to the satisfaction of vesting conditions and the expiration of lock-up agreements, shares registered under our registration statement on Form S-8 will be available for resale immediately in the public market without restriction.
We cannot predict the size of future issuances of our common stock or the effect, if any, that future issuances and sales of our common stock will have on the market price of our common stock. Sales of substantial amounts of our common stock (including any shares issued in connection with an acquisition), or the perception that such sales could occur, may adversely affect prevailing market prices for our common stock.
45
Table of Contents
Our organizational documents and the voting agreement may impede or discourage a takeover, which could deprive our investors of the opportunity to receive a premium for their shares.
Provisions of our amended and restated certificate of incorporation, our amended and restated bylaws to be effective upon the completion of this offering and the voting agreement may make it more difficult for, or prevent a third party from, acquiring control of us. These provisions include:
| • | requiring that certain former management members of WildHorse Resources vote all of their shares of our common stock, including with respect to the election of our directors, in a manner consistent with the votes cast by MRD LLC; |
| • | at such time as the Funds no longer beneficially own more than 50% of our outstanding common stock, our Board will be divided into three classes with each class serving staggered three year terms; |
| • | at such time as the Funds no longer beneficially own more than 50% of our outstanding common stock, any action by stockholders may only be taken at an annual meeting or special meeting and may no longer be effected by a written consent of the stockholders; |
| • | at such time as the Funds no longer beneficially own more than 50% of our outstanding common stock, special meetings of our stockholders may only be called by our Board, the chief executive officer or the chairman of our Board (prior to such time, a special meeting may also be called at the request of stockholders holding a majority of the outstanding shares entitled to vote); |
| • | at such time as the Funds no longer beneficially own more than 50% of our outstanding common stock, the affirmative vote of the holders of at least 75% in voting power of all then outstanding common stock entitled to vote generally in the election of directors, voting together as a single class, shall be required to remove any or all of the directors from office at any time; |
| • | prohibiting cumulative voting in the election of directors; and |
| • | authorizing the issuance of “blank check” preferred stock without any need for action by stockholders. |
Our issuance of shares of preferred stock could delay or prevent a change in control of us. Our Board has authority to issue shares of preferred stock without stockholder approval in one or more series, designate the number of shares constituting any series, and fix the rights, preferences, privileges and restrictions thereof, including dividend rights, voting rights, rights and terms of redemption, redemption price or prices and liquidation preferences of such series. The issuance of shares of our preferred stock may have the effect of delaying, deferring or preventing a change in control without further action by the stockholders, even where stockholders are offered a premium for their shares.
Together, our amended and restated certificate of incorporation, amended and restated bylaws and the voting agreement could make the removal of management more difficult and may discourage transactions that otherwise could involve payment of a premium over prevailing market prices for our common stock. Furthermore, the existence of the foregoing provisions, as well as the significant amount of common stock beneficially owned by the Funds following this offering, could limit the price that investors might be willing to pay in the future for shares of our common stock. They could also deter potential acquirers of us, thereby reducing the likelihood that you could receive a premium for your common stock in an acquisition. See “Description of Capital Stock—Anti-Takeover Effects of Provisions of Our Amended and Restated Certificate of Incorporation, our Amended and Restated Bylaws and Delaware Law.”
We have engaged in transactions with our affiliates and expect to do so in the future. The terms of such transactions and the resolution of any conflicts that may arise may not always be in our or our stockholders’ best interests.
We have engaged in transactions and expect to continue to engage in transactions with affiliated companies, as described under the caption “Certain Relationships and Related Party Transactions.” The resolution of any conflicts that may arise in connection with any related party transactions that we have entered into with the
46
Table of Contents
Partnership, the Funds or their affiliates, including pricing, duration or other terms of service, may not always be in our or our stockholders’ best interests because the Funds may have the ability to influence the outcome of these conflicts. For a discussion of potential conflicts, please read “—NGP controls more than a majority of our common stock, and its interests may conflict with those of our other stockholders.”
You will experience an immediate and substantial dilution in the net tangible book deficit of the common stock you purchase.
After giving effect to this offering and the other adjustments described in “Dilution,” we expect that our pro forma as adjusted net tangible book deficit as of December 31, 2013 would be $ per share. Based on an assumed initial public offering price of $ per share, the midpoint of the estimated offering range set forth on the cover page of this prospectus, you will experience immediate and substantial dilution of approximately $ per share in net tangible book deficit of the common stock you purchase in this offering. See “Dilution,” including the discussion of the effects on dilution from a change in the price of this offering.
We may issue preferred stock whose terms could adversely affect the voting power or value of our common stock.
Our amended and restated certificate of incorporation authorizes us to issue, without the approval of our stockholders, one or more classes or series of preferred stock having such designations, preferences, limitations and relative rights, including preferences over our common stock respecting dividends and distributions, as our Board may determine. The terms of one or more classes or series of preferred stock could adversely impact the voting power or value of our common stock. For example, we might grant holders of preferred stock the right to elect some number of our directors in all events or on the happening of specified events or the right to veto specified transactions. Similarly, the repurchase or redemption rights or liquidation preferences we might assign to holders of preferred stock could affect the residual value of the common stock. See “Description of Capital Stock—Limitation of Liability and Indemnification Matters.”
The additional requirements of having a class of publicly traded equity securities may strain our resources and distract management.
After the consummation of this offering, we will be subject to additional reporting requirements of the Securities and Exchange Act of 1934 (the “Exchange Act”), the Sarbanes-Oxley Act of 2002 and the Dodd-Frank Act. The Dodd-Frank Act effects comprehensive changes to public company governance and disclosures in the United States and will subject us to additional federal regulation. We cannot predict with any certainty the requirements of the regulations ultimately adopted or how the Dodd-Frank Act and such regulations will impact the cost of compliance for a company with publicly traded common stock. We are currently evaluating and monitoring developments with respect to the Dodd-Frank Act and other new and proposed rules and cannot predict or estimate the amount of the additional costs we may incur or the timing of such costs. These laws, regulations and standards are subject to varying interpretations, in many cases due to their lack of specificity, and, as a result, their application in practice may evolve over time as new guidance is provided by regulatory and governing bodies. This could result in continuing uncertainty regarding compliance matters and higher costs necessitated by ongoing revisions to disclosure and governance practices. We intend to invest resources to comply with evolving laws, regulations and standards, and this investment may result in increased general and administrative expenses and a diversion of management’s time and attention from revenue-generating activities to compliance activities. If our efforts to comply with new laws, regulations and standards differ from the activities intended by regulatory or governing bodies due to ambiguities related to practice, regulatory authorities may initiate legal proceedings against us and our business may be harmed. We also expect that being a company with publicly traded common stock and these new rules and regulations will make it more expensive for us to obtain director and officer liability insurance, and we may be required to accept reduced coverage or incur substantially higher costs to obtain coverage. These factors could also make it more difficult for us to attract and retain qualified members of our Board, particularly to serve on our audit committee, and qualified executive officers.
47
Table of Contents
The Sarbanes-Oxley Act requires that we maintain effective disclosure controls and procedures and internal control over financial reporting. These requirements may place a strain on our systems and resources. Under Section 404 of the Sarbanes-Oxley Act, we will be required to include a report of management on our internal control over financial reporting in our Annual Reports on Form 10-K beginning with the Form 10-K for the year ending December 31, 2014. In order to maintain and improve the effectiveness of our disclosure controls and procedures and internal control over financial reporting, significant resources and management oversight will be required. This may divert management’s attention from other business concerns, which could have a material adverse effect on our business, financial condition, results of operations and cash flows. If we are unable to conclude that our disclosure controls and procedures and internal control over financial reporting are effective, or if we are no longer an emerging growth company and our independent public accounting firm is unable to provide us with an unqualified report on our internal control over financial reporting in future years, investors may lose confidence in our financial reports and our stock price may decline.
We will remain an “emerging growth company” for up to five years. After we are no longer an “emerging growth company,” we expect to incur significant additional expenses and devote substantial management effort toward ensuring compliance with those requirements applicable to companies that are not “emerging growth companies,” including Section 404 of the Sarbanes-Oxley Act. Please read “—We will incur increased costs as a result of being a public company, which may significantly affect our financial condition.”
We will incur increased costs as a result of being a public company, which may significantly affect our financial condition.
As a public company, we will incur significant legal, accounting and other expenses that we did not incur as a private company. We will incur costs associated with our public company reporting requirements. We also anticipate that we will incur costs associated with corporate governance requirements, including requirements under the Sarbanes-Oxley Act, as well as rules implemented by the SEC and the Financial Industry Regulatory Authority. We expect these rules and regulations to increase our legal and financial compliance costs and to make some activities more time-consuming and costly, particularly after we are no longer an “emerging growth company.” We also expect these rules and regulations may make it more difficult and more expensive for us to obtain director and officer liability insurance and we may be required to accept reduced policy limits and coverage or incur substantially higher costs to obtain the same or similar coverage. As a result, it may be more difficult for us to attract and retain qualified individuals to serve on our Board or as executive officers.
We are an “emerging growth company” and we cannot be certain if the reduced disclosure requirements applicable to emerging growth companies will make our common stock less attractive to investors.
We are an “emerging growth company,” as defined in the JOBS Act, and we intend to take advantage of certain exemptions from various reporting requirements that are applicable to other public companies, including, but not limited to, not being required to comply with the auditor attestation requirements of Section 404 of the Sarbanes-Oxley Act, reduced disclosure obligations regarding executive compensation in our periodic reports and proxy statements, and exemptions from the requirements of holding a nonbinding advisory vote on executive compensation and stockholder approval of any golden parachute payments not previously approved. We intend to take advantage of these reporting exemptions until we are no longer an “emerging growth company.” We cannot predict if investors will find our common stock less attractive because we will rely on these exemptions. If some investors find our common stock less attractive as a result, there may be a less active trading market for our common stock and our stock price may be more volatile.
We will cease to be an “emerging growth company” upon the earliest of (i) the last day of the fiscal year in which we have $1.0 billion or more in annual revenues, (ii) the date on which we become a “large accelerated filer” (the fiscal year-end on which the total market value of our common equity securities held by non-affiliates is $700 million or more as of June 30), (iii) the date on which we issue more than $1.0 billion of non-convertible debt over a three-year period, or (iv) the last day of the fiscal year following the fifth anniversary of our initial public offering.
48
Table of Contents
In addition, Section 107 of the JOBS Act provides that an emerging growth company can take advantage of the extended transition period provided in Section 7(a)(2)(B) of the Securities Act for complying with new or revised accounting standards, but we have irrevocably opted out of the extended transition period and, as a result, we will adopt new or revised accounting standards on the relevant dates in which adoption of such standards is required for other public companies.
To the extent that we rely on any of the exemptions available to emerging growth companies, you will receive less information about our executive compensation and internal control over financial reporting than issuers that are not emerging growth companies. If some investors find our common stock to be less attractive as a result, there may be a less active trading market for our common stock and our stock price may be more volatile.
If we fail to maintain an effective system of internal controls, we may not be able to accurately report our financial results or prevent fraud. As a result, our shareholders could lose confidence in our financial reporting, which would harm our business and the trading price of our common stock.
Effective internal controls are necessary for us to provide reliable financial reports, prevent fraud and operate successfully as a public company. If we cannot provide reliable financial reports or prevent fraud, our reputation and operating results would be harmed. We cannot be certain that our efforts to maintain our internal controls will be successful, that we will be able to maintain adequate controls over our financial processes and reporting in the future or that we will be able to comply with our obligations under Section 404 of the Sarbanes Oxley Act of 2002. Any failure to maintain effective internal controls, or difficulties encountered in implementing or improving our internal controls, could harm our operating results or cause us to fail to meet our reporting obligations. Ineffective internal controls could also cause investors to lose confidence in our reported financial information, which would likely have a negative effect on the trading price of our common stock.
49
Table of Contents
CAUTIONARY NOTE REGARDING FORWARD-LOOKING STATEMENTS
This prospectus contains “forward-looking statements.” Forward-looking statements are subject to a number of risks and uncertainties, many of which are beyond our control. All statements, other than statements of historical fact included in this prospectus, are forward-looking statements. When used in this prospectus, the words “could,” “should,” “will,” “believe,” “anticipate,” “intend,” “estimate,” “expect,” “may,” “continue,” “predict,” “plan,” “potential,” “pursue,” “target,” “project,” “forecast,” the negative of such terms, or other similar expressions are intended to identify forward-looking statements, although not all forward-looking statements contain such identifying words.
Forward-looking statements may include statements about:
| • | our business strategy; |
| • | our estimated reserves and the present value thereof; |
| • | our technology; |
| • | our cash flows and liquidity; |
| • | our financial strategy, budget, projections and future operating results; |
| • | realized commodity prices; |
| • | timing and amount of future production of reserves; |
| • | availability of drilling and production equipment; |
| • | availability of pipeline capacity; |
| • | availability of oilfield labor; |
| • | the amount, nature and timing of capital expenditures, including future development costs; |
| • | availability and terms of capital; |
| • | drilling of wells, including statements made about future horizontal drilling activities; |
| • | competition; |
| • | government regulations; |
| • | marketing of production; |
| • | exploitation or property acquisitions; |
| • | costs of exploiting and developing our properties and conducting other operations; |
| • | general economic and business conditions; |
| • | competition in the oil and natural gas industry; |
| • | effectiveness of our risk management activities; |
| • | environmental and other liabilities; |
| • | counterparty credit risk; |
| • | taxation of the oil and natural gas industry; |
| • | developments in other countries that produce oil and natural gas; |
| • | uncertainty regarding future operating results; |
| • | plans and objectives of management; and |
| • | plans, objectives, expectations and intentions contained in this prospectus that are not historical. |
50
Table of Contents
These types of statements, other than statements of historical fact included in this prospectus, are forward-looking statements. These forward-looking statements may be found in “Summary,” “Risk Factors,” “Management’s Discussion and Analysis of Financial Condition and Results of Operations” and other sections of this prospectus. These statements discuss future expectations, contain projections of results of operations or of financial condition or include other “forward-looking” information. These forward-looking statements involve risks and uncertainties. Important factors that could cause our actual results or financial condition to differ materially from our expectations include, but are not limited to, the following risks and uncertainties:
| • | variations in the market demand for, and prices of, oil, natural gas and NGLs; |
| • | uncertainties about our estimated reserves; |
| • | the adequacy of our capital resources and liquidity including, but not limited to, access to additional borrowing capacity under our new revolving credit facility; |
| • | general economic and business conditions; |
| • | risks associated with negative developments in the capital markets; |
| • | failure to realize expected value creation from property acquisitions; |
| • | uncertainties about our ability to replace reserves and economically develop our current reserves; |
| • | drilling results; |
| • | potential financial losses or earnings reductions from our commodity price risk management programs; |
| • | adoption or potential adoption of new governmental regulations; |
| • | the availability of capital on economic terms to fund our capital expenditures and acquisitions; |
| • | risks associated with our substantial indebtedness; and |
| • | our ability to satisfy future cash obligations and environmental costs. |
The forward-looking statements contained in this prospectus are largely based on our expectations, which reflect estimates and assumptions made by our management. These estimates and assumptions reflect our best judgment based on currently known market conditions and other factors. Although we believe such estimates and assumptions to be reasonable, they are inherently uncertain and involve a number of risks and uncertainties that are beyond our control. In addition, management’s assumptions about future events may prove to be inaccurate. All readers are cautioned that the forward-looking statements contained in this prospectus are not guarantees of future performance, and we cannot assure any reader that such statements will be realized or that the events or circumstances described in any forward-looking statement will occur. Actual results may differ materially from those anticipated or implied in the forward-looking statements due to factors described in the “Risk Factors” section of this prospectus and elsewhere in this prospectus. All forward-looking statements speak only as of the date on which they are made. We do not intend to update or revise any forward-looking statements as a result of new information, future events or otherwise. These cautionary statements qualify all forward-looking statements attributable to us or persons acting on our behalf.
51
Table of Contents
Assuming an initial public offering price of $ per share, the midpoint of the range set forth on the cover page of this prospectus, we estimate that we will receive net proceeds from this offering of approximately $ million, after deducting underwriting discounts and commissions and fees and expenses associated with this offering and the restructuring transactions of $ million payable by us.
The following table illustrates our use of proceeds of this offering and borrowings under our new revolving credit facility:
| Sources of Cash (In millions) |
Uses of Cash (In millions) |
|||||||||
| Net proceeds from this offering |
$ | Redemption of PIK notes(1) |
$ | |||||||
| Borrowings under our new revolving credit facility |
Cash consideration to certain former management members of WildHorse Resources(2) |
|||||||||
| Repayment of outstanding borrowings under WildHorse Resources’ credit agreements(2) |
||||||||||
| General corporate purposes |
||||||||||
|
|
|
|
|
|||||||
| Total |
$ | Total |
$ | |||||||
|
|
|
|
|
|||||||
| (1) | Includes the payment of principal plus any applicable premium and accrued and unpaid interest, if any, to the date of redemption, which we expect will be 30 days after the closing of this offering. Until such redemption date, we will use the amount to be paid to the holders of the PIK notes to temporarily reduce amounts outstanding under our new revolving credit facility. |
| (2) | Please see “Restructuring Transactions” for additional discussion of the cash consideration that will be paid to certain former management members of WildHorse Resources and “Management Discussion and Analysis of Financial Condition and Results of Operations—Debt Agreements—MRD Segment—WildHorse Resources Revolving Credit Facility and Second Lien Facility (To Be Terminated at Closing)” for a description of the repayment of outstanding borrowings under WildHorse Resources’ credit agreements that will be made in connection with the restructuring transactions. |
We will not receive any proceeds from the sale of shares of our common stock by MRD LLC, including pursuant to any exercise by the underwriters of their option to purchase additional shares of our common stock. MRD LLC is deemed under federal securities laws to be an underwriter with respect to the common stock it may sell in connection with this offering.
Each $1.00 increase (decrease) in the assumed initial public offering price of $ per share would increase (decrease) the net proceeds to us from this offering by $ million, assuming the number of shares offered by us, as set forth on the cover page of this prospectus, remains the same and after deducting the estimated underwriting discounts and commissions and estimated expenses payable by us. An increase (decrease) of 1,000,000 in the number of shares we are offering would increase (decrease) the net proceeds to us from this offering, after deducting the estimated underwriting discounts and commissions and estimated expenses payable by us, by approximately $ million, assuming the initial public offering price per share remains the same.
The PIK notes bear interest at the rate of 10.00% per annum if paid in cash and 10.75% per annum if paid as PIK interest and mature on December 15, 2018. MRD LLC used the net proceeds from the offering of the PIK notes after paying offering expenses to repay all amounts outstanding under its senior secured credit facility, to fund a debt service reserve account for the payment of interest on the PIK notes, to pay a distribution to the Funds and for general company purposes. In connection with the closing of this offering, we will enter into a new revolving credit facility and use borrowings under that agreement, together with a portion of the net proceeds of this offering, to repay outstanding borrowings under WildHorse Resources’ credit agreements, which will be terminated upon repayment. Borrowings under WildHorse Resources’ credit agreements were used to acquire assets, to make capital expenditures and for other general corporate purposes. See “Management’s Discussion and Analysis of Financial Condition and Results of Operations—Debt Agreements—MRD Segment.”
52
Table of Contents
We do not anticipate declaring or providing any cash dividends to holders of our common stock in the foreseeable future. We currently intend to retain all future earnings, if any, for use in the operation of our business and to fund future growth. The decision whether to pay dividends in the future will be made by our Board in light of conditions then existing, including factors such as our financial condition, earnings, available cash, business opportunities, legal requirements, restrictions in our debt agreements, and other contracts and other factors our Board deems relevant.
53
Table of Contents
The following table shows our predecessor’s cash and cash equivalents and our predecessor’s capitalization as of December 31, 2013:
| • | on an actual basis; and |
| • | on an as adjusted basis to give effect to (i) the restructuring transactions described under “Restructuring Transactions,” (ii) borrowing $ million under our new revolving credit facility to repay outstanding borrowings under WildHorse Resources’ credit agreements, and (iii) the issuance and sale of shares of common stock in this offering by us and our application of the net proceeds as described under “Use of Proceeds.” |
You should read this table together with “Restructuring Transactions,” “Use of Proceeds,” and “Management’s Discussion and Analysis of Financial Condition and Results of Operations” and the pro forma and historical consolidated financial statements included elsewhere in this prospectus. For a description of the pro forma adjustments, please read our Unaudited Pro Forma Combined Financial Statements.
| At December 31, 2013 | ||||||||
| Actual | As Adjusted | |||||||
| Cash and cash equivalents(1) |
$ | 77,721 | ||||||
| Restricted cash(2) |
50,000 | |||||||
| Long-term debt: |
||||||||
| MRD Segment: |
||||||||
| WildHorse Resources revolving credit facility |
203,100 | |||||||
| WildHorse Resources second lien term loan |
325,000 | |||||||
| MRD senior secured revolving credit facility |
— | |||||||
| 10.00%/10.75% Senior PIK Toggle Notes due 2018 |
343,050 | |||||||
| MEMP Segment: |
||||||||
| MEMP revolving credit facility |
103,000 | |||||||
| 7.625% senior notes due 2021 |
689,067 | |||||||
|
|
|
|
|
|||||
| Total long-term debt |
1,663,217 | — | ||||||
| Members’ equity: |
||||||||
| MRD LLC members’ equity |
277,517 | |||||||
| Stockholders’ equity: |
||||||||
| Common stock, $0.01 par value, 1,000 shares authorized, 100 shares issued and outstanding (historical); shares authorized, shares issued and outstanding |
— | |||||||
| Additional paid-in capital |
— | |||||||
| Accumulated deficit |
— | |||||||
|
|
|
|
|
|||||
| Total Memorial Resource Development Corp. stockholders’ equity |
— | |||||||
| Noncontrolling interest |
580,615 | |||||||
|
|
|
|
|
|||||
| Total capitalization |
2,521,349 | — | ||||||
|
|
|
|
|
|||||
| (1) | Includes $13.1 million of cash and cash equivalents related to MEMP and its subsidiaries. |
| (2) | $50 million of restricted cash is held in the debt service reserve account to secure payments of interest and certain other payments on the PIK notes of which $32 million (net of $18 million to be used to pay accrued interest on the PIK notes on June 15, 2014) is to be retained by MRD LLC in the restructuring transactions and released to MRD LLC upon redemption of the PIK notes (which we expect will be 30 days after the closing of this offering). |
54
Table of Contents
Dilution is the amount by which the offering price paid by the purchasers of the common stock to be sold in this offering exceeds the net tangible book value (deficit) per share of common stock after the offering. Net tangible book value per share is determined at any date by subtracting our total liabilities from the total book value of our tangible assets and dividing the difference by the number of shares of common stock deemed to be outstanding at that date. There will be shares of our common stock reserved for future awards under the Memorial Resource Development Corp. 2014 Incentive Award Plan as of the consummation of this offering.
Our net tangible book value as of December 31, 2013 was $ million, or $ per share. After giving effect to the receipt of approximately $ million of estimated net proceeds from our sale of shares of common stock in this offering at an assumed offering price of $ per share, which represents the midpoint of the range set forth on the front cover of this prospectus, our as adjusted net tangible book deficit as of December 31, 2013 would have been approximately $ million, or $ per share. This represents an immediate decrease in our net tangible book deficit of $ per share to our existing stockholders and an immediate dilution of $ per share to new investors purchasing shares of common stock in the offering. The following table illustrates this substantial and immediate per share dilution to new investors:
| Per Share | ||||
| Assumed initial public offering price per share |
$ | |||
| Net tangible book value (deficit) before the offering |
||||
| Increase per share attributable to investors in the offering |
||||
| As adjusted net tangible book value (deficit) after the offering |
||||
| Dilution per share to new investors |
$ | |||
A $1.00 increase (decrease) in the assumed initial public offering price of $ per share would decrease (increase) our as adjusted net tangible book value (deficit) by $ million, or $ per share, and increase (decrease) the dilution per share to new investors in this offering by $ , assuming the number of shares offered by us, as set forth on the cover page of this prospectus, remains the same and after deducting the estimated underwriting discounts and commissions and estimated expenses payable by us.
The following table summarizes on an as adjusted basis as of December 31, 2013, giving effect to:
| • | the total number of shares of common stock purchased from us; |
| • | the total consideration paid to us, assuming an initial public offering price of $ per share (before deducting the estimated underwriting discount and commissions and offering expenses payable by us in connection with this offering); and |
| • | the average price per share paid by our existing stockholders and by new investors purchasing shares in this offering: |
| Shares Purchased | Total Consideration | Average Price Per Share |
||||||||||||||
| Number |
Percent | Amount | Percent | |||||||||||||
| Existing stockholders(1) |
% | % | $ | |||||||||||||
| Investors in the offering |
% | % | ||||||||||||||
| Total |
100 | % | 100 | % | $ | |||||||||||
| (1) | The number of shares disclosed for the existing stockholders includes shares that may be sold by MRD LLC in this offering, including pursuant to any exercise of the underwriters’ option to purchase additional shares of common stock. |
A $1.00 increase (decrease) in the assumed initial public offering price of $ per share (the midpoint of the range set forth on the cover page of this prospectus) would increase (decrease) total consideration paid by
55
Table of Contents
new investors, total consideration paid by all stockholders and the average price per share by $ million, $ million and $ , respectively, assuming the number of shares offered by us, as set forth on the cover page of this prospectus, remains the same.
The tables and calculations above also assume no exercise of the underwriters’ option to purchase additional shares from MRD LLC. If the underwriters exercise their option to purchase additional shares in full, then the number of shares held by new investors will be increased to , or approximately % of our outstanding shares of common stock.
56
Table of Contents
SELECTED HISTORICAL FINANCIAL DATA
MRD LLC and its consolidated subsidiaries, our accounting predecessor, controls MEMP through its ownership of MEMP GP, the general partner of MEMP. Because MRD LLC controls MEMP through its ownership of the general partner, MRD LLC is required to consolidate MEMP for accounting and financial reporting purposes even though MRD LLC owns a minority of its partner interests and MRD LLC and MEMP have independent capital structures. MRD LLC receives cash distributions from MEMP as a result of its partner interests and incentive distribution rights in MEMP, when declared and paid by MEMP. In connection with the closing of this offering, MRD LLC will contribute substantially all of its existing assets to us in exchange for shares of our common stock. Through our ownership of MEMP GP, we will continue to control MEMP and therefore will continue to consolidate the results of MEMP into our consolidated financial statements in future periods.
Our predecessor has two reportable business segments, both of which are engaged in the acquisition, exploitation, development and production of oil and natural gas properties:
| • | MRD—reflects all of MRD LLC’s consolidating subsidiaries except for MEMP and its subsidiaries. |
| • | MEMP—reflects the consolidated and combined operations of MEMP and its subsidiaries. |
We will continue to have two reportable segments following the completion of this offering. For more information regarding reportable business segments, please see the predecessor’s audited historical financial statements and related notes.
The following tables include the selected historical financial data of our predecessor, as well as the MRD Segment as of and for the periods indicated. The selected historical financial data of our predecessor as of and for the years ended December 31, 2013 and 2012 were derived from the audited historical financial statements of our predecessor included elsewhere in this prospectus. The selected historical financial data of the MRD Segment as of and for the years ended December 31, 2013 and 2012 were derived from certain financial information used in the preparation of our predecessor’s audited financial statements.
The selected unaudited pro forma data as of and for the year ended December 31, 2013 has been prepared to give pro forma effect to: (i) the exclusion of BlueStone, which is not being conveyed to us in connection with this offering, (ii) the offering of our shares of common stock contemplated hereby and the use of the net proceeds therefrom as described in “Use of Proceeds,” (iii) incremental federal income tax expense, and (iv) the restructuring transactions.
We derived the data in the following tables from, and the following tables should be read together with and is qualified in its entirety by reference to, our predecessor’s historical financial statements and our pro forma financial statements and the accompanying notes included elsewhere in this prospectus. You should also read “Restructuring Transactions,” “Use of Proceeds,” “Management’s Discussion and Analysis of Financial Condition and Results of Operations,” and our pro forma and historical consolidated financial statements, all included elsewhere in this prospectus. Among other things, those historical consolidated and combined financial statements and pro forma financial statements include more detailed information regarding the basis of presentation for the following data.
57
Table of Contents
| MRD LLC (Predecessor) | Memorial Resource Development Corp. Pro Forma |
|||||||||||
| Year Ended December 31, | Year Ended December 31, |
|||||||||||
| 2013 | 2012 | 2013 | ||||||||||
| (unaudited) | ||||||||||||
| (in thousands) | ||||||||||||
| Statement of Operations Data: |
||||||||||||
| Revenues: |
||||||||||||
| Oil and natural gas sales |
$ | 571,948 | $ | 393,631 | $ | 554,819 | ||||||
| Other revenues |
3,075 | 3,237 | 3,075 | |||||||||
|
|
|
|
|
|
|
|||||||
| Total revenues |
575,023 | 396,868 | 557,894 | |||||||||
| Costs and expenses: |
||||||||||||
| Lease operating |
113,640 | 103,754 | 111,035 | |||||||||
| Pipeline operating |
1,835 | 2,114 | 1,835 | |||||||||
| Exploration |
2,356 | 9,800 | 2,356 | |||||||||
| Production and ad valorem taxes |
27,146 | 23,624 | 26,316 | |||||||||
| Depreciation, depletion and amortization |
184,717 | 138,672 | 175,786 | |||||||||
| Impairment of proved oil and gas properties |
6,600 | 28,871 | 4,201 | |||||||||
| General and administrative |
125,358 | 69,187 | 101,098 | |||||||||
| Accretion of asset retirement obligations |
5,581 | 5,009 | 5,523 | |||||||||
| (Gain) loss on commodity derivatives |
(29,294 | ) | (34,905 | ) | (29,311 | ) | ||||||
| (Gain) loss on sale of property |
(85,621 | ) | (9,761 | ) | 3,927 | |||||||
| Other, net |
649 | 502 | 649 | |||||||||
|
|
|
|
|
|
|
|||||||
| Total costs and expenses |
352,967 | 336,867 | 403,415 | |||||||||
|
|
|
|
|
|
|
|||||||
| Operating income |
222,056 | 60,001 | 154,479 | |||||||||
|
|
|
|
|
|
|
|||||||
| Other income (expense) |
||||||||||||
| Interest expense, net |
(69,250 | ) | (33,238 | ) | ||||||||
| Amortization of investment premium |
— | (194 | ) | — | ||||||||
| Other, net |
145 | 535 | 143 | |||||||||
|
|
|
|
|
|
|
|||||||
| Total other income (expense) |
(69,105 | ) | (32,897 | ) | ||||||||
| Income tax expense |
(1,619 | ) | (107 | ) | ||||||||
|
|
|
|
|
|
|
|||||||
| Net income (loss) |
$ | 151,332 | $ | 26,997 | ||||||||
|
|
|
|
|
|
|
|||||||
| Cash Flow Data: |
||||||||||||
| Net cash provided by operating activities |
$ | 277,823 | $ | 240,404 | ||||||||
| Net cash used in investing activities |
367,443 | 606,738 | ||||||||||
| Net cash provided by financing activities |
117,950 | 361,761 | ||||||||||
| Balance Sheet Data (at period end): |
||||||||||||
| Working capital |
$ | 48,256 | $ | 63,054 | ||||||||
| Total assets |
2,829,161 | 2,459,304 | ||||||||||
| Total debt |
1,663,217 | 939,382 | ||||||||||
| Total equity (including noncontrolling interests) |
858,132 | 1,276,709 | ||||||||||
58
Table of Contents
| MRD Segment | MRD Segment Pro Forma |
|||||||||||
| Year Ended December 31, | Year Ended December 31, |
|||||||||||
| 2013 | 2012 | 2013 | ||||||||||
| (unaudited) | ||||||||||||
| (in thousands) |
||||||||||||
| Statement of Operations Data: |
||||||||||||
| Revenues: |
||||||||||||
| Oil and natural gas sales |
$230,751 | $138,032 | $ | 213,622 | ||||||||
| Other revenues |
807 | 782 | 807 | |||||||||
|
|
|
|
|
|
|
|||||||
| Total revenues |
|
231,558 |
|
|
138,814 |
|
214,429 | |||||
| Costs and expenses: |
||||||||||||
| Lease operating |
25,006 | 24,438 | 22,401 | |||||||||
| Exploration |
1,226 | 7,337 | 1,226 | |||||||||
| Production and ad valorem taxes |
9,362 | 7,576 | 8,532 | |||||||||
| Depreciation, depletion and amortization |
87,043 | 62,636 | 78,112 | |||||||||
| Impairment of proved oil and gas properties |
2,527 | 18,339 | 128 | |||||||||
| General and administrative |
81,758 | 38,414 | 57,498 | |||||||||
| Accretion of asset retirement obligations |
728 | 632 | 670 | |||||||||
| (Gain) loss on commodity derivatives |
(3,013) | (13,488 | ) | (3,030 | ) | |||||||
| (Gain) loss on sale of property |
(82,773) | (2 | ) | 6,775 | ||||||||
| Other, net |
2 | 364 | 2 | |||||||||
|
|
|
|
|
|
|
|||||||
| Total costs and expenses |
|
121,866 |
|
|
146,246 |
|
172,314 | |||||
|
|
|
|
|
|
|
|||||||
| Operating income |
109,692 | (7,432 | ) | 42,115 | ||||||||
|
|
|
|
|
|
|
|||||||
| Other income (expense) |
||||||||||||
| Interest expense, net |
(27,349) | (12,802 | ) | |||||||||
| Earnings from equity investments |
1,066 | 4,880 | 1,066 | |||||||||
| Other, net |
145 | 535 | 143 | |||||||||
|
|
|
|
|
|
|
|||||||
| Total other income (expense) |
(26,138 | ) | (7,387 | ) | ||||||||
| Income tax (expense) benefit |
(1,311 | ) | 178 | |||||||||
|
|
|
|
|
|
|
|||||||
| Net income (loss) |
$ | 82,243 | $ | (14,641 | ) | |||||||
|
|
|
|
|
|
|
|||||||
| Cash Flow Data (Unaudited): |
||||||||||||
| Net cash provided by operating activities |
$ | 83,910 | $ | 84,172 | ||||||||
| Net cash used in investing activities |
5,533 | 230,471 | ||||||||||
| Net cash provided by (used in) financing activities |
(38,963 | ) | 133,271 | |||||||||
| Other Financial Data: |
||||||||||||
| Adjusted EBITDA (unaudited) |
$ | 197,903 | $ | 132,105 | $ | 173,135 | ||||||
| Balance Sheet Data (at period end): |
||||||||||||
| Working capital (unaudited) |
$ | 51,214 | $ | 2,424 | ||||||||
| Total assets |
1,281,134 | 1,102,406 | ||||||||||
| Total debt |
871,150 | 309,200 | ||||||||||
| Total equity (unaudited) |
279,412 | 682,644 | ||||||||||
59
Table of Contents
MANAGEMENT’S DISCUSSION AND ANALYSIS OF FINANCIAL CONDITION
AND RESULTS OF OPERATIONS
Management’s Discussion and Analysis of Financial Condition and Results of Operations should be read in conjunction with the financial statements and related notes included elsewhere in this prospectus. The following discussion contains forward-looking statements that reflect our future plans, estimates, beliefs and expected performance. The forward-looking statements are dependent upon events, risks and uncertainties that may be outside our control. Our actual results could differ materially from those discussed in these forward-looking statements. Factors that could cause or contribute to such differences are described under the heading “Risk Factors” included elsewhere in this prospectus. In light of these risks, uncertainties and assumptions, the forward-looking events discussed may not occur. Also see “Cautionary Note Regarding Forward-Looking Statements” included elsewhere in this prospectus.
Overview
We are a Delaware corporation formed by Memorial Resource Development LLC (“MRD LLC”) in January 2014 to own and acquire oil and natural gas properties in North America. MRD LLC is a Delaware limited liability company formed on April 27, 2011 by Natural Gas Partners VIII, L.P. (“NGP VIII”), Natural Gas Partners IX, L.P. (“NGP IX”) and NGP IX Offshore Holdings, L.P. (“NGP IX Offshore”) (collectively, the “Funds”) to own, acquire, exploit and develop oil and natural gas properties. The Funds are private equity funds managed by Natural Gas Partners (“NGP”).
In connection with the closing of this offering, MRD LLC and its consolidated subsidiaries, which is our accounting predecessor, will contribute to us substantially all of its assets, comprised of the following, in exchange for shares of common stock: (1) 100% of its ownership interests in Classic Hydrocarbons Holdings, L.P. (“Classic”), Classic Hydrocarbons GP Co., L.L.C. (“Classic GP”), Black Diamond Minerals, LLC (“Black Diamond”), Beta Operating Company, LLC (“Beta Operating”), MRD Operating LLC (“MRD Operating”) and Memorial Production Partners GP LLC (“MEMP GP”), (2) its 99.9% membership interest in WildHorse Resources, LLC (“WildHorse Resources”), (3) 5,360,912 subordinated units, representing an 8.7% limited partner interest in Memorial Production Partners LP (“MEMP”) and (4) 50% of the incentive distribution rights of MEMP. In addition, certain former management members of WildHorse Resources will contribute to us the remaining 0.1% membership interest in WildHorse Resources as well as exchange their incentive units in exchange for shares of common stock and cash consideration. At that time, we will be majority-owned by the group consisting of MRD LLC and certain former management members of WildHorse Resources.
Following the completion of the offering, MRD LLC will retain (i) its interest in BlueStone Natural Resources Holdings, LLC (“BlueStone”), MRD Royalty LLC (“MRD Royalty”) and MRD Midstream LLC (“MRD Midstream”) and (ii) the $32 million in cash (net of $18 million to be used to pay PIK note interest on June 15, 2014) to be released from its debt service reserve account in connection with the redemption of the PIK notes (which we expect will be 30 days after the closing of this offering).
MRD LLC controls MEMP through its ownership of MEMP GP. MEMP is a publicly traded limited partnership engaged in the acquisition, production and development of oil and natural gas properties in the United States. Due to MRD LLC’s control of MEMP through the ownership of its general partner, MRD LLC is required to consolidate MEMP for accounting and financial reporting purposes. Although consolidated for accounting and financial reporting, MRD LLC and MEMP have independent capital structures. MRD LLC receives cash distributions from MEMP as a result of its partner interests and incentive distribution rights in MEMP, when declared and paid by MEMP.
60
Table of Contents
Business Segments
MRD LLC has two reportable business segments, both of which are engaged in the acquisition, exploitation, development and production of oil and natural gas properties:
| • | MRD—reflects all of MRD LLC’s consolidating subsidiaries except for MEMP and its subsidiaries. |
| • | MEMP—reflects the consolidated and combined operations of MEMP and its subsidiaries. |
Our reportable business segments are organized in a manner that reflects how management manages those business activities. We evaluate segment performance based on Adjusted EBITDA. For additional information regarding this financial measure, see “Summary Historical Consolidated and Combined Pro Forma Financial Data—Adjusted EBITDA.” For additional information regarding our predecessor’s reportable business segments, see the notes to our predecessor’s consolidated and combined financial statements found elsewhere in this prospectus.
Segment financial information has been retrospectively revised for the following common control transactions between MEMP and MRD LLC for comparability purposes:
| • | acquisition by MEMP of all the outstanding membership interests in Tanos Energy, LLC (“Tanos”) for a purchase price of approximately $77.4 million on October 1, 2013; |
| • | acquisition by MEMP of all the outstanding membership interests in Prospect Energy, LLC for a purchase price of approximately $16.3 million on October 1, 2013; |
| • | acquisition by MEMP of all the outstanding membership interests in WHT Energy Partners LLC (“WHT”) for a purchase price of approximately $200.0 million on March 28, 2013; |
| • | acquisition by MEMP of certain assets from Classic in East Texas in May 2012 for a purchase price of approximately $27.0 million; and |
| • | acquisition by MEMP of certain assets from Tanos in East Texas in April 2012 for a purchase price of approximately $18.5 million. |
The MRD Segment is focused on the exploitation, development, and acquisition of natural gas, NGL and oil properties mainly in the Cotton Valley formation in North Louisiana and East Texas as well as the Rocky Mountains. These properties consist primarily of assets with extensive production histories, high drilling success rates, and significant horizontal redevelopment potential. The MRD Segment is focused on maintaining and growing its production and cash flow primarily through the development of its sizeable inventory.
The MEMP Segment is engaged in the acquisition, exploitation, development and production of oil and natural gas properties, with assets consisting primarily of producing oil and natural gas properties that are principally located in East Texas/North Louisiana, the Permian Basin, offshore Southern California, the Rockies, the Eagle Ford and South Texas. Most of the MEMP Segment’s properties are located in large, mature oil and natural gas reservoirs with well-known geologic characteristics and long-lived, predictable production profiles and modest capital requirements. The MEMP Segment is focused on generating stable cash flows, to allow MEMP to make quarterly cash distributions to its unitholders and, over time, to increase those quarterly cash distributions.
Recent Developments
MRD Segment
| • | On February 28, 2014, WildHorse Resources repurchased net profits interests from an affiliate of NGP for $63.4 million after customary adjustments. These net profits interests were originally sold to the NGP affiliate upon the completion of certain acquisitions in 2010 by WildHorse Resources. The repurchase of the net profits interests was accounted for as a combination of entities under common control at historical |
61
Table of Contents
| cost in a manner similar to the pooling of interest method and our consolidated and combined financial statements presented herein have been retrospectively revised. As WildHorse Resources is the operator of the properties and sold the net profits interest to the affiliate of NGP in 2010, these net profits interests are accounted for as working interests in our consolidated and combined financial statements. |
| • | On April 1, 2014, WildHorse Resources sold certain oil and natural gas properties in East Texas to MEMP for approximately $34.0 million in cash consideration, subject to customary post-closing adjustments. |
MEMP Segment
| • | On March 25, 2014, MEMP acquired certain oil and natural gas properties in the Eagle Ford trend from Alta Mesa Holdings, LP for a purchase price of $173.0 million, subject to customary purchase price adjustments. The acquired properties are 100% non-operated. |
| • | On April 1, 2014, MEMP acquired certain oil and natural gas properties in East Texas from WildHorse Resources for approximately $34.0 million in cash consideration, subject to customary post-closing adjustments. |
Sources of Revenues
Both the MRD Segment’s and the MEMP Segment’s revenues are derived from the sale of natural gas and oil production, as well as the sale of NGLs that are extracted from natural gas during processing. Production revenues are derived entirely from the continental United States. Natural gas, NGL and oil prices are inherently volatile and are influenced by many factors outside their control. In order to reduce the impact of fluctuations in natural gas and oil prices on revenues, or to protect the economics of property acquisitions, both segments intend to periodically enter into derivative contracts with respect to a significant portion of their estimated natural gas and oil production through various transactions that fix the future prices received. These transactions may include price swaps whereby the applicable segment will receive a fixed price for production and pay a variable market price to the contract counterparty. Additionally, either segment may enter into costless collars, whereby the applicable segment receives the excess, if any, of the fixed floor over the floating rate or pay the excess, if any, of the floating rate over the fixed ceiling price. At the end of each period the fair value of these commodity derivative instruments are estimated and, because hedge accounting is not elected, the changes in the fair value of unsettled commodity derivative instruments are recognized in earnings at the end of each accounting period.
Principal Components of Cost Structure
| • | Lease operating expenses. These are the day to day costs incurred to maintain production of our natural gas, NGLs and oil. Such costs include utilities, direct labor, water injection and disposal, materials and supplies, compression, repairs and workover expenses. Cost levels for these expenses can vary based on supply and demand for oilfield services. |
| • | Production and ad valorem taxes. These consist of severance and ad valorem taxes. Production taxes are paid on produced natural gas, NGLs and oil based on a percentage of market prices and at fixed per unit rates established by federal, state or local taxing authorities. Both the MRD and MEMP Segments take full advantage of all credits and exemptions in the various taxing jurisdictions where they operate. Ad valorem taxes are generally tied to the valuation of the oil and natural properties; however, these valuations are reasonably correlated to revenues, excluding the effects of any commodity derivative contracts. |
| • | Exploration expense. These are geological and geophysical costs and include seismic costs, costs of unsuccessful exploratory dry holes and unsuccessful leasing efforts. |
| • | Impairment of unproved and proved properties. For unproved properties, these primarily include costs associated with lease expirations. Proved properties are impaired whenever the carrying value of the properties exceed their estimated undiscounted future cash flows. |
62
Table of Contents
| • | Depreciation, depletion and amortization. Depreciation, depletion and amortization, or DD&A, includes the systematic expensing of the capitalized costs incurred to acquire, explore and develop natural gas, NGLs and oil. As a “successful efforts” company, all costs associated with acquisition and development efforts and all successful exploration efforts are capitalized, and these costs are allocated to each unit of production using the units of production method. |
| • | General and administrative expense. These costs include overhead, including payroll and benefits for employees, costs of maintaining headquarters, costs of managing production and development operations, compensation expense associated with incentive units, franchise taxes, audit and other professional fees, and legal compliance expenses. Certain of our and our predecessor’s employees hold incentive units in MRD LLC and/or, prior to the restructuring transactions, certain subsidiaries of MRD LLC, that may, upon vesting, entitle the holders to a disproportionate share of future distributions by MRD LLC to its members after all of the members that have made capital contributions to MRD LLC and/or certain subsidiaries have received cumulative distributions in respect of their membership interest equal to specified rates of return. |
| • | Interest expense. Both the MRD and MEMP Segments finance a portion of their working capital requirements and acquisitions with borrowings under revolving credit facilities and senior note issuances. As a result, both the MRD and MEMP Segments incur substantial interest expense that is affected by both fluctuations in interest rates and financing decisions. We expect to continue to incur significant interest expense as we continue to grow. |
| • | Income tax expense. MRD LLC, our predecessor, is a limited liability company not subject to federal income taxes. Accordingly, no provision for federal income taxes has been provided for in our historical results of operations because taxable income was passed through to MRD LLC’s members. Although we are a corporation under the Internal Revenue Code, subject to federal income taxes at a statutory rate of 35% of pretax earnings, we do not expect to report any income tax benefit or expense until the consummation of this offering. |
Results of Operations
Consolidated
Selected consolidated and combined results of operations for the years ended December 31, 2013 and 2012 are presented below and have been derived from our predecessor’s consolidated and combined financial statements included elsewhere in this prospectus. Also see our predecessor’s consolidated and combined financial statements and related notes included elsewhere in this prospectus for a description of our predecessor’s “previous owners.”
| For Year Ended December 31, |
||||||||
| 2013 | 2012 | |||||||
| (in thousands) | ||||||||
| Oil & natural gas sales |
$ | 571,948 | $ | 393,631 | ||||
| Lease operating |
113,640 | 103,754 | ||||||
| Exploration |
2,356 | 9,800 | ||||||
| Production and ad valorem taxes |
27,146 | 23,624 | ||||||
| Depreciation, depletion, and amortization |
184,717 | 138,672 | ||||||
| Impairment of proved oil and natural gas properties |
6,600 | 28,871 | ||||||
| General and administrative |
125,358 | 69,187 | ||||||
| (Gain) loss on commodity derivative instruments |
(29,294 | ) | (34,905 | ) | ||||
| (Gain) loss on sale of properties |
(85,621 | ) | (9,761 | ) | ||||
| Interest expense, net |
69,250 | 33,238 | ||||||
| Net income (loss) |
151,332 | 26,997 | ||||||
63
Table of Contents
Year Ended December 31, 2013 Compared to the Year Ended December 31, 2012
Our predecessor recorded net income of $151.3 million in 2013 compared to net income of $27.0 million in 2012. The increase in net income was primarily due to increases in revenues and gains on the sale of properties, partially offset by increases in DD&A, general and administrative expenses and interest expense.
| • | Oil and natural gas revenues were $571.9 million, an increase of $178.3 million from 2012. Production increased 28,062 MMcfe (approximately 37%) while the average realized sales price increased $0.31 per Mcfe. Production increases were primarily due to acquisitions and drilling activities in North Louisiana and East Texas. The favorable volume variance contributed to a $147.2 million increase in revenues and the favorable pricing variance contributed to a $31.1 million increase in revenues. |
| • | The $46.0 million increase in DD&A expense was primarily due to increased production volumes related to acquisitions and drilling activities in North Louisiana and East Texas. Increased production volumes increased DD&A expense by $51.8 million, while a 3% decrease in the DD&A rate between periods decreased DD&A expense by $5.8 million. |
| • | During 2013, BlueStone sold its remaining interests in certain properties in East Texas to a third party and recognized a gain of $89.5 million. This gain was partially offset by a loss of $6.8 million recorded by Black Diamond on the sale of certain of its Wyoming properties. During 2012, the previous owners of oil and gas properties acquired by MEMP recognized a gain of approximately $9.8 million related to the sale of properties in West Texas. |
| • | Interest expense was $69.3 million in 2013, an increase of $36.0 million from 2012. The increase in interest expense was primarily due to higher levels of indebtedness as debt outstanding was $939.4 million at December 31, 2012 compared to $1,663.2 million at December 31, 2013. |
Please see segment discussion below for further information regarding changes in other line items on a segment basis.
MRD Segment
The MRD Segment’s consolidated and combined results of operations for the years ended December 31, 2013 and 2012 presented below have been derived from our predecessor’s consolidated and combined financial statements included elsewhere in this prospectus. Please see the Notes to the Consolidated and Combined Financial Statements included elsewhere in this prospectus for information regarding business segments. The comparability of the results of operations among the periods presented is impacted by the following significant transactions:
| • | the sale by BlueStone of substantially all of its assets in July 2013 for approximately $117.9 million, which resulted in the recognition of a $89.5 million gain; |
| • | the acquisition of oil and gas properties by WildHorse Resources in Louisiana in March 2013 for approximately $67.1 million; and |
| • | the acquisition by WildHorse Resources of oil and gas properties in East Texas and North Louisiana in May 2012 for a net purchase price of approximately $77.5 million. |
In addition to the transactions affecting comparability of the results of operations of the MRD Segment among the periods presented, the results of operations of the MRD Segment following the completion of this offering will be affected by incremental public company expenses and general and administrative costs.
In connection with the closing of this offering and the restructuring transactions, MRD LLC will contribute substantially all of its assets to us other than BlueStone, MRD Royalty, MRD Midstream and the remaining cash held in the debt service reserve account established in connection with the issuance of the PIK notes. At December 31, 2013, BlueStone’s total assets were less than 1% of both our consolidated and MRD Segment total
64
Table of Contents
assets. BlueStone’s total revenues were approximately 3% of our consolidated total revenues and 7% of the MRD Segment’s total revenues for the year ended December 31, 2013. BlueStone’s production volumes were approximately 2% of our consolidated production volumes and 4% of the MRD Segment’s production volumes for the year ended December 31, 2013.
| For Year Ended December 31, |
||||||||
| 2013 | 2012 | |||||||
| (in thousands) | ||||||||
| Oil & natural gas sales |
$ | 230,751 | $ | 138,032 | ||||
| Lease operating |
25,006 | 24,438 | ||||||
| Exploration |
1,226 | 7,337 | ||||||
| Production and ad valorem taxes |
9,362 | 7,576 | ||||||
| Depreciation, depletion, and amortization |
87,043 | 62,636 | ||||||
| Impairment of proved oil and natural gas properties |
2,527 | 18,339 | ||||||
| General and administrative |
81,758 | 38,414 | ||||||
| (Gain) loss on commodity derivative instruments |
(3,013 | ) | (13,488 | ) | ||||
| (Gain) loss on sale of properties |
(82,773 | ) | (2 | ) | ||||
| Interest expense, net |
27,349 | 12,802 | ||||||
| Net income (loss) |
82,243 | (14,641 | ) | |||||
| Natural gas and oil revenue: |
||||||||
| Oil sales |
$ | 66,961 | $ | 35,264 | ||||
| NGL sales |
53,881 | 36,611 | ||||||
| Natural gas sales |
109,909 | 66,157 | ||||||
|
|
|
|
|
|||||
| Total natural gas and oil revenue |
$ | 230,751 | $ | 138,032 | ||||
|
|
|
|
|
|||||
| Production Volumes: |
||||||||
| Oil (MBbls) |
665 | 369 | ||||||
| NGLs (MBbls) |
1,457 | 898 | ||||||
| Natural gas (MMcf) |
34,092 | 24,130 | ||||||
|
|
|
|
|
|||||
| Total (MMcfe) |
46,819 | 31,731 | ||||||
|
|
|
|
|
|||||
| Average net production (MMcfe/d) |
128.3 | 86.7 | ||||||
|
|
|
|
|
|||||
| Average sales price: |
||||||||
| Oil (per Bbl) |
$ | 100.76 | $ | 95.56 | ||||
| NGL (per Bbl) |
36.99 | 40.78 | ||||||
| Natural gas (per Mcf) |
3.22 | 2.74 | ||||||
|
|
|
|
|
|||||
| Total (Mcfe) |
$ | 4.93 | $ | 4.35 | ||||
|
|
|
|
|
|||||
| Average unit costs per Mcfe: |
||||||||
| Lease operating expense |
$ | 0.53 | $ | 0.77 | ||||
| Production and ad valorem taxes |
$ | 0.20 | $ | 0.24 | ||||
| General and administrative expenses |
$ | 1.75 | $ | 1.21 | ||||
| Depletion, depreciation, and amortization |
$ | 1.86 | $ | 1.97 | ||||
Year Ended December 31, 2013 Compared to the Year Ended December 31, 2012
The MRD Segment recorded net income of $82.2 million in 2013 compared to a net loss of $14.6 million in 2012. The increase in net income was primarily due to gains on sales of properties and increased production.
| • | Oil and natural gas revenues were $230.8 million in 2013, an increase of $92.7 million from 2012. Production increased 15,088 MMcfe (approximately 48%) while the average realized sales price increased |
65
Table of Contents
| $0.58 per Mcfe. Production volume increases were primarily due to acquisitions and drilling activities in the Cotton Valley formation in North Louisiana and East Texas. The favorable volume variance contributed to a $65.6 million increase in revenues, and the favorable pricing variance contributed to a $27.1 million increase in revenues. |
| • | Lease operating expenses were $25.0 million in 2013, an increase in $0.6 million from 2012. This increase was primarily due to acquisitions and drilling activities in the Cotton Valley formation in North Louisiana and East Texas. However, on a per Mcfe basis, lease operating expenses decreased by $0.24 per Mcfe as certain items, such as direct labor and materials and supplies, generally remain relatively fixed across broad production volume ranges. |
| • | The $24.4 million increase in DD&A expense was primarily due to increased production volumes related to acquisitions and drilling activities in the Cotton Valley formation in North Louisiana and East Texas. Increased production volumes increased DD&A expense by $29.8 million, while a 6% decrease in the DD&A rate between periods decreased DD&A expense by $5.4 million. On a per Mcfe basis, DD&A expense decreased by $0.11 per Mcfe from 2012 to 2013. An increase in proved reserve volumes more than offset the impact of increases to the depletable cost base. |
Generally, if reserve volumes are revised up or down, then the DD&A rate per unit of production will change inversely. However, if the depletable base changes, then the DD&A rate moves in the same direction. Absolute or total DD&A, as opposed to the rate per unit of production, generally moves in the same direction as production volumes.
| • | During 2013 and 2012, the MRD Segment recorded impairments of $2.5 million and $18.3 million, respectively, primarily related to certain fields in East Texas. For these impairments, the estimated future cash flows expected from properties in these fields were compared to their carrying values and determined to be unrecoverable. Downward revisions due to performance and declines in natural gas prices triggered the 2013 and 2012 impairments, respectively. |
| • | General and administrative expenses were $81.8 million in 2013, an increase of $43.3 million from 2012. The increase in general and administrative expenses was primarily due to growth in employees as a result of acquisitions and development activities and incentive unit compensation expense. General and administrative expenses during 2013 included recognition of approximately $43.3 million of compensation expense related to an incentive unit payments to certain key management members of certain MRD LLC subsidiaries compared to approximately $9.5 million recorded in 2012. |
| • | Gains on commodity derivative instruments of $3.0 million were recognized during 2013, of which $12.2 million consisted of cash settlements received. Gains on commodity derivative instruments of $13.5 million were recognized during 2012, of which $30.2 million consisted of cash settlements received. The decrease in cash settlements received was primarily due to higher natural gas prices. |
Given the volatility of commodity prices, it is not possible to predict future changes in fair value or cash settlements that will ultimately be realized upon settlement of the open positions in future years. If commodity prices at settlement are lower than the prices of the settled positions, the derivative contracts are expected to mitigate the otherwise negative effect on earnings of lower oil, natural gas and NGL prices. However, if commodity prices at settlement are higher than the prices of the settled positions, the derivative contracts are expected to dampen the otherwise positive effect on earnings of higher oil, natural gas and NGL prices and will, in this context, be viewed as having resulted in an opportunity cost.
| • | During 2013, BlueStone entered into an agreement with a publicly traded third party to sell its remaining interest in certain properties in the Mossy Grove Prospect in Walker and Madison Counties located in East Texas and recognized a gain of $89.5 million. This gain was offset by a loss of $6.8 million recorded by Black Diamond on the sale of certain of its Wyoming oil and gas properties. During 2012, gains of less than $0.1 million were recognized by the MRD Segment. |
| • | Net interest expense during 2013 was $27.3 million, including amortization of deferred financing fees of approximately $2.5 million and losses on interest rate swaps of $0.2 million. Net interest expense during |
66
Table of Contents
| 2012 was $12.8 million, including amortization of deferred financing fees of approximately $1.6 million and losses on interest rate swaps of $1.2 million. The increase in net interest expense is primarily the result of higher level of indebtedness during 2013 compared to 2012. |
MEMP Segment
The MEMP Segment’s consolidated and combined results of operations for the years ended December 31, 2013 and 2012 presented below have been derived from MRD LLC’s consolidated and combined financial statements included elsewhere in this prospectus.
The comparability of the results of operations among the periods presented is impacted by the following significant transactions:
| • | two separate third party acquisitions by MEMP of assets in East Texas in May and September 2012, respectively, for a net purchase price of approximately $126.9 million; |
| • | the acquisition of working interests, royalty interests and net revenue interests located in the Permian Basin in July 2012 for a net purchase price of approximately $74.7 million; and |
| • | multiple acquisitions of operated and non-operated interests in certain oil and natural gas properties primarily located in the Permian Basin for an aggregate net purchase price of $75.9 million. |
| For Year Ended December 31, |
||||||||
| 2013 | 2012 | |||||||
| (in thousands) | ||||||||
| Oil & natural gas sales |
$ | 341,197 | $ | 255,608 | ||||
| Lease operating |
88,893 | 80,116 | ||||||
| Exploration |
1,130 | 2,463 | ||||||
| Production and ad valorem taxes |
17,784 | 16,048 | ||||||
| Depreciation, depletion, and amortization |
97,269 | 76,036 | ||||||
| Impairment of proved oil and natural gas properties |
54,362 | 10,532 | ||||||
| General and administrative |
43,495 | 30,342 | ||||||
| (Gain) loss on commodity derivative instruments |
(26,281 | ) | (21,417 | ) | ||||
| (Gain) loss on sale of properties |
(2,848 | ) | (9,759 | ) | ||||
| Interest expense, net |
41,901 | 20,436 | ||||||
| Net income |
20,268 | 46,518 | ||||||
| Natural gas and oil revenue: |
||||||||
| Oil sales |
$ | 171,095 | $ | 145,103 | ||||
| NGL sales |
51,215 | 26,647 | ||||||
| Natural gas sales |
118,887 | 83,858 | ||||||
|
|
|
|
|
|||||
| Total natural gas and oil revenue |
$ | 341,197 | $ | 255,608 | ||||
|
|
|
|
|
|||||
| Production Volumes: |
||||||||
| Oil (MBbls) |
1,764 | 1,519 | ||||||
| NGLs (MBbls) |
1,632 | 745 | ||||||
| Natural gas (MMcf) |
35,924 | 29,744 | ||||||
|
|
|
|
|
|||||
| Total (MMcfe) |
56,303 | 43,329 | ||||||
|
|
|
|
|
|||||
| Average net production (MMcfe/d) |
154.3 | 118.4 | ||||||
|
|
|
|
|
|||||
| Average sales price: |
||||||||
| Oil (per Bbl) |
$ | 96.98 | $ | 95.54 | ||||
| NGL(per Bbl) |
31.38 | 35.75 | ||||||
| Natural gas (per Mcf) |
3.31 | 2.82 | ||||||
|
|
|
|
|
|||||
| Total (Mcfe) |
$ | 6.06 | $ | 5.90 | ||||
|
|
|
|
|
|||||
| Average unit costs per Mcfe: |
||||||||
| Lease operating expense |
$ | 1.58 | $ | 1.85 | ||||
| Production and ad valorem taxes |
$ | 0.32 | $ | 0.37 | ||||
| General and administrative expenses |
$ | 0.77 | $ | 0.70 | ||||
| Depletion, depreciation, and amortization |
$ | 1.73 | $ | 1.75 | ||||
67
Table of Contents
Year Ended December 31, 2013 Compared to the Year Ended December 31, 2012
MEMP recorded net income of $20.3 million in 2013 compared to income of $46.5 million 2012.
| • | Oil and natural gas revenues were $341.2 million in 2013, an increase of $85.6 million from 2012. Production increased 12,974 MMcfe (approximately 30%) while the average realized sales price increased $0.16 per Mcfe. The favorable volume variance contributed to a $76.6 million increase in revenues, whereas the favorable pricing variance contributed to a $9.0 million decrease in revenues. |
| • | Lease operating expenses were $88.9 million in 2013, an increase of $8.8 million from 2012. Production and ad valorem taxes were $17.8 million in 2013, an increase of $1.7 million from 2012. Both lease operating expenses and production and ad valorem taxes increased primarily due to increased production volumes associated with properties acquired during both 2012 and 2013 and increased drilling activities. |
| • | The increase in DD&A expense was primarily due to increased production volumes related to acquisitions in 2012 and 2013 and increased drilling activities. Increased production volumes caused DD&A expense to increase by $22.8 million, while a 1% change in the DD&A rate between periods caused DD&A expense to decrease by $1.5 million. An increase in proved reserve volumes more than offset the impact of increases to the depletable cost base. |
| • | During 2013, MEMP recorded $54.4 million of impairments consisting of $50.3 million related to certain properties in East Texas and $4.1 million related to certain properties in South Texas. For the East Texas properties, the estimated future cash flows expected from these properties were compared to their carrying values and determined to be unrecoverable as a result of downward revisions of estimated proved reserves based upon updated well performance data. In South Texas, the estimated future cash flows expected from these properties were compared to their carrying values and determined to be unrecoverable as a result of a downward revision of estimated proved reserves based on pricing terms specific to these properties. During 2012, MEMP recorded impairments of $10.5 million primarily related to properties in the Permian Basin. The 2012 impairments were a result of downward revisions of estimated proved reserves due to unfavorable drilling results in the area. |
| • | General and administrative expenses were $43.5 million in 2013, an increase of $13.2 million. The increase in general and administrative expenses was primarily due to growth in employees as a result of acquisitions and drilling activities. General and administrative expenses for 2013 included $3.6 million of non-cash unit-based compensation expense and $6.7 million of acquisition-related costs. General and administrative expenses for 2012 were $30.3 million and included $1.4 million of non-cash unit-based compensation expense and $4.1 million of acquisition-related costs. |
| • | Net gains on commodity derivative instruments of $26.3 million were recognized during 2013, of which $19.9 million consisted of cash settlements. Net gains on commodity derivative instruments of $21.4 million were recognized during 2012, of which $44.1 million consisted of cash settlements. The decrease in cash settlements was primarily due to higher natural gas prices. |
| • | During 2013, a gain of approximately $2.8 million was recorded due to the sale of certain non-operated properties in East Texas. During 2012, a gain of approximately $9.8 million was recognized related to the sale of properties in Garza and Ector Counties in Texas. |
| • | Net interest expense during 2013 was $41.9 million, including amortization of deferred financing fees of approximately $5.8 million and gains on interest rate swaps of $1.5 million. Net interest expense during 2012 was $20.4 million, including amortization of deferred financing fees of approximately $0.6 million and losses on interest rate swaps of $4.0 million. The increase in net interest expense is primarily the result of higher level of indebtedness during 2013 compared to 2012. |
68
Table of Contents
Liquidity and Capital Resources
Although results are consolidated for financial reporting, the MRD and MEMP Segments operate with independent capital structures. With the exception of cash distributions paid to the MRD Segment by the MEMP Segment related to MEMP partnership interests held by MRD LLC, the cash needs of each segment have been met independently with a combination of operating cash flows, asset sales, credit facility borrowings and the issuance of equity. We expect that the cash needs of each of the MRD Segment and the MEMP Segment will continue to be met independently of each other with a combination of these funding sources.
MRD Segment
Historically, the primary sources of liquidity have been through borrowings under credit facilities, capital contributions from NGP and certain members of management, borrowings under a second lien term loan facility, asset sales, including dropdowns to MEMP, and net cash provided by operating activities. The primary use of cash has been for the exploration, development and acquisition of natural gas, NGLs and oil properties. As we pursue reserve and production growth, we continually monitor what capital resources, including equity and debt financings, are available to meet future financial obligations, planned capital expenditure activities and liquidity requirements. The future success in growing proved reserves and production will be highly dependent on the capital resources available. As of December 31, 2013, we had 1,371 identified gross potential horizontal well locations, which will take many years to develop. Additionally, the proved undeveloped reserves will require an estimated $1.3 billion of development capital over the next five years according to our reserve report as of December 31, 2013. A significant portion of this capital requirement will be funded out of operating cash flows. However, we may be required to generate or raise significant capital to conduct drilling activities on these identified potential well locations and to finance the development of proved undeveloped reserves.
We expect that the primary sources of liquidity and capital resources after the consummation of this offering will be cash flows generated by operating activities, borrowings under revolving credit facilities and distributions from MEMP on the subordinated units and incentive distribution rights owned by MEMP GP. We will also have the ability to issue additional equity and debt as needed through private or public offerings.
After the completion of this offering, we believe our cash flows provided by operating activities and availability under our revolving credit facility will provide us with the financial flexibility and wherewithal to meet our cash requirements, including normal operating needs, and pursue our currently planned 2014 development drilling activities. However, future cash flows are subject to a number of variables, including the level of natural gas production and prices, and significant additional capital expenditures will be required to more fully develop our properties and acquire additional properties. We cannot assure you that operations and other needed capital will be available on acceptable terms, or at all.
Capital Budget
During 2013, we invested approximately $190 million of capital at the MRD Segment to drill 31 gross (21.3 net) wells. A substantial portion of our development program is focused on horizontal drilling of liquids rich wells in the Terryville Complex, where we spent approximately $163 million in capital expenditures to drill 15 gross (12.1 net) horizontal wells during 2013.
In 2014, we have budgeted a total of $316 million to drill and complete 49 gross (39 net) operated wells and to participate in 12 gross (1.1 net) non-operated wells. We expect to fund our 2014 development primarily from cash flows from operations. The majority of our drilling locations and our 2014 development program are focused on the Terryville Complex, where we plan to invest $264 million on drilling and completing 33 gross (28 net) horizontal wells and 2 gross (2.0 net) vertical wells. We plan to run four to five rigs during 2014 targeting primarily our four primary zones within the Cotton Valley — the Upper Red, Lower Red, Lower Deep Pink and Upper Deep Pink. Total vertical depth of these zones ranges from 8,200 to 11,200 feet.
69
Table of Contents
In our East Texas properties in the Joaquin Field, we plan to spend development capital of $36 million running one rig to drill 8 gross (6 net) horizontal wells targeting the Cotton Valley formation at vertical depths of 6,000 to 10,000 feet.
In our Rockies & Other area, we plan to spend $12 million of development capital, primarily in the Tepee Field in the Piceance Basin in Colorado focused on completing 3 wells drilled in fourth quarter of 2013 and running 1 rig to drill an additional 3 operated wells. We also plan to spend an additional $4 million to participate in 12 horizontal wells operated by SandRidge Energy in the Mississippian oil play of Northern Oklahoma.
Cash Flows from Operating, Investing and Financing Activities
The following tables summarize both consolidated/combined and segment cash flows from operating, investing and financing activities for the periods indicated. For information regarding the individual components of our cash flow amounts, see the Statements of Consolidated and Combined Cash Flows included elsewhere in this prospectus.
Consolidated & Combined
| For Year Ended December 31, |
||||||||
| 2013 | 2012 | |||||||
| Net cash provided by operating activities |
$ | 277,823 | $ | 240,404 | ||||
| Net cash used in investing activities |
367,443 | 606,738 | ||||||
| Net cash provided by financing activities |
117,950 | 361,761 | ||||||
MRD Segment
| For Year Ended December 31, |
||||||||
| 2013 | 2012 | |||||||
| (unaudited) | ||||||||
| Net cash provided by operating activities |
$ | 83,910 | $ | 84,172 | ||||
| Net cash used in investing activities |
||||||||
| Acquisition of oil and gas properties |
$ | (67,098 | ) | $ | (83,055 | ) | ||
| Additions to oil and gas properties |
(198,340 | ) | (165,203 | ) | ||||
| Additions to other property and equipment |
(2,432 | ) | (1,267 | ) | ||||
| Equity investments in MEMP Segment |
(521 | ) | (206 | ) | ||||
| Distributions received from MEMP Segment related to partnership interests |
26,006 | 19,263 | ||||||
| Additions to restricted cash |
(49,347 | ) | — | |||||
| Proceeds from the sale of oil and gas properties to third parties |
151,187 | — | ||||||
| Proceeds from the sale of MEMP common units |
135,012 | — | ||||||
| Other |
— | (3 | ) | |||||
|
|
|
|
|
|||||
| Net cash used in investing activities |
$ | (5,533 | ) | $ | (230,471 | ) | ||
|
|
|
|
|
|||||
| Net cash provided by financing activities |
||||||||
| Advances on revolving credit facilities |
$ | 174,400 | $ | 228,450 | ||||
| Payments on revolving credit facilities |
(280,500 | ) | (129,750 | ) | ||||
| Borrowings under second lien term loan |
325,000 | — | ||||||
| Proceeds from the issuance of PIK notes |
343,000 | — | ||||||
| Loan origination fees |
(20,267 | ) | (1,276 | ) | ||||
| Purchase of noncontrolling interests in consolidated subsidiaries |
(13,865 | ) | — | |||||
| Contribution from NGP affiliate |
— | 7,033 | ||||||
| Contributions from MEMP Segment |
180,260 | 29,280 | ||||||
| Distributions to noncontrolling interests |
(7,446 | ) | — | |||||
| Distributions to MEMP Segment |
— | (1,900 | ) | |||||
| Distributions to Funds |
(732,362 | ) | — | |||||
| Distributions made by previous owners |
(2,590 | ) | (2,317 | ) | ||||
| Other cash transfers from MEMP Segment |
— | 3,751 | ||||||
| Other |
(4,593 | ) | — | |||||
|
|
|
|
|
|||||
| Net cash (used in) provided by financing activities |
$ | (38,963 | ) | $ | 133,271 | |||
|
|
|
|
|
|||||
70
Table of Contents
Year Ended December 31, 2013 Compared to the Year Ended December 31, 2012
Operating Activities. Net cash flows provided by operating activities were $83.9 million in 2013 compared to $84.2 million in 2012. Although production volumes increased 15,088 MMcfe (approximately 48%), net cash flows from operating activities were impacted by $43.3 million of compensation expense recognized in 2013 related to incentive unit payments, which was an increase of $33.8 million from 2012.
Investing Activities. Cash used in investing activities was $5.5 million during 2013 compared to $230.5 million in 2012. Cash used for the acquisition of oil and gas properties was $67.1 million in 2013 compared to $83.1 million in 2012. The 2013 acquisition was for certain properties located in Louisiana that were purchased in March 2013. The 2012 acquisitions consisted primarily of properties located in East Texas and North Louisiana.
Cash used for additions to oil and gas properties was $198.3 million in 2013 compared to $165.2 million in 2012. The additions in both 2013 and 2012 consisted primarily of drilling and completion activities focused on the Cotton Valley formation in North Louisiana and East Texas.
Distributions of $26.0 million were received in 2013 from MEMP related to the common and subordinated units owned by MRD LLC as compared to $19.3 million received in 2012. In November 2013, MRD LLC sold 7,061,294 MEMP common units in a public offering, which generated net proceeds of $135.0 million.
Proceeds from the sale of oil and gas properties totaled $151.2 million in 2013. In May 2013, Black Diamond sold certain of its Wyoming properties for approximately $33.0 million. In July 2013, BlueStone sold its interest in certain properties located in Walker and Madison Counties in East Texas for approximately $117.9 million. There were no sales of oil and gas properties in 2012.
Additions to restricted cash totaled $49.3 million and were primarily related to the $50.0 million debt service reserve established in connection with the issuance of the PIK notes in December 2013.
Financing Activities. Cash used in financing activities was $39.0 million in 2013 compared to cash provided by financing activities of $133.3 million in 2012. Net payments under revolving credit facilities were $106.1 million in 2013 compared to net borrowings of $98.7 in 2012. In June 2013, WildHorse Resources received gross proceeds of $325.0 million under its second lien term loan and in December 2013, MRD LLC received gross proceeds of $343.0 million related to the issuance of the PIK notes. Deferred financing costs were $20.3 million in 2013 compared to $1.3 million in 2012. The increase in deferred financing costs was primarily due to the WildHorse second lien term loan and the PIK notes.
In November 2013, MRD LLC purchased the noncontrolling interests in Black Diamond, Classic GP and Classic for $13.9 million of consideration.
Cash received from the MEMP Segment in 2013 related to the sale of assets from the MRD Segment to the MEMP Segment was $180.3 million compared to $29.3 million.
Distributions to the Funds during 2013 were $732.4 million. The sources to fund these distributions primarily included $225.0 million from the WildHorse second lien term loan, $210.0 million from the December 2013 PIK notes, $63.8 million from the sale of properties to third parties, $125.0 million from the sale of properties to MEMP and $105.0 million from the sale of 7,061,294 MEMP common units that MRD LLC owned. Distributions to noncontrolling interests and previous owners totaled $15.9 million in 2013 compared to $2.3 million in 2012.
71
Table of Contents
MEMP Segment
| For Year Ended December 31, |
||||||||
| 2013 | 2012 | |||||||
| (unaudited) | ||||||||
| Net cash provided by operating activities |
$ | 193,697 | $ | 156,844 | ||||
| Net cash used in investing activities: |
||||||||
| Acquisition of oil and natural gas properties |
$ | (38,664 | ) | $ | (277,623 | ) | ||
| Additions to oil and gas properties |
(161,675 | ) | (107,789 | ) | ||||
| Additions to other property and equipment |
(238 | ) | (1,748 | ) | ||||
| Additions to restricted investments |
(5,361 | ) | (4,599 | ) | ||||
| Proceeds from the sale of oil and gas properties |
4,525 | 34,521 | ||||||
| Other |
— | 29 | ||||||
|
|
|
|
|
|||||
| Net cash used in investing activities |
$ | (201,413 | ) | $ | (357,209 | ) | ||
|
|
|
|
|
|||||
| Net cash provided by financing activities |
||||||||
| Advances on revolving credit facilities |
$ | 958,355 | $ | 391,000 | ||||
| Payments on revolving credit facilities |
(1,485,537 | ) | (121,819 | ) | ||||
| Proceeds from the issuances of senior notes |
688,563 | — | ||||||
| Loan origination fees |
(20,908 | ) | (2,225 | ) | ||||
| Contributions from previous owners |
7,233 | 44,072 | ||||||
| Contribution from NGP affiliate |
2,013 | 38,125 | ||||||
| Contribution from general partner |
521 | 206 | ||||||
| Contributions from MRD Segment |
— | 1,900 | ||||||
| Net proceeds from public equity offering |
490,138 | 194,304 | ||||||
| Distributions to partners |
(96,643 | ) | (34,436 | ) | ||||
| Distributions to MRD Segment |
(180,260 | ) | (29,280 | ) | ||||
| Distributions to NGP affiliates |
(355,495 | ) | (242,174 | ) | ||||
| Distributions made by previous owners |
(2,552 | ) | (26,455 | ) | ||||
| Other cash transfers to MRD Segment |
— | (3,751 | ) | |||||
| Other |
(9,013 | ) | (646 | ) | ||||
|
|
|
|
|
|||||
| Net cash provided by financing activities |
$ | (3,585 | ) | $ | 208,821 | |||
|
|
|
|
|
|||||
Year Ended December 31, 2013 Compared to the Year Ended December 31, 2012
Operating Activities. Key drivers of net operating cash flows are commodity prices, production volumes and operating costs. Net cash flows provided by operating activities increased during 2013 primarily due to an increase in production volumes as a result of acquisitions and increased drilling activities. Cash flows provided by operating activities at the MEMP Segment are used primarily to fund distributions to its partners and additions to oil and gas properties. The previous owners primarily used cash flows provided by operating activities to fund its exploration and development expenditures.
Investing Activities. Cash used in investing activities during 2013 was $201.4 million, of which $38.7 million was used to acquire oil and gas properties located in Wyoming and East Texas and $161.7 million was used for additions to oil and gas properties. Cash used in investing activities during 2012 was $357.2 million, of which $277.6 million was used to acquire oil and gas properties and $107.8 million was used for additions to oil and gas properties. The 2012 acquisitions included $126.9 million of acquisitions in East Texas and $150.7 million of acquisitions in the Permian Basin.
Various restricted investment accounts fund certain long-term contractual and regulatory asset retirement obligations and collateralize certain regulatory bonds associated with the offshore Southern California oil properties. For the years ended December 31, 2013 and 2012, additions to restricted investments were $5.4 million and $4.6 million, respectively.
Proceeds from the sale of oil and gas properties were $4.5 million in 2013 compared to $34.5 million in 2012. The 2013 sales primarily consisted of certain non-operated properties in East Texas while the 2012 sales primarily consisted of certain properties in Garza and Ector counties located in West Texas.
72
Table of Contents
Financing Activities. Cash used in financing activities was $3.6 million in 2013 compared to cash provided by financing activities of $208.8 million in 2012.
MEMP generated total net proceeds of $490.1 million from two separate equity offerings in 2013 compared to $194.3 million in 2012. In March 2013, MEMP issued 9,775,000 common units to the public at an offering price of $18.35 per unit generating net proceeds of approximately $171.8 million. In October 2013, MEMP issued 16,675,000 common units to the public at an offering price of $19.90 per unit generating net proceeds of approximately $318.3 million. In December 2012, MEMP generated net proceeds of $194.3 million from a public offering of common units.
MEMP completed a private placement of 7.625% senior notes due 2021 (the “Senior Notes”) with two additional issuances during 2013. MEMP issued $300.0 million aggregate principal amount of the Senior Notes at 98.521% of par in April 2013, an additional $100.0 million aggregate principal amount at 102.0% of par in May 2013 and an additional $300.0 million aggregate principal amount at 97.0% of par in October 2013. Total proceeds, net of discounts, from the issuance of the Senior Notes were $688.6 million during 2013.
Distributions to partners were $96.6 million during the year ended December 31, 2013 compared to $34.4 million during the year ended December 31, 2012 due to increases in both declared distribution rates per unit and increases in the number of outstanding units. Distributions to the MRD Segment totaled $180.3 million in 2013 compared to $29.3 million in 2012. These distributions were primarily associated with the acquisition of assets by MEMP from the MRD Segment. Distributions to NGP affiliates were $355.5 million in 2013 compared to $242.2 million in 2012. The 2013 distribution was associated with the acquisition of assets by MEMP from certain affiliates of NGP in October 2013. The 2012 distribution was associated with the acquisition of assets located offshore Southern California from an affiliate of NGP.
The previous owners received contributions of $7.2 million during 2013 compared to $44.1 million during 2012. Distributions made by the previous owners totaled $2.6 million in 2013 compared to $26.5 million in 2012.
MEMP had net payments of $527.2 million during 2013 related to revolving credit facilities. Borrowings under revolving credit facilities were used primarily to fund distributions associated with acquisitions of oil and gas properties from affiliates of NGP. Proceeds from the issuance of the Senior Notes and common unit public equity offerings were used to repay borrowings under MEMP’s revolving credit facility. During 2012, MEMP had net borrowings of $269.2 million related to revolving credit facilities. These borrowings were primarily used to fund distributions associated with acquisitions of oil and gas properties from affiliates of NGP. Deferred financing costs of $20.9 million were incurred during 2013 associated with both the Senior Notes and MEMP’s revolving credit facility compared to $2.2 million incurred in 2012 related to revolving credit facilities.
Debt Agreements—MRD Segment
New Revolving Credit Facility
Concurrently with the closing of this offering, we anticipate that we will enter into a -year $ billion senior secured revolving credit facility with an initial borrowing base of $ million. We intend to redeem the PIK notes and repay all outstanding indebtedness under WildHorse Resources’ credit agreements (discussed below) with net proceeds generated from this offering and borrowings under our new credit agreement.
MRD LLC Revolving Credit Agreement (Terminated) & PIK Notes (To Be Redeemed 30 Days After Closing)
On July 13, 2012, MRD LLC entered into a two-year $50.0 million senior secured revolving credit facility with an initial borrowing base of $35.0 million. MRD LLC pledged 7,061,294 MEMP common units and
73
Table of Contents
5,360,912 MEMP subordinated units as security under the credit facility as well as its oil and gas properties and certain other assets of MRD LLC. On November 20, 2012, MRD LLC entered into a first amendment to its credit agreement, which among other things: (i) increased the aggregate maximum credit to $1.0 billion (ii) increased the borrowing base to $120.0 million and (iii) extended the maturity date to November 20, 2016. On April 25, 2013, MRD LLC entered into a second amendment to its credit agreement, which among other things: (i) increased the borrowing base to $170.0 million and (ii) designated Tanos together with its consolidating subsidiaries as additional guarantors.
On October 1, 2013, Tanos and its consolidating subsidiaries were removed as guarantors and the borrowing base was reduced to $120.0 million. On November 1, 2013, MRD LLC entered into a third amendment to its credit agreement, which among other things: (i) designated Black Diamond together with its consolidating subsidiaries as additional guarantors, (ii) reduced the borrowing base to $100.0 million, and (iii) permitted second lien indebtedness. On November 22, 2013, the borrowing base was automatically reduced to $60.0 million upon MRD LLC’s sale of 7,061,294 MEMP common units in a secondary offering. On December 18, 2013, indebtedness then outstanding under the revolving credit facility of $59.7 million and all accrued interest were paid off in full and the revolving credit facility was terminated in connection with the issuance of the PIK notes discussed below.
On December 18, 2013, the MRD Issuers completed a private placement of $350.0 million in aggregate principal amount of the PIK notes. The PIK notes were issued at 98% of par and will mature on December 15, 2018. Net proceeds from the private offering were used: (i) to repay all indebtedness then outstanding under MRD LLC’s then-existing revolving credit facility, (ii) to establish a cash reserve of $50.0 million for the payment of interest on the PIK notes, (iii) to pay a $210.0 million distribution to the Funds, and (iv) for general company purposes.
Interest on the PIK notes is payable semi-annually in arrears on June 15 and December 15 of each year, commencing on June 15, 2014. Subject to conditions in the indenture governing the PIK notes, MRD LLC is required to pay interest on the PIK notes in cash or through issuing additional notes (such an issuance, “PIK Interest”). The interest rate on the PIK notes is 10.00% per annum for interest paid in cash or 10.75% per annum for PIK Interest. Any PIK Interest will be paid by issuing additional notes having the same terms as the PIK notes. PIK notes are subject to optional redemption at prices specified in the indenture plus accrued and unpaid interest, if any. The MRD Issuers may also be required to repurchase the PIK notes upon a change of control.
At the time the PIK notes were issued, all of MRD LLC’s subsidiaries other than MEMP and BlueStone and each of their respective subsidiaries were designated as restricted subsidiaries. The indenture governing the PIK notes contains customary covenants and restrictive provisions that apply to both MRD LLC and its restricted subsidiaries, many of which will terminate if at any time no default exists under the indenture and the PIK notes receive an investment grade rating from both of two specified ratings agencies. The PIK notes are fully and unconditionally guaranteed on a senior unsecured basis by all of MRD LLC’s restricted subsidiaries, except MEMP GP and WildHorse Resources.
WildHorse Resources is party to credit arrangements (discussed below) consisting of a credit agreement and a second lien term loan, which credit arrangements impose significant restrictions on WildHorse Resources, including limitations on WildHorse Resources’ ability to distribute cash to MRD LLC. For example, distributions from WildHorse Resources to MRD LLC are subject to certain conditions under WildHorse Resources’ credit arrangements and are limited to the lesser of (i) 50% of WildHorse Resources’ net income from July 1, 2013 together with, among other things, capital contributions and returns on investments and (ii) the lesser of (x) 50% of WildHorse Resources’ net income for the four fiscal quarters preceding any such distribution and (y) $45,000,000. WildHorse Resources’ credit arrangements also include other restrictions, including restrictions on WildHorse Resources’ ability to enter into transactions with its affiliates, including MRD LLC.
The indenture also provides for customary and other events of default. In the case of an event of default arising from certain events of bankruptcy or insolvency, all outstanding PIK notes will become due and payable
74
Table of Contents
immediately without further action or notice. If any other event of default occurs and is continuing, the trustee or the holders of at least 25% in principal amount of the then outstanding PIK notes may declare all the PIK notes to be due and payable immediately.
Contemporaneous with the closing of this Offering, we will issue a redemption notice to the holders of the PIK notes pursuant to which we will redeem all outstanding PIK notes 30 days after the delivery of such notice. On the redemption date, we will pay all principal and any applicable premium and accrued and unpaid interest on such notes with a portion of the net cash proceeds of this offering. Until the redemption date of the PIK notes, we will use the amount to be paid to the holders of those notes to temporarily reduce amounts outstanding under our new revolving credit facility. We will be subject to the provisions of the PIK notes indenture until the redemption date.
WildHorse Resources Revolving Credit Facility and Second Lien Facility (To Be Terminated At Closing)
On May 12, 2010, WildHorse Resources entered into a revolving credit facility. Borrowings under the amended revolving credit facility are secured by liens on substantially all of WildHorse Resources’ properties, but in any event, not less than 80% of the total value of the WildHorse Resources’ oil and natural gas properties.
On April 3, 2013, WildHorse Resources entered into an amended and restated credit agreement. The new revolving credit facility provides for aggregate maximum credit amounts at any time of $1.0 billion, consisting of borrowings and letters of credit and has an initial borrowing base of $300.0 million. The new revolving credit facility matures on April 13, 2018. The borrowing base is subject to redetermination on at least a semi-annual basis. Borrowings under the revolving credit facility are secured by liens on substantially all of WildHorse Resources’ properties, but in any event, not less than 80% of the total value of the WildHorse Resources’ oil and natural gas properties.
On June 13, 2013, WildHorse Resources entered into a $325.0 million second lien term loan agreement that matures on December 13, 2018. No amount of second lien term loans once repaid may be reborrowed. Borrowings bear interest, at the borrower’s option, at either: (i) the Alternative Base Rate (as defined within each credit facility) plus 5.25% per annum or (ii) the applicable LIBOR plus 6.25% per annum. Borrowings under the second lien term loan agreement are secured by second-priority liens on substantially all of WildHorse Resources’ properties, but in any event, not less than 80% of the total value of the WildHorse Resources’ oil and natural gas properties. The priority of the security interests in the collateral and related creditors’ rights is set forth in an intercreditor agreement. The second lien term loan agreement contains customary affirmative and negative covenants, restrictive provisions and events of default.
On June 13, 2013, WildHorse Resources borrowed $325.0 million under its second lien term loan agreement and used such borrowings to reduce outstanding indebtedness under its revolving credit facility and to pay a one-time special $225.0 million distribution to MRD LLC. This $225.0 million distribution was subsequently distributed to the Funds.
In connection with the closing of this Offering, we anticipate that the WildHorse Resources’ revolving credit facility and second lien term loan will be repaid in full and terminated.
Black Diamond Revolving Credit Facility (Terminated)
On July 27, 2011, the Black Diamond entered into a second amended and restated revolving credit facility, which extended the maturity date of the original agreement to May 9, 2015. Borrowings under the revolving credit facility are collateralized by Black Diamond’s oil and natural gas properties. On November 1, 2013, the Black Diamond revolving credit facility was terminated. There was no indebtedness outstanding or accrued interest payable on such date.
75
Table of Contents
Debt Agreements—MEMP Segment
MEMP Revolving Credit Facility & Senior Notes
On December 14, 2011, Memorial Production Operating LLC (“OLLC”), a wholly-owned subsidiary of MEMP, entered into multi-year $1.0 billion senior secured revolving credit facility with an initial borrowing base of $300.0 million. A sixth amendment to the credit agreement was entered into on September 26, 2013, which among other things: (i) increased the facility from $1.0 billion to $2.0 billion and (ii) increased the borrowing base from $480.0 million to $920.0 million upon the closing of MEMP’s $603.0 million acquisition that closed October 1, 2013. On October 10, 2013, borrowing base was automatically reduced by $75.0 million in conjunction with the issuance of additional senior notes as discussed below in accordance with the terms of the credit facility. Borrowings under the revolving credit facility are secured by liens on substantially all of MEMP’s properties, but in any event, not less than 80% of the total value of the MEMP’s oil and natural gas properties, and all of MEMP’s equity interests in OLLC and any future guarantor subsidiaries (other than San Pedro Bay Pipeline Company) and all of MEMP’s other assets including personal property. Additionally, borrowings under the revolving credit facility bear interest, at MEMP’s option, at: (i) the Alternative Base Rate defined as the greatest of (x) the prime rate as determined by the administrative agent, (y) the federal funds effective rate plus 0.50%, and (z) the one-month adjusted LIBOR plus 1.0% (adjusted upwards, if necessary, to the next 1/100th of 1%), in each case, plus a margin that varies from 0.50% to 1.50% per annum according to the borrowing base usage (which is the ratio of outstanding borrowings and letters of credit to the borrowing base then in effect), (ii) the applicable LIBOR plus a margin that varies from 1.50% to 2.50% per annum according to the borrowing base usage, or (iii) the applicable LIBOR Market Index plus a margin that varies from 1.75% to 2.75% per annum according to the borrowing base usage. The unused portion of the borrowing base will be subject to a commitment fee that varies from 0.375% to 0.50% per annum according to the borrowing base usage.
On April 17, 2013, MEMP and Finance Corp. completed a private placement of $300.0 million aggregate principal amount of 7.625% senior unsecured notes due 2021 (the “Senior Notes”). The Senior Notes were issued at 98.521% of par and are fully and unconditionally guaranteed (subject to customary release provisions) on a joint and several basis by all of the MEMP’s subsidiaries (other than Finance Corp., which is co-issuer of the Senior Notes, and certain immaterial subsidiaries). On May 23, 2013, the Issuers issued an additional $100.0 million aggregate principal amount of the Senior Notes at 102% of par. The Senior Notes will mature on May 1, 2021 with interest accruing at a rate of 7.625% per annum and payable semi-annually in arrears on May 1 and November 1 of each year, commencing November 1, 2013. The Senior Notes are governed by an indenture. The Senior Notes are subject to optional redemption at prices specified in the indenture plus accrued and unpaid interest, if any. The Issuers may also be required to repurchase the Senior Notes upon a change of control. The indenture contains customary covenants and restrictive provisions, many of which will terminate if at any time no default exists under the indenture and the Senior Notes receive an investment grade rating from both of two specified ratings agencies. The indenture also provides for customary and other events of default. In the case of an event of default arising from certain events of bankruptcy or insolvency with respect to either of the Issuers, all outstanding Senior Notes will become due and payable immediately without further action or notice. If any other event of default occurs and is continuing, the trustee or the holders of at least 25% in principal amount of the then outstanding Senior Notes may declare all the Senior Notes to be due and payable immediately. The Issuers have agreed pursuant to registration rights agreements to file an exchange offer registration statement or, under certain circumstances, a shelf registration statement with respect to the Senior Notes no later than April 17, 2014.
Previous Owner Revolving Credit Facilities (Terminated)
On October 1, 2013, the debt balance then outstanding under the Boaz and Crown revolving credit facilities and all accrued interest was paid off in full and these revolving credit facilities were terminated. On October 1, 2013, the debt balance then outstanding under the Stanolind and Propel Energy revolving credit facilities and all accrued interest was paid off in full by MEMP on behalf of Stanolind and Propel Energy, respectively.
76
Table of Contents
Contractual Obligations
In the table below, we set forth MRD LLC’s consolidated and combined contractual obligations as of December 31, 2013. The contractual obligations that will actually be paid in future periods may vary from those reflected in the table because the estimates and assumptions are subjective.
| Payments Due by Period (in thousands) | ||||||||||||||||||||
| Contractual Obligations |
Total | 2014 | 2015 - 2016 | 2017 - 2018 | Beyond 2018 |
|||||||||||||||
| Revolving credit facility(1) |
||||||||||||||||||||
| MRD Segment |
$ | 203,100 | $ | — | $ | — | $ | 203,100 | $ | — | ||||||||||
| MEMP Segment |
103,000 | — | — | 103,000 | — | |||||||||||||||
| Estimated interest payments(2) |
||||||||||||||||||||
| MRD Segment |
20,242 | 4,671 | 9,342 | 6,229 | — | |||||||||||||||
| MEMP Segment |
14,227 | 3,348 | 6,695 | 4,184 | — | |||||||||||||||
| Notes and Second Lien Term Loan(3) |
||||||||||||||||||||
| MRD Segment |
973,500 | 59,700 | 119,400 | 794,400 | — | |||||||||||||||
| MEMP Segment |
1,100,313 | 53,375 | 106,750 | 106,750 | 833,438 | |||||||||||||||
| Asset retirement obligations(4) |
||||||||||||||||||||
| MRD Segment |
12,150 | 90 | 1,818 | 2,775 | 7,467 | |||||||||||||||
| MEMP Segment |
99,619 | — | 1,878 | 6,373 | 91,368 | |||||||||||||||
| Decommissioning Trust Agreement(5) |
||||||||||||||||||||
| MRD Segment |
— | — | — | — | — | |||||||||||||||
| MEMP Segment |
12,392 | 2,042 | 10,350 | — | — | |||||||||||||||
| Operating leases |
||||||||||||||||||||
| MRD Segment |
16,340 | 1,840 | 4,153 | 5,091 | 5,256 | |||||||||||||||
| MEMP Segment |
3,985 | 549 | 976 | 410 | 2,050 | |||||||||||||||
| Compression services |
||||||||||||||||||||
| MRD Segment |
583 | 572 | 11 | — | — | |||||||||||||||
| MEMP Segment |
6,507 | 6,507 | — | — | — | |||||||||||||||
| Drilling services |
||||||||||||||||||||
| MRD Segment |
20,323 | 20,323 | — | — | — | |||||||||||||||
| MEMP Segment |
— | — | — | — | — | |||||||||||||||
| Processing Plant Demand Fees |
||||||||||||||||||||
| MRD Segment |
118,182 | 19,347 | 51,606 | 47,229 | — | |||||||||||||||
| MEMP Segment |
— | — | — | — | — | |||||||||||||||
|
|
|
|
|
|
|
|
|
|
|
|||||||||||
| Total |
$ | 2,704,463 | $ | 172,364 | $ | 312,979 | $ | 1,279,541 | $ | 939,579 | ||||||||||
|
|
|
|
|
|
|
|
|
|
|
|||||||||||
| (1) | Represents the scheduled future maturities of principal amounts outstanding for the periods indicated. See the Notes to the Consolidated and Combined Financial Statements included elsewhere in this prospectus for information regarding our revolving credit facilities. |
| (2) | Estimated interest payments are based on the principal amount outstanding under revolving credit facilities at December 31, 2013. In calculating these amounts, we applied the weighted-average interest rate during 2013 associated with such debt. See the Notes to the Consolidated and Combined Financial Statements included elsewhere in this prospectus for the weighted-average variable interest rate charged during 2013 under these credit facilities. In addition, the estimate of payments for interest gives effect to interest rate swap agreements that were in place at December 31, 2013. |
| (3) | Represents the scheduled future interest payments and principal payments on the PIK notes, the Senior Notes and the WildHorse Resources second lien term loan. See the Notes to the Consolidated and Combined Financial Statements included elsewhere in this prospectus for information regarding debt agreements. |
| (4) | Asset retirement obligations represent estimated discounted costs for future dismantlement and abandonment costs. These obligations are recorded as liabilities on our December 31, 2013 balance sheet. See the Notes to the Consolidated and Combined Financial Statements included elsewhere in this prospectus for additional information regarding our asset retirement obligations. |
| (5) | Pursuant to a Bureau of Ocean Energy Management decommissioning trust agreement, the Partnership is required to fund a trust account to comply with supplemental regulatory bonding requirements related to decommissioning obligations for the offshore Southern California production facilities. See the Notes to the Consolidated and Combined Financial Statements included elsewhere in this prospectus for additional information. |
77
Table of Contents
Critical Accounting Policies and Estimates
Natural Gas and Oil Properties
We use the successful efforts method of accounting to account for our natural gas and oil properties. Under this method, costs of acquiring properties, costs of drilling successful exploration wells, and development costs are capitalized. The costs of exploratory wells are initially capitalized pending a determination of whether proved reserves have been found. At the completion of drilling activities, the costs of exploratory wells remain capitalized if a determination is made that proved reserves have been found. If no proved reserves have been found, the costs of each of the related exploratory wells are charged to expense. In some cases, a determination of proved reserves cannot be made at the completion of drilling, requiring additional testing and evaluation of the wells. The costs of such exploratory wells are expensed if a determination of proved reserves has not been made within a twelve-month period after drilling is complete. Exploration costs such as geological, geophysical, and seismic costs are expensed as incurred.
As exploration and development work progresses and the reserves on these properties are proven, capitalized costs attributed to the properties are subject to depreciation and depletion. Depletion of capitalized costs is provided using the units-of-production method based on proved natural gas and oil reserves related to the associated field. Capitalized drilling and development costs of producing natural gas and oil properties are depleted over proved developed reserves and leasehold costs are depleted over total proved reserves.
On the sale or retirement of a complete or partial unit of a proved property or pipeline and related facilities, the cost and related accumulated depreciation, depletion, and amortization are eliminated from the property accounts, and any gain or loss is recognized.
Proved Natural Gas and Oil Reserves
The estimates of proved natural gas and oil reserves utilized in the preparation of the consolidated and combined financial statements are estimated in accordance with the rules established by the SEC and the FASB. These rules require that reserve estimates be prepared under existing economic and operating conditions using a trailing 12-month average price with no provision for price and cost escalations in future years except by contractual arrangements. We intend to use NSAI to prepare a reserve report as of December 31 of each year for a vast majority of our proved reserves and to prepare internal estimates of our proved reserves as of June 30 of each year.
Reserve estimates are inherently imprecise. Accordingly, the estimates are expected to change as more current information becomes available. Oil and gas properties are depleted by field using the units-of-production method. It is possible that, because of changes in market conditions or the inherent imprecision of reserve estimates, the estimates of future cash inflows, future gross revenues, the amount of natural gas and oil reserves, the remaining estimated lives of natural gas and oil properties, or any combination of the above may be increased or reduced. Increases in recoverable economic volumes generally reduce per unit depletion rates while decreases in recoverable economic volumes generally increase per unit depletion rates.
A decline in proved reserves may result from lower market prices, which may make it uneconomical to drill for and produce higher cost fields. In addition, a decline in proved reserve estimates may impact the outcome of our assessment of oil and gas producing properties for impairment.
Impairments
Proved natural gas and oil properties are reviewed for impairment when events and circumstances indicate a possible decline in the recoverability of the carrying value of such properties, such as a downward revision of the reserve estimates, less than expected production, drilling results, higher operating and development costs, or lower commodity prices. The estimated undiscounted future cash flows expected in connection with the property are compared to the carrying value of the property to determine if the carrying amount is recoverable. If the carrying value of the property exceeds its estimated undiscounted future cash flows, the carrying amount of the
78
Table of Contents
property is reduced to its estimated fair value using Level 3 inputs. The factors used to determine fair value include, but are not limited to, estimates of proved reserves, future commodity prices, the timing of future production and capital expenditures and a discount rate commensurate with the risk reflective of the lives remaining for the respective oil and gas properties.
Asset Retirement Obligations
An asset retirement obligation associated with retiring long-lived assets is recognized as a liability on a discounted basis in the period in which the legal obligation is incurred and becomes determinable, with an equal amount capitalized as an addition to natural gas and oil properties, which is allocated to expense over the useful life of the asset. Generally, oil and gas producing companies incur such a liability upon acquiring or drilling a well. Accretion expense is recognized over time as the discounted liabilities are accreted to their expected settlement value. Upon settlement of the liability, a gain or loss is recognized to the extent the actual costs differ from the recorded liability.
Incentive Units
The governing documents of MRD LLC and certain of MRD LLC’s subsidiaries, including WildHorse Resources and BlueStone, provide for the issuance of incentive units. The incentive units are subject to performance conditions that affect their vesting. Compensation cost is recognized only if the performance condition is probable of being satisfied at each reporting date.
WildHorse Resources, BlueStone and MRD LLC have each granted incentive units to certain of its members who were key employees at the time of grant. Holders of incentive units are entitled to distributions ranging from 10% to 31.5% when declared, but only after cumulative distribution thresholds (payouts) have been achieved. Payouts are generally triggered after the recovery of specified members’ capital contributions plus a rate of return.
Vesting of incentive units is generally dependent upon an explicit service period, a fundamental change as defined in the respective governing document, and achievement of payout. All incentive units not vested are forfeited if an employee is no longer employed. All incentive units will be forfeited if a holder resigns whether the incentive units are vested or not. If the payouts have not yet occurred, then all incentive units, whether or not vested, will be forfeited automatically (unless extended).
Revenue Recognition
Revenue from the sale of natural gas and oil is recognized when title passes, net of royalties due to third parties. Natural gas and oil revenues are recorded using the sales method. Under this method, revenues are recognized based on actual volumes of natural gas and oil sold to purchasers, regardless of whether the sales are proportionate to our ownership in the property. An asset or a liability is recognized to the extent that we have an imbalance in excess of our proportionate share of the remaining recoverable reserves on the underlying properties.
Derivative Instruments
Commodity derivative financial instruments (e.g., swaps, floors, collars, and put options) are used to reduce the impact of natural gas and oil price fluctuations. Interest rate swaps are used to manage exposure to interest rate volatility, primarily as a result of variable rate borrowings under credit facilities. Every derivative instrument is recorded in the balance sheet as either an asset or liability measured at its fair value. Changes in the derivative’s fair value are recognized currently in earnings as we have not elected hedge accounting for any of our derivative positions.
79
Table of Contents
Income Tax
Our predecessor is organized as a pass-through entity for federal income tax purposes. As a result, members are responsible for federal income taxes on their share of our taxable income. Certain of our predecessor’s consolidated subsidiaries are taxed as corporations and subject to federal income taxes. Our predecessor is also subject to the Texas margin tax and certain aspects of the tax make it similar to an income tax as the tax is assessed on 1% of taxable margin apportioned to operations in Texas. Deferred taxes arise due to temporary differences between the financial statement carrying value of existing assets and liabilities and their respective tax basis.
Our predecessor must recognize the tax effects of any uncertain tax positions it may adopt if the position taken is more likely than not sustainable based on its technical merits. If a tax position meets such criteria, the tax effect that would be recognized by us would be the largest amount of benefit with more than a 50% chance of being realized. There were no uncertain tax positions that required recognition in the financial statements at December 31, 2013 or 2012.
Upon closing of the offering, we will be treated as a taxable C corporation and will be subject to federal and certain state income taxes. Accordingly, a pro forma income tax provision has been disclosed as if our predecessor was a taxable corporation for all periods presented. A pro forma effective tax rate of 36.06% and 35.39% was used for the years ended December 31, 2013 and 2012, respectively. If MRD LLC had affected the change in tax status on December 31, 2013, MRD LLC would have recognized a deferred tax liability of approximately $114.9 million primarily related to the tax basis of its long-lived assets being less than its book basis in those assets. MRD LLC would not have recognized any material deferred tax assets.
Unaudited Pro Forma Earnings Per Share
MRD LLC has presented pro forma earnings per share for all periods presented. Pro forma net income (loss) per basic and diluted share is determined by dividing the pro forma net income (loss) by the number of common shares expected to be outstanding immediately following the Offering.
Off–Balance Sheet Arrangements
As of December 31, 2013, we had no off–balance sheet arrangements.
Recently Issued Accounting Pronouncements
For a discussion of recent accounting pronouncements that will affect us, see the Notes to the Consolidated and Combined Financial Statements included elsewhere in this prospectus.
Quantitative and Qualitative Disclosures About Market Risk
The primary objective of the following information is to provide forward-looking quantitative and qualitative information about our potential exposure to market risk. The term “market risk” refers to the risk of loss arising from adverse changes in natural gas and oil prices and interest rates. The disclosures are not meant to be precise indicators of expected future losses, but rather indicators of how we view and manage our ongoing market risk exposures. All of our market risk sensitive instruments were entered into for hedging purposes, rather than for speculative trading.
Commodity Price Risk
Our cash flow from operations is subject to many variables, the most significant of which is the volatility of natural gas and oil prices. Natural gas and oil prices are determined primarily by prevailing market conditions, which are dependent on regional and worldwide economic activity, weather and other factors beyond our control. Our future cash flow from operations will depend on the prices of natural gas and oil and our ability to maintain and increase production through acquisitions and exploitation and development projects.
80
Table of Contents
To reduce the impact of fluctuations in natural gas and oil prices on our revenues, or to protect the economics of property acquisitions, we periodically enter into derivative contracts with respect to a portion of our projected natural gas and oil production through various transactions that fix the future prices received. These transactions may include price swaps, whereby we will receive a fixed price for our production and pay a variable market price to the contract counterparty. Additionally, we may enter into collars, whereby we receive the excess, if any, of the fixed floor over the floating rate or pays the excess, if any, of the floating rate over the fixed ceiling price. These hedging activities are intended to support natural gas and oil prices at targeted levels and to manage our exposure to natural gas and oil price fluctuations. We do not enter derivative contracts for speculative trading purposes. Our revolving credit facility contains various covenants and restrictive provisions which, among other things, limit our ability to enter into commodity price hedges exceeding a certain percentage of production.
For additional information regarding the volumes of our production covered by commodity derivative contracts and the average prices at which production is hedged as of December 31, 2013 and December 31, 2012, see the Notes to the Consolidated and Combined Financial Statements included elsewhere in this prospectus as well as the tables below.
At December 31, 2013, the MRD Segment had the following open commodity positions:
| 2014 | 2015 | 2016 | 2017 | |||||||||||||
| Natural Gas Derivative Contracts: |
||||||||||||||||
| Fixed price swap contracts: |
||||||||||||||||
| Average Monthly Volume (MMBtu) |
1,190,000 | 880,000 | 670,000 | 520,000 | ||||||||||||
| Weighted-average fixed price |
$ | 4.10 | $ | 4.19 | $ | 4.32 | $ | 4.45 | ||||||||
| Collar contracts: |
||||||||||||||||
| Average Monthly Volume (MMBtu) |
330,000 | 130,000 | — | — | ||||||||||||
| Weighted-average floor price |
$ | 4.09 | $ | 4.00 | $ | — | $ | — | ||||||||
| Weighted-average ceiling price |
$ | 5.24 | $ | 4.64 | $ | — | $ | — | ||||||||
| Basis swaps: |
||||||||||||||||
| Average Monthly Volume (MMBtu) |
270,000 | 180,000 | 220,000 | 200,000 | ||||||||||||
| Spread |
$ | (0.07 | ) | $ | (0.09 | ) | $ | (0.08 | ) | $ | (0.08 | ) | ||||
| Crude Oil Derivative Contracts: |
||||||||||||||||
| Fixed price swap contracts: |
||||||||||||||||
| Average Monthly Volume (Bbls) |
18,000 | 6,000 | — | — | ||||||||||||
| Weighted-average fixed price |
$ | 91.66 | $ | 88.50 | $ | — | $ | — | ||||||||
| Collar contracts: |
||||||||||||||||
| Average Monthly Volume (Bbls) |
8,000 | 2,000 | — | — | ||||||||||||
| Weighted-average floor price |
$ | 85.00 | $ | 85.00 | $ | — | $ | — | ||||||||
| Weighted-average ceiling price |
$ | 117.50 | $ | 101.35 | $ | — | $ | — | ||||||||
| NGL Derivative Contracts: |
||||||||||||||||
| Fixed price swap contracts: |
||||||||||||||||
| Average Monthly Volume (Bbls) |
18,000 | — | — | — | ||||||||||||
| Weighted-average fixed price |
$ | 64.27 | — | — | — | |||||||||||
81
Table of Contents
At December 31, 2013, the MEMP Segment had the following open commodity positions:
| 2014 | 2015 | 2016 | 2017 | 2018 | 2019 | |||||||||||||||||||
| Natural Gas Derivative Contracts: |
||||||||||||||||||||||||
| Fixed price swap contracts: |
||||||||||||||||||||||||
| Average Monthly Volume (MMBtu) |
2,575,458 | 2,145,278 | 2,342,442 | 2,230,067 | 2,060,000 | 1,814,583 | ||||||||||||||||||
| Weighted-average fixed price |
$ | 4.34 | $ | 4.30 | $ | 4.42 | $ | 4.31 | $ | 4.52 | $ | 4.77 | ||||||||||||
| Collar contracts: |
||||||||||||||||||||||||
| Average Monthly Volume (MMBtu) |
340,000 | 350,000 | — | — | — | — | ||||||||||||||||||
| Weighted-average floor price |
$ | 4.93 | $ | 4.62 | $ | — | $ | — | $ | — | $ | — | ||||||||||||
| Weighted-average ceiling price |
$ | 6.12 | $ | 5.80 | $ | — | $ | — | $ | — | $ | — | ||||||||||||
| Call spreads(1): |
||||||||||||||||||||||||
| Average Monthly Volume (MMBtu) |
120,000 | 80,000 | — | — | — | — | ||||||||||||||||||
| Weighted-average sold strike price |
$ | 5.08 | $ | 5.25 | $ | — | $ | — | $ | — | $ | — | ||||||||||||
| Weighted-average bought strike price |
$ | 6.31 | $ | 6.75 | $ | — | $ | — | $ | — | $ | — | ||||||||||||
| Basis swaps: |
||||||||||||||||||||||||
| Average Monthly Volume (MMBtu) |
2,822,083 | — | — | — | — | — | ||||||||||||||||||
| Spread |
$ | (0.09 | ) | $ | — | $ | — | $ | — | $ | — | $ | — | |||||||||||
| Crude Oil Derivative Contracts: |
||||||||||||||||||||||||
| Fixed price swap contracts: |
||||||||||||||||||||||||
| Average Monthly Volume (Bbls) |
136,444 | 148,281 | 142,313 | 130,600 | 122,000 | 40,000 | ||||||||||||||||||
| Weighted-average fixed price |
$ | 95.82 | $ | 93.07 | $ | 86.85 | $ | 85.96 | $ | 85.62 | $ | 85.00 | ||||||||||||
| Collar contracts: |
||||||||||||||||||||||||
| Average Monthly Volume (Bbls) |
23,000 | 5,000 | — | — | — | — | ||||||||||||||||||
| Weighted-average floor price |
$ | 82.83 | $ | 80.00 | $ | — | $ | — | $ | — | $ | — | ||||||||||||
| Weighted-average ceiling price |
$ | 105.31 | $ | 94.00 | $ | — | $ | — | $ | — | $ | — | ||||||||||||
| Basis swaps: |
||||||||||||||||||||||||
| Average Monthly Volume (Bbls) |
57,292 | 57,500 | — | — | — | — | ||||||||||||||||||
| Spread |
$ | (9.21 | ) | $ | (9.73 | ) | $ | — | $ | — | $ | — | $ | — | ||||||||||
| NGL Derivative Contracts: |
||||||||||||||||||||||||
| Fixed price swap contracts: |
||||||||||||||||||||||||
| Average Monthly Volume (Bbls) |
118,500 | 112,800 | — | — | — | — | ||||||||||||||||||
| Weighted-average fixed price |
$ | 36.23 | $ | 35.04 | $ | — | $ | — | $ | — | $ | — | ||||||||||||
| (1) | These transactions were entered into for the purpose of eliminating the ceiling portion of certain collar arrangements, which effectively converted the applicable collars into swaps. |
At December 31, 2012, the MRD Segment had the following open commodity positions:
| 2013 | 2014 | 2015 | ||||||||||
| Natural Gas Derivative Contracts: |
||||||||||||
| Fixed price swap contracts: |
||||||||||||
| Average Monthly Volume (MMBtu) |
961,000 | 540,000 | 210,000 | |||||||||
| Weighted-average fixed price |
$ | 4.08 | $ | 3.96 | $ | 4.09 | ||||||
| Collar contracts: |
||||||||||||
| Average Monthly Volume (MMBtu) |
661,000 | 430,000 | 130,000 | |||||||||
| Weighted-average floor price |
$ | 4.61 | $ | 4.18 | $ | 4.00 | ||||||
| Weighted-average ceiling price |
$ | 5.56 | $ | 5.10 | $ | 4.64 | ||||||
| Basis swaps: |
||||||||||||
| Average Monthly Volume (MMBtu) |
230,000 | 230,000 | 390,000 | |||||||||
| Spread |
$ | (0.09 | ) | $ | (0.09 | ) | $ | (0.09 | ) | |||
82
Table of Contents
| 2013 | 2014 | 2015 | ||||||||||
| Crude Oil Derivative Contracts: |
||||||||||||
| Fixed price swap contracts: |
||||||||||||
| Average Monthly Volume (Bbls) |
6,000 | — | — | |||||||||
| Weighted-average fixed price |
$ | 98.44 | $ | — | $ | — | ||||||
| Collar contracts: |
||||||||||||
| Average Monthly Volume (Bbls) |
22,750 | 14,000 | 2,000 | |||||||||
| Weighted-average floor price |
$ | 84.66 | $ | 87.86 | $ | 85.00 | ||||||
| Weighted-average ceiling price |
$ | 108.89 | $ | 111.34 | $ | 101.35 | ||||||
| NGL Derivative Contracts: |
||||||||||||
| Fixed price swap contracts: |
||||||||||||
| Average Monthly Volume (Bbls) |
28,500 | 2,000 | — | |||||||||
| Weighted-average fixed price |
$ | 54.12 | $ | 84.00 | $ | — | ||||||
At December 31, 2012, the MEMP Segment had the following open commodity positions:
| 2013 | 2014 | 2015 | 2016 | 2017 | 2018 | |||||||||||||||||||
| Natural Gas Derivative Contracts: |
||||||||||||||||||||||||
| Fixed price swap contracts: |
||||||||||||||||||||||||
| Average Monthly Volume (MMBtu) |
1,017,672 | 1,462,125 | 1,156,112 | 1,113,275 | 1,020,067 | 900,000 | ||||||||||||||||||
| Weighted-average fixed price |
$ | 4.35 | $ | 4.38 | $ | 4.28 | $ | 4.53 | $ | 4.30 | $ | 4.75 | ||||||||||||
| Collar contracts: |
||||||||||||||||||||||||
| Average Monthly Volume (MMBtu) |
1,014,000 | 340,000 | 350,000 | — | — | — | ||||||||||||||||||
| Weighted-average floor price |
$ | 4.76 | $ | 4.93 | $ | 4.62 | $ | — | $ | — | $ | — | ||||||||||||
| Weighted-average ceiling price |
$ | 5.82 | $ | 6.12 | $ | 5.80 | $ | — | $ | — | $ | — | ||||||||||||
| Call spreads(1): |
||||||||||||||||||||||||
| Average Monthly Volume (MMBtu) |
430,000 | 120,000 | 80,000 | — | — | — | ||||||||||||||||||
| Weighted-average sold strike price |
$ | 4.59 | $ | 5.08 | $ | 5.25 | $ | — | $ | — | $ | — | ||||||||||||
| Weighted-average bought strike price |
$ | 5.84 | $ | 6.31 | $ | 6.75 | $ | — | $ | — | $ | — | ||||||||||||
| Basis swaps: |
||||||||||||||||||||||||
| Average Monthly Volume (MMBtu) |
813,432 | 1,318,750 | — | — | — | — | ||||||||||||||||||
| Spread |
$ | (0.11 | ) | $ | (0.09 | ) | $ | — | $ | — | $ | — | $ | — | ||||||||||
| Crude Oil Derivative Contracts: |
||||||||||||||||||||||||
| Fixed price swap contracts: |
||||||||||||||||||||||||
| Average Monthly Volume (Bbls) |
70,632 | 35,102 | 12,031 | 11,013 | 10,000 | — | ||||||||||||||||||
| Weighted-average fixed price |
$ | 103.32 | $ | 94.27 | $ | 90.29 | $ | 90.39 | $ | 88.30 | $ | — | ||||||||||||
| Collar contracts: |
||||||||||||||||||||||||
| Average Monthly Volume (Bbls) |
36,750 | 52,158 | 50,000 | 44,000 | 42,000 | — | ||||||||||||||||||
| Weighted-average floor price |
$ | 84.73 | $ | 90.51 | $ | 89.00 | $ | 85.00 | $ | 85.00 | $ | — | ||||||||||||
| Weighted-average ceiling price |
$ | 108.07 | $ | 107.03 | $ | 103.31 | $ | 103.40 | $ | 99.00 | $ | — | ||||||||||||
| Call contracts: |
||||||||||||||||||||||||
| Average Monthly Volume (Bbls) |
10,000 | — | — | — | — | — | ||||||||||||||||||
| Weighted-average fixed price |
$ | 115.00 | $ | — | $ | — | $ | — | $ | — | $ | — | ||||||||||||
| NGL Derivative Contracts: |
||||||||||||||||||||||||
| Fixed price swap contracts: |
||||||||||||||||||||||||
| Average Monthly Volume (Bbls) |
30,805 | 16,300 | — | — | — | — | ||||||||||||||||||
| Weighted-average fixed price |
$ | 53.19 | $ | 58.91 | $ | — | $ | — | $ | — | $ | — | ||||||||||||
| (1) | These transactions were entered into for the purpose of eliminating the ceiling portion of certain collar arrangements, which effectively converted the applicable collars into swaps. |
83
Table of Contents
Interest Rate Risk
Periodically, we enter into interest rate swaps to mitigate exposure to market rate fluctuations by converting variable interest rates such as those in our credit agreement to fixed interest rates. See the Notes to the Consolidated and Combined Financial Statements included elsewhere in this prospectus for additional information regarding fixed-for-floating interest rate swap open positions as of December 31, 2013 and December 31, 2012 as well as the tables below.
At December 31, 2013, we had the following interest rate swap open positions:
| Credit Facility |
2014 | 2015 | 2016 | |||||||||
| MEMP: |
||||||||||||
| Average Monthly Notional (in thousands) |
$ | 173,958 | $ | 280,833 | $ | 150,000 | ||||||
| Weighted-average fixed rate |
1.306 | % | 1.416 | % | 1.193 | % | ||||||
| Floating rate |
1 Month LIBOR | 1 Month LIBOR | 1 Month LIBOR | |||||||||
| WildHorse Resources: |
||||||||||||
| Average Monthly Notional (in thousands) |
$ | 118,750 | $ | 100,000 | $ | — | ||||||
| Weighted-average fixed rate |
0.773 | % | 0.758 | % | — | |||||||
| Floating rate |
1 Month LIBOR | 1 Month LIBOR | — | |||||||||
At December 31, 2012, we had the following interest rate swap open positions:
| Credit Facility |
2013 | 2014 | 2015 | 2016 | ||||||||||||
| MEMP: |
||||||||||||||||
| Average Monthly Notional (in thousands) |
$ | 162,500 | $ | 150,000 | $ | 150,000 | $ | 150,000 | ||||||||
| Weighted-average fixed rate |
1.148 | % | 1.193 | % | 1.193 | % | 1.193 | % | ||||||||
| Floating rate |
1 Month LIBOR | 1 Month LIBOR | 1 Month LIBOR | 1 Month LIBOR | ||||||||||||
| WildHorse Resources: |
||||||||||||||||
| Average Monthly Notional (in thousands) |
$ | 150,667 | $ | 118,750 | $ | 100,000 | $ | — | ||||||||
| Weighted-average fixed rate |
0.779 | % | 0.773 | % | 0.758 | % | — | |||||||||
| Floating rate |
1 Month LIBOR | 1 Month LIBOR | 1 Month LIBOR | — | ||||||||||||
| Tanos: |
||||||||||||||||
| Average Monthly Notional (in thousands) |
$ | 30,000 | $ | — | $ | — | $ | — | ||||||||
| Weighted-average fixed rate |
1.362 | % | — | — | — | |||||||||||
| Floating rate |
1 Month LIBOR | — | — | — | ||||||||||||
| WHT: |
||||||||||||||||
| Average Monthly Notional (in thousands) |
$ | 75,000 | $ | 25,000 | $ | — | $ | — | ||||||||
| Weighted-average fixed rate |
1.510 | % | 1.510 | % | — | — | ||||||||||
| Floating rate |
1 Month LIBOR | 1 Month LIBOR | — | — | ||||||||||||
| Previous Owners: |
||||||||||||||||
| Average Monthly Notional (in thousands) |
$ | 11,500 | 5,750 | $ | — | $ | — | |||||||||
| Weighted-average fixed rate |
0.500 | % | 0.500 | % | — | — | ||||||||||
| Floating rate |
1 Month LIBOR | 1 Month LIBOR | — | — | ||||||||||||
84
Table of Contents
Counterparty and Customer Credit Risk
Our principal exposures to credit risk are through receivables resulting from commodity derivatives and the sale of our oil and gas production, which we market to energy companies.
By using derivative instruments that are not traded on an exchange to hedge exposures to changes in commodity prices, we expose ourselves to the credit risk of our counterparties. Credit risk is the potential failure of the counterparty to perform under the terms of the derivative contract. When the fair value of a derivative contract is positive, the counterparty is expected to owe us, which creates the credit risk. To minimize the credit risk in derivative instruments, it is our policy to enter into derivative contracts only with counterparties that are creditworthy financial institutions deemed by management as competent and competitive market-makers. The creditworthiness of our counterparties is subject to periodic review. As of December 31, 2013, all of our derivative contracts are with major financial institutions who are also lenders under our revolving credit facilities. See the Notes to the Consolidated and Combined Financial Statements included elsewhere in this prospectus for additional information.
We are also subject to credit risk due to the concentration of our natural gas and oil receivables with several significant customers. We do not require our customers to post collateral, and the inability of our significant customers to meet their obligations to us or their insolvency or liquidation may adversely affect our financial results.
85
Table of Contents
MRD LLC has two reportable business segments, both of which are engaged in the acquisition, exploitation, development and production of oil and natural gas properties:
| • | MRD—reflects all of MRD LLC’s consolidating subsidiaries except for MEMP. |
| • | MEMP—reflects the consolidated and combined operations of MEMP. |
Because we control MEMP through our ownership of its general partner, its business and operations are consolidated with ours for financial reporting purposes, even though we own a minority of its partner interests. As a result, our financial statements and notes thereto included elsewhere in this prospectus consolidate MEMP’s business and assets with ours. However, except where expressly noted to the contrary, the following discussion of our business, operations and assets and the use of the terms “we”, “our” and “us” excludes MEMP’s business, operations and assets. See “—MEMP” for information regarding MEMP’s business and assets. In addition, because BlueStone will not be included in the assets that MRD LLC will contribute to us in connection with the restructuring transactions, unless stated otherwise, the information in this section does not include BlueStone.
We are an independent natural gas and oil company focused on the exploitation, development, and acquisition of natural gas, NGL and oil properties with a majority of our activity in the Terryville Complex of North Louisiana, where we are targeting overpressured, liquids-rich natural gas opportunities in multiple zones in the Cotton Valley formation. Our total leasehold position is 347,458 gross (205,818 net) acres, of which 60,041 gross (51,522 net) acres are in what we believe to be the core of the Terryville Complex. We are focused on creating shareholder value primarily through the development of our sizeable horizontal inventory.
MEMP is engaged in the acquisition, exploitation, development and production of oil and natural gas properties, with assets consisting primarily of producing oil and natural gas properties that are principally located in East Texas/North Louisiana, the Permian Basin, offshore Southern California, the Rockies, the Eagle Ford and South Texas. Most of MEMP’s properties are located in large, mature oil and natural gas reservoirs with well-known geologic characteristics and long-lived, predictable production profiles and modest capital requirements. MEMP is focused on generating stable cash flows, to allow MEMP to make quarterly cash distributions to its unitholders and, over time, to increase those quarterly cash distributions.
MRD
Overview
As of December 31, 2013, we had 1,297 gross (892 net) identified horizontal drilling locations, of which over 1,146 gross (796 net) identified horizontal drilling locations are located in the Terryville Complex. These total net identified horizontal drilling locations represent an inventory of over 26 years based on our expected 2014 drilling program. We believe our inventory to be repeatable and capable of generating high returns based on the extensive production history in the area, the results of our horizontal wells drilled to date, and the consistent reservoir quality across multiple target formations. As of December 31, 2013, we had estimated proved, probable and possible reserves of approximately 1,126 Bcfe, 800 Bcfe and 1,034 Bcfe, respectively. As of such date, we operated 98% of our proved reserves, 71% of which were natural gas. For the three months ended December 31, 2013, 45% of our pro forma MRD Segment revenues were attributable to natural gas production, 28% to NGLs and 27% to oil. For the year ended December 31, 2013, we generated pro forma MRD Segment Adjusted EBITDA of $173 million and pro forma net income of $ million, and made pro forma total capital expenditures of $204 million, including $70 million for wells coming online in 2014. Please see “—Summary Historical Consolidated and Combined Pro Forma Financial Data—Adjusted EBITDA” for an explanation of the basis for the pro forma presentation and our use of Adjusted EBITDA to measure the MRD Segment’s profitability.
86
Table of Contents
Our average net daily production for the three months ended December 31, 2013 was 137 MMcfe/d (approximately 70% natural gas, 22% NGLs and 8% oil) and our reserve life was 23 years. As of December 31, 2013, we produced from 95 horizontal wells and 800 vertical wells. The Terryville Complex represented 83% of our total net production for the three months ended December 31, 2013. Our estimated average net daily production for the period from February 1 through February 28, 2014 was 172 MMcfe/d, of which 69% was from natural gas. Our estimated average net daily production from our properties in the Terryville Complex for the same period was 150 MMcfe/d, or 87% of our total production. In the Terryville Complex, we completed and brought online two additional horizontal wells during the first quarter of 2014, bringing our total number of producing horizontal wells to 23 in our primary formations. The 30-day initial production rates of our two most recent wells averaged 15.9 MMcfe/d, which compares to an average 30-day initial production rate of 15.1 MMcfe/d for all of our Terryville Complex horizontal wells drilled to date.
The following chart provides information regarding our production growth and the increasing proportion of our horizontal well production since the beginning of 2012.
Our Properties
Cotton Valley—Overview
The Cotton Valley formation extends across East Texas, North Louisiana and Southern Arkansas. The formation has been under development since the 1930s and is characterized by thick, multi-zone natural gas and oil reservoirs with well-known geologic characteristics and long-lived, predictable production profiles. Over 21,000 vertical wells have been completed throughout the play. In 2005, operators started redeveloping the Cotton Valley using horizontal drilling and advanced hydraulic fracturing techniques. To date, operators have drilled over 600 horizontal Cotton Valley wells. Some large, analogous redevelopment projects in the Cotton Valley include the Nan-Su-Gail Field in Freestone County, East Texas, where over 40 horizontal wells have been drilled by operators such as Devon Energy Corporation and Marathon Oil Corporation, and the Carthage Complex in Panola County, East Texas, where operators such as ExxonMobil Corporation, ConocoPhillips and Anadarko Petroleum Corporation have drilled over 153 horizontal wells.
87
Table of Contents
Cotton Valley—Terryville Complex Horizontal Redevelopment
We are currently engaged in the horizontal redevelopment of the Terryville Complex in Lincoln Parish, Louisiana utilizing horizontal drilling and completion techniques similar to those employed at the Nan-Su-Gail Field, Carthage Complex in East Texas and other major resource plays across the United States. We have assembled a largely contiguous acreage position in the Terryville Complex of approximately 60,041 gross (51,522 net) acres as of December 31, 2013. The majority of our current and planned development is focused in and around what we believe to be the core of the Terryville Complex.
We entered the Terryville Complex via an acquisition from Petrohawk Energy Corporation in April 2010, with the goal of redeveloping the field with horizontal drilling and modern completion techniques. Since that acquisition, we have completed multiple bolt-on acquisitions and in-fill leases to build our current position. We believe the Terryville Complex, which has been producing since 1954, is one of North America’s most prolific natural gas fields, characterized by high recoveries relative to drilling and completion costs, high initial production rates with high liquids yields, long reserve life, multiple stacked producing zones, available infrastructure and a large number of service providers.
After initially drilling eight vertical pilot wells in the Terryville Complex, we commenced a horizontal drilling program in 2011 to further delineate and define our position. In 2013, we shifted our operational focus to full-scale horizontal redevelopment of the Terryville Complex, going from two rigs to four rigs by the end of that year. Additionally, in the fourth quarter of 2013, we moved to drilling on multi-well pads that allow us to more efficiently drill wells and control costs as we develop our stacked pay zones. We intend to dedicate approximately $264 million of our $316 million drilling and completion budget in 2014 to develop multiple zones within the Terryville Complex, where we expect to drill and complete 35 gross (30 net) wells. Our horizontal redevelopment program in the Terryville Complex will be focused on increasing our well performance and recoveries.
Within the Terryville Complex, as of December 31, 2013, we had 945 Bcfe, 688 Bcfe and 966 Bcfe of estimated proved, probable and possible reserves, respectively, and a drilling inventory consisting of 1,146 gross (796 net) identified horizontal drilling locations, including 91 gross (72 net) drilling locations to which we have attributed proved undeveloped reserves as of December 31, 2013. Since initiating our horizontal drilling program in 2011, we have drilled 23 gross (18.4 net) horizontal wells, growing our gross daily production in the Terryville Complex by 294% from 53.0 MMcfe/d for the three months ended March 31, 2010 to 208.6 MMcfe/d for the month ended February 28, 2014. For the three months ended December 31, 2013, 42% of our revenues from the Terryville Complex were attributable to natural gas, 29% to NGLs and 29% to oil. Within the Terryville Complex, on a proved reserves basis, we operate approximately 99% of our existing acreage and hold an average working interest of approximately 74% across our acreage. Our high operating control allows us to more efficiently and economically manage the redevelopment of this extensive resource.
We believe seismic data, as well as information gathered from the results of our existing 275 vertical and 23 horizontal wells throughout the field, support the existence of at least ten stacked pay zones across the Terryville Complex. Our redevelopment program currently targets four of the stacked pay zones in the Cotton Valley formation—zones we term the Upper Red, Lower Red, Lower Deep Pink and Upper Deep Pink, all of which we are developing with horizontal wells through pad drilling. These four zones have an overall thickness ranging from 400 to 890 feet across our acreage position. We believe the overpressured nature of this section of the Cotton Valley formation is highly productive when accessed through horizontal drilling and fracture stimulation technologies. These qualities, when combined with the liquids-rich nature of the natural gas, high initial rates of production and competitive well costs, produce what we believe to be amongst the highest rate of return wells in the nation.
88
Table of Contents
The table below details certain information on estimated ultimate recoveries and production for the 23 horizontal wells currently producing in the Terryville Complex. Our well results have shown consistency in initial production, decline rates and estimated ultimate recovery. The consistency of these results gives us confidence that the full-scale redevelopment of the Terryville Complex we began in 2013 will be successful as we move from four to five rigs in 2014.
| Lateral Length (Feet) |
Gross Wellhead Flow Rates After Processing |
|||||||||||||||||||||||||||||||||||||||||||||||||||||||||||||||||||
| Producing Wells |
|
|
|
|
||||||||||||||||||||||||||||||||||||||||||||||||||||||||||||||||
| EUR (2) | EUR Bcfe/ 1,000’ |
Cumulative Production | (MMcfe/d) (3)(4) | D&C ($MM) |
||||||||||||||||||||||||||||||||||||||||||||||||||||||||||||||||
| Well Name (1) |
Bcfe | %Gas | %NGL | %Oil | First Production |
Days Producing |
Bcfe | %Gas | %NGL | %Oil | 0-30 | 0-90 | 91-180 | 181-360 | ||||||||||||||||||||||||||||||||||||||||||||||||||||||
| Upper Red Zone |
||||||||||||||||||||||||||||||||||||||||||||||||||||||||||||||||||||
| LD Barnett 23H-2 |
4,015 | 13.6 | 69 | % | 27 | % | 4 | % | 3.4 | 1/30/12 | 761 | 4.2 | 71 | % | 24 | % | 5 | % | 14.5 | 12.0 | 7.7 | 5.5 | 6.7 | |||||||||||||||||||||||||||||||||||||||||||||
| Colquitt 20 17H-1 |
4,357 | 11.2 | 80 | % | 18 | % | 2 | % | 2.6 | 7/30/12 | 579 | 3.6 | 82 | % | 17 | % | 2 | % | 17.5 | 12.6 | 7.2 | 5.1 | 7.7 | |||||||||||||||||||||||||||||||||||||||||||||
| Dowling 22 15H-1 |
5,376 | 16.8 | 75 | % | 23 | % | 2 | % | 3.1 | 9/22/12 | 525 | 4.8 | 80 | % | 18 | % | 3 | % | 16.3 | 15.6 | 11.1 | 8.2 | 8.8 | |||||||||||||||||||||||||||||||||||||||||||||
| Nobles 13H-1 |
4,216 | 11.6 | 66 | % | 23 | % | 11 | % | 2.8 | 11/17/12 | 469 | 3.9 | 66 | % | 21 | % | 13 | % | 21.5 | 16.7 | 9.9 | 6.5 | 7.8 | |||||||||||||||||||||||||||||||||||||||||||||
| Sidney McCullin 16 21H-1 |
4,604 | 16.9 | 75 | % | 22 | % | 2 | % | 3.7 | 1/19/13 | 406 | 4.1 | 81 | % | 16 | % | 3 | % | 17.4 | 14.2 | 10.8 | 8.2 | 8.1 | |||||||||||||||||||||||||||||||||||||||||||||
| Wright 14 11 HC-1 |
5,250 | 18.0 | 68 | % | 26 | % | 6 | % | 3.4 | 5/27/13 | 278 | 4.0 | 65 | % | 28 | % | 8 | % | 19.6 | 18.1 | 16.1 | 8.8 | ||||||||||||||||||||||||||||||||||||||||||||||
| BF Fallin 22 15H-1 |
5,122 | 15.6 | 73 | % | 24 | % | 3 | % | 3.0 | 6/17/13 | 257 | 2.8 | 74 | % | 22 | % | 4 | % | 14.8 | 13.7 | 11.8 | 7.5 | ||||||||||||||||||||||||||||||||||||||||||||||
| Dowling 20 17H-1 |
4,327 | 8.9 | 73 | % | 25 | % | 2 | % | 2.1 | 7/22/13 | 222 | 1.7 | 77 | % | 20 | % | 3 | % | 15.2 | 11.0 | 5.6 | 10.7 | ||||||||||||||||||||||||||||||||||||||||||||||
| Gleason 31H-1 |
3,692 | 2.5 | 92 | % | 8 | % | — | 0.7 | 8/12/13 | 201 | 0.4 | 92 | % | 8 | % | — | 3.5 | 2.7 | 1.8 | 9.4 | ||||||||||||||||||||||||||||||||||||||||||||||||
| Burnett 26H-1 |
2,405 | 4.2 | 71 | % | 25 | % | 4 | % | 1.7 | 9/22/13 | 160 | 0.7 | 70 | % | 26 | % | 4 | % | 6.9 | 5.5 | 6.6 | |||||||||||||||||||||||||||||||||||||||||||||||
| Drewett 17 8H-1 |
4,010 | 14.0 | 67 | % | 23 | % | 10 | % | 3.5 | 11/13/13 | 108 | 1.9 | 61 | % | 28 | % | 11 | % | 22.1 | 18.7 | 7.7 | |||||||||||||||||||||||||||||||||||||||||||||||
| Wright 13 12 HC-2 |
6,009 | 18.1 | 69 | % | 23 | % | 8 | % | 3.0 | 12/21/13 | 70 | 1.5 | 78 | % | 10 | % | 12 | % | 24.0 | 7.9 | ||||||||||||||||||||||||||||||||||||||||||||||||
| LA Minerals 15 22H-2 |
5,814 | NA | NA | NA | NA | NA | 1/21/14 | 39 | 0.7 | NA | NA | NA | 18.0 | 8.4 | ||||||||||||||||||||||||||||||||||||||||||||||||||||||
| Lower Red Zone |
||||||||||||||||||||||||||||||||||||||||||||||||||||||||||||||||||||
| TL McCrary 14H-1 |
4,544 | 12.8 | 70 | % | 27 | % | 3 | % | 2.8 | 5/1/12 | 669 | 3.9 | 73 | % | 23 | % | 4 | % | 14.4 | 11.7 | 8.3 | 5.4 | 7.7 | |||||||||||||||||||||||||||||||||||||||||||||
| Nobles 13H-2 |
4,060 | 9.2 | 70 | % | 25 | % | 5 | % | 2.3 | 11/17/12 | 469 | 2.9 | 69 | % | 22 | % | 8 | % | 16.0 | 11.9 | 8.4 | 5.2 | 7.8 | |||||||||||||||||||||||||||||||||||||||||||||
| LA Methodist Orphanage 14H-1 |
3,637 | 12.1 | 70 | % | 24 | % | 6 | % | 3.3 | 2/15/13 | 379 | 3.3 | 70 | % | 22 | % | 8 | % | 14.0 | 13.0 | 9.7 | 6.3 | 9.1 | |||||||||||||||||||||||||||||||||||||||||||||
| Dowling 21 16H-1 |
4,590 | 9.4 | 77 | % | 21 | % | 1 | % | 2.0 | 3/18/13 | 348 | 2.3 | 84 | % | 14 | % | 2 | % | 13.0 | 10.1 | 6.5 | 6.6 | ||||||||||||||||||||||||||||||||||||||||||||||
| Drewett 17 8H-2 |
3,700 | 3.7 | 69 | % | 24 | % | 7 | % | 1.0 | 11/13/13 | 108 | 0.6 | 64 | % | 29 | % | 7 | % | 8.7 | 6.2 | 6.8 | |||||||||||||||||||||||||||||||||||||||||||||||
| Wright 13 12 HC-1 |
5,409 | 8.2 | 68 | % | 22 | % | 10 | % | 1.5 | 12/21/13 | 70 | 0.9 | 77 | % | 10 | % | 13 | % | 15.6 | 9.0 | ||||||||||||||||||||||||||||||||||||||||||||||||
| LA Minerals 15 22H-1 |
5,926 | NA | NA | NA | NA | NA | 1/21/14 | 39 | 0.5 | NA | NA | NA | 13.8 | 7.9 | ||||||||||||||||||||||||||||||||||||||||||||||||||||||
| Lower Deep Pink Zone |
||||||||||||||||||||||||||||||||||||||||||||||||||||||||||||||||||||
| LA Methodist Orphanage 14H-2 |
3,550 | 12.2 | 68 | % | 24 | % | 8 | % | 3.4 | 2/15/13 | 379 | 2.8 | 68 | % | 21 | % | 10 | % | 14.3 | 11.6 | 7.6 | 5.7 | 6.1 | |||||||||||||||||||||||||||||||||||||||||||||
| Wright 13 12 HC-3 |
5,706 | 6.3 | 69 | % | 23 | % | 8 | % | 1.1 | 12/21/13 | 70 | 0.8 | 79 | % | 10 | % | 12 | % | 13.2 | 7.1 | ||||||||||||||||||||||||||||||||||||||||||||||||
| Wright 13 12 HC-4 |
5,010 | 5.0 | 69 | % | 22 | % | 9 | % | 1.0 | 12/21/13 | 70 | 0.7 | 78 | % | 10 | % | 12 | % | 12.6 | 6.0 | ||||||||||||||||||||||||||||||||||||||||||||||||
| Averages |
||||||||||||||||||||||||||||||||||||||||||||||||||||||||||||||||||||
| All Wells |
4,580 | 11.0 | 72 | % | 23 | % | 5 | % | 2.5 | 290 | 2.3 | 74 | % | 19 | % | 7 | % | 15.1 | 12.1 | 8.8 | 6.2 | 7.8 | ||||||||||||||||||||||||||||||||||||||||||||||
| Upper Red |
4,554 | 12.6 | 73 | % | 22 | % | 5 | % | 2.7 | 313 | 2.6 | 75 | % | 20 | % | 6 | % | 16.3 | 12.8 | 9.1 | 6.7 | 8.2 | ||||||||||||||||||||||||||||||||||||||||||||||
| Lower Red |
4,552 | 9.2 | 71 | % | 24 | % | 5 | % | 2.2 | 297 | 2.1 | 73 | % | 20 | % | 7 | % | 13.6 | 10.6 | 8.2 | 5.6 | 7.8 | ||||||||||||||||||||||||||||||||||||||||||||||
| Lower Deep Pink |
4,755 | 7.8 | 69 | % | 23 | % | 9 | % | 1.8 | 173 | 1.4 | 75 | % | 14 | % | 11 | % | 13.4 | 11.6 | 7.6 | 5.7 | 6.4 | ||||||||||||||||||||||||||||||||||||||||||||||
| (1) | The wells in this table are included within our proved developed producing reserve category in our reserve report as of December 31, 2013. LA Minerals 15 22H-1 and LA Minerals 15 22H-2 both started producing in January 2014 so they have not been included in the year-end reserve report. |
| (2) | EUR represents the Estimated Ultimate Recovery or sum of total gross remaining reserves attributable to each location in our reserve report and cumulative sales from such location. EUR is shown on a combined basis for oil/condensates, gas and NGLs, after the effects of processing. |
| (3) | Production data is as of February 28, 2014 and shown gross on a combined basis after the effects of processing. |
| (4) | Periodic flow rates start on day 4, with days 1 through 3 used to allow clean up associated with well completion. The 30-day flow rates therefore start on day 4 and continue 30 days to day 33 and the 90-day flow rates go from day 4 to day 93. |
89
Table of Contents
East Texas
We own and operate approximately 24,458 gross (19,776 net) acres as of December 31, 2013 in Panola and Shelby Counties in Texas, where we are currently producing primarily from the Cotton Valley, Travis Peak and Bossier formations and targeting the Cotton Valley formation for future development. From January 1, 2011 through December 31, 2013, we have drilled and completed 28 gross (10.3 net) wells and are operating one rig in East Texas as of December 31, 2013. In 2014, we plan to invest $36 million to drill and complete 8 gross (6 net) wells in East Texas in the Joaquin Field of Panola and Shelby Counties. As of December 31, 2013, we had approximately 108 gross identified horizontal drilling locations in East Texas, including 54 gross (43 net) drilling locations to which we have attributed proved undeveloped reserves as of December 31, 2013. For the three months ended December 31, 2013, our average net daily production from our East Texas properties was 21 MMcfe/d, of which 76% was natural gas. Within our East Texas properties, on a proved reserves basis, we operate approximately 94% of our existing properties.
Rockies & Other
We own approximately 162,375 gross (66,191 net) acres as of December 31, 2013 in our Rockies & Other region and for the three months ended December 31, 2013 our average net daily production from this region was 1 MMcfe/d. In 2014, we plan to operate one rig and invest $12 million to drill 3 gross (3 net) vertical wells in the Tepee Field of the Piceance Basin targeting the Mancos and Williams Fork formations. We also plan to invest $4 million to participate in 12 gross horizontal wells (1.1 net) operated by SandRidge Energy Inc. in the Mississippian oil play of Northern Oklahoma. As of December 31, 2013, we had approximately 174 gross identified vertical drilling locations in the Tepee Field in our Rockies & Other area.
Reserves
Our estimates of proved reserves are prepared by NSAI, and our estimates of probable and possible reserves are prepared by our management and audited by NSAI. As of December 31, 2013, we had 1,126 Bcfe, 800 Bcfe and 1,034 Bcfe of estimated proved, probable and possible reserves, respectively. As of this date, our proved reserves were 71% gas and 29% NGLs and oil. Additionally, the PV-10 of our proved reserves was $1,469 million, the PV-10 for our probable reserves was $1,052 million and the PV-10 for our possible reserves was $1,342 million. The following table provides summary information regarding our estimated proved, probable and possible reserves data by area based on our reserve report and our average net daily production by area for the three months ended December 31, 2013:
| Proved Total (Bcfe) |
% Gas | % Developed |
Proved PV-10 (in millions)(1) |
Probable Total (Bcfe)(2) |
Probable PV-10 (in millions)(1) |
Possible Total (Bcfe)(2) |
Possible PV-10 (in millions)(1) |
Average Net Daily Production MMcfe/d |
||||||||||||||||||||||||||||
| Terryville Complex |
945 | 71 | % | 33 | % | $ | 1,341 | 688 | $ | 1,032 | 966 | $ | 1,339 | 115 | ||||||||||||||||||||||
| East Texas |
175 | 75 | % | 29 | % | 110 | 109 | 18 | 66 | 3 | 21 | |||||||||||||||||||||||||
| Rockies & Other |
6 | 49 | % | 100 | % | 18 | 2 | 2 | 2 | 1 | 1 | |||||||||||||||||||||||||
|
|
|
|
|
|
|
|
|
|
|
|
|
|
|
|
|
|
|
|||||||||||||||||||
| Total |
1,126 | 71 | % | 33 | % | $ | 1,469 | 800 | $ | 1,052 | 1,034 | $ | 1,342 | 137 | ||||||||||||||||||||||
|
|
|
|
|
|
|
|
|
|
|
|
|
|
|
|||||||||||||||||||||||
| (1) | In this prospectus, we have disclosed our PV-10 based on our reserve report. PV-10 is a non-GAAP financial measure and represents the period-end present value of estimated future cash inflows from our natural gas and crude oil reserves, less future development and production costs, discounted at 10% per annum to reflect timing of future cash flows and using SEC pricing assumptions in effect at the end of the period. SEC pricing for natural gas and oil of $3.67 per Mcf and $93.42 per Bbl was based on the unweighted average of the first-day-of-the-month prices for each of the twelve months preceding December 2013. PV-10 differs from standardized measure, the most directly comparable GAAP financial measure, because it does not include the effects of income taxes. Moreover, GAAP does not provide a measure of estimated future net cash flows for reserves other than proved reserves. Because PV-10 estimates of probable and possible reserves are more uncertain than PV-10 and standardized estimates of proved reserves, but have not been adjusted for risk due to |
90
Table of Contents
| that uncertainty, they may not be comparable with each other. Nonetheless, we believe that PV-10 estimates for reserve categories other than proved present useful information for investors about the future net cash flows of our reserves in the absence of a comparable GAAP measure such as standardized measure. Because of this, PV-10 can be used within the industry and by creditors and securities analysts to evaluate estimated net cash flows from proved reserves on a more comparable basis. In addition, investors should be cautioned that estimates of PV-10 for probable and possible reserves, as well as the underlying volumetric estimates, are inherently more uncertain of being recovered and realized than comparable measures for proved reserves, and that the uncertainty for possible reserves is even more significant. Our PV-10 estimates of proved reserves and our standardized measure are equivalent because, prior to the completion of this offering, we were not subject to entity level taxation. Accordingly, no provision for federal income taxes has been provided because taxable income has been passed through to our equity holders. After this offering, we will be treated as a taxable entity for federal income tax purposes and our future income taxes will be dependent upon our future taxable income. Neither PV-10 nor standardized measure represents an estimate of fair market value of our natural gas and oil properties. We and others in the industry use PV-10 as a measure to compare the relative size and value of estimated reserves held by companies without regard to the specific tax characteristics of such entities. |
| (2) | Substantially all of our estimated probable and possible reserves are classified as undeveloped. |
Drilling Inventory and Capital Budget
We intend to develop our multi-year drilling inventory by utilizing our significant expertise in horizontal drilling and fracture stimulation to grow our production, reserves and cash flow. For 2014, we have budgeted a total of $316 million to drill and complete 49 gross (39 net) operated wells and to participate in 12 gross (1.1 net) non-operated wells. We expect to fund our 2014 development primarily from cash flows from operations. The majority of our drilling locations and our 2014 development program are focused on the Terryville Complex, where we plan to invest $264 million on drilling and completing 33 gross (28 net) horizontal wells and 2 gross (2 net) vertical wells. Approximately $5.0 million of our Terryville Complex budget is allocated towards the drilling of vertical wells and routine facilities maintenance. In East Texas, we plan to invest $36 million on drilling and completing 8 gross (6 net) horizontal wells. In our Rockies & Other area we plan to invest $12 million on drilling and completing 3 gross (3 net) vertical wells in the Tepee Field and $4 million to participate in 12 gross (1.1 net) horizontal wells operated by SandRidge Energy Inc. in the Mississippian oil play of Northern Oklahoma.
The following table provides information regarding our acreage and drilling locations by area, as of December 31, 2013, except for projected 2014 information:
| Gross Horizontal Drilling Locations(1)(2) | Net Horizontal Drilling Inventory (years) |
2014 Projected Operated Net Wells to be Drilled(3) |
2014 Projected Capital Budget ($MM) |
|||||||||||||||||||||||||||||||||||||||||
| Net Acreage |
WI% | Total | ||||||||||||||||||||||||||||||||||||||||||
| Proved | Probable | Possible | Management | Gross | Net | |||||||||||||||||||||||||||||||||||||||
| Terryville Complex |
96,733 | 74 | % | 91 | 147 | 165 | 743 | 1,146 | 796 | 28 | 30 | $ | 264 | |||||||||||||||||||||||||||||||
| East Texas |
42,894 | 79 | % | 54 | 39 | 15 | — | 108 | 92 | 15 | 6 | 36 | ||||||||||||||||||||||||||||||||
| Rockies & Other |
66,191 | 41 | % | — | 23 | 20 | — | 43 | 4 | — | 3 | 16 | ||||||||||||||||||||||||||||||||
|
|
|
|
|
|
|
|
|
|
|
|
|
|
|
|
|
|
|
|
|
|
|
|||||||||||||||||||||||
| Total |
205,818 | 59 | % | 145 | 209 | 200 | 743 | 1,297 | 892 | 26 | 39 | $ | 316 | |||||||||||||||||||||||||||||||
| (1) | The above table excludes 192 proved vertical drilling locations in the reserve report in the Terryville Complex and 174 identified vertical locations based on management estimates in the Rockies and Other region. |
| (2) | Please see “Business—Our Operations—Drilling Locations” for more information regarding the process and criteria through which these drilling locations were identified. The drilling locations on which we actually drill will depend on the availability of capital, regulatory approval, commodity prices, costs, actual drilling results and other factors. Please see “Risk Factors—Risks Related to Our Business—Our identified drilling locations, which are scheduled out over many years, are susceptible to uncertainties that could materially alter the occurrence or timing of their drilling.” Proved, probable and possible locations are based on our reserve report. Management locations are based on management estimates. |
| (3) | Represents net operated wells only. Excludes 12 gross (1.1 net) non-operated wells to be drilled in our Rockies & Other area in 2014. |
91
Table of Contents
Our extensive inventory and horizontal drilling program in the Terryville Complex is currently focused on four zones within the Cotton Valley formation—the Upper Red, Lower Red, Lower Deep Pink and Upper Deep Pink. The table below sets forth our drilling locations by zone as of December 31, 2013 along with the average results for the wells we have drilled within each zone. Please see “Business—Our Properties—Cotton Valley–Terryville Complex Horizontal Redevelopment” for more detail on our properties in the Terryville Complex.
| Gross Horizontal Drilling Locations(1) | Average Historical Results(2) | |||||||||||||||||||||||||||||||||||||||||||||||
| Lower Cotton Valley Zone |
Producing Wells Drilled(1) |
30
Day Initial Production (MMcfe/d) |
EUR (Bcfe)(3) |
EUR % Gas |
EUR % NGL |
EUR % Oil |
Drilling and Completion Costs ($MM) |
|||||||||||||||||||||||||||||||||||||||||
| Proved | Probable | Possible | Management | Total | ||||||||||||||||||||||||||||||||||||||||||||
| Upper Red |
47 | 42 | 40 | 313 | 442 | 13 | 16.3 | 12.6 | 73 | % | 22 | %` | 5 | % | $ | 8.2 | ||||||||||||||||||||||||||||||||
| Lower Red |
40 | 40 | 36 | 276 | 392 | 7 | 13.6 | 9.2 | 71 | 24 | 5 | 7.8 | ||||||||||||||||||||||||||||||||||||
| Lower Deep Pink |
4 | 28 | 47 | 79 | 158 | 3 | 13.4 | 7.8 | 69 | 23 | 9 | 6.4 | ||||||||||||||||||||||||||||||||||||
| Upper Deep Pink |
— | 37 | 42 | 75 | 154 | — | — | — | — | — | — | — | ||||||||||||||||||||||||||||||||||||
|
|
|
|
|
|
|
|
|
|
|
|
|
|
|
|
|
|
|
|
|
|
|
|
|
|||||||||||||||||||||||||
| Total Terryville Complex |
91 | 147 | 165 | 743 | 1,146 | 23 | 15.1 | 11.0 | 72 | % | 23 | % | 5 | % | $ | 7.8 | ||||||||||||||||||||||||||||||||
| (1) | Please see “Business—Our Operations—Drilling Locations” for more information regarding the process and criteria through which these drilling locations were identified. The drilling locations on which we actually drill will depend on the availability of capital, regulatory approval, commodity prices, costs, actual drilling results and other factors. Please see “Risk Factors—Risks Related to Our Business—Our identified drilling locations, which are scheduled out over many years, are susceptible to uncertainties that could materially alter the occurrence or timing of their drilling.” Proved, probable and possible locations are based on our reserve report. Management locations are based on management estimates. |
| (2) | Relates to the 21 horizontal wells in the Terryville Complex included in our reserve report as proved developed reserves as of December 31, 2013. Drilling and completion costs include costs associated with two additional wells that have come online since year-end. |
| (3) | EUR represents the Estimated Ultimate Recovery or the sum of total gross remaining reserves attributable to each location in our reserve report and cumulative sales from such location. EUR is shown at the wellhead on a combined basis for oil/condensates and wet gas. |
Our Terryville horizontal development program in 2014 has an average working interest of 87% and our total horizontal development inventory has an average working interest of 69%.
For the Terryville Complex, our 2014 budget assumes an average cost of $8.6 million for gross horizontal wells ($7.5 million per net well) and is based on an average lateral length of 6,270 feet. As part of our long-term development plan, the lateral length of our planned wells is expected to increase and we expect wells within the Terryville Complex to cost on average $9.3 million for gross wells ($8.1 million per net well) drilled with a 7,000 foot lateral length.
Business Strategies
Our primary objective is to build shareholder value through growth in reserves, production and cash flows by developing and expanding our significant portfolio of drilling locations. To achieve our objective, we intend to execute the following business strategies:
Grow production, reserves and cash flow through the development of our extensive drilling inventory. We believe our extensive inventory of low-risk drilling locations, combined with our operating expertise, will enable us to continue to deliver production, reserve and cash flow growth and create shareholder value. As of December 31, 2013, we had assembled an aggregate drilling inventory of 1,297 gross identified horizontal drilling locations, 88% of which are in the Terryville Complex, representing a drilling inventory of over 28 years based on our expected 2014 drilling program. We believe that the risk and uncertainty associated with our core acreage positions in the Terryville Complex has been largely reduced through our development activity, and because those positions are in areas with extensive drilling and production history. Since initiating our horizontal drilling program with one rig in 2011, we have invested over $288 million in the Terryville Complex through December 31, 2013. With four rigs running in the Terryville Complex as of December 31, 2013, we are one of the most active drillers in the Cotton Valley formation. We intend to dedicate approximately
92
Table of Contents
$264 million of our $316 million drilling and completion budget in 2014 to develop the overpressured liquids-rich Terryville Complex through multi-well pad drilling. We believe multiple vertically stacked producing horizons in the Terryville Complex can be developed using horizontal drilling techniques, thus enhancing the economics of this field.
Enhance returns through prudent capital allocation and continued improvements in operational and capital efficiencies. We continually monitor and adjust our drilling program with the objective of achieving the highest total returns on our portfolio of drilling opportunities. We believe we will achieve this objective by (i) minimizing the capital costs of drilling and completing horizontal wells through knowledge of the target formations, (ii) maximizing well production and recoveries by optimizing lateral length, the number of frac stages, perforation intervals and the type of fracture stimulation employed, (iii) targeting specific zones within our leasehold position to maximize our hydrocarbon mix based on the existing commodity price environment and (iv) minimizing operating costs through efficient well management.
Exploit additional development opportunities on current acreage. Our existing asset base provides numerous opportunities for our highly experienced technical team to create shareholder value by increasing our inventory beyond our currently identified drilling locations and ultimately by growing our estimated proved reserves. In the Terryville Complex, we are currently targeting multiple stacked horizons. We also believe our East Texas region has a significant inventory of low-risk, liquids-rich horizontal drilling locations. Finally, we continue to evaluate our leasehold positions in the Rocky Mountains and have preliminarily evaluated over 170 potential vertical locations.
Maintain a disciplined, growth oriented financial strategy. We intend to fund our growth primarily with internally generated cash flows while maintaining ample liquidity and access to the capital markets. Furthermore, we plan to hedge a significant portion of our expected production to reduce our exposure to downside commodity price fluctuations and enable us to protect our cash flows and maintain liquidity to fund our drilling program. Since approximately 76% of our acreage in the Terryville Complex was held by production as of December 31, 2013 and no significant drilling commitments are needed to hold our remaining acreage in the near term, we are able to allocate capital among projects in a manner that optimizes both costs and returns, resulting in a highly efficient drilling program.
Make opportunistic acquisitions that meet our strategic and financial objectives. We will seek to acquire oil and gas properties that we believe complement our existing properties in our core areas of operation. In addition to our focus on the Terryville Complex, we are pursuing other properties that provide opportunities for the addition of reserves and production through a combination of exploitation, development, high-potential exploration and control of operations. We follow a technology driven strategy to establish large, contiguous leasehold positions in the core of prolific basins and opportunistically add to those positions through bolt-on acquisitions over time. We entered into the Terryville Complex through strategic acquisitions and grassroots leasing efforts, amassing a land position of 96,733 net acres, 51,522 net acres of which we believe to be in the core of the play. We will continue to identify and opportunistically acquire additional acreage and producing assets to complement our multi-year drilling inventory.
Competitive Strengths
We believe that the following strengths will allow us to successfully execute our business strategies.
Large, concentrated position in one of North America’s leading plays. We own approximately 60,041 gross (51,522 net) acres in what we believe to be the core of the Terryville Complex in Lincoln Parish, which we believe to be one of North America’s most prolific liquids-rich natural gas fields, characterized by consistent and predictable geology and multiple stacked pay formations confirmed by extensive vertical well control. Through December 31, 2013, our drilling program in the Terryville Complex has produced some of the top performing gas wells in the United States in the previous two years, with single horizontal well results having achieved average
93
Table of Contents
30-day initial production rates of 15.1 MMcfe/d, EURs averaging 11.0 Bcfe and average drilling and completion costs of $7.8 million per well. Approximately 76% of our acreage in the Terryville Complex was held by production at December 31, 2013 and there are no significant lease expirations until 2017. Additionally, all of our acreage in this play can be held by running a one rig program over the next 18 months.
De-risked acreage position with multi-year inventory of liquids-rich drilling opportunities. As of December 31, 2013, we had a drilling inventory consisting of 1,297 gross identified horizontal drilling locations, of which approximately 145 are gross proved undeveloped locations. Based on our expected 2014 drilling program and net identified drilling locations, we have over 26 years of liquids-rich drilling inventory. The majority of our drilling activity has been and will continue to be focused in the Terryville Complex, where we produce liquids-rich natural gas from the overpressured Cotton Valley formation. We have used subsurface data from our vertical wells coupled with 3-D seismic data to identify and prioritize our inventory based on returns. This liquids-rich gas formation allows for NGL processing that, when coupled with the condensate produced, results in strong well economics. For the three months ended December 31, 2013, 45% of our pro forma MRD Segment revenues were attributable to natural gas, 28% to NGLs and 27% to oil.
Significant operational control with low cost operations. On a proved reserves basis, we operate 99% of our properties and have operational control of all of our drilling inventory in the Terryville Complex. We believe maintaining operational control will enable us to enhance returns by implementing more efficient and cost-effective operating practices, through the selection of economic drilling locations, opportunistic timing of development, continuous improvement of drilling, completion and stimulation techniques and development on multi-well pads. As a result of the contiguous nature of our leasehold in the Terryville Complex and its geologic continuity, we are able to drill consistently long laterals, averaging over 4,200 lateral feet, which helps us to reduce costs on a per-lateral foot basis and increase our returns. We expect the average lateral length of the 35 gross wells that we expect to drill in the Terryville Complex in 2014 to be 6,400 feet per well. Operating in mature basins in North Louisiana and East Texas allows us to take advantage of the available and extensive midstream infrastructure and accelerate our development plan without encountering significant constraints in either takeaway or processing capacity. Our operational control allows us to focus on operating efficiency, which has resulted in our MRD Segment lease operating costs declining 31% from $0.77 per Mcfe for the year ended December 31, 2012 to $0.53 per Mcfe for the year ended December 31, 2013.
Proven and incentivized executive and technical team. We believe our management and technical teams are one of our principal competitive strengths due to our team’s significant industry experience and long history of working together in the identification, execution and integration of acquisitions, cost efficient management of profitable, large scale drilling programs and a focus on rates of return. Additionally, our technical team has substantial expertise in advanced drilling and completion technologies and decades of expertise in operating in the North Louisiana and East Texas regions. The members of our management team collectively have an average of 22 years of experience in the oil and natural gas industry. John A. Weinzierl, our Chief Executive Officer, has 24 years of oil and natural gas industry experience as a petroleum engineer, a strong commercial and technical background and extensive experience acquiring and managing oil and natural gas properties. Our management team has a significant economic interest in us directly and through its equity interests in our controlling stockholder, MRD LLC. We believe our management team is motivated to deliver high returns, create shareholder value and maintain safe and reliable operations.
Our relationship with MEMP. We currently own 5,360,912 subordinated units representing a 8.7% limited partner interest in MEMP and a 0.1% general partner interest in MEMP through our ownership of its general partner. We also own 50% of MEMP’s incentive distribution rights. MEMP’s objective as a master limited partnership is to generate stable cash flows, allowing it to make quarterly distributions to its limited partners and, over time, to increase those quarterly distributions. As a result of its familiarity with our management team and our asset base and our track record of prior “drop-down” transactions, we believe that MEMP is a natural purchaser of properties from us that meet its acquisition criteria. We believe this mutually beneficial relationship enhances MEMP’s ability to generate consistent returns on its oil and natural gas
94
Table of Contents
properties, provides us with a growing source of cash flow from our partnership interests in MEMP and allows us to monetize producing non-core properties. Since MEMP’s initial public offering, we have consummated “drop-down” transactions with MEMP totaling approximately $376 million. In addition, we may have the opportunity to work jointly with MEMP to pursue certain acquisitions of oil and natural gas properties that may not otherwise be attractive acquisition candidates for either of us individually. While we believe that MEMP would be a preferred acquirer of our mature, non-core assets, we are under no obligation to offer to sell, and it is under no obligation to offer to buy, any of our properties.
Financial strength and flexibility. During 2013, we generated $173 million of pro forma MRD Segment Adjusted EBITDA and made pro forma total capital expenditures of $204 million, including $70 million on wells coming online in 2014. We intend to continue to fund our organic growth predominantly with internally generated cash flows while maintaining ample liquidity for opportunistic acquisitions. We will continue to maintain a disciplined approach to spending whereby we allocate capital in order to optimize returns and create shareholder value. We seek to protect these future cash flows and liquidity levels by maintaining a three-to-five year rolling hedge program. Pro forma as of December 31, 2013 for this offering and the restructuring transactions (including the redemption of the PIK notes for approximately $363 million 30 days after the closing of this offering), we expect our total liquidity, consisting of cash on hand and available borrowing capacity under our new revolving credit facility, to be in excess of $ million.
Acquisition History
We built out our leasehold positions in North Louisiana, East Texas and the Rocky Mountains primarily through the following acquisition activities:
| • | In November 2007, we acquired interests in the Joaquin Field, which is the core of our East Texas acreage; |
| • | In December 2007, we acquired interests in the Tepee Field in the Piceance Basin in Colorado; |
| • | In April and May 2010, we acquired interests in the Terryville Complex and other North Louisiana fields, which are the core of our North Louisiana acreage; |
| • | In November 2010, we acquired interests in the Spider and E. Logansport Fields in North Louisiana; |
| • | In May 2012, we acquired interests in the Terryville Complex and Double A Field in North Louisiana and East Texas; |
| • | In April 2013, we acquired interests in the West Simsboro and Simsboro Fields of the Terryville Complex in North Louisiana; |
| • | In November 2013, we acquired the remaining equity interests in Classic Hydrocarbons Holdings, L.P., Classic Hydrocarbons GP Co., L.L.C. and Black Diamond Minerals, LLC, which hold oil and natural gas properties in East Texas, North Louisiana and the Rocky Mountains; and |
| • | In February 2014, we repurchased net profits interests in the Terryville Complex from an affiliate of NGP for $63.4 million after customary adjustments. These net profits interests were originally sold to the NGP affiliate upon the completion of certain acquisitions in 2010 by WildHorse Resources. |
2013 and 2014 Capital Budget
During 2013, we invested approximately $190 million of capital to drill 31 gross (21.3 net) wells. A substantial portion of our development program is focused on horizontal drilling of liquids rich wells in the Terryville Complex, where we spent approximately $163 million in capital expenditures to drill 15 gross (12.1 net) horizontal wells during 2013.
95
Table of Contents
In 2014, we have budgeted a total of $316 million to drill and complete 49 gross (39 net) operated wells and to participate in 12 gross (1.1 net) non-operated wells. We expect to fund our 2014 development primarily from cash flows from operations. The majority of our drilling locations and our 2014 development program are focused on the Terryville Complex, where we plan to invest $264 million on drilling and completing 33 gross (28 net) horizontal wells and 2 gross (2.0 net) vertical wells. We plan to run four to five rigs during 2014 targeting primarily our four primary zones within the Cotton Valley—the Upper Red, Lower Red, Lower Deep Pink and Upper Deep Pink. Total vertical depth of these zones ranges from 8,200 to 11,200 feet.
In our East Texas properties in the Joaquin Field, we plan to spend development capital of $36 million running one rig to drill 8 gross (6 net) horizontal wells targeting the Cotton Valley formation at vertical depths of 6,000 to 10,000 feet.
In our Rockies & Other area, we plan to spend $12 million of development capital, primarily in the Tepee Field in the Piceance Basin in Colorado focused on completing 3 wells drilled in fourth quarter of 2013 and running 1 rig to drill an additional 3 operated wells. We also plan to spend an additional $4 million to participate in 12 horizontal wells operated by SandRidge Energy in the Mississippian oil play of Northern Oklahoma.
Our Equity Owners
Our principal stockholder is MRD LLC, which is controlled by the Funds, which are three of the private equity funds managed by NGP. Upon completion of this initial public offering, MRD LLC, the selling stockholder in this offering, will own approximately % of our common stock (or approximately % if the underwriters’ option to purchase additional shares from MRD LLC is exercised in full). The Funds also collectively indirectly own 50% of MEMP’s incentive distribution rights. We are also a party to certain other agreements with MRD LLC, the Funds and certain of their affiliates. For a description of these agreements, please read “Certain Relationships and Related Party Transactions.”
Additionally, upon the closing of this initial public offering, certain former management members of WildHorse Resources will own approximately % of our common stock. Upon completion of this offering, we will enter into a services agreement with WildHorse Resources Management Company, LLC, a subsidiary of WildHorse Resources II, LLC. NGP and certain former management members of WildHorse Resources own WildHorse Resources II, LLC. For a description of this services agreement, please read “Certain Relationships and Related Party Transactions.”
Founded in 1988, NGP is a family of private equity investment funds, with cumulative committed capital of approximately $10.5 billion since inception, organized to make investments in the natural resources sector. NGP is part of the investment platform of NGP Energy Capital Management, a premier investment franchise in the natural resources industry, which together with its affiliates has managed approximately $13 billion in cumulative committed capital since inception.
Relationship with Memorial Production Partners LP
Through our ownership of its general partner, we control MEMP, a publicly traded limited partnership. In addition to the general partner interest, we also own 5,360,912 subordinated units representing a 8.7% limited partner interest in MEMP and 50% of MEMP’s incentive distribution rights.
MEMP is engaged in the acquisition, exploitation, development and production of oil and natural gas properties in the United States, with assets consisting primarily of producing oil and natural gas properties that are located in East Texas/North Louisiana, the Permian Basin, offshore Southern California, the Rockies, the Eagle Ford and South Texas. Most of MEMP’s properties are located in large, mature oil and natural gas reservoirs with well-known geologic characteristics and long-lived, predictable production profiles and modest capital requirements. As of December 31, 2013:
96
Table of Contents
| • | MEMP’s total estimated proved reserves were approximately 1,015 Bcfe, of which approximately 60% were natural gas and 61% were classified as proved developed reserves; and |
| • | MEMP produced from 2,866 gross (1,663 net) producing wells across its properties, with an average working interest of 58%. |
In accordance with MEMP’s limited partnership agreement, incentive distribution rights represent the right to receive an increasing percentage of quarterly distributions of MEMP’s available cash from operating surplus after the minimum quarterly distribution and the target distribution levels have been achieved. The minimum quarterly distribution is $0.4750 ($1.90 on an annualized basis) per unit. MEMP GP owns 50% of the incentive distribution rights, which are freely transferable under the MEMP limited partnership agreement. After the closing of this offering, we will own 100% of the voting and economic interests in MEMP GP, and MEMP GP will own 50% of the MEMP incentive distribution rights. The incentive distribution rights are payable as follows:
If for any quarter:
| • | MEMP has distributed available cash from operating surplus to the common and subordinated unitholders in an amount equal to the minimum quarterly distribution; and |
| • | MEMP has distributed available cash from operating surplus on outstanding common units in an amount necessary to eliminate any cumulative arrearages in payment of the minimum quarterly distribution; |
then, MEMP will distribute any additional available cash from operating surplus for that quarter among the unitholders and the general partner in the following manner:
| • | first, 99.9% to all unitholders, pro rata, and 0.1% to the holders of the incentive distribution rights (50% of which are owned by MEMP GP), until each unitholder receives a total of $0.54625 per unit for that quarter; |
| • | second, 85.0% to all unitholders, pro rata, and 15.0% to the holders of the incentive distribution rights (50% of which are owned by MEMP GP), until each unitholder receives a total of $0.59375 per unit for that quarter; |
| • | thereafter, 75.0% to all unitholders, pro rata, and 25.0% to the holders of the incentive distribution rights (50% of which are owned by MEMP GP). |
Since December 2011, MEMP has increased its quarterly cash distribution from $0.4750 ($1.90 on an annualized basis) per unit to $0.5500 ($2.20 on an annualized basis) per unit, which is its most recently announced distribution.
MRD LLC currently provides and, following the closing of this offering, we will provide management, administrative, and operations personnel to MEMP under an omnibus agreement. Pursuant to that omnibus agreement, MEMP will be required to reimburse us for all expenses incurred by us (or payments made on MEMP’s behalf) in conjunction with our provision of general and administrative services to MEMP, including its public company expenses and an allocated portion of the salary and benefits of the executive officers of MEMP’s general partner and our other employees who perform services for MEMP or on MEMP’s behalf. Please read “Certain Relationships and Related Party Transactions—Omnibus Agreement” for more information about the omnibus agreement.
We view our relationship with MEMP as a part of our strategic alternatives, and we believe that MEMP will be incentivized to acquire additional suitable assets from us and to pursue acquisitions jointly with us in the future. However, MEMP will regularly evaluate acquisitions and may elect to acquire properties in the future without offering us the opportunity to participate in those transactions. Moreover, after this offering, MEMP will continue to be free to act in a manner that is beneficial to its interests without regard to ours, which may include electing not to acquire additional assets from us. Although we believe MEMP will desire to acquire properties
97
Table of Contents
from us for purchase, MEMP will not have any obligation to acquire properties from us. If MEMP chooses not to acquire properties from us, then our ability to monetize our proved developed properties may be impaired, which could adversely affect our cash flow and net income.
Our Operations
Preparation of Reserve Estimates
Oil and natural gas reserve engineering is inherently a subjective process of estimating underground accumulations of oil and natural gas that cannot be measured exactly. The accuracy of any reserve estimate is a function of the quality of available data and engineering and geological interpretation and judgment. Accordingly, reserve estimates may vary from the quantities of oil and natural gas that are ultimately recovered. For a discussion of risks associated with reserve estimates, please read “Risk Factors—Risks Related to Our Business—Reserve estimates depend on many assumptions that may turn out to be inaccurate. Any material inaccuracies in our reserve estimates or underlying assumptions will materially affect the quantities and present value of our reserves.”
Evaluation and Review of Estimated Reserves. Our historical proved reserve estimates and MEMP’s historical proved reserve estimates were prepared by NSAI, our independent petroleum engineers. The technical persons responsible for preparing our proved reserve estimates meet the requirements with regard to qualifications, independence, objectivity and confidentiality set forth in the Standards Pertaining to the Estimating and Auditing of Oil and Gas Reserves Information promulgated by the Society of Petroleum Engineers. NSAI does not own an interest in any of our properties, nor is it employed by us on a contingent basis. A copy of NSAI’s summary reserve report regarding our proved reserves as of December 31, 2013 is included as Appendix B-1 to this prospectus. A copy of NSAI’s audit letter regarding the management report of our probable and possible reserves as of December 31, 2013 is included as Appendix B-2 to this prospectus. A copy of NSAI’s summary reserve report regarding the MEMP proved reserves as of December 31, 2013 (the “MEMP Reserve Report”) is included as Exhibit 99.3 to the registration statement of which this prospectus forms a part.
Our historical probable and possible reserve estimates were prepared by us and audited by NSAI. We maintain an internal staff of petroleum engineers and geoscience professionals who work closely with our independent reserve engineers to ensure the integrity, accuracy and timeliness of the data used to calculate our estimated reserves and MEMP’s proved reserves. Our technical team meets regularly with NSAI reserve engineers to review properties and discuss the assumptions and methods used in the reserve estimation process. We provide historical information to NSAI for our properties and MEMP’s properties, such as ownership interest, oil and natural gas production, well test data, commodity prices and operating and development costs.
Internal Engineers. John D. Williams is our technical person at MRD LLC primarily responsible for liaison with and oversight of our and MEMP’s third-party reserve engineers, NSAI, which prepared the reserve report for our properties and MEMP’s properties, as of December 31, 2013. Mr. Williams has been practicing petroleum engineering at MRD LLC since March 2012. Mr. Williams is a Registered Professional Engineer in the State of Texas with over 17 years experience in the estimation and evaluation of reserves. From April 2005 to March 2012, he held various positions at Southwestern Energy Company, most recently as Reservoir Engineering Manager. From August 1998 to April 2005, he served in various capacities at Ryder Scott Company, which culminated in his serving as Vice President. Mr. Williams is a graduate of the University of Texas at Austin with a Bachelor of Science Degree in Petroleum Engineering and with a Master of Science Degree in Petroleum Engineering.
NSAI is an independent oil and natural gas consulting firm. No director, officer, or key employee of NSAI has any financial ownership in us, MRD LLC, the Funds, or any of their respective affiliates. NSAI’s compensation for the required investigations and preparation of its report is not contingent upon the results obtained and reported. NSAI has not performed other work for us, MRD LLC, the Funds, or any of their respective affiliates that would
98
Table of Contents
affect its objectivity. The estimates of proved reserves at December 31, 2013 presented in the NSAI reports were overseen by Mr. Justin S. Hamilton; Mr. David E. Nice; Mr. Richard B. Talley, Jr.; Mr. Philip S. (Scott) Frost; Mr. Joseph J. Spellman; Mr. Eric J. Stevens; Mr. Craig H. Adams; Mr. Nathan C. Shahan; Mr. J. Carter Henson, Jr. and Mr. Allen E. Evans, Jr.
Justin Hamilton has been practicing consulting petroleum engineering at NSAI since 2004. Mr. Hamilton is a Licensed Professional Engineer in the State of Texas (License No. 104999) and has over 13 years of practical experience in petroleum engineering, with over 13 years of experience in the estimation and evaluation of reserves. He graduated from Brigham Young University in 2000 with a B.S. in mechanical engineering and from the University of Texas in 2007 with an M.B.A.
David Nice has been practicing consulting petroleum geology at NSAI since 1998. Mr. Nice is a Licensed Professional Geoscientist in the State of Texas (License No. 346) and has over 28 years of practical experience in petroleum geosciences, with over 15 years of experience in the estimation and evaluation of reserves. He graduated from University of Wyoming in 1982 with a B.S. in geology and in 1985 with an M.S. in geology.
Richard Talley has been practicing consulting petroleum engineering at NSAI since 2004. Mr. Talley is a Licensed Professional Engineer in the State of Texas (License No. 102425) and in the State of Louisiana (License No. 36998) and has over 15 years of practical experience in petroleum engineering, with over 9 years of experience in the estimation and evaluation of reserves. He graduated from University of Oklahoma in 1998 with a B.S. in mechanical engineering and from Tulane University in 2001 with an M.B.A.
Scott Frost has been practicing consulting petroleum engineering at NSAI since 1984. Mr. Frost is a Licensed Professional Engineer in the State of Texas (License No. 88738) and has over 30 years of practical experience in petroleum engineering, with over 30 years of experience in the estimation and evaluation of reserves. He graduated from Vanderbilt University in 1979 with a B.E. in mechanical engineering and from Tulane University in 1984 with an M.B.A.
Joseph Spellman has been practicing consulting petroleum engineering at NSAI since 1989. Mr. Spellman is a Licensed Professional Engineer in the State of Texas (License No. 73709) and has over 30 years of practical experience in petroleum engineering, with over 30 years of experience in the estimation and evaluation of reserves. He graduated from University of Wisconsin-Platteville in 1980 with a B.S. in civil engineering.
Eric Stevens has been practicing consulting petroleum engineering at NSAI since 2007. Mr. Stevens is a Licensed Professional Engineer in the State of Texas (License No. 102415) and has over 11 years of practical experience in petroleum engineering, with over 11 years of experience in the estimation and evaluation of reserves. He graduated from Brigham Young University in 2002 with a B.S. in mechanical engineering.
Craig Adams has been practicing consulting petroleum engineering at NSAI since 1997. Mr. Adams is a Licensed Professional Engineer in the State of Texas (License No. 68137) and has over 29 years of practical experience in petroleum engineering, with over 17 years of experience in the estimation and evaluation of reserves. He graduated from Texas Tech University in 1985 with a B.S. in petroleum engineering.
Nathan Shahan has been practicing consulting petroleum engineering at NSAI since 2007. Mr. Shahan is a Licensed Professional Engineer in the State of Texas (License No. 102389) and has over 12 years of practical experience in petroleum engineering, with over 7 years of experience in the estimation and evaluation of reserves. He graduated from Texas A&M University in 2002 with a B.S. in petroleum engineering and in 2007 with a M.E. in petroleum engineering.
Allen Evans has been practicing consulting petroleum geology at NSAI since 1996. Mr. Evans is a Licensed Professional Geoscientist in the State of Texas (License No. 1286) and has over 30 years of practical experience in petroleum geosciences, with over 30 years of experience in the estimation and evaluation of reserves. He graduated from Old Dominion University in 1981 with a B.S. in geology and in 1987 with a M.S. in geology.
99
Table of Contents
Carter Henson has been practicing consulting petroleum engineering at NSAI since 1989. Mr. Henson is a Licensed Professional Engineer in the State of Texas (License No. 73964) and has over 30 years of practical experience in petroleum engineering, with over 25 years of experience in the estimation and evaluation of reserves. He graduated from Rice University in 1981 with a B.S. in mechanical engineering.
All ten technical principals meet or exceed the education, training, and experience requirements set forth in the Standards Pertaining to the Estimating and Auditing of Oil and Gas Reserves Information promulgated by the Society of Petroleum Engineers; all ten are proficient in applying industry standard practices to engineering and geoscience evaluations as well as applying SEC and other industry reserves definitions and guidelines.
Estimation of Proved Reserves. Under SEC rules, proved reserves are those quantities of oil and natural gas, which, by analysis of geoscience and engineering data, can be estimated with reasonable certainty to be economically producible—from a given date forward, from known reservoirs and under existing economic conditions, operating methods and government regulations—prior to the time at which contracts providing the right to operate expire, unless evidence indicates that renewal is reasonably certain, regardless of whether deterministic or probabilistic methods are used for the estimation. If deterministic methods are used, the SEC has defined reasonable certainty for proved reserves as a “high degree of confidence that the quantities will be recovered.” All of our proved reserves and MEMP’s proved reserves as of December 31, 2013 were estimated using a deterministic method. The estimation of reserves involves two distinct determinations. The first determination results in the estimation of the quantities of recoverable oil and natural gas and the second determination results in the estimation of the uncertainty associated with those estimated quantities in accordance with the definitions established under SEC rules. The process of estimating the quantities of recoverable oil and natural gas reserves relies on the use of certain generally accepted analytical procedures. These analytical procedures fall into four broad categories or methods: (1) production performance-based methods; (2) material balance-based methods; (3) volumetric-based methods; and (4) analogy. These methods may be used singularly or in combination by the reserve evaluator in the process of estimating the quantities of reserves. Reserves for proved developed producing wells were estimated using production performance methods for the vast majority of properties. Certain new producing properties with very little production history were forecast using a combination of production performance and analogy to similar production, both of which are considered to provide a relatively high degree of accuracy. Non-producing reserve estimates, for developed and undeveloped properties, were forecast using either volumetric or analogy methods, or a combination of both. These methods provide a relatively high degree of accuracy for predicting proved developed non-producing and proved undeveloped reserves for our properties, due to the mature nature of the properties targeted for development and an abundance of subsurface control data.
To estimate economically recoverable proved reserves and related future net cash flows, NSAI considered many factors and assumptions, including the use of reservoir parameters derived from geological, geophysical and engineering data which cannot be measured directly, economic criteria based on current costs and the SEC pricing requirements and forecasts of future production rates.
Under SEC rules, reasonable certainty can be established using techniques that have been proven effective by actual production from projects in the same reservoir or an analogous reservoir or by other evidence using reliable technology that establishes reasonable certainty. Reliable technology is a grouping of one or more technologies (including computational methods) that has been field tested and has been demonstrated to provide reasonably certain results with consistency and repeatability in the formation being evaluated or in an analogous formation. To establish reasonable certainty with respect to our estimated proved reserves, the technologies and economic data used in the estimation of our proved reserves have been demonstrated to yield results with consistency and repeatability, and include production and well test data, downhole completion information, geologic data, electrical logs, radioactivity logs, core analyses, available seismic data and historical well cost and operating expense data.
Estimation of Probable and Possible Reserves. Estimates of probable reserves are inherently imprecise. When producing an estimate of the amount of oil and natural gas that is recoverable from a particular reservoir,
100
Table of Contents
an estimated quantity of probable reserves is an estimate of those additional reserves that are less certain to be recovered than proved reserves but which, together with proved reserves, are as likely as not to be recovered. Estimates of probable reserves are also continually subject to revisions based on production history, results of additional exploration and development, price changes and other factors.
When deterministic methods are used, it is as likely as not that actual remaining quantities recovered will exceed the sum of estimated proved plus probable reserves. When probabilistic methods are used, there should be at least a 50% probability that the actual quantities recovered will equal or exceed the proved plus probable reserves estimates. Probable reserves may be assigned to areas of a reservoir adjacent to proved reserves where data control or interpretations of available data are less certain, even if the interpreted reservoir continuity of structure or productivity does not meet the reasonable certainty criterion. Probable reserves may be assigned to areas that are structurally higher than the proved area if these areas are in communication with the proved reservoir. Probable reserves estimates also include potential incremental quantities associated with a greater percentage recovery of the hydrocarbons in place than assumed for proved reserves.
Estimates of possible reserves are also inherently imprecise. When producing an estimate of the amount of oil and natural gas that is recoverable from a particular reservoir, an estimated quantity of possible reserves is an estimate that might be achieved, but only under more favorable circumstances than are likely. Estimates of possible reserves are also continually subject to revisions based on production history, results of additional exploration and development, price changes and other factors.
When deterministic methods are used, the total quantities ultimately recovered from a project have a low probability of exceeding proved plus probable plus possible reserves. When probabilistic methods are used, there should be at least a 10% probability that the total quantities ultimately recovered will equal or exceed the proved plus probable plus possible reserves estimates. Possible reserves may be assigned to areas of a reservoir adjacent to probable reserve where data control and interpretations of available data are progressively less certain. Frequently, this will be in areas where geoscience and engineering data are unable to define clearly the area and vertical limits of commercial production from the reservoir. Possible reserves also include incremental quantities associated with a greater percentage of recovery of the hydrocarbons in place than the recovery quantities assumed for probable reserves.
Possible reserves may be assigned where geoscience and engineering data identify directly adjacent portions of a reservoir within the same accumulation that may be separated from proved areas by faults with displacement less than formation thickness or other geological discontinuities and that have not been penetrated by a wellbore, and the registrant believes that such adjacent portions are in communication with the known (proved) reservoir. Possible reserves may be assigned to areas that are structurally higher or lower than the proved area if these areas are in communication with the proved reservoir.
101
Table of Contents
Estimated Reserves
The table below identifies our reserves per our reserve report for our three areas:
| Oil (MBbl) | Natural Gas (MMcf) |
NGLs (MBbl) |
Total (MMcfe) |
|||||||||||||
| Proved Developed |
||||||||||||||||
| Terryville Complex |
2,933 | 220,588 | 12,050 | 310,484 | ||||||||||||
| East Texas |
165 | 40,435 | 1,678 | 51,492 | ||||||||||||
| Rockies & Other |
306 | 2,774 | 176 | 5,665 | ||||||||||||
|
|
|
|
|
|
|
|
|
|||||||||
| Total Proved Developed |
3,403 | 263,797 | 13,905 | 367,641 | ||||||||||||
| Proved Undeveloped |
||||||||||||||||
| Terryville Complex |
7,585 | 448,123 | 23,402 | 634,049 | ||||||||||||
| East Texas |
323 | 90,334 | 5,270 | 123,887 | ||||||||||||
| Rockies & Other |
— | — | — | — | ||||||||||||
|
|
|
|
|
|
|
|
|
|||||||||
| Total Proved Undeveloped |
7,908 | 538,457 | 28,672 | 757,936 | ||||||||||||
| Total Proved |
||||||||||||||||
| Terryville Complex |
10,518 | 668,711 | 35,452 | 944,533 | ||||||||||||
| East Texas |
487 | 130,769 | 6,948 | 175,379 | ||||||||||||
| Rockies & Other |
306 | 2,774 | 176 | 5,665 | ||||||||||||
|
|
|
|
|
|
|
|
|
|||||||||
| Total Proved Reserves |
11,311 | 802,254 | 42,577 | 1,125,577 | ||||||||||||
| Probable(1) |
||||||||||||||||
| Terryville Complex |
10,041 | 453,902 | 29,056 | 688,486 | ||||||||||||
| East Texas |
285 | 79,765 | 4,653 | 109,392 | ||||||||||||
| Rockies & Other |
153 | 1,519 | — | 2,439 | ||||||||||||
|
|
|
|
|
|
|
|
|
|||||||||
| Total Probable Reserves |
10,480 | 535,185 | 33,709 | 800,317 | ||||||||||||
| Possible(1) |
||||||||||||||||
| Terryville Complex |
13,793 | 639,273 | 40,700 | 966,232 | ||||||||||||
| East Texas |
172 | 48,299 | 2,817 | 66,239 | ||||||||||||
| Rockies & Other |
106 | 1,128 | — | 1,762 | ||||||||||||
|
|
|
|
|
|
|
|
|
|||||||||
| Total Possible Reserves |
14,072 | 688,701 | 43,517 | 1,034,233 | ||||||||||||
| (1) | Substantially all of our estimated probable and possible reserves are classified as undeveloped. |
Proved Undeveloped Reserves
As of December 31, 2013, we had 758 Bcfe of proved undeveloped reserves, comprised of 8 MMBbls of oil, 538 Bcf of natural gas and 29 MMBbls of NGLs. None of our PUDs as of December 31, 2013 are scheduled to be developed on a date more than five years from the date the reserves were initially booked as PUDs. PUDs will be converted from undeveloped to developed as the applicable wells begin production.
Changes in PUDs that occurred during 2013 were due to:
| • | Reclassifications of 20.2 Bcfe into proved developed reserves for implementation of drilling projects; and |
| • | Reduction of 5.2 Bcfe after giving effect to 66.9 Bcfe of additions from the Terryville Complex due to proving up additional drilling locations. |
102
Table of Contents
During the year ended December 31, 2013, we spent $69.0 million to convert PUDs to proved developed reserves. As of December 31, 2013 per the reserve report, future development costs relating to the development of PUDs for the years 2014, 2015, 2016, 2017 and 2018 are estimated at approximately $248 million, $358 million, $282 million, $264 million and $160 million, respectively, to capture the balance of drilling the PUD reserves within a five-year timeframe. Approximately 84%, or $1.1 billion, of the future development costs over the next five years are related to development of PUD reserves in the Terryville Complex. As we continue to develop our properties and have more well production and completion data, we believe we will continue to realize cost savings and experience lower relative drilling and completion costs as we convert PUDs into proved developed reserves in the upcoming years. All of our PUD locations are scheduled to be drilled prior to the end of December 31, 2018. Based on our current expectations of its cash flows, we believe that we can fund the drilling of our current PUD inventory and our expansions in the next five years from our cash flow from operations.
Production, Revenues and Price History
The following table sets forth information regarding our production, revenues and realized prices and production costs for the years ended December 31, 2013 and 2012.
| Year Ended December 31, 2013 | ||||||||||||||||
| Terryville | East Texas |
Rockies & Other |
Total | |||||||||||||
| Production Volumes: |
||||||||||||||||
| Oil (MBbls) |
475 | 165 | 25 | 665 | ||||||||||||
| NGLs (MBbls) |
1,243 | 177 | 37 | 1,457 | ||||||||||||
| Natural gas (MMcf) |
27,398 | 6,249 | 445 | 34,092 | ||||||||||||
|
|
|
|
|
|
|
|
|
|||||||||
| Total (MMcfe) |
37,705 | 8,297 | 817 | 46,819 | ||||||||||||
|
|
|
|
|
|
|
|
|
|||||||||
| Average net production (MMcfe/d) |
103.3 | 22.8 | 2.2 | 128.3 | ||||||||||||
|
|
|
|
|
|
|
|
|
|||||||||
| Average sales price (excluding commodity derivatives): |
||||||||||||||||
| Oil (per Bbl) |
$ | 100.57 | $ | 102.06 | $ | 95.78 | $ | 100.76 | ||||||||
| NGL(per Bbl) |
$ | 37.69 | $ | 31.33 | $ | 40.68 | $ | 36.99 | ||||||||
| Natural gas (per Mcf) |
$ | 3.10 | $ | 3.79 | $ | 2.91 | $ | 3.22 | ||||||||
|
|
|
|
|
|
|
|
|
|||||||||
| Total (Mcfe) |
$ | 4.76 | $ | 5.54 | $ | 6.39 | $ | 4.93 | ||||||||
|
|
|
|
|
|
|
|
|
|||||||||
| Average unit costs per Mcfe: |
||||||||||||||||
| Lease operating expense |
$ | 0.33 | $ | 1.24 | $ | 1.91 | $ | 0.53 | ||||||||
| Year Ended December 31, 2012 | ||||||||||||||||
| Terryville | East Texas |
Rockies & Other |
Total | |||||||||||||
| Production Volumes: |
||||||||||||||||
| Oil (MBbls) |
273 | 67 | 29 | 369 | ||||||||||||
| NGLs (MBbls) |
702 | 85 | 111 | 898 | ||||||||||||
| Natural gas (MMcf) |
14,028 | 8,917 | 1,185 | 24,130 | ||||||||||||
|
|
|
|
|
|
|
|
|
|||||||||
| Total (MMcfe) |
19,874 | 9,832 | 2,025 | 31,731 | ||||||||||||
|
|
|
|
|
|
|
|
|
|||||||||
| Average net production (MMcfe/d) |
54.3 | 26.9 | 5.5 | 86.7 | ||||||||||||
|
|
|
|
|
|
|
|
|
|||||||||
| Average sales price (excluding commodity derivatives): |
||||||||||||||||
| Oil (per Bbl) |
$ | 95.78 | $ | 97.98 | $ | 88.05 | $ | 95.56 | ||||||||
| NGL(per Bbl) |
$ | 40.52 | $ | 39.08 | $ | 43.71 | $ | 40.78 | ||||||||
| Natural gas (per Mcf) |
$ | 2.53 | $ | 3.13 | $ | 2.32 | $ | 2.74 | ||||||||
|
|
|
|
|
|
|
|
|
|||||||||
| Total (Mcfe) |
$ | 4.53 | $ | 3.84 | $ | 5.02 | $ | 4.35 | ||||||||
|
|
|
|
|
|
|
|
|
|||||||||
| Average unit costs per Mcfe: |
||||||||||||||||
| Lease operating expense |
$ | 0.61 | $ | 0.99 | $ | 1.24 | $ | 0.77 | ||||||||
103
Table of Contents
Productive Wells
The following table sets forth certain information regarding productive wells in each of our areas at December 31, 2013.
| Area |
Gross | Net | Operated | |||||||||
| Terryville Complex |
626 | 396 | 499 | |||||||||
| East Texas |
123 | 92 | 95 | |||||||||
| Rockies & Other(1) |
146 | 20 | 1 | |||||||||
|
|
|
|
|
|
|
|||||||
| Total |
895 | 508 | 595 | |||||||||
| (1) | Includes the Mississippian oil play of Northern Oklahoma. |
Acreage
The following table sets forth certain information regarding the developed and undeveloped acreage in which we own an interest as of December 31, 2013.
| Developed Acres | Undeveloped Acres | Total Acreage | ||||||||||||||||||||||||||||||||||
| Gross | Net | Gross | Net | Gross | Net | HBP | WI | |||||||||||||||||||||||||||||
| Terryville Complex |
106,374 | 73,875 | 24,372 | 22,858 | 130,746 | 96,733 | 76 | % | 74 | % | ||||||||||||||||||||||||||
| East Texas |
37,109 | 30,335 | 17,228 | 12,559 | 54,337 | 42,894 | 71 | % | 79 | % | ||||||||||||||||||||||||||
| Rockies & Other(1) |
5,659 | 3,147 | 156,716 | 63,044 | 162,375 | 66,191 | 5 | % | 41 | % | ||||||||||||||||||||||||||
|
|
|
|
|
|
|
|
|
|
|
|
|
|
|
|
|
|||||||||||||||||||||
| Total |
149,142 | 107,357 | 198,316 | 98,461 | 347,458 | 205,818 | 52 | % | 59 | % | ||||||||||||||||||||||||||
| Terryville Complex Core(2) |
35,749 | 28,743 | 24,292 | 22,778 | 60,041 | 51,552 | 56 | % | 86 | % | ||||||||||||||||||||||||||
| (1) | Includes the Mississippian oil play of Northern Oklahoma. |
| (2) | The substantial majority of what we believe to be the Terryville Complex Core is located in Lincoln Parish, Louisiana and is where we will focus the majority of our future development. |
Undeveloped Acreage Expirations
The following table sets forth the gross and net undeveloped acreage in our core operating areas as of December 31, 2013 that will expire over the next three years unless production is established within the spacing units covering the acreage or the lease is renewed or extended under continuous drilling provisions prior to the primary term expiration dates. There are no reserves attributable to our expiring acreage.
| 2014 | 2015 | 2016 | ||||||||||||||||||||||
| Area |
Gross | Net | Gross | Net | Gross | Net | ||||||||||||||||||
| Terryville Complex |
2,407 | 2,180 | 2,487 | 2,390 | 3,633 | 3,420 | ||||||||||||||||||
| East Texas |
5,212 | 2,606 | 2,027 | 748 | — | — | ||||||||||||||||||
| Rockies & Other(1) |
3,206 | 2,199 | 15,564 | 8,878 | 27,582 | 17,455 | ||||||||||||||||||
|
|
|
|
|
|
|
|
|
|
|
|
|
|||||||||||||
| Total |
10,825 | 6,985 | 20,078 | 12,015 | 31,215 | 20,875 | ||||||||||||||||||
| (1) | Includes the Mississippian oil play of Northern Oklahoma. |
104
Table of Contents
Drilling Activity
The following table summarizes our drilling activity for the years ended December 31, 2013, 2012 and 2011. Gross wells reflect the sum of all wells in which we own an interest. Net wells reflect the sum of our working interests in gross wells. At December 31, 2013, 10 gross (9.2 net) wells were in various stages of completion.
| Years ended December 31, | ||||||||||||||||||||||||
| 2013 | 2012 | 2011 | ||||||||||||||||||||||
| Gross | Net | Gross | Net | Gross | Net | |||||||||||||||||||
| Development wells: |
||||||||||||||||||||||||
| Productive |
22.0 | 13.3 | 11.0 | 10.2 | 4.0 | 3.9 | ||||||||||||||||||
| Dry |
— | — | — | — | — | — | ||||||||||||||||||
|
|
|
|
|
|
|
|
|
|
|
|
|
|||||||||||||
| Total development wells |
22.0 | 13.3 | 11.0 | 10.2 | 4.0 | 3.9 | ||||||||||||||||||
| Exploratory wells: |
||||||||||||||||||||||||
| Productive |
9.0 | 8.0 | 7.0 | 5.6 | 27.0 | 9.4 | ||||||||||||||||||
| Dry |
— | — | — | — | 3.0 | 1.5 | ||||||||||||||||||
|
|
|
|
|
|
|
|
|
|
|
|
|
|||||||||||||
| Total exploratory wells |
9.0 | 8.0 | 7.0 | 5.6 | 30.0 | 10.9 | ||||||||||||||||||
| Total wells drilled |
31.0 | 21.3 | 18.0 | 15.8 | 34.0 | 14.8 | ||||||||||||||||||
Drilling Locations
All of our 1,297 gross horizontal locations are attributable to acreage that is currently held by production and approximately 11% are attributable to proved undeveloped reserves as of December 31, 2013. In making these assessments, we include properties in which we hold operated and non-operated interests, as well as redevelopment opportunities. Once we have identified acreage that is prospective for the targeted formations, well placement is determined primarily by the regulatory spacing rules prescribed by the governing body in each of our operating areas. Wells drilled in the Cotton Valley formation in the Terryville Complex adhere to 180-acre spacing.
Our identified horizontal drilling locations are scheduled to be drilled over many years. The ultimate timing of the drilling of these locations will be influenced by multiple factors, including oil, natural gas and NGL prices, the availability and cost of capital, drilling and production costs, the availability of drilling services and equipment, drilling results, lease expirations, gathering systems, processing, marketing and pipeline transportation constraints, regulatory approvals and other factors. For a discussion of the risks associated with our drilling program, see “Risk Factors—Risks Related to Our Business—Our identified drilling locations, which are scheduled out over many years, are susceptible to uncertainties that could materially alter the occurrence or timing of their drilling.”
105
Table of Contents
MEMP
The following table summarizes information about MEMP’s proved oil and natural gas reserves by geographic region as of December 31, 2013 and its average net production for the three months ended December 31, 2013:
| Estimated Total Proved Reserves | ||||||||||||||||||||||||||||
| Total (Bcfe) |
% Gas | % Oil & NGLs |
% Developed |
Standardized Measure (in millions)(1) |
Average Net Daily Production (MMcfe/d) |
R/P Ratio(2) (years) |
||||||||||||||||||||||
| East Texas/North Louisiana |
598 | 69 | % | 31 | % | 54 | % | $ | 688 | 110.2 | 15 | |||||||||||||||||
| Permian Basin |
108 | 8 | % | 92 | % | 45 | % | 362 | 13.3 | 22 | ||||||||||||||||||
| California |
86 | 0 | % | 100 | % | 70 | % | 344 | 9.3 | 25 | ||||||||||||||||||
| Rockies |
61 | 83 | % | 17 | % | 84 | % | 78 | 11.5 | 15 | ||||||||||||||||||
| South Texas |
162 | 85 | % | 15 | % | 82 | % | 137 | 23.4 | 19 | ||||||||||||||||||
|
|
|
|
|
|
|
|
|
|
|
|
|
|
|
|||||||||||||||
| Total |
1,015 | 60 | % | 40 | % | 61 | % | $ | 1,609 | 167.7 | 17 | |||||||||||||||||
|
|
|
|
|
|
|
|||||||||||||||||||||||
| (1) | Standardized measure is calculated in accordance with Accounting Standards Codification, or ASC, Topic 932, Extractive Activities—Oil and Gas. Because MEMP is a limited partnership, it is generally not subject to federal or state income taxes and thus makes no provision for federal or state income taxes in the calculation of its standardized measure. Standardized measure does not give effect to commodity derivative contracts. |
| (2) | The reserve-to-production ratio is calculated by dividing our estimated proved reserves as of December 31, 2013 by average net daily production for the three months ended December 31, 2013 on an annualized basis. |
Estimated Proved Reserves
The following table presents the estimated net proved oil and natural gas reserves attributable to MEMP’s properties and the standardized measure amounts associated with the estimated proved reserves attributable to MEMP’s properties as of December 31, 2013, based on MEMP’s reserve report.
| Oil (MBbl) | Natural Gas (MMcf) |
Natural Gas Liquids (MBbl) |
Total (MMcfe) |
|||||||||||||
| Estimated Proved Reserves |
||||||||||||||||
| Total Proved Developed |
22,265 | 387,548 | 15,959 | 616,893 | ||||||||||||
| Total Proved Undeveloped |
16,884 | 219,591 | 12,887 | 398,212 | ||||||||||||
|
|
|
|
|
|
|
|
|
|||||||||
| Total Proved Reserves |
39,149 | 607,139 | 28,846 | 1,015,105 | ||||||||||||
Development of Proved Undeveloped Reserves
As of December 31, 2013, MEMP had 398,212 MMcfe of proved undeveloped reserves, comprised of 16,884 MBbls of oil, 219,591 MMcf of natural gas and 12,887 MBbls of NGLs. None of MEMP’s PUDs as of December 31, 2013 are scheduled to be developed on a date more than five years from the date the reserves were initially booked as PUDs. PUDs will be converted from undeveloped to developed as the applicable wells begin production.
Changes in PUDs that occurred during 2013 were due to:
| • | Reclassifications of 69.5 Bcfe into proved developed reserves for implementation of drilling projects; and |
| • | Increases of 72.3 Bcfe primarily due to reserve additions and price revisions. |
106
Table of Contents
During the year ended December 31, 2013, MEMP spent $103.4 million to convert PUDs to proved developed reserves. As of December 31, 2013 per the MEMP Reserve Report, future development costs relating to the development of PUDs for the years 2014, 2015, 2016, 2017 and 2018 are estimated at approximately $185 million, $178 million, $179 million, $72 million and $7 million, respectively, to capture the balance of drilling the PUD reserves within a five-year timeframe. As MEMP continues to develop its properties and have more well production and completion data, MEMP believes it will continue to realize cost savings and experience lower relative drilling and completion costs as we convert PUDs into proved developed reserves in the upcoming years. All of the MEMP’s PUD locations are scheduled to be drilled prior to the end of December 31, 2018. Based on MEMP’s current expectations of its cash flows, MEMP believes that it can fund the drilling of its current PUD inventory and its expansions in the next five years from its cash flow from operations.
Production, Revenue and Price History
The following tables summarize MEMP’s average net production, average sales prices by product and average production costs for the years ended December 31, 2013 and 2012, respectively:
| Year Ended December 31, | ||||||||
| 2013 | 2012 | |||||||
| Production Volumes: |
||||||||
| Oil (MBbls) |
1,764 | 1,519 | ||||||
| NGLs (MBbls) |
1,632 | 745 | ||||||
| Natural gas (MMcf) |
35,924 | 29,744 | ||||||
|
|
|
|
|
|||||
| Total (MMcfe) |
56,303 | 43,329 | ||||||
| Average net production (MMcfe/d) |
154.3 | 118.4 | ||||||
| Average Sales Price (Excluding Commodity Derivatives): |
||||||||
| Oil (per Bbl) |
$ | 96.98 | $ | 95.54 | ||||
| NGL (Per Bbl) |
31.38 | 35.75 | ||||||
| Natural Gas (per Mcf) |
3.31 | 2.82 | ||||||
|
|
|
|
|
|||||
| Total (per Mcfe) |
$ | 6.06 | $ | 5.90 | ||||
| Average Unit Costs per Mcfe: |
||||||||
| Lease operating expense |
$ | 1.58 | $ | 1.85 | ||||
Productive Wells
Productive wells consist of producing wells and wells capable of production, including natural gas wells awaiting pipeline connections to commence deliveries and oil wells awaiting connection to production facilities. Gross wells are the total number of producing wells in which MEMP owns an interest, and net wells are the sum of MEMP’s fractional working interests owned in gross wells. The following table sets forth information relating to the productive wells in which MEMP owned a working interest as of December 31, 2013.
| Oil | Natural Gas | |||||||||||||||
| Gross | Net | Gross | Net | |||||||||||||
| Operated(1) |
489 | 441 | 1,432 | 1,063 | ||||||||||||
| Non-operated |
43 | 8 | 902 | 151 | ||||||||||||
|
|
|
|
|
|
|
|
|
|||||||||
| Total |
532 | 449 | 2,334 | 1,214 | ||||||||||||
|
|
|
|
|
|
|
|
|
|||||||||
| (1) | Includes wells operated by MRD LLC on MEMP’s behalf. |
107
Table of Contents
Developed Acreage
Acreage related to royalty, overriding royalty and other similar interests is excluded from this summary. As of December 31, 2013, substantially all of MEMP’s leasehold acreage was held by production. The following table sets forth information as of December 31, 2013 relating to MEMP’s leasehold acreage.
| Developed Acreage(1) | ||||||||
| Region |
Gross(2) | Net(3) | ||||||
| East Texas/North Louisiana |
142,118 | 55,593 | ||||||
| Permian |
33,832 | 24,675 | ||||||
| Rockies |
133,664 | 48,910 | ||||||
| South Texas |
85,027 | 70,629 | ||||||
|
|
|
|
|
|||||
| Total |
394,641 | 199,807 | ||||||
|
|
|
|
|
|||||
| (1) | Developed acres are acres spaced or assigned to productive wells or wells capable of production. |
| (2) | A gross acre is an acre in which MEMP owns a working interest. The number of gross acres is the total number of acres in which MEMP owns a working interest. |
| (3) | A net acre is deemed to exist when the sum of MEMP’s fractional ownership working interests in gross acres equals one. The number of net acres is the sum of the fractional working interests owned in gross acres expressed as whole numbers and fractions thereof. |
Undeveloped Acreage
The following table sets forth information as of December 31, 2013 relating to MEMP’s undeveloped leasehold acreage.
| Undeveloped Acreage |
||||||||
| Region |
Gross(1) | Net(2) | ||||||
| East Texas/North Louisiana |
14,385 | 5,254 | ||||||
| Permian |
16,717 | 13,599 | ||||||
| Rockies |
73,422 | 50,802 | ||||||
| South Texas |
1,658 | 1,658 | ||||||
|
|
|
|
|
|||||
| Total |
106,182 | 71,313 | ||||||
|
|
|
|
|
|||||
| (1) | A gross acre is an acre in which MEMP owns a working interest. The number of gross acres is the total number of acres in which MEMP owns a working interest. |
| (2) | A net acre is deemed to exist when the sum of MEMP’s fractional ownership working interests in gross acres equals one. The number of net acres is the sum of the fractional working interests owned in gross acres expressed as whole numbers and fractions thereof. |
108
Table of Contents
Drilling Activities
MEMP’s drilling activities consist entirely of development wells. The following table sets forth information with respect to wells drilled and completed by MEMP, its predecessor, or the previous owners during the periods indicated. The information should not be considered indicative of future performance, nor should a correlation be assumed between the number of productive wells drilled, quantities of reserves found or economic value.
| Year Ended December 31, | ||||||||||||||||||||||||
| 2013 | 2012 | 2011 | ||||||||||||||||||||||
| Gross | Net | Gross | Net | Gross | Net | |||||||||||||||||||
| Development wells: |
||||||||||||||||||||||||
| Productive |
45.0 | 32.6 | 38.0 | 24.4 | 14.0 | 10.7 | ||||||||||||||||||
| Dry |
— | — | 1.0 | 1.0 | 1.0 | 1.0 | ||||||||||||||||||
| Exploratory wells: |
||||||||||||||||||||||||
| Productive |
— | — | — | — | — | — | ||||||||||||||||||
| Dry |
— | — | — | — | — | — | ||||||||||||||||||
| Total wells: |
||||||||||||||||||||||||
| Productive |
45.0 | 32.6 | 38.0 | 24.4 | 14.0 | 10.7 | ||||||||||||||||||
| Dry |
— | — | 1.0 | 1.0 | 1.0 | 1.0 | ||||||||||||||||||
|
|
|
|
|
|
|
|
|
|
|
|
|
|||||||||||||
| Total |
45.0 | 32.6 | 39.0 | 25.4 | 15.0 | 11.7 | ||||||||||||||||||
|
|
|
|
|
|
|
|
|
|
|
|
|
|||||||||||||
For purposes of the table above, MEMP’s predecessor refers collectively to (a) BlueStone and its wholly-owned subsidiaries and certain oil and natural gas properties owned by Classic Hydrocarbons Holdings, L.P. for periods prior to the closing of MEMP’s initial public offering on December 14, 2011 and (b) for periods after April 8, 2011 through the closing of MEMP’s initial public offering, certain oil and natural gas properties owned by WHT Energy Partners LLC. MEMP’s previous owners refers collectively to (a) certain oil and natural gas properties that MEMP acquired from MRD LLC in April and May 2012 for periods after common control commenced through their respective acquisition dates and (b) Rise Energy Operating, LLC and its wholly-owned subsidiaries (except for Rise Energy Operating, Inc.) from February 3, 2009 (inception) through December 11, 2012.
Delivery Commitments
MEMP has no commitments to deliver a fixed and determinable quantity of our oil or natural gas production in the near future under our existing contracts.
Marketing and Major Customers
We market the majority of production from properties we and MEMP operate for both our account and the account of the other working interest owners in our operated properties. We sell substantially all of our production to a variety of purchasers under contracts ranging from one month to several years, all at market prices. We normally sell production to a relatively small number of customers, as is customary in the exploration, development and production business. During the year ended December 31, 2013, Energy Transfer Equity, L.P. and subsidiaries accounted for 77% of our revenues and Phillips 66 accounted for 15% of MEMP’s revenues. If we were to lose any one of our customers, the loss could temporarily delay production and sale of a portion of our oil and natural gas in the related producing region. If we were to lose any single customer, we believe we could identify a substitute customer to purchase the impacted production volumes. However, if one or more of our larger customers ceased purchasing oil or natural gas altogether, the loss of any such customer could have a detrimental effect on our production volumes in general and on our ability to find substitute customers to purchase our production volumes.
109
Table of Contents
Title to Properties
We believe that we and MEMP have satisfactory title to all of our producing properties in accordance with generally accepted industry standards. As is customary in the industry, in the case of undeveloped properties, often cursory investigation of record title is made at the time of lease acquisition. Investigations are made before the consummation of an acquisition of producing properties and before commencement of drilling operations on undeveloped properties. Individual properties may be subject to burdens that we believe do not materially interfere with the use or affect the value of the properties. Burdens on properties may include customary royalty interests, liens incident to operating agreements and for current taxes, obligations or duties under applicable laws, development obligations under natural gas leases, or net profits interests.
Oil and Natural Gas Leases
The typical oil and natural gas lease agreement covering our properties and MEMP’s properties provides for the payment of royalties to the mineral owner for all oil and natural gas produced from any wells drilled on the leased premises. The lessor royalties and other leasehold burdens on our properties generally range from 12.5% to 25%, resulting in a net revenue interest to us generally ranging from 87.5% to 75%. 52% of our leasehold acreage is held by production.
Seasonality
Demand for oil and natural gas generally decreases during the spring and fall months and increases during the summer and winter months. However, seasonal anomalies such as mild winters or mild summers sometimes lessen this fluctuation. In addition, certain natural gas users utilize natural gas storage facilities and purchase some of their anticipated winter requirements during the summer. This can also lessen seasonal demand fluctuations. These seasonal anomalies can increase competition for equipment, supplies and personnel during the spring and summer months, which could lead to shortages and increase costs or delay our operations or MEMP’s operations.
Competition
The oil and natural gas industry is intensely competitive, and we and MEMP compete with other companies in our industry that have greater resources than we do, especially in our focus areas. Many of these companies not only explore for and produce oil and natural gas, but also carry on refining operations and market petroleum and other products on a regional, national or worldwide basis. These companies may be able to pay more for productive natural gas properties and exploratory locations or define, evaluate, bid for and purchase a greater number of properties and locations than our financial or human resources permit, and may be able to expend greater resources to attract and maintain industry personnel. In addition, these companies may have a greater ability to continue exploration activities during periods of low natural gas market prices. Our larger competitors may be able to absorb the burden of existing, and any changes to, federal, state and local laws and regulations more easily than we can, which would adversely affect our competitive position. Our ability to acquire additional properties and to discover reserves in the future will be dependent upon our ability to evaluate and select suitable properties and to consummate transactions in a highly competitive environment. In addition, because we have fewer financial and human resources than many companies in our industry, we may be at a disadvantage in bidding for exploratory locations and producing natural gas properties.
Hydraulic Fracturing
We and MEMP use hydraulic fracturing as a means to maximize the productivity of almost every well that we drill and complete. Hydraulic fracturing is a necessary part of the completion process because our properties are dependent upon our ability to effectively fracture the producing formations in order to produce at economic rates. Nearly all of our proved non-producing and proved undeveloped reserves associated with future drilling,
110
Table of Contents
recompletion, and refracture stimulation projects, or approximately 71.3% of our total estimated proved reserves as of December 31, 2013 and approximately 37.6% of MEMP’s total estimated proved reserves as of December 31, 2013, require hydraulic fracturing.
We have and continue to follow applicable industry standard practices and legal requirements for groundwater protection in our and MEMP’s operations which are subject to supervision by state and federal regulators (including the Bureau of Land Management on federal acreage). These protective measures include setting surface casing at a depth sufficient to protect fresh water zones as determined by regulatory agencies, and cementing the well to create a permanent isolating barrier between the casing pipe and surrounding geological formations. This aspect of well design essentially eliminates a pathway for the fracturing fluid to contact any aquifers during the hydraulic fracturing operations. For recompletions of existing wells, the production casing is pressure tested prior to perforating the new completion interval.
Injection rates and pressures are monitored instantaneously and in real time at the surface during our hydraulic fracturing operations. Pressure is monitored on both the injection string and the immediate annulus to the injection string. Hydraulic fracturing operations would be shut down immediately if an abrupt change occurred to the injection pressure or annular pressure.
Certain state regulations require disclosure of the components in the solutions used in hydraulic fracturing operations. Approximately 99% of the hydraulic fracturing fluids we use are made up of water and sand. The remainder of the constituents in the fracturing fluid are managed and used in accordance with applicable requirements.
Hydraulic fracture stimulation requires the use of a significant volume of water. Upon flowback of the water, we dispose of it in a way that minimizes the impact to nearby surface water by disposing into approved disposal or injection wells. We currently do not discharge water to the surface.
For information regarding existing and proposed governmental regulations regarding hydraulic fracturing and related environmental matters, please read “—Regulation of Environmental and Occupational Health and Safety Matters—Hydraulic Fracturing.”
Regulation of the Oil and Natural Gas Industry
Our and MEMP’s operations are substantially affected by federal, state and local laws and regulations. In particular, natural gas production and related operations are, or have been, subject to price controls, taxes and numerous other laws and regulations. All of the jurisdictions in which we own or operate producing oil and natural gas properties have statutory provisions regulating the exploration for and production of oil and natural gas, including provisions related to permits for the drilling of wells, bonding requirements to drill or operate wells, the location of wells, the method of drilling and casing wells, the surface use and restoration of properties upon which wells are drilled, sourcing and disposal of water used in the drilling and completion process, and the abandonment of wells. Our operations are also subject to various conservation laws and regulations. These include the regulation of the size of drilling and spacing units or proration units, the number of wells which may be drilled in an area, and the unitization or pooling of crude natural gas wells, as well as regulations that generally prohibit the venting or flaring of natural gas, and impose certain requirements regarding the ratability or fair apportionment of production from fields and individual wells.
Failure to comply with applicable laws and regulations can result in substantial penalties. The regulatory burden on the industry increases the cost of doing business and affects profitability. Although we believe we are in substantial compliance with all applicable laws and regulations, such laws and regulations are frequently amended or reinterpreted. Therefore, we are unable to predict the future costs or impact of compliance. Additional proposals and proceedings that affect the natural gas industry are regularly considered by Congress, the states, FERC, and the courts. We cannot predict when or whether any such proposals may become effective.
111
Table of Contents
We believe we and MEMP are in substantial compliance with currently applicable laws and regulations and that continued substantial compliance with existing requirements will not have a material adverse effect on our financial position, cash flows or results of operations. However, current regulatory requirements may change, currently unforeseen environmental incidents may occur or past non-compliance with environmental laws or regulations may be discovered.
Regulation of Production of Oil and Natural Gas
The production of oil and natural gas is subject to regulation under a wide range of local, state and federal statutes, rules, orders and regulations. Federal, state and local statutes and regulations require permits for drilling operations, drilling bonds and reports concerning operations. All of the states in which we and MEMP own and operate properties have regulations governing conservation matters, including provisions for the unitization or pooling of oil and natural gas properties, the establishment of maximum allowable rates of production from oil and natural gas wells, the regulation of well spacing, and plugging and abandonment of wells. The effect of these regulations is to limit the amount of oil and natural gas that we can produce from our wells and to limit the number of wells or the locations at which we can drill, although we can apply for exceptions to such regulations or to have reductions in well spacing. Moreover, each state generally imposes a production or severance tax with respect to the production and sale of oil, natural gas and natural gas liquids within its jurisdiction. We own interests in properties located onshore in different U.S. states. These states regulate drilling and operating activities by requiring, among other things, permits for the drilling of wells, maintaining bonding requirements in order to drill or operate wells, and regulating the location of wells, the method of drilling and casing wells, the surface use and restoration of properties upon which wells are drilled and the plugging and abandonment of wells. The laws of these states also govern a number of environmental and conservation matters, including the handling and disposing or discharge of waste materials, the size of drilling and spacing units or proration units and the density of wells that may be drilled, unitization and pooling of oil and natural gas properties and establishment of maximum rates of production from oil and natural gas wells. Some states have the power to prorate production to the market demand for oil and natural gas. The failure to comply with these rules and regulations can result in substantial penalties. Our competitors in the oil and natural gas industry are subject to the same regulatory requirements and restrictions that affect our operations.
Regulation of Environmental and Occupational Health and Safety Matters
Our and MEMP’s operations are subject to numerous stringent federal, state and local statutes and regulations governing the discharge of materials into the environment or otherwise relating to protection of the environment or occupational health and safety. Numerous governmental agencies, such as the U.S. Environmental Protection Agency (“EPA”), issue regulations, which often require difficult and costly compliance measures that carry substantial administrative, civil and criminal penalties and may result in injunctive obligations for failure to comply. These laws and regulations may require the acquisition of a permit before drilling commences, restrict the types, quantities and concentrations of various substances that can be released into the environment in connection with drilling, production and transporting through pipelines, govern the sourcing and disposal of water used in the drilling, completion and production process, limit or prohibit drilling activities in certain areas and on certain lands lying within wilderness, wetlands, frontier and other protected areas, require some form of remedial action to prevent or mitigate pollution from current or former operations such as plugging abandoned wells or closing earthen pits, result in the suspension or revocation of necessary permits, licenses and authorizations, require that additional pollution controls be installed and impose substantial liabilities for pollution resulting from operations or failure to comply with regulatory filings. In addition, these laws and regulations may restrict the rate of production. The strict and joint and several liability nature of such laws and regulations could impose liability upon us regardless of fault. Public interest in the protection of the environment has increased dramatically in recent years. The trend of more expansive and stringent environmental legislation and regulations applied to the crude oil and natural gas industry could continue, resulting in increased costs of doing business and consequently affecting profitability. Changes in environmental laws and regulations occur frequently, and to the extent laws are enacted or other governmental
112
Table of Contents
action is taken that restricts drilling or imposes more stringent and costly operating, waste handling, disposal and cleanup requirements, our business and prospects, as well as the oil and natural gas industry in general, could be materially adversely affected.
Hazardous Substance and Waste Handling
Our and MEMP’s operations are subject to environmental laws and regulations relating to the management and release of hazardous substances, solid and hazardous wastes and petroleum hydrocarbons. These laws generally regulate the generation, storage, treatment, transportation and disposal of solid and hazardous waste and may impose strict and, in some cases, joint and several liability for the investigation and remediation of affected areas where hazardous substances may have been released or disposed. The Comprehensive Environmental Response, Compensation, and Liability Act, as amended, referred to as CERCLA or the Superfund law, and comparable state laws, impose liability, without regard to fault or the legality of the original conduct, on certain classes of persons deemed “responsible parties.” These persons include current owners or operators of the site where a release of hazardous substances occurred, prior owners or operators that owned or operated the site at the time of the release or disposal of hazardous substances, and companies that disposed or arranged for the disposal of the hazardous substances found at the site. Under CERCLA, these persons may be subject to strict and joint and several liability for the costs of cleaning up the hazardous substances that have been released into the environment, for damages to natural resources and for the costs of certain health studies. CERCLA also authorizes the EPA and, in some instances, third parties to act in response to threats to the public health or the environment and to seek to recover the costs they incur from the responsible classes of persons. It is not uncommon for neighboring landowners and other third parties to file claims for personal injury and property damage allegedly caused by hazardous substances or other pollutants released into the environment. Despite the “petroleum exclusion” of Section 101(14) of CERCLA, which currently encompasses natural gas, we may nonetheless handle hazardous substances within the meaning of CERCLA, or similar state statutes, in the course of our ordinary operations and, as a result, may be jointly and severally liable under CERCLA for all or part of the costs required to clean up sites at which these hazardous substances have been released into the environment. In addition, we may have liability for releases of hazardous substances at our properties by prior owners or operators or other third parties.
The Oil Pollution Act of 1990 (the “OPA”) is the primary federal law imposing oil spill liability. The OPA contains numerous requirements relating to the prevention of and response to petroleum releases into waters of the United States, including the requirement that operators of offshore facilities and certain onshore facilities near or crossing waterways must maintain certain significant levels of financial assurance to cover potential environmental cleanup and restoration costs. Under the OPA, strict, joint and several liability may be imposed on “responsible parties” for all containment and cleanup costs and certain other damages arising from a release, including, but not limited to, the costs of responding to a release of oil to surface waters and natural resource damages, resulting from oil spills into or upon navigable waters, adjoining shorelines or in the exclusive economic zone of the United States. A “responsible party” includes the owner or operator of an onshore facility. The OPA establishes a liability limit for onshore facilities of $350 million. These liability limits may not apply if: a spill is caused by a party’s gross negligence or willful misconduct; the spill resulted from violation of a federal safety, construction or operating regulation; or a party fails to report a spill or to cooperate fully in a clean-up. We are also subject to analogous state statutes that impose liabilities with respect to oil spills.
We also generate solid wastes, including hazardous wastes, which are subject to the requirements of the Resource Conservation and Recovery Act (“RCRA”), as amended, and comparable state statutes. Although RCRA regulates both solid and hazardous wastes, it imposes strict requirements on the generation, storage, treatment, transportation and disposal of hazardous wastes. Certain petroleum production wastes are excluded from RCRA’s hazardous waste regulations. It is possible, however, that these wastes, which could include wastes currently generated during our operations, could be designated as “hazardous wastes” in the future and, therefore, be subject to more rigorous and costly disposal requirements. Indeed, legislation has been proposed from time to time in Congress to re-categorize certain oil and gas exploration and production wastes as “hazardous wastes.”
113
Table of Contents
Any such changes in the laws and regulations could have a material adverse effect on our maintenance capital expenditures and operating expenses.
We believe that we and MEMP are in substantial compliance with the requirements of CERCLA, RCRA, OPA and related state and local laws and regulations, and that we hold all necessary and up-to-date permits, registrations and other authorizations required under such laws and regulations. Although we believe that the current costs of managing our wastes as they are presently classified are reflected in our budget, any legislative or regulatory reclassification of oil and natural gas exploration and production wastes could increase our costs to manage and dispose of such wastes.
Water and Other Waste Discharges and Spills
The Federal Water Pollution Control Act, as amended, also known as the Clean Water Act, the Safe Drinking Water Act (“SDWA”), the OPA and comparable state laws impose restrictions and strict controls regarding the discharge of pollutants, including produced waters and other natural gas wastes, into federal and state waters. The discharge of pollutants into regulated waters is prohibited, except in accordance with the terms of a permit issued by the EPA or the state. The discharge of dredge and fill material in regulated waters, including wetlands, is also prohibited, unless authorized by a permit issued by the U.S. Army Corps of Engineers. The EPA has also adopted regulations requiring certain oil and natural gas exploration and production facilities to obtain individual permits or coverage under general permits for storm water discharges. Costs may be associated with the treatment of wastewater or developing and implementing storm water pollution prevention plans, as well as for monitoring and sampling the storm water runoff from certain of our facilities. Some states also maintain groundwater protection programs that require permits for discharges or operations that may impact groundwater conditions. The underground injection of fluids is subject to permitting and other requirements under state laws and regulation. Obtaining permits has the potential to delay the development of oil and natural gas projects. These same regulatory programs also limit the total volume of water that can be discharged, hence limiting the rate of development, and require us to incur compliance costs. These laws and any implementing regulations provide for administrative, civil and criminal penalties for any unauthorized discharges of oil and other substances in reportable quantities and may impose substantial potential liability for the costs of removal, remediation and damages. Pursuant to these laws and regulations, we may be required to obtain and maintain approvals or permits for the discharge of wastewater or storm water and the underground injection of fluids and are required to develop and implement spill prevention, control and countermeasure plans, also referred to as “SPCC plans,” in connection with on-site storage of significant quantities of oil. We and MEMP maintain all required discharge permits necessary to conduct our operations, and we believe we and MEMP are in substantial compliance with their terms.
Hydraulic Fracturing
We and MEMP use hydraulic fracturing extensively in our operations. Hydraulic fracturing is an essential and common practice in the oil and gas industry used to stimulate production of natural gas and/or oil from low permeability subsurface rock formations. Hydraulic fracturing involves using water, sand, and certain chemicals to fracture the hydrocarbon-bearing rock formation to allow flow of hydrocarbons into the wellbore. While hydraulic fracturing has historically been regulated by state oil and natural gas commissions, the practice has become increasingly controversial in certain parts of the country, resulting in increased scrutiny and regulation. For example, the EPA has asserted federal regulatory authority over certain hydraulic-fracturing activities under the SDWA involving the use of diesel fuels and published permitting guidance in February 2014 addressing the use of diesel in fracturing operations. Also, the EPA has indicated that it may develop and issue regulations under the Toxic Substances Control Act to require companies to disclose information regarding the chemicals used in hydraulic fracturing; however, to date, it has taken no action to do so. In addition, Congress has from time to time considered legislation to amend the SDWA, including legislation that would repeal the exemption for hydraulic fracturing from the definition of “underground injection” and require federal permitting and regulatory control of hydraulic fracturing, as well as
114
Table of Contents
legislative proposals to require disclosure of the chemical constituents of the fluids used in the fracturing process. Also, in the near future we may be subject to regulations that restrict our ability to discharge water produced as part of our production operations, and the ability to use injection wells as a disposal option not only will depend on federal or state regulations but also on whether available injection wells have sufficient storage capacities. The EPA is currently developing effluent limitation guidelines that may impose federal pre-treatment standards on all oil and gas operators transporting wastewater associated with hydraulic fracturing activities to publicly owned treatment works for disposal. The EPA plans to propose such standards by late 2014. In addition, in May 2013, the federal Bureau of Land Management published a supplemental notice of proposed rulemaking governing hydraulic fracturing on federal and Indian lands that replaces a prior draft of proposed rulemaking issued by the agency in May 2012. The revised proposed rule would continue to require public disclosure of chemicals used in hydraulic fracturing on federal and Indian lands, confirmation that wells used in fracturing operations meet appropriate construction standards, and development of appropriate plans for managing flowback water that returns to the surface.
Further, in April 2012, the EPA released final rules that subject all oil and gas operations (production, processing, transmission, storage and distribution) to regulation under the new source performance standards (“NSPS”) and the National Emission Standards for Hazardous Air Pollutants (“NESHAPS”) programs. These rules became effective October 2012. The rules include NSPS standards for completions of hydraulically-fractured gas wells. The standards include the reduced emission completion techniques, or “green completions,” developed in the EPA’s Natural Gas STAR program along with pit flaring of gas not sent to the gathering line. “Green completions” for hydraulic fracturing will require the operator to recover rather than vent the gas and NGLs that come to the surface during completion of the fracturing process. The standards will be applicable to newly drilled and fractured wells and wells that are refractured on or after January 1, 2015. Further, the rules under NESHAPS include Maximum Achievable Control Technology (“MACT”) standards for glycol dehydrators and storage vessels at major source of hazardous air pollutants not currently subject to MACT standards. In April 2013 EPA issued a proposed revision as a result of legal challenges to the original rule which may impact the scope of these rules. The rule is designed to limit emissions of volatile organic compounds (“VOC”), sulfur dioxide, and hazardous air pollutants from a variety of sources within natural gas processing plants, oil and natural gas production facilities, and natural gas transmission compressor stations. This rule could require a number of modifications to our operations including the installation of new equipment. Compliance with such rules could result in significant costs, including increased capital expenditures and operating costs, and could adversely impact our business. Additionally, in December 2012, seven states submitted a notice of intent to sue the EPA to compel the agency to make a determination as to whether standards or performance limiting methane emissions from oil and gas sources is appropriate and if so, to promulgate performance standards for methane emissions from existing oil and gas sources.
Several states have adopted, or are considering adopting, regulations that could restrict or prohibit hydraulic fracturing in certain circumstances and/or require the disclosure of the composition of hydraulic fracturing fluids. For example, Texas requires oil and natural gas operators to publicly disclose the chemicals used in the hydraulic fracturing process. Regulations require that well operators disclose the list of chemical ingredients subject to the requirements of the Occupational Safety and Health Act, as amended (“OSHA”) for disclosure on an internet website and also file the list of chemicals with the Texas Railroad Commission with the well completion report. The total volume of water used to hydraulically fracture a well must also be disclosed to the public and filed with the Texas Railroad Commission. Furthermore, in May 2013, the Texas Railroad Commission issued a “well integrity rule,” which updates the requirements for drilling, putting pipe down, and cementing wells. The rule also includes new testing and reporting requirements, such as (i) the requirement to submit cementing reports after well completion or after cessation of drilling, whichever is later, and (ii) the imposition of additional testing on wells less than 1,000 feet below usable groundwater. The “well integrity rule” took effect in January 2014. We believe that we follow applicable standard industry practices and legal requirements for groundwater protection in our hydraulic fracturing activities. Nonetheless, if new or more stringent federal, state, or local legal restrictions relating to the hydraulic fracturing process are adopted in areas where we operate, we could incur potentially significant added costs to comply with such requirements, experience delays or curtailment in the pursuit of exploration, development, or production activities, and perhaps even be precluded from drilling wells.
115
Table of Contents
Certain governmental reviews have been conducted or are underway that focus on environmental aspects of hydraulic fracturing practices, which could lead to increased regulation. For example, the White House Council on Environmental Quality is coordinating an administration-wide review of hydraulic fracturing practices. The EPA has also commenced a study of the potential environmental effects of hydraulic fracturing on drinking water and groundwater, with a first progress report outlining work currently underway by the agency released on December 21, 2012, and a final report drawing conclusions about the potential impacts of hydraulic fracturing on drinking water resources expected to be available for public comment and peer review by late 2014. Other governmental agencies, including the U.S. Department of Energy, have evaluated or are evaluating various other aspects of hydraulic fracturing. These ongoing or proposed studies could spur initiatives to further regulate hydraulic fracturing under the SDWA or other regulatory mechanisms, and could ultimately make it more difficult or costly for us to perform fracturing and increase our costs of compliance and doing business.
A number of lawsuits and enforcement actions have been initiated across the country alleging that hydraulic fracturing practices have adversely impacted drinking water supplies, use of surface water, and the environment generally. If new laws or regulations that significantly restrict hydraulic fracturing are adopted, such laws could make it more difficult or costly for us to perform fracturing to stimulate production from tight formations as well as make it easier for third parties opposing the hydraulic fracturing process to initiate legal proceedings based on allegations that specific chemicals used in the fracturing process could adversely affect groundwater. In addition, if hydraulic fracturing is further regulated at the federal or state level, our fracturing activities could become subject to additional permitting and financial assurance requirements, more stringent construction specifications, increased monitoring, reporting and recordkeeping obligations, plugging and abandonment requirements and also to attendant permitting delays and potential increases in costs. Such legislative changes could cause us to incur substantial compliance costs, and compliance or the consequences of any failure to comply by us could have a material adverse effect on our financial condition and results of operations. At this time, it is not possible to estimate the impact on our business of newly enacted or potential federal or state legislation governing hydraulic fracturing, and any of the above risks could impair our ability to manage our business and have a material adverse effect on our operations, cash flows and financial position.
Air Emissions
The federal Clean Air Act, as amended, and comparable state laws restrict the emission of air pollutants from many sources, including compressor stations, through the issuance of permits and the imposition of other requirements. These laws and regulations may require us to obtain pre-approval for the construction or modification of certain projects or facilities expected to produce or significantly increase air emissions, obtain and strictly comply with stringent air permit requirements or utilize specific equipment or technologies to control emissions of certain pollutants. The need to obtain permits has the potential to delay the development of oil and natural gas projects. Over the next several years, we may be required to incur certain capital expenditures for air pollution control equipment or other air emissions related issues. For example, in August 2012, the EPA published final rules under the Clean Air Act that subject oil and natural gas production, processing, transmission and storage operations to regulation under the NSPS and NESHAPS programs. With regards to production activities, these final rules require, among other things, the reduction of volatile organic compound emissions from three subcategories of fractured and refractured gas wells for which well completion operations are conducted: wildcat (exploratory) and delineation gas wells; low reservoir pressure non-wildcat and non-delineation gas wells; and all “other” fractured and refractured gas wells. All three subcategories of wells must route flow back emissions to a gathering line or be captured and combusted using a combustion device such as a flare after October 15, 2012. However, the “other” wells must use reduced emission completions, also known as “green completions,” with or without combustion devices, after January 1, 2015. These regulations also establish specific new requirements regarding emissions from production-related wet seal and reciprocating compressors, effective October 15, 2012, and from pneumatic controllers and storage vessels, effective October 15, 2013. The EPA received numerous requests for reconsideration of these rules from both industry and the environmental community, and court challenges to the rules were also filed. The EPA issued revised rules in 2013 responding to these requests. For example, on April 12, 2013, the EPA published a proposed amendment
116
Table of Contents
extending compliance dates for certain storage vessels, and on September 23, 2013, the EPA issued a press release announcing that it had finalized the proposed amendment.
We may be required to incur certain capital expenditures in the next few years for air pollution control equipment in connection with maintaining or obtaining operating permits addressing other air emission related issues, which may have a material adverse effect on our operations. Obtaining permits also has the potential to delay the development of oil and natural gas projects. We believe that we and MEMP currently are in substantial compliance with all air emissions regulations and that we and MEMP hold all necessary and valid construction and operating permits for our current operations.
Regulation of “Greenhouse Gas” Emissions
In response to findings that emissions of carbon dioxide, methane and other greenhouse gases (“GHGs”) present an endangerment to public health and the environment, the EPA has adopted regulations under existing provisions of the federal Clean Air Act that, among other things, establish Prevention of Significant Deterioration (“PSD”) construction and Title V operating permit reviews for certain large stationary sources that are potential major sources of GHG emissions. As part of these efforts, the EPA issued a final rule (the “Tailoring Rule”), effective January 1, 2011, that established emissions thresholds such that only these large stationary sources are subject to GHG permitting. On October 15, 2013, the U.S. Supreme Court announced it will review aspects of the Tailoring Rule in 2014. In addition, the EPA has adopted rules requiring the monitoring and reporting of GHG emissions from specified onshore and offshore oil and gas production sources in the United States on an annual basis, which include certain of our operations.
In addition, in August 2012, the EPA established NSPS for VOCs and sulfur dioxide and an air toxic standard for oil and natural gas production, transmission, and storage. The rules include the first federal air standards for natural gas wells that are hydraulically fractured, or refractured, as well as requirements for several other sources, such as storage tanks and other equipment, and limits methane emissions from these sources in an effort to reduce GHG emissions. These requirements could adversely affect our operations by requiring us to make significant expenditures to ensure compliance with the NSPS.
While Congress has from time to time considered legislation to reduce emissions of GHGs, there has not been significant activity in the form of adopted legislation to reduce GHG emissions at the federal level in recent years. In the absence of such federal climate legislation, a number of state and regional efforts have emerged that are aimed at tracking and/or reducing GHG emissions by means of cap and trade programs that typically require major sources of GHG emissions, such as electric power plants, to acquire and surrender emission allowances in return for emitting those GHGs. If Congress were to undertake comprehensive tax reform in the coming year, it is possible that such reform may include a carbon tax, which could impose additional direct costs on operations and reduce demand for refined products. In any event, the Obama administration has announced its Climate Action Plan, which, among other things, directs federal agencies to develop a strategy for the reduction of methane emissions, including emissions from the oil and gas industry. As part of the Climate Action Plan, the Obama Administration also announced that it intends to adopt additional regulations to reduce emissions of GHGs and to encourage greater use of low carbon technologies in the coming years. For example, in September 2013, the EPA re-issued proposed NSPS for GHG emissions from Electric Utility Generating Units. Finally, it should be noted that some scientists have concluded that increasing concentrations of GHGs in the Earth’s atmosphere may produce climate changes that have significant physical effects, such as increased frequency and severity of storms, floods and other climatic events; if any such effects were to occur, they could have an adverse effect on our exploration and production operations.
Restrictions on GHG emissions that may be imposed in various states could adversely affect the oil and natural gas industry. Any GHG regulation could increase our costs of compliance by potentially delaying the receipt of permits and other regulatory approvals; requiring us to monitor emissions, install additional equipment or modify facilities to reduce GHG and other emissions; purchase emission credits; and utilize electric driven
117
Table of Contents
compression at facilities to obtain regulatory permits and approvals in a timely manner. While we are subject to certain federal GHG monitoring and reporting requirements, our operations are not adversely impacted by existing federal, state and local climate change initiatives and, at this time, it is not possible to accurately estimate how potential future laws or regulations addressing GHG emissions would impact our business.
Occupational Safety and Health Act
We are also subject to the requirements of the OSHA and comparable state laws that regulate the protection of the health and safety of employees. In addition, OSHA’s hazard communication standard requires that information be maintained about hazardous materials used or produced in our operations and that this information be provided to employees, state and local government authorities and citizens. We believe that our and MEMP’s operations are in substantial compliance with the OSHA requirements.
National Environmental Policy Act
Oil and natural gas exploration and production activities on federal lands are subject to the National Environmental Policy Act (“NEPA”). NEPA requires federal agencies, including the Departments of Interior and Agriculture, to evaluate major agency actions having the potential to significantly impact the environment. In the course of such evaluations, an agency prepares an environmental assessment to evaluate the potential direct, indirect and cumulative impacts of a proposed project. If impacts are considered significant, the agency will prepare a more detailed environmental impact study that is made available for public review and comment. All of our current exploration and production activities, as well as proposed exploration and development plans, on federal lands require governmental permits that are subject to the requirements of NEPA. This environmental impact assessment process has the potential to delay the development of oil and natural gas projects. Authorizations under NEPA also are subject to protest, appeal or litigation, which can delay or halt projects.
Endangered Species Act
The Endangered Species Act (“ESA”) was established to protect endangered and threatened species. Pursuant to the ESA, if a species is listed as threatened or endangered, restrictions may be imposed on activities adversely affecting that species’ habitat. Similar protections are offered to migratory birds under the Migratory Bird Treaty Act. We conduct operations on federal oil and natural gas leases in areas where certain species that are listed as threatened or endangered and where other species, such as the sage grouse, potentially could be listed as threatened or endangered under the ESA exist. The U.S. Fish and Wildlife Service may designate critical habitat and suitable habitat areas that it believes are necessary for survival of a threatened or endangered species. A critical habitat or suitable habitat designation could result in further material restrictions to federal land use and may materially delay or prohibit land access for oil and natural gas development. If we were to have a portion of our leases designated as critical or suitable habitat, it could cause us to incur additional costs or become subject to operating restrictions or bans in the affected areas, which could adversely impact the value of our leases.
Summary
In summary, we believe we and MEMP are in substantial compliance with currently applicable environmental laws and regulations. Although we have not experienced any material adverse effect from compliance with environmental requirements, there is no assurance that this will continue. We did not have any material capital or other non-recurring expenditures in connection with complying with environmental laws or environmental remediation matters in 2012 or 2013.
Employees
As of December 31, 2013, we had 332 full-time employees. Our future success will depend partially on our ability to attract, retain and motivate qualified personnel. We are not a party to any collective bargaining agreements and have not experienced any strikes or work stoppages. We consider our relations with our employees to be satisfactory.
118
Table of Contents
Our Offices
Our executive offices are located at 1301 McKinney St., Suite 2100, Houston, TX 77010, and the phone number at this address is (713) 588-8300.
Legal Proceedings
From time to time, we are subject to various legal proceedings arising in the ordinary course of business, including proceedings for which we have insurance coverage. As of the date hereof, neither we nor MEMP are party to any material legal proceedings.
119
Table of Contents
Directors and Executive Officers
The following table provides information regarding our current executive officers and directors as of April 3, 2014.
| Name |
Age |
Position | ||||
| Tony R. Weber |
51 | Chairman | ||||
| John A. Weinzierl |
45 | Chief Executive Officer and Director | ||||
| William J. Scarff |
58 | President | ||||
| Kyle N. Roane |
34 | Vice President, General Counsel and Corporate Secretary | ||||
| Dennis G. Venghaus |
32 | Chief Accounting Officer | ||||
| Scott A. Gieselman |
51 | Director | ||||
| Kenneth A. Hersh |
51 | Director | ||||
Set forth below is a description of the backgrounds of our executive officers and directors.
Tony R. Weber has served as Chairman of our board since our formation and as a member of MRD LLC’s board of managers and MEMP GP’s board of directors since September 2011. Mr. Weber currently serves as Managing Partner and Chief Operating Officer for NGP. Prior to joining NGP in December 2003, Mr. Weber was the Chief Financial Officer of Merit Energy Company from April 1998 to December 2003. Prior to that, he was Senior Vice President and Manager of Union Bank of California’s Energy Division in Dallas, Texas from 1987 to 1998. In his role at NGP, Mr. Weber serves on numerous private company boards as well as industry groups, IPAA Capital Markets Committee and Dallas Wildcat Committee. He currently serves on the Dean’s Council of the Mays Business School at Texas A&M University and was a founding member of the Mays Business Fellows Program.
The board believes that Mr. Weber’s extensive corporate finance, banking and private equity experience bring substantial leadership skill and experience to the Board.
John A. Weinzierl has served as our Chief Executive Officer since our formation, and the Chief Executive Officer of MRD LLC and the Chief Executive Officer and Chairman of MEMP GP since January 2014. Previously, Mr. Weinzierl served as President and Chief Executive Officer of MRD LLC and President, Chief Executive Officer and Chairman of MEMP GP since April 2011. Prior to the completion of the Partnership’s initial public offering in December 2011, Mr. Weinzierl was a managing director and operating partner of NGP from December 2010. From July 1999 to December 2010, Mr. Weinzierl worked in various positions at NGP, where he became a managing director in December 2004. Mr. Weinzierl was appointed a venture partner of NGP from February 2012 to February 2013. From October 2006 until November 2011, Mr. Weinzierl was a director of Eagle Rock Energy G&P, LLC, the indirect general partner of Eagle Rock Energy Partners, L.P., a (i) natural gas gathering, processing and transportation company and (ii) developer of oil and natural gas properties, where he also served on the compensation committee.
The board believes Mr. Weinzierl’s degree and experience in petroleum engineering and his M.B.A. education, as well as his investment and business expertise honed at NGP, bring valuable strategic, managerial and analytical skills to the board and us.
William J. Scarff has served as our President since our formation, and the President of MRD LLC and MEMP GP since January 2014. From 2000 through January 2014, Mr. Scarff has served as President and Chief Executive Officer of several private exploration and production companies sponsored by Natural Gas Partners. Since October 2010, Mr. Scarff has served as President and Chief Executive Officer of Propel Energy, LLC. Prior to that, he was President and Chief Executive Officer of Seismic Ventures, Inc. from 2006 to 2009.
120
Table of Contents
Since February 2005, Mr. Scarff has served as President and Chief Executive Officer of Proton Operating Company, LLC and from 1999 to 2005, he was President and Chief Executive Officer of Proton Energy, LLC and its affiliates. From 1978 to 1999, Mr. Scarff held a variety of positions of increasing responsibility in Marathon Oil Company, Anadarko Production Company, Burlington Resources, Texas Meridian Resource Corporation and Hilcorp Energy Company.
Kyle N. Roane has served as our Vice President, General Counsel and Corporate Secretary since our formation, and the Vice President, General Counsel and Corporate Secretary of MRD LLC and MEMP GP since January 2014. Previously, Mr. Roane served as the General Counsel and Corporate Secretary of MRD LLC and MEMP GP since February 2012. From 2005 to February 2012, Mr. Roane practiced corporate and securities law at Akin Gump Strauss Hauer & Feld L.L.P.
Dennis G. Venghaus has served as our Chief Accounting Officer since our formation, and the Controller of MRD LLC and MEMP GP since January 2012. Prior to joining MRD LLC and MEMP GP, Mr. Venghaus was with Opportune LLP from June 2010 to January 2012 as a Manager in the Complex Financial Reporting group. From September 2004 through June 2010, he held various positions in the audit practice at PricewaterhouseCoopers LLP in Houston, TX, primarily serving energy clients. Mr. Venghaus is a Certified Public Accountant.
Scott A. Gieselman has served as a member of our board since our formation and as a member of MRD LLC’s board of managers and MEMP GP’s board of directors since September 2011. Mr. Gieselman has been a managing director of NGP since April 2007. Mr. Gieselman has served as a member of the board of directors of Rice Energy, Inc. since January 2014. From 1988 to April 2007, Mr. Gieselman worked in various positions in the investment banking energy group of Goldman, Sachs & Co., where he became a partner in 2002.
The board believes that Mr. Gieselman’s considerable financial and energy investment banking experience, as well as his experience on the boards of numerous private energy companies bring important and valuable skills to the Board.
Kenneth A. Hersh has served as a member of our board since our formation and as a member of MRD LLC’s board of managers and MEMP GP’s board of directors since April 2011. Mr. Hersh is the Chief Executive Officer of NGP Energy Capital Management and a managing partner of NGP and has served in those or similar capacities since 1989. He currently serves as a director of NGP Capital Resources Company, a business development company that focuses on the energy industry. Mr. Hersh served as a director of Resolute Energy Corporation from September 2009 to March 2012, as a director of Eagle Rock Energy G&P, LLC, the indirect general partner of Eagle Rock Energy Partners, L.P., from March 2006 until June 2011 and Energy Transfer Partners, L.L.C., the indirect general partner of Energy Transfer Partners, L.P., a natural gas gathering and processing and transportation and storage and retail propane company, from February 2004 through December 2009, and served as a director of LE GP, LLC, the general partner of Energy Transfer Equity, L.P., from October 2002 through December 2009. Mr. Hersh currently serves on the Dean’s Council of the Harvard Kennedy School and on the Advisory Councils of the Graduate School of Business at Stanford University and The Bendheim Center for Finance at Princeton University. He is also a member of the World Economic Forum where he has been a featured speaker at its annual meeting held in Davos, Switzerland.
The board believes that Mr. Hersh brings extensive knowledge to the board and us through his experiences in the energy industry as an investor, involvement in complex energy-related transactions and his position as Chief Executive Officer of NGP Energy Capital Management and co-manager of NGP’s investment portfolio. Mr. Hersh also brings a wealth of industry-specific transactional skills, entrepreneurial ideas and a personal network of public and private capital sources that the board believes will bring us opportunities that we may not otherwise have.
121
Table of Contents
Board Composition
Upon the closing of this offering, it is anticipated that we will have five directors. Assuming that the group consisting of MRD LLC and certain former management members of WildHorse Resources management continue to control more than 50% of our common stock, we intend to avail ourselves of the “controlled company” exception under NASDAQ rules, which eliminates the requirements that we (i) have a majority of independent directors, (ii) maintain a compensation committee or (iii) maintain an independent nominating function. We will be required, however, to have an audit committee comprised entirely of independent directors within the permitted “phase-in” period under NASDAQ rules.
As a result of the size of that group’s ownership of our common stock, that group will be able to control matters requiring stockholder approval, including the election of directors, changes to our organizational documents and significant corporate transactions.
If at any time we cease to be a “controlled company” under NASDAQ rules, the Board will take all action necessary to comply with the NASDAQ rules, including appointing a majority of independent directors to the Board and ensuring we have a compensation committee and a nominating and corporate governance committee, each composed entirely of independent directors, subject to a permitted “phase-in” period. We will cease to qualify as a “controlled company” once that group ceases to control a majority of our voting stock.
Initially, our board of directors will consist of a single class of directors each serving one year terms. After a group including MRD LLC and/or the Funds no longer beneficially owns more than 50% of our issued and outstanding common stock, our board of directors will be divided into three classes of directors, with each class as nearly equal in number as possible, serving staggered three year terms, and such directors being removable only for “cause.”
In evaluating director candidates, our Board will assess whether a candidate possesses the integrity, judgment, knowledge, experience, skill and expertise that are likely to enhance the ability of the Board to manage and direct our affairs and business, including, when applicable, to enhance the ability of committees of the board to fulfill their duties. We have no minimum qualifications for director candidates. In general, however, our Board will review and evaluate both incumbent and potential new directors in an effort to achieve diversity of skills and experience among our directors and in light of the following criteria:
| • | experience in business, government, education, technology or public interests; |
| • | high-level managerial experience in large organizations; |
| • | breadth of knowledge regarding our business or industry; |
| • | specific skills, experience or expertise related to an area of importance to us, such as energy production, consumption, distribution or transportation, government, policy, finance or law; |
| • | moral character and integrity; |
| • | commitment to our stockholders’ interests; |
| • | ability to provide insights and practical wisdom based on experience and expertise; |
| • | ability to read and understand financial statements; and |
| • | ability to devote the time necessary to carry out the duties of a director, including attendance at meetings and consultation on company matters. |
Although we do not have a policy in regard to the consideration of diversity in identifying director nominees, qualified candidates for nomination to the board are considered without regard to race, color, religion, gender, ancestry or national origin.
122
Table of Contents
Director Independence
Our Board has determined that, under NASDAQ listing standards and taking into account any applicable committee standards and rules under the Exchange Act, is an independent director. Within 90 days of our listing on the NASDAQ, we will appoint at least one additional independent director. Within one year of the date of effectiveness of the registration statement of which this prospectus is a part, we will appoint a third independent director.
Audit Committee
Prior to the listing of our common stock on the NASDAQ, we intend to have an Audit Committee and may have such other committees as the Board shall determine from time to time. The Audit Committee will have the composition and responsibilities described below.
will serve as the initial member of our Audit Committee. Within 90 days of our listing on the NASDAQ we will appoint another independent director to our Audit Committee. Our Board has determined that is an Audit Committee financial expert as defined by the SEC. Each member of the Audit Committee meets or will meet criteria for independence of Audit Committee members set forth in Rule 10A-3(b)(1) under the Exchange Act.
The principal duties of the Audit Committee are to assist the Board in fulfilling its responsibility to oversee management regarding:
| • | systems of internal control over financial reporting and disclosure controls and procedures; |
| • | the integrity of the financial statements; |
| • | the qualifications, engagement, compensation, independence and performance of the independent auditors and our internal audit function; |
| • | compliance with legal and regulatory requirements; |
| • | review of material related party transactions; and |
| • | compliance with and adequacy of the code of business and ethics, review and, if appropriate, approve any requests for written waivers sought with respect to any executive officer or director under, the code of business and ethics. |
Code of Conduct
In connection with the closing of this offering, our Board will adopt a code of business conduct and ethics (the “Code of Conduct”) that will apply to all directors, officers and employees, including our principal executive officer, principal financial officer and principal accounting officer. Upon the closing of this offering, the Code of Conduct will be available in the Corporate Governance section of our website at www.memorialrd.com. The contents of our website are not incorporated by reference herein or otherwise a part of this prospectus. The purpose of the Code of Conduct is to promote honest and ethical conduct, including the ethical handling of actual or apparent conflicts of interest between personal and professional relationships; to promote full, fair, accurate, timely and understandable disclosure in periodic reports required to be filed by us; and to promote compliance with all applicable rules and regulations that apply to us and our officers.
Executive Compensation
We were formed in January 2014 and have not incurred any cost or liability with respect to compensation, management incentive or retirement benefits for our executive officers for the fiscal year ended December 31, 2013 or for any prior periods. Accordingly, we are not presenting any compensation for historical periods.
123
Table of Contents
Director Compensation
Our officers or employees who also serve as our directors will not receive additional compensation for their service as a director. Our directors who are not our officers or employees will receive compensation as “non-employee directors.” We expect that each non-employee director will receive an annual retainer and an additional retainer for service as the chair of the audit committee. We also expect to grant equity-based awards to non-employee directors upon appointment to the board or as of the completion of this offering and on an annual basis. Non-employee directors will be reimbursed for all out-of-pocket expenses incurred in connection with attending board or committee meetings. Each director will be indemnified for his actions associated with being a director to the fullest extent permitted under Delaware law.
Compensation Discussion and Analysis
We expect that the future compensation of our executive and non-executive officers will include a significant component of incentive compensation based on our performance. We expect to employ a compensation philosophy that will emphasize pay-for-performance, which will be based on a combination of our performance and the individual’s impact on our performance and will place the majority of each officer’s compensation at risk. The performance metrics governing incentive compensation will not be tied in any way to the performance of entities other than us. We believe this pay-for-performance approach generally aligns the interests of our executive officers with that of our stockholders, and at the same time enables us to maintain a lower level of base overhead in the event our operating and financial performance fails to meet expectations. We will design our executive compensation to attract and retain individuals with the background and skills necessary to successfully execute our business model in a demanding environment, to motivate those individuals to reach near-term and long-term goals in a way that aligns their interest with that of our stockholders, and to reward success in reaching such goals.
We expect that we will use three primary elements of compensation to fulfill that design—salary, cash bonus and long-term equity incentive awards. Cash bonuses and equity incentives (as opposed to salary) represent the performance driven elements. They are also flexible in application and can be tailored to meet our objectives. The determination of specific individuals’ cash bonuses reflects their relative contribution to achieving or exceeding annual goals, and the determination of specific individuals’ long-term incentive awards is based on their expected contribution in respect of longer term performance objectives.
We do not intend to establish a defined benefit or pension plan for our executive officers because we believe such plans primarily reward longevity rather than performance. We will provide a basic benefits package generally to all employees, which includes a 401(k) plan and health, disability and life insurance.
Change of Control Agreements
We will enter into change of control agreements with our executive officers in connection with the closing of this offering. The change of control agreements will continue in effect until the earlier of (i) a separation from service other than on account of a “qualifying termination” (as defined below), (ii) the Company’s satisfaction of all of our obligations under the change of control agreement, or (iii) the execution of a written agreement between the Company and the executive officer terminating the change of control agreement.
Under the terms of each change of control agreement, if an executive’s employment is terminated on account of a qualifying termination, then subject to such executive’s signing and not revoking a separation agreement and release of claims, then such executive will be entitled to:
| • | receive a lump sum payment of % of such executive’s (a) annual base salary and (b) target bonus, in each case, at the highest rate in effect during the twelve month period prior to the date in which the qualifying termination occurs; |
| • | the vesting of all outstanding unvested awards previously granted to such executive under the Memorial Resource Development Corp. 2014 Incentive Award Plan; |
124
Table of Contents
| • | reimbursement for the amount of COBRA continuation premiums (less required co-pay) until the earlier of (a) twelve months following the qualifying termination and (b) such time as such executive is no longer eligible for COBRA continuation coverage; |
| • | financial counseling services for twelve months following the qualifying termination, subject to a maximum benefit of $30,000; and |
| • | outplacement counseling services for twelve months following the qualifying termination, subject to a maximum value of $30,000. |
For purposes of the above, “qualifying termination” means, as to any executive, the separation of service on account of (i) an involuntary termination by the Company without cause or (ii) such executive’s voluntary resignation for good reason, in each case, within six months prior to, or twenty-four months following, a change of control. The term “cause” means (a) such executive’s commission of, conviction for, plea of guilty or nolo contendere to a felony or a crime involving moral turpitude; (b) engaging in conduct that constitutes fraud, gross negligence or willful misconduct that results or would reasonably be expected to result in material harm to the Company or our business or reputation; (c) breach of any material terms of such executive’s employment, including any of our policies or code of conduct; or (d) failure to perform such executive’s duties for the Company. The term “good reason” means the occurrence of one of the following without an executive’s express written consent (i) a material reduction of such executive’s duties, position or responsibilities, or such executive’s removal from such position and responsibilities, unless such executive is offered a comparable position (i.e., a position of equal or greater organizational level, duties, authority, compensation, title and status); (ii) a material reduction by the Company of such executive’s base compensation (base salary and target bonus) as in effect immediately prior to such reduction; or (iii) such executive is requested to relocate (except for office relocations that would not increase such executive’s one way commute by more than 50 miles). The term “change of control” has the meaning ascribed to such term in the Memorial Resource Development Corp. 2014 Incentive Award Plan and is described in the discussion below under “—2014 Incentive Award Plan—Certain Transactions.”
In the event that the board determines that payments to be made to an executive under the change of control agreement would constitute excess parachute payments subject to excise tax under Section 4999 of the Internal Revenue Code, then the amount of such payments shall either (i) be reduced so that such payments will not be subject to such excise tax or (ii) paid in full, whichever results in the better net after tax position for the executive.
2014 Incentive Award Plan
Following the closing of this offering, we anticipate granting equity and equity-based compensation awards to our executive officers and other key employees on a periodic basis to align compensation with our performance. These awards will be granted under the Memorial Resource Development Corp. 2014 Incentive Award Plan, which we refer to as the Plan, that we intend to adopt prior to the closing of this offering and which will be effective no later than the day prior to the completion of this offering. The material terms of the Plan are described in more detail below.
Purpose; Eligibility and Administration
The principal purpose of the Plan will be to attract, retain and engage selected employees, consultants and directors through the granting of equity and equity-based compensation awards.
Our and our subsidiaries’ employees, consultants and directors, including our executive officers, will be eligible to receive awards under the Plan. Our Board will administer the Plan and may delegate its duties and responsibilities as plan administrator to subcommittees comprised of our directors and/or officers, subject to certain limitations. Our Board will administer the Plan with respect to awards to non-employee directors.
125
Table of Contents
Subject to the express terms and conditions of the Plan, the plan administrator will have the authority to make all determinations and interpretations under the plan, prescribe all forms for use with the plan and adopt, amend and/or rescind rules for the administration of the plan. The plan administrator will also set the terms and conditions of all awards under the plan, including any vesting and vesting acceleration conditions.
Limitation on Awards and Shares Available
Initially, the aggregate number of our shares of common stock available for issuance pursuant to awards granted under the Plan will be the sum of shares, subject to adjustment as described below plus an annual increase on the first day of each calendar year beginning January 1, 2015 and ending on and including the last January 1 prior to the expiration date of the Plan, equal to the least of (i) shares, (ii) 10% of the shares outstanding (on an as-converted basis) on the final day of the immediately preceding calendar year and (iii) such smaller number of shares as determined by the Board. Please read “—Certain Transactions.” This number will also be adjusted due to the following shares becoming eligible to be used again for grants under the Plan:
| • | shares subject to awards or portions of awards granted under the Plan which are forfeited, expire or lapse for any reason, or are settled for cash without the delivery of shares, to the extent of such forfeiture, expiration, lapse or cash settlement; and |
| • | shares that we repurchase prior to vesting so that such shares are returned to us. |
Shares granted under the Plan may be treasury shares, authorized but unissued shares, or shares purchased in the open market. The payment of cash dividends in conjunction with any outstanding awards will not be counted against the shares available for issuance under the Plan. In addition, if we or one of our subsidiaries acquires or combines with another company that has shares available for grant pursuant to a qualifying equity plan, we may use those shares (until such date as they could not have been used under such entity’s plan) to grant awards pursuant to the Plan to individuals who were not providing services to us immediately prior to the acquisition or combination.
The Plan will not provide for individual limits on awards that may be granted to any individual participant under the Plan. Rather, the amount of awards to be granted to individual participants will be determined by our Board or such committee which our Board appoints from time to time, as part of their compensation decision-making processes.
Awards
The Plan provides for the grant of stock options (including non-qualified stock options, or “NQSOs,” and incentive stock options, or “ISOs”), restricted stock, dividend equivalents, stock payments, restricted stock units, or “RSUs,” performance awards, stock appreciation rights, or “SARs,” and other equity-based and cash-based awards, or any combination thereof. Awards under the Plan will be set forth in award agreements, which will detail the terms and conditions of the awards, including any applicable vesting and payment terms and post-termination exercise limitations as well as any other consequences with respect to the awards upon a termination of the applicable eligible individual’s service. Equity-based awards will generally be settled in shares of our common stock, but the plan administrator may provide for cash settlement of any award. A brief description of each award type follows.
| • | Non-qualified Stock Options. NQSOs will provide for the right to purchase shares of our common stock at a specified price which generally, except with respect to certain substitute options granted in connection with corporate transactions, will not be less than fair market value on the date of grant. NQSOs may be granted for any term specified by the plan administrator that does not exceed ten years and will usually become exercisable in one or more installments after the grant date, subject to vesting conditions which may include continued employment or service with us, satisfaction of performance targets and/or other conditions, as determined by the plan administrator. |
126
Table of Contents
| • | Incentive Stock Options. ISOs will be designed in a manner intended to comply with the provisions of Section 422 of the Internal Revenue Code, or the Code, and will be subject to specified restrictions contained in the Code. ISOs will have an exercise price of not less than 100% of the fair market value of the underlying shares on the date of grant (or 110% in the case of ISOs granted to certain significant stockholders), except with respect to certain substitute ISOs granted in connection with a corporate transaction. Only employees will be eligible to receive ISOs, and ISOs will not have a term of more than ten years (or five years in the case of ISOs granted to certain significant stockholders). Vesting conditions may apply to ISOs as determined by the plan administrator and may include continued employment or service with us, satisfaction of performance targets and/or other conditions. |
| • | Restricted Stock. Restricted stock may be granted to any eligible individual and made subject to such restrictions as may be determined by the plan administrator. Unless the plan administrator determines otherwise, restricted stock may be forfeited for no consideration or repurchased by us if the conditions or restrictions on vesting are not met. In general, restricted stock may not be sold or otherwise transferred until restrictions are removed or expire. Recipients of restricted stock, unlike recipients of options, will have voting rights and will have the right to receive dividends, if any, prior to the time when the restrictions lapse, subject to the terms of an applicable award agreement, which may provide for dividends to be placed in escrow and not released until the restrictions are removed or expire. |
| • | Restricted Stock Units. RSUs may be awarded to any eligible individual, typically without payment of consideration but subject to vesting conditions based upon continued employment or service with us, satisfaction of performance criteria and/or other conditions, all as determined by the plan administrator. Like restricted stock, RSUs generally may not be sold or otherwise transferred or hypothecated until the applicable vesting conditions are removed or expire. Unlike restricted stock, shares of stock underlying RSUs will not be issued until the RSUs vest (or later, if payment is deferred), and recipients of RSUs generally will have no voting or dividend rights with respect to such shares prior to the time when the applicable vesting conditions are satisfied. |
| • | Dividend Equivalents. Dividend equivalents represent the per share value of the dividends, if any, paid by us, calculated with reference to the number of shares of our common stock covered by an award. Dividend equivalents may be settled in cash or shares and at such times as determined by the plan administrator. |
| • | Stock Payments. Stock payments may be authorized by the plan administrator in the form of our shares or an option or other right to purchase our shares as part of a deferred compensation or other arrangement in lieu of all or any part of compensation, including bonuses, that would otherwise be payable in cash to an employee, consultant or non-employee director. |
| • | Stock Appreciation Rights. SARs may be granted in connection with stock options, other awards or separately. SARs typically provide for payment to the holder based upon increases in the price of a share over a set exercise price. The exercise price of any SAR granted under the Plan generally, except with respect to certain substitute SARs granted in connection with a corporate transaction, will be at least 100% of the fair market value of the underlying shares on the date of grant. The term of a SAR may not be longer than ten years. There are no restrictions specified in the Plan on the exercise of SARs or the amount of gain realizable therefrom, although restrictions may be imposed by the plan administrator in the SAR award agreement. SARs granted under the Plan may be settled in cash or our shares, or in a combination of both, at the election of the plan administrator. Vesting conditions may apply to SARs as determined by the plan administrator and may include continued employment or service with us, satisfaction of performance goals and/or other conditions. |
| • | Performance Awards. Performance awards may be granted by the plan administrator on an individual or group basis. Generally, these awards will consist of bonuses based upon attainment of specific performance targets and may be paid in cash, our shares or a combination of both. Performance awards may also include “phantom” stock awards that provide for payments based upon the value of our shares. |
127
Table of Contents
Certain Transactions
The plan administrator will have broad discretion to equitably adjust the provisions of the Plan and the terms and conditions of existing and future awards, including with respect to aggregate number and type of shares subject to the Plan and awards granted pursuant to the Plan, to prevent the dilution or enlargement of intended benefits and/or facilitate necessary or desirable changes in the event of certain transactions and events affecting our shares, such as stock dividends, stock splits, mergers, acquisitions, consolidations and other corporate transactions. In the case of certain events or changes in capitalization that constitute “equity restructurings,” equitable adjustments will be non-discretionary. In the event of a change in control where the acquiror does not assume or replace awards granted under the Plan, such awards may be subject to accelerated vesting so that 100% of such awards will become vested and exercisable or payable, as applicable, and will be exercisable for a period of fifteen days following notice of such event from the plan administrator and, if not exercised, will terminate upon the expiration of such fifteen-day period.
The plan administrator may also provide for the acceleration, cash-out, termination, assumption, substitution or conversion of awards in the event of a change in control or certain other unusual or nonrecurring events or transactions. A “change in control” is defined in the Plan to mean (i) the acquisition by a person or group of more than 50% of the total combined voting power of our outstanding securities, (ii) during any consecutive two-year period, the replacement of a majority of our incumbent directors with directors whose election was not supported by at least two-thirds of our incumbent directors, (iii) a merger, consolidation, reorganization or business combination or the sale of substantially all of our assets after which the Funds and their affiliates cease to own at least 50% of the combined voting power in us, in each case, other than a transaction which results in our voting securities before such transaction continuing to represent or being converted into a majority of the voting securities of the surviving entity and after which no person or group owns a majority of the combined voting power of the surviving entity or (iv) our liquidation or dissolution; provided, however, any event or occurrence whereby the Funds or a group consisting of our directors, executive officers or members of our management acquire voting control of us will not constitute a change in control for purposes of the Plan.
Transferability, Repricing and Participant Payments
With limited exceptions for estate planning, domestic relations orders, certain beneficiary designations and the laws of descent and distribution, awards under the Plan are generally non-transferable prior to vesting and are exercisable only by the participant. The price per share of a stock option or SAR may not be decreased and an underwater stock option or SAR may not be replaced or cashed out without stockholder approval. With regard to tax withholding, exercise price and purchase price obligations arising in connection with awards under the Plan, the plan administrator may, in its discretion, accept cash or check, our shares that meet specified conditions, a “market sell order” (or other cashless broker-assisted transaction) or such other consideration as it deems suitable.
Amendment and Termination
Our Board may terminate, amend or modify the Plan at any time and from time to time. However, we must generally obtain stockholder approval to increase the number of shares available under the Plan (other than in connection with certain corporate events, as described above) or to the extent required by applicable law, rule or regulation (including any applicable stock exchange rule).
Expiration Date
The Plan will expire on, and no option or other award may be granted pursuant to the Plan after, the tenth anniversary of the date the Plan was adopted by our Board. Any award that is outstanding on the expiration date of the Plan will remain in force according to the terms of the Plan and the applicable award agreement.
128
Table of Contents
Awards To Be Granted Following This Offering
Following the consummation of this offering, we expect that our Board will approve an award of restricted stock units under the Plan to certain of our key employees, including each of our executive officers. We currently expect that these awards will contain a combination of time and performance-based vesting conditions, with a three-year annual vesting schedule. However, the number of shares subject to the awards and the precise terms and conditions of the restricted stock units have not yet been finally determined or approved.
Relation of Compensation Policies and Practices to Risk Management
We expect our compensation arrangements to contain a number of design elements that serve to minimize the incentive for taking excessive or inappropriate risk to achieve short-term, unsustainable results. In combination with our risk-management practices, we do not believe that risks arising from our compensation policies and practices for our employees are reasonably likely to have a material adverse effect on us.
129
Table of Contents
PRINCIPAL AND SELLING STOCKHOLDERS
The following table provides certain information regarding the beneficial ownership of our outstanding capital stock as of , 2014, and after giving effect to the offering, for:
| • | each person who then will beneficially own more than 5% of the then outstanding capital stock on a fully diluted basis; |
| • | each of our directors and director nominees; |
| • | each of our named executive officers; and |
| • | all of our directors, director nominees and named executive officers as a group. |
The amounts and percentages of common stock beneficially owned are reported on the basis of regulations of the SEC governing the determination of beneficial ownership of securities. Under the rules of the SEC, a person is deemed to be a “beneficial owner” of a security if that person has or shares “voting power,” which includes the power to vote or to direct the voting of such security, or “investment power,” which includes the power to dispose of or to direct the disposition of such security. A person is also deemed to be a beneficial owner of any securities of which that person has a right to acquire beneficial ownership within 60 days. Under these rules, more than one person may be deemed a beneficial owner of the same securities and a person may be deemed a beneficial owner of securities as to which he has no economic interest. Except as indicated by footnote and in the next paragraph, the persons named in the table below have sole voting and investment power with respect to all shares of common stock shown as beneficially owned by them. Unless otherwise noted, the mailing address of each person or entity named in the table is 1301 McKinney Street, Suite 2100, Houston, Texas 77010.
Upon the closing of this offering, the group consisting of MRD LLC and Messrs. Bahr and Graham will continue to control a majority of our voting common stock. As a result, we will be a “controlled company” within the meaning of the NASDAQ listing rules. However, the number of shares reflected in the table below as beneficially owned by each of the members of that group does not include shares held by the other members of that group that are subject to the terms of the voting agreement pursuant to which, among other things, such group members have agreed to act together to vote for the election of certain directors to the Board.
MRD LLC has granted the underwriters the option to purchase up to an additional shares of common stock and will sell such shares only to the extent such option is exercised. MRD LLC is deemed under federal securities laws to be an underwriter with respect to the common stock it may sell in connection with this offering. The number of shares being offered by MRD LLC in the table below assumes no exercise of the underwriters’ option to purchase additional shares of common stock from MRD LLC.
| Shares beneficially owned prior to offering |
Shares being offered |
Shares beneficially owned after offering |
||||||||||||||
| Name of beneficial owner |
Number | Percentage | Number | Percentage | ||||||||||||
| Memorial Resource Development LLC (“MRD LLC”)(1) |
% | % | ||||||||||||||
| Kenneth A. Hersh(2) |
% | — | % | |||||||||||||
| Anthony Bahr(3) |
% | — | % | |||||||||||||
| Jay Graham(3) |
% | — | % | |||||||||||||
| Tony R. Weber |
% | — | % | |||||||||||||
| John A. Weinzierl |
% | — | % | |||||||||||||
| Scott A. Gieselman |
% | — | % | |||||||||||||
| William J. Scarff |
% | — | % | |||||||||||||
| Kyle N. Roane |
% | — | % | |||||||||||||
| Dennis G. Venghaus |
% | — | % | |||||||||||||
| % | — | % | ||||||||||||||
| All named executive officers, directors and director nominees as a group (7 persons) |
% | — | % | |||||||||||||
130
Table of Contents
| (1) | The board of managers of MRD LLC has voting and dispositive power over these shares. The board of managers of MRD LLC consists of John A. Weinzierl, Kenneth A. Hersh, Scott A. Gieselman and Tony R. Weber, none of whom individually have voting and dispositive power over these shares. Each such person expressly disclaims beneficial ownership over these shares, except to the extent of any pecuniary interest therein. MRD LLC is owned by Natural Gas Partners VIII, L.P. (“NGP VIII”), Natural Gas Partners IX, L.P. (“NGP IX”) and NGP IX Offshore Holdings, L.P. (“NGP IX Offshore”). NGP VIII, NGP IX and NGP IX Offshore may be deemed to share voting and dispositive power over the reported securities; thus, each may also be deemed to be the beneficial owner of these securities. Each of NGP VIII, NGP IX and NGP IX Offshore disclaims beneficial ownership of the reported securities in excess of such entity’s respective pecuniary interest in the securities. G.F.W. Energy VIII, L.P., GFW VIII, L.L.C., G.F.W. Energy IX, L.P. and GFW IX, L.L.C. may be deemed to beneficially own the shares held by Memorial Resource Development LLC that are attributable to NGP VIII, NGP IX and NGP IX Offshore by virtue of GFW VIII, L.L.C. being the sole general partner of G.F.W. Energy VIII, L.P. (which is the general partner of NGP VIII) and GFW IX, L.L.C. being the sole general partner of G.F.W. Energy IX, L.P. (which is the general partner of NGP IX and NGP IX Offshore). Kenneth A. Hersh, one of our directors and who is an Authorized Member of each of GFW VIII, L.L.C. and GFW IX, L.L.C., may also be deemed to share the power to vote, or to direct the vote, and to dispose, or to direct the disposition, of those shares. Mr. Hersh does not own directly any shares. |
| (2) | G.F.W. Energy VIII, L.P., GFW VIII, L.L.C., G.F.W. Energy IX, L.P. and GFW IX, L.L.C. may be deemed to beneficially own the shares held by Memorial Resource Development LLC that are attributable to NGP VIII, NGP IX and NGP IX Offshore by virtue of GFW VIII, L.L.C. being the sole general partner of G.F.W. Energy VIII, L.P. (which is the general partner of NGP VIII) and GFW IX, L.L.C. being the sole general partner of G.F.W. Energy IX, L.P. (which is the general partner of NGP IX and NGP IX Offshore). Kenneth A. Hersh, one of our directors and who is an Authorized Member of each of GFW VIII, L.L.C. and GFW IX, L.L.C., may also be deemed to share the power to vote, or to direct the vote, and to dispose, or to direct the disposition, of those shares. Mr. Hersh does not own directly any shares. |
| (3) | The address for these beneficial owners is 9805 Katy Freeway, Suite 400, Houston, TX 77024. |
131
Table of Contents
CERTAIN RELATIONSHIPS AND RELATED PARTY TRANSACTIONS
Corporate Restructuring
In connection with our corporate restructuring, we will engage in transactions with certain affiliates and our existing equity holders. See “Restructuring Transactions” for a description of these transactions.
Historical Transactions with Affiliates
MRD LLC was formed in April 2011 and capitalized in connection with the December 2011 initial public offering of MEMP. The limited liability company agreement of MRD LLC provides for a number of different classes of units, all of which are currently owned by the Funds. In June 2012, MRD LLC issued profits interests to certain of its officers and employees. These profits interests only participate in distributions upon liquidation events meeting certain requisite financial return thresholds.
Voting Agreement
In connection with the completion of this offering, MRD LLC will enter into a voting agreement with certain former management members of WildHorse Resources that are contributing their ownership of WildHorse Resources to us in the restructuring transactions. Among other things, that voting agreement will provide that those former management members of WildHorse Resources will vote all of their shares of our common stock in a manner consistent with the votes cast by MRD LLC.
Registration Rights Agreement
In connection with the closing of this offering, we expect to enter into a registration rights agreement with MRD LLC and former management members of WildHorse Resources. The registration rights agreement is expected to provide for customary rights for MRD LLC and certain former management members of WildHorse Resources to demand that we file a resale shelf registration statement or, in certain circumstances, conduct an underwritten offering of shares held by MRD LLC and certain former management members of WildHorse Resources. In addition, we expect that the agreement will grant MRD LLC and certain former management members of WildHorse Resources customary rights to participate in certain underwritten offerings of our common stock that we may conduct.
Omnibus Agreement
On December 14, 2011, in connection with the closing of MEMP’s initial public offering, MRD LLC entered into an omnibus agreement with MEMP and its general partner. In connection with the closing of this offering, we will assume all of MRD LLC’s duties and obligations under the omnibus agreement.
Pursuant to the omnibus agreement, MEMP is required to reimburse us for all expenses incurred by us (or payments made on the MEMP’s behalf) in conjunction with our provision of general and administrative services to MEMP, including, but not limited to, public company expenses and an allocated portion of the salary and benefits of the executive officers of MEMP’s general partner and our other employees who perform services for MEMP or on MEMP’s behalf. MEMP is also obligated to reimburse us for insurance coverage expenses we incur with respect to MEMP’s business and operations and with respect to director and officer liability coverage for the officers and directors of MEMP’s general partner.
Pursuant to the omnibus agreement, we will indemnify MEMP’s general partner and MEMP against (i) title defects and (ii) income taxes attributable to pre-closing ownership or operation of the assets we contributed to MEMP in connection with MEMP’s initial public offering, including any income tax liabilities related to such contribution occurring on or prior to the closing of MEMP’s initial public offering.
132
Table of Contents
Our indemnification obligation will survive until December 2014 with respect to title defects and (ii) for sixty days after the expiration of the applicable statute of limitations with respect to income taxes. All title claims are subject to a $25,000 per claim de minimus exception and an aggregate $2,000,000 deductible.
Pursuant to the omnibus agreement, MEMP must indemnify us for any liabilities incurred by us attributable to the operating and administrative services provided to MEMP under the omnibus agreement, other than liabilities resulting from our bad faith, fraud, gross negligence or willful misconduct. In addition, we must indemnify MEMP for any liability MEMP incurs as a result of our bad faith or willful misconduct in providing operating and administrative services under the omnibus agreement. We may terminate the omnibus agreement in the event that we cease to be an affiliate of MEMP and may also terminate the omnibus agreement in the event of MEMP’s material breach of the agreement, including failure to pay amounts due thereunder in accordance with its terms.
Under the omnibus agreement, none of the parties thereto nor any of their respective affiliates have any obligation to offer, or provide any opportunity to pursue, purchase or invest in, any business opportunity to any other party or their affiliates. Furthermore, the omnibus agreement does not restrict any of the parties thereto and their respective affiliates from competing with either us, MEMP or the MEMP’s general partner.
Tax Sharing Agreement
On December 14, 2011, in connection with the closing of MEMP’s initial public offering, MRD LLC entered into a tax sharing agreement with MEMP. In connection with this offering, we will assume all of MRD LLC’s duties and obligations under the tax sharing agreement pursuant to which MEMP is required to reimburse us for the MEMP’s share of state and local income and other taxes borne by us as a result of MEMP’s results being included in a combined or consolidated tax return filed by us or our affiliates with respect to periods after the closing of MEMP’s initial public offering. Under the tax sharing agreement, we may use our tax attributes to cause our combined or consolidated group, of which MEMP may be a member for this purpose, to owe no tax. However, MEMP would nevertheless be required to reimburse us for the tax MEMP would have owed had the attributes not been available or used for MEMP’s benefit, even though we had no cash expense for that period.
Beta Management Agreement
On December 12, 2012, MRD LLC entered into a management agreement with its wholly-owned subsidiary, Beta Operating Company, LLC pursuant to which MRD LLC agreed to provide management and administrative oversight with respect to the services provided by such subsidiary under certain operating agreements with a subsidiary of MEMP, in exchange for an annual management fee. In connection with the closing of this offering, we will assume this management agreement and we will receive approximately $0.4 million from MEMP annually under that agreement.
Services Agreement
Upon the closing of this offering, we will enter into a services agreement with WildHorse Resources Management Company, LLC, or WHR Management Company, that will address the following matters:
| • | our obligation to reimburse WHR Management Company for all expenses incurred by WHR Management Company (or payments made on our behalf) in conjunction with its provision of operating and administrative services to us relating to the Terryville Complex; and |
| • | our obligation to indemnify WHR Management Company for certain liabilities. |
The services agreement will provide that we must indemnify WHR Management Company for any liabilities incurred by WHR Management Company attributable to the operating and administrative services provided to us under the agreement, other than liabilities resulting from WHR Management Company’s bad faith
133
Table of Contents
or willful misconduct. In addition, WHR Management Company must indemnify us for any liability we incur as a result of WHR Management Company’s bad faith or willful misconduct in providing operating and administrative services under the services agreement. WHR Management Company may terminate the services agreement in the event that it ceases to be our affiliate and may also terminate the services agreement if we fail to pay amounts due under that agreement in accordance with its terms. We may terminate the services agreement if WHR Management Company fails to satisfactorily perform its obligations under that agreement. The services agreement may only be assigned by either party with the other party’s consent. Upon the closing of this offering, WHR Management Company will be a subsidiary of WildHorse Resources II, LLC, an affiliate of MRD LLC and the Company. NGP and certain former management members of WildHorse Resources own WildHorse Resources II, LLC.
Gas Processing Agreement
On March 17, 2014, WildHorse Resources, which will become our wholly-owned subsidiary in connection with the restructuring transactions to be entered into in connection with the completion of this offering, entered into a gas processing agreement with PennTex North Louisiana, LLC (“PennTex”). PennTex is a joint venture among certain affiliates of NGP in which MRD Midstream LLC owns a minority interest. Once PennTex’s processing plant becomes operational, it will process natural gas produced from wells located on certain leases owned by WildHorse Resources in the state of Louisiana. The agreement has a 15-year primary term, subject to one year extensions at either party’s election. WildHorse Resources will pay PennTex a monthly fee, subject to an annual inflationary escalation, based on volumes of natural gas delivered and processed. Once the plant is declared operational, WildHorse Resources will be obligated to pay a minimum processing fee equal to approximately $18.3 million on an annual basis, subject to certain adjustments and conditions. The gas processing agreement requires that the processing plant be operational no later than November 1, 2015.
Repurchase of Net Profits Interests
On February 28, 2014, WildHorse Resources, which will become our wholly-owned subsidiary in connection with the restructuring transactions to be entered into in connection with the completion of this offering, repurchased net profits interests from an affiliate of NGP for $63.4 million after customary adjustments. These net profits interests were originally sold to the NGP affiliate upon the completion of certain acquisitions in 2010 by WildHorse Resources.
Dispositions of Oil and Natural Gas Producing Properties to the Partnership
We have divested long-lived producing oil and natural gas properties to the Partnership through the following drop down transactions:
| • | In April 2012, we sold 22 Bcfe of proved reserves located in East Texas to the Partnership for cash consideration of approximately $18.5 million; |
| • | In May 2012, we sold an additional 28 Bcfe of proved reserves in East Texas to the Partnership for a final purchase price of approximately $27.0 million; |
| • | In March 2013, we sold 162 Bcfe of proved reserves located in East Texas to the Partnership for cash consideration of approximately $200.0 million; |
| • | In October 2013, we sold 99 Bcfe of proved reserves located in East Texas and the Rocky Mountains to the Partnership for cash consideration of approximately $96.3 million; and |
| • | In April 2014, we sold approximately 15 Bcfe of proved reserves located in East Texas to the Partnership for cash consideration of approximately $34.0 million, subject to customary post-closing adjustments. |
134
Table of Contents
Procedures for Approval of Related Party Transactions
Prior to the closing of this offering, we have not maintained a policy for approval of related party transactions. A “related party transaction” is a transaction, arrangement or relationship in which we or any of our subsidiaries was, is or will be a participant, the amount of which involved exceeds $120,000, and in which any related person had, has or will have a direct or indirect material interest. A “related person” means:
| • | any person who is, or at any time during the applicable period was, one of our executive officers or one of our directors; |
| • | any person who is known by us to be the beneficial owner of more than 5% of our common stock; |
| • | any immediate family member of any of the foregoing persons, which means any child, stepchild, parent, stepparent, spouse, sibling, mother-in-law, father-in-law, son-in-law, daughter-in-law, brother-in-law or sister-in-law of a director, executive officer or a beneficial owner of more than 5% of our common stock, and any person (other than a tenant or employee) sharing the household of such director, executive officer or beneficial owner of more than 5% of our common stock; and |
| • | any firm, corporation or other entity in which any of the foregoing persons is a partner or principal or in a similar position or in which such person has a 10% or greater beneficial ownership interest. |
We anticipate that our Board will adopt a written related party transactions policy prior to the completion of this offering. Pursuant to this policy, we expect that our Audit Committee will review all material facts of all related party transactions.
135
Table of Contents
We are a Delaware corporation recently formed by MRD LLC. As part of the corporate restructuring that will occur immediately prior to the closing of this offering, MRD LLC and former WildHorse Resources management will contribute equity interests in certain entities to us in exchange for shares of our common stock. See “Description of Capital Stock” for additional information regarding the terms of our amended and restated certificate of incorporation and amended and restated bylaws as will be in effect upon the closing of this offering.
The restructuring will consist of the following steps:
| • | MRD LLC will contribute to us substantially all of its assets, comprised of: |
| • | 100% of the ownership interests in Classic Hydrocarbons Holdings, L.P., Classic Hydrocarbons GP Co., L.L.C., Black Diamond Minerals, LLC, Beta Operating Company, LLC and MRD Operating LLC; |
| • | 99.9% of the membership interests in WildHorse Resources, the owner of our properties in the Terryville Complex; and |
| • | MEMP GP (including MEMP GP’s ownership of 50% of MEMP’s incentive distribution rights) and 5,360,912 subordinated units representing an 8.7% limited partner interest in MEMP; |
| • | We will issue shares of our common stock to MRD LLC; |
| • | Certain former management members of WildHorse Resources will contribute to us their outstanding incentive units in WildHorse Resources, as well as the remaining 0.1% of the membership interests in WildHorse Resources, and we will issue shares of our common stock and pay cash consideration of $ to such former management members of WildHorse Resources; and |
| • | We will enter into a registration rights agreement and a voting agreement with MRD LLC and certain former management members of WildHorse Resources, and a services agreement with an entity managed by certain former management members of WildHorse Resources. |
In connection with the restructuring transactions, MRD LLC will retain:
| • | BlueStone, which sold substantially all of its assets in July 2013 for $117.9 million, MRD Royalty, which owns certain immaterial leasehold interests and overriding royalty interests in Texas and Montana, and MRD Midstream, which owns an indirect interest in certain immaterial midstream assets in North Louisiana; and |
| • | The $32 million in cash (net of $18 million to be used to pay accrued interest on the PIK notes on June 15, 2014) to be released from its debt service reserve account in connection with the redemption of the PIK notes (which we expect will be 30 days after the closing of this offering). |
We refer to the transactions above collectively as our “restructuring transactions.” Contemporaneous with the restructuring transactions, we will assume the PIK notes and use a portion of the net proceeds from this offering to redeem all outstanding PIK notes, including paying any applicable premium and accrued and unpaid interest, if any, to the date of redemption (which we expect will be 30 days after the closing of this offering). We will use any remaining proceeds, together with proceeds under our new revolving credit facility, to repay and terminate WildHorse Resources’ credit agreements. See “Use of Proceeds.” For more information regarding BlueStone, see “Management’s Discussion and Analysis of Financial Condition and Results of Operations—Results of Operations—MRD Segment.”
Limited Liability Company Agreement of MRD LLC
In connection with the completion of this offering, the members of MRD LLC, including the Funds and certain members of our management team, will enter into a third amended and restated limited liability company agreement of MRD LLC, or the LLC Agreement. Among other things, the LLC Agreement will provide the mechanism by which MRD LLC will vote the shares of our common stock that it holds and the circumstances in which distributions will be made to the members of MRD LLC.
136
Table of Contents
The LLC Agreement will provide that the board of directors of MRD LLC shall consist of:
| • | our Chief Executive Officer; and |
| • | three directors appointed by the Funds. |
In addition, the LLC Agreement will provide that MRD LLC and its members will agree to vote the shares of our common stock held by MRD LLC in favor of the election of these four directors to our Board.
Under the LLC Agreement, the board of directors of MRD LLC has the authority to vote the shares of our common stock held in its discretion with respect to matters deemed ordinary course, including the election of our directors, the ratification of our auditor, the approval of incentive compensation plans and proposals submitted by other stockholders. On all other matters, the board of directors of MRD LLC will vote the shares of common stock in equal proportion to the vote cast by members holding voting units relative to all outstanding voting units. See “Principal and Selling Stockholders” for a description of the ownership of the voting interests of MRD LLC and the Funds.
The LLC Agreement will provide that MRD LLC will make distributions to its members in certain circumstances, including in connection with a change of control of us and any secondary sales of our common stock by MRD LLC. In addition, on a date to be determined in accordance with the LLC Agreement, MRD LLC may distribute all remaining shares of our common stock to its members based on a valuation at such time. The number of shares that members of our management team receive will increase to the extent that the return on investment ultimately realized by the other members of MRD LLC increases.
137
Table of Contents
The following diagram shows our ownership structure before giving effect to the restructuring transactions and this offering.
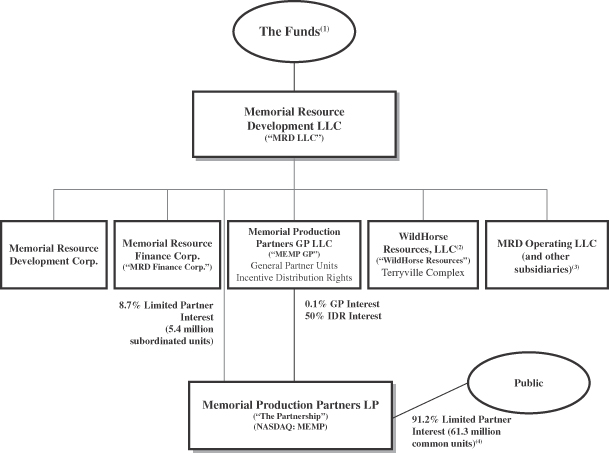
| (1) | “The Funds” refer collectively to Natural Gas Partners VIII, L.P., Natural Gas Partners IX, L.P. and NGP IX Offshore Holdings, L.P., which collectively own all of the membership interests in MRD LLC. Please read “Principal and Selling Stockholders” for information regarding beneficial ownership. The Funds collectively indirectly own 50% of the Partnership’s incentive distribution rights. |
| (2) | MRD LLC owns 99.9% of the membership interests in WildHorse Resources; former management members of WildHorse Resources own the remaining 0.1%. |
| (3) | Includes Classic Hydrocarbons Holdings, L.P. (“Classic”), Classic Hydrocarbons GP Co., L.L.C. (“Classic GP”), Black Diamond Minerals, LLC (“Black Diamond”), Beta Operating Company, LLC (“Beta Operating”), BlueStone Natural Resources Holdings, LLC (“BlueStone”), MRD Royalty LLC (“MRD Royalty”) and MRD Midstream LLC (“MRD Midstream”). |
| (4) | As of December 31, 2013. |
138
Table of Contents
The following diagram shows our ownership structure after giving effect to the restructuring transactions and this offering, assuming no exercise of the underwriters’ option to purchase additional shares from MRD LLC and does not give effect to shares of common stock reserved for future issuance under the Memorial Resource Development Corp. 2014 Incentive Award Plan (described in “Management—2014 Incentive Award Plan”).
| (1) | If the underwriters exercise in full their option to purchase additional shares of common stock from MRD LLC, the ownership interest of the public stockholders will increase to shares of common stock, representing an aggregate % ownership interest in us, and MRD LLC will own shares of common stock, representing an aggregate % ownership interest in us. |
| (2) | As of December 31, 2013. |
| (3) | “The Funds” refer collectively to Natural Gas Partners VIII, L.P., Natural Gas Partners IX, L.P. and NGP IX Offshore Holdings, L.P., which collectively own all of the membership interests in MRD LLC. Please read “Principal and Selling Stockholders” for information regarding beneficial ownership. The Funds collectively indirectly own 50% of the Partnership’s incentive distribution rights. |
| (4) | Subsidiaries of MRD LLC following the restructuring transactions will include BlueStone Natural Resources Holdings, LLC (“BlueStone”), MRD Royalty LLC (“MRD Royalty”) and MRD Midstream LLC (“MRD Midstream”). Also, please see the “Principal and Selling Stockholders” table on page 130 for the beneficial ownership of our shares by our executive officers and directors. |
| (5) | Includes Classic Hydrocarbons Holdings, L.P. (“Classic”), Classic Hydrocarbons GP Co., L.L.C. (“Classic GP”), Black Diamond Minerals, LLC (“Black Diamond”), and Beta Operating Company, LLC (“Beta Operating”). |
139
Table of Contents
Upon completion of this offering, our authorized capital stock will consist of shares of common stock, $ par value per share, of which shares will be issued and outstanding, and shares of preferred stock, $ par value per share, of which no shares will be issued and outstanding.
The following summary of our capital stock, our amended and restated certificate of incorporation and our amended and restated bylaws do not purport to be complete and are qualified in their entirety by reference to the provisions of applicable law and to our amended and restated certificate of incorporation and amended and restated bylaws, forms of which are filed as exhibits to the registration statement of which this prospectus is a part and which will become effective at or around the effective time of such registration statement.
Common Stock
Except as provided by law or in a preferred stock designation, holders of common stock are entitled to one vote for each share held of record on all matters submitted to a vote of the stockholders, will have the exclusive right to vote for the election of directors and do not have cumulative voting rights. Except as otherwise required by law, holders of common stock are not entitled to vote on any amendment to the amended and restated certificate of incorporation (including any certificate of designations relating to any series of preferred stock) that relates solely to the terms of any outstanding series of preferred stock if the holders of such affected series are entitled, either separately or together with the holders of one or more other such series, to vote thereon pursuant to the amended and restated certificate of incorporation (including any certificate of designations relating to any series of preferred stock) or pursuant to the DGCL. Subject to prior rights and preferences that may be applicable to any outstanding shares or series of preferred stock, holders of common stock are entitled to receive ratably in proportion to the shares of common stock held by them such dividends (payable in cash, stock or otherwise), if any, as may be declared from time to time by our Board out of funds legally available for dividend payments. All outstanding shares of common stock are fully paid and non-assessable, and the shares of common stock to be issued upon completion of this offering will be fully paid and non-assessable. The holders of common stock have no preferences or rights of conversion, exchange, pre-emption or other subscription rights. There are no redemption or sinking fund provisions applicable to the common stock. In the event of any voluntary or involuntary liquidation, dissolution or winding-up of our affairs, holders of common stock will be entitled to share ratably in our assets in proportion to the shares of common stock held by them that are remaining after payment or provision for payment of all of our debts and obligations and after distribution in full of preferential amounts to be distributed to holders of outstanding shares of preferred stock, if any.
Preferred Stock
Our amended and restated certificate of incorporation authorizes our Board, subject to any limitations prescribed by law, without further stockholder approval, to establish and to issue from time to time one or more classes or series of preferred stock, par value $ per share, covering up to an aggregate of shares of preferred stock. Each class or series of preferred stock will cover the number of shares and will have the powers, preferences, rights, qualifications, limitations and restrictions determined by the Board, which may include, among others, dividend rights, liquidation preferences, voting rights, conversion rights, preemptive rights and redemption rights. Except as provided by law or in a preferred stock designation, the holders of preferred stock will not be entitled to vote at or receive notice of any meeting of stockholders.
Anti-Takeover Effects of Provisions of Our Amended and Restated Certificate of Incorporation, Our Amended and Restated Bylaws and Delaware Law
Some provisions of Delaware law and our amended and restated certificate of incorporation and our amended and restated bylaws contain provisions that could make the following transactions more difficult: acquisitions of us by means of a tender offer, a proxy contest or otherwise; or removal of our incumbent officers
140
Table of Contents
and directors. These provisions may also have the effect of preventing changes in our management. It is possible that these provisions could make it more difficult to accomplish or could deter transactions that stockholders may otherwise consider to be in their best interest or in our best interests, including transactions that might result in a premium over the market price for our shares.
These provisions are expected to discourage coercive takeover practices and inadequate takeover bids. These provisions are also designed to encourage persons seeking to acquire control of us to first negotiate with us. We believe that the benefits of increased protection and our potential ability to negotiate with the proponent of an unfriendly or unsolicited proposal to acquire or restructure us outweigh the disadvantages of discouraging these proposals because, among other things, negotiation of these proposals could result in an improvement of their terms.
Delaware Law
Upon completion of this offering, we will be subject to the provisions of Section 203 of the DGCL, which regulates corporate takeovers. In general, those provisions prohibit a Delaware corporation, including those whose securities are listed for trading on the NASDAQ, from engaging in any business combination with any interested stockholder for a period of three years following the date that the stockholder became an interested stockholder, unless:
| • | the business combination or transaction in which the person became interested is approved by the Board before the date the interested stockholder attained that status; |
| • | upon consummation of the transaction that resulted in the stockholder becoming an interested stockholder, the interested stockholder owned at least 85% of the voting stock of the corporation outstanding at the time the transaction commenced other than, for purposes of determining the voting stock outstanding (but not the outstanding stock owned by the interested stockholder), shares owned by persons who are directors and also officers of us and by certain employee stock plans; or |
| • | on or after such time the business combination is approved by the Board and authorized at a meeting of stockholders by at least two-thirds of the outstanding voting stock that is not owned by the interested stockholder. |
Section 203 defines “business combination” to include the following:
| • | certain mergers or consolidations involving the corporation and the interested stockholder; |
| • | any sale, transfer, pledge or other disposition of 10% or more of the assets of the corporation to or with the interested stockholder; |
| • | subject to certain exceptions, any transaction that results in the issuance or transfer by the corporation of any stock of the corporation to the interested stockholder; |
| • | subject to certain exceptions, any transaction involving the corporation that has the effect of increasing the proportionate share of the stock of any class or series of the corporation beneficially owned by the interested stockholder; or |
| • | the receipt by the interested stockholder of the benefit of loans, advances, guarantees, pledges or other financial benefits provided by or through the corporation. |
In general, Section 203 defines an interested stockholder as any entity or person beneficially owning 15% or more of the outstanding voting stock of the corporation and any entity or person affiliated with or controlling or controlled by any of these entities or persons. Since the Funds will have owned their equity in us at the time we complete our corporate formation, the Funds will not be subject to the restrictions of Section 203.
141
Table of Contents
Amended and Restated Certificate of Incorporation and Amended and Restated Bylaws
Provisions of our amended and restated certificate of incorporation and amended and restated bylaws may delay or discourage transactions involving an actual or potential change in control or change in our management, including transactions in which stockholders might otherwise receive a premium for their shares, or transactions that our stockholders might otherwise deem to be in their best interests. Therefore, these provisions could adversely affect the price of our common stock.
Among other things, our amended and restated certificate of incorporation and amended and restated bylaws will:
| • | establish advance notice procedures with regard to stockholder proposals relating to the nomination of candidates for election as directors or new business to be brought before meetings of our stockholders. These procedures provide that notice of stockholder proposals must be timely given in writing to our corporate secretary prior to the meeting at which the action is to be taken. Generally, to be timely, notice must be received at our principal executive offices not less than 90 days nor more than 120 days prior to the first anniversary date of the annual meeting for the preceding year. Our amended and restated bylaws specify the requirements as to form and content of all stockholders’ notices. These requirements may preclude stockholders from bringing matters before the stockholders at an annual or special meeting; |
| • | provide our Board the ability to authorize undesignated preferred stock. This ability makes it possible for our Board to issue, without stockholder approval, preferred stock with voting or other rights or preferences that could impede the success of any attempt to change control of us. These and other provisions may have the effect of deferring hostile takeovers or delaying changes in control or management of our company; |
| • | provide that the authorized number of directors may be changed only by resolution of the Board; |
| • | provide that all vacancies, including newly created directorships, may, except as otherwise required by law or, if applicable, the rights of holders of a series of preferred stock, be filled by the affirmative vote of a majority of directors then in office, even if less than a quorum; |
| • | at any time after a group including MRD LLC and/or the Funds or their respective affiliates no longer collectively beneficially own more than 50% of the outstanding shares of our common stock: |
| • | provide that any action required or permitted to be taken by the stockholders must be effected at a duly called annual or special meeting of stockholders and may not be effected by any consent in writing in lieu of a meeting of such stockholders, subject to the rights of the holders of any series of preferred stock with respect to such series (prior to such time, such actions may be taken without a meeting by written consent of holders of common stock having not less than the minimum number of votes that would be necessary to authorize such action at a meeting); |
| • | provide our certificate of incorporation and bylaws may be amended by the affirmative vote of the holders of at least two-thirds of our then outstanding common stock (prior to such time, our certificate of incorporation and bylaws may be amended by the affirmative vote of the holders of a majority of our then outstanding common stock); |
| • | provide that special meetings of our stockholders may only be called by the Board, the chief executive officer or the chairman of the board (prior to such time, a special meeting may also be called at the request of stockholders holding a majority of the outstanding shares entitled to vote); |
| • | provide for our Board to be divided into three classes of directors, with each class as nearly equal in number as possible, serving staggered three year terms, other than directors which may be elected by holders of preferred stock, if any, and that directors may only be removed for cause. This system of electing and removing directors may tend to discourage a third party from making a tender offer or otherwise attempting to obtain control of us, because it generally makes it more difficult for stockholders to replace a majority of the directors; and |
142
Table of Contents
| • | provide that the affirmative vote of the holders of at least 75% in voting power of all then outstanding common stock entitled to vote generally in the election of directors, voting together as a single class, shall be required to remove any or all of the directors from office at any time. |
Limitation of Liability and Indemnification Matters
Our amended and restated certificate of incorporation limits the liability of our directors for monetary damages for breach of their fiduciary duty as directors, except for liability that cannot be eliminated under the DGCL. Delaware law provides that directors of a company will not be personally liable for monetary damages for breach of their fiduciary duty as directors, except for liabilities:
| • | for any breach of their duty of loyalty to us or our stockholders; |
| • | for acts or omissions not in good faith or which involve intentional misconduct or a knowing violation of law; |
| • | for unlawful payment of dividend or unlawful stock repurchase or redemption, as provided under Section 174 of the DGCL; or |
| • | for any transaction from which the director derived an improper personal benefit. |
Any amendment, repeal or modification of these provisions will be prospective only and would not affect any limitation on liability of a director for acts or omissions that occurred prior to any such amendment, repeal or modification.
Our amended and restated certificate of incorporation and amended and restated bylaws also provide that we will indemnify our directors and officers to the fullest extent permitted by Delaware law. Our amended and restated certificate of incorporation and amended and restated bylaws also permit us to purchase insurance on behalf of any officer, director, employee or other agent for any liability arising out of that person’s actions as our officer, director, employee or agent, regardless of whether Delaware law would permit indemnification. We intend to enter into indemnification agreements with each of our current and future directors and officers. These agreements will require us to indemnify these individuals to the fullest extent permitted under Delaware law against liability that may arise by reason of their service to us, and to advance expenses incurred as a result of any proceeding against them as to which they could be indemnified. We believe that the limitation of liability provision in our amended and restated certificate of incorporation and the indemnification agreements will facilitate our ability to continue to attract and retain qualified individuals to serve as directors and officers.
Corporate Opportunity
Under our amended and restated certificate of incorporation, to the extent permitted by law:
| • | MRD LLC, NGP, the Funds and their affiliates have the right to, and have no duty to abstain from, exercising such right to, conduct business with any business that is competitive or in the same line of business as us, do business with any of our clients or customers, or invest or own any interest publicly or privately in, or develop a business relationship with, any business that is competitive or in the same line of business as us; |
| • | if MRD LLC, NGP, the Funds or their affiliates acquires knowledge of a potential transaction that could be a corporate opportunity, they have no duty to offer such corporate opportunity to us; and |
| • | we have renounced any interest or expectancy in, or in being offered an opportunity to participate in, such corporate opportunities. |
Transfer Agent and Registrar
The transfer agent and registrar for our common stock is .
Listing
We intend to apply to list our common stock on the NASDAQ Global Market under the symbol “MRD.”
143
Table of Contents
SHARES ELIGIBLE FOR FUTURE SALE
There has not been a public market for our common stock prior to this offering. We cannot predict the extent to which investor interest in us will lead to the development of an active trading market or how liquid that market might become. If an active trading market does not develop, you may have difficulty selling any of our common stock that you buy. The initial public offering price for the common stock will be determined by negotiations between us and the underwriters and may not be indicative of prices that will prevail in the open market following this offering. See “Underwriting.” Consequently, you may be unable to sell our common stock at prices equal to or greater than the price you pay in this offering.
Sale of Restricted Shares
Upon completion of this offering, we will have an aggregate of shares of our common stock outstanding. Of these shares, shares of our common stock to be sold in this offering will be freely tradable without restriction or further registration under the Securities Act, except for any shares which may be acquired by any of our “affiliates” as that term is defined in Rule 144 under the Securities Act, which will be subject to the resale limitations of Rule 144. The remaining shares of our common stock outstanding will be restricted securities, as that term is defined in Rule 144, and may in the future be sold pursuant to an effective registration statement or under the Securities Act to the extent permitted by Rule 144 or any other available exemption under the Securities Act. All of the shares beneficially owned by MRD LLC and certain former management members of WildHorse Resources following this offering will be restricted securities.
Memorial Resource Development Corp. 2014 Incentive Award Plan
Following the completion of this offering, we intend to file a registration statement on Form S-8 under the Securities Act with the SEC to register shares of our common stock issued or reserved for issuance under the Memorial Resource Development Corp. 2014 Incentive Award Plan. Subject to the expiration of any lock-up restrictions as described below and following the completion of any vesting periods, shares of our common stock issued under the Memorial Resource Development Corp. 2014 Incentive Award Plan, issuable upon the exercise of options granted or to be granted under the plan, will be freely tradable without restriction under the Securities Act, unless such shares are held by any of our affiliates.
Lock-up Agreements
Executive officers, directors and our stockholders, including MRD LLC and certain former management members of WildHorse Resources, have agreed not to sell or transfer any shares of our common stock for a period of 180 days from the date of this prospectus, subject to certain exceptions and extensions. See “Underwriting” for a description of these lock-up provisions.
Rule 144
In general, under Rule 144 under the Securities Act, a person who is not deemed to have been an affiliate of ours at any time during the three months preceding a sale, and who has beneficially owned restricted securities within the meaning of Rule 144 for at least six months (including any period of consecutive ownership of preceding non-affiliated holders) would be entitled to sell those shares. A non-affiliated person who has beneficially owned restricted securities within the meaning of Rule 144 for at least one year would be entitled to sell those shares without regard to the provisions of Rule 144.
All of our outstanding common stock before this offering is held by affiliates. A person who is deemed to be an affiliate of ours and who has beneficially owned restricted securities within the meaning of Rule 144 for at least six months would be entitled to sell within any three-month period a number of shares (when aggregated with sales by certain related parties) that does not exceed the greater of 1% of the then outstanding shares of our common stock
144
Table of Contents
( shares following this offering) or the average weekly trading volume of our common stock reported through the applicable stock exchange during the four calendar weeks preceding such sale. Such sales are also subject to certain manner of sale provisions, notice requirements and the availability of current public information about us.
Rule 701
In general, under Rule 701, any of our employees, directors, officers, consultants or advisors who purchases shares from us in connection with a compensatory stock or option plan or other written agreement before the effective date of this offering is entitled to sell such shares 90 days after the effective date of this offering in reliance on Rule 144, without having to comply with the holding period requirement of Rule 144 and, in the case of non-affiliates, without having to comply with the public information, volume limitation or notice filing provisions of Rule 144. The SEC has indicated that Rule 701 will apply to typical stock options granted by an issuer before it becomes subject to the reporting requirements of the Exchange Act, along with the shares acquired upon exercise of such options, including exercises after the date of this prospectus.
Registration Rights
Pursuant to the Registration Rights Agreement we expect to enter into in connection with the closing of this offering, we expect that MRD LLC and certain former management members of WildHorse Resources will have customary rights to demand that we file a resale shelf registration statement or, in certain circumstances, conduct an underwritten offering of shares held by MRD LLC and certain former management members of WildHorse Resources. In addition, we expect that the agreement will grant MRD LLC and certain former management members of WildHorse Resources customary rights to participate in certain underwritten offerings of our common stock that we may conduct. See “Certain Relationships and Related Party Transactions—Registration Rights Agreement.”
145
Table of Contents
TO
NON-U.S. HOLDERS
Introduction
The following is a discussion of certain U.S. federal income tax considerations applicable to Non-U.S. Holders (as defined below) arising from the acquisition, ownership and disposition of shares of our common stock. This summary is for general information purposes only and does not purport to be a complete analysis or listing of all potential U.S. federal income tax considerations that may apply to a Non-U.S. Holder as a result of the acquisition, ownership and disposition of shares of our common stock. In addition, this summary does not take into account the individual facts and circumstances of any particular Non-U.S. Holder that may affect the U.S. federal income tax considerations applicable to such holder. Accordingly, this summary is not intended to be, and should not be construed as, legal or U.S. federal income tax advice with respect to any Non-U.S. Holder. Moreover, this summary is not binding on the Internal Revenue Service, or the IRS, or the U.S. courts, and no assurance can be provided that the conclusions reached in this summary will not be challenged by the IRS or will be sustained by a U.S. court if so challenged. We have not requested, and we do not intend to request, a ruling from the IRS or an opinion from U.S. legal counsel regarding any of the U.S. federal income or other tax considerations of the acquisition, ownership and disposition of shares of our common stock. Each Non-U.S. Holder should consult its own tax advisor regarding the acquisition, ownership and disposition of shares of our common stock.
Scope of This Disclosure
Authorities
This summary is based on the Internal Revenue Code of 1986, as amended (the “Code”), Treasury Regulations (final, temporary, and proposed), U.S. court decisions, published IRS rulings and published administrative positions of the IRS, that are applicable and, in each case, as in effect and available, as of the date of this prospectus. Any of the authorities on which this summary is based could be changed in a material and adverse manner at any time, and any such change could be applied on a retroactive basis and could affect the U.S. federal income tax considerations described in this summary.
Non-U.S. Holders
For purposes of this summary, a “Non-U.S. Holder” is a beneficial owner of shares of our common stock that is not a partnership or other entity classified as a partnership for U.S. federal income tax purposes and that is not: (a) an individual who is a citizen or resident of the U.S., (b) a corporation, or other entity classified as a corporation for U.S. federal income tax purposes, that is created or organized in or under the laws of the U.S. or any state in the U.S., including the District of Columbia, (c) an estate if the income of such estate is subject to U.S. federal income tax regardless of the source of such income, or (d) a trust if (i) such trust has validly elected to be treated as a U.S. person for U.S. federal income tax purposes or (ii) a U.S. court is able to exercise primary supervision over the administration of such trust and one or more U.S. persons have the authority to control all substantial decisions of such trust.
Non-U.S. Holders Subject to Special U.S. Federal Income Tax Rules Not Addressed
This summary does not address the U.S. federal income tax considerations of the acquisition, ownership and disposition of shares of our common stock by Non-U.S. Holders that are subject to special provisions under the Code, including the following Non-U.S. Holders: (a) Non-U.S. Holders that are tax-exempt organizations, qualified retirement plans, individual retirement accounts, or other tax-deferred accounts; (b) Non-U.S. Holders that are financial institutions, insurance companies, real estate investment trusts, or regulated investment companies or that are broker-dealers, dealers, or traders in securities or currencies that elect to apply a mark-to-
146
Table of Contents
market accounting method; (c) Non-U.S. Holders that have a “functional currency” other than the U.S. dollar; (d) Non-U.S. Holders that own shares of our common stock as part of a straddle, hedging transaction, conversion transaction, constructive sale, or other arrangement involving more than one position; (e) Non-U.S. Holders that acquire shares of our common stock in connection with the exercise of employee stock options or otherwise as compensation for services; (f) Non-U.S. Holders that hold shares of our common stock other than as a capital asset within the meaning of Section 1221 of the Code; (g) Non-U.S. Holders who are U.S. expatriates or former long term residents of the United States; and (h) Non-U.S. Holders that have or now own, directly, indirectly, or by attribution, 5% or more, by voting power or value, of the outstanding shares of our common stock. Non-U.S. Holders that are subject to special provisions under the Code, including but not limited to Non-U.S. Holders described immediately above, should consult their own tax advisors regarding the U.S. federal, U.S. state and local, and foreign tax and other tax considerations of the acquisition, ownership and disposition of shares of our common stock.
If a partnership or other entity that is classified as a partnership for U.S. federal income tax purposes holds shares of our common stock, the U.S. federal income tax considerations to such partnership and the partners of such partnership generally will depend on the activities of the partnership and the status of such partners (or owners). Partnerships or other entities that are classified as partnerships for U.S. federal income tax purposes and their owners should consult their own tax advisors regarding the U.S. federal income tax considerations of the acquisition, ownership and disposition of shares of our common stock.
Tax Considerations Other Than U.S. Federal Income Tax Considerations Not Addressed
This summary does not address any state, local, alternative minimum, estate and gift, foreign, or other tax considerations other than U.S. federal income tax considerations that may be relevant to Non-U.S. Holders in connection with the acquisition, ownership and disposition of shares of our common stock. Each Non-U.S. Holder should consult its own tax advisors regarding any state, local, estate and gift, foreign, and any other tax considerations that may be relevant to such holder in connection with the acquisition, ownership and disposition of shares of our common stock.
Dividends
In general, if dividends with respect to shares of our common stock are made, such dividends would be treated as dividends to the extent of our current or accumulated earnings and profits as determined under the Code. Any portion of a dividend that exceeds our current or accumulated earnings and profits will first be applied to reduce the Non-U.S. Holder’s basis in shares of our common stock, and, to the extent such portion exceeds the Non-U.S. Holder’s basis, the excess will be treated as gain from the disposition of shares of our common stock, the tax treatment of which is discussed below under the heading “—Gain on Sale or Other Disposition of Shares of our Common Stock.”
Generally, dividends paid in respect of shares of our common stock to a Non-U.S. Holder will be subject to U.S. withholding tax at a 30% rate, subject to the two following exceptions:
| • | Dividends effectively connected with a trade or business of a Non-U.S. Holder within the U.S. generally will not be subject to withholding if the Non-U.S. Holder complies with applicable IRS certification and disclosure requirements and generally will be subject to U.S. federal income tax on a net income basis at regular U.S. federal income tax rates (in the same manner as a U.S. person) on its U.S. trade or business income. In the case of a Non-U.S. Holder that is a corporation, such effectively connected income also may be subject to the branch profits tax at a 30% rate (or such lower rate as may be prescribed by an applicable tax treaty). |
| • | The withholding tax might not apply, or might apply at a reduced rate, under the terms of an applicable tax treaty. Under Treasury Regulations, to obtain a reduced rate of withholding under a tax treaty, a Non-U.S. Holder generally will be required to satisfy applicable certification and other requirements. A Non- |
147
Table of Contents
| U.S. Holder of shares of our common stock eligible for a reduced rate of U.S. withholding tax may obtain a refund or credit of any excess amounts withheld by filing an appropriate claim for refund with the IRS. |
Gain on Sale or Other Disposition of Shares of Our Common Stock
Except as described in the discussion below under the heading “Information Reporting; Backup Withholding Tax,” a Non-U.S. Holder generally will not be subject to U.S. federal income tax, including withholding tax, in connection with the receipt of proceeds from the sale, exchange, or other taxable disposition of shares of our common stock, unless:
| • | the gain is effectively connected with the Non-U.S. Holder’s conduct of a trade or business within the United States and, if subject to an applicable tax treaty, is attributable to a permanent establishment or fixed base maintained by the Non-U.S. Holder in the U.S.; |
| • | in the case of an individual, the Non-U.S. Holder has been present in the U.S. for at least 183 days or more in the taxable year of disposition (and certain other conditions are satisfied); or |
| • | we are or have been a “U.S. real property holding corporation,” or USRPHC, for U.S. federal income tax purposes (that is, a domestic corporation whose trade or business and real property assets consist primarily of “U.S. real property interests”) at any time during the shorter of the five-year period ending on the date of disposition and the Non-U.S. Holder’s holding period for its shares of our common stock and, if shares of our common stock are “regularly traded on an established securities market,” the Non-U.S. Holder held, directly or indirectly, at any time during such period, more than 5% of our issued and outstanding common stock. |
Income that is effectively connected with the conduct of a U.S. trade or business by a Non-U.S. Holder generally will be subject to regular U.S. federal income tax in the same manner as if it were realized by a U.S. Holder. In addition, if such Non-U.S. Holder is a corporation, such gain may be subject to a branch profits tax at a rate of 30% (or such lower rate as is provided by an applicable income tax treaty).
If an individual Non-U.S. Holder is present in the U.S. for at least 183 days during the taxable year of disposition, the Non-U.S. Holder may be subject to a flat 30% tax on any U.S.-source gain derived from the sale, exchange, or other taxable disposition of shares of our common stock (other than gain effectively connected with a U.S. trade or business), which may be offset by U.S.-source capital losses.
It is likely that we will be a USRPHC. As a result, any gain recognized by a Non-U.S. Holder on the sale, exchange, or other taxable disposition of our common stock may be subject to U.S. federal income tax in the same manner as gain recognized by a U.S. Holder, or the FIRPTA Tax. In addition, a Non-US. Holder may under certain circumstances be subject to withholding in an amount equal to 10% of the gross proceeds on the sale or disposition; if the Non-U.S. Holder files a U.S. federal income tax return, any amounts so withheld will generally be credited against, and refunded to the extent in excess of, any FIRPTA Tax such Non-U.S. Holder owes.
However, so long as our common stock is considered to be “regularly traded on an established securities market,” or regularly traded, at any time during the calendar year, a Non-U.S. Holder generally will not be subject to FIRPTA Tax on any gain recognized on the sale or other disposition of our common stock unless the Non-U.S. Holder owned (actually or constructively) shares of our common stock with a fair market value of more than 5% of the total fair market value of our common stock at any time during the applicable period described in the third bullet point above. No withholding is required under these rules upon a sale or other taxable disposition of our common stock if it is considered to be regularly traded. If, on the other hand, our common stock is not considered to be regularly traded, a Non-U.S. Holder will be subject to FIRPTA Tax on any gain recognized on your sale or other taxable disposition of our common stock, and withholding on the gross proceeds thereof, regardless of such Non-U.S. Holder’s percentage ownership of our common stock.
148
Table of Contents
Recent Law Changes Affecting U.S. Federal Income Tax Withholding
Legislation enacted in 2010 and recent administrative guidance will require withholding at a rate of 30% on dividends paid on or after July 1, 2014 (and gross proceeds from the sale of shares of our common stock paid on or after January 1, 2017) to certain foreign financial institutions (including investment funds), unless such institution enters into an agreement with the Secretary of the Treasury to, among other things, report, on an annual basis, information with respect to accounts with or shares in the institution held by certain U.S. persons and by certain non-U.S. entities that are wholly or partially owned by United States persons, and to withhold on payments made to certain account holders. Accordingly, the entity through which shares of our common stock is held will affect the determination of whether such withholding is required. Similarly, dividends in respect of, and gross proceeds from the sale of, shares of our common stock held by an investor that is a non-financial foreign entity will be subject to withholding at a rate of 30% if such entity or another non-financial foreign entity is the beneficial owner of the payment, unless, among other things, the beneficial owner or the payee either (i) certifies to the withholding agent that such entity does not have any “substantial United States owners” or (ii) provides certain information regarding the entity’s “substantial United States owners” to the withholding agent, which the withholding agent will in turn provide to the Secretary of the Treasury. Non-U.S. holders are encouraged to consult with their tax advisors regarding the possible implications of the legislation on their investment in shares of our common stock.
Information Reporting; Backup Withholding Tax
A Non-U.S. Holder generally will not be subject to information reporting or backup withholding with respect to payments of dividends on, or gross proceeds from the disposition of, shares of our common stock that are made within the United States or though certain U.S.-related financial intermediaries, provided that the Non-U.S. Holder certifies as to its foreign status or otherwise establishes an exemption.
Backup withholding is not an additional tax. Amounts withheld as backup withholding may be credited against a Non-U.S. Holder’s U.S. federal income tax liability, and a Non-U.S. Holder may obtain a refund of any excess amounts withheld under the backup withholding rules by timely filing the appropriate claim for refund with the IRS and furnishing any required information. Non-U.S. Holders should consult their own tax advisors regarding the application of the information reporting and backup withholding rules to them in their particular circumstances.
149
Table of Contents
Citigroup Global Markets Inc. is acting as book-running manager of the offering and as representative of the underwriters. Subject to the terms and conditions stated in the underwriting agreement dated the date of this prospectus, each underwriter named below has severally agreed to purchase, and we and MRD LLC have agreed to sell to that underwriter, the number of shares set forth opposite the underwriter’s name.
| Underwriter |
Number of Shares | |
| Citigroup Global Markets Inc. |
||
| Total |
||
|
|
The underwriting agreement provides that the obligations of the underwriters to purchase the shares included in this offering are subject to approval of legal matters by counsel and to other conditions. The underwriters are obligated to purchase all the shares (other than those covered by the underwriters’ option to purchase additional shares described below) if they purchase any of the shares.
Shares sold by the underwriters to the public will initially be offered at the initial public offering price set forth on the cover of this prospectus. Any shares sold by the underwriters to securities dealers may be sold at a discount from the initial public offering price not to exceed $ per share. If all the shares are not sold at the initial offering price, the underwriters may change the offering price and the other selling terms. The representative has advised us that the underwriters do not intend to make sales to discretionary accounts.
If the underwriters sell more shares than the total number set forth in the table above, MRD LLC has granted to the underwriters an option, exercisable for 30 days from the date of this prospectus, to purchase up to additional shares at the public offering price less the underwriting discount. The underwriters may exercise the option solely for the purpose of covering over-allotments, if any, in connection with this offering. To the extent the option is exercised, each underwriter must purchase a number of additional shares approximately proportionate to that underwriter’s initial purchase commitment. Any shares issued or sold under the option will be issued and sold on the same terms and conditions as the other shares that are the subject of this offering.
We, our officers and directors, MRD LLC and certain former management members of WildHorse Resources have agreed that, for a period of 180 days from the date of this prospectus, we and they will not, without the prior written consent of Citigroup Global Markets Inc. dispose of or hedge any shares or any securities convertible into or exchangeable for our common stock. Citigroup Global Markets Inc. in its sole discretion may release any of the securities subject to these lock-up agreements at any time, which, in the case of officers and directors, shall be with notice.
Prior to this offering, there has been no public market for our shares. Consequently, the initial public offering price for the shares was determined by negotiations among us and the representative. Among the factors considered in determining the initial public offering price were our results of operations, our current financial condition, our future prospects, our markets, the economic conditions in and future prospects for the industry in which we compete, our management, and currently prevailing general conditions in the equity securities markets, including current market valuations of publicly traded companies considered comparable to our company. We cannot assure you, however, that the price at which the shares will sell in the public market after this offering will not be lower than the initial public offering price or that an active trading market in our shares will develop and continue after this offering.
We have applied to have our shares listed on the Nasdaq Global Market under the symbol “MRD.”
150
Table of Contents
The following table shows the underwriting discounts and commissions that we and MRD LLC are to pay to the underwriters in connection with this offering. These amounts are shown assuming both no exercise and full exercise of the underwriters’ over-allotment option.
| Paid by the Company | ||||||||
| No Exercise | Full Exercise | |||||||
| Per share |
$ | $ | ||||||
| Total |
$ | $ | ||||||
| Paid by MRD LLC | ||||||||
| No Exercise | Full Exercise | |||||||
| Per share |
$ | $ | ||||||
| Total |
$ | $ | ||||||
We estimate that our portion of the total expenses of this offering will be $ (excluding underwriting discounts and commissions).
In connection with the offering, the underwriters may purchase and sell shares in the open market. Purchases and sales in the open market may include short sales, purchases to cover short positions, which may include purchases pursuant to the underwriters’ option to purchase additional shares, and stabilizing purchases.
| • | Short sales involve secondary market sales by the underwriters of a greater number of shares than they are required to purchase in the offering. |
| • | “Covered” short sales are sales of shares in an amount up to the number of shares represented by the underwriters’ option to purchase additional shares. |
| • | “Naked” short sales are sales of shares in an amount in excess of the number of shares represented by the underwriters’ option to purchase additional shares. |
| • | Covering transactions involve purchases of shares either pursuant to the underwriters’ option to purchase additional shares or in the open market in order to cover short positions. |
| • | To close a naked short position, the underwriters must purchase shares in the open market. A naked short position is more likely to be created if the underwriters are concerned that there may be downward pressure on the price of the shares in the open market after pricing that could adversely affect investors who purchase in the offering. |
| • | To close a covered short position, the underwriters must purchase shares in the open market or must exercise their option to purchase additional shares. In determining the source of shares to close the covered short position, the underwriters will consider, among other things, the price of shares available for purchase in the open market as compared to the price at which they may purchase shares through the underwriters’ option to purchase additional shares. |
| • | Stabilizing transactions involve bids to purchase shares so long as the stabilizing bids do not exceed a specified maximum. |
Purchases to cover short positions and stabilizing purchases, as well as other purchases by the underwriters for their own accounts, may have the effect of preventing or retarding a decline in the market price of the shares. They may also cause the price of the shares to be higher than the price that would otherwise exist in the open market in the absence of these transactions. The underwriters may conduct these transactions on the Nasdaq Global Market, in the over-the-counter market or otherwise. If the underwriters commence any of these transactions, they may discontinue them at any time.
Relationships
The underwriters are full service financial institutions engaged in various activities, which may include securities trading, commercial and investment banking, financial advisory, investment management, principal
151
Table of Contents
investment, hedging, financing and brokerage activities. The underwriters and their respective affiliates have in the past performed commercial banking, investment banking and advisory services for us from time to time for which they have received customary fees and reimbursement of expenses and may, from time to time, engage in transactions with and perform services for us in the ordinary course of their business for which they may receive customary fees and reimbursement of expenses. In the ordinary course of their various business activities, the underwriters and their respective affiliates may make or hold a broad array of investments and actively trade debt and equity securities (or related derivative securities) and financial instruments (which may include bank loans and/or credit default swaps) for their own account and for the accounts of their customers and may at any time hold long and short positions in such securities and instruments. Such investments and securities activities may involve securities and/or instruments of ours or our affiliates. In addition, affiliates of certain of the underwriters are lenders, and in some cases agents or managers for the lenders, under WildHorse Resources’ revolving credit facility and we expect affiliates of the certain underwriters will be lenders under the new revolving credit facility we will enter into in connection with the closing of this offering. Certain of the underwriters or their affiliates that have a lending relationship with us routinely hedge their credit exposure to us consistent with their customary risk management policies. A typical such hedging strategy would include these underwriters or their affiliates hedging such exposure by entering into transactions which consist of either the purchase of credit default swaps or the creation of short positions in our securities. The underwriters and their affiliates may also make investment recommendations and/or publish or express independent research views in respect of such securities or financial instruments and may hold, or recommend to clients that they acquire, long and/or short positions in such securities and instruments.
We and MRD LLC have agreed to indemnify the underwriters against certain liabilities, including liabilities under the Securities Act, or to contribute to payments the underwriters may be required to make because of any of those liabilities.
Notice to Prospective Investors in the European Economic Area
In relation to each member state of the European Economic Area that has implemented the Prospectus Directive (each, a relevant member state), with effect from and including the date on which the Prospectus Directive is implemented in that relevant member state (the relevant implementation date), an offer of shares described in this prospectus may not be made to the public in that relevant member state other than:
| • | to any legal entity which is a qualified investor as defined in the Prospectus Directive; |
| • | to fewer than 100 or, if the relevant member state has implemented the relevant provision of the 2010 PD Amending Directive, 150 natural or legal persons (other than qualified investors as defined in the Prospectus Directive), as permitted under the Prospectus Directive, subject to obtaining the prior consent of the relevant Dealer or Dealers nominated by us for any such offer; or |
| • | in any other circumstances falling within Article 3(2) of the Prospectus Directive, |
provided that no such offer of shares shall require us or any underwriter to publish a prospectus pursuant to Article 3 of the Prospectus Directive.
For purposes of this provision, the expression an “offer of securities to the public” in any relevant member state means the communication in any form and by any means of sufficient information on the terms of the offer and the shares to be offered so as to enable an investor to decide to purchase or subscribe for the shares, as the expression may be varied in that member state by any measure implementing the Prospectus Directive in that member state, and the expression “Prospectus Directive” means Directive 2003/71/EC (and amendments thereto, including the 2010 PD Amending Directive, to the extent implemented in the relevant member state) and includes any relevant implementing measure in the relevant member state. The expression 2010 PD Amending Directive means Directive 2010/73/EU.
The sellers of the shares have not authorized and do not authorize the making of any offer of shares through any financial intermediary on their behalf, other than offers made by the underwriters with a view to the final
152
Table of Contents
placement of the shares as contemplated in this prospectus. Accordingly, no purchaser of the shares, other than the underwriters, is authorized to make any further offer of the shares on behalf of the sellers or the underwriters.
Notice to Prospective Investors in the United Kingdom
This prospectus is only being distributed to, and is only directed at, persons in the United Kingdom that are qualified investors within the meaning of Article 2(1)(e) of the Prospectus Directive that are also (i) investment professionals falling within Article 19(5) of the Financial Services and Markets Act 2000 (Financial Promotion) Order 2005 (the “Order”) or (ii) high net worth entities, and other persons to whom it may lawfully be communicated, falling within Article 49(2)(a) to (d) of the Order (each such person being referred to as a “relevant person”). This prospectus and its contents are confidential and should not be distributed, published or reproduced (in whole or in part) or disclosed by recipients to any other persons in the United Kingdom. Any person in the United Kingdom that is not a relevant person should not act or rely on this document or any of its contents.
Notice to Prospective Investors in France
Neither this prospectus nor any other offering material relating to the shares described in this prospectus has been submitted to the clearance procedures of the Autorité des Marchés Financiers or of the competent authority of another member state of the European Economic Area and notified to the Autorité des Marchés Financiers. The shares have not been offered or sold and will not be offered or sold, directly or indirectly, to the public in France. Neither this prospectus nor any other offering material relating to the shares has been or will be:
| • | released, issued, distributed or caused to be released, issued or distributed to the public in France; or |
| • | used in connection with any offer for subscription or sale of the shares to the public in France. |
Such offers, sales and distributions will be made in France only:
| • | to qualified investors (investisseurs qualifiés) and/or to a restricted circle of investors (cercle restreint d’investisseurs), in each case investing for their own account, all as defined in, and in accordance with articles L.411-2, D.411-1, D.411-2, D.734-1, D.744-1, D.754-1 and D.764-1 of the French Code monétaire et financier; |
| • | to investment services providers authorized to engage in portfolio management on behalf of third parties; or |
| • | in a transaction that, in accordance with article L.411-2-II-1°-or-2°-or 3° of the French Code monétaire et financier and article 211-2 of the General Regulations (Règlement Général) of the Autorité des Marchés Financiers, does not constitute a public offer (appel public à l’épargne). |
The shares may be resold directly or indirectly, only in compliance with articles L.411-1, L.411-2, L.412-1 and L.621-8 through L.621-8-3 of the French Code monétaire et financier.
Notice to Prospective Investors in Hong Kong
The shares may not be offered or sold in Hong Kong by means of any document other than (i) in circumstances which do not constitute an offer to the public within the meaning of the Companies Ordinance (Cap. 32, Laws of Hong Kong), or (ii) to “professional investors” within the meaning of the Securities and Futures Ordinance (Cap. 571, Laws of Hong Kong) and any rules made thereunder, or (iii) in other circumstances which do not result in the document being a “prospectus” within the meaning of the Companies Ordinance (Cap. 32, Laws of Hong Kong) and no advertisement, invitation or document relating to the shares may be issued or may be in the possession of any person for the purpose of issue (in each case whether in Hong Kong or elsewhere), which is directed at, or the contents of which are likely to be accessed or read by, the public in Hong
153
Table of Contents
Kong (except if permitted to do so under the laws of Hong Kong) other than with respect to shares which are or are intended to be disposed of only to persons outside Hong Kong or only to “professional investors” within the meaning of the Securities and Futures Ordinance (Cap. 571, Laws of Hong Kong) and any rules made thereunder.
Notice to Prospective Investors in Japan
The shares offered in this prospectus have not been and will not be registered under the Financial Instruments and Exchange Law of Japan. The shares have not been offered or sold and will not be offered or sold, directly or indirectly, in Japan or to or for the account of any resident of Japan (including any corporation or other entity organized under the laws of Japan), except (i) pursuant to an exemption from the registration requirements of the Financial Instruments and Exchange Law and (ii) in compliance with any other applicable requirements of Japanese law.
Notice to Prospective Investors in Singapore
This prospectus has not been registered as a prospectus with the Monetary Authority of Singapore. Accordingly, this prospectus and any other document or material in connection with the offer or sale, or invitation for subscription or purchase, of the shares may not be circulated or distributed, nor may the shares be offered or sold, or be made the subject of an invitation for subscription or purchase, whether directly or indirectly, to persons in Singapore other than (i) to an institutional investor under Section 274 of the Securities and Futures Act, Chapter 289 of Singapore (the “SFA”), (ii) to a relevant person pursuant to Section 275(1), or any person pursuant to Section 275(1A), and in accordance with the conditions specified in Section 275 of the SFA or (iii) otherwise pursuant to, and in accordance with the conditions of, any other applicable provision of the SFA, in each case subject to compliance with conditions set forth in the SFA.
Where the shares are subscribed or purchased under Section 275 of the SFA by a relevant person which is:
| • | a corporation (which is not an accredited investor (as defined in Section 4A of the SFA)) the sole business of which is to hold investments and the entire share capital of which is owned by one or more individuals, each of whom is an accredited investor; or |
| • | a trust (where the trustee is not an accredited investor) whose sole purpose is to hold investments and each beneficiary of the trust is an individual who is an accredited investor, |
shares, debentures and units of shares and debentures of that corporation or the beneficiaries’ rights and interest (howsoever described) in that trust shall not be transferred within six months after that corporation or that trust has acquired the shares pursuant to an offer made under Section 275 of the SFA except:
| • | to an institutional investor (for corporations, under Section 274 of the SFA) or to a relevant person defined in Section 275(2) of the SFA, or to any person pursuant to an offer that is made on terms that such shares, debentures and units of shares and debentures of that corporation or such rights and interest in that trust are acquired at a consideration of not less than S$200,000 (or its equivalent in a foreign currency) for each transaction, whether such amount is to be paid for in cash or by exchange of securities or other assets, and further for corporations, in accordance with the conditions specified in Section 275 of the SFA; |
| • | where no consideration is or will be given for the transfer; or |
| • | where the transfer is by operation of law. |
154
Table of Contents
The validity of the shares of common stock offered hereby will be passed upon for us by Akin Gump Strauss Hauer & Feld LLP, Houston, Texas. Certain legal matters in connection with this offering will be passed upon for the underwriters by Vinson & Elkins L.L.P., Houston, Texas.
The financial statement of Memorial Resource Development Corp. as of January 31, 2014 has been included herein upon the report of KPMG LLP, independent registered public accounting firm, appearing elsewhere herein, and upon the authority of said firm as experts in accounting and auditing.
The consolidated and combined financial statements and schedules of our predecessor (as described in Note 1 to those financial statements) as of December 31, 2013 and 2012, and for each of the years then ended, have been included herein and in the registration statement in reliance upon the report of KPMG LLP, independent registered public accounting firm, appearing elsewhere herein, and upon the authority of said firm as experts in accounting and auditing.
Estimated quantities of our proved oil and natural gas reserves and the net present value of such reserves as of December 31, 2013 set forth in this prospectus are based on the reserve report prepared by Netherland, Sewell & Associates, Inc. Our acreage had been audited or evaluated by an independent reservoir engineering firm since 2011 and Netherland, Sewell & Associates, Inc. evaluated these reserves as of December 31, 2013.
Our estimates of probable and possible reserves are prepared by management and audited by Netherland, Sewell & Associates, Inc.
Estimated quantities of MEMP’s proved oil and natural gas reserves and the net present value of such reserves as of December 31, 2013 set forth in this prospectus are based on the reserve report prepared by Netherland, Sewell & Associates, Inc. MEMP’s acreage had been audited or evaluated by an independent reservoir engineering firm since 2011 and Netherland, Sewell & Associates, Inc. evaluated these reserves as of December 31, 2013.
We have included these estimates in reliance on the authority of Netherland, Sewell & Associates, Inc. as experts in such matters.
155
Table of Contents
WHERE YOU CAN FIND MORE INFORMATION
We have filed with the SEC a registration statement under the Securities Act, with respect to the shares of our common stock offered by this prospectus. This prospectus, filed as a part of the registration statement, does not contain all of the information set forth in the registration statement or the exhibits and schedules thereto as permitted by the rules and regulations of the SEC. For further information about us and our common stock, you should refer to the registration statement. This prospectus summarizes provisions that we consider material of certain contracts and other documents to which we refer you. You should review the full text of those documents. We have included copies of those documents as exhibits to the registration statement.
The registration statement and the exhibits thereto filed with the SEC may be inspected, without charge, and copies may be obtained at prescribed rates, at the public reference facility maintained by the SEC at 100 F Street, N.E., Washington, D.C. 20549. You may request copies of the documents, upon payment of a duplicating fee, by writing the Public Reference Section of the SEC. Please call 1-800-SEC-0330 for further information on the public reference rooms. Our filings with the SEC are also available to the public from commercial document retrieval services and at the web site maintained by the SEC at http://www.sec.gov.
Our website address is www.memorialrd.com. We expect to make available our periodic reports and other information filed with or furnished to the SEC, free of charge through our website, as soon as reasonably practicable after those reports and other information are electronically filed with or furnished to the SEC. Information on our website or any other website is not incorporated by reference herein and does not constitute a part of this prospectus.
As a result of the offering, we and our stockholders will also become subject to the proxy solicitation rules, annual and periodic reporting requirements and other requirements of the Exchange Act. These periodic reports, proxy statements and other information will be available for inspection and copying at the regional offices, public reference facilities and web site of the SEC referred to above. We will furnish our stockholders with annual reports containing audited financial statements certified by an independent registered public accounting firm and quarterly reports containing unaudited financial statements for the first three quarters of each fiscal year.
156
Table of Contents
F-1
Table of Contents
REPORT OF INDEPENDENT REGISTERED PUBLIC ACCOUNTING FIRM
To the Board of Directors
Memorial Resource Development Corp.
We have audited the accompanying balance sheet of Memorial Resource Development Corp. as of January 31, 2014. This financial statement is the responsibility of the Memorial Resource Development Corp.’s management. Our responsibility is to express an opinion on this financial statement based on our audit.
We conducted our audit in accordance with the standards of the Public Company Accounting Oversight Board (United States). Those standards require that we plan and perform the audit to obtain reasonable assurance about whether the balance sheet is free of material misstatement. The Company is not required to have, nor were we engaged to perform an audit of the Company’s internal control over financial reporting. Our audit included consideration of internal control over financial reporting as a basis for designing audit procedures that are appropriate in the circumstances, but not for the purpose of expressing an opinion on the effectiveness of the Company’s internal control over financial reporting. Accordingly, we express no such opinion. An audit of a balance sheet also includes examining, on a test basis, evidence supporting the amounts and disclosures in that balance sheet, assessing the accounting principles used and significant estimates made by management, as well as evaluating the overall balance sheet presentation. We believe that our audit of the balance sheet provides a reasonable basis for our opinion.
In our opinion, the balance sheet referred to above presents fairly, in all material respects, the financial position of Memorial Resource Development Corp. as of January 31, 2014, in conformity with U.S. generally accepted accounting principles.
/s/ KPMG LLP
Dallas, TX
February 6, 2014
F-2
Table of Contents
MEMORIAL RESOURCE DEVELOPMENT CORP.
BALANCE SHEET
| January 31, 2014 |
||||
| ASSETS |
||||
| Cash and cash equivalents |
$ | — | ||
|
|
|
|||
| Total assets |
$ | — | ||
|
|
|
|||
| SHAREHOLDERS’ EQUITY |
||||
| Common stock, $0.01 par value; authorized 1,000 shares; 100 issued and outstanding at January 31, 2014 |
1 | |||
| Less receivable from Memorial Resource Development LLC |
(1 | ) | ||
|
|
|
|||
| Total shareholders’ equity |
$ | — | ||
|
|
|
|||
See Accompanying Note to Balance Sheet.
F-3
Table of Contents
MEMORIAL RESOURCE DEVELOPMENT CORP.
NOTE TO BALANCE SHEET
Note 1. Organization and Basis of Presentation
Memorial Resource Development Corp. (“MRDC”) is a Delaware corporation formed by Memorial Resource Development LLC (“MRD LLC”) on January 31, 2014 to own and acquire oil and natural gas properties in North America. MRD LLC is a Delaware limited liability company formed on April 27, 2011 by Natural Gas Partners VIII, L.P. (“NGP VIII”), Natural Gas Partners IX, L.P. (“NGP IX”) and NGP IX Offshore Holdings, L.P. (“NGP IX Offshore”) (collectively, the “Funds”) to own, acquire, exploit and develop oil and natural gas properties. The Funds are private equity funds managed by Natural Gas Partners (“NGP”).
MRDC plans to pursue an initial public offering (the “offering”) of its common stock. In connection with the closing of this offering, MRD LLC will contribute the following to us in exchange for shares of common stock: (1) 100% of its ownership interests in Classic Hydrocarbons Holdings, L.P. (“Classic”), Classic Hydrocarbons GP Co., L.L.C. (“Classic GP”), Black Diamond Minerals, LLC (“Black Diamond”), Beta Operating Company, LLC (“Beta Operating”), MRD Operating LLC (“MRD Operating”) and Memorial Production Partners GP LLC (“MEMP GP”), (2) its 99.9% membership interest in WildHorse Resources, LLC (“WildHorse Resources”), (3) 5,360,912 subordinated units, representing an 8.7% limited partner interest in Memorial Production Partners LP (“MEMP”) and (4) 50% of the incentive distribution rights of MEMP. In addition, certain former management members of WildHorse Resources will contribute to us the remaining 0.1% membership interest in WildHorse Resources as well as exchange their incentive units in exchange for shares of common stock and cash consideration.
This balance sheet has been prepared in accordance with accounting principles generally accepted in the United States of America (“GAAP”). MRD LLC has committed to contribute $1 as the initial sole shareholder. This contribution receivable is reflected as a reduction to equity. Separate Statements of Income, Changes in Stockholder’s Equity and of Cash Flows have not been presented because MRDC has had no business transactions or activities to date.
F-4
Table of Contents
MEMORIAL RESOURCE DEVELOPMENT CORP.
UNAUDITED PRO FORMA CONDENSED COMBINED FINANCIAL INFORMATION
We are a Delaware corporation (“MRDC”) formed by Memorial Resource Development LLC (“MRD LLC”) in January 2014 to own and acquire oil and natural gas properties in North America. MRD LLC is a Delaware limited liability company formed on April 27, 2011 by Natural Gas Partners VIII, L.P. (“NGP VIII”), Natural Gas Partners IX, L.P. (“NGP IX”) and NGP IX Offshore Holdings, L.P. (“NGP IX Offshore”) (collectively, the “Funds”) to own, acquire, exploit and develop oil and natural gas properties. The Funds are private equity funds managed by Natural Gas Partners (“NGP”).
In connection with the closing of this offering, MRD LLC and its consolidated subsidiaries, which is our accounting predecessor, will contribute the following to us in exchange for shares of common stock: (1) 100% of its ownership interests in Classic Hydrocarbons Holdings, L.P. (“Classic”), Classic Hydrocarbons GP Co., L.L.C. (“Classic GP”), Black Diamond Minerals, LLC (“Black Diamond”), Beta Operating Company, LLC (“Beta Operating”), MRD Operating LLC (“MRD Operating”) and Memorial Production Partners GP LLC (“MEMP GP”), (2) its 99.9% membership interest in WildHorse Resources, LLC (“WildHorse Resources”), (3) 5,360,912 subordinated units, representing an 8.7% limited partner interest in Memorial Production Partners LP (“MEMP”) and (4) 50% of MEMP’s incentive distribution rights. In addition, certain former management members of WildHorse Resources will contribute to us the remaining 0.1% membership interest in WildHorse Resources as well as exchange their incentive units in exchange for shares of common stock and cash consideration. Collectively, we refer to these transactions as the “Restructuring.” Following the completion of the offering, MRD LLC will retain (i) its interests in BlueStone Natural Resources Holdings, LLC (“BlueStone Holdings”) as well as two immaterial subsidiaries that were formed subsequent to December 31, 2013 and (ii) the cash to be released from its debt service reserve account in connection with the redemption of the PIK notes.
MRD LLC controls MEMP through its ownership of MEMP GP. MEMP is a publicly traded limited partnership engaged in the acquisition, production and development of oil and natural gas properties in the United States. Due to MRD LLC’s control of MEMP through the ownership of its general partner, MRD LLC is required to consolidate MEMP for accounting and financial reporting purposes.
MRD LLC has two reportable business segments, both of which are engaged in the acquisition, exploitation, development and production of oil and natural gas properties:
| • | MRD—reflects all of MRD LLC’s consolidating subsidiaries except for MEMP and its subsidiaries. |
| • | MEMP—reflects the consolidated and combined operations of MEMP and its subsidiaries. |
The following unaudited pro forma condensed combined financial information reflects the historical financial statements of MRD LLC adjusted on a pro forma basis to give effect to the following transactions as if they had occurred on December 31, 2013 for pro forma balance sheet purposes and on January 1, 2013 for pro forma statements of operations purposes:
| • | the exclusion of BlueStone Holdings since it is not being conveyed to MRDC and the cash reserve associated with the PIK notes; |
| • | the Restructuring transactions as described above; and |
| • | the initial public offering of shares of common stock and the use of the net proceeds therefrom as described in “Use of Proceeds” (the “Offering”). |
F-5
Table of Contents
MEMORIAL RESOURCE DEVELOPMENT CORP.
UNAUDITED PRO FORMA CONDENSED COMBINED FINANCIAL INFORMATION
Offering. For purposes of the unaudited pro forma combined financial statements, the Offering is defined as the planned issuance and sale to the public of shares of common stock of MRDC as contemplated by this prospectus and the application of the net proceeds from such issuance as described in “Use of Proceeds.” The net proceeds from the sale of the common stock are expected to be $ million (based on an assumed initial public offering price of $ , the midpoint of the price range set forth on the cover of this prospectus), net of underwriting discounts and commissions of $ million and other offering-related expenses payable by us, which is estimated to be approximately $ million.
The unaudited pro forma combined balance sheet of MRDC is based on the audited historical consolidated and combined balance sheet of MRD LLC as of December 31, 2013 and includes pro forma adjustments to give effect to the exclusion of BlueStone Holdings and the cash reserve associated with the PIK notes, the Restructuring, and the Offering, as if they had occurred on December 31, 2013.
The unaudited pro forma combined statements of operations of MRDC are based on: (i) the audited historical consolidated and combined statement of operations of MRD LLC for the year ended December 31, 2013, having been adjusted to give effect to the exclusion of BlueStone Holdings, the Restructuring and the Offering as if they occurred on January 1, 2013 and (ii) the historical accounting records of MRD LLC.
The unaudited pro forma combined financial statements have been prepared on the basis that MRDC will be subject to subchapter C of the Internal Revenue Code of 1986, as amended, and as a result, will become taxable as a corporation and subject to U.S. federal and state income taxes at the entity level. The unaudited pro forma combined financial statements should be read in conjunction with the notes thereto and with the audited historical consolidated and combined financial statements and related notes of MRD LLC, included elsewhere in this prospectus.
The pro forma adjustments to the audited historical consolidated and combined financial statements are based on currently available information and certain estimates and assumptions. The actual effect of the transactions discussed in the accompanying notes ultimately may differ from the unaudited pro forma adjustments included herein. However, management believes that the assumptions utilized to prepare the pro forma adjustments provide a reasonable basis for presenting the significant effects of the transactions as currently contemplated and that the unaudited pro forma adjustments are factually supportable, give appropriate effect to the expected impact of events that are directly attributable to the transactions, and reflect those items expected to have a continuing impact on MRDC.
The unaudited pro forma combined financial statements of MRDC are not necessarily indicative of financial results that would have been attained had the described transactions occurred on the dates indicated below or which could be achieved in the future because they necessarily exclude various operating expenses, such as incremental general and administrative expenses associated with being a public company.
F-6
Table of Contents
MEMORIAL RESOURCE DEVELOPMENT CORP.
UNAUDITED PRO FORMA CONDENSED COMBINED BALANCE SHEET
DECEMBER 31, 2013
| MRD LLC Historical |
Exclude BlueStone Holdings |
Offering
& Restructuring Related Adjustments |
MRDC Pro Forma Combined |
|||||||||||||
| ASSETS |
||||||||||||||||
| Current assets: |
||||||||||||||||
| Cash and cash equivalents |
$ | 77,721 | $ | (7,405 | ) | $ | (e) | $ | ||||||||
| (f) | ||||||||||||||||
| (g) | ||||||||||||||||
| Restricted cash |
35,000 | — | (35,000 | )(a) | — | |||||||||||
| Accounts receivable: |
||||||||||||||||
| Oil and natural gas sales |
68,764 | (402 | ) | — | 68,362 | |||||||||||
| Joint interest owners and other |
19,958 | (144 | ) | — | 19,814 | |||||||||||
| Affiliates |
4,652 | — | — | 4,652 | ||||||||||||
| Short-term derivative instruments |
9,289 | — | — | 9,289 | ||||||||||||
| Prepaid expenses and other current assets |
19,513 | (1,786 | ) | — | 17,727 | |||||||||||
|
|
|
|
|
|
|
|
|
|||||||||
| Total current assets |
234,897 | (9,737 | ) | |||||||||||||
| Property and equipment, at cost: |
||||||||||||||||
| Oil and natural gas properties, successful efforts method |
3,037,298 | (16,572 | ) | — | 3,020,726 | |||||||||||
| Other |
10,331 | (500 | ) | — | 9,831 | |||||||||||
| Accumulated depreciation, depletion and impairment |
(627,925 | ) | 15,826 | — | (612,099 | ) | ||||||||||
|
|
|
|
|
|
|
|
|
|||||||||
| Oil and natural gas properties, net |
2,419,704 | (1,246 | ) | — | 2,418,458 | |||||||||||
| Long-term derivative instruments |
48,616 | — | — | 48,616 | ||||||||||||
| Restricted investments |
73,385 | — | — | 73,385 | ||||||||||||
| Restricted cash |
15,506 | — | (15,000 | )(a) | 506 | |||||||||||
| Other long-term assets |
37,053 | — | (f) | |||||||||||||
| (19,727 | )(h) | |||||||||||||||
|
|
|
|
|
|
|
|
|
|||||||||
| Total assets |
$ | 2,829,161 | $ | (10,983 | ) | $ | $ | |||||||||
|
|
|
|
|
|
|
|
|
|||||||||
The accompanying notes are an integral part of this unaudited pro forma financial information.
F-7
Table of Contents
MEMORIAL RESOURCE DEVELOPMENT CORP.
UNAUDITED PRO FORMA CONDENSED COMBINED BALANCE SHEET
DECEMBER 31, 2013
| MRD LLC Historical |
Exclude BlueStone Holdings |
Offering
& Restructuring Related Adjustments |
MRDC Pro Forma Combined |
|||||||||||||
| LIABILITIES AND EQUITY |
||||||||||||||||
| Current liabilities: |
||||||||||||||||
| Accounts payable |
$ | 20,734 | (401 | ) | $ | — | $ | 20,333 | ||||||||
| Accounts payable—affiliates |
1,975 | (119 | ) | — | 1,856 | |||||||||||
| Revenues payable |
56,091 | (429 | ) | — | 55,662 | |||||||||||
| Accrued liabilities |
98,130 | (1,227 | ) | — | 96,903 | |||||||||||
| Short-term derivative instruments |
9,711 | — | — | 9,711 | ||||||||||||
|
|
|
|
|
|
|
|
|
|||||||||
| Total current liabilities |
186,641 | (2,176 | ) | — | 184,495 | |||||||||||
| Long-term debt—MRD Segment |
871,150 | — | (f) | |||||||||||||
| (871,150 | )(g) | |||||||||||||||
| Long-term debt—MEMP Segment |
792,067 | — | — | 792,067 | ||||||||||||
| Asset retirement obligations |
111,679 | (631 | ) | — | 111,048 | |||||||||||
| Long-term derivative instruments |
6,080 | — | — | 6,080 | ||||||||||||
| Other long-term liabilities |
3,412 | — | (d) | 3,412 | ||||||||||||
|
|
|
|
|
|
|
|
|
|||||||||
| Total liabilities |
1,971,029 | (2,807 | ) | |||||||||||||
| Equity: |
||||||||||||||||
| Common stock |
— | — | (b) | |||||||||||||
| (c) | ||||||||||||||||
| (e) | ||||||||||||||||
| Additional paid in capital |
— | — | (b) | |||||||||||||
| (c) | ||||||||||||||||
| (e) | ||||||||||||||||
| (g) | ||||||||||||||||
| Accumulated deficit |
— | — | (c) | |||||||||||||
| (d) | ||||||||||||||||
| (19,727 | )(h) | |||||||||||||||
| Members’ equity |
237,186 | (2,100 | ) | (185,086 | )(b) | — | ||||||||||
| (50,000 | )(a) | |||||||||||||||
| Previous owners |
40,331 | — | — | 40,331 | ||||||||||||
|
|
|
|
|
|
|
|
|
|||||||||
| Total members’ equity |
277,517 | (2,100 | ) | — | — | |||||||||||
| Noncontrolling interest |
580,615 | (6,076 | ) | (398 | )(c) | 574,141 | ||||||||||
|
|
|
|
|
|
|
|
|
|||||||||
| Total equity |
858,132 | (8,176 | ) | |||||||||||||
|
|
|
|
|
|
|
|
|
|||||||||
| Total liabilities and equity |
$ | 2,829,161 | $ | (10,983 | ) | $ | $ | |||||||||
|
|
|
|
|
|
|
|
|
|||||||||
The accompanying notes are an integral part of this unaudited pro forma financial information.
F-8
Table of Contents
MEMORIAL RESOURCE DEVELOPMENT CORP.
UNAUDITED PRO FORMA CONDENSED COMBINED STATEMENTS OF OPERATIONS
FOR THE YEAR ENDED DECEMBER 31, 2013
| MRD LLC Historical |
Exclude BlueStone Holdings |
Offering
& Restructuring Related Adjustments |
MRDC Pro Forma Combined |
|||||||||||||
| Revenues: |
||||||||||||||||
| Oil & natural gas sales |
$ | 571,948 | $ | (17,129 | ) | $ | — | $ | 554,819 | |||||||
| Other revenues |
3,075 | — | — | 3,075 | ||||||||||||
|
|
|
|
|
|
|
|
|
|||||||||
| Total revenues |
575,023 | (17,129 | ) | — | 557,894 | |||||||||||
|
|
|
|
|
|
|
|
|
|||||||||
| Costs and expenses: |
||||||||||||||||
| Lease operating |
113,640 | (2,605 | ) | — | 111,035 | |||||||||||
| Pipeline operating |
1,835 | — | — | 1,835 | ||||||||||||
| Exploration |
2,356 | — | — | 2,356 | ||||||||||||
| Production and ad valorem taxes |
27,146 | (830 | ) | — | 26,316 | |||||||||||
| Depreciation, depletion, and amortization |
184,717 | (8,931 | ) | — | 175,786 | |||||||||||
| Impairment of proved oil and natural gas properties |
6,600 | (2,399 | ) | — | 4,201 | |||||||||||
| General and administrative |
125,358 | (24,260 | ) | — | 101,098 | |||||||||||
| Accretion of asset retirement obligations |
5,581 | (58 | ) | — | 5,523 | |||||||||||
| (Gain) loss on commodity derivative instruments |
(29,294 | ) | (17 | ) | — | (29,311 | ) | |||||||||
| (Gain) loss on sale of properties |
(85,621 | ) | 89,548 | — | 3,927 | |||||||||||
| Other, net |
649 | — | — | 649 | ||||||||||||
|
|
|
|
|
|
|
|
|
|||||||||
| Total costs and expenses |
352,967 | 50,448 | — | 403,415 | ||||||||||||
|
|
|
|
|
|
|
|
|
|||||||||
| Operating income |
222,056 | (67,577 | ) | — | 154,479 | |||||||||||
| Other income (expense): |
||||||||||||||||
| Interest expense, net |
(69,250 | ) | 53 | (i) | ||||||||||||
| 1,411 | (j) | |||||||||||||||
| 20,814 | (k) | |||||||||||||||
| Other, net |
145 | (2 | ) | — | 143 | |||||||||||
|
|
|
|
|
|
|
|
|
|||||||||
| Total other income (expense) |
(69,105 | ) | 51 | |||||||||||||
|
|
|
|
|
|
|
|
|
|||||||||
| Income (loss) before income taxes |
152,951 | (67,526 | ) | |||||||||||||
| Income tax benefit (expense) |
(1,619 | ) | 1,147 | (l) | ||||||||||||
|
|
|
|
|
|
|
|
|
|||||||||
| Net income (loss) |
$ | 151,332 | $ | (66,379 | ) | $ | $ | |||||||||
|
|
|
|
|
|
|
|
|
|||||||||
| Net income (loss) per common share(m) |
||||||||||||||||
| Basic and diluted |
||||||||||||||||
| Weighted average common shares outstanding(m) |
||||||||||||||||
| Basic and diluted |
||||||||||||||||
The accompanying notes are an integral part of this unaudited pro forma financial information.
F-9
Table of Contents
MEMORIAL RESOURCE DEVELOPMENT CORP.
NOTES TO UNAUDITED PRO FORMA CONDENSED COMBINED FINANCIAL STATEMENTS
Note 1. Basis of Presentation
We are a Delaware corporation (“MRDC”) formed by Memorial Resource Development LLC (“MRD LLC”) in January 2014 to own and acquire oil and natural gas properties in North America. MRD LLC is a Delaware limited liability company formed on April 27, 2011 by Natural Gas Partners VIII, L.P. (“NGP VIII”), Natural Gas Partners IX, L.P. (“NGP IX”) and NGP IX Offshore Holdings, L.P. (“NGP IX Offshore”) (collectively, the “Funds”) to own, acquire, exploit and develop oil and natural gas properties. The Funds are private equity funds managed by Natural Gas Partners (“NGP”).
In connection with the closing of this offering, MRD LLC and its consolidated subsidiaries, which is our accounting predecessor, will contribute the following to us in exchange for shares of common stock: (1) 100% of its ownership interests in Classic Hydrocarbons Holdings, L.P. (“Classic”), Classic Hydrocarbons GP Co., L.L.C. (“Classic GP”), Black Diamond Minerals, LLC (“Black Diamond”), Beta Operating Company, LLC (“Beta Operating”), MRD Operating LLC (“MRD Operating”) and Memorial Production Partners GP LLC (“MEMP GP”), (2) its 99.9% membership interest in WildHorse Resources, LLC (“WildHorse Resources”), (3) 5,360,912 subordinated units, representing an 8.7% limited partner interest in Memorial Production Partners LP (“MEMP”) and (4) 50% of MEMP’s incentive distribution rights. In addition, certain former management members of WildHorse Resources will contribute to us the remaining 0.1% membership interest in WildHorse Resources as well as exchange their incentive units in exchange for shares of common stock and cash consideration. Collectively, we refer to these transactions as the “Restructuring.” Following the completion of the offering, MRD LLC will retain (i) its interests in BlueStone Natural Resources Holdings, LLC (“BlueStone Holdings”) as well as two immaterial subsidiaries that were formed subsequent to December 31, 2013 and (ii) the cash to be released from its debt service reserve account in connection with the redemption of the PIK notes.
MRD LLC controls MEMP through its ownership of MEMP GP. MEMP is a publicly traded limited partnership engaged in the acquisition, production and development of oil and natural gas properties in the United States. Due to MRD LLC’s control of MEMP through the ownership of its general partner, MRD LLC is required to consolidate MEMP for accounting and financial reporting purposes.
The following unaudited pro forma condensed combined financial information reflects the historical financial statements of MRD LLC adjusted on a pro forma basis to give effect to the following transactions as if they had occurred on December 31, 2013 for pro forma balance sheet purposes and on January 1, 2013 for pro forma statements of operations purposes:
| • | the exclusion of BlueStone Holdings since it is not being conveyed to MRDC and the cash reserve associated with the PIK notes; |
| • | the Restructuring transactions as described above; and |
| • | the initial public offering of shares of common stock and the use of the net proceeds therefrom as described in “Use of Proceeds” (the “Offering”). |
The unaudited pro forma combined balance sheet of MRDC is based on the audited historical consolidated and combined balance sheet of MRD LLC as of December 31, 2013 and includes pro forma adjustments to give effect to the exclusion of BlueStone Holdings, and the Offering, as if they had occurred on December 31, 2013.
The unaudited pro forma combined statements of operations of MRDC are based on: (i) the audited historical consolidated and combined statement of operations of MRD LLC for the year ended December 31, 2013, having been adjusted to give effect to the exclusion of BlueStone Holdings, and the Offering as if they occurred on January 1, 2013 and (ii) the historical accounting records of MRD LLC.
F-10
Table of Contents
MEMORIAL RESOURCE DEVELOPMENT CORP.
NOTES TO UNAUDITED PRO FORMA CONDENSED COMBINED FINANCIAL STATEMENTS
The unaudited pro forma combined financial statements have been prepared on the basis that MRDC will be subject to subchapter C of the Internal Revenue Code of 1986, as amended, and as a result, will become taxable as a corporation and subject to U.S. federal and state income taxes at the entity level. The unaudited pro forma combined financial statements should be read in conjunction with the notes thereto and with the audited historical consolidated and combined financial statements and related notes of MRD LLC, included elsewhere in this prospectus.
The pro forma adjustments to the audited historical consolidated and combined financial statements are based on currently available information and certain estimates and assumptions. The actual effect of the transactions discussed in the accompanying notes ultimately may differ from the unaudited pro forma adjustments included herein. However, management believes that the assumptions utilized to prepare the pro forma adjustments provide a reasonable basis for presenting the significant effects of the transactions as currently contemplated and that the unaudited pro forma adjustments are factually supportable, give appropriate effect to the expected impact of events that are directly attributable to the transactions, and reflect those items expected to have a continuing impact on MRDC.
The unaudited pro forma combined financial statements of MRDC are not necessarily indicative of financial results that would have been attained had the described transactions occurred on the dates indicated below or which could be achieved in the future because they necessarily exclude various operating expenses, such as incremental general and administrative expenses associated with being a public company.
F-11
Table of Contents
MEMORIAL RESOURCE DEVELOPMENT CORP.
NOTES TO UNAUDITED PRO FORMA CONDENSED COMBINED FINANCIAL STATEMENTS
Note 2. MRD Segment Stand-Alone Pro Forma Financial Statements
Unaudited Pro Forma Condensed Combined Balance Sheet—December 31, 2013
| MRD Segment Historical |
Exclude BlueStone Holdings |
Offering & Restructuring Related Adjustments |
MRD Segment Pro Forma Combined |
|||||||||||||
| ASSETS |
||||||||||||||||
| Current assets: |
||||||||||||||||
| Cash and cash equivalents |
$ | 64,582 | $ | (7,405 | ) | $ | (e) | $ | ||||||||
| (f) | ||||||||||||||||
| (g) | ||||||||||||||||
| Restricted cash |
35,000 | — | (35,000 | )(a) | — | |||||||||||
| Accounts receivable: |
||||||||||||||||
| Oil and natural gas sales |
34,232 | (402 | ) | — | 33,830 | |||||||||||
| Joint interest owners and other |
15,324 | (144 | ) | — | 15,180 | |||||||||||
| Affiliates |
6,963 | — | — | 6,963 | ||||||||||||
| Short-term derivative instruments |
1,688 | — | — | 1,688 | ||||||||||||
| Prepaid expenses and other current assets |
10,367 | (1,786 | ) | — | 8,581 | |||||||||||
|
|
|
|
|
|
|
|
|
|||||||||
| Total current assets |
168,156 | (9,737 | ) | |||||||||||||
| Property and equipment, at cost: |
||||||||||||||||
| Oil and natural gas properties, successful efforts method |
1,272,830 | (16,572 | ) | — | 1,256,258 | |||||||||||
| Other |
7,431 | (500 | ) | — | 6,931 | |||||||||||
| Accumulated depreciation, depletion and impairment |
(259,121 | ) | 15,826 | — | (243,295 | ) | ||||||||||
|
|
|
|
|
|
|
|
|
|||||||||
| Oil and natural gas properties, net |
1,021,140 | (1,246 | ) | — | 1,019,894 | |||||||||||
| Long-term derivative instruments |
5,959 | — | 5,959 | |||||||||||||
| Investments in unconsolidated affiliates |
50,780 | — | — | 50,780 | ||||||||||||
| Restricted cash |
15,506 | — | (15,000 | )(a) | 506 | |||||||||||
| Other long-term assets |
19,593 | — | (f) | |||||||||||||
| (19,727 | )(h) | |||||||||||||||
|
|
|
|
|
|
|
|
|
|||||||||
| Total assets |
$ | 1,281,134 | $ | (10,983 | ) | $ | $ | |||||||||
|
|
|
|
|
|
|
|
|
|||||||||
F-12
Table of Contents
MEMORIAL RESOURCE DEVELOPMENT CORP.
NOTES TO UNAUDITED PRO FORMA CONDENSED COMBINED FINANCIAL STATEMENTS
| MRD
Segment Historical |
Exclude BlueStone Holdings |
Offering & Restructuring Related Adjustments |
MRD Segment Pro Forma Combined |
|||||||||||||
| LIABILITIES AND EQUITY |
||||||||||||||||
| Current liabilities: |
||||||||||||||||
| Accounts payable |
$ | 12,561 | (401 | ) | $ | — | $ | 12,160 | ||||||||
| Accounts payable—affiliates |
4,493 | (119 | ) | — | 4,374 | |||||||||||
| Revenues payable |
39,800 | (429 | ) | — | 39,371 | |||||||||||
| Accrued liabilities |
58,373 | (1,227 | ) | — | 57,146 | |||||||||||
| Short-term derivative instruments |
1,715 | — | — | 1,715 | ||||||||||||
|
|
|
|
|
|
|
|
|
|||||||||
| Total current liabilities |
116,942 | (2,176 | ) | — | 114,766 | |||||||||||
| Long-term debt—MRD Segment |
871,150 | — | (f) | |||||||||||||
| (871,150 | )(g) | |||||||||||||||
| Asset retirement obligations |
12,059 | (631 | ) | — | 11,428 | |||||||||||
| Long-term derivative instruments |
205 | — | — | 205 | ||||||||||||
| Other long-term liabilities |
1,366 | — | — | (d) | 1,366 | |||||||||||
|
|
|
|
|
|
|
|
|
|||||||||
| Total liabilities |
1,001,722 | (2,807 | ) | |||||||||||||
| Equity: |
||||||||||||||||
| Common stock |
— | — | (b) | |||||||||||||
| (c) | ||||||||||||||||
| (e) | ||||||||||||||||
| Additional paid in capital |
— | — | (b) | |||||||||||||
| (c) | ||||||||||||||||
| (e) | ||||||||||||||||
| (g) | ||||||||||||||||
| Accumulated deficit |
— | — | (c) | |||||||||||||
| (d) | ||||||||||||||||
| (19,727 | )(h) | |||||||||||||||
| Members’ equity |
232,774 | (2,100 | ) | (180,674 | )(b) | — | ||||||||||
| (50,000 | )(a) | |||||||||||||||
| Previous Owners |
40,331 | — | — | 40,331 | ||||||||||||
|
|
|
|
|
|
|
|
|
|||||||||
| Total members’ equity |
273,105 | (2,100 | ) | |||||||||||||
| Noncontrolling interest |
6,307 | (6,076 | ) | (231 | )(c) | — | ||||||||||
|
|
|
|
|
|
|
|
|
|||||||||
| Total equity |
279,412 | (8,176 | ) | |||||||||||||
|
|
|
|
|
|
|
|
|
|||||||||
| Total liabilities and equity |
$ | 1,281,134 | $ | (10,983 | ) | $ | $ | |||||||||
|
|
|
|
|
|
|
|
|
|||||||||
F-13
Table of Contents
MEMORIAL RESOURCE DEVELOPMENT CORP.
NOTES TO UNAUDITED PRO FORMA CONDENSED COMBINED FINANCIAL STATEMENTS
Unaudited Pro Forma Condensed Combined Statements of Operations—For the Year Ended December 31, 2013
| . | MRD Segment Historical |
Exclude BlueStone Holdings |
MRD Segment Adjustments |
Offering & Restructuring Related Adjustments |
MRD Segment Pro Forma Combined |
|||||||||||||||
| Revenues: |
||||||||||||||||||||
| Oil & natural gas sales |
$ | 230,751 | $ | (17,129 | ) | $ | — | $ | — | $ | 213,622 | |||||||||
| Other revenues |
807 | — | — | — | 807 | |||||||||||||||
|
|
|
|
|
|
|
|
|
|
|
|||||||||||
| Total revenues |
231,558 | (17,129 | ) | — | — | 214,429 | ||||||||||||||
|
|
|
|
|
|
|
|
|
|
|
|||||||||||
| Costs and expenses: |
||||||||||||||||||||
| Lease operating |
25,006 | (2,605 | ) | — | — | 22,401 | ||||||||||||||
| Exploration |
1,226 | — | — | — | 1,226 | |||||||||||||||
| Production and ad valorem taxes |
9,362 | (830 | ) | — | — | 8,532 | ||||||||||||||
| Depreciation, depletion, and amortization |
87,043 | (8,931 | ) | — | — | 78,112 | ||||||||||||||
| Impairment of proved oil and natural gas properties |
2,527 | (2,399 | ) | — | — | 128 | ||||||||||||||
| General and administrative |
81,758 | (24,260 | ) | — | — | 57,498 | ||||||||||||||
| Accretion of asset retirement obligations |
728 | (58 | ) | — | — | 670 | ||||||||||||||
| (Gain) loss on commodity derivative instruments |
(3,013 | ) | (17 | ) | — | — | (3,030 | ) | ||||||||||||
| (Gain) loss on sale of properties |
(82,773 | ) | 89,548 | — | — | 6,775 | ||||||||||||||
| Other, net |
2 | — | — | — | 2 | |||||||||||||||
|
|
|
|
|
|
|
|
|
|
|
|||||||||||
| Total costs and expenses |
121,866 | 50,448 | — | — | 172,314 | |||||||||||||||
|
|
|
|
|
|
|
|
|
|
|
|||||||||||
| Operating income |
109,692 | (67,577 | ) | — | — | 42,115 | ||||||||||||||
| Other income (expense): |
||||||||||||||||||||
| Interest expense, net |
(27,349 | ) | 53 | — | (i) | |||||||||||||||
| 1,411 | (j) | |||||||||||||||||||
| 20,814 | (k) | |||||||||||||||||||
| Earnings from equity investments |
1,066 | — | — | — | 1,066 | |||||||||||||||
| Other, net |
145 | (2 | ) | — | — | 143 | ||||||||||||||
|
|
|
|
|
|
|
|
|
|
|
|||||||||||
| Total other income (expense) |
(26,138 | ) | 51 | — | ||||||||||||||||
|
|
|
|
|
|
|
|
|
|
|
|||||||||||
| Income (loss) before income taxes |
83,554 | (67,526 | ) | — | ||||||||||||||||
| Income tax benefit (expense) |
(1,311 | ) | 1,147 | — | (l) | |||||||||||||||
|
|
|
|
|
|
|
|
|
|
|
|||||||||||
| Net income (loss) |
$ | 82,243 | $ | (66,379 | ) | $ | — | $ | $ | |||||||||||
|
|
|
|
|
|
|
|
|
|
|
|||||||||||
F-14
Table of Contents
MEMORIAL RESOURCE DEVELOPMENT CORP.
NOTES TO UNAUDITED PRO FORMA CONDENSED COMBINED FINANCIAL STATEMENTS
Note 3. Pro Forma Adjustments and Assumptions
Unaudited Pro Forma Condensed Combined Balance Sheet
The following adjustments were made in the preparation of the unaudited pro forma condensed combined balance sheet:
| (a) | Pro forma adjustments to reflect the $50 million in cash to be released from its debt service reserve account in connection with the redemption of the PIK notes. |
| (b) | Pro forma adjustment to reflect the issuance of shares of our common stock to MRD LLC in exchange for: (1) 100% of the ownership interests in Classic, Classic GP, Black Diamond, Beta Operating, MRD Operating and MEMP GP; (2) 99.9% of the membership interests in WildHorse Resources; (3) the 5,360,912 MEMP subordinated units representing limited partner interests in MEMP; and (4) 50% of the incentive distribution rights of MEMP. |
| (c) | Pro forma adjustment to reflect the contribution from certain former management members of WildHorse Resources to us of the remaining 0.1% membership interest in WildHorse Resources and the forfeiture of their incentive units in exchange for shares of our common stock and cash consideration of $ . The cash consideration will be paid from the net proceeds from the Offering and borrowings under a new revolving credit facility as discussed in (e) and (f) below. The portion of the total consideration related to acquiring the 0.1% membership interest will be accounted for as the acquisition of noncontrolling interests and the remaining portion related to the incentive units will be recorded as compensation expense within general and administrative expenses. A corresponding charge to earnings has not been reflected in the unaudited pro forma combined statements of operations as the charge is considered non-recurring. |
| (d) | Pro forma adjustment to reflect the estimated change in long-term deferred tax liabilities for temporary differences between the historical cost basis and tax basis of the assets and liabilities being contributed to MRDC. MRDC will be subject to subchapter C of the Internal Revenue Code of 1986, as amended, and as a result, will become taxable as a corporation and subject to U.S. federal and state income taxes at the entity level. A corresponding charge to earnings has not been reflected in the unaudited pro forma combined statements of operations as the charge is considered non-recurring. |
| (e) | Pro forma adjustments to reflect the estimated gross proceeds of million to the Company from the issuance and sale of million shares of common stock at an assumed initial public offering price of $ per share (the midpoint of the price range set forth on the cover of this registration statement), net of estimated underwriting discounts and commissions of $ million and additional estimated expenses related to the Offering of approximately $ million. |
| (f) | Pro forma adjustment to reflect the cash proceeds from borrowings by MRDC of $ million under a new credit facility and financing costs of $ . |
| (g) | Pro forma adjustments to record the use of the $ million of net proceeds from this Offering and borrowings under our new revolving credit facility to: (1) redeem the PIK notes in their entirety and pay any applicable premium in connection with such redemption and accrued and unpaid interest, if any, to the date of redemption; (2) repay indebtedness under WildHorse Resources’ revolving and second lien credit facilities; and (3) pay cash consideration to former management members of WildHorse Resources. |
| (h) | Pro forma adjustment to reflect a $8.3 million write-off of unamortized deferred financing costs associated with the PIK notes upon redemption and a $11.4 million of write-off of unamortized deferred financing costs associated with WildHorse Resources’ revolving and second lien credit facilities; however, a corresponding charge to earnings has not been reflected in the unaudited pro forma combined statements of operations as the charge is considered non-recurring. |
F-15
Table of Contents
MEMORIAL RESOURCE DEVELOPMENT CORP.
NOTES TO UNAUDITED PRO FORMA CONDENSED COMBINED FINANCIAL STATEMENTS
Unaudited Pro Forma Condensed Combined Statements of Operations
The following adjustments were made in the preparation of the unaudited pro forma condensed combined statements of operations for the year ended December 31, 2013:
| (i) | Pro forma adjustment to reflect the incurrence of interest expense on $ million of borrowings by MRDC under a new credit facility at LIBOR plus % and expenses on the unused borrowing base of %. Pro forma adjustment also reflects amortization of deferred financing costs of approximately $ million for the year ended December 31, 2013. A one-eighth percentage point change in the interest rate would change pro forma interest by $ million for the year ended December 31, 2013. |
| (j) | Pro forma adjustment to reflect a reduction in interest expense on the PIK notes as a result of applying $ million of net proceeds from this Offering to redeem the PIK notes in their entirety. |
| (k) | Pro forma adjustment to reflect a reduction in interest expense under WildHorse Resources’ revolving and second lien credit facilities associated with repayment of such debt with net proceeds from the Offering and borrowing by MRDC under a new credit facility. The second lien facility was entered into in June 2013. |
| (l) | Pro forma adjustment to reflect the estimated incremental income tax provision associated with the historical results of operations and pro forma adjustments assuming the earnings had been subject to federal income tax as a subchapter C corporation using an effective tax rate of approximately %. This rate is inclusive of federal and state income taxes. |
| (m) | Basic and diluted earnings per share is based on the issuance and sale of shares of common stock at the initial public offering. |
Note 4. Pro Forma Proved Reserves and Standardized Measure of Discounted Future Net Cash Flows
Users of this information should be aware that the process of estimating quantities of “proved” and “proved developed” oil and natural gas reserves is very complex, requiring significant subjective decisions in the evaluation of all available geological, engineering and economic data for each reservoir. The data for a given reservoir may also change substantially over time as a result of numerous factors including, but not limited to, additional activity, evolving production history and continual reassessment of the viability of production under varying economic conditions. As a result, revisions to existing reserve estimates may occur from time to time. Although every reasonable effort is made to ensure reserve estimates reported represent the most accurate assessments possible, the subjective decisions and variances in available data for various reservoirs make these estimates generally less precise than other estimates included in the financial statement disclosures.
Proved reserves are those quantities of oil and natural gas that by analysis of geoscience and engineering data can be estimated with reasonable certainty to be economically producible—from a given date forward, from known reservoirs, and under existing economic conditions, operating methods and government regulations—prior to the time at which contracts providing the right to operate expire, unless evidence indicates that renewal is reasonably certain, regardless of whether deterministic or probabilistic methods are used for the estimation. The project to extract the hydrocarbons must have commenced or the operator must be reasonably certain that it will continue the project within a reasonable time.
Netherland, Sewell & Associates, Inc. (“NSAI”) was engaged to prepare all of our estimated proved reserves (by volume) at December 31, 2013. All proved reserves are located in the United States and all prices are held constant in accordance with SEC rules.
In accordance with SEC regulations, reserves at December 31, 2013 were estimated using the unweighted arithmetic average first-day-of-the-month price for the preceding 12-month period.
F-16
Table of Contents
MEMORIAL RESOURCE DEVELOPMENT CORP.
NOTES TO UNAUDITED PRO FORMA CONDENSED COMBINED FINANCIAL STATEMENTS
The following table sets forth estimates of the net reserves as of December 31, 2013:
| MRD LLC Historical Equivalent (MMcfe) |
Exclude BlueStone Holdings Equivalent (MMcfe) |
MRDC Pro Forma Combined Equivalent (MMcfe) |
||||||||||
| Proved developed and undeveloped reserves: |
||||||||||||
| Beginning of year |
2,074,990 | (8,057 | ) | 2,066,933 | ||||||||
| Extensions and discoveries |
295,832 | — | 295,832 | |||||||||
| Purchase of minerals in place |
57,737 | — | 57,737 | |||||||||
| Production |
(103,122 | ) | 1,690 | (101,432 | ) | |||||||
| Sales of minerals in place |
(27,169 | ) | 4,178 | (22,991 | ) | |||||||
| Revision of previous estimates |
(157,586 | ) | 2,189 | (155,397 | ) | |||||||
|
|
|
|
|
|
|
|||||||
| End of year(1) |
2,140,682 | — | 2,140,682 | |||||||||
|
|
|
|
|
|
|
|||||||
| Proved developed reserves: |
||||||||||||
| Beginning of year |
957,573 | (4,901 | ) | 952,672 | ||||||||
| End of year |
984,534 | — | 984,534 | |||||||||
| Proved undeveloped reserves: |
||||||||||||
| Beginning of year |
1,117,417 | (3,156 | ) | 1,114,261 | ||||||||
| End of year |
1,156,148 | — | 1,156,148 | |||||||||
| (1) | MRD LLC historical column includes reserves of 965,110 MMcfe attributable to noncontrolling interests and the previous owners. |
A variety of methodologies are used to determine our proved reserve estimates. The principal methodologies employed are reservoir simulation, decline curve analysis, volumetric, material balance, advance production type curve matching, petro-physics/log analysis and analogy. Some combination of these methods is used to determine reserve estimates in substantially all of our fields.
The standardized measure of discounted future net cash flows presented below is computed by applying first of month average prices, year-end costs and legislated tax rates and a discount factor of 10 percent to proved reserves. We do not believe the standardized measure provides a reliable estimate of the expected future cash flows to be obtained from the development and production of its oil and gas properties or of the value of its proved oil and gas reserves. The standardized measure is prepared on the basis of certain prescribed assumptions including first of month average prices, which represent discrete points in time and therefore may cause significant variability in cash flows from year to year as prices change.
F-17
Table of Contents
MEMORIAL RESOURCE DEVELOPMENT CORP.
NOTES TO UNAUDITED PRO FORMA CONDENSED COMBINED FINANCIAL STATEMENTS
The standardized measure of discounted future net cash flows is as follows for the year ended December 31, 2013 (in thousands):
| MRD LLC Historical |
Offering & Restructuring Related Adjustments |
MRDC Pro Forma Combined |
||||||||||
| Future cash inflows |
$ | 12,614,998 | $ | — | $ | 12,614,998 | ||||||
| Future production costs |
(4,306,398 | ) | — | (4,306,398 | ) | |||||||
| Future development costs |
(2,038,803 | ) | — | (2,038,803 | ) | |||||||
| Future income tax expense(1) |
— | (821,733 | ) | (821,733 | ) | |||||||
|
|
|
|
|
|
|
|||||||
| Future net cash flows for estimated timing of cash flows |
6,269,797 | (821,733 | ) | 5,448,064 | ||||||||
| 10% annual discount for estimated timing of cash flows |
(3,192,733 | ) | 392,018 | (2,800,715 | ) | |||||||
|
|
|
|
|
|
|
|||||||
| Standardized measure of discounted future net cash flows(2) |
$ | 3,077,064 | $ | (429,715 | ) | $ | 2,647,349 | |||||
|
|
|
|
|
|
|
|||||||
| (1) | Pro forma adjustment to reflect the estimated incremental income tax provision associated with the historical results of operations and pro forma adjustments for the MRD Segment assuming the earnings had been subject to federal income tax as a subchapter C corporation using an effective tax rate of approximately 36%. This rate is inclusive of federal and state income taxes. |
| (2) | The MRD LLC Historical column includes $1,529,217 attributable to noncontrolling interests and the previous owners and on a pro forma basis includes $1,506,499 attributable to noncontrolling interests and the previous owners. |
The following is a summary of the changes in the standardized measure of discounted future net cash flows for the proved oil and natural gas reserves during the year ended December 31, 2013 (in thousands):
| MRD LLC Historical |
Exclude BlueStone Holdings |
Offering & Restructuring Related Adjustments |
MRDC Pro Forma Combined |
|||||||||||||
| Beginning of year |
$ | 2,910,511 | $ | (35,469 | ) | $ | — | $ | 2,875,042 | |||||||
| Sale of oil and natural gas produced, net of production costs |
(430,964 | ) | 13,694 | — | (417,270 | ) | ||||||||||
| Purchase of minerals in place |
74,337 | — | — | 74,337 | ||||||||||||
| Sale of minerals in place |
(54,091 | ) | 24,718 | — | (29,373 | ) | ||||||||||
| Extensions and discoveries |
437,427 | — | — | 437,427 | ||||||||||||
| Changes in income taxes |
— | — | (429,715 | ) | (429,715 | ) | ||||||||||
| Changes in prices and costs |
(85,731 | ) | — | — | (85,731 | ) | ||||||||||
| Previously estimated development costs incurred |
261,787 | (4,048 | ) | — | 257,739 | |||||||||||
| Net changes in future development costs |
(17,514 | ) | — | — | (17,514 | ) | ||||||||||
| Revisions of previous quantities |
(327,926 | ) | — | — | (327,926 | ) | ||||||||||
| Accretion of discount |
287,535 | — | — | 287,535 | ||||||||||||
| Change in production rates and other |
21,693 | 1,105 | — | 22,798 | ||||||||||||
|
|
|
|
|
|
|
|
|
|||||||||
| End of year |
$ | 3,077,064 | $ | — | $ | (429,715 | ) | $ | 2,647,349 | |||||||
|
|
|
|
|
|
|
|
|
|||||||||
F-18
Table of Contents
MRD Segment
The following table sets forth estimates of the net reserves as of December 31, 2013:
| MRD Segment Historical Equivalent (MMcfe) |
Exclude BlueStone Holdings Equivalent (MMcfe) |
MRD Segment Pro Forma Combined Equivalent (MMcfe) |
||||||||||
| Proved developed and undeveloped reserves: |
||||||||||||
| Beginning of year |
1,059,895 | (8,057 | ) | 1,051,838 | ||||||||
| Extensions and discoveries |
210,652 | — | 210,652 | |||||||||
| Purchase of minerals in place |
39,183 | — | 39,183 | |||||||||
| Production |
(46,819 | ) | 1,690 | (45,129 | ) | |||||||
| Sales of minerals in place |
(27,169 | ) | 4,178 | (22,991 | ) | |||||||
| Revision of previous estimates |
(110,165 | ) | 2,189 | (107,976 | ) | |||||||
|
|
|
|
|
|
|
|||||||
| End of year(1) |
1,125,577 | — | 1,125,577 | |||||||||
|
|
|
|
|
|
|
|||||||
| Proved developed reserves: |
||||||||||||
| Beginning of year |
337,869 | (4,901 | ) | 332,968 | ||||||||
| End of year |
367,641 | — | 367,641 | |||||||||
| Proved undeveloped reserves: |
||||||||||||
| Beginning of year |
722,026 | (3,156 | ) | 718,870 | ||||||||
| End of year |
757,936 | — | 757,936 | |||||||||
| (1) | MRD segment historical column includes reserves of 965,110 MMcfe attributable to noncontrolling interests and the previous owners. |
The standardized measure of discounted future net cash flows is as follows for the year ended December 31, 2013 (in thousands):
| MRD Segment Historical |
Exclude BlueStone Holdings |
Offering & Restructuring Related Adjustments |
MRD Segment Pro Forma Combined |
|||||||||||||
| Future cash inflows |
$ | 5,722,848 | $ | — | $ | — | $ | 5,722,848 | ||||||||
| Future production costs |
(1,587,374 | ) | — | — | (1,587,374 | ) | ||||||||||
| Future development costs |
(1,352,945 | ) | — | — | (1,352,945 | ) | ||||||||||
| Future income tax expense(1) |
— | — | (760,433 | ) | (760,433 | ) | ||||||||||
|
|
|
|
|
|
|
|
|
|||||||||
| Future net cash flows for estimated timing of cash flows |
2,782,529 | — | (760,433 | ) | 2,022,096 | |||||||||||
| 10% annual discount for estimated timing of cash flows |
(1,313,577 | ) | — | 358, 986 | (954,591 | ) | ||||||||||
|
|
|
|
|
|
|
|
|
|||||||||
| Standardized measure of discounted future net cash flows(2) |
$ | 1,468,952 | $ | — | $ | (401,447 | ) | $ | 1,067,505 | |||||||
|
|
|
|
|
|
|
|
|
|||||||||
| (1) | Pro forma adjustment to reflect the estimated incremental income tax provision associated with the historical results of operations and pro forma adjustments for the MRD Segment assuming the earnings had been subject to federal income tax as a subchapter C corporation using an effective tax rate of approximately 36%. This rate is inclusive of federal and state income taxes. |
| (2) | The MRD Segment Historical column includes $63,422 attributable to noncontrolling interests and the previous owners and on a pro forma basis includes $40,704 attributable to noncontrolling interests and the previous owners. |
F-19
Table of Contents
The following is a summary of the changes in the standardized measure of discounted future net cash flows for the proved oil and natural gas reserves during the year ended December 31, 2013 (in thousands):
| MRD Segment Historical |
Exclude BlueStone Holdings |
Offering & Restructuring Related Adjustments |
MRD Segment Pro Forma Combined |
|||||||||||||
| Beginning of year |
$ | 1,320,595 | $ | (35,469 | ) | $ | — | $ | 1,285,126 | |||||||
| Sale of oil and natural gas produced, net of production costs |
(196,444 | ) | 13,694 | — | (182,750 | ) | ||||||||||
| Purchase of minerals in place |
51,177 | — | — | 51,177 | ||||||||||||
| Sale of minerals in place |
(54,091 | ) | 24,718 | — | (29,373 | ) | ||||||||||
| Extensions and discoveries |
301,004 | — | — | 301,004 | ||||||||||||
| Changes in income taxes |
— | — | (401,447 | ) | (401,447 | ) | ||||||||||
| Changes in prices and costs |
(11,336 | ) | — | — | (11,336 | ) | ||||||||||
| Previously estimated development costs incurred |
87,297 | (4,048 | ) | — | 83,249 | |||||||||||
| Net changes in future development costs |
57,353 | — | — | 57,353 | ||||||||||||
| Revisions of previous quantities |
(186,804 | ) | — | — | (186,804 | ) | ||||||||||
| Accretion of discount |
128,544 | — | — | 128,544 | ||||||||||||
| Change in production rates and other |
(28,343 | ) | 1,105 | — | (27,238 | ) | ||||||||||
|
|
|
|
|
|
|
|
|
|||||||||
| End of year |
$ | 1,468,952 | $ | — | $ | (401,447 | ) | $ | 1,067,505 | |||||||
|
|
|
|
|
|
|
|
|
|||||||||
F-20
Table of Contents
REPORT OF INDEPENDENT REGISTERED PUBLIC ACCOUNTING FIRM
The Board of Managers
Memorial Resource Development LLC:
We have audited the accompanying consolidated and combined balance sheets of Memorial Resource Development LLC and subsidiaries (the Company) as of December 31, 2013 and 2012, and the related consolidated and combined statements of operations, equity, and cash flows for the years then ended. In connection with our audits of the consolidated and combined financial statements, we also have audited Schedule I—Condensed Financial Information (Schedule I). These consolidated and combined financial statements and Schedule I are the responsibility of the Company’s management. Our responsibility is to express an opinion on these consolidated and combined financial statements and Schedule I based on our audits.
We conducted our audits in accordance with the standards of the Public Company Accounting Oversight Board (United States). Those standards require that we plan and perform the audit to obtain reasonable assurance about whether the financial statements are free of material misstatement. The Company is not required to have, nor were we engaged to perform, an audit of its internal control over financial reporting. Our audit included consideration of internal control over financial reporting as a basis for designing audit procedures that are appropriate in the circumstances, but not for the purpose of expressing an opinion on the effectiveness of the Company’s internal control over financial reporting. Accordingly, we express no such opinion. An audit includes examining, on a test basis, evidence supporting the amounts and disclosures in the financial statements. An audit also includes assessing the accounting principles used and significant estimates made by management, as well as evaluating the overall financial statement presentation. We believe that our audits provide a reasonable basis for our opinion.
In our opinion, the consolidated and combined financial statements referred to above present fairly, in all material respects, the financial position of Memorial Resource Development LLC and subsidiaries as of December 31, 2013 and 2012, and the results of their operations and their cash flows for each of the years then ended in conformity with U.S. generally accepted accounting principles. Also in our opinion, the related Schedule I, when considered in relation to the basic consolidated and combined financial statements taken as a whole, present fairly, in all material respects, the information set forth therein.
As discussed in Note 1 to the consolidated and combined financial statements, the balances sheets, and the related statements of operations, equity, and cash flows have been prepared on a combined basis of accounting.
/s/ KPMG LLP
Dallas, Texas
April 4, 2014
F-21
Table of Contents
MEMORIAL RESOURCE DEVELOPMENT LLC (PREDECESSOR)
CONSOLIDATED AND COMBINED BALANCE SHEETS
(In thousands)
| December 31, | ||||||||
| 2013 | 2012 | |||||||
| ASSETS |
||||||||
| Current assets: |
||||||||
| Cash and cash equivalents |
$ | 77,721 | $ | 49,391 | ||||
| Restricted cash |
35,000 | 2,013 | ||||||
| Accounts receivable: |
||||||||
| Oil and natural gas sales |
68,764 | 64,128 | ||||||
| Joint interest owners and other |
19,958 | 17,701 | ||||||
| Affiliates |
4,652 | 77 | ||||||
| Short-term derivative instruments |
9,289 | 41,921 | ||||||
| Prepaid expenses and other current assets |
19,513 | 13,577 | ||||||
|
|
|
|
|
|||||
| Total current assets |
234,897 | 188,808 | ||||||
| Property and equipment, at cost: |
||||||||
| Oil and natural gas properties, successful efforts method |
3,037,298 | 2,637,466 | ||||||
| Other |
10,331 | 9,920 | ||||||
| Accumulated depreciation, depletion and impairment |
(627,925 | ) | (471,949 | ) | ||||
|
|
|
|
|
|||||
| Oil and natural gas properties, net |
2,419,704 | 2,175,437 | ||||||
| Long-term derivative instruments |
48,616 | 17,179 | ||||||
| Restricted investments |
73,385 | 68,024 | ||||||
| Restricted cash |
15,506 | — | ||||||
| Other long-term assets |
37,053 | 9,856 | ||||||
|
|
|
|
|
|||||
| Total assets |
$ | 2,829,161 | $ | 2,459,304 | ||||
|
|
|
|
|
|||||
| LIABILITIES AND EQUITY |
||||||||
| Current liabilities: |
||||||||
| Accounts payable |
$ | 20,734 | $ | 36,633 | ||||
| Accounts payable—affiliates |
1,975 | — | ||||||
| Revenues payable |
56,091 | 50,967 | ||||||
| Accrued liabilities |
98,130 | 33,487 | ||||||
| Short-term derivative instruments |
9,711 | 4,667 | ||||||
|
|
|
|
|
|||||
| Total current liabilities |
186,641 | 125,754 | ||||||
| Long-term debt—MRD Segment |
871,150 | 309,200 | ||||||
| Long-term debt—MEMP Segment |
792,067 | 630,182 | ||||||
| Asset retirement obligations |
111,679 | 101,990 | ||||||
| Long-term derivative instruments |
6,080 | 11,623 | ||||||
| Other long-term liabilities |
3,412 | 3,846 | ||||||
|
|
|
|
|
|||||
| Total liabilities |
1,971,029 | 1,182,595 | ||||||
| Commitments and contingencies (Note 14) |
||||||||
| Equity: |
||||||||
| Members |
237,186 | 811,614 | ||||||
| Previous owners (Note 1) |
40,331 | 233,433 | ||||||
|
|
|
|
|
|||||
| Total members’ equity |
277,517 | 1,045,047 | ||||||
| Noncontrolling interest |
580,615 | 231,662 | ||||||
|
|
|
|
|
|||||
| Total equity |
858,132 | 1,276,709 | ||||||
|
|
|
|
|
|||||
| Total liabilities and equity |
$ | 2,829,161 | $ | 2,459,304 | ||||
|
|
|
|
|
|||||
See Accompanying Notes to Consolidated and Combined Financial Statements.
F-22
Table of Contents
MEMORIAL RESOURCE DEVELOPMENT LLC (PREDECESSOR)
STATEMENTS OF CONSOLIDATED AND COMBINED OPERATIONS
(In thousands)
| For Year Ended December 31, | ||||||||
| 2013 | 2012 | |||||||
| Revenues: |
||||||||
| Oil & natural gas sales |
$ | 571,948 | $ | 393,631 | ||||
| Other revenues |
3,075 | 3,237 | ||||||
|
|
|
|
|
|||||
| Total revenues |
575,023 | 396,868 | ||||||
|
|
|
|
|
|||||
| Costs and expenses: |
||||||||
| Lease operating |
113,640 | 103,754 | ||||||
| Pipeline operating |
1,835 | 2,114 | ||||||
| Exploration |
2,356 | 9,800 | ||||||
| Production and ad valorem taxes |
27,146 | 23,624 | ||||||
| Depreciation, depletion, and amortization |
184,717 | 138,672 | ||||||
| Impairment of proved oil and natural gas properties |
6,600 | 28,871 | ||||||
| General and administrative |
125,358 | 69,187 | ||||||
| Accretion of asset retirement obligations |
5,581 | 5,009 | ||||||
| (Gain) loss on commodity derivative instruments |
(29,294 | ) | (34,905 | ) | ||||
| (Gain) loss on sale of properties |
(85,621 | ) | (9,761 | ) | ||||
| Other, net |
649 | 502 | ||||||
|
|
|
|
|
|||||
| Total costs and expenses |
352,967 | 336,867 | ||||||
|
|
|
|
|
|||||
| Operating income |
222,056 | 60,001 | ||||||
| Other income (expense): |
||||||||
| Interest expense, net |
(69,250 | ) | (33,238 | ) | ||||
| Amortization of investment premium |
— | (194 | ) | |||||
| Other, net |
145 | 535 | ||||||
|
|
|
|
|
|||||
| Total other income (expense) |
(69,105 | ) | (32,897 | ) | ||||
|
|
|
|
|
|||||
| Income before income taxes |
152,951 | 27,104 | ||||||
| Income tax benefit (expense) |
(1,619 | ) | (107 | ) | ||||
|
|
|
|
|
|||||
| Net income |
151,332 | 26,997 | ||||||
| Net income (loss) attributable to noncontrolling interest |
49,830 | (2,701 | ) | |||||
|
|
|
|
|
|||||
| Net income (loss) attributable to Memorial Resource Development LLC |
$ | 101,502 | $ | 29,698 | ||||
|
|
|
|
|
|||||
| Net income (loss) attributable to members |
$ | 90,712 | $ | (7,620 | ) | |||
| Net income (loss) attributable to previous owners (Note 1) |
10,790 | 37,318 | ||||||
|
|
|
|
|
|||||
| Net income (loss) attributable to Memorial Resource Development LLC |
$ | 101,502 | $ | 29,698 | ||||
|
|
|
|
|
|||||
| Income before income taxes |
152,951 | 27,104 | ||||||
| Pro forma provision for income taxes (Note 2) |
(55,154 | ) | (9,592 | ) | ||||
|
|
|
|
|
|||||
| Pro forma net income |
$ | 97,797 | $ | 17,512 | ||||
|
|
|
|
|
|||||
| Pro forma basic and diluted earnings per share |
||||||||
| Pro forma basic and diluted weighted average shares outstanding |
||||||||
See Accompanying Notes to Consolidated and Combined Financial Statements.
F-23
Table of Contents
MEMORIAL RESOURCE DEVELOPMENT LLC (PREDECESSOR)
STATEMENTS OF CONSOLIDATED AND COMBINED CASH FLOWS
(In thousands)
| For Year Ended December 31, | ||||||||
| 2013 | 2012 | |||||||
| Cash flows from operating activities: |
||||||||
| Net income |
$ | 151,332 | $ | 26,997 | ||||
| Adjustments to reconcile net income to net cash provided by operating activities: |
||||||||
| Depreciation, depletion, and amortization |
184,717 | 138,672 | ||||||
| Impairment of oil and natural gas properties |
6,600 | 28,871 | ||||||
| (Gain) loss on derivative instruments |
(29,533 | ) | (29,323 | ) | ||||
| Cash settlements on derivative instruments |
30,403 | 72,045 | ||||||
| Premiums paid for derivatives |
— | (411 | ) | |||||
| Deferred income tax expense (benefit) |
76 | (312 | ) | |||||
| Amortization of loan origination costs |
8,343 | 3,584 | ||||||
| Accretion of senior notes net discount |
554 | — | ||||||
| Amortization of investment premium |
— | 194 | ||||||
| Accretion of asset retirement obligations |
5,581 | 5,009 | ||||||
| Amortization of MEMP equity awards |
3,557 | 1,423 | ||||||
| (Gain) loss on sale of properties |
(85,621 | ) | (9,761 | ) | ||||
| Non-cash compensation expense |
1,057 | — | ||||||
| Exploration costs |
181 | 6,980 | ||||||
| Changes in operating assets and liabilities: |
||||||||
| Accounts receivable |
(15,758 | ) | (7,382 | ) | ||||
| Prepaid expenses and other |
(2,986 | ) | (1,574 | ) | ||||
| Payables and accrued liabilities |
19,320 | 5,392 | ||||||
|
|
|
|
|
|||||
| Net cash provided by operating activities |
277,823 | 240,404 | ||||||
|
|
|
|
|
|||||
| Cash flows from investing activities: |
||||||||
| Acquisition of oil and natural gas properties |
(105,762 | ) | (360,678 | ) | ||||
| Additions to oil and gas properties |
(360,015 | ) | (273,334 | ) | ||||
| Additions to restricted investments |
(5,361 | ) | (4,599 | ) | ||||
| Additions to other property and equipment |
(2,670 | ) | (2,674 | ) | ||||
| Additions to restricted cash |
(49,347 | ) | (3 | ) | ||||
| Proceeds from the sale of oil and gas properties |
155,712 | 34,521 | ||||||
| Other |
— | 29 | ||||||
|
|
|
|
|
|||||
| Net cash used in investing activities |
(367,443 | ) | (606,738 | ) | ||||
|
|
|
|
|
|||||
| Cash flows from financing activities: |
||||||||
| Advances on revolving credit facility |
1,132,755 | 619,450 | ||||||
| Payments on revolving credit facility |
(1,766,037 | ) | (251,569 | ) | ||||
| Loan origination fees |
(41,175 | ) | (3,501 | ) | ||||
| Borrowings under second lien credit facility |
325,000 | — | ||||||
| Proceeds from the issuances of senior notes |
1,031,563 | — | ||||||
| Purchase of additional interests in consolidated subsidiaries |
(15,135 | ) | — | |||||
| Contributions from previous owners |
1,214 | 44,072 | ||||||
| Proceeds from changes in ownership interests of MEMP |
135,012 | — | ||||||
| Proceeds from MEMP public equity offering |
511,204 | 202,573 | ||||||
| Costs incurred in conjunction with MEMP public equity offering |
(21,066 | ) | (8,268 | ) | ||||
| Contributions from NGP affiliates related to sale of properties |
2,013 | 45,158 | ||||||
| Distributions to Members |
(732,362 | ) | — | |||||
| Distributions to noncontrolling interests |
(78,083 | ) | (15,208 | ) | ||||
| Distribution to NGP affiliates (see Note 1) |
(355,494 | ) | (242,174 | ) | ||||
| Distributions made by previous owners |
(4,005 | ) | (28,772 | ) | ||||
| Cash retained by previous owners |
(7,909 | ) | — | |||||
| Other |
455 | — | ||||||
|
|
|
|
|
|||||
| Net cash provided by financing activities |
117,950 | 361,761 | ||||||
|
|
|
|
|
|||||
| Net change in cash and cash equivalents |
28,330 | (4,573 | ) | |||||
| Cash and cash equivalents, beginning of year |
49,391 | 53,964 | ||||||
|
|
|
|
|
|||||
| Cash and cash equivalents, end of year |
$ | 77,721 | $ | 49,391 | ||||
|
|
|
|
|
|||||
| Supplemental cash flows: |
||||||||
| Cash paid for interest |
$ | 61,140 | $ | 23,525 | ||||
| Noncash investing and financing activities: |
||||||||
| Change in capital expenditures in payables and accrued liabilities |
41,017 | 17,158 | ||||||
| Assumptions of asset retirement obligations related to properties acquired or drilled |
4,227 | 7,962 | ||||||
| Contribution of oil and gas properties from NGP affiliate |
— | 6,893 | ||||||
| Accrued distribution to NGP affiliates related to Cinco Group acquisition |
4,352 | — | ||||||
| Contribution related to sale of assets to NGP affiliate—restricted cash |
— | 2,013 | ||||||
| Accrued equity offering costs |
— | 171 | ||||||
| Distributions to noncontrolling interests |
— | 47 | ||||||
See Accompanying Notes to Consolidated and Combined Financial Statements.
F-24
Table of Contents
MEMORIAL RESOURCE DEVELOPMENT LLC (PREDECESSOR)
STATEMENTS OF CONSOLIDATED AND COMBINED EQUITY
(In thousands)
| Members’ Equity | ||||||||||||||||
| Previous | Noncontrolling | |||||||||||||||
| Members | Owners | Interest | Total | |||||||||||||
| Balance January 1, 2012 |
$ | 853,436 | $ | 261,340 | $ | 161,588 | $ | 1,276,364 | ||||||||
| Net income (loss) |
(7,620 | ) | 37,318 | (2,701 | ) | 26,997 | ||||||||||
| Contributions |
— | 44,072 | — | 44,072 | ||||||||||||
| Contribution of oil and gas properties from NGP affiliate |
— | 6,893 | — | 6,893 | ||||||||||||
| Net proceeds from MEMP public equity offering |
— | — | 194,134 | 194,134 | ||||||||||||
| Distributions |
— | (28,772 | ) | (15,255 | ) | (44,027 | ) | |||||||||
| Net book value of net assets acquired from affiliates (Note 12) |
52,217 | (93,696 | ) | 41,479 | — | |||||||||||
| Amortization of MEMP equity awards |
— | — | 1,423 | 1,423 | ||||||||||||
| Noncontrolling interest’s share of net book value in excess of consideration received from sale of assets to MEMP |
727 | — | (727 | ) | — | |||||||||||
| Contribution related to sale of assets to NGP affiliate |
6,291 | 40,138 | 742 | 47,171 | ||||||||||||
| Net book value of assets acquired by NGP affiliate |
(579 | ) | (33,859 | ) | (68 | ) | (34,506 | ) | ||||||||
| Distribution to affiliate in connection with acquisition of assets |
(134,964 | ) | — | (107,210 | ) | (242,174 | ) | |||||||||
| Impact from equity transactions of MEMP |
41,930 | — | (41,930 | ) | — | |||||||||||
| Other |
176 | (1 | ) | 187 | 362 | |||||||||||
|
|
|
|
|
|
|
|
|
|||||||||
| Balance December 31, 2012 |
811,614 | 233,433 | 231,662 | 1,276,709 | ||||||||||||
| Net income (loss) |
90,712 | 10,790 | 49,830 | 151,332 | ||||||||||||
| Contributions |
— | 1,214 | — | 1,214 | ||||||||||||
| Net proceeds from MEMP public equity offering |
— | — | 490,138 | 490,138 | ||||||||||||
| Sale of MEMP common units |
60,701 | — | 74,311 | 135,012 | ||||||||||||
| Distributions |
(732,362 | ) | (4,005 | ) | (78,083 | ) | (814,450 | ) | ||||||||
| Net book value of net assets acquired from affiliates (Note 12) |
50,751 | (181,556 | ) | 130,805 | — | |||||||||||
| Amortization of MEMP equity awards |
— | — | 3,557 | 3,557 | ||||||||||||
| Noncontrolling interest’s share of cash consideration received in excess of the net book value sold to MEMP |
(24 | ) | — | 24 | — | |||||||||||
| Distribution to affiliate in connection with acquisition of assets |
(98,180 | ) | — | (253,055 | ) | (351,235 | ) | |||||||||
| Purchase of noncontrolling interests |
(303 | ) | — | (14,832 | ) | (15,135 | ) | |||||||||
| Impact from equity transactions of MEMP |
54,183 | — | (54,183 | ) | — | |||||||||||
| Other |
94 | (2,299 | ) | 441 | (1,764 | ) | ||||||||||
| Net assets retained by previous owners |
— | (17,246 | ) | — | (17,246 | ) | ||||||||||
|
|
|
|
|
|
|
|
|
|||||||||
| Balance December 31, 2013 |
$ | 237,186 | $ | 40,331 | $ | 580,615 | $ | 858,132 | ||||||||
|
|
|
|
|
|
|
|
|
|||||||||
See Accompanying Notes Consolidated and Combined Financial Statements.
F-25
Table of Contents
MEMORIAL RESOURCE DEVELOPMENT LLC (PREDECESSOR)
NOTES TO CONSOLIDATED AND COMBINED FINANCIAL STATEMENTS
Note 1. Background, Organization and Basis of Presentation
Background & Organization
Memorial Resource Development LLC (“Memorial Resource”) is a Delaware limited liability company (the “Company”) formed on April 27, 2011 by Natural Gas Partners VIII, L.P. (“NGP VIII”), Natural Gas Partners IX, L.P. (“NGP IX”) and NGP IX Offshore Holdings, L.P. (“NGP IX Offshore”) (collectively, the “Funds”) to own, acquire, exploit and develop oil and natural gas properties. The Funds are private equity funds managed by Natural Gas Partners (“NGP”). Unless the context requires otherwise, references to “we,” “us,” “our,” or “the Company” are intended to mean the business and operations of Memorial Resource Development LLC and its consolidated subsidiaries.
These financial statements have been prepared in anticipation of a proposed initial public offering (the “Offering”) of the common stock of Memorial Resource Development Corp. (“MRDC”). In connection with the closing of the Offering, Memorial Resource will contribute its ownership interests in all of its directly owned subsidiaries except for BlueStone Natural Resources Holdings, LLC (“BlueStone Holdings”) as well as two immaterial subsidiaries that were recently formed, 5,360,912 subordinated units representing limited partner interests in Memorial Production Partners LP (“MEMP”), and 50% of the incentive distribution rights of MEMP in exchange for shares of common stock of MRDC. MRDC will become a subsidiary of Memorial Resource. Memorial Resource’s consolidated and combined financial statements represent MRDC’s predecessor for accounting and financial reporting purposes.
At December 31, 2013, BlueStone Holdings’ total assets were less than 1% of consolidated total assets and the MRD Segment’s total assets. BlueStone Holdings’ total revenues were approximately 3% of consolidated total revenues and 7% of the MRD Segment’s total revenues for the year ended December 31, 2013. BlueStone Holdings’ production volumes were approximately 2% of consolidated production volumes and 4% of the MRD Segment’s production volumes for the year ended December 31, 2013.
As of December 31, 2013, Memorial Resource’s significant consolidating subsidiaries consisted of the following:
| • | Memorial Production Partners GP LLC (“MEMP GP”), a wholly-owned subsidiary, owns a 0.1% general partner interest in MEMP represented by 61,300 general partner units as of December 31, 2013. MEMP is a publicly traded Delaware limited partnership, the common units of which are listed on the NASDAQ Global Market under the symbol “MEMP.” MEMP was formed in April 2011 to own and acquire oil and natural gas properties in North America and completed its initial public offering on December 14, 2011. MEMP’s business activities are conducted through its wholly-owned subsidiary Memorial Production Operating LLC (“OLLC”) and its subsidiaries. All of OLLC’s consolidating subsidiaries are wholly-owned either directly or indirectly, except for one indirect majority-owned subsidiary. At December 31, 2013, Memorial Resource owned all of the 5,360,912 subordinated units outstanding. The Funds collectively indirectly own 50% of MEMP’s incentive distribution rights (“IDRs”). Memorial Resource owns the remaining IDRs. MEMP’s assets consist primarily of producing oil and natural gas properties and are located in Texas, Louisiana, Colorado, Wyoming, New Mexico, and offshore Southern California. |
| • | Black Diamond Minerals, LLC (“Black Diamond”), a wholly-owned subsidiary, together with its majority-owned subsidiary are engaged in the exploration, development, production, and operations of oil and natural gas properties located in Colorado, Oklahoma, and Wyoming. |
| • | BlueStone Holdings, a majority-owned subsidiary, together with its consolidated subsidiaries (collectively, “BlueStone”) are engaged in the exploration, development, production, and operations of oil |
F-26
Table of Contents
MEMORIAL RESOURCE DEVELOPMENT LLC (PREDECESSOR)
NOTES TO CONSOLIDATED AND COMBINED FINANCIAL STATEMENTS
| and natural gas properties located in Texas. As of December 31, 2013, Memorial Resource owned an 89.45% membership interest in BlueStone Holdings and other individuals owned the remaining membership interests. All of BlueStone Holdings’ consolidating subsidiaries are wholly-owned either directly or indirectly. |
| • | Classic Hydrocarbons Holdings, L.P. (“Classic”), an indirect wholly-owned subsidiary, together with its consolidated subsidiaries are engaged in the exploration, development, production, and sale of oil and natural gas primarily in East Texas and Louisiana. As of December 31, 2013, Classic Hydrocarbons GP CO., L.L.C. (“Classic GP”) owned a 0.41% general partner interest in Classic and Memorial Resource owned a 99.59% limited partner interest in Classic. All of Classic’s consolidating subsidiaries are wholly-owned either directly or indirectly. As of December 31, 2013, Memorial Resource owned a 100% membership interest in Classic GP. |
| • | WildHorse Resources, LLC (“WildHorse”), a majority-owned subsidiary, together with its wholly-owned subsidiary are engaged in the acquisition, exploitation, and development of natural gas and crude oil properties located in Louisiana and Texas. As of December 31, 2013, Memorial Resource owned a 99.89% membership interest in WildHorse and other individuals owned the remaining membership interests. In connection with the closing of the Offering, the remaining membership interests will be contributed to MRDC and incentive units held by certain members of management will be exchanged for shares of common stock of MRDC and cash consideration. |
| • | Beta Operating Company, LLC (“Beta Operating”), a wholly-owned subsidiary, employs those employees who operate and support MEMP’s offshore Southern California oil and gas properties. Beta Operating was contributed to Memorial Resource by MEMP in December 2012. This entity was formerly owned by an affiliate of NGP. MEMP’s acquisition of Beta Operating in December 2012 and the subsequent contribution to Memorial Resource were accounted for as common control transactions at historical cost. |
| • | Memorial Resource Finance Corp. (“MRD Finance Corp.”), a wholly-owned subsidiary, has no material assets or any liabilities other than as a co-issuer of our debt securities. Its activities will be limited to co-issuing our debt securities and engaging in other activities incidental thereto. |
MEMP acquired certain oil and natural gas producing properties in East Texas from Tanos Energy, LLC (“Tanos”) on April 2, 2012. Prior to April 1, 2013, Memorial Resource owned a 98.94% membership interest in Tanos. On April 1, 2013, Memorial Resource purchased the remaining membership interest in Tanos (see Note 11). MEMP acquired certain oil and natural gas producing properties in East Texas from Classic on May 14, 2012; acquired all of the outstanding membership interests in WHT Energy Partners LLC (“WHT”) from WildHorse and Tanos on March 28, 2013; acquired all the outstanding membership interests in Prospect Energy, LLC (“Prospect Energy”) from Black Diamond on October 1, 2013; and acquired all of the outstanding membership interests in Tanos from Memorial Resource on October 1, 2013; acquired certain of the oil and natural gas properties in Jackson County, Texas (the “MRD Assets”) from Memorial Resource on October 1, 2013; acquired certain oil and natural gas producing properties in East Texas from WildHorse on April 1, 2014. These intercompany transactions have been eliminated in preparation of our consolidated and combined financial statements.
References to “previous owners” for accounting and financial reporting purposes refer collectively to:
| • | Rise Energy Operating, LLC and its wholly-owned subsidiaries (except for Rise Energy Operating, Inc.) (“REO”) from February 3, 2009 (inception) through the date of acquisition. MEMP acquired REO, which owns certain operating interests in producing and non-producing oil and gas properties offshore Southern California, in December 2012 from Rise Energy Partners, LP (“Rise”). Beta Operating was a wholly-owned subsidiary of Rise Energy Operating, LLC until it was contributed to Memorial Resource by MEMP in December 2012. Rise is primarily owned by two of the Funds. |
F-27
Table of Contents
MEMORIAL RESOURCE DEVELOPMENT LLC (PREDECESSOR)
NOTES TO CONSOLIDATED AND COMBINED FINANCIAL STATEMENTS
| • | Certain oil and natural gas properties and related assets primarily in the Permian Basin, East Texas and the Rockies that MEMP acquired through equity transactions on October 1, 2013 from certain affiliates of NGP. On October 1, 2013, MEMP acquired Boaz Energy, LLC (“Boaz”), Crown Energy Partners, LLC (“Crown”), the Crown net profits interest and overriding royalty interest (“Crown NPI/ORRI”), Propel Energy SPV LLC (“Propel SPV”), together with its wholly-owned subsidiary Propel Energy Services, LLC (“Propel Energy Services”), and Stanolind Oil and Gas SPV LLC (“Stanolind SPV”) from: (a) Boaz Energy Partners, LLC (“Boaz Energy Partners”), Crown Energy Partners Holdings, LLC (“Crown Holdings”), Propel Energy, LLC (“Propel Energy”) and Stanolind Oil and Gas LP (“Stanolind”), all of which are primarily owned by two of the Funds. |
| • | A net profits interest that WildHorse purchased from NGP Income Co-Investment Fund II, L.P. (“NGPCIF”) on February 28, 2014 (“NGPCIF NPI”). NGPCIF is controlled by NGP. Upon the completion of the 2010 Petrohawk and Clayton Williams acquisitions, WildHorse sold a net profits interest in these properties to NGPCIF (see Note 12). Since WildHorse sold the net profits interest, the historical results are accounted for as a working interest for all periods. |
Basis of Presentation
Our consolidated financial statements include our accounts and those of our majority-owned subsidiaries in which we have a controlling interest. Likewise, the combined financial statements include those of the previous owners for the periods that those entities were under common control.
All material intercompany transactions and balances have been eliminated in preparation of our consolidated and combined financial statements. The accompanying consolidated and combined financial statements have been prepared in accordance with accounting principles generally accepted in the United States of America (“GAAP”). In the opinion of management, all adjustments necessary for a fair presentation of the financial statements have been made. Certain amounts in the prior year financial statements have been reclassified to conform to the presentation in the current year financial statements.
We have two reportable business segments, both of which are engaged in the acquisition, exploitation, development and production of oil and natural gas properties (See Note 13). Our reportable business segments are as follows:
| • | MRD—reflects the combined operations of Memorial Resource, WildHorse and its previous owners, Classic and Classic GP, Black Diamond, BlueStone, Beta Operating and MEMP GP. |
| • | MEMP—reflects the combined operations of MEMP, its previous owners, and any dropdown transactions between MEMP and other Memorial Resource subsidiaries. |
Segment financial information has been retrospectively revised for the following common control transactions between MEMP and other Memorial Resource subsidiaries for comparability purposes:
| • | acquisition by MEMP of all the outstanding membership interests in Tanos for a purchase price of approximately $77.4 million on October 1, 2013; |
| • | acquisition by MEMP of all the outstanding membership interests in Prospect Energy for a purchase price of approximately $16.3 million on October 1, 2013; |
| • | acquisition by MEMP of all the outstanding membership interests in WHT for a purchase price of approximately $200.0 million on March 28, 2013; |
| • | acquisition by MEMP of certain assets from Classic in East Texas in May 2012 for a purchase price of approximately $27.0 million; and |
F-28
Table of Contents
MEMORIAL RESOURCE DEVELOPMENT LLC (PREDECESSOR)
NOTES TO CONSOLIDATED AND COMBINED FINANCIAL STATEMENTS
| • | acquisition by MEMP of certain assets from Tanos in East Texas in April 2012 for a purchase price of approximately $18.5 million. |
Note 2. Summary of Significant Accounting Policies
Use of Estimates
The preparation of consolidated and combined financial statements in conformity with GAAP requires management to make estimates and assumptions that affect the reported amounts of assets and liabilities and disclosure of contingent assets and liabilities at the date of the consolidated and combined financial statements and the reported amounts of revenues and expenses during the reporting period. Actual results could differ from those estimates.
Significant estimates include, but are not limited to, oil and natural gas reserves; depreciation, depletion, and amortization of proved oil and natural gas properties; future cash flows from oil and natural gas properties; impairment of long-lived assets; fair value of derivatives; fair value of equity compensation; fair values of assets acquired and liabilities assumed in business combinations and asset retirement obligations.
Principles of Consolidation and Combination
Our consolidated financial statements include our accounts and those of our majority-owned subsidiaries in which we have a controlling interest. Likewise, the combined financial statements include those of the previous owners. All material intercompany balances and transactions have been eliminated.
Cash and Cash Equivalents
Cash and cash equivalents represent unrestricted cash on hand and all highly liquid investments with original contractual maturities of three months or less.
Concentrations of Credit Risk
Cash balances, accounts receivable, restricted investments and derivative financial instruments are financial instruments potentially subject to credit risk. Cash and cash equivalents are maintained in bank deposit accounts which, at times, may exceed the federally insured limits. Management periodically reviews and assesses the financial condition of the banks to mitigate the risk of loss. Various restricted investment accounts fund certain long-term contractual and regulatory asset retirement obligations and collateralize certain regulatory bonds associated with the offshore Southern California oil and gas properties. These restricted investments consist of money market deposit accounts, money market mutual funds, commercial paper, and U.S. Government securities, all held with credit-worthy financial institutions. Derivative financial instruments are generally executed with major financial institutions that expose us to market and credit risks and which may, at times, be concentrated with certain counterparties. The credit worthiness of the counterparties is subject to continual review. We rely upon netting arrangements with counterparties to reduce credit exposure. We have not experienced any losses from such instruments.
Oil and natural gas are sold to a variety of purchasers, including intrastate and interstate pipelines or their marketing affiliates and independent marketing companies. Accounts receivable from joint operations are from a number of oil and natural gas companies, partnerships, individuals, and others who own interests in the properties operated by us and our predecessor. Generally, operators of crude oil and natural gas properties have the right to offset future revenues against unpaid charges related to operated wells, minimizing the credit risk associated with these receivables. Additionally, management believes that any credit risk imposed by a
F-29
Table of Contents
MEMORIAL RESOURCE DEVELOPMENT LLC (PREDECESSOR)
NOTES TO CONSOLIDATED AND COMBINED FINANCIAL STATEMENTS
concentration in the oil and natural gas industry is mitigated by the creditworthiness of its customer base. An allowance for doubtful accounts is recorded after all reasonable efforts have been exhausted to collect or settle the amount owed. Any amounts outstanding longer than the contractual terms are considered past due. Management determined that an allowance for uncollectible accounts was unnecessary at both December 31, 2013 and 2012, respectively.
If we were to lose any one of our customers, the loss could temporarily delay production and the sale of oil and natural gas in the related producing region. If we were to lose any single customer, we believe that a substitute customer to purchase the impacted production volumes could be identified.
Oil and Natural Gas Properties
Oil and natural gas exploration, development and production activities are accounted for in accordance with the successful efforts method of accounting. Under this method, costs of acquiring properties, costs of drilling successful exploration wells, and development costs are capitalized. The costs of exploratory wells are initially capitalized pending a determination of whether proved reserves have been found. At the completion of drilling activities, the costs of exploratory wells remain capitalized if determination is made that proved reserves have been found. If no proved reserves have been found, the costs of each of the related exploratory wells are charged to expense. In some cases, a determination of proved reserves cannot be made at the completion of drilling, requiring additional testing and evaluation of the wells. The costs of such exploratory wells are expensed if a determination of proved reserves has not been made within a twelve-month period after drilling is complete. Exploration costs such as geological, geophysical, and seismic costs are expensed as incurred.
As exploration and development work progresses and the reserves on these properties are proven, capitalized costs attributed to the properties are subject to depreciation and depletion. Depletion of capitalized costs is provided using the units-of-production method based on proved oil and gas reserves related to the associated field. Capitalized drilling and development costs of producing oil and natural gas properties are depleted over proved developed reserves and leasehold costs are depleted over total proved reserves.
On the sale or retirement of a complete or partial unit of a proved property or pipeline and related facilities, the cost and related accumulated depreciation, depletion, and amortization are removed from the property accounts, and any gain or loss is recognized.
There were no material capitalized exploratory drilling costs pending evaluation at December 31, 2013 and December 31, 2012.
Impairments
Proved oil and natural gas properties are reviewed for impairment when events and circumstances indicate a possible decline in the recoverability of the carrying value of such properties, such as a downward revision of the reserve estimates, less than expected production, drilling results, higher operating and development costs, or lower commodity prices. The estimated undiscounted future cash flows expected in connection with the property are compared to the carrying value of the property to determine if the carrying amount is recoverable. If the carrying value of the property exceeds its estimated undiscounted future cash flows, the carrying amount of the property is reduced to its estimated fair value using Level 3 inputs. The factors used to determine fair value include, but are not limited to, estimates of proved reserves, future commodity prices, the timing of future production and capital expenditures and a discount rate commensurate with the risk reflective of the lives remaining for the respective oil and gas properties. Impairment expense for the years ended December 31, 2013 and 2012 was approximately $6.6 million and $28.9 million, respectively.
F-30
Table of Contents
MEMORIAL RESOURCE DEVELOPMENT LLC (PREDECESSOR)
NOTES TO CONSOLIDATED AND COMBINED FINANCIAL STATEMENTS
Nonproducing oil and natural gas properties, which consist of undeveloped leasehold costs and costs associated with the purchase of proved undeveloped reserves, are assessed for impairment on a property-by-property basis. If the assessment indicates an impairment, a loss is recognized by providing a valuation allowance. The impairment assessment is affected by economic factors such as the results of exploration activities, commodity price outlooks, remaining lease terms, and potential shifts in business strategy employed by management.
Asset Retirement Obligations
An asset retirement obligation associated with retiring long-lived assets is recognized as a liability on a discounted basis in the period in which the legal obligation is incurred and becomes determinable, with an equal amount capitalized as an addition to oil and natural gas properties, which is allocated to expense over the useful life of the asset. Generally, oil and gas producing companies incur such a liability upon acquiring or drilling a well. Accretion expense is recognized over time as the discounted liabilities are accreted to their expected settlement value. Upon settlement of the liability, a gain or loss is recognized as a component of exploration costs to the extent the actual costs differ from the recorded liability. See Note 6 for further discussion of asset retirement obligations.
Oil and Gas Reserves
The estimates of proved oil and natural gas reserves utilized in the preparation of the consolidated and combined financial statements are estimated in accordance with the rules established by the SEC and the Financial Accounting Standards Board (“FASB”). These rules require that reserve estimates be prepared under existing economic and operating conditions using a trailing 12-month average price with no provision for price and cost escalations in future years except by contractual arrangements. Netherland, Sewell & Associates, Inc. (“NSAI”), our independent reserve engineers, was engaged to prepare our reserves estimates at December 31, 2013.
Reserve estimates are inherently imprecise. Accordingly, the estimates are expected to change as more current information becomes available. It is possible that, because of changes in market conditions or the inherent imprecision of reserve estimates, the estimates of future cash inflows, future gross revenues, the amount of oil and natural gas reserves, the remaining estimated lives of oil and natural gas properties, or any combination of the above may be increased or reduced. Increases in recoverable economic volumes generally reduce per unit depletion rates while decreases in recoverable economic volumes generally increase per unit depletion rates.
Other Property & Equipment
Other property and equipment is stated at historical costs and is comprised primarily of vehicles, furniture, fixtures, and computer hardware and software. Depreciation of other property and equipment is calculated using the straight-line method generally based on estimated useful lives of three to five years.
Restricted Investments
Various restricted investment accounts fund certain long-term contractual and regulatory asset retirement obligations and collateralize certain regulatory bonds associated with the offshore Southern California oil and gas properties. These investments are classified as held-to-maturity, and such investments are stated at amortized cost. Interest earned on these investments is included in interest expense – net in the statement of operations. The amortized cost of such investments is adjusted for amortization of premiums and accretion of discounts to maturity. Such amortization and accretion is displayed as a separate line item in the statement of operations. At December 31, 2013, these restricted investments consisted of money market deposit accounts, money market mutual funds, commercial paper, and U.S. Government securities. See Note 7 for additional information.
F-31
Table of Contents
MEMORIAL RESOURCE DEVELOPMENT LLC (PREDECESSOR)
NOTES TO CONSOLIDATED AND COMBINED FINANCIAL STATEMENTS
Debt Issuance Costs
These costs are recorded on the balance sheet and amortized over the term of the associated debt using the straight-line method which approximates the effective yield method. Amortization expense, including write-offs of debt issuance costs, for the years ended December 31, 2013 and 2012 was approximately $8.3 million and $3.6 million, respectively.
Revenue Recognition
Revenue from the sale of oil and natural gas is recognized when title passes, net of royalties due to third parties. Oil and natural gas revenues are recorded using the sales method. Under this method, revenues are recognized based on actual volumes of oil and natural gas sold to purchasers, regardless of whether the sales are proportionate to our ownership in the property. An asset or a liability is recognized to the extent that we have an imbalance in excess of our proportionate share of the remaining recoverable reserves on the underlying properties. No significant imbalances existed at December 31, 2013 or 2012.
The following individual customers each accounted for 10% or more of total reported revenues for the period indicated:
| Years Ending December 31, |
||||||||
| 2013 | 2012 | |||||||
| Consolidated & Combined: |
||||||||
| Energy Transfer Equity, L.P. and subsidiaries |
35 | % | 13 | % | ||||
| MRD Segment: |
||||||||
| Energy Transfer Equity, L.P. and subsidiaries |
77 | % | 39 | % | ||||
| Sunoco, Inc.(1) |
n/a | 15 | % | |||||
| Dominion Gas Ventures LP |
n/a | 15 | % | |||||
| MEMP Segment: |
||||||||
| Phillips 66(2) |
15 | % | 13 | % | ||||
| ConocoPhillips(2) |
n/a | 14 | % | |||||
| (1) | Sunoco, Inc. became a subsidiary of Energy Transfer Equity, L.P. in October 2012. |
| (2) | Phillips 66 was a subsidiary of ConocoPhillips through April 30, 2012. Accordingly, any revenues generated from Phillips 66 prior to May 1, 2012 were reported under ConocoPhillips. |
Derivative Instruments
Commodity derivative financial instruments (e.g., swaps, floors, collars, and put options) are used to reduce the impact of natural gas and oil price fluctuations. Interest rate swaps are used to manage exposure to interest rate volatility, primarily as a result of variable rate borrowings under the credit facilities. Every derivative instrument is recorded on the balance sheet as either an asset or liability measured at its fair value. Changes in the derivative’s fair value are recognized in earnings as we have not elected hedge accounting for any of our derivative positions.
Income Tax
We are organized as a pass-through entity for federal income tax purposes. As a result, our members are responsible for federal income taxes on their share of our taxable income. Certain of our consolidated subsidiaries are taxed as corporations and subject to federal income taxes. We are also subject to the Texas margin tax and certain aspects of the tax make it similar to an income tax as the tax is assessed on 1% of taxable margin apportioned to operations in Texas. Deferred taxes arise due to temporary differences between the
F-32
Table of Contents
MEMORIAL RESOURCE DEVELOPMENT LLC (PREDECESSOR)
NOTES TO CONSOLIDATED AND COMBINED FINANCIAL STATEMENTS
financial statement carrying value of existing assets and liabilities and their respective tax basis. Deferred tax liabilities as of December 31, 2013 were approximately $3.2 million and total tax expense for the year was approximately $1.6 million. Deferred tax liabilities as of December 31, 2012 were approximately $3.1 million and total tax expense for the year was approximately $0.1 million.
We must recognize the tax effects of any uncertain tax positions we may adopt if the position taken by us is more likely than not sustainable based on its technical merits. If a tax position meets such criteria, the tax effect that would be recognized by us would be the largest amount of benefit with more than a 50% chance of being realized. There were no uncertain tax positions that required recognition in the financial statements at December 31, 2013 or 2012.
Upon closing of the Offering, MRDC will be treated as a taxable C corporation and will be subject to federal and certain state income taxes. Accordingly, a pro forma income tax provision has been disclosed as if Memorial Resource was a taxable corporation for all periods presented. Pro forma tax expense was computed using a blended corporate level federal and state tax rate of 36.06% and 35.39% for the years ended December 31, 2013 and 2012, respectively.
Unaudited Pro Forma Earnings Per Share
Memorial Resource has presented pro forma earnings per share (“EPS”) for all periods presented. Pro forma net income (loss) per basic share is determined by dividing the pro forma net income (loss) available to common shareholders by the number of common shares expected to be outstanding immediately following the Offering.
The following sets forth the calculation of pro forma EPS for the periods indicated (in thousands, except per share amounts):
| For the Year Ended December 31, | ||||||||
| 2013 | 2012 | |||||||
| Numerator: |
||||||||
| Pro forma net income (loss) |
$ | 97,797 | $ | 17,512 | ||||
| Noncontrolling interest in pro forma net (income) loss, net of tax |
(31,861 | ) | 1,745 | |||||
| Previous owners interest in pro forma net (income) loss, net of tax |
(6,899 | ) | (24,111 | ) | ||||
|
|
|
|
|
|||||
| Pro forma net income (loss) available to common shareholders |
$ | 59,037 | $ | (4,854 | ) | |||
|
|
|
|
|
|||||
| Denominator: |
||||||||
| Common shares outstanding immediately following the Offering |
||||||||
|
|
|
|
|
|||||
| Basic and diluted EPS |
$ | $ | ||||||
|
|
|
|
|
|||||
F-33
Table of Contents
MEMORIAL RESOURCE DEVELOPMENT LLC (PREDECESSOR)
NOTES TO CONSOLIDATED AND COMBINED FINANCIAL STATEMENTS
The following sets forth the calculation of our supplemental pro forma EPS, for the periods indicated (in thousands, except per share amounts):
| For the Year Ended December 31, | ||||||||
| 2013 | 2012 | |||||||
| Numerator: |
||||||||
| Pro forma net income (loss) |
$ | 97,797 | $ | 17,512 | ||||
| Noncontrolling interest in pro forma net (income) loss, net of tax |
(31,861 | ) | 1,745 | |||||
|
|
|
|
|
|||||
| Pro forma net income (loss) available to common shareholders |
$ | 65,936 | $ | 19,257 | ||||
|
|
|
|
|
|||||
| Denominator: |
||||||||
| Common shares outstanding immediately following the Offering |
||||||||
|
|
|
|
|
|||||
| Basic and diluted EPS |
$ | $ | ||||||
|
|
|
|
|
|||||
Our supplemental basic and diluted EPU includes all the earnings generated by the previous owners for all periods presented due to common control considerations.
Unit-Based Compensation Arrangements
The fair value of equity-classified awards (e.g., restricted common unit awards) is amortized to earnings over the requisite service or vesting period. Compensation expense for liability-classified awards are recognized over the requisite service or vesting period of an award based on the fair value of the award re-measured at each reporting period. Generally, no compensation expense is recognized for equity instruments that do not vest.
The governing documents of Memorial Resource and certain of its subsidiaries, including WildHorse and BlueStone, provide for the issuance of incentive units. The incentive units are subject to performance conditions that affect their vesting. Compensation cost is recognized only if the performance condition is probable of being satisfied at each reporting date.
See Note 10 and 11 for further information.
Current Accrued Liabilities
Current accrued liabilities consisted of the following at the dates indicated (in thousands):
| December 31, | ||||||||
| 2013 | 2012 | |||||||
| Accrued capital expenditures |
$ | 48,579 | $ | 14,352 | ||||
| Accrued lease operating expense |
13,240 | 6,701 | ||||||
| Accrued general and administrative expenses |
14,485 | 2,290 | ||||||
| Accrued ad valorem and production taxes |
3,541 | 3,753 | ||||||
| Accrued interest payable |
11,934 | 1,239 | ||||||
| Accrued environmental |
577 | 1,012 | ||||||
| Other miscellaneous, including operator advances |
5,774 | 4,140 | ||||||
|
|
|
|
|
|||||
| $ | 98,130 | $ | 33,487 | |||||
|
|
|
|
|
|||||
New Accounting Pronouncements
Offsetting Disclosure Requirements. In December 2011, the FASB issued an accounting standard update intended to enhance current disclosure requirements on offsetting financial assets and liabilities. In January 2013,
F-34
Table of Contents
MEMORIAL RESOURCE DEVELOPMENT LLC (PREDECESSOR)
NOTES TO CONSOLIDATED AND COMBINED FINANCIAL STATEMENTS
the FASB issued an accounting standard update to clarify the scope of offsetting disclosure requirements. The new disclosure requirements required the disclosure of both gross and net information about derivatives, repurchase agreements and reverse purchase agreements, and securities borrowing and securities lending transactions eligible for offset on the balance sheet or subject to a master netting arrangement or similar agreement. Disclosure of collateral received and posted in connection with master netting agreements or similar arrangements is also required. The disclosures became effective for annual and interim periods beginning on or after January 1, 2013 and were applied retrospectively. The adoption of this new guidance did not have a significant impact on our financial statements.
Note 3. Acquisitions and Divestitures
The third party acquisitions discussed below were accounted for under the acquisition method of accounting. Accordingly, we conducted assessments of net assets acquired and recognized amounts for identifiable assets acquired and liabilities assumed at their estimated acquisition date fair values, while acquisition costs associated with the acquisitions were expensed as incurred. The operating revenues and expenses of acquired properties are included in the accompanying financial statements from their respective closing dates forward. The transactions were financed through capital contributions and borrowings under credit facilities.
The fair values of oil and natural gas properties are measured using valuation techniques that convert future cash flows to a single discounted amount. Significant inputs to the valuation of oil and natural properties include estimates of: (i) economic reserves; (ii) future operating and development costs; (iii) future commodity prices; and (iv) a market-based weighted average cost of capital.
MEMP has consummated several common control acquisitions since completing its initial public offering in December 2011, as further discussed in Note 12, from certain affiliates of NGP. These acquisitions were each accounted for as a transaction between entities under common control, similar to a pooling of interests, whereby the net assets acquired were recorded at historical cost.
Acquisition-related costs
Acquisition-related costs for both related party and third party transactions are included in general and administrative expenses in the accompanying statements of operations for the periods indicated below (in thousands):
| For the Year Ended December 31, |
||||||
| 2013 |
2012 |
|||||
| $8,313 |
$4,538 | |||||
2013 Acquisitions
On March 18, 2013, a purchase and sale agreement was executed by WildHorse for the purchase of certain oil and gas properties and leases in Louisiana from a third party (‘‘Louisiana Acquisition’’). The final adjusted purchase price was $67.1 million. This transaction closed on April 30, 2013. The following table summarizes the fair value of the third party assets acquired and liabilities assumed as of the acquisition date (in thousands):
| Louisiana Acquisition |
||||
| Oil and gas properties |
$ | 68,887 | ||
| Asset retirement obligations |
(1,789 | ) | ||
|
|
|
|||
| Total identifiable net assets |
$ | 67,098 | ||
|
|
|
|||
F-35
Table of Contents
MEMORIAL RESOURCE DEVELOPMENT LLC (PREDECESSOR)
NOTES TO CONSOLIDATED AND COMBINED FINANCIAL STATEMENTS
MEMP closed two separate transactions during the year ended December 31, 2013 to acquire certain oil and natural gas properties from third parties in East Texas (the “East Texas Acquisition”) and the Rockies (the “Rockies Acquisition”) for approximately $29.4 million in aggregate. The East Texas Acquisition closed on September 6, 2013 and the Rockies Acquisition closed on August 30, 2013. The following table summarizes the fair value of the third party assets acquired and liabilities assumed as of each acquisition date (in thousands):
| East Texas Acquisition |
Rockies Acquisition |
|||||||
| Oil and gas properties |
$ | 9,974 | $ | 20,744 | ||||
| Asset retirement obligations |
(78 | ) | (1,163 | ) | ||||
| Accrued liabilities |
— | (118 | ) | |||||
|
|
|
|
|
|||||
| Total identifiable net assets |
$ | 9,896 | $ | 19,463 | ||||
|
|
|
|
|
|||||
Propel Energy also acquired incremental interests in certain oil and gas properties and leases in the Hendrick Field located in Winkler County, Texas from two third parties in three separate transactions for approximately $9.3 million.
2012 Acquisitions
Third Party. On May 1, 2012, MEMP and WildHorse jointly acquired operating and non-operating interests in certain oil and natural gas properties located in East Texas and North Louisiana from an undisclosed third party seller (“Undisclosed Seller Acquisition”) for a final net purchase price of approximately $112.1 million. These properties are located primarily in Polk County, Texas and Lincoln and Claiborne Parishes, Louisiana. During the year ended December 31, 2012, approximately $22.1 million of revenue and $9.2 million of earnings were recorded in the statement of operations related to the Undisclosed Seller Acquisition subsequent to the closing date.
On September 28, 2012, MEMP acquired certain oil and natural gas properties in East Texas from Goodrich Petroleum Corporation (“Goodrich Acquisition”) for a final net purchase price of $90.4 million after customary post-closing adjustments. The effective date of this transaction was July 1, 2012. This transaction was financed with borrowings under MEMP’s revolving credit facility. These properties are located in the East Henderson field of Rusk County, Texas. During the year ended December 31, 2012, approximately $4.6 million of revenue and $2.0 million of earnings were recorded in the statement of operations related to the Goodrich Acquisition subsequent to the closing date.
Collectively, the previous owners consummated multiple acquisitions during 2012 by acquiring operating and non-operating interests in certain oil and natural gas properties primarily located in various Texas and New Mexico counties for an aggregate adjusted purchase price of $147.9 million, the largest of which was completed in July by Stanolind. In July 2012, Stanolind completed an acquisition of working interests, royalty interests and net revenue interests (the “Menemsha Acquisition”) located in various counties in Texas for a final net purchase price of $74.7 million. During the year ended December 31, 2012, approximately $4.9 million of revenue and $0.9 million of earnings were recorded in the statement of operations related to the Menemsha Acquisition subsequent to the closing date.
F-36
Table of Contents
MEMORIAL RESOURCE DEVELOPMENT LLC (PREDECESSOR)
NOTES TO CONSOLIDATED AND COMBINED FINANCIAL STATEMENTS
The following table summarizes the fair value of the assets acquired and liabilities assumed as of each acquisition date (in thousands).
| Undisclosed Seller Acquisition |
Goodrich Acquisition |
Menemsha Acquisition |
Other Previous Owner Acquisitions |
|||||||||||||
| Oil and gas properties |
$ | 115,633 | $ | 91,187 | $ | 75,114 | $ | 77,764 | ||||||||
| Prepaid expenses and other current assets |
— | 425 | — | — | ||||||||||||
| Revenues payable |
(1,602 | ) | (875 | ) | — | — | ||||||||||
| Asset retirement obligations |
(1,592 | ) | (161 | ) | (408 | ) | (4,558 | ) | ||||||||
| Accrued liabilities |
(297 | ) | (153 | ) | — | — | ||||||||||
|
|
|
|
|
|
|
|
|
|||||||||
| Total identifiable net assets |
$ | 112,142 | $ | 90,423 | $ | 74,706 | $ | 73,206 | ||||||||
|
|
|
|
|
|
|
|
|
|||||||||
The following unaudited pro forma combined results of operations are provided for the year ended December 31, 2012 (in thousands) as though the Undisclosed Seller Acquisition, Goodrich Acquisition, and Menemsha Acquisition had been completed on January 1, 2011. The unaudited pro forma financial information was derived from our historical combined statements of operations and adjusted to include: (i) the revenues and direct operating expenses associated with oil and gas properties acquired, (ii) depletion expense applied to the adjusted basis of the properties acquired and (iii) interest expense on additional borrowings necessary to finance the acquisitions. The unaudited pro forma financial information does not purport to be indicative of results of operations that would have occurred had the transactions occurred on the basis assumed above, nor is such information indicative of expected future results of operations.
| Revenues |
431,061 | |||
| Net income |
40,940 |
During 2012, we also acquired certain interests in oil and gas properties through several individually immaterial acquisitions for an aggregate purchase price of $10.2 million.
Divestitures
On January 1, 2013, Tanos sold a natural gas gathering pipeline located in East Texas, which it had originally acquired in April 2010, to a privately held gas transportation company for a minimum of $1.5 million. The maximum allowable additional proceeds are $2.0 million. The contingent consideration is based on the natural gas pipeline servicing any new wells that Tanos drills in the area over the next three years. The contingent consideration portion of an arrangement is recorded when the consideration is determined to be realizable. Tanos recorded an aggregate gain of approximately $1.4 million related to this transaction, of which $0.4 million was contingent consideration. Tanos also sold certain non-operated oil and gas properties in 2013 for $2.9 million and recorded a gain of $1.4 million.
On May 10, 2013, Black Diamond entered into a purchase and sale agreement with a third party to sell certain of its Wyoming oil and gas properties with an estimated net book value of $39.8 million for $33.0 million, before customary adjustments. As a result, Black Diamond recorded a loss on the sale of $6.8 million. This transaction closed on June 4, 2013.
BlueStone entered into an agreement with a publicly traded third party to sell its remaining interest in certain properties in the Mossy Grove Prospect in Walker and Madison Counties located in East Texas. Total cash consideration received by BlueStone was approximately $117.9 million, which exceeded the net book value of the properties sold by $89.5 million. The transaction closed on July 31, 2013.
F-37
Table of Contents
MEMORIAL RESOURCE DEVELOPMENT LLC (PREDECESSOR)
NOTES TO CONSOLIDATED AND COMBINED FINANCIAL STATEMENTS
During 2012, certain of our subsidiaries sold certain interests in oil and gas properties for an aggregate $3.3 million. Losses of approximately $0.1 million were recognized related to these divestures.
The previous owners sold certain interests in oil and gas properties offshore Louisiana on October 11, 2012 for an aggregate $40.1 million to an NGP controlled entity, of which $38.1 million was received upon closing. As of December 31, 2012, the remaining proceeds were held in escrow and included in restricted cash on the balance sheet. The remaining proceeds were released from escrow in April 2013. Due to common control considerations, the proceeds from the sale exceeded the net book value of the properties sold by $6.3 million and recognized in the equity statement as a net contribution.
On July 11, 2012, the previous owners completed the sale of a portion of its oil and gas assets located in Garza County, Texas to a third party for $26.1 million and recognized a gain of approximately $7.6 million. On September 18, 2012, the previous owners completed the sale of a portion of its oil and gas assets located in Ector County, Texas to a third party for $4.7 million and recognized a gain of approximately $2.2 million.
The majority of the proceeds generated from these sales were used to acquire operating and non-operating interests in certain oil and natural gas properties located primarily in various Texas and New Mexico counties.
Note 4. Fair Value Measurements of Financial Instruments
Fair value is defined as the price that would be received to sell an asset or paid to transfer a liability in an orderly transaction between market participants at a specified measurement date. Fair value estimates are based on either (i) actual market data or (ii) assumptions that other market participants would use in pricing an asset or liability, including estimates of risk. A three-tier hierarchy has been established that classifies fair value amounts recognized or disclosed in the financial statements. The hierarchy considers fair value amounts based on observable inputs (Levels 1 and 2) to be more reliable and predictable than those based primarily on unobservable inputs (Level 3). The characteristics of fair value amounts classified within each level of the hierarchy are described as follows:
Level 1—Unadjusted quoted prices in active markets that are accessible at the measurement date for identical, unrestricted assets or liabilities. An active market is one in which transactions for the assets or liabilities occur in sufficient frequency and volume to provide pricing information on an ongoing basis.
Level 2—Quoted prices in markets that are not active, or inputs that are observable, either directly or indirectly, for substantially the full term of the asset or liability. Substantially all of these inputs are observable in the marketplace throughout the full term of the instrument, can be derived from observable data, or are supported by observable levels at which transactions are executed in the marketplace. At December 31, 2013 and 2012, all of the derivative instruments reflected on the accompanying balance sheets were considered Level 2.
Level 3—Measure based on prices or valuation models that require inputs that are both significant to the fair value measurement and are less observable from objective sources (i.e., supported by little or no market activity).
F-38
Table of Contents
MEMORIAL RESOURCE DEVELOPMENT LLC (PREDECESSOR)
NOTES TO CONSOLIDATED AND COMBINED FINANCIAL STATEMENTS
Assets and Liabilities Measured at Fair Value on a Recurring Basis
The carrying values of cash and cash equivalents, accounts receivables, accounts payables (including accrued liabilities) and amounts outstanding under long-term debt agreements included in the accompanying balance sheets approximated fair value at December 31, 2013 and 2012. The fair value estimates are based upon observable market data and are classified within Level 2 of the fair value hierarchy. These assets and liabilities are not presented in the following tables.
The fair market values of the derivative financial instruments reflected on the balance sheets as of December 31, 2013 and 2012 were based on estimated forward commodity prices and forward interest rate yield curves. Financial assets and liabilities are classified based on the lowest level of input that is significant to the fair value measurement in its entirety. The significance of a particular input to the fair value measurement requires judgment, and may affect the valuation of the fair value of assets and liabilities and their placement within the fair value hierarchy levels. The following table presents the derivative assets and liabilities that are measured at fair value on a recurring basis at December 31, 2013 and 2012 for each of the fair value hierarchy levels:
| Fair Value Measurements at December 31, 2013 Using | ||||||||||||||||
| Quoted Prices in Active Market (Level 1) |
Significant Other Observable Inputs (Level 2) |
Significant Unobservable Inputs (Level 3) |
Fair Value | |||||||||||||
| (in thousands) | ||||||||||||||||
| Assets: |
||||||||||||||||
| Commodity derivatives |
$ | — | $ | 105,054 | $ | — | $ | 105,054 | ||||||||
| Interest rate derivatives |
— | 884 | — | 884 | ||||||||||||
|
|
|
|
|
|
|
|
|
|||||||||
| Total assets |
$ | — | $ | 105,938 | $ | — | $ | 105,938 | ||||||||
|
|
|
|
|
|
|
|
|
|||||||||
| Liabilities: |
||||||||||||||||
| Commodity derivatives |
— | $ | 58,234 | — | $ | 58,234 | ||||||||||
| Interest rate derivatives |
— | 5,590 | — | 5,590 | ||||||||||||
|
|
|
|
|
|
|
|
|
|||||||||
| Total liabilities |
$ | — | $ | 63,824 | $ | — | $ | 63,824 | ||||||||
|
|
|
|
|
|
|
|
|
|||||||||
| Fair Value Measurements at December 31, 2012 Using | ||||||||||||||||
| Quoted Prices in Active Market (Level 1) |
Significant Other Observable Inputs (Level 2) |
Significant Unobservable Inputs (Level 3) |
Fair Value | |||||||||||||
| (in thousands) | ||||||||||||||||
| Assets: |
||||||||||||||||
| Commodity derivatives |
$ | — | $ | 95,586 | $ | — | $ | 95,586 | ||||||||
|
|
|
|
|
|
|
|
|
|||||||||
| Liabilities: |
||||||||||||||||
| Commodity derivatives |
— | $ | 45,938 | — | $ | 45,938 | ||||||||||
| Interest rate derivatives |
— | 6,838 | — | 6,838 | ||||||||||||
|
|
|
|
|
|
|
|
|
|||||||||
| Total liabilities |
$ | — | $ | 52,776 | $ | — | $ | 52,776 | ||||||||
|
|
|
|
|
|
|
|
|
|||||||||
See Note 5 for additional information regarding our derivative instruments.
F-39
Table of Contents
MEMORIAL RESOURCE DEVELOPMENT LLC (PREDECESSOR)
NOTES TO CONSOLIDATED AND COMBINED FINANCIAL STATEMENTS
Assets and Liabilities Measured at Fair Value on a Nonrecurring Basis
Certain assets and liabilities are reported at fair value on a nonrecurring basis as reflected on the balance sheets. The following methods and assumptions are used to estimate the fair values:
| • | The fair value of asset retirement obligations (“AROs”) is based on discounted cash flow projections using numerous estimates, assumptions, and judgments regarding such factors as the existence of a legal obligation for an ARO; amounts and timing of settlements; the credit-adjusted risk-free rate; and inflation rates. See Note 6 for a summary of changes in AROs. |
| • | If sufficient market data is not available, the determination of the fair values of proved and unproved properties acquired in transactions accounted for as business combinations are prepared by utilizing estimates of discounted cash flow projections. The factors to determine fair value include, but are not limited to, estimates of: (i) economic reserves; (ii) future operating and development costs; (iii) future commodity prices; and (iv) a market-based weighted average cost of capital. |
| • | Proved oil and natural gas properties are reviewed for impairment when events and circumstances indicate a possible decline in the recoverability of the carrying value of such properties. The factors used to determine fair value include, but are not limited to, estimates of proved reserves, future commodity prices, the timing of future production and capital expenditures and a discount rate commensurate with the risk reflective of the lives remaining for the respective oil and gas properties. |
| • | During the year ended December 31, 2013, we recognized $6.6 million of impairments. The impairments primarily related to certain properties located in South Texas. The estimated future cash flows expected from South Texas properties were compared to their carrying values and determined to be unrecoverable as a result of a downward revision of estimated proved reserves based on pricing terms specific to these properties. |
| • | During the year ended December 31, 2012, we recognized $28.9 million of impairments to proved oil and natural gas properties. Approximately $8.0 million related to a particular lease in the Elkhorn (Ellenburger) and Canyon Fields located in the Permian Basin as a result of a downward revision of estimated proved reserves due to unfavorable drilling results in the area. The remaining $20.9 million of impairments primarily related to certain fields in East Texas. The carrying values of these fields were determined to be unrecoverable due to a decline in gas prices. |
Note 5. Risk Management and Derivative Instruments
Derivative instruments are utilized to manage exposure to commodity price and interest rate fluctuations and achieve a more predictable cash flow in connection with natural gas and oil sales from production and borrowing related activities. These transactions limit exposure to declines in prices or increases in interest rates, but also limit the benefits that would be realized if prices increase or interest rates decrease.
Certain inherent business risks are associated with commodity and interest derivative contracts, including market risk and credit risk. Market risk is the risk that the price of natural gas or oil will change, either favorably or unfavorably, in response to changing market conditions. Credit risk is the risk of loss from nonperformance by the counterparty to a contract. It is our policy to enter into derivative contracts, including interest rate swaps, only with counterparties that are creditworthy financial institutions deemed by management as competent and competitive market makers. Each of the counterparties to our derivative contracts is a lender in our credit agreements. While collateral is generally not required to be posted by counterparties, credit risk associated with derivative instruments is minimized by limiting exposure to any single counterparty and entering into derivative instruments only with counterparties that are large financial institutions, which management believes present minimal credit risk. Additionally, master netting agreements are used to mitigate risk of loss due to default with counterparties on derivative instruments. We have also entered into the International Swaps and Derivatives
F-40
Table of Contents
MEMORIAL RESOURCE DEVELOPMENT LLC (PREDECESSOR)
NOTES TO CONSOLIDATED AND COMBINED FINANCIAL STATEMENTS
Association Master Agreements (“ISDA Agreements”) with each of our counterparties. The terms of the ISDA Agreements provide us and each of our counterparties with rights of set-off upon the occurrence of defined acts of default by either us or our counterparty to a derivative, whereby the party not in default may set-off all liabilities owed to the defaulting party against all net derivative asset receivables from the defaulting party. See Note 8 for additional information in regards to our revolving credit facilities.
Commodity Derivatives
A combination of commodity derivatives (e.g., floating-for-fixed swaps, collars, call spreads and basis swaps) is used to manage exposure to commodity price volatility. Generally, natural gas derivative contracts are entered into and indexed to NYMEX Henry Hub and regional indices that are in proximity to our areas of production. Generally, oil derivative contracts are entered into and indexed to NYMEX WTI, Inter-Continental Exchange (“ICE”) Brent and California Midway-Sunset. Our NGL derivative contracts are indexed to OPIS Mont Belvieu. At December 31, 2013, the MRD Segment had the following open commodity positions:
| 2014 | 2015 | 2016 | 2017 | |||||||||||||
| Natural Gas Derivative Contracts: |
||||||||||||||||
| Fixed price swap contracts: |
||||||||||||||||
| Average Monthly Volume (MMBtu) |
1,190,000 | 880,000 | 670,000 | 520,000 | ||||||||||||
| Weighted-average fixed price |
$ | 4.10 | $ | 4.19 | $ | 4.32 | $ | 4.45 | ||||||||
| Collar contracts: |
||||||||||||||||
| Average Monthly Volume (MMBtu) |
330,000 | 130,000 | — | — | ||||||||||||
| Weighted-average floor price |
$ | 4.09 | $ | 4.00 | $ | — | $ | — | ||||||||
| Weighted-average ceiling price |
$ | 5.24 | $ | 4.64 | $ | — | $ | — | ||||||||
| Basis swaps: |
||||||||||||||||
| Average Monthly Volume (MMBtu) |
270,000 | 180,000 | 220,000 | 200,000 | ||||||||||||
| Spread |
$ | (0.07 | ) | $ | (0.09 | ) | $ | (0.08 | ) | $ | (0.08 | ) | ||||
| Crude Oil Derivative Contracts: |
||||||||||||||||
| Fixed price swap contracts: |
||||||||||||||||
| Average Monthly Volume (Bbls) |
18,000 | 6,000 | — | — | ||||||||||||
| Weighted-average fixed price |
$ | 91.66 | $ | 88.50 | $ | — | $ | — | ||||||||
| Collar contracts: |
||||||||||||||||
| Average Monthly Volume (Bbls) |
8,000 | 2,000 | — | — | ||||||||||||
| Weighted-average floor price |
$ | 85.00 | $ | 85.00 | $ | — | $ | — | ||||||||
| Weighted-average ceiling price |
$ | 117.50 | $ | 101.35 | $ | — | $ | — | ||||||||
| NGL Derivative Contracts: |
||||||||||||||||
| Fixed price swap contracts: |
||||||||||||||||
| Average Monthly Volume (Bbls) |
18,000 | — | — | — | ||||||||||||
| Weighted-average fixed price |
$ | 64.27 | — | — | — | |||||||||||
F-41
Table of Contents
MEMORIAL RESOURCE DEVELOPMENT LLC (PREDECESSOR)
NOTES TO CONSOLIDATED AND COMBINED FINANCIAL STATEMENTS
At December 31, 2013, the MEMP Segment had the following open commodity positions:
| 2014 | 2015 | 2016 | 2017 | 2018 | 2019 | |||||||||||||||||||
| Natural Gas Derivative Contracts: |
||||||||||||||||||||||||
| Fixed price swap contracts: |
||||||||||||||||||||||||
| Average Monthly Volume (MMBtu) |
2,575,458 | 2,145,278 | 2,342,442 | 2,230,067 | 2,060,000 | 1,814,583 | ||||||||||||||||||
| Weighted-average fixed price |
$ | 4.34 | $ | 4.30 | $ | 4.42 | $ | 4.31 | $ | 4.52 | $ | 4.77 | ||||||||||||
| Collar contracts: |
||||||||||||||||||||||||
| Average Monthly Volume (MMBtu) |
340,000 | 350,000 | — | — | — | — | ||||||||||||||||||
| Weighted-average floor price |
$ | 4.93 | $ | 4.62 | $ | — | $ | — | $ | — | $ | — | ||||||||||||
| Weighted-average ceiling price |
$ | 6.12 | $ | 5.80 | $ | — | $ | — | $ | — | $ | — | ||||||||||||
| Call spreads(1): |
||||||||||||||||||||||||
| Average Monthly Volume (MMBtu) |
120,000 | 80,000 | — | — | — | — | ||||||||||||||||||
| Weighted-average sold strike price |
$ | 5.08 | $ | 5.25 | $ | — | $ | — | $ | — | $ | — | ||||||||||||
| Weighted-average bought strike price |
$ | 6.31 | $ | 6.75 | $ | — | $ | — | $ | — | $ | — | ||||||||||||
| Basis swaps: |
||||||||||||||||||||||||
| Average Monthly Volume (MMBtu) |
2,822,083 | — | — | — | — | — | ||||||||||||||||||
| Spread |
$ | (0.09 | ) | $ | — | $ | — | $ | — | $ | — | $ | — | |||||||||||
| Crude Oil Derivative Contracts: |
||||||||||||||||||||||||
| Fixed price swap contracts: |
||||||||||||||||||||||||
| Average Monthly Volume (Bbls) |
136,444 | 148,281 | 142,313 | 130,600 | 122,000 | 40,000 | ||||||||||||||||||
| Weighted-average fixed price |
$ | 95.82 | $ | 93.07 | $ | 86.85 | $ | 85.96 | $ | 85.62 | $ | 85.00 | ||||||||||||
| Collar contracts: |
||||||||||||||||||||||||
| Average Monthly Volume (Bbls) |
23,000 | 5,000 | — | — | — | — | ||||||||||||||||||
| Weighted-average floor price |
$ | 82.83 | $ | 80.00 | $ | — | $ | — | $ | — | $ | — | ||||||||||||
| Weighted-average ceiling price |
$ | 105.31 | $ | 94.00 | $ | — | $ | — | $ | — | $ | — | ||||||||||||
| Basis swaps: |
||||||||||||||||||||||||
| Average Monthly Volume (Bbls) |
57,292 | 57,500 | — | — | — | — | ||||||||||||||||||
| Spread |
$ | (9.21 | ) | $ | (9.73 | ) | $ | — | $ | — | $ | — | $ | — | ||||||||||
| NGL Derivative Contracts: |
||||||||||||||||||||||||
| Fixed price swap contracts: |
||||||||||||||||||||||||
| Average Monthly Volume (Bbls) |
118,500 | 112,800 | — | — | — | — | ||||||||||||||||||
| Weighted-average fixed price |
$ | 36.23 | $ | 35.04 | $ | — | $ | — | $ | — | $ | — | ||||||||||||
| (1) | These transactions were entered into for the purpose of eliminating the ceiling portion of certain collar arrangements, which effectively converted the applicable collars into swaps. |
F-42
Table of Contents
MEMORIAL RESOURCE DEVELOPMENT LLC (PREDECESSOR)
NOTES TO CONSOLIDATED AND COMBINED FINANCIAL STATEMENTS
Interest Rate Swaps
Periodically, we enter into interest rate swaps to mitigate exposure to market rate fluctuations by converting variable interest rates such as those in our credit agreement to fixed interest rates. Conditions sometimes arise where actual borrowings are less than notional amounts hedged which has and could result in over-hedged amounts from an economic perspective. From time to time we enter into offsetting positions to avoid being economically over-hedged. At December 31, 2013, we had the following interest rate swap open positions:
| Credit Facility (see Note 8) |
2014 | 2015 | 2016 | |||||||||
| MEMP Segment: |
||||||||||||
| Average Monthly Notional (in thousands) |
$ | 173,958 | $ | 280,833 | $ | 150,000 | ||||||
| Weighted-average fixed rate |
1.306 | % | 1.416 | % | 1.193 | % | ||||||
| Floating rate |
1 Month LIBOR | 1 Month LIBOR | 1 Month LIBOR | |||||||||
| MRD Segment: |
||||||||||||
| Average Monthly Notional (in thousands) |
$ | 118,750 | $ | 100,000 | $ | — | ||||||
| Weighted-average fixed rate |
0.773 | % | 0.758 | % | — | |||||||
| Floating rate |
1 Month LIBOR | 1 Month LIBOR | — | |||||||||
Balance Sheet Presentation
The following table summarizes the gross fair value of derivative instruments by the appropriate balance sheet classification even when the derivative instruments are subject to netting arrangements and qualify for net presentation on the balance sheet and the net recorded fair value as reflected on the balance sheet at December 31:
| Asset Derivatives | Liability Derivatives | |||||||||||||||||
| Type |
Balance Sheet Location |
2013 | 2012 | 2013 | 2012 | |||||||||||||
| (in thousands) | ||||||||||||||||||
| Commodity contracts |
Short-term derivative instruments | $ | 21,759 | $ | 48,901 | $ | 19,739 | $ | 8,072 | |||||||||
| Interest rate swaps |
Short-term derivative instruments | 845 | — | 3,287 | 3,575 | |||||||||||||
|
|
|
|
|
|
|
|
|
|||||||||||
| Gross fair value |
22,604 | 48,901 | 23,026 | 11,647 | ||||||||||||||
| Netting arrangements |
Short-term derivative instruments | (13,315 | ) | (6,980 | ) | (13,315 | ) | (6,980 | ) | |||||||||
|
|
|
|
|
|
|
|
|
|||||||||||
| Net recorded fair value |
Short-term derivative instruments | $ | 9,289 | $ | 41,921 | $ | 9,711 | $ | 4,667 | |||||||||
|
|
|
|
|
|
|
|
|
|||||||||||
| Commodity contracts |
Long-term derivative instruments | $ | 83,295 | $ | 46,685 | $ | 38,495 | $ | 37,866 | |||||||||
| Interest rate swaps |
Long-term derivative instruments | 39 | — | 2,303 | 3,263 | |||||||||||||
|
|
|
|
|
|
|
|
|
|||||||||||
| Gross fair value |
83,334 | 46,685 | 40,798 | 41,129 | ||||||||||||||
| Netting arrangements |
Long-term derivative instruments | (34,718 | ) | (29,506 | ) | (34,718 | ) | (29,506 | ) | |||||||||
|
|
|
|
|
|
|
|
|
|||||||||||
| Net recorded fair value |
Long-term derivative instruments | $ | 48,616 | $ | 17,179 | $ | 6,080 | $ | 11,623 | |||||||||
|
|
|
|
|
|
|
|
|
|||||||||||
F-43
Table of Contents
MEMORIAL RESOURCE DEVELOPMENT LLC (PREDECESSOR)
NOTES TO CONSOLIDATED AND COMBINED FINANCIAL STATEMENTS
Gains & Losses on Derivatives
We do not designate derivative instruments as hedging instruments for financial reporting purposes and neither did our predecessor. Accordingly, all gains and losses, including unrealized gains and losses from changes in the derivative instruments’ fair values, have been recorded in the accompanying statements of operations. The following table details the gains and losses related to derivative instruments for the years ending December 31, 2013 and 2012:
| Statements of Operations Location |
Years Ended December 31, |
|||||||||
| Derivative Instruments |
2013 | 2012 | ||||||||
| (in thousands) | ||||||||||
| Commodity derivative contracts |
(Gain) loss on commodity derivative instruments | $ | (29,294 | ) | $ | (34,905 | ) | |||
| Interest rate swaps |
Interest expense, net | (239 | ) | 5,582 | ||||||
Note 6. Asset Retirement Obligations
Asset retirement obligations primarily relate to our portion of future plugging and abandonment of wells and related facilities. The following table represents a reconciliation of the asset retirement obligations for the years ended December 31, 2013 and 2012:
| 2013 | 2012 | |||||||
| (in thousands) | ||||||||
| Asset retirement obligations at beginning of year |
$ | 102,380 | $ | 90,699 | ||||
| Liabilities added from acquisitions or drilling |
4,227 | 7,962 | ||||||
| Liabilities removed upon sale of wells |
(1,765 | ) | (1,931 | ) | ||||
| Liabilities removed upon plugging and abandoning |
(170 | ) | (119 | ) | ||||
| Accretion expense |
5,581 | 5,009 | ||||||
| Revision of estimates |
1,516 | 760 | ||||||
|
|
|
|
|
|||||
| Asset retirement obligations at end of year |
111,769 | 102,380 | ||||||
| Less: Current portion |
90 | 390 | ||||||
|
|
|
|
|
|||||
| Asset retirement obligations—long-term portion |
111,679 | 101,990 | ||||||
|
|
|
|
|
|||||
Note 7. Restricted Investments
Various restricted investment accounts fund certain long-term contractual and regulatory asset retirement obligations and collateralize certain regulatory bonds associated with the offshore Southern California oil and gas properties. The components of the restricted investment balance, which are all attributable to our MEMP Segment, are as follows at December 31:
| 2013 | 2012 | |||||||
| (in thousands) | ||||||||
| BOEM platform abandonment (See Note 14) |
$ | 66,373 | $ | 61,389 | ||||
| BOEM lease bonds |
794 | 776 | ||||||
| SPBPC Collateral: |
||||||||
| Contractual pipeline and surface facilities abandonment (See Note 14) |
2,306 | 1,959 | ||||||
| California State Lands Commission pipeline right-of-way bond |
3,005 | 3,000 | ||||||
| City of Long Beach pipeline facility permit |
500 | 500 | ||||||
| Federal pipeline right-of-way bond |
307 | 300 | ||||||
| Port of Long Beach pipeline license |
100 | 100 | ||||||
|
|
|
|
|
|||||
| Restricted investments |
$ | 73,385 | $ | 68,024 | ||||
|
|
|
|
|
|||||
F-44
Table of Contents
MEMORIAL RESOURCE DEVELOPMENT LLC (PREDECESSOR)
NOTES TO CONSOLIDATED AND COMBINED FINANCIAL STATEMENTS
Note 8. Long Term Debt
Our debt obligations under revolving credit facilities consisted of the following at December 31:
| 2013 | 2012 | |||||||
| (in thousands) | ||||||||
| MRD Segment: |
||||||||
| Memorial Resource $1.0 billion revolving credit facility, variable-rate, terminated December 2013 |
$ | — | $ | 80,000 | ||||
| 10.00%/10.75% senior PIK toggle notes due December 2018(1) |
350,000 | — | ||||||
| 10.00%/10.75% senior PIK toggle notes unamortized discounts |
(6,950 | ) | — | |||||
| WildHorse $1.0 billion revolving credit facility, variable-rate, due April 2018 |
203,100 | 202,200 | ||||||
| WildHorse $325.0 million second lien term facility, variable-rate, due December 2018 |
325,000 | — | ||||||
| Black Diamond $150.0 million revolving credit facility, variable-rate, terminated November 2013 |
— | 27,000 | ||||||
| BlueStone $150.0 million revolving credit facility, variable-rate, terminated August 2013 |
— | — | ||||||
|
|
|
|
|
|||||
| Subtotal |
871,150 | 309,200 | ||||||
|
|
|
|
|
|||||
| MEMP Segment: |
||||||||
| MEMP $2.0 billion revolving credit facility, variable-rate, due March 2018 |
103,000 | 371,000 | ||||||
| 7.625% senior notes, fixed-rate, due May 1, 2021(2) |
700,000 | — | ||||||
| 7.625% senior notes unamortized discounts |
(10,933 | ) | — | |||||
| WHT $400.0 million revolving credit facility, variable-rate, terminated March 2013 |
— | 89,300 | ||||||
| Tanos $250.0 million revolving credit facility, variable-rate, terminated April 2013 |
— | 25,250 | ||||||
| Stanolind $250.0 million revolving credit facility, variable-rate, due July 2017 |
— | 85,750 | ||||||
| Boaz $75.0 million revolving credit facility, variable-rate, terminated October 2013 |
— | 29,500 | ||||||
| Crown $75.0 million revolving credit facility, variable-rate, terminated October 2013 |
— | 13,882 | ||||||
| Propel Energy $200.0 million revolving credit facility, variable-rate, due June 2015 |
— | 15,500 | ||||||
|
|
|
|
|
|||||
| Subtotal |
792,067 | 630,182 | ||||||
|
|
|
|
|
|||||
| Total long-term debt |
$ | 1,663,217 | $ | 939,382 | ||||
|
|
|
|
|
|||||
| (1) | The estimated fair value of this fixed-rate debt was $348.3 million. The estimated fair value is based on quoted market prices and is classified as Level 2 within the fair value hierarchy. |
| (2) | The estimated fair value of this fixed-rate debt was $721.0 million. The estimated fair value is based on quoted market prices and is classified as Level 2 within the fair value hierarchy. |
Each of the revolving credit facilities contain customary covenants and restrictive provisions including but not limited to: (i) limitation on indebtedness and liens, (ii) limitations on restricted payments, (iii) limitation on investments and acquisitions, (iv) limitations on transactions with affiliates, (v) limitation on mergers, consolidation and asset sales, and (vi) limitations on commodity hedging and interest rate hedging. Each of the revolving credit facilities also includes financial maintenance covenants that require each borrower to meet certain financial performance criteria periodically (e.g., minimum interest coverage ratio and maximum leverage). The definitions and required ratios are set forth in each credit facility.
Each of the credit facilities contain customary and other events of default including but not limited to: (i) failure to make payments when due, (ii) breach of any covenants continuing beyond the cure period, (iii) default under any other material debt, (iv) change in management or change of control, and (v) certain material adverse effects on the business of the loan parties. Upon an event of default, revolving credit commitments could be terminated and any outstanding indebtedness under such revolving credit facility, together with accrued interest, fees and other obligations under such credit facility, could be declared immediately due and payable.
F-45
Table of Contents
MEMORIAL RESOURCE DEVELOPMENT LLC (PREDECESSOR)
NOTES TO CONSOLIDATED AND COMBINED FINANCIAL STATEMENTS
Borrowing Base
Credit facilities tied to borrowing bases are common throughout the oil and gas industry. Each of the revolving credit facilities borrowing base is subject to redetermination on at least a semi-annual basis primarily based on estimated proved reserves. The borrowing base for each credit facility was the following at December 31:
| 2013 | ||||
| (in thousands) | ||||
| MRD Segment: |
||||
| WildHorse $1.0 billion revolving credit facility, variable-rate, due April 2018 |
300,000 | |||
| MEMP Segment: |
||||
| MEMP $2.0 billion revolving credit facility, variable-rate, due March 2018 |
845,000 | |||
|
|
|
|||
| Total borrowing base |
1,145,000 | |||
|
|
|
|||
Weighted-Average Interest Rates
The following table presents the weighted-average interest rates paid on variable-rate debt obligations for the periods presented:
| For the
Year Ended December 31, |
||||||||
| Credit facility |
2013 | 2012 | ||||||
| MRD Segment: |
||||||||
| Memorial Resource |
3.17 | % | 4.11 | % | ||||
| Classic |
n/a | 4.50 | % | |||||
| WildHorse revolver |
2.30 | % | 3.00 | % | ||||
| WildHorse second lien |
7.60 | % | n/a | |||||
| Black Diamond |
3.97 | % | 3.62 | % | ||||
| BlueStone |
n/a | n/a | ||||||
| MEMP Segment: |
||||||||
| MEMP |
3.25 | % | 2.74 | % | ||||
| Tanos |
3.10 | % | 2.31 | % | ||||
| WHT |
2.29 | % | 2.60 | % | ||||
| REO |
n/a | 3.40 | % | |||||
| Stanolind |
3.52 | % | 3.76 | % | ||||
| Crown |
3.38 | % | 4.20 | % | ||||
| Propel Energy |
3.08 | % | 3.28 | % | ||||
Generally, borrowings under each revolving credit facility bear interest, at the borrower’s option, at either: (i) the Alternative Base Rate (as defined within each credit facility) plus a margin that varies according to the borrowing base usage (which is the ratio of outstanding borrowings and letters of credit to the borrowing base then in effect), or (ii) the applicable LIBOR plus a margin that varies according to the borrowing base usage. The unused portion of the borrowing base will be subject a commitment fee that may vary from 0.375% to 0.50% per annum according to the borrowing base usage.
Memorial Resource Revolving Credit Agreement & Senior Notes
On July 13, 2012, Memorial Resource entered into a two-year $50.0 million senior secured revolving credit facility with an initial borrowing base of $35.0 million. Memorial Resource pledged 7,061,294 of MEMP
F-46
Table of Contents
MEMORIAL RESOURCE DEVELOPMENT LLC (PREDECESSOR)
NOTES TO CONSOLIDATED AND COMBINED FINANCIAL STATEMENTS
common units and 5,360,912 of MEMP subordinated units as security under the revolving credit facility as well as its oil and gas properties and certain other assets of Memorial Resource. This revolving credit facility was also guaranteed by certain of Memorial Resource’s wholly-owned subsidiaries.
On November 20, 2012, Memorial Resource entered into a first amendment to its credit agreement, which among other things: (i) increased the aggregate maximum credit to $1.0 billion, (ii) increased the borrowing base to $120.0 million and (iii) extended the maturity date to November 20, 2016. On April 25, 2013, Memorial Resource entered into a second amendment to its credit agreement, which among other things: (i) increased the borrowing base to $170.0 million and (ii) designated Tanos together with its consolidating subsidiaries as additional guarantors. On October 1, 2013, Tanos and its consolidating subsidiaries were removed as guarantors and the borrowing base was reduced to $120.0 million. On November 1, 2013, Memorial Resource entered into a third amendment to its credit agreement, which among other things: (i) designated Black Diamond together with its consolidating subsidiaries as additional guarantors, (ii) reduced the borrowing base to $100.0 million, and (iii) permitted second lien indebtedness. On November 22, 2013, the borrowing base was automatically reduced to $60.0 million upon Memorial Resource’s sale of 7,061,294 MEMP common units in a secondary offering.
On December 18, 2013, indebtedness then outstanding under the revolving credit facility of $59.7 million and all accrued interest was paid off in full and the revolving credit facility was terminated in connection with the issuance of senior notes discussed below.
On December 18, 2013, Memorial Resource and its wholly-owned subsidiary, Memorial Resource Finance Corp. (“MRD Finance Corp.” and collectively, the “MRD Issuers”), completed a private placement of $350.0 million in aggregate principal amount of 10.00% / 10.75% Senior PIK Toggle Notes due 2018 (the “PIK notes”). The PIK notes were issued at 98% of par and will mature on December 15, 2018. Net proceeds from the private offering were used: (i) to repay all indebtedness then outstanding under Memorial Resource’s revolving credit facility, (ii) to establish a cash reserve of $50.0 million for the payment of interest on the PIK notes, (iii) to pay a $210.0 million distribution to the Funds, and (iv) for general company purposes.
Interest on the PIK notes will be payable semi-annually in arrears on June 15 and December 15 of each year, commencing on June 15, 2014. Subject to conditions in the indenture governing the PIK notes, Memorial Resource will be required to pay interest on the PIK notes in cash or through issuing additional notes (such an issuance, “PIK Interest”). The interest rate on the PIK notes is 10.00% per annum for interest paid in cash or 10.75% per annum for PIK Interest. PIK Interest will be paid by issuing additional notes having the same terms as the PIK notes. The PIK notes are subject to optional redemption at prices specified in the indenture plus accrued and unpaid interest, if any. The MRD Issuers may also be required to repurchase the PIK notes upon a change of control.
At the time the PIK notes were issued, all of Memorial Resource’s subsidiaries other than MEMP and BlueStone (and their respective subsidiaries) were designated as restricted subsidiaries. The indenture governing the PIK notes contains customary covenants and restrictive provisions that apply to both Memorial Resource and its restricted subsidiaries, many of which will terminate if at any time no default exists under the indenture and the PIK notes receive an investment grade rating from both of two specified ratings agencies. The PIK notes are fully and unconditionally guaranteed on a senior unsecured basis by all of Memorial Resource’s restricted subsidiaries, except MEMP GP, WildHorse and MRD Royalty LLC.
The indenture also provides for customary and other events of default. In the case of an event of default arising from certain events of bankruptcy or insolvency, all outstanding PIK notes will become due and payable immediately without further action or notice. If any other event of default occurs and is continuing, the trustee or the holders of at least 25% in principal amount of the then outstanding PIK notes may declare all the PIK notes to be due and payable immediately.
F-47
Table of Contents
MEMORIAL RESOURCE DEVELOPMENT LLC (PREDECESSOR)
NOTES TO CONSOLIDATED AND COMBINED FINANCIAL STATEMENTS
Classic Revolving Credit Facility
On November 1, 2007, Classic entered into a four-year, $150.0 million revolving credit facility, which was collateralized by its oil and gas properties. The revolving credit facility was amended on June 21, 2010 to extend the maturity date to June 21, 2014. On November 20, 2012, indebtedness then outstanding under the revolving credit facility of $80.0 million and all accrued interest was paid off in full with borrowings under the Memorial Resource revolving credit facility and the Classic revolving credit facility was terminated.
WildHorse Revolving Credit Facility & Second Lien Facility
On May 12, 2010, WildHorse entered into a revolving credit facility. Borrowings under the amended revolving credit facility are secured by liens on substantially all of WildHorse’s properties, but in any event, not less than 80% of the total value of the WildHorse’s oil and natural gas properties.
On April 3, 2013, WildHorse entered into an amended and restated credit agreement. The new revolving credit facility provides for aggregate maximum credit amounts at any time of $1.0 billion, consisting of borrowings and letters of credit and has an initial borrowing base of $300.0 million. The new revolving credit facility matures on April 13, 2018. The borrowing base is subject to redetermination on at least a semi-annual basis. Borrowings under the revolving credit facility are secured by liens on substantially all of WildHorse’s properties, but in any event, not less than 80% of the total value of the WildHorse’s oil and natural gas properties.
On June 13, 2013, WildHorse entered into a $325.0 million second lien term loan agreement and matures on December 13, 2018. No amount of second lien term loans once repaid may be reborrowed. Borrowings bear interest, at the borrower’s option, at either: (i) the Alternative Base Rate (as defined within each credit facility) plus 5.25% per annum or (ii) the applicable LIBOR plus 6.25% per annum. Borrowings under the second lien term loan agreement are secured by second-priority liens on substantially all of WildHorse’s properties, but in any event, not less than 80% of the total value of the WildHorse’s oil and natural gas properties. The priority of the security interests in the collateral and related creditors’ rights is set forth in an intercreditor agreement. The second lien term loan agreement contains customary affirmative and negative covenants, restrictive provisions and events of default.
On June 13, 2013, WildHorse borrowed $325.0 million under its second lien term loan agreement and used such borrowings to reduce outstanding indebtedness under its revolving credit facility and to pay a one-time special $225.0 million distribution to Memorial Resource. This $225.0 million distribution was subsequently distributed to NGP.
Black Diamond Revolving Credit Facility
On July 27, 2011, the Black Diamond entered into a second amended and restated revolving credit facility, which extended the maturity date of the original agreement to May 9, 2015. Borrowings under the revolving credit facility were collateralized by Black Diamond’s oil and natural gas properties. On November 1, 2013, the Black Diamond revolving credit facility was terminated. There was no indebtedness outstanding or accrued interest payable on such date.
BlueStone Revolving Credit Facility
On July 8, 2009, BlueStone entered into a $150.0 million revolving credit facility with various lenders. The line of credit was available until July 8, 2012, at which time all principal and accrued interest amounts would have been payable. On June 25, 2010, BlueStone refinanced its existing credit agreement and entered into a new
F-48
Table of Contents
MEMORIAL RESOURCE DEVELOPMENT LLC (PREDECESSOR)
NOTES TO CONSOLIDATED AND COMBINED FINANCIAL STATEMENTS
$150.0 million revolving credit facility. Amounts outstanding under this credit facility were payable on June 25, 2014. There were no amounts outstanding under these facilities at December 31, 2012. Borrowings under the revolving credit facility were secured by BlueStone’s assets and its equity interests in its subsidiaries. On August 27, 2013, the BlueStone revolving credit facility was terminated. There was no indebtedness outstanding or accrued interest payable on such date.
MEMP Revolving Credit Facility & Senior Notes
OLLC is a party to a $2.0 billion revolving credit facility, which is guaranteed by MEMP and certain of its current and future subsidiaries. A sixth amendment to the credit agreement was entered into on September 23, 2013, which among other things: (i) increased the facility from $1.0 billion to $2.0 billion and (ii) increased the borrowing base from $480.0 million to $920.0 million upon the closing of MEMP’s $603.0 million acquisition that closed October 1, 2013. The borrowing base was automatically reduced by $100.0 million in conjunction with the issuances of senior notes in April and May 2013 as discussed below in accordance with the terms of the credit facility. On October 10, 2013, the borrowing base was automatically reduced by $75.0 million in conjunction with the issuance of additional senior notes.
Borrowings under the revolving credit facility are secured by liens on substantially all of MEMP’s properties, but in any event, not less than 80% of the total value of the MEMP’s oil and natural gas properties, and all of MEMP’s equity interests in OLLC and any future guarantor subsidiaries (other than San Pedro Bay Pipeline Company) and all of MEMP’s other assets including personal property.
On April 17, 2013, MEMP and its wholly-owned subsidiary, Memorial Production Finance Corporation (“Finance Corp.” and collectively, the “Issuers”), completed a private placement of $300.0 million aggregate principal amount of 7.625% senior unsecured notes due 2021 (the “Senior Notes”). The Senior Notes were issued at 98.521% of par and are fully and unconditionally guaranteed (subject to customary release provisions) on a joint and several basis by all of the MEMP’s subsidiaries (other than Finance Corp., which is co-issuer of the Senior Notes, and certain immaterial subsidiaries). On May 23, 2013, the Issuers issued an additional $100.0 million aggregate principal amount of the Senior Notes at 102% of par. On October 10, 2013, the Issuers issued additional $300.0 million aggregate principal amounts at 97% of par. The Senior Notes will mature on May 1, 2021 with interest accruing at a rate of 7.625% per annum and payable semi-annually in arrears on May 1 and November 1 of each year, commencing November 1, 2013. The Senior Notes are governed by an indenture. The Senior Notes are subject to optional redemption at prices specified in the indenture plus accrued and unpaid interest, if any. The Issuers may also be required to repurchase the Senior Notes upon a change of control. The indenture contains customary covenants and restrictive provisions, many of which will terminate if at any time no default exists under the indenture and the Senior Notes receive an investment grade rating from both of two specified ratings agencies. The indenture also provides for customary and other events of default. In the case of an event of default arising from certain events of bankruptcy or insolvency with respect to either of the Issuers, all outstanding Senior Notes will become due and payable immediately without further action or notice. If any other event of default occurs and is continuing, the trustee or the holders of at least 25% in principal amount of the then outstanding Senior Notes may declare all the Senior Notes to be due and payable immediately. The Issuers have agreed pursuant to registration rights agreements to file an exchange offer registration statement or, under certain circumstances, a shelf registration statement with respect to the Senior Notes no later than April 17, 2014.
Tanos Revolving Credit Facility
On December 16, 2010, Tanos entered into an amended and restated credit agreement with various lenders, which consisted of a four-year, $250 million revolving credit facility, which was collateralized by Tanos’ oil and
F-49
Table of Contents
MEMORIAL RESOURCE DEVELOPMENT LLC (PREDECESSOR)
NOTES TO CONSOLIDATED AND COMBINED FINANCIAL STATEMENTS
gas properties. On April 1, 2013, indebtedness then outstanding under the revolving credit facility of $27.0 million was repaid and on April 25, 2013 all accrued interest was paid off in full and the Tanos revolving credit facility was terminated.
WHT Revolving Credit Facility
On April 8, 2011, WHT entered into a revolving credit facility. Borrowings under the revolving credit facility were secured by liens on substantially all of WHT’s properties, but in any event, not less than 80% of the total value of the WHT’s oil and natural gas properties. On March 28, 2013, the debt balance then outstanding under the revolving credit facility of $89.3 million and all accrued interest was paid off in full and the WHT revolving credit facility was terminated.
Stanolind Revolving Credit Facility
On September 9, 2010, Stanolind entered into a multi-year $50.0 million senior secured revolving credit agreement, which is collateralized by substantially all of Stanolind’s oil and gas properties. During 2012, the credit agreement was amended, which among other things: (i) increased the aggregate maximum credit to $250.0 million and (ii) increased the borrowing base to $75.0 million. The borrowing base was redetermined subsequent to the amendment date and set at $97.0 million. The maturity date of the credit facility was July 13, 2017. All of Stanolind’s indebtedness outstanding under the revolving credit facility was attributable to Stanolind SPV. On October 1, 2013, the debt balance then outstanding under the revolving credit facility and all accrued interest was paid off in full by MEMP on behalf of Stanolind.
Boaz Revolving Credit Facility
On August 1, 2011, Boaz entered into a multi-year $75.0 million senior secured revolving credit agreement, which was collateralized by substantially all of Boaz’s oil and gas properties. The maturity date of the credit facility was August 31, 2015. On October 1, 2013, the debt balance then outstanding under the revolving credit facility and all accrued interest was paid off in full and the Boaz revolving credit facility was terminated.
Crown Revolving Credit Facility
On January 28, 2010, Crown entered into a multi-year $75.0 million senior secured revolving credit agreement, which was collateralized by substantially all of Crown’s oil and gas properties. The maturity date of the credit facility was October 25, 2016. On October 1, 2013, the debt balance then outstanding under the revolving credit facility and all accrued interest was paid off in full and the Crown revolving credit facility was terminated.
Propel Energy Revolving Credit Facility
On June 15, 2011, Propel Energy entered into a multi-year $200.0 million senior secured revolving credit agreement, which was collateralized by substantially all of Propel Energy’s oil and gas properties. The maturity date of the credit facility was June 15, 2015. All of Propel Energy’s indebtedness outstanding under the revolving credit facility was attributable to Propel SPV. On October 1, 2013, the debt balance then outstanding under the revolving credit facility and all accrued interest was paid off in full by MEMP on behalf of Propel Energy.
REO Revolving Credit Facility
On October 26, 2011, REO entered into a three-year, $150.0 million revolving credit facility, which was collateralized by its assets. On December 12, 2012, indebtedness then outstanding under the revolving credit facility of $28.5 million and all accrued interest was paid off in full and the revolving credit facility was terminated.
F-50
Table of Contents
MEMORIAL RESOURCE DEVELOPMENT LLC (PREDECESSOR)
NOTES TO CONSOLIDATED AND COMBINED FINANCIAL STATEMENTS
Unamortized Deferred Financing Costs
Unamortized deferred financing costs associated with our combined debt obligations were as follows at December 31:
| 2013 | 2012 | |||||||
| (in thousands) | ||||||||
| MRD Segment: |
||||||||
| Memorial Resource revolving credit facility |
$ | — | $ | 653 | ||||
| PIK notes |
8,261 | — | ||||||
| Classic revolving credit facility |
— | 160 | ||||||
| WildHorse revolving credit facility |
2,436 | 921 | ||||||
| WildHorse second lien term loan |
9,030 | — | ||||||
| Black Diamond revolving credit facility |
— | 233 | ||||||
| MEMP Segment: |
||||||||
| MEMP revolving credit facility |
5,413 | 3,359 | ||||||
| Senior Notes |
15,053 | — | ||||||
| Tanos revolving credit facility |
— | 416 | ||||||
| WHT revolving credit facility |
— | 1,419 | ||||||
| Stanolind revolving credit facility |
— | 580 | ||||||
| Boaz revolving credit facility |
— | 153 | ||||||
| Crown revolving credit facility |
— | 96 | ||||||
| Propel Energy revolving credit facility |
— | 236 | ||||||
|
|
|
|
|
|||||
| $ | 40,193 | $ | 8,226 | |||||
|
|
|
|
|
|||||
Note 9. Noncontrolling Interests
Noncontrolling interests is the portion of equity ownership in our majority-owned subsidiaries not attributable to us and primarily consists of the equity interests held by: (i) the limited partners of MEMP, excluding units held by MRD; (ii) a third party investor in the San Pedro Bay Pipeline Company; and (iii) certain current or former key employees of certain of our subsidiaries.
Distributions paid to the limited partners of MEMP primarily represent the quarterly cash distributions paid to MEMP’s unitholders, excluding those paid to Memorial Resource.
Contributions received from limited partners of MEMP primarily represent net cash proceeds received from common unit offerings. On March 25, 2013, MEMP sold 9,775,000 of its common units in an underwritten equity offering, which generated net cash proceeds of approximately $171.8 million after deducting underwriting discounts and offering expenses. The net proceeds from this equity offering partially funded MEMP’s acquisition of all of the outstanding equity interests in WHT. On October 8, 2013, MEMP sold 16,675,000 of its common units in an underwritten equity offering, which generated net cash proceeds of approximately $318.3 million after deducting underwriting discounts and offering expenses. The net proceeds from this equity offering were used to repay a portion of outstanding borrowings under the MEMP revolving credit facility. In December 2012, MEMP sold 11,975,000 of its common units in an underwritten equity offering, which generated net cash proceeds of $194.3 million. The net proceeds from this equity offering partially funded MEMP’s December 2012 acquisition.
On April 1, 2013, Tanos’ management team sold its 1.066% interest in Tanos to Memorial Resource and all incentive units held were forfeited. See Note 11 for further information.
F-51
Table of Contents
MEMORIAL RESOURCE DEVELOPMENT LLC (PREDECESSOR)
NOTES TO CONSOLIDATED AND COMBINED FINANCIAL STATEMENTS
In connection with this sale, all of Tanos’ employees resigned and became employees of Tanos Exploration II, LLC (“Tanos II”), a Texas limited liability company controlled by the former management team of Tanos. Effective April 1, 2013, Tanos II entered into a transition services agreement with Tanos, whereby Tanos II would manage the operations of Tanos for up to a 6-month period of time. Tanos II is an unrelated entity.
On November 1, 2013, Memorial Resource purchased the noncontrolling interests in Black Diamond, Classic GP and Classic and all incentive units were forfeited. See Note 11 for further information.
In connection with the purchase of the remaining noncontrolling interests in Black Diamond, all of Black Diamond’s employees resigned and certain of them became members of DBD Partners, LLC (“DBD”), a Delaware limited liability company controlled by the former management team of Black Diamond. Effective November 1, 2013, DBD entered into a transition services agreement with Black Diamond, whereby DBD would manager the operations of Black Diamond for up to a 12 month period of time. DBD is an unrelated entity.
Note 10. Long-Term Incentive Plan
In December 2011, the Memorial Production Partners GP LLC Long-Term Incentive Plan (“LTIP”) was adopted for employees, officers, consultants and directors of MEMP GP and any of its affiliates, including Memorial Resource, who perform services for MEMP. The LTIP consists of restricted units, phantom units, unit options, unit appreciation rights, distribution equivalent rights, other unit-based awards and unit awards. The LTIP initially limits the number of common units that may be delivered pursuant to awards under the plan to 2,142,221 common units. Common units that are cancelled, forfeited or withheld to satisfy exercise prices or tax withholding obligations will be available for delivery pursuant to other awards. During the years ended December 31, 2013 and 2012, there were multiple awards of restricted common units that were granted under the LTIP to executive officers and independent directors of MEMP GP and other Memorial Resource employees who provide services for MEMP.
The restricted common units awarded are subject to restrictions on transferability, customary forfeiture provisions and graded vesting provisions. Award recipients have all the rights of a unitholder in MEMP with respect to the restricted common units, including the right to receive distributions thereon if and when distributions are made by MEMP to its unitholders (except with respect to the fourth quarter 2011 distribution that was paid in February 2012). The term “restricted common unit” represents a time-vested unit. Such awards are non-vested until the required service period expires.
Based on the market price per unit on the date of grant, the aggregate fair value of the restricted common units awarded to MEMP GP’s executive officers and other Memorial Resource employees during the years ended December 31, 2013 and 2012 was $9.7 million and $5.0 million, respectively. The restricted common units granted are accounted for as equity-classified awards. The grant-date fair value net of estimated forfeitures is recognized as compensation cost on a straight-line basis over the requisite service period. The fair value of the restricted unit awards granted to the independent directors of MEMP GP are also recognized as compensation cost on a straight-line basis over the requisite service period. The compensation costs associated with these awards are recorded as general and administrative expenses.
F-52
Table of Contents
MEMORIAL RESOURCE DEVELOPMENT LLC (PREDECESSOR)
NOTES TO CONSOLIDATED AND COMBINED FINANCIAL STATEMENTS
The following table summarizes information regarding restricted common unit awards for the periods presented:
| Number of Units |
Weighted Average Grant Date Fair Value per Unit(1) |
|||||||
| Restricted common units outstanding at January 1, 2012 |
— | $ | — | |||||
| Granted(2) |
287,943 | $ | 18.07 | |||||
| Forfeited |
(2,334 | ) | $ | 17.14 | ||||
|
|
|
|||||||
| Restricted common units outstanding at December 31, 2012 |
285,609 | $ | 18.08 | |||||
| Granted(3) |
524,718 | $ | 18.83 | |||||
| Forfeited |
(11,734 | ) | $ | 17.24 | ||||
| Vested |
(91,666 | ) | $ | 18.31 | ||||
|
|
|
|||||||
| Restricted common units outstanding at December 31, 2013 |
706,927 | $ | 18.62 | |||||
|
|
|
|||||||
| (1) | Determined by dividing the aggregate grant date fair value of awards by the number of awards issued. |
| (2) | The aggregate grant date fair value of restricted common unit awards issued in 2012 was $5.2 million based on grant date market prices of MEMP ranging from of $17.14 to $18.58 per unit. |
| (3) | The aggregate grant date fair value of restricted common unit awards issued in 2013 was $9.9 million based on grant date market prices of MEMP ranging from of $18.33 to $20.35 per unit. |
The unrecognized compensation cost associated with restricted common unit awards was an aggregate $9.9 million at December 31, 2013, which will be recognized over a weighted-average period of 2.2 years.
Since the restricted common units are participating securities of MEMP, any distributions received by the restricted common unitholders are reflected as a component of cash distributions to noncontrolling interest as presented on our statements of consolidated and combined cash flows. During the years ended December 31, 2013 and 2012, the restricted common unitholders received a distribution of approximately $1.0 million and $0.2 million, respectively.
Note 11. Incentive Units
Each of the governing documents of BlueStone Holdings, Tanos, WildHorse, Classic, Black Diamond and Memorial Resource either currently provide or previously provided for the issuance of incentive units. The incentive units are subject to performance conditions that affects their vesting. Compensation cost is recognized only if the performance condition is probable of being satisfied at each reporting date.
BlueStone Holdings, Tanos, WildHorse, Classic, Black Diamond and Memorial Resource each granted incentive units to certain of its members who were key employees at the time of grant. Holders of incentive units are entitled to distributions ranging from 10% to 31.5% when declared, but only after cumulative distribution thresholds (“payouts”) have been achieved. Payouts are generally triggered after the recovery of specified members’ capital contributions plus a rate of return. On December 14, 2011 and in connection with MEMP’s initial public offering, BlueStone Holdings’ Special Tier and Tier I unit holders vested in their respective awards. Tier I unit holders will participate in 16.5% of any future distributions made by BlueStone Holdings.
Vesting of the incentive units is generally dependent upon an explicit service period, a fundamental change as defined in the respective governing document, and achievement of payout. All incentive units not vested are forfeited if an employee is no longer employed. All incentive units will be forfeited if a holder resigns whether the incentive units are vested or not. If the payouts have not yet occurred, then all incentive units, whether or not vested, will be forfeited automatically (unless extended).
F-53
Table of Contents
MEMORIAL RESOURCE DEVELOPMENT LLC (PREDECESSOR)
NOTES TO CONSOLIDATED AND COMBINED FINANCIAL STATEMENTS
Except for the following, no compensation cost has been recorded related to incentive units for the years ended December 31, 2013 and 2012:
| • | During 2012, a special distribution of $9.5 million was approved and declared to the WildHorse incentive unit holders as an advance on a future potential final distribution. This special distribution was included in general and administrative expense in the accompanying statement of operations for the year ended December 31, 2012. |
| • | On April 1, 2013, Tanos’ management team sold its 1.066% interest in Tanos to Memorial Resource and all incentive units held were forfeited. Compensation expense of approximately $5.8 million was recorded by Tanos and recognized as general and administrative expense during April 2013. |
| • | Compensation expense of approximately $19.1 million was recorded by BlueStone and recognized as general and administrative expense during July 2013. Net proceeds generated from the sale of oil and gas properties (see Note 3) were used to pay the distribution. |
| • | On November 1, 2013, Memorial Resource purchased the noncontrolling interests in Black Diamond, Classic GP and Classic and all incentive units were forfeited. Total consideration remitted by Memorial Resource was approximately $28.5 million, of which $2.0 million is payable in quarterly installments commencing February 1, 2014. Compensation expense of approximately $12.6 million was recorded by Black Diamond, Classic GP and Classic in the aggregate and recognized as general and administrative expense during November 2013. |
| • | In connection with the PIK notes issued in December 2013, a special distribution of $10.0 million to holders of WildHorse’s Tier 1 incentive units was deemed probable of occurring. This amount was recognized as compensation expense in December 2013 with a corresponding amount in accrued liabilities on our balance sheet at December 31, 2013 as payment was not made until January 2, 2014. |
In connection with the Offering, certain former management members of WildHorse Resources will contribute their 0.1% membership interest in WildHorse as well as their incentive units in exchange for shares of common stock of MRDC and cash consideration. As such, WildHorse is expected to recognize additional compensation cost in 2014 upon the closing of the Offering.
Note 12. Related Party Transactions
Common Control Transactions between MEMP and Other Memorial Resource Subsidiaries
During the year ended December 31, 2012, MEMP acquired additional oil and natural gas properties from Tanos and Classic. MEMP acquired all of the outstanding membership interests in WHT from WildHorse and Tanos on March 28, 2013; acquired all the outstanding membership interests in Prospect Energy from Black Diamond on October 1, 2013; acquired all of the outstanding membership interests in Tanos from Memorial Resource on October 1, 2013; and acquired the MRD Assets from Memorial Resource on October 1, 2013. These intercompany transactions eliminate in preparation of our consolidated and combined financial statements.
Beta Acquisition
On December 12, 2012, MEMP acquired REO, which owns certain operating interests in producing and non-producing oil and gas properties offshore Southern California, from Rise for a purchase price of $270.6 million, which included $3.0 million of working capital and other customary adjustments. The Beta acquisition was funded with borrowings under MEMP’s revolving credit facility and the net proceeds generated
F-54
Table of Contents
MEMORIAL RESOURCE DEVELOPMENT LLC (PREDECESSOR)
NOTES TO CONSOLIDATED AND COMBINED FINANCIAL STATEMENTS
from its December 12, 2012 public offering of common units. The effective date for this transaction was September 1, 2012. The acquired properties, which are referred to as the Beta properties, primarily consist of a 51.75% working interest in three Pacific Outer Continental Shelf blocks covering the Beta Field, and are located in federal waters approximately eleven miles offshore the Port of Long Beach, California. Associated facilities include three conventional wellhead and production processing platforms, a 17.5-mile pipeline and an onshore tankage and metering facility. Two of the platforms are bridge connected and stand in approximately 260 feet of water, while the third platform stands in approximately 700 feet of water. This acquisition was accounted for as a combination of entities under common control at historical cost in a manner similar to the pooling of interest method. MEMP recorded the following net assets (in thousands):
| Cash and cash equivalents |
$ | 6,021 | ||
| Accounts receivable |
16,284 | |||
| Short-term derivative instruments, net |
2,926 | |||
| Prepaid expenses and other current assets |
4,521 | |||
| Oil and natural gas properties, net |
108,342 | |||
| Restricted investments |
68,009 | |||
| Accounts payable |
(9,092 | ) | ||
| Accrued liabilities |
(9,140 | ) | ||
| Asset retirement obligations |
(58,746 | ) | ||
| Credit facilities |
(28,500 | ) | ||
| Deferred tax liability |
(1,674 | ) | ||
| Noncontrolling interest |
(5,255 | ) | ||
|
|
|
|||
| Net assets |
$ | 93,696 | ||
|
|
|
An affiliate of REO collected a management fee for providing administrative services to REO. These administrative services included accounting, business development, finance, legal, information technology, insurance, government regulations, communications, regulatory, environmental and human resources services. REO incurred and paid management fees of $1.6 million during the year ended December 31, 2012. These management fees are presented as a component of general and administrative costs and expenses in the accompanying statements of operations.
F-55
Table of Contents
MEMORIAL RESOURCE DEVELOPMENT LLC (PREDECESSOR)
NOTES TO CONSOLIDATED AND COMBINED FINANCIAL STATEMENTS
October 2013 Cinco Group Acquisition
On October 1, 2013, MEMP acquired, through equity and asset transactions, oil and natural gas properties primarily in the Permian Basin, East Texas and the Rockies from Memorial Resource and certain affiliates of NGP for an aggregate preliminary purchase price of approximately $603 million (subject to customary post-closing adjustments), of which approximately $507.1 million was received by certain affiliates of NGP. We refer to this transaction as the “Cinco Group acquisition.” The Cinco Group acquisition was funded with borrowings under MEMP’s revolving credit facility. The Cinco Group acquisition was accounted for as a combination of entities under common control at historical cost in a manner similar to the pooling of interest method.
| Cash and cash equivalents |
$ | 2,820 | ||
| Accounts receivable |
5,184 | |||
| Prepaid expenses and other current assets |
1,454 | |||
| Oil and natural gas properties, net |
342,759 | |||
| Other long-term assets |
344 | |||
| Accounts payable |
(2,346 | ) | ||
| Revenue payable |
(2,910 | ) | ||
| Accrued liabilities |
(1,799 | ) | ||
| Short-term derivative instruments, net |
(1,828 | ) | ||
| Long-term derivative instruments, net |
(826 | ) | ||
| Asset retirement obligations |
(9,606 | ) | ||
| Credit facilities |
(151,690 | ) | ||
|
|
|
|||
| Net assets |
$ | 181,556 | ||
|
|
|
Net Profits Interest Sold to NGP
Upon the completion of the 2010 Petrohawk and Clayton Williams acquisitions, WildHorse sold a net profits interest in these properties to NGPCIF. Upon the acquisition of the Petrohawk properties WildHorse immediately sold a net profits interest of 6.25% for all producing well bores and the right to participate in a 3.125% net profits interest in non-producing wellbores for the subject area for $19.5 million, or $19.1 million after adjustments. Upon the acquisition of the Clayton Williams properties, WildHorse immediately sold a net profits interest of 23.5% for all producing wellbores and the right to participate in a 10.0% net profits interest in non-producing wellbores for the subject area for $19.8 million, or $19.9 million after adjustments. No gain or loss was recorded from these two transactions.
The net profits agreements for these transactions provide for a fixed fee of $20,000 per month for overhead and management in lieu of COPAS (Council of Petroleum Accountants Societies) billings. The net profits agreements do not provide for an overhead adjustment factor for this monthly charge, as suggested by COPAS. Quarterly net payments are made to NGPCIF for its net profits interest in the Petrohawk and Clayton Williams acquisitions. The net payments include credits for revenue receipts which are offset with production costs, capital expenditures and the management fee and are adjusted for any acquisition settlements received or paid and any other miscellaneous adjustments. As required by such agreements, WildHorse cannot collect funds owed by NGPCIF to WildHorse, but WildHorse can net amounts due from future quarterly payments.
As a result of these transactions, WildHorse paid NGPCIF a total of $2.6 million and $2.3 million during 2013 and 2012, respectively. NGPCIF owed WildHorse $0.2 million at December 31, 2013. WildHorse owed NGPCIF $0.4 million at December 31, 2012.
F-56
Table of Contents
MEMORIAL RESOURCE DEVELOPMENT LLC (PREDECESSOR)
NOTES TO CONSOLIDATED AND COMBINED FINANCIAL STATEMENTS
On February 28, 2014, WildHorse repurchased these net profits interests from NGPCIF for a purchase price $63.4 million after customary adjustments. This acquisition was accounted for as a combination of entities under common control at historical cost in a manner similar to the pooling of interest method and our consolidated and combined financial statements presented herein have been retrospectively revised.
WildHorse Management Services Agreement
WildHorse Resources II, LLC (“WHR II”) is an independent energy company engaged in the acquisition, exploitation, and development of natural gas and crude oil properties. WHR II is a related party and was organized in the State of Delaware on June 3, 2013. A management services agreement was executed on August 8, 2013, where WildHorse began providing general, administrative and employee services to WHR II. On August 8, 2013, a management agreement between WildHorse and WHR II was executed where WildHorse was appointed the manager for WHR II with responsibilities including administrative and land services, operator services and financial and accounting services. As operator, WildHorse receives operated and non-operated revenues on behalf of WHR II and bills and receives joint interest billings. In addition, WildHorse pays for lease operating expenses and drilling costs on behalf of WHR II. On August 8, 2013, an asset and cost sharing agreement between WildHorse and WHR II was executed. As part of the agreement, shared WildHorse costs are allocated between WildHorse and WHR II in accordance with a sharing ratio. The sharing ratio is based on the previous quarters capital expenditures and number of operated wells. Company specific costs are billed directly to the appropriate entity. As a result of these agreements, WildHorse received net payments of $4.4 million from WHR II during 2013. WildHorse owed WHR II $2.4 million as of December 31, 2013.
Cinco Group Transition Service Agreements
MEMP entered into transition service agreements with Propel Energy, Stanolind, and Boaz Energy Partners to ensure that ownership, operation, and maintenance of acquired properties can be smoothly transitioned. The term of these agreements are from October 1, 2013 through February 28, 2014. MEMP expects to pay transition service fees of approximately $0.8 million in the aggregate under these agreements.
Other
Effective March 1, 2012, BlueStone entered into an agreement with CH4 Energy III, LLC, an NGP controlled entity, to sell an undivided 25% interest in certain properties in the Mossy Grove Prospect in Walker and Madison Counties located in East Texas. Total cash consideration received by BlueStone was approximately $7.0 million, which exceeded the net book value of the properties sold by $6.4 million. Due to common control considerations, the $6.4 million was recognized in the equity statement as a contribution. The transaction closed on July 13, 2012.
A company affiliated with one of the Classic’s employees provided certain land-related services to Classic. Classic paid approximately $1.0 million to this company for these services in 2012.
Certain of the Cinco Group entities entered into an advisory service, reimbursement, and indemnification agreements with NGP. These agreements generally required that an annual advisory fee be paid to NGP. Fees paid under these agreements for the years ended December 31, 2013 and 2012 were approximately $0.3 million and $0.4 million, respectively. Certain of the Cinco Group entities also paid a financing fee equal to a percentage of the capital contributions raised by NGP. These fees were considered a syndication cost and reduced equity contributions for financing fees paid. Fees for the year ended December 31, 2012 was approximately $0.4 million. There were no fees for the year ended December 31, 2013.
F-57
Table of Contents
MEMORIAL RESOURCE DEVELOPMENT LLC (PREDECESSOR)
NOTES TO CONSOLIDATED AND COMBINED FINANCIAL STATEMENTS
During 2012, the previous owners received an equity contribution of $6.9 million of oil and gas properties in the Hendricks Field located in the Permian Basin of Texas by an NGP controlled entity. Due to common control considerations, this equity contribution was recorded at historical cost of the properties.
During 2012, Boaz reimbursed a member of its management team approximately $0.3 million in general, administrative, and lease operating expenses related to an oral lease agreement between the member of management and a third party for a field office and yard located in Bronte, Texas.
See Note 3 for additional information regarding the divestiture of certain interests in oil and gas properties offshore Louisiana that the previous owners sold during 2012 to an NGP controlled entity.
Note 13. Business Segment Data
Our reportable business segments are organized in a manner that reflects how management manages those business activities.
We have two reportable business segments, both of which are engaged in the acquisition, exploitation, development and production of oil and natural gas properties. Our reportable business segments are as follows:
| • | MRD—reflects the combined operations of Memorial Resource, WildHorse, Classic and Classic GP, Black Diamond, BlueStone, Beta Operating, and MEMP GP. |
| • | MEMP—reflects the combined operations of MEMP, including the previous owners and any dropdown transactions between MEMP and other Memorial Resource subsidiaries. See Note 1 for additional information regarding dropdown transactions between MEMP and other Memorial Resource subsidiaries. |
We evaluate segment performance based on Adjusted EBITDA. Adjusted EBITDA is defined as net income (loss), plus interest expense; income tax expense; depreciation, depletion and amortization; impairment of goodwill and long-lived assets; accretion of asset retirement obligations; losses on commodity derivative contracts and cash settlements received; losses on sale of assets; unit-based compensation expenses; exploration costs; equity loss from MEMP (MRD Segment only); cash distributions from MEMP (MRD Segment only); acquisition related costs; amortization of investment premium; and other non-routine items, less interest income; income tax benefit; gains on commodity derivative contracts and cash settlements paid; equity income from MEMP (MRD Segment only); gains on sale of assets and other non-routine items.
Financial information presented for the MEMP business segment is derived from the underlying consolidated and combined financial statements of MEMP that are publicly available.
Segment revenues and expenses include intersegment transactions. Our combined totals reflect the elimination of intersegment transactions.
In the MRD Segment’s individual financial statements, investments in the MEMP Segment that are included in the consolidated and combined financial statements are accounted for by the equity method.
F-58
Table of Contents
MEMORIAL RESOURCE DEVELOPMENT LLC (PREDECESSOR)
NOTES TO CONSOLIDATED AND COMBINED FINANCIAL STATEMENTS
The following table presents selected business segment information for the periods indicated (in thousands):
| MRD | MEMP | Other Adjustments & Eliminations |
Consolidated and Combined Totals |
|||||||||||||
| Total revenues: |
||||||||||||||||
| Year ended December 31, 2013 |
$ | 231,558 | $ | 343,616 | $ | (151 | ) | $ | 575,023 | |||||||
| Year ended December 31, 2012 |
138,814 | 258,423 | (369 | ) | 396,868 | |||||||||||
| Adjusted EBITDA: |
||||||||||||||||
| Year ended December 31, 2013(1) |
197,903 | 222,185 | (25,232 | ) | 394,856 | |||||||||||
| Year ended December 31, 2012(1) |
131,702 | 179,334 | (23,447 | ) | 287,589 | |||||||||||
| Segment assets:(2) |
||||||||||||||||
| As of December 31, 2013 |
1,281,134 | 1,552,307 | (4,280 | ) | 2,829,161 | |||||||||||
| As of December 31, 2012 |
1,102,406 | 1,489,404 | (132,506 | ) | 2,459,304 | |||||||||||
| Total expenditures for additions to long-lived assets: |
||||||||||||||||
| Year ended December 31, 2013 |
267,870 | 200,577 | — | 468,447 | ||||||||||||
| Year ended December 31, 2012 |
249,526 | 387,160 | — | 636,686 | ||||||||||||
| (1) | Adjustments and eliminations for the years ended December 31, 2013 and 2012 include amounts related to the MRD’s Segment equity investments in the MEMP Segment as well the elimination of $26.0 million and $19.3 million of cash distributions that MEMP paid Memorial Resource for the years ended December 31, 2013 and 2012, respectively, related to Memorial Resource’s partnership interests in MEMP. |
| (2) | Adjustments and eliminations primarily represent the elimination of the MRD’s Segment equity investments in the MEMP Segment. The adjustment at December 31, 2013 also includes $49.9 million related to an impairment recognized by the MEMP Segment during 2013. This impairment did not exist on a consolidated basis. |
Calculation of Reportable Segments’ Adjusted EBITDA
| For the Year Ended December 31, 2013 |
||||||||||||
| MRD | MEMP | Combined Totals |
||||||||||
| (in thousands) | ||||||||||||
| Net income (loss) |
$ | 82,243 | $ | 20,268 | $ | 102,511 | ||||||
| Interest expense, net |
27,349 | 41,901 | 69,250 | |||||||||
| Income tax expense (benefit) |
1,311 | 308 | 1,619 | |||||||||
| DD&A |
87,043 | 97,269 | 184,312 | |||||||||
| Impairment of proved oil and natural gas properties |
2,527 | 54,362 | 56,889 | |||||||||
| Accretion of AROs |
728 | 4,853 | 5,581 | |||||||||
| (Gain) loss on commodity derivative instruments |
(3,013 | ) | (26,281 | ) | (29,294 | ) | ||||||
| Cash settlements received on commodity derivative instruments |
12,240 | 19,879 | 32,119 | |||||||||
| Gain on sale of properties |
(82,773 | ) | (2,848 | ) | (85,621 | ) | ||||||
| Acquisition related costs |
1,584 | 6,729 | 8,313 | |||||||||
| Incentive unit compensation expense |
43,279 | 3,558 | 46,837 | |||||||||
| Non-cash compensation expense |
— | 1,057 | 1,057 | |||||||||
| Exploration costs |
1,226 | 1,130 | 2,356 | |||||||||
| Equity (income) loss from MEMP |
(1,847 | ) | — | (1,847 | ) | |||||||
| Cash distributions from MEMP |
26,006 | — | 26,006 | |||||||||
|
|
|
|
|
|
|
|||||||
| Adjusted EBITDA |
$ | 197,903 | $ | 222,185 | $ | 420,088 | ||||||
|
|
|
|
|
|
|
|||||||
F-59
Table of Contents
MEMORIAL RESOURCE DEVELOPMENT LLC (PREDECESSOR)
NOTES TO CONSOLIDATED AND COMBINED FINANCIAL STATEMENTS
| For the Year Ended December 31, 2012 |
||||||||||||
| MRD | MEMP | Combined Totals |
||||||||||
| (in thousands) | ||||||||||||
| Net income (loss) |
$ | (14,641 | ) | $ | 46,518 | $ | 31,877 | |||||
| Interest expense, net |
12,802 | 20,436 | 33,238 | |||||||||
| Income tax expense (benefit) |
(178 | ) | 285 | 107 | ||||||||
| DD&A |
62,636 | 76,036 | 138,672 | |||||||||
| Impairment of proved oil and natural gas properties |
18,339 | 10,532 | 28,871 | |||||||||
| Accretion of AROs |
632 | 4,377 | 5,009 | |||||||||
| (Gain) loss on commodity derivative instruments |
(13,488 | ) | (21,417 | ) | (34,905 | ) | ||||||
| Cash settlements received on commodity derivative instruments |
30,188 | 44,111 | 74,299 | |||||||||
| Gain on sale of properties |
(2 | ) | (9,759 | ) | (9,761 | ) | ||||||
| Acquisition related costs |
403 | 4,135 | 4,538 | |||||||||
| Incentive unit compensation expense |
9,510 | 1,423 | 10,933 | |||||||||
| Exploration costs |
7,337 | 2,463 | 9,800 | |||||||||
| Amortization of investment premium |
— | 194 | 194 | |||||||||
| Non-cash equity (income) loss from MEMP |
(696 | ) | — | (696 | ) | |||||||
| Cash distributions from MEMP |
19,263 | — | 19,263 | |||||||||
|
|
|
|
|
|
|
|||||||
| Adjusted EBITDA |
$ | 132,105 | $ | 179,334 | $ | 311,439 | ||||||
|
|
|
|
|
|
|
|||||||
The following table presents a reconciliation of total reportable segments’ Adjusted EBITDA to net income (loss) for each of the periods indicated.
| For the Years Ended December 31, |
||||||||
| 2013 | 2012 | |||||||
| (in thousands) | ||||||||
| Total Reportable Segments’ Adjusted EBITDA |
$ | 420,088 | $ | 311,439 | ||||
| Adjustment to reconcile Adjusted EBITDA to net income (loss): |
||||||||
| Interest expense, net |
(69,250 | ) | (33,238 | ) | ||||
| Income tax benefit (expense) |
(1,619 | ) | (107 | ) | ||||
| DD&A |
(184,717 | ) | (138,672 | ) | ||||
| Impairment of proved oil and natural gas properties |
(6,600 | ) | (28,871 | ) | ||||
| Accretion of AROs |
(5,581 | ) | (5,009 | ) | ||||
| Gains (losses) on commodity derivative instruments |
29,294 | 34,905 | ||||||
| Cash settlements received on commodity derivative instruments |
(32,119 | ) | (74,299 | ) | ||||
| Gain on sale of properties |
85,621 | 9,761 | ||||||
| Acquisition related costs |
(8,313 | ) | (4,538 | ) | ||||
| Incentive unit compensation expense |
(46,837 | ) | (10,933 | ) | ||||
| Non-cash compensation expense |
(1,057 | ) | — | |||||
| Exploration costs |
(2,356 | ) | (9,800 | ) | ||||
| Amortization of investment premium |
— | (194 | ) | |||||
| Cash distributions from MEMP |
(26,006 | ) | (19,263 | ) | ||||
| Non-cash equity (income) loss from WHT & MRD Assets |
784 | (4,184 | ) | |||||
|
|
|
|
|
|||||
| Net income (loss) |
$ | 151,332 | $ | 26,997 | ||||
|
|
|
|
|
|||||
F-60
Table of Contents
MEMORIAL RESOURCE DEVELOPMENT LLC (PREDECESSOR)
NOTES TO CONSOLIDATED AND COMBINED FINANCIAL STATEMENTS
Included below is our consolidated and combined statement of operations disaggregated by reportable segment for the period indicated:
| For the Year Ended December 31, 2013 |
||||||||||||||||
| MRD | MEMP | Other Adjustments & Eliminations |
Consolidated and Combined Totals |
|||||||||||||
| (in thousands) | ||||||||||||||||
| Revenues: |
||||||||||||||||
| Oil & natural gas sales |
$ | 230,751 | $ | 341,197 | $ | — | $ | 571,948 | ||||||||
| Other revenues |
807 | 2,419 | (151 | ) | 3,075 | |||||||||||
|
|
|
|
|
|
|
|
|
|||||||||
| Total revenues |
231,558 | 343,616 | (151 | ) | 575,023 | |||||||||||
|
|
|
|
|
|
|
|
|
|||||||||
| Costs and expenses: |
||||||||||||||||
| Lease operating |
25,006 | 88,893 | (259 | ) | 113,640 | |||||||||||
| Pipeline operating |
— | 1,835 | — | 1,835 | ||||||||||||
| Exploration |
1,226 | 1,130 | — | 2,356 | ||||||||||||
| Production and ad valorem taxes |
9,362 | 17,784 | — | 27,146 | ||||||||||||
| Depreciation, depletion, and amortization |
87,043 | 97,269 | 405 | 184,717 | ||||||||||||
| Impairment of proved oil and natural gas properties |
2,527 | 54,362 | (50,289 | ) | 6,600 | |||||||||||
| General and administrative |
81,758 | 43,495 | 105 | 125,358 | ||||||||||||
| Accretion of asset retirement obligations |
728 | 4,853 | — | 5,581 | ||||||||||||
| (Gain) loss on commodity derivative instruments |
(3,013 | ) | (26,281 | ) | — | (29,294 | ) | |||||||||
| (Gain) loss on sale of properties |
(82,773 | ) | (2,848 | ) | — | (85,621 | ) | |||||||||
| Other, net |
2 | 647 | — | 649 | ||||||||||||
|
|
|
|
|
|
|
|
|
|||||||||
| Total costs and expenses |
121,866 | 281,139 | (50,038 | ) | 352,967 | |||||||||||
|
|
|
|
|
|
|
|
|
|||||||||
| Operating income |
109,692 | 62,477 | 49,887 | 222,056 | ||||||||||||
| Other income (expense): |
||||||||||||||||
| Interest expense, net |
(27,349 | ) | (41,901 | ) | — | (69,250 | ) | |||||||||
| Earnings from equity investments |
1,066 | — | (1,066 | ) | — | |||||||||||
| Other, net |
145 | — | — | 145 | ||||||||||||
|
|
|
|
|
|
|
|
|
|||||||||
| Total other income (expense) |
(26,138 | ) | (41,901 | ) | (1,066 | ) | (69,105 | ) | ||||||||
|
|
|
|
|
|
|
|
|
|||||||||
| Income before income taxes |
83,554 | 20,576 | 48,821 | 152,951 | ||||||||||||
| Income tax benefit (expense) |
(1,311 | ) | (308 | ) | — | (1,619 | ) | |||||||||
|
|
|
|
|
|
|
|
|
|||||||||
| Net income |
$ | 82,243 | $ | 20,268 | $ | 48,821 | $ | 151,332 | ||||||||
|
|
|
|
|
|
|
|
|
|||||||||
| (1) | During the year ended December 31, 2013 the MEMP Segment recorded impairments of $50.3 million related to certain properties in East Texas. Both the MRD and MEMP Segments own properties in the same field and on a consolidated basis the expected future cash flows exceeded the carrying value, and therefore, did not result in an impairment on a consolidated basis. |
F-61
Table of Contents
MEMORIAL RESOURCE DEVELOPMENT LLC (PREDECESSOR)
NOTES TO CONSOLIDATED AND COMBINED FINANCIAL STATEMENTS
| For the Year Ended December 31, 2012 |
||||||||||||||||
| MRD | MEMP | Other Adjustments & Eliminations |
Consolidated and Combined Totals |
|||||||||||||
| (in thousands) | ||||||||||||||||
| Revenues: |
||||||||||||||||
| Oil & natural gas sales |
$ | 138,032 | $ | 255,608 | $ | (9 | ) | $ | 393,631 | |||||||
| Other revenues |
782 | 2,815 | (360 | ) | 3,237 | |||||||||||
|
|
|
|
|
|
|
|
|
|||||||||
| Total revenues |
138,814 | 258,423 | (369 | ) | 396,868 | |||||||||||
|
|
|
|
|
|
|
|
|
|||||||||
| Costs and expenses: |
||||||||||||||||
| Lease operating |
24,438 | 80,116 | (800 | ) | 103,754 | |||||||||||
| Pipeline operating |
— | 2,114 | — | 2,114 | ||||||||||||
| Exploration |
7,337 | 2,463 | — | 9,800 | ||||||||||||
| Production and ad valorem taxes |
7,576 | 16,048 | — | 23,624 | ||||||||||||
| Depreciation, depletion, and amortization |
62,636 | 76,036 | — | 138,672 | ||||||||||||
| Impairment of proved oil and natural gas properties |
18,339 | 10,532 | — | 28,871 | ||||||||||||
| General and administrative |
38,414 | 30,342 | 431 | 69,187 | ||||||||||||
| Accretion of asset retirement obligations |
632 | 4,377 | — | 5,009 | ||||||||||||
| (Gain) loss on commodity derivative instruments |
(13,488 | ) | (21,417 | ) | — | (34,905 | ) | |||||||||
| (Gain) loss on sale of properties |
(2 | ) | (9,759 | ) | — | (9,761 | ) | |||||||||
| Other, net |
364 | 138 | — | 502 | ||||||||||||
|
|
|
|
|
|
|
|
|
|||||||||
| Total costs and expenses |
146,246 | 190,990 | (369 | ) | 336,867 | |||||||||||
|
|
|
|
|
|
|
|
|
|||||||||
| Operating income |
(7,432 | ) | 67,433 | — | 60,001 | |||||||||||
| Other income (expense): |
||||||||||||||||
| Interest expense, net |
(12,802 | ) | (20,436 | ) | — | (33,238 | ) | |||||||||
| Amortization of investment premium |
— | (194 | ) | — | (194 | ) | ||||||||||
| Earnings from equity investments |
4,880 | — | (4,880 | ) | — | |||||||||||
| Other, net |
535 | — | — | 535 | ||||||||||||
|
|
|
|
|
|
|
|
|
|||||||||
| Total other income (expense) |
(7,387 | ) | (20,630 | ) | (4,880 | ) | (32,897 | ) | ||||||||
|
|
|
|
|
|
|
|
|
|||||||||
| Income before income taxes |
(14,819 | ) | 46,803 | (4,880 | ) | 27,104 | ||||||||||
| Income tax benefit (expense) |
178 | (285 | ) | — | (107 | ) | ||||||||||
|
|
|
|
|
|
|
|
|
|||||||||
| Net income |
$ | (14,641 | ) | $ | 46,518 | $ | (4,880 | ) | $ | 26,997 | ||||||
|
|
|
|
|
|
|
|
|
|||||||||
Note 14. Commitments and Contingencies
Litigation & Environmental
As part of our normal business activities, we may be named as defendants in litigation and legal proceedings, including those arising from regulatory and environmental matters. Although we are insured against various risks to the extent we believe it is prudent, there is no assurance that the nature and amount of such insurance will be adequate, in every case, to indemnify us against liabilities arising from future legal proceedings. We are not aware of any litigation, pending or threatened, that we believe is reasonably likely to have a significant adverse effect on our financial position, results of operations or cash flows. At December 31, 2012, we had an accrued liability of approximately $0.1 million relating primarily to a matter that has been settled. We did not have an accrued liability at December 31, 2013.
Environmental costs for remediation are accrued based on estimates of known remediation requirements. Such accruals are based on management’s best estimate of the ultimate cost to remediate a site and are adjusted
F-62
Table of Contents
MEMORIAL RESOURCE DEVELOPMENT LLC (PREDECESSOR)
NOTES TO CONSOLIDATED AND COMBINED FINANCIAL STATEMENTS
as further information and circumstances develop. Those estimates may change substantially depending on information about the nature and extent of contamination, appropriate remediation technologies and regulatory approvals. Expenditures to mitigate or prevent future environmental contamination are capitalized. Ongoing environmental compliance costs are charged to expense as incurred. In accruing for environmental remediation liabilities, costs of future expenditures for environmental remediation are not discounted to their present value, unless the amount and timing of the expenditures are fixed or reliably determinable. At December 31, 2013, none of our estimated environmental remediation liabilities were discounted to present value since the ultimate amount and timing of cash payments for such liabilities were not readily determinable.
The following table presents the activity of our environmental reserves for the periods presented:
| 2013 | 2012 | |||||||
| (in thousands) | ||||||||
| Balance at beginning of period |
$ | 1,469 | $ | 1,747 | ||||
| Charged to costs and expenses |
— | 193 | ||||||
| Payments |
(892 | ) | (471 | ) | ||||
|
|
|
|
|
|||||
| Balance at end of period |
$ | 577 | $ | 1,469 | ||||
|
|
|
|
|
|||||
At December 31, 2013 and 2012, $0.6 million and $1.0 million, respectively, of our environmental reserves were classified as current liabilities in accrued liabilities.
Sinking Fund Trust Agreement
REO assumed an obligation with a third party to make payments into a sinking fund in connection with its 2009 acquisition of the Beta properties, the purpose of which is to provide funds adequate to decommission the portion of the San Pedro Bay pipeline that lies within California state waters and the surface facilities. Under the terms of the agreement, REO, as the operator of the properties, is obligated to make monthly deposits into the sinking fund account in an amount equal to $0.25 per barrel of oil and other liquid hydrocarbon produced from the acquired working interest. Interest earned in the account stays in the account. The obligation to fund ceases when the aggregate value of the account reaches $4.3 million. As of December 31, 2013, the gross account balance included in restricted investments was approximately $2.3 million. REO’s maximum remaining obligation net to its 51.75% interest under the terms of the current agreement was $1.0 million at December 31, 2013.
Supplemental Bond for Decommissioning Liabilities Trust Agreement
REO assumed an obligation with the Bureau of Ocean Energy Management (“BOEM”) in connection with its 2009 acquisition of the Beta properties. Under the terms of the agreement dated March 1, 2007, the seller of the Beta properties was obligated to deliver a $90.0 million U.S. Treasury Note into a trust account for the decommissioning of the offshore production facilities. At the time of acquisition, all obligations under this existing agreement had been met.
F-63
Table of Contents
MEMORIAL RESOURCE DEVELOPMENT LLC (PREDECESSOR)
NOTES TO CONSOLIDATED AND COMBINED FINANCIAL STATEMENTS
In January 2010, the BOEM issued a report that revised upward, the estimated cost of decommissioning. In June 2010, REO agreed to make additional quarterly payments to the trust account attributable to its net working interest of approximately $0.6 million beginning on June 30, 2010 until the payments and accrued interest attributable to REO equal $78.7 million by December 31, 2016. The trust account must maintain minimum balances attributable to REO’s net working interest as follows (in thousands):
| June 30, 2014 |
$ | 68,310 | ||
| June 30, 2015 |
$ | 72,450 | ||
| June 30, 2016 |
$ | 76,590 | ||
| December 31, 2016 |
$ | 78,660 |
In the event the account balance is less than the contractual amount, the working interest owners must make additional payments. Interest income earned and deposited in the trust account mitigates the likelihood that additional payments will have to be made by the working interest owners. As of December 31, 2013, the maximum remaining obligation net to REO’s interest was approximately $12.2 million.
The trust account is held by REO for the benefit of all working interest owners. The following is a summary of the gross held-to-maturity investments held in the trust account less the outside working interest owners share as of December 31, 2013 (in thousands):
| Investment |
Amortized Cost |
Unrealized Gain (Loss) |
Fair Market Value |
|||||||||
| U.S. Bank Money Market Cash Equivalent |
$ | 105,184 | $ | — | $ | 105,184 | ||||||
| U.S. Government Treasury Note, maturity of March 31, 2014, and 1.75% coupon |
23,073 | 93 | 23,166 | |||||||||
| Less: Outside working interest owners share |
(61,884 | ) | (45 | ) | (61,929 | ) | ||||||
|
|
|
|
|
|
|
|||||||
| $ | 66,373 | $ | 48 | $ | 66,421 | |||||||
|
|
|
|
|
|
|
|||||||
Processing Plant Expansions by Third Party Gatherer
In 2012, WildHorse contracted with Regency Field Services LLC (the “Gatherer”) to expand their Dubach processing plant by up to 70 MMcf per day among other facility and infrastructure improvements. The expansion project was complete and fully operational by July 2013. WildHorse will pay a payback demand fee until the payback demand fees received by the Gatherer plus any third party fees equal 110% of the new facility cost. For each month from the commencement date through the month in which the payout date occurs, WildHorse will pay a payback demand fee equal to the monthly demand quantity (136,200 MMBtu per day) times $0.26 per MMBtu. In addition, for each MMBtu gathered in excess of the demand quantity, WildHorse will pay a payback demand fee of $0.26 per MMBtu.
In 2013, WildHorse contracted with the Gatherer to build a new high pressure pipeline from the dedicated area to the Gatherer’s Dubberly processing plant in Webster Parish, LA amongst other pipeline and infrastructure improvements. The expansion project was complete and fully operational by mid-December 2013. WildHorse will pay a payback demand fee until the payback demand fees received by the Gatherer plus any third party fees equal to 110% of the pipeline and infrastructure improvement costs. For each month from the commencement date through the month in which the payout date occurs, WildHorse will pay a payback demand fee equal to the monthly demand fee times $0.31 per MMBtu. In addition, for each MMBtu gathered in excess of the demand quantity, WildHorse will pay a payback demand fee of $0.31 per MMBtu. The monthly demand quantity is 56,750 MMBtu per day from the Dubberly start-up date through one full year thereafter and then increasing to 113,500 MMBtu per day until payout.
F-64
Table of Contents
MEMORIAL RESOURCE DEVELOPMENT LLC (PREDECESSOR)
NOTES TO CONSOLIDATED AND COMBINED FINANCIAL STATEMENTS
Pursuant to the agreement, the Gatherer is obligated to process gas up to the maximum daily quantity of 158,000 MMBtu per day from the commencement date of the Dubach facility expansion through the start-up of the Dubberly pipeline. With the start-up of the Dubberly pipeline, the Gatherer is obligated to process gas up to the maximum daily quantity of 214,750 MMBtu per day through one full year thereafter. From and after the first anniversary of the Dubberly start-up date, the Gatherer is obligated to process gas up to the maximum daily quantity of 271,500 MMbtu per day. WildHorse is obligated to deliver all volumes of gas produced from the dedicated area to the Gatherer up to the maximum daily quantity.
Total allowable costs for the Dubach Plant expansion and the Dubberly pipeline (new Facility Costs) cannot exceed $129.0 million. WildHorse expects that total payments by WildHorse to the Gatherer for the new Facility Costs will not exceed 60% of the total payment amounts after contributions made by other owners. Payments made will reduce revenue associated with the production and are reflected in our reserve report.
WildHorse’s minimum commitments to the Gatherer, before other owner contributions, as of December 31, 2013 were as follows (in thousands):
| Dubach | Dubberly | Total Facility Costs |
||||||||||
| 2014 |
$ | 12,925 | $ | 6,421 | $ | 19,346 | ||||||
| 2015 |
12,925 | 12,842 | 25,767 | |||||||||
| 2016 |
12,961 | 12,878 | 25,839 | |||||||||
| 2017 |
12,925 | 12,842 | 25,767 | |||||||||
| 2018 |
10,766 | 10,697 | 21,463 | |||||||||
|
|
|
|
|
|
|
|||||||
| Total |
$ | 62,502 | $ | 55,680 | $ | 118,182 | ||||||
|
|
|
|
|
|
|
|||||||
Subsequent event. The contract with the Gatherer for the Dubach processing plant was amended effective February 1, 2014 where the payback demand fee for the Dubach processing plant increased from $0.26 to $0.275 cents per MMbtu. Also, the contract with the Gatherer for the new high pressure pipeline was amended effective February 1, 2014 where the payback demand fee decreased from $0.31 to $0.275 cents per MMbtu.
WildHorse’s minimum commitments to the Gatherer, before other owner contributions, as of February 1, 2014 were as follows (in thousands):
| Dubach | Dubberly | Total Facility Costs |
||||||||||
| 2014 |
$ | 12,510 | $ | 5,212 | $ | 17,722 | ||||||
| 2015 |
13,671 | 11,393 | 25,064 | |||||||||
| 2016 |
13,709 | 11,424 | 25,133 | |||||||||
| 2017 |
13,671 | 11,393 | 25,064 | |||||||||
| 2018 |
12,772 | 10,643 | 23,415 | |||||||||
|
|
|
|
|
|
|
|||||||
| Total |
$ | 66,333 | $ | 50,065 | $ | 116,398 | ||||||
|
|
|
|
|
|
|
|||||||
Operating Leases
We have leases for offshore Southern California pipeline right-of-way use and office space. We also incur surface rentals related to our business operations. For the years ended December 31, 2013 and 2012, we recognized $8.3 million and $5.0 million, respectively, of rent expense.
F-65
Table of Contents
MEMORIAL RESOURCE DEVELOPMENT LLC (PREDECESSOR)
NOTES TO CONSOLIDATED AND COMBINED FINANCIAL STATEMENTS
Amounts shown in the following table represent minimum lease payment obligations under non-cancelable operating leases with a remaining term in excess of one year as of December 31, 2013:
| Payment or Settlement due by Period | ||||||||||||||||||||||||||||
| Lease Obligations |
Total | 2014 | 2015 | 2016 | 2017 | 2018 | Thereafter | |||||||||||||||||||||
| (in thousands) | ||||||||||||||||||||||||||||
| Operating leases |
20,325 | 2,389 | 2,546 | 2,583 | 2,718 | 2,783 | 7,306 | |||||||||||||||||||||
Drilling & Compression Services
We have entered into drilling and compression services agreements with various terms. Amounts shown in the following table represent our minimum commitments as of December 31, 2013:
| Payment or Settlement due by Period | ||||||||||||||||||||||||||||
| Service Agreements |
Total | 2014 | 2015 | 2016 | 2017 | 2018 | Thereafter | |||||||||||||||||||||
| (in thousands) | ||||||||||||||||||||||||||||
| Drilling services |
20,323 | 20,323 | — | — | — | — | — | |||||||||||||||||||||
| Compression services |
7,090 | 7,079 | 11 | — | — | — | — | |||||||||||||||||||||
WildHorse Letter of Credit and Certificate of Deposit
Standby letters of credit were issued to the Louisiana Office of Conservation and the Railroad Commission of Texas for the account of WildHorse for $1.2 million during 2011. The letters of credit are to insure compliance by WildHorse with regulatory requirements. These letters of credit are collateralized by two Certificates of Deposits; the fair value of the Certificates of Deposits was $0.5 million and $1.2 million at December 31, 2013 and 2012, respectively. The amount of the letter of credit and the Certificates of Deposit is adjusted depending on the requirements of the Office of Conservation. The Certificates of Deposit is classified as a restricted noncurrent asset and is not considered operating cash for the purposes of the statements of cash flows.
Note 15. Defined Contribution Plans
Memorial Resource sponsors a defined contribution plan for the benefit of substantially all employees who have attained 18 years of age. The plan allows eligible employees to make tax-deferred contributions up to 100% of their annual compensation, not to exceed annual limits established by the Internal Revenue Service. Memorial Resource makes matching contributions of 100% of employee contributions that does not exceed 6% of compensation. Employees are immediately vested in these matching contributions. The plan received employer contributions of approximately $0.9 million and $0.4 million in for the years ended December 31, 2013 and 2012, respectively.
Effective January 1, 2012, REO assumed sponsorship of a separate defined contribution plan. This plan specifically benefits substantially all those employed by the Memorial Resource subsidiary (Beta Operating) that operates and supports the Beta properties that have attained 21 years of age. Eligible employees are permitted to make tax-deferred contributions up to 100% of their annual compensation, not to exceed annual limits established by the Internal Revenue Service. Employer matching contributions of 100% of employee contributions that does not exceed 6% of compensation are made to the plan as well. The employer matching contributions associated with this plan were subject to a three-year graded vesting schedule through February 28, 2012. Effective March 1, 2012, the plan was amended to offer immediate vesting of employer matching contributions. The plan received employer contributions of approximately $0.6 million and $0.5 million in 2013
F-66
Table of Contents
MEMORIAL RESOURCE DEVELOPMENT LLC (PREDECESSOR)
NOTES TO CONSOLIDATED AND COMBINED FINANCIAL STATEMENTS
and 2012, respectively. Approximately $0.3 million associated with this plan are reflected as costs and expenses in the accompanying statements of operations for both the years ended December 31, 2013 and 2012, respectively.
WildHorse, Tanos, BlueStone, Classic and Black Diamond also sponsor defined contribution plans for the benefit their eligible employees. Matching employer contributions of approximately $0.5 million and $0.6 million were made to these other plans in 2013 and 2012, respectively.
Crown and Stanolind also made matching contributions to defined contribution plans for the benefit of their eligible employees. Matching employer contributions of approximately $0.1 million were made to these plans in both 2013 and 2012. Such contributions to these plans are included in general and administrative expenses in the accompanying combined statements of operations.
Note 16. Subsequent Events
In preparing the consolidated and combined financial statements, management has evaluated all subsequent events and transactions for potential recognition or disclosure through April 4, 2014, the date the consolidated and combined financial statements were available for issuance.
Common Control Acquisition
On April 1, 2014, MEMP acquired certain oil and natural gas producing properties in East Texas from WildHorse for a purchase price of $34.0 million, subject to customary purchase price adjustments. This transaction was financed with borrowings under MEMP’s revolving credit facility. The acquired properties primarily represent additional working interests in wells currently owned by MEMP and located primarily in Polk and Tyler Counties in the Double A Field of East Texas, as well as the Sunflower, Segno and Sugar Creek Fields.
3rd Party Acquisition
On March 25, 2014, MEMP acquired certain oil and gas producing properties in the Eagle Ford trend from Alta Mesa Holdings, LP for a purchase price of $173 million, subject to customary purchase price adjustments. The acquired properties are located in Karnes County in the core of the Eagle Ford oil window. The properties are 100% non-operated. In addition, MEMP acquired a 30% interest in the seller’s Eagle Ford leasehold. MEMP acquired all of the seller’s working and net revenue interest in the producing wells subject to a net profits interest retained by the seller that reduces annually and terminates after three years. At the end of three years, MEMP will own all of the seller’s interests in the currently producing wells.
NGPCIF NPI Acquisition
See Notes 1 and 12 for further information regarding WildHorse’s acquisition of NGPCIF NPI.
Recently Formed Subsidiaries
MRD Royalty LLC (“MRD Royalty”) and MRD Midstream LLC (“MRD Midstream”) were formed by Memorial Resource in 2014. MRD Royalty owns certain immaterial leasehold interests and overriding royalty interests in Texas and Montana. MRD Midstream owns an indirect interest in certain immaterial midstream assets in North Louisiana. Following the completion of the Offering, Memorial Resource will retain its ownership interest in MRD Royalty and MRD Midstream.
F-67
Table of Contents
MEMORIAL RESOURCE DEVELOPMENT LLC (PREDECESSOR)
NOTES TO CONSOLIDATED AND COMBINED FINANCIAL STATEMENTS
Gas Processing Agreement
On March 17, 2014, WildHorse entered into a gas processing agreement with PennTex North Louisiana, LLC (“PennTex”). PennTex is a joint venture among certain affiliates of NGP in which MRD Midstream owns a noncontrolling interest. Once PennTex’s processing plant becomes operational, it will process natural gas produced from wells located on certain leases owned by WildHorse in the state of Louisiana. The agreement has a 15-year primary term, subject to one year extensions at either party’s election. WildHorse will pay PennTex a monthly fee, subject to an annual inflationary escalation, based on volumes of natural gas delivered and processed. Once the plant is declared operational, WildHorse will be obligated to pay a minimum processing fee equal to approximately $18.3 million on an annual basis, subject to certain adjustments and conditions. The gas processing agreement requires that the processing plant be operational no later than November 1, 2015.
Note 17. Supplemental Oil and Gas Information (Unaudited)
Capitalized Costs Relating to Oil and Natural Gas Producing Activities
The total amount of capitalized costs relating to oil and natural gas producing activities and the total amount of related accumulated depreciation, depletion and amortization is as follows at the dates indicated.
| Years Ended December 31, | ||||||||
| 2013 | 2012 | |||||||
| (in thousands) | ||||||||
| MRD Segment: |
||||||||
| Evaluated oil and natural gas properties |
$ | 1,226,417 | $ | 1,052,219 | ||||
| Unevaluated oil and natural gas properties |
46,413 | 26,589 | ||||||
| Accumulated depletion, depreciation, and amortization |
(256,629 | ) | (202,581 | ) | ||||
|
|
|
|
|
|||||
| Subtotal |
$ | 1,016,201 | $ | 876,227 | ||||
|
|
|
|
|
|||||
| MEMP Segment: |
||||||||
| Evaluated oil and natural gas properties(1) |
$ | 1,758,953 | $ | 1,545,402 | ||||
| Unevaluated oil and natural gas properties |
— | 5,004 | ||||||
| Accumulated depletion, depreciation, and amortization(1) |
(416,617 | ) | (265,710 | ) | ||||
|
|
|
|
|
|||||
| Subtotal |
$ | 1,342,336 | $ | 1,284,696 | ||||
|
|
|
|
|
|||||
| Eliminations: |
||||||||
| Accumulated depletion, depreciation, and amortization(1) |
$ | 49,884 | $ | — | ||||
| Consolidated: |
||||||||
| Evaluated oil and natural gas properties(1) |
$ | 2,985,370 | $ | 2,597,621 | ||||
| Unevaluated oil and natural gas properties |
46,413 | 31,593 | ||||||
| Accumulated depletion, depreciation, and amortization(1) |
(623,362 | ) | (468,291 | ) | ||||
|
|
|
|
|
|||||
| Total |
$ | 2,408,421 | $ | 2,160,923 | ||||
|
|
|
|
|
|||||
|
(1) Amounts do not include costs for SPBPC and related support equipment |
||||||||
F-68
Table of Contents
MEMORIAL RESOURCE DEVELOPMENT LLC (PREDECESSOR)
NOTES TO CONSOLIDATED AND COMBINED FINANCIAL STATEMENTS
Costs Incurred in Oil and Natural Gas Property Acquisition, Exploration and Development Activities
Costs incurred in property acquisition, exploration and development activities were as follows for the periods indicated:
| Years Ended December 31, | ||||||||
| 2013 | 2012 | |||||||
| (in thousands) | ||||||||
| MRD Segment: |
||||||||
| Property acquisition costs, proved |
$ | 56,108 | $ | 87,857 | ||||
| Property acquisition costs, unproved |
19,975 | 5,293 | ||||||
| Exploration and extension well costs |
13,313 | 212 | ||||||
| Development |
210,440 | 135,951 | ||||||
|
|
|
|
|
|||||
| Subtotal |
$ | 299,836 | $ | 229,313 | ||||
|
|
|
|
|
|||||
| MEMP Segment: |
||||||||
| Property acquisition costs, proved |
$ | 37,786 | $ | 278,246 | ||||
| Property acquisition costs, unproved |
— | — | ||||||
| Exploration and extension well costs |
— | 42,430 | ||||||
| Development(1) |
145,830 | 62,472 | ||||||
|
|
|
|
|
|||||
| Subtotal |
$ | 183,616 | $ | 383,148 | ||||
|
|
|
|
|
|||||
| Consolidated: |
||||||||
| Property acquisition costs, proved |
$ | 93,894 | $ | 366,103 | ||||
| Property acquisition costs, unproved |
19,975 | 5,293 | ||||||
| Exploration and extension well costs |
13,313 | 42,642 | ||||||
| Development(1) |
356,270 | 198,423 | ||||||
|
|
|
|
|
|||||
| Total |
$ | 483,452 | $ | 612,461 | ||||
|
|
|
|
|
|||||
|
(1) Amounts do not include costs for SPBPC and related support equipment |
||||||||
Standardized Measure of Discounted Future Net Cash Flows from Proved Reserves
As required by the FASB and SEC, the standardized measure of discounted future net cash flows presented below is computed by applying first-day-of-the-month average prices, year-end costs and legislated tax rates and a discount factor of 10 percent to proved reserves. We do not believe the standardized measure provides a reliable estimate of the expected future cash flows to be obtained from the development and production of its oil and gas properties or of the value of its proved oil and gas reserves. The standardized measure is prepared on the basis of certain prescribed assumptions including first-day-of-the-month average prices, which represent discrete points in time, and therefore, may cause significant variability in cash flows from year to year as prices change.
Oil and Natural Gas Reserves
Users of this information should be aware that the process of estimating quantities of “proved” and “proved developed” oil and natural gas reserves is very complex, requiring significant subjective decisions in the evaluation of all available geological, engineering and economic data for each reservoir. The data for a given reservoir may also change substantially over time as a result of numerous factors including, but not limited to, additional development activity, evolving production history and continual reassessment of the viability of production under varying economic conditions. As a result, revisions to existing reserve estimates may occur from time to time. Although every reasonable effort is made to ensure reserve estimates reported represent the
F-69
Table of Contents
MEMORIAL RESOURCE DEVELOPMENT LLC (PREDECESSOR)
NOTES TO CONSOLIDATED AND COMBINED FINANCIAL STATEMENTS
most accurate assessments possible, the subjective decisions and variances in available data for various reservoirs make these estimates generally less precise than other estimates included in the financial statement disclosures.
Proved reserves are those quantities of oil and natural gas that by analysis of geoscience and engineering data can be estimated with reasonable certainty to be economically producible—from a given date forward, from known reservoirs, and under existing economic conditions, operating methods and government regulations—prior to the time at which contracts providing the right to operate expire, unless evidence indicates that renewal is reasonably certain, regardless of whether deterministic or probabilistic methods are used for the estimation. The project to extract the hydrocarbons must have commenced or the operator must be reasonably certain that it will commence the project within a reasonable time.
We engaged NSAI to prepare reserves estimates for all of our estimated proved reserves (by volume) at December 31, 2013. All proved reserves are located in the United States and all prices are held constant in accordance with SEC rules.
The weighted-average benchmark product prices used for valuing the reserves are based upon the average of the first-day-of-the-month price for each month within the period January through December of each year presented:
| 2013 | 2012 | |||||||
| Oil ($/Bbl): |
||||||||
| Spot(1) |
$ | 93.42 | $ | 91.33 | ||||
| NGL ($/Bbl): |
||||||||
| Spot(1) |
$ | 93.42 | $ | 91.75 | ||||
| Natural Gas ($/MMbtu): |
||||||||
| Spot(2) |
$ | 3.67 | $ | 2.75 | ||||
| (1) | The unweighted average West Texas Intermediate spot price was adjusted by lease for quality, transportation fees, and a regional price differential. |
| (2) | The unweighted average Henry Hub spot price was adjusted by lease for energy content, compression charges, transportation fees, and regional price differentials. |
F-70
Table of Contents
MEMORIAL RESOURCE DEVELOPMENT LLC (PREDECESSOR)
NOTES TO CONSOLIDATED AND COMBINED FINANCIAL STATEMENTS
MRD Segment
The following tables set forth estimates of the net reserves as of December 31, 2013 and 2012, respectively:
| Year Ended December 31, 2013 | ||||||||||||||||
| Oil (MBbls) |
Gas (MMcf) |
NGLs (MBbls) |
Equivalent (MMcfe) |
|||||||||||||
| Proved developed and undeveloped reserves: |
||||||||||||||||
| Beginning of year |
11,953 | 739,378 | 41,466 | 1,059,895 | ||||||||||||
| Extensions and discoveries |
1,794 | 149,974 | 8,319 | 210,652 | ||||||||||||
| Purchase of minerals in place |
211 | 31,815 | 1,017 | 39,183 | ||||||||||||
| Production |
(665 | ) | (34,092 | ) | (1,457 | ) | (46,819 | ) | ||||||||
| Sales of minerals in place |
(599 | ) | (14,137 | ) | (1,573 | ) | (27,169 | ) | ||||||||
| Revision of previous estimates |
(1,383 | ) | (70,684 | ) | (5,196 | ) | (110,165 | ) | ||||||||
|
|
|
|
|
|
|
|
|
|||||||||
| End of year(1) |
11,311 | 802,254 | 42,576 | 1,125,577 | ||||||||||||
|
|
|
|
|
|
|
|
|
|||||||||
| Proved developed reserves: |
||||||||||||||||
| Beginning of year |
3,082 | 245,449 | 12,321 | 337,869 | ||||||||||||
| End of year |
3,402 | 263,797 | 13,904 | 367,641 | ||||||||||||
| Proved undeveloped reserves: |
||||||||||||||||
| Beginning of year |
8,871 | 493,929 | 29,145 | 722,026 | ||||||||||||
| End of year |
7,909 | 538,457 | 28,672 | 757,936 | ||||||||||||
| (1) | Includes reserves of 41,077 MMcfe attributable to noncontrolling interests and the MRD Segment previous owners. |
| Year Ended December 31, 2012 | ||||||||||||||||
| Oil (MBbls) |
Gas (MMcf) |
NGLs (MBbls) |
Equivalent (MMcfe) |
|||||||||||||
| Proved developed and undeveloped reserves: |
||||||||||||||||
| Beginning of year |
10,834 | 929,335 | 53,031 | 1,312,533 | ||||||||||||
| Extensions and discoveries |
689 | 42,019 | 2,778 | 62,819 | ||||||||||||
| Purchase of minerals in place |
1,100 | 28,115 | 1,879 | 45,987 | ||||||||||||
| Production |
(369 | ) | (24,131 | ) | (898 | ) | (31,731 | ) | ||||||||
| Sales of minerals in place |
(4 | ) | (728 | ) | — | (752 | ) | |||||||||
| Revision of previous estimates |
(297 | ) | (235,232 | ) | (15,324 | ) | (328,961 | ) | ||||||||
|
|
|
|
|
|
|
|
|
|||||||||
| End of year(1) |
11,953 | 739,378 | 41,466 | 1,059,895 | ||||||||||||
|
|
|
|
|
|
|
|
|
|||||||||
| Proved developed reserves: |
||||||||||||||||
| Beginning of year |
2,107 | 191,557 | 7,644 | 250,073 | ||||||||||||
| End of year |
3,082 | 245,449 | 12,321 | 337,869 | ||||||||||||
| Proved undeveloped reserves: |
||||||||||||||||
| Beginning of year |
8,727 | 737,778 | 45,387 | 1,062,460 | ||||||||||||
| End of year |
8,871 | 493,929 | 29,145 | 722,026 | ||||||||||||
| (1) | Includes reserves of 67,135 MMcfe attributable to noncontrolling interests and the MRD Segment previous owners. |
F-71
Table of Contents
MEMORIAL RESOURCE DEVELOPMENT LLC (PREDECESSOR)
NOTES TO CONSOLIDATED AND COMBINED FINANCIAL STATEMENTS
Noteworthy amounts included in the categories of proved reserve changes for the years ended December 31, 2013 and 2012 in the above tables include:
| • | 148.6 Bcfe of the increase in reserves for the year end December 31, 2013, through the category extensions and discoveries, was due to the WildHorse’s horizontal redevelopment drilling program in the Terryville Complex in Lincoln Parish, Louisiana. |
| • | WildHorse acquired 43.5 Bcfe in multiple acquisitions during the year ended December 31, 2012, the largest being the Undisclosed Seller Acquisition. Downward revisions of previous estimates for estimated natural gas proved reserves was primarily the result of a decrease in natural gas prices. |
See Note 3 for additional information on acquisitions and divestitures.
A variety of methodologies are used to determine our proved reserve estimates. The principal methodologies employed are reservoir simulation, decline curve analysis, volumetric, material balance, advance production type curve matching, petro-physics/log analysis and analogy. Some combination of these methods is used to determine reserve estimates in substantially all of our fields.
The standardized measure of discounted future net cash flows is as follows:
| Years Ended December 31, | ||||||||
| 2013 | 2012 | |||||||
| (in thousands) | ||||||||
| Future cash inflows |
$ | 5,722,848 | $ | 4,921,192 | ||||
| Future production costs |
(1,587,374 | ) | (1,255,289 | ) | ||||
| Future development costs |
(1,352,945 | ) | (1,060,777 | ) | ||||
|
|
|
|
|
|||||
| Future net cash flows for estimated timing of cash flows(1) |
2,782,529 | 2,605,126 | ||||||
| 10% annual discount for estimated timing of cash flows |
(1,313,577 | ) | (1,284,531 | ) | ||||
|
|
|
|
|
|||||
| Standardized measure of discounted future net cash flows(2) |
$ | 1,468,952 | $ | 1,320,595 | ||||
|
|
|
|
|
|||||
| (1) | We are subject to the Texas Franchise tax which has a maximum effective rate of 0.7% of gross income apportioned to Texas to immateriality we have excluded the impact of this tax. However, had we not been a tax exempt entity future income tax for the years ended December 31, 2013 and 2012 would have been $760,433 and $647,464, respectively. |
| (2) | Includes $63,422 and $78,518 attributable to both noncontrolling interests and the MRD Segment previous owners for the years ended December 31, 2013 and 2012, respectively. |
F-72
Table of Contents
MEMORIAL RESOURCE DEVELOPMENT LLC (PREDECESSOR)
NOTES TO CONSOLIDATED AND COMBINED FINANCIAL STATEMENTS
Changes in Standardized Measure of Discounted Future Net Cash Flows Relating to Proved Reserves
The following is a summary of the changes in the standardized measure of discounted future net cash flows for the proved oil and natural gas reserves during each of the years in the two year period ended December 31, 2013:
| Years Ended December 31, | ||||||||
| 2013 | 2012 | |||||||
| (in thousands) | ||||||||
| Beginning of year |
$ | 1,320,595 | $ | 1,386,071 | ||||
| Sale of oil and natural gas produced, net of production costs |
(196,444 | ) | (107,316 | ) | ||||
| Purchase of minerals in place |
51,177 | 98,384 | ||||||
| Sale of minerals in place |
(54,091 | ) | — | |||||
| Extensions and discoveries |
301,004 | 127,994 | ||||||
| Changes in prices and costs |
(11,336 | ) | (402,202 | ) | ||||
| Previously estimated development costs incurred |
87,297 | 64,390 | ||||||
| Net changes in future development costs |
57,353 | (67,331 | ) | |||||
| Revisions of previous quantities |
(186,804 | ) | (176,788 | ) | ||||
| Accretion of discount |
128,544 | 138,607 | ||||||
| Change in production rates and other |
(28,343 | ) | 258,786 | |||||
|
|
|
|
|
|||||
| End of year |
$ | 1,468,952 | $ | 1,320,595 | ||||
|
|
|
|
|
|||||
MEMP Segment
The following tables set forth estimates of the net reserves as of December 31, 2013 and 2012, respectively:
| Year Ended December 31, 2013 | ||||||||||||||||
| Oil (MBbls) |
Gas (MMcf) |
NGLs (MBbls) |
Equivalent (MMcfe) |
|||||||||||||
| Proved developed and undeveloped reserves: |
||||||||||||||||
| Beginning of year |
39,089 | 604,440 | 29,352 | 1,015,095 | ||||||||||||
| Extensions and discoveries |
5,655 | 40,770 | 1,747 | 85,180 | ||||||||||||
| Purchase of minerals in place |
119 | 16,294 | 258 | 18,554 | ||||||||||||
| Production |
(1,764 | ) | (35,924 | ) | (1,632 | ) | (56,303 | ) | ||||||||
| Sales of minerals in place |
— | — | — | — | ||||||||||||
| Revision of previous estimates |
(3,950 | ) | (18,441 | ) | (879 | ) | (47,421 | ) | ||||||||
|
|
|
|
|
|
|
|
|
|||||||||
| End of year(1) |
39,149 | 607,139 | 28,846 | 1,015,105 | ||||||||||||
|
|
|
|
|
|
|
|
|
|||||||||
| Proved developed reserves: |
||||||||||||||||
| Beginning of year |
24,515 | 376,932 | 15,947 | 619,704 | ||||||||||||
| End of year |
22,265 | 387,548 | 15,959 | 616,893 | ||||||||||||
| Proved undeveloped reserves: |
||||||||||||||||
| Beginning of year |
14,574 | 227,508 | 13,405 | 395,391 | ||||||||||||
| End of year |
16,884 | 219,591 | 12,887 | 398,212 | ||||||||||||
| (1) | MRD Segment’s share of these reserves is 89,837 MMcfe. |
F-73
Table of Contents
MEMORIAL RESOURCE DEVELOPMENT LLC (PREDECESSOR)
NOTES TO CONSOLIDATED AND COMBINED FINANCIAL STATEMENTS
| Year Ended December 31, 2012 | ||||||||||||||||
| Oil (MBbls) |
Gas (MMcf) |
NGLs (MBbls) |
Equivalent (MMcfe) |
|||||||||||||
| Proved developed and undeveloped reserves: |
||||||||||||||||
| Beginning of year |
27,150 | 579,751 | 15,045 | 832,913 | ||||||||||||
| Extensions and discoveries |
7,501 | 19,869 | 1,053 | 71,192 | ||||||||||||
| Purchase of minerals in place |
11,336 | 113,617 | 7,095 | 224,202 | ||||||||||||
| Production |
(1,519 | ) | (29,744 | ) | (745 | ) | (43,329 | ) | ||||||||
| Sales of minerals in place |
(4,214 | ) | (4,214 | ) | — | (29,499 | ) | |||||||||
| Revision of previous estimates |
(1,165 | ) | (74,839 | ) | 6,904 | (40,384 | ) | |||||||||
|
|
|
|
|
|
|
|
|
|||||||||
| End of year(1)(2) |
39,089 | 604,440 | 29,352 | 1,015,095 | ||||||||||||
|
|
|
|
|
|
|
|
|
|||||||||
| Proved developed reserves: |
||||||||||||||||
| Beginning of year |
19,332 | 413,431 | 10,015 | 589,504 | ||||||||||||
| End of year |
24,515 | 376,932 | 15,947 | 619,704 | ||||||||||||
| Proved undeveloped reserves: |
||||||||||||||||
| Beginning of year |
7,818 | 166,320 | 5,030 | 243,409 | ||||||||||||
| End of year |
14,574 | 227,508 | 13,405 | 395,391 | ||||||||||||
| (1) | Includes reserves of 406,324 MMcfe attributable to common control acquisitions. |
| (2) | MRD Segment’s share of these reserves is 476,550 MMcfe. |
Noteworthy amounts included in the categories of proved reserve changes for the years 2013 and 2012 in the above tables include:
| • | MEMP acquired 224.2 Bcfe in multiple acquisitions during the year ended December 31, 2012, the largest being the Goodrich Acquisition of 148.9 Bcfe. Stanolind acquired 43.6 Bcfe through multiple acquisitions, the largest being the Menemsha Acquisition of 23.9 Bcfe. During the year ended December 31, 2012, Propel divested 19.0 Bcfe of offshore Louisiana oil and gas properties to an NGP controlled entity. |
See Note 3 for additional information on acquisitions and divestitures.
A variety of methodologies are used to determine our proved reserve estimates. The principal methodologies employed are reservoir simulation, decline curve analysis, volumetric, material balance, advance production type curve matching, petro-physics/log analysis and analogy. Some combination of these methods is used to determine reserve estimates in substantially all of our fields.
The standardized measure of discounted future net cash flows is as follows:
| Years Ended December 31, | ||||||||
| 2013 | 2012 | |||||||
| (in thousands) | ||||||||
| Future cash inflows |
$ | 6,892,150 | $ | 6,511,776 | ||||
| Future production costs |
(2,719,024 | ) | (2,258,554 | ) | ||||
| Future development costs |
(685,858 | ) | (620,944 | ) | ||||
|
|
|
|
|
|||||
| Future net cash flows for estimated timing of cash flows(1) |
3,487,268 | 3,632,278 | ||||||
| 10% annual discount for estimated timing of cash flows |
(1,879,156 | ) | (2,042,362 | ) | ||||
|
|
|
|
|
|||||
| Standardized measure of discounted future net cash flows(2)(3) |
$ | 1,608,112 | $ | 1,589,916 | ||||
|
|
|
|
|
|||||
| (1) | MEMP is subject to the Texas Franchise tax which has a maximum effective rate of 0.7% of gross income apportioned to Texas. Due to immateriality we have excluded the impact of this tax. MEMP is organized as a pass-through entity for income tax purposes. Had we not been a tax exempt entity our share of future income tax related to our ownership of MEMP for the years ended December 31, 2013 and 2012 would have been $61,300 and $306,297, respectively. |
F-74
Table of Contents
MEMORIAL RESOURCE DEVELOPMENT LLC (PREDECESSOR)
NOTES TO CONSOLIDATED AND COMBINED FINANCIAL STATEMENTS
| (2) | Includes $503,021 attributable to the MEMP previous owners for the year ended December 31, 2012. |
| (3) | MRD Segment’s share of the standardized measure of discounted future net cash flows was $142,318 and $554,981 for the years ended December 31, 2013 and 2012, respectively. |
Changes in Standardized Measure of Discounted Future Net Cash Flows Relating to Proved Reserves
The following is a summary of the changes in the standardized measure of discounted future net cash flows for the proved oil and natural gas reserves during each of the years in the two year period ended December 31, 2013:
| Years Ended December 31, | ||||||||
| 2013 | 2012 | |||||||
| (in thousands) | ||||||||
| Beginning of year |
$ | 1,589,916 | $ | 1,499,414 | ||||
| Sale of oil and natural gas produced, net of production costs |
(234,520 | ) | (160,023 | ) | ||||
| Purchase of minerals in place |
23,160 | 375,953 | ||||||
| Sale of minerals in place |
— | (154,963 | ) | |||||
| Extensions and discoveries |
136,423 | 265,108 | ||||||
| Changes in income taxes, net. |
— | 1,947 | ||||||
| Changes in prices and costs |
(74,395 | ) | (331,760 | ) | ||||
| Previously estimated development costs incurred |
174,490 | 66,360 | ||||||
| Net changes in future development costs |
(74,867 | ) | (1,140 | ) | ||||
| Revisions of previous quantities |
(141,122 | ) | (90,587 | ) | ||||
| Accretion of discount |
158,991 | 150,136 | ||||||
| Change in production rates and other |
50,036 | (30,529 | ) | |||||
|
|
|
|
|
|||||
| End of year |
$ | 1,608,112 | $ | 1,589,916 | ||||
|
|
|
|
|
|||||
F-75
Table of Contents
MEMORIAL RESOURCE DEVELOPMENT LLC (PREDECESSOR)
SCHEDULE 1—CONDENSED FINANCIAL INFORMATION
| December 31, | ||||||||
| 2013 | 2012 | |||||||
| ASSETS |
||||||||
| Current assets: |
||||||||
| Cash and cash equivalents |
$ | 19,293 | $ | 8,019 | ||||
| Restricted cash |
35,000 | — | ||||||
| Accounts receivable: |
||||||||
| Affiliates |
90,917 | 84,347 | ||||||
| Other |
— | 3 | ||||||
| Prepaid expenses and other current assets |
2,802 | 707 | ||||||
|
|
|
|
|
|||||
| Total current assets |
148,012 | 93,076 | ||||||
| Property and equipment, at cost: |
||||||||
| Furniture and fixtures |
1,679 | 1,217 | ||||||
| Accumulated depreciation, depletion and impairment |
(547 | ) | (199 | ) | ||||
|
|
|
|
|
|||||
| Oil and natural gas properties, net |
1,132 | 1,018 | ||||||
| Long-term derivative instruments |
||||||||
| Investments in subsidiaries |
411,657 | 797,868 | ||||||
| Investments in previous owners |
40,331 | 233,433 | ||||||
| Restricted cash |
15,000 | — | ||||||
| Other long-term assets |
6,596 | 259 | ||||||
|
|
|
|
|
|||||
| Total assets |
$ | 622,728 | $ | 1,125,654 | ||||
|
|
|
|
|
|||||
| LIABILITIES AND EQUITY |
||||||||
| Current liabilities: |
||||||||
| Accounts payable |
$ | 130 | $ | 161 | ||||
| Accrued liabilities |
1,896 | 225 | ||||||
|
|
|
|
|
|||||
| Total current liabilities |
2,026 | 386 | ||||||
| Long-term debt |
343,050 | 80,000 | ||||||
| Other long-term liabilities |
135 | 221 | ||||||
|
|
|
|
|
|||||
| Total liabilities |
345,211 | 80,607 | ||||||
| Commitments and contingencies |
||||||||
| Equity: |
||||||||
| Members |
237,186 | 811,614 | ||||||
| Previous Owners |
40,331 | 233,433 | ||||||
|
|
|
|
|
|||||
| Total liabilities and members’ equity |
$ | 622,728 | $ | 1,125,654 | ||||
|
|
|
|
|
|||||
F-76
Table of Contents
MEMORIAL RESOURCE DEVELOPMENT LLC (PREDECESSOR)
SCHEDULE 1—CONDENSED FINANCIAL INFORMATION
Condensed statements of income
| For Year Ended December 31, |
||||||||
| 2013 | 2012 | |||||||
| Costs and expenses: |
||||||||
| Depreciation, depletion, and amortization |
348 | 195 | ||||||
| General and administrative |
20,111 | 10,176 | ||||||
| (Gain) loss on commodity derivative instruments |
546 | — | ||||||
|
|
|
|
|
|||||
| Total costs and expenses |
21,005 | 10,371 | ||||||
|
|
|
|
|
|||||
| Operating income |
(21,005 | ) | (10,371 | ) | ||||
| Other income (expense): |
||||||||
| Equity income (loss) from subsidiaries |
114,974 | 2,970 | ||||||
| Equity income (loss) from previous owners |
10,790 | 37,318 | ||||||
| Interest expense, net |
(3,257 | ) | (219 | ) | ||||
|
|
|
|
|
|||||
| Total other income (expense) |
122,507 | 40,069 | ||||||
|
|
|
|
|
|||||
| Net income (loss) |
$ | 101,502 | $ | 29,698 | ||||
|
|
|
|
|
|||||
Condensed statements of cash flows
| For Year Ended December 31, |
||||||||
| 2013 | 2012 | |||||||
| Net cash provided by (used in) operating activities |
$ | (3,556 | ) | $ | (75,088 | ) | ||
|
|
|
|
|
|||||
| Cash flows from investing activities: |
||||||||
| Investments in subsidiaries |
(40,666 | ) | (718 | ) | ||||
| Additions to furniture and fixtures |
(461 | ) | (903 | ) | ||||
| Proceeds from changes in ownership interests in MEMP |
135,012 | — | ||||||
| Changes in restricted cash |
(50,000 | ) | — | |||||
|
|
|
|
|
|||||
| Net cash (used in) provided by investing activities |
43,885 | (1,621 | ) | |||||
|
|
|
|
|
|||||
| Cash flows from financing activities: |
||||||||
| Advances on revolving credit facility |
— | 80,000 | ||||||
| Payments on revolving credit facility |
(80,000 | ) | — | |||||
| Proceeds from issuance of senior notes |
343,000 | — | ||||||
| Distributions received from subsidiaries (see Note 3) |
448,349 | — | ||||||
| Loan origination fees |
(8,042 | ) | (802 | ) | ||||
| Distributions to Members |
(732,362 | ) | — | |||||
|
|
|
|
|
|||||
| Net cash (used in) provided by financing activities |
(29,055 | ) | 79,198 | |||||
|
|
|
|
|
|||||
| Net change in cash and cash equivalents |
11,274 | 2,489 | ||||||
| Cash and cash equivalents, beginning of year |
8,019 | 5,530 | ||||||
|
|
|
|
|
|||||
| Cash and cash equivalents, end of year |
$ | 19,293 | $ | 8,019 | ||||
|
|
|
|
|
|||||
F-77
Table of Contents
MEMORIAL RESOURCE DEVELOPMENT LLC (PREDECESSOR)
NOTES TO CONDENSED FINANCIAL INFORMATION
Note 1. Basis of Presentation
Memorial Resource Development LLC (“Memorial Resource”) is a Delaware limited liability company (the “Company”) formed on April 27, 2011 to own, acquire, exploit and develop oil and natural gas properties. Unless the context requires otherwise, references to “we,” “us,” “our,” or “the Company” are intended to mean the business and operations of Memorial Resource Development LLC and its consolidated subsidiaries. There are significant restrictions over the ability of Memorial Resource to obtain funds from certain of its consolidating subsidiaries through dividends, loans or advances. Accordingly, these condensed financial statements have been presented on a “parent-only” basis. Under a parent-only presentation, the investments of Memorial Resource in its consolidated subsidiaries are presented under the equity method of accounting. These parent-only financial statements should be read in conjunction with the consolidated financial statements of MRD LLC included elsewhere herein. These condensed financial statements have been prepared in anticipation of a proposed initial public offering of the common stock of Memorial Resource Development Corp. (“MRDC”).
Note 2. Long-Term Debt
Our debt obligations under revolving credit facilities consisted of the following at December 31:
| 2013 | 2012 | |||||||
| (in thousands) | ||||||||
| Memorial Resource $1.0 billion revolving credit facility, variable-rate, terminated December 2013 |
$ | — | $ | 80,000 | ||||
| 10.00%/10.75% senior PIK toggle notes due December 2018 |
350,000 | — | ||||||
| 10.00%/10.75% senior PIK toggle notes unamortized discounts |
(6,950 | ) | — | |||||
|
|
|
|
|
|||||
| Total long-term debt |
$ | 343,050 | $ | 80,000 | ||||
|
|
|
|
|
|||||
On July 13, 2012, Memorial Resource entered into a two-year $50.0 million senior secured revolving credit with an initial borrowing base of $35.0 million. Memorial Resource pledged 7,061,294 of Memorial Production Partners LP (“MEMP”) common units and 5,360,912 of MEMP subordinated units as security under the credit facility as well as its oil and gas properties and certain other assets of Memorial Resource. This credit facility was also guaranteed by certain of Memorial Resources wholly-owned subsidiaries.
On November 20, 2012, Memorial Resource entered into a first amendment to its credit agreement, which among other things: (i) increased the aggregate maximum credit to $1.0 billion (ii) increased the borrowing base to $120.0 million and (iii) extended the maturity date to November 20, 2016. On April 25, 2013, Memorial Resource entered into a second amendment to its credit agreement, which among other things: (i) increased the borrowing base to $170.0 million and (ii) designated Tanos together with its consolidating subsidiaries as additional guarantors. On October 1, 2013, Tanos Energy, LLC (“Tanos”) and its consolidating subsidiaries were removed as guarantors and the borrowing base was reduced to $120.0 million . On November 1, 2013, Memorial Resource entered into a third amendment to its credit agreement, which among other things: (i) designated Black Diamond Minerals, LLC (“Black Diamond”) together with its consolidating subsidiaries as additional guarantors, (ii) reduced the borrowing base to $100.0 million, and (iii) permitted second lien indebtedness. On November 22, 2013, the borrowing base was automatically reduced to $60.0 million upon Memorial Resource’s sale of 7,061,294 MEMP common units in a secondary offering.
On December 18, 2013, indebtedness then outstanding under the revolving credit facility of $59.7 million and all accrued interest was paid off in full and the revolving credit facility was terminated in connection with the issuance of senior notes discussed below.
F-78
Table of Contents
MEMORIAL RESOURCE DEVELOPMENT LLC (PREDECESSOR)
NOTES TO CONDENSED FINANCIAL INFORMATION
On December 18, 2013, Memorial Resource and its wholly-owned subsidiary, Memorial Resource Finance Corp. (“MRD Finance Corp.” and collectively, the “MRD Issuers”), completed a private placement of $350.0 million in aggregate principal amount of 10.00% / 10.75% Senior PIK Toggle Notes due 2018 (the “PIK notes”). The PIK notes were issued at 98% of par and will mature on December 15, 2018. Net proceeds from the private offering were used: (i) to repay all indebtedness then outstanding under Memorial Resource’s revolving credit facility, (ii) to establish a cash reserve of $50.0 million for the payment of interest on the PIK notes, (iii) to pay a $220.0 million distribution to the Funds, and (iv) for general company purposes.
Interest on the PIK notes will be payable semi-annually in arrears on June 15 and December 15 of each year, commencing on June 15, 2014. Subject to conditions in the indenture governing the PIK notes, Memorial Resource will be required to pay interest on the PIK notes in cash or through issuing additional notes (such an issuance, “PIK Interest”). The interest rate on the PIK notes is 10.00% per annum for interest paid in cash or 10.75% per annum for PIK Interest. PIK Interest will be paid by issuing additional notes having the same terms as the PIK notes. The PIK notes are subject to optional redemption at prices specified in the indenture plus accrued and unpaid interest, if any. The MRD Issuers may also be required to repurchase the PIK notes upon a change of control.
At the time the PIK notes were issued, all of Memorial Resource’s subsidiaries other than MEMP and BlueStone Holdings (and their respective subsidiaries) were designated as restricted subsidiaries. The indenture governing the PIK notes contains customary covenants and restrictive provisions that apply to both Memorial Resource and its restricted subsidiaries, many of which will terminate if at any time no default exists under the indenture and the PIK notes receive an investment grade rating from both of two specified ratings agencies. The PIK notes are fully and unconditionally guaranteed on a senior unsecured basis by all of Memorial Resource’s restricted subsidiaries, except MEMP GP and WildHorse.
The indenture also provides for customary and other events of default. In the case of an event of default arising from certain events of bankruptcy or insolvency, all outstanding PIK notes will become due and payable immediately without further action or notice. If any other event of default occurs and is continuing, the trustee or the holders of at least 25% in principal amount of the then outstanding PIK notes may declare all the PIK notes to be due and payable immediately.
Note 3. Distribution from subsidiaries
The table below shows the distributions received from our subsidiaries classified as inflows from operating activities for the periods indicated since they are represent return on investment:
| For Year Ended December 31, | ||||||||
| 2013 | 2012 | |||||||
| Distributions received from subsidiaries |
$ | 25,966 | $ | 19,228 | ||||
Distributions received from our subsidiaries that represent return of investment are classified as inflows from investing activities.
F-79
Table of Contents
Appendix A
GLOSSARY OF OIL AND NATURAL GAS TERMS
The terms defined in this section are used throughout this prospectus:
Analogous Reservoir: Analogous reservoirs, as used in resource assessments, have similar rock and fluid properties, reservoir conditions (depth, temperature, and pressure) and drive mechanisms, but are typically at a more advanced stage of development than the reservoir of interest and thus may provide concepts to assist in the interpretation of more limited data and estimation of recovery. When used to support proved reserves, analogous reservoir refers to a reservoir that shares all of the following characteristics with the reservoir of interest: (i) the same geological formation (but not necessarily in pressure communication with the reservoir of interest); (ii) the same environment of deposition; (iii) similar geologic structure; and (iv) the same drive mechanism.
Basin: A large depression on the earth’s surface in which sediments accumulate.
Bbl: One stock tank barrel, or 42 U.S. gallons liquid volume, used in reference to oil or other liquid hydrocarbons.
Bcf: One billion cubic feet of natural gas.
Bcfe: One billion cubic feet of natural gas equivalent.
Boe: One barrel of oil equivalent, calculated by converting natural gas to oil equivalent barrels at a ratio of six Mcf of natural gas to one Bbl of oil.
Btu: One British thermal unit, the quantity of heat required to raise the temperature of a one-pound mass of water by one degree Fahrenheit.
Developed Acreage: The number of acres which are allocated or assignable to producing wells or wells capable of production.
Development Well: A well drilled within the proved area of an oil or natural gas reservoir to the depth of a stratigraphic horizon known to be productive.
Differential: An adjustment to the price of oil or natural gas from an established spot market price to reflect differences in the quality and/or location of oil or natural gas.
Economically Producible: The term economically producible, as it relates to a resource, means a resource which generates revenue that exceeds, or is reasonably expected to exceed, the costs of the operation. For this determination, the value of the products that generate revenue are determined at the terminal point of oil and natural gas producing activities.
Estimated Ultimate Recovery (EUR): Estimated ultimate recovery is the sum of reserves remaining as of a given date and cumulative production as of that date.
Exploitation: A development or other project which may target proven or unproven reserves (such as probable or possible reserves), but which generally has a lower risk than that associated with exploration projects.
Exploratory Well: A well drilled to find and produce oil and natural gas reserves not classified as proved, to find a new reservoir in a field previously found to be productive of oil or natural gas in another reservoir or to extend a known reservoir.
A-1
Table of Contents
Field: An area consisting of a single reservoir or multiple reservoirs, all grouped on or related to the same individual geological structural feature and/or stratigraphic condition. The field name refers to the surface area, although it may refer to both the surface and the underground productive formations.
Gross Acres or Gross Wells: The total acres or wells, as the case may be, in which we have working interest.
ICE: Inter-Continental Exchange.
MBtu/d: One thousand Btu per day.
Mcf: One thousand cubic feet of natural gas.
MMBtu: One million British thermal units.
MMcf: One million cubic feet of natural gas.
MMcfe: One million cubic feet of natural gas equivalent.
Net Acres or Net Wells: Gross acres or wells, as the case may be, multiplied by our working interest ownership percentage.
Net Production: Production that is owned by us less royalties and production due others.
Net Revenue Interest: A working interest owner’s gross working interest in production less the royalty, overriding royalty, production payment and net profits interests.
NGLs: The combination of ethane, propane, butane and natural gasolines that when removed from natural gas become liquid under various levels of higher pressure and lower temperature.
NYMEX: New York Mercantile Exchange.
Oil: Oil and condensate.
Operator: The individual or company responsible for the exploration and/or production of an oil or natural gas well or lease.
Play: A geographic area with hydrocarbon potential.
Possible Reserves: Reserves that are less certain to be recovered than probable reserves.
Probable Reserves: Reserves that are less certain to be recovered than proved reserves but that, together with proved reserves, are as likely as not to be recovered.
Productive Well: A well that produces commercial quantities of hydrocarbons, exclusive of its capacity to produce at a reasonable rate of return.
Proved Developed Reserves: Proved reserves that can be expected to be recovered from existing wells with existing equipment and operating methods.
Proved Reserves: Those quantities of oil and natural gas, which, by analysis of geoscience and engineering data, can be estimated with reasonable certainty to be economically producible, from a given date forward, from known reservoirs, and under existing economic conditions, operating methods, and government regulations, prior to the time at which contracts providing the right to operate expire, unless evidence indicates that renewal is reasonably certain, regardless of whether deterministic or probabilistic methods are used for the estimation. The project to extract the hydrocarbons must have commenced, or the operator must be reasonably certain that it will commence the project, within a reasonable time. The area of the reservoir considered as proved
A-2
Table of Contents
includes (i) the area identified by drilling and limited by fluid contacts, if any, and (ii) adjacent undrilled portions of the reservoir that can, with reasonable certainty, be judged to be continuous with it and to contain economically producible oil or natural gas on the basis of available geoscience and engineering data. In the absence of data on fluid contacts, proved quantities in a reservoir are limited by the lowest known hydrocarbons, as seen in a well penetration, unless geoscience, engineering or performance data and reliable technology establishes a lower contact with reasonable certainty. Where direct observation from well penetrations has defined a highest known oil elevation and the potential exists for an associated natural gas cap, proved oil reserves may be assigned in the structurally higher portions of the reservoir only if geoscience, engineering, or performance data and reliable technology establish the higher contact with reasonable certainty. Reserves which can be produced economically through application of improved recovery techniques (including fluid injection) are included in the proved classification when (i) successful testing by a pilot project in an area of the reservoir with properties no more favorable than in the reservoir as a whole, the operation of an installed program in the reservoir, or an analogous reservoir or other evidence using reliable technology establishes the reasonable certainty of the engineering analysis on which the project or program was based; and (ii) the project has been approved for development by all necessary parties and entities, including governmental entities. Existing economic conditions include prices and costs at which economic producibility from a reservoir is to be determined. The price used is the average price during the twelve-month period prior to the ending date of the period covered by the report, determined as an unweighted arithmetic average of the first-day-of-the-month price for each month within such period, unless prices are defined by contractual arrangements, excluding escalations based upon future conditions.
PUDs: Proved Undeveloped Reserves.
Proved Undeveloped Reserves: Proved oil and natural gas reserves that are expected to be recovered from new wells on undrilled acreage or from existing wells where a relatively major expenditure is required for recompletion. Reserves on undrilled acreage are limited to those drilling units offsetting productive units that are reasonably certain of production when drilled. Proved reserves for other undrilled units can be claimed only where it can be demonstrated with certainty that there is continuity of production from the existing productive formation. Under no circumstances should estimates for proved undeveloped reserves be attributable to any acreage for which an application of fluid injection or other improved recovery technique is contemplated, unless such techniques have been proved effective by actual tests in the area and in the same reservoir.
Realized Price: The cash market price less all expected quality, transportation and demand adjustments.
Recompletion: The completion for production of an existing wellbore in another formation from that which the well has been previously completed.
Reliable Technology: Reliable technology is a grouping of one or more technologies (including computational methods) that has been field tested and has been demonstrated to provide reasonably certain results with consistency and repeatability in the formation being evaluated or in an analogous formation.
Reserve Life: A measure of the productive life of an oil and natural gas property or a group of properties, expressed in years. Reserve life is calculated by dividing proved reserve volumes at year-end by production volumes. In our calculation of reserve life, production volumes are adjusted, if necessary, to reflect property acquisitions and dispositions.
Reserves: Reserves are estimated remaining quantities of oil and natural gas and related substances anticipated to be economically producible, as of a given date, by application of development projects to known accumulations. In addition, there must exist, or there must be a reasonable expectation that there will exist, the legal right to produce or a revenue interest in the production, installed means of delivering oil and natural gas or related substances to market and all permits and financing required to implement the project. Reserves should not be assigned to adjacent reservoirs isolated by major, potentially sealing, faults until those reservoirs are
A-3
Table of Contents
penetrated and evaluated as economically producible. Reserves should not be assigned to areas that are clearly separated from a known accumulation by a non-productive reservoir (i.e., absence of reservoir, structurally low reservoir or negative test results). Such areas may contain prospective resources (i.e., potentially recoverable resources from undiscovered accumulations).
Reservoir: A porous and permeable underground formation containing a natural accumulation of producible oil and/or natural gas that is confined by impermeable rock or water barriers and is individual and separate from other reserves.
Resources: Resources are quantities of oil and natural gas estimated to exist in naturally occurring accumulations. A portion of the resources may be estimated to be recoverable and another portion may be considered unrecoverable. Resources include both discovered and undiscovered accumulations.
Spacing: The distance between wells producing from the same reservoir. Spacing is often expressed in terms of acres (e.g., 40-acre spacing) and is often established by regulatory agencies.
Undeveloped Acreage: Lease acreage on which wells have not been drilled or completed to a point that would permit the production of commercial quantities of oil and natural gas regardless of whether such acreage contains proved reserves.
Wellbore: The hole drilled by the bit that is equipped for oil or natural gas production on a completed well. Also called well or borehole.
Working Interest: An interest in an oil and natural gas lease that gives the owner of the interest the right to drill for and produce oil and natural gas on the leased acreage and requires the owner to pay a share of the costs of drilling and production operations.
WTI: West Texas Intermediate.
A-4
Table of Contents
|
|
CHAIRMAN & CEO C.H. (SCOTT) REES III PRESIDENT & COO DANNY D. SIMMONS EXECUTIVE VP G. LANCE BINDER |
EXECUTIVE COMMITTEE P. SCOTT FROST – DALLAS J. CARTER HENSON, JR. – HOUSTON DAN PAUL SMITH – DALLAS JOSEPH J. SPELLMAN – DALLAS THOMAS J. TELLA II – DALLAS |

April 3, 2014
Mr. John A. Weinzierl
Memorial Resource Development LLC
1301 McKinney Street, Suite 2100
Houston, Texas 77010
Dear Mr. Weinzierl:
In accordance with your request, we have estimated the proved reserves and future revenue, as of December 31, 2013, to the Memorial Resource Development LLC (MRD) interest in certain oil and gas properties located in Colorado, Louisiana, Oklahoma, Texas, and Wyoming. Memorial Resource Development LLC owns its interest in these properties through its subsidiaries Black Diamond Minerals, LLC; Classic Hydrocarbons, Inc. (Classic IV); and WildHorse Resources, LLC (WHR). The WHR portion of the MRD interest shown herein comprises the WHR interest owned by MRD as of December 31, 2013, and the NGP Income Co-Investment Opportunities Fund II, LP interest managed by WHR. We completed our evaluation on or about the date of this letter. It is our understanding that the proved reserves estimated in this report constitute all of the proved reserves owned by MRD (other than those attributable to BlueStone Natural Resources Holdings, LLC; Memorial Production Partners LP; and their respective subsidiaries). The estimates in this report have been prepared in accordance with the definitions and regulations of the U.S. Securities and Exchange Commission (SEC) and, with the exception of the exclusion of future income taxes, conform to the FASB Accounting Standards Codification Topic 932, Extractive Activities—Oil and Gas. Definitions are presented immediately following this letter. This report has been prepared for Memorial Resource Development LLC’s use in filing with the SEC; in our opinion the assumptions, data, methods, and procedures used in the preparation of this report are appropriate for such purpose.
We estimate the net reserves and future net revenue to the MRD interest in these properties, as of December 31, 2013, to be:
| Net Reserves | Future Net Revenue (M$) | |||||||||||||||||||
| Category |
Oil (MBBL) |
NGL (MBBL) |
Gas(1) (MMCF) |
Total | Present Worth at 10% |
|||||||||||||||
| Proved Developed Producing |
2,625.8 | 12,259.9 | 234,036.9 | 1,014,683.4 | 610,303.5 | |||||||||||||||
| Proved Developed Non-Producing |
776.9 | 1,644.9 | 29,760.0 | 159,150.0 | 92,615.4 | |||||||||||||||
| Proved Undeveloped |
7,907.9 | 28,671.9 | 538,457.1 | 1,608,681.2 | 766,033.0 | |||||||||||||||
|
|
|
|
|
|
|
|
|
|
|
|||||||||||
| Total Proved |
11,310.5 | 42,576.7 | 802,254.1 | 2,782,514.7 | 1,468,952.1 | |||||||||||||||
Totals may not add because of rounding.
| (1) | Estimates of gas reserves include field fuel usage volumes for the WHR properties. |
The oil volumes shown include crude oil and condensate. Oil and natural gas liquids (NGL) volumes are expressed in thousands of barrels (MBBL); a barrel is equivalent to 42 United States gallons. Gas volumes are expressed in millions of cubic feet (MMCF) at standard temperature and pressure bases.
| 4500 THANKSGIVING TOWER Ÿ 1601 ELM STREET Ÿ DALLAS, TEXAS 75201-4754 Ÿ PH: 214-969-5401 Ÿ FAX: 214-969-5411 |
nsai@nsai-petro.com | |||
| 1221 LAMAR STREET, SUITE 1200 Ÿ HOUSTON, TEXAS 77010-3072 Ÿ PH: 713-654-4950 Ÿ FAX: 713-654-4951 |
netherlandsewell.com |
B-1
Table of Contents

The estimates shown in this report are for proved reserves. As requested, probable and possible reserves that exist for these properties have not been included. This report does not include any value that could be attributed to interests in undeveloped acreage beyond those tracts for which undeveloped reserves have been estimated. Reserves categorization conveys the relative degree of certainty; reserves subcategorization is based on development and production status. The estimates of reserves and future revenue included herein have not been adjusted for risk.
Gross revenue is MRD’s share of the gross (100 percent) revenue from the properties prior to any deductions. Future net revenue is after deductions for MRD’s share of production taxes, ad valorem taxes, capital costs, and operating expenses but before consideration of any income taxes. The future net revenue has been discounted at an annual rate of 10 percent to determine its present worth, which is shown to indicate the effect of time on the value of money. Future net revenue presented in this report, whether discounted or undiscounted, should not be construed as being the fair market value of the properties.
Prices used in this report are based on the 12-month unweighted arithmetic average of the first-day-of-the-month price for each month in the period January through December 2013. For oil and NGL volumes, the average Southwestern Wyoming Sweet posted price of $83.53 per barrel is used for properties located in Natrona and Sweetwater Counties, Wyoming, and the average West Texas Intermediate posted price of $93.42 per barrel is used for all other properties. These average posted prices are adjusted by lease for quality and regional and local price differentials. For gas volumes, the average CIG Rocky Mountains spot price of $3.527 per MMBTU is used for properties located in Colorado and Wyoming, and the average Henry Hub spot price of $3.670 per MMBTU is used for all other properties. These average spot prices are adjusted by lease for energy content, transportation fees, and regional and local price differentials. All prices are held constant throughout the lives of the properties. The average adjusted product prices weighted by production over the remaining lives of the properties are $100.26 per barrel of oil, $39.72 per barrel of NGL, and $3.656 per MCF of gas.
Operating costs used in this report are based on operating expense records of MRD. For nonoperated properties, these costs include the per-well overhead expenses allowed under joint operating agreements along with estimates of costs to be incurred at and below the district and field levels. Operating costs have been divided into per-well costs, per-unit-of-production costs, and workover costs. As requested, operating costs for the operated properties are limited to direct lease- and field-level costs and MRD’s estimate of the portion of its headquarters general and administrative overhead expenses necessary to operate the properties. Operating costs are not escalated for inflation.
Capital costs used in this report were provided by MRD and are based on authorizations for expenditure and actual costs from recent activity. Capital costs are included as required for workovers, new development wells, and production equipment. Based on our understanding of future development plans, a review of the records provided to us, and our knowledge of similar properties, we regard these estimated capital costs to be reasonable. Capital costs are not escalated for inflation. As requested, our estimates do not include any salvage value for the lease and well equipment or the cost of abandoning the properties.
For the purposes of this report, we did not perform any field inspection of the properties, nor did we examine the mechanical operation or condition of the wells and facilities. We have not investigated possible environmental liability related to the properties; therefore, our estimates do not include any costs due to such possible liability.
B-2
Table of Contents
We have made no investigation of potential volume and value imbalances resulting from overdelivery or underdelivery to the MRD interest. Therefore, our estimates of reserves and future revenue do not include adjustments for the settlement of any such imbalances; our projections are based on MRD receiving its net revenue interest share of estimated future gross production after field usage and shrinkage.
The reserves shown in this report are estimates only and should not be construed as exact quantities. Proved reserves are those quantities of oil and gas which, by analysis of engineering and geoscience data, can be estimated with reasonable certainty to be economically producible; probable and possible reserves are those additional reserves which are sequentially less certain to be recovered than proved reserves. Estimates of reserves may increase or decrease as a result of market conditions, future operations, changes in regulations, or actual reservoir performance. In addition to the primary economic assumptions discussed herein, our estimates are based on certain assumptions including, but not limited to, that the properties will be developed consistent with current development plans, that the properties will be operated in a prudent manner, that no governmental regulations or controls will be put in place that would impact the ability of the interest owner to recover the reserves, and that our projections of future production will prove consistent with actual performance. If the reserves are recovered, the revenues therefrom and the costs related thereto could be more or less than the estimated amounts. Because of governmental policies and uncertainties of supply and demand, the sales rates, prices received for the reserves, and costs incurred in recovering such reserves may vary from assumptions made while preparing this report.
For the purposes of this report, we used technical and economic data including, but not limited to, well logs, geologic maps, well test data, production data, historical price and cost information, and property ownership interests. The reserves in this report have been estimated using deterministic methods; these estimates have been prepared in accordance with the Standards Pertaining to the Estimating and Auditing of Oil and Gas Reserves Information promulgated by the Society of Petroleum Engineers (SPE Standards). We used standard engineering and geoscience methods, or a combination of methods, including performance analysis, volumetric analysis, and analogy, that we considered to be appropriate and necessary to categorize and estimate reserves in accordance with SEC definitions and regulations. For the Classic IV and WHR properties, a substantial portion of these reserves are for undeveloped locations and producing wells that lack sufficient production history upon which performance-related estimates of reserves can be based; such reserves are based on estimates of reservoir volumes and recovery efficiencies along with analogy to properties with similar geologic and reservoir characteristics. As in all aspects of oil and gas evaluation, there are uncertainties inherent in the interpretation of engineering and geoscience data; therefore, our conclusions necessarily represent only informed professional judgment.
B-3
Table of Contents
The data used in our estimates were obtained from MRD, public data sources, and the nonconfidential files of Netherland, Sewell & Associates, Inc. and were accepted as accurate. Supporting work data are on file in our office. We have not examined the titles to the properties or independently confirmed the actual degree or type of interest owned. The technical persons responsible for preparing the estimates presented herein meet the requirements regarding qualifications, independence, objectivity, and confidentiality set forth in the SPE Standards. We are independent petroleum engineers, geologists, geophysicists, and petrophysicists; we do not own an interest in these properties nor are we employed on a contingent basis.
| Sincerely, | ||||||
| NETHERLAND, SEWELL & ASSOCIATES, INC. | ||||||
| Texas Registered Engineering Firm F-2699 | ||||||
| By: | /s/ C.H. (Scott) Rees III | |||||
| C.H. (Scott) Rees III, P.E. | ||||||
| Chairman and Chief Executive Officer | ||||||
| By: | /s/ Justin S. Hamilton | By: | /s/ Allen E. Evans, Jr. | |||
| Justin S. Hamilton, P.E. 104999 | Allen E. Evans, Jr., P.G. 1286 | |||||
| Vice President | Vice President | |||||
| Date Signed: April 3, 2014 | Date Signed: April 3, 2014 | |||||
| JSH:JLO | ||||||
B-4
Table of Contents
DEFINITIONS OF OIL AND GAS RESERVES
Adapted from U.S. Securities and Exchange Commission Regulation S-X Section 210.4-10(a)
The following definitions are set forth in U.S. Securities and Exchange Commission (SEC) Regulation S-X Section 210.4-10(a). Also included is supplemental information from (1) the 2007 Petroleum Resources Management System approved by the Society of Petroleum Engineers, (2) the FASB Accounting Standards Codification Topic 932, Extractive Activities—Oil and Gas, and (3) the SEC’s Compliance and Disclosure Interpretations.
(1) Acquisition of properties. Costs incurred to purchase, lease or otherwise acquire a property, including costs of lease bonuses and options to purchase or lease properties, the portion of costs applicable to minerals when land including mineral rights is purchased in fee, brokers’ fees, recording fees, legal costs, and other costs incurred in acquiring properties.
(2) Analogous reservoir. Analogous reservoirs, as used in resources assessments, have similar rock and fluid properties, reservoir conditions (depth, temperature, and pressure) and drive mechanisms, but are typically at a more advanced stage of development than the reservoir of interest and thus may provide concepts to assist in the interpretation of more limited data and estimation of recovery. When used to support proved reserves, an “analogous reservoir” refers to a reservoir that shares the following characteristics with the reservoir of interest:
| (i) | Same geological formation (but not necessarily in pressure communication with the reservoir of interest); |
| (ii) | Same environment of deposition; |
| (iii) | Similar geological structure; and |
| (iv) | Same drive mechanism. |
Instruction to paragraph (a)(2): Reservoir properties must, in the aggregate, be no more favorable in the analog than in the reservoir of interest.
(3) Bitumen. Bitumen, sometimes referred to as natural bitumen, is petroleum in a solid or semi-solid state in natural deposits with a viscosity greater than 10,000 centipoise measured at original temperature in the deposit and atmospheric pressure, on a gas free basis. In its natural state it usually contains sulfur, metals, and other non-hydrocarbons.
(4) Condensate. Condensate is a mixture of hydrocarbons that exists in the gaseous phase at original reservoir temperature and pressure, but that, when produced, is in the liquid phase at surface pressure and temperature.
(5) Deterministic estimate. The method of estimating reserves or resources is called deterministic when a single value for each parameter (from the geoscience, engineering, or economic data) in the reserves calculation is used in the reserves estimation procedure.
(6) Developed oil and gas reserves. Developed oil and gas reserves are reserves of any category that can be expected to be recovered:
| (i) | Through existing wells with existing equipment and operating methods or in which the cost of the required equipment is relatively minor compared to the cost of a new well; and |
B-5
Table of Contents
DEFINITIONS OF OIL AND GAS RESERVES
Adapted from U.S. Securities and Exchange Commission Regulation S-X Section 210.4-10(a)
| (ii) | Through installed extraction equipment and infrastructure operational at the time of the reserves estimate if the extraction is by means not involving a well. |
Supplemental definitions from the 2007 Petroleum Resources Management System:
Developed Producing Reserves—Developed Producing Reserves are expected to be recovered from completion intervals that are open and producing at the time of the estimate. Improved recovery reserves are considered producing only after the improved recovery project is in operation.
Developed Non-Producing Reserves—Developed Non-Producing Reserves include shut-in and behind-pipe Reserves. Shut-in Reserves are expected to be recovered from (1) completion intervals which are open at the time of the estimate but which have not yet started producing, (2) wells which were shut-in for market conditions or pipeline connections, or (3) wells not capable of production for mechanical reasons. Behind-pipe Reserves are expected to be recovered from zones in existing wells which will require additional completion work or future recompletion prior to start of production. In all cases, production can be initiated or restored with relatively low expenditure compared to the cost of drilling a new well.
(7) Development costs. Costs incurred to obtain access to proved reserves and to provide facilities for extracting, treating, gathering and storing the oil and gas. More specifically, development costs, including depreciation and applicable operating costs of support equipment and facilities and other costs of development activities, are costs incurred to:
| (i) | Gain access to and prepare well locations for drilling, including surveying well locations for the purpose of determining specific development drilling sites, clearing ground, draining, road building, and relocating public roads, gas lines, and power lines, to the extent necessary in developing the proved reserves. |
| (ii) | Drill and equip development wells, development-type stratigraphic test wells, and service wells, including the costs of platforms and of well equipment such as casing, tubing, pumping equipment, and the wellhead assembly. |
| (iii) | Acquire, construct, and install production facilities such as lease flow lines, separators, treaters, heaters, manifolds, measuring devices, and production storage tanks, natural gas cycling and processing plants, and central utility and waste disposal systems. |
| (iv) | Provide improved recovery systems. |
(8) Development project. A development project is the means by which petroleum resources are brought to the status of economically producible. As examples, the development of a single reservoir or field, an incremental development in a producing field, or the integrated development of a group of several fields and associated facilities with a common ownership may constitute a development project.
(9) Development well. A well drilled within the proved area of an oil or gas reservoir to the depth of a stratigraphic horizon known to be productive.
(10) Economically producible. The term economically producible, as it relates to a resource, means a resource which generates revenue that exceeds, or is reasonably expected to exceed, the costs of the operation. The value of the products that generate revenue shall be determined at the terminal point of oil and gas producing activities as defined in paragraph (a)(16) of this section.
(11) Estimated ultimate recovery (EUR). Estimated ultimate recovery is the sum of reserves remaining as of a given date and cumulative production as of that date.
B-6
Table of Contents
DEFINITIONS OF OIL AND GAS RESERVES
Adapted from U.S. Securities and Exchange Commission Regulation S-X Section 210.4-10(a)
(12) Exploration costs. Costs incurred in identifying areas that may warrant examination and in examining specific areas that are considered to have prospects of containing oil and gas reserves, including costs of drilling exploratory wells and exploratory-type stratigraphic test wells. Exploration costs may be incurred both before acquiring the related property (sometimes referred to in part as prospecting costs) and after acquiring the property. Principal types of exploration costs, which include depreciation and applicable operating costs of support equipment and facilities and other costs of exploration activities, are:
| (i) | Costs of topographical, geographical and geophysical studies, rights of access to properties to conduct those studies, and salaries and other expenses of geologists, geophysical crews, and others conducting those studies. Collectively, these are sometimes referred to as geological and geophysical or “G&G” costs. |
| (ii) | Costs of carrying and retaining undeveloped properties, such as delay rentals, ad valorem taxes on properties, legal costs for title defense, and the maintenance of land and lease records. |
| (iii) | Dry hole contributions and bottom hole contributions. |
| (iv) | Costs of drilling and equipping exploratory wells. |
| (v) | Costs of drilling exploratory-type stratigraphic test wells. |
(13) Exploratory well. An exploratory well is a well drilled to find a new field or to find a new reservoir in a field previously found to be productive of oil or gas in another reservoir. Generally, an exploratory well is any well that is not a development well, an extension well, a service well, or a stratigraphic test well as those items are defined in this section.
(14) Extension well. An extension well is a well drilled to extend the limits of a known reservoir.
(15) Field. An area consisting of a single reservoir or multiple reservoirs all grouped on or related to the same individual geological structural feature and/or stratigraphic condition. There may be two or more reservoirs in a field which are separated vertically by intervening impervious strata, or laterally by local geologic barriers, or by both. Reservoirs that are associated by being in overlapping or adjacent fields may be treated as a single or common operational field. The geological terms “structural feature” and “stratigraphic condition” are intended to identify localized geological features as opposed to the broader terms of basins, trends, provinces, plays, areas-of-interest, etc.
(16) Oil and gas producing activities.
| (i) | Oil and gas producing activities include: |
| (A) | The search for crude oil, including condensate and natural gas liquids, or natural gas (“oil and gas”) in their natural states and original locations; |
| (B) | The acquisition of property rights or properties for the purpose of further exploration or for the purpose of removing the oil or gas from such properties; |
| (C) | The construction, drilling, and production activities necessary to retrieve oil and gas from their natural reservoirs, including the acquisition, construction, installation, and maintenance of field gathering and storage systems, such as: |
| (1) | Lifting the oil and gas to the surface; and |
B-7
Table of Contents
DEFINITIONS OF OIL AND GAS RESERVES
Adapted from U.S. Securities and Exchange Commission Regulation S-X Section 210.4-10(a)
| (2) | Gathering, treating, and field processing (as in the case of processing gas to extract liquid hydrocarbons); and |
| (D) | Extraction of saleable hydrocarbons, in the solid, liquid, or gaseous state, from oil sands, shale, coalbeds, or other nonrenewable natural resources which are intended to be upgraded into synthetic oil or gas, and activities undertaken with a view to such extraction. |
Instruction 1 to paragraph (a)(16)(i): The oil and gas production function shall be regarded as ending at a “terminal point”, which is the outlet valve on the lease or field storage tank. If unusual physical or operational circumstances exist, it may be appropriate to regard the terminal point for the production function as:
| a. | The first point at which oil, gas, or gas liquids, natural or synthetic, are delivered to a main pipeline, a common carrier, a refinery, or a marine terminal; and |
| b. | In the case of natural resources that are intended to be upgraded into synthetic oil or gas, if those natural resources are delivered to a purchaser prior to upgrading, the first point at which the natural resources are delivered to a main pipeline, a common carrier, a refinery, a marine terminal, or a facility which upgrades such natural resources into synthetic oil or gas. |
Instruction 2 to paragraph (a)(16)(i): For purposes of this paragraph (a)(16), the term saleable hydrocarbons means hydrocarbons that are saleable in the state in which the hydrocarbons are delivered.
| (ii) | Oil and gas producing activities do not include: |
| (A) | Transporting, refining, or marketing oil and gas; |
| (B) | Processing of produced oil, gas, or natural resources that can be upgraded into synthetic oil or gas by a registrant that does not have the legal right to produce or a revenue interest in such production; |
| (C) | Activities relating to the production of natural resources other than oil, gas, or natural resources from which synthetic oil and gas can be extracted; or |
| (D) | Production of geothermal steam. |
(17) Possible reserves. Possible reserves are those additional reserves that are less certain to be recovered than probable reserves.
| (i) | When deterministic methods are used, the total quantities ultimately recovered from a project have a low probability of exceeding proved plus probable plus possible reserves. When probabilistic methods are used, there should be at least a 10% probability that the total quantities ultimately recovered will equal or exceed the proved plus probable plus possible reserves estimates. |
| (ii) | Possible reserves may be assigned to areas of a reservoir adjacent to probable reserves where data control and interpretations of available data are progressively less certain. Frequently, this will be in areas where geoscience and engineering data are unable to define clearly the area and vertical limits of commercial production from the reservoir by a defined project. |
| (iii) | Possible reserves also include incremental quantities associated with a greater percentage recovery of the hydrocarbons in place than the recovery quantities assumed for probable reserves. |
| (iv) | The proved plus probable and proved plus probable plus possible reserves estimates must be based on reasonable alternative technical and commercial interpretations within the reservoir or subject project that are clearly documented, including comparisons to results in successful similar projects. |
B-8
Table of Contents
DEFINITIONS OF OIL AND GAS RESERVES
Adapted from U.S. Securities and Exchange Commission Regulation S-X Section 210.4-10(a)
| (v) | Possible reserves may be assigned where geoscience and engineering data identify directly adjacent portions of a reservoir within the same accumulation that may be separated from proved areas by faults with displacement less than formation thickness or other geological discontinuities and that have not been penetrated by a wellbore, and the registrant believes that such adjacent portions are in communication with the known (proved) reservoir. Possible reserves may be assigned to areas that are structurally higher or lower than the proved area if these areas are in communication with the proved reservoir. |
| (vi) | Pursuant to paragraph (a)(22)(iii) of this section, where direct observation has defined a highest known oil (HKO) elevation and the potential exists for an associated gas cap, proved oil reserves should be assigned in the structurally higher portions of the reservoir above the HKO only if the higher contact can be established with reasonable certainty through reliable technology. Portions of the reservoir that do not meet this reasonable certainty criterion may be assigned as probable and possible oil or gas based on reservoir fluid properties and pressure gradient interpretations. |
(18) Probable reserves. Probable reserves are those additional reserves that are less certain to be recovered than proved reserves but which, together with proved reserves, are as likely as not to be recovered.
| (i) | When deterministic methods are used, it is as likely as not that actual remaining quantities recovered will exceed the sum of estimated proved plus probable reserves. When probabilistic methods are used, there should be at least a 50% probability that the actual quantities recovered will equal or exceed the proved plus probable reserves estimates. |
| (ii) | Probable reserves may be assigned to areas of a reservoir adjacent to proved reserves where data control or interpretations of available data are less certain, even if the interpreted reservoir continuity of structure or productivity does not meet the reasonable certainty criterion. Probable reserves may be assigned to areas that are structurally higher than the proved area if these areas are in communication with the proved reservoir. |
| (iii) | Probable reserves estimates also include potential incremental quantities associated with a greater percentage recovery of the hydrocarbons in place than assumed for proved reserves. |
| (iv) | See also guidelines in paragraphs (a)(17)(iv) and (a)(17)(vi) of this section. |
(19) Probabilistic estimate. The method of estimation of reserves or resources is called probabilistic when the full range of values that could reasonably occur for each unknown parameter (from the geoscience and engineering data) is used to generate a full range of possible outcomes and their associated probabilities of occurrence.
(20) Production costs.
| (i) | Costs incurred to operate and maintain wells and related equipment and facilities, including depreciation and applicable operating costs of support equipment and facilities and other costs of operating and maintaining those wells and related equipment and facilities. They become part of the cost of oil and gas produced. Examples of production costs (sometimes called lifting costs) are: |
| (A) | Costs of labor to operate the wells and related equipment and facilities. |
| (B) | Repairs and maintenance. |
B-9
Table of Contents
DEFINITIONS OF OIL AND GAS RESERVES
Adapted from U.S. Securities and Exchange Commission Regulation S-X Section 210.4-10(a)
| (C) | Materials, supplies, and fuel consumed and supplies utilized in operating the wells and related equipment and facilities. |
| (D) | Property taxes and insurance applicable to proved properties and wells and related equipment and facilities. |
| (E) | Severance taxes. |
| (ii) | Some support equipment or facilities may serve two or more oil and gas producing activities and may also serve transportation, refining, and marketing activities. To the extent that the support equipment and facilities are used in oil and gas producing activities, their depreciation and applicable operating costs become exploration, development or production costs, as appropriate. Depreciation, depletion, and amortization of capitalized acquisition, exploration, and development costs are not production costs but also become part of the cost of oil and gas produced along with production (lifting) costs identified above. |
(21) Proved area. The part of a property to which proved reserves have been specifically attributed.
(22) Proved oil and gas reserves. Proved oil and gas reserves are those quantities of oil and gas, which, by analysis of geoscience and engineering data, can be estimated with reasonable certainty to be economically producible—from a given date forward, from known reservoirs, and under existing economic conditions, operating methods, and government regulations—prior to the time at which contracts providing the right to operate expire, unless evidence indicates that renewal is reasonably certain, regardless of whether deterministic or probabilistic methods are used for the estimation. The project to extract the hydrocarbons must have commenced or the operator must be reasonably certain that it will commence the project within a reasonable time.
| (i) | The area of the reservoir considered as proved includes: |
| (A) | The area identified by drilling and limited by fluid contacts, if any, and |
| (B) | Adjacent undrilled portions of the reservoir that can, with reasonable certainty, be judged to be continuous with it and to contain economically producible oil or gas on the basis of available geoscience and engineering data. |
| (ii) | In the absence of data on fluid contacts, proved quantities in a reservoir are limited by the lowest known hydrocarbons (LKH) as seen in a well penetration unless geoscience, engineering, or performance data and reliable technology establishes a lower contact with reasonable certainty. |
| (iii) | Where direct observation from well penetrations has defined a highest known oil (HKO) elevation and the potential exists for an associated gas cap, proved oil reserves may be assigned in the structurally higher portions of the reservoir only if geoscience, engineering, or performance data and reliable technology establish the higher contact with reasonable certainty. |
| (iv) | Reserves which can be produced economically through application of improved recovery techniques (including, but not limited to, fluid injection) are included in the proved classification when: |
| (A) | Successful testing by a pilot project in an area of the reservoir with properties no more favorable than in the reservoir as a whole, the operation of an installed program in the reservoir or an analogous reservoir, or other evidence using reliable technology establishes the reasonable certainty of the engineering analysis on which the project or program was based; and |
B-10
Table of Contents
DEFINITIONS OF OIL AND GAS RESERVES
Adapted from U.S. Securities and Exchange Commission Regulation S-X Section 210.4-10(a)
| (B) | The project has been approved for development by all necessary parties and entities, including governmental entities. |
| (v) | Existing economic conditions include prices and costs at which economic producibility from a reservoir is to be determined. The price shall be the average price during the 12-month period prior to the ending date of the period covered by the report, determined as an unweighted arithmetic average of the first-day-of-the-month price for each month within such period, unless prices are defined by contractual arrangements, excluding escalations based upon future conditions. |
(23) Proved properties. Properties with proved reserves.
(24) Reasonable certainty. If deterministic methods are used, reasonable certainty means a high degree of confidence that the quantities will be recovered. If probabilistic methods are used, there should be at least a 90% probability that the quantities actually recovered will equal or exceed the estimate. A high degree of confidence exists if the quantity is much more likely to be achieved than not, and, as changes due to increased availability of geoscience (geological, geophysical, and geochemical), engineering, and economic data are made to estimated ultimate recovery (EUR) with time, reasonably certain EUR is much more likely to increase or remain constant than to decrease.
(25) Reliable technology. Reliable technology is a grouping of one or more technologies (including computational methods) that has been field tested and has been demonstrated to provide reasonably certain results with consistency and repeatability in the formation being evaluated or in an analogous formation.
(26) Reserves. Reserves are estimated remaining quantities of oil and gas and related substances anticipated to be economically producible, as of a given date, by application of development projects to known accumulations. In addition, there must exist, or there must be a reasonable expectation that there will exist, the legal right to produce or a revenue interest in the production, installed means of delivering oil and gas or related substances to market, and all permits and financing required to implement the project.
Note to paragraph (a)(26): Reserves should not be assigned to adjacent reservoirs isolated by major, potentially sealing, faults until those reservoirs are penetrated and evaluated as economically producible. Reserves should not be assigned to areas that are clearly separated from a known accumulation by a non-productive reservoir (i.e., absence of reservoir, structurally low reservoir, or negative test results). Such areas may contain prospective resources (i.e., potentially recoverable resources from undiscovered accumulations).
B-11
Table of Contents
DEFINITIONS OF OIL AND GAS RESERVES
Adapted from U.S. Securities and Exchange Commission Regulation S-X Section 210.4-10(a)
Excerpted from the FASB Accounting Standards Codification Topic 932, Extractive Activities—Oil and Gas:
932-235-50-30 A standardized measure of discounted future net cash flows relating to an entity’s interests in both of the following shall be disclosed as of the end of the year:
| a. | Proved oil and gas reserves (see paragraphs 932-235-50-3 through 50-11B) |
| b. | Oil and gas subject to purchase under long-term supply, purchase, or similar agreements and contracts in which the entity participates in the operation of the properties on which the oil or gas is located or otherwise serves as the producer of those reserves (see paragraph 932-235-50-7). |
The standardized measure of discounted future net cash flows relating to those two types of interests in reserves may be combined for reporting purposes.
932-235-50-31 All of the following information shall be disclosed in the aggregate and for each geographic area for which reserve quantities are disclosed in accordance with paragraphs 932-235-50-3 through 50-11B:
| a. | Future cash inflows. These shall be computed by applying prices used in estimating the entity’s proved oil and gas reserves to the year-end quantities of those reserves. Future price changes shall be considered only to the extent provided by contractual arrangements in existence at year-end. |
| b. | Future development and production costs. These costs shall be computed by estimating the expenditures to be incurred in developing and producing the proved oil and gas reserves at the end of the year, based on year-end costs and assuming continuation of existing economic conditions. If estimated development expenditures are significant, they shall be presented separately from estimated production costs. |
| c. | Future income tax expenses. These expenses shall be computed by applying the appropriate year-end statutory tax rates, with consideration of future tax rates already legislated, to the future pretax net cash flows relating to the entity’s proved oil and gas reserves, less the tax basis of the properties involved. The future income tax expenses shall give effect to tax deductions and tax credits and allowances relating to the entity’s proved oil and gas reserves. |
| d. | Future net cash flows. These amounts are the result of subtracting future development and production costs and future income tax expenses from future cash inflows. |
| e. | Discount. This amount shall be derived from using a discount rate of 10 percent a year to reflect the timing of the future net cash flows relating to proved oil and gas reserves. |
| f. | Standardized measure of discounted future net cash flows. This amount is the future net cash flows less the computed discount. |
(27) Reservoir. A porous and permeable underground formation containing a natural accumulation of producible oil and/or gas that is confined by impermeable rock or water barriers and is individual and separate from other reservoirs.
(28) Resources. Resources are quantities of oil and gas estimated to exist in naturally occurring accumulations. A portion of the resources may be estimated to be recoverable, and another portion may be considered to be unrecoverable. Resources include both discovered and undiscovered accumulations.
(29) Service well. A well drilled or completed for the purpose of supporting production in an existing field. Specific purposes of service wells include gas injection, water injection, steam injection, air injection, salt-water disposal, water supply for injection, observation, or injection for in-situ combustion.
(30) Stratigraphic test well. A stratigraphic test well is a drilling effort, geologically directed, to obtain information pertaining to a specific geologic condition. Such wells customarily are drilled without the intent of being completed for hydrocarbon production. The classification also includes tests identified as core tests and all types of expendable holes related to hydrocarbon exploration. Stratigraphic tests are classified as “exploratory type” if not drilled in a known area or “development type” if drilled in a known area.
B-12
Table of Contents
DEFINITIONS OF OIL AND GAS RESERVES
Adapted from U.S. Securities and Exchange Commission Regulation S-X Section 210.4-10(a)
(31) Undeveloped oil and gas reserves. Undeveloped oil and gas reserves are reserves of any category that are expected to be recovered from new wells on undrilled acreage, or from existing wells where a relatively major expenditure is required for recompletion.
| (i) | Reserves on undrilled acreage shall be limited to those directly offsetting development spacing areas that are reasonably certain of production when drilled, unless evidence using reliable technology exists that establishes reasonable certainty of economic producibility at greater distances. |
| (ii) | Undrilled locations can be classified as having undeveloped reserves only if a development plan has been adopted indicating that they are scheduled to be drilled within five years, unless the specific circumstances, justify a longer time. |
From the SEC’s Compliance and Disclosure Interpretations (October 26, 2009):
Although several types of projects—such as constructing offshore platforms and development in urban areas, remote locations or environmentally sensitive locations—by their nature customarily take a longer time to develop and therefore often do justify longer time periods, this determination must always take into consideration all of the facts and circumstances. No particular type of project per se justifies a longer time period, and any extension beyond five years should be the exception, and not the rule.
Factors that a company should consider in determining whether or not circumstances justify recognizing reserves even though development may extend past five years include, but are not limited to, the following:
| • | The company’s level of ongoing significant development activities in the area to be developed (for example, drilling only the minimum number of wells necessary to maintain the lease generally would not constitute significant development activities); |
| • | The company’s historical record at completing development of comparable long-term projects; |
| • | The amount of time in which the company has maintained the leases, or booked the reserves, without significant development activities; |
| • | The extent to which the company has followed a previously adopted development plan (for example, if a company has changed its development plan several times without taking significant steps to implement any of those plans, recognizing proved undeveloped reserves typically would not be appropriate); and |
| • | The extent to which delays in development are caused by external factors related to the physical operating environment (for example, restrictions on development on Federal lands, but not obtaining government permits), rather than by internal factors (for example, shifting resources to develop properties with higher priority). |
| (iii) | Under no circumstances shall estimates for undeveloped reserves be attributable to any acreage for which an application of fluid injection or other improved recovery technique is contemplated, unless such techniques have been proved effective by actual projects in the same reservoir or an analogous reservoir, as defined in paragraph (a)(2) of this section, or by other evidence using reliable technology establishing reasonable certainty. |
(32) Unproved properties. Properties with no proved reserves.
B-13
Table of Contents
|
|
CHAIRMAN & CEO C.H. (SCOTT) REES III PRESIDENT & COO DANNY D. SIMMONS EXECUTIVE VP G. LANCE BINDER |
EXECUTIVE COMMITTEE P. SCOTT FROST – DALLAS J. CARTER HENSON, JR. – HOUSTON DAN PAUL SMITH – DALLAS JOSEPH J. SPELLMAN – DALLAS THOMAS J. TELLA II – DALLAS |
April 4, 2014
Mr. John A. Weinzierl
Memorial Resource Development LLC
1301 McKinney Street, Suite 2100
Houston, Texas 77010
Dear Mr. Weinzierl:
In accordance with your request, we have audited the estimates prepared by Memorial Resource Development LLC and its subsidiaries (collectively referred to herein as “MRD”), as of December 31, 2013, of the probable, and possible reserves and future revenue to the Memorial Resource Development LLC interest in certain oil and gas properties located in Colorado, Louisiana, Oklahoma, and Texas. Our estimates of proved reserves and future revenue for these properties are set forth in our report dated April 3, 2014. Memorial Resource Development LLC owns its interest in these properties through its subsidiaries Black Diamond Minerals, LLC; Classic Hydrocarbons, Inc.; and WildHorse Resources, LLC (WHR). It is our understanding that the probable and possible reserves estimated in this report constitute all of the probable and possible reserves owned by MRD (other than those attributable to BlueStone Natural Resources Holdings, LLC; Memorial Production Partners LP; and their respective subsidiaries). We have examined the estimates with respect to reserves quantities, reserves categorization, future producing rates, future net revenue, and the present value of such future net revenue, using the definitions set forth in U.S. Securities and Exchange Commission (SEC) Regulation S-X Rule 4-10(a). The estimates of reserves and future revenue have been prepared in accordance with the definitions and regulations of the SEC and, with the exception of the exclusion of future income taxes, conform to the FASB Accounting Standards Codification Topic 932, Extractive Activities—Oil and Gas. We completed our audit on or about the date of this letter. This report has been prepared for Memorial Resource Development LLC’s use in filing with the SEC; in our opinion the assumptions, data, methods, and procedures used in the preparation of this report are appropriate for such purpose.
The following table sets forth MRD’s estimates of the net reserves and future net revenue, as of December 31, 2013, for the audited properties:
| Net Reserves | Future Net Revenue (M$) | |||||||||||||||||||
| Category |
Oil (MBBL) |
NGL (MBBL) |
Gas(1) (MMCF) |
Total | Present Worth at 10% |
|||||||||||||||
| Probable |
10,479.7 | 33,708.9 | 535,185.3 | 2,148,275.7 | 1,052,242.6 | |||||||||||||||
| Possible |
14,071.6 | 43,517.1 | 688,700.6 | 3,226,515.1 | 1,342,304.4 | |||||||||||||||
| (1) | Estimates of gas reserves include field fuel usage volumes for the WHR properties. |
The oil volumes shown include crude oil and condensate. Oil and natural gas liquids (NGL) volumes are expressed in thousands of barrels (MBBL); a barrel is equivalent to 42 United States gallons. Gas volumes are expressed in millions of cubic feet (MMCF) at standard temperature and pressure bases.
When compared on a field-by-field basis, some of the estimates of MRD are greater and some are less than the estimates of Netherland, Sewell & Associates, Inc. (NSAI). However, in our opinion the estimates of MRD’s probable and possible reserves and future revenue shown herein are, in the aggregate, reasonable and have been
| 4500 THANKSGIVING TOWER Ÿ 1601 ELM STREET Ÿ DALLAS, TEXAS 75201-4754 Ÿ PH: 214-969-5401 Ÿ FAX: 214-969-5411 |
nsai@nsai-petro.com | |||
| 1221 LAMAR STREET, SUITE 1200 Ÿ HOUSTON, TEXAS 77010-3072 Ÿ PH: 713-654-4950 Ÿ FAX: 713-654-4951 |
netherlandsewell.com |
B-14
Table of Contents
prepared in accordance with the Standards Pertaining to the Estimating and Auditing of Oil and Gas Reserves Information promulgated by the Society of Petroleum Engineers (SPE Standards). Additionally, these estimates are within the recommended 10 percent tolerance threshold set forth in the SPE Standards. We are satisfied with the methods and procedures used by MRD in preparing the December 31, 2013, estimates of reserves and future revenue, and we saw nothing of an unusual nature that would cause us to take exception with the estimates, in the aggregate, as prepared by MRD.
The estimates shown herein are for probable and possible reserves; a substantial portion of these reserves are for undeveloped locations. MRD’s estimates do not include any value for undeveloped acreage beyond those tracts for which undeveloped reserves have been estimated. Reserves categorization conveys the relative degree of certainty; reserves subcategorization is based on development and production status. The estimates of reserves and future revenue included herein have not been adjusted for risk.
Prices used by MRD are based on the 12-month unweighted arithmetic average of the first-day-of-the-month price for each month in the period January through December 2013. For oil and NGL volumes, the average West Texas Intermediate posted price of $93.42 per barrel is adjusted by lease for quality and regional and local price differentials. For gas volumes, the average CIG Rocky Mountains spot price of $3.527 per MMBTU is used for properties located in Colorado, and the average Henry Hub spot price of $3.670 per MMBTU is used for all other properties. These average spot prices are adjusted by lease for energy content, transportation fees, and regional and local price differentials. All prices are held constant throughout the lives of the properties.
Operating costs used by MRD are based on historical operating expense records. For nonoperated properties, these costs include the per-well overhead expenses allowed under joint operating agreements along with estimates of costs to be incurred at and below the district and field levels. Operating costs have been divided into per-well costs, per-unit-of-production costs, and workover costs. Operating costs for the operated properties are limited to direct lease- and field-level costs and MRD’s estimate of the portion of its headquarters general and administrative overhead expenses necessary to operate the properties. Capital costs used by MRD are based on authorizations for expenditure and actual costs from recent activity. Capital costs are included as required for workovers, new development wells, and production equipment. Operating costs and capital costs are not escalated for inflation. Estimates do not include any salvage value for the lease and well equipment or the cost of abandoning the properties.
The reserves shown in this report are estimates only and should not be construed as exact quantities. Proved reserves are those quantities of oil and gas which, by analysis of engineering and geoscience data, can be estimated with reasonable certainty to be economically producible; probable and possible reserves are those additional reserves which are sequentially less certain to be recovered than proved reserves. Estimates of reserves may increase or decrease as a result of market conditions, future operations, changes in regulations, or actual reservoir performance. In addition to the primary economic assumptions discussed herein, estimates of MRD and NSAI are based on certain assumptions including, but not limited to, that the properties will be developed consistent with current development plans, that the properties will be operated in a prudent manner, that no governmental regulations or controls will be put in place that would impact the ability of the interest owner to recover the reserves, and that projections of future production will prove consistent with actual performance. If the reserves are recovered, the revenues therefrom and the costs related thereto could be more or less than the estimated amounts. Because of governmental policies and uncertainties of supply and demand, the sales rates, prices received for the reserves, and costs incurred in recovering such reserves may vary from assumptions made while preparing these estimates.
B-15
Table of Contents
It should be understood that our audit does not constitute a complete reserves study of the audited oil and gas properties. Our audit consisted primarily of substantive testing, wherein we conducted a detailed review of all properties. In the conduct of our audit, we have not independently verified the accuracy and completeness of information and data furnished by MRD with respect to ownership interests, oil and gas production, well test data, historical costs of operation and development, product prices, or any agreements relating to current and future operations of the properties and sales of production. However, if in the course of our examination something came to our attention that brought into question the validity or sufficiency of any such information or data, we did not rely on such information or data until we had satisfactorily resolved our questions relating thereto or had independently verified such information or data. Our audit did not include a review of MRD’s overall reserves management processes and practices.
We used standard engineering and geoscience methods, or a combination of methods, including performance analysis, volumetric analysis, and analogy, that we considered to be appropriate and necessary to establish the conclusions set forth herein. As in all aspects of oil and gas evaluation, there are uncertainties inherent in the interpretation of engineering and geoscience data; therefore, our conclusions necessarily represent only informed professional judgment.
Supporting data documenting this audit, along with data provided by MRD, are on file in our office. The technical persons responsible for conducting this audit meet the requirements regarding qualifications, independence, objectivity, and confidentiality set forth in the SPE Standards. We are independent petroleum engineers, geologists, geophysicists, and petrophysicists; we do not own an interest in these properties nor are we employed on a contingent basis.
| Sincerely, | ||||||||
| NETHERLAND, SEWELL & ASSOCIATES, INC. | ||||||||
| Texas Registered Engineering Firm F-2699 | ||||||||
| By: | /s/ C.H. (Scott) Rees III | |||||||
| C.H. (Scott) Rees III, P.E. | ||||||||
| Chairman and Chief Executive Officer | ||||||||
| By: | /s/ Philip S. (Scott) Frost | By: | /s/ William J. Knights | |||||
| Philip S. (Scott) Frost, P.E. 88738 | William J. Knights, P.G. 1532 | |||||||
| Senior Vice President | Vice President | |||||||
| Date Signed: April 4, 2014 | Date Signed: April 4, 2014 | |||||||
| PSF:JLO | ||||||||
B-16
Table of Contents
Shares
Common Stock
PRELIMINARY PROSPECTUS
Citigroup
, 2014
Until , 2014 (25 days after the date of this prospectus), all dealers effecting transactions in these securities, whether or not participating in this offering, may be required to deliver a prospectus. This is in addition to the dealers’ obligation to deliver a prospectus when acting as an underwriter and with respect to their unsold allotments or subscriptions.
Table of Contents
PART II. INFORMATION NOT REQUIRED IN THE PROSPECTUS
Item 13. Other Expenses of Issuance and Distribution
The following table sets forth the estimated fees and expenses, other than underwriting discounts and commissions, paid or payable by the registrant in connection with the issuance and distribution of the common stock. All amounts are estimates except for the SEC registration, Financial Industry Regulatory Authority, Inc. and stock exchange and listing fees.
| SEC registration fee |
$ | 90,160 | ||
| Stock exchange filing fee and listing fee |
* | |||
| Transfer agent and registrar fees |
* | |||
| Printing and engraving costs |
* | |||
| Legal fees and expenses |
* | |||
| Accountants’ fees and expenses |
* | |||
| Financial Industry Regulatory Authority, Inc. filing fee |
* | |||
| Miscellaneous |
* | |||
|
|
|
|||
| Total |
$ | * | ||
|
|
|
| * | To be filed by amendment. |
Item 14. Indemnification of Directors and Officers
The Company is incorporated in Delaware. Section 145 of the Delaware General Corporation Law (“DGCL”) provides that a corporation may indemnify any person who was or is a party or is threatened to be made a party to any threatened, pending or completed action, suit or proceeding whether civil, criminal, administrative or investigative (other than an action by or in the right of the corporation) by reason of the fact that he is or was a director, officer, employee or agent of the corporation, or is or was serving at the request of the corporation as a director, officer, employee or agent of another corporation, partnership, joint venture, trust or other enterprise, against expenses (including attorneys’ fees), judgments, fines and amounts paid in settlement actually and reasonably incurred by him in connection with such action, suit or proceeding if he acted in good faith and in a manner he reasonably believed to be in or not opposed to the best interests of the corporation, and, with respect to any criminal action or proceeding, had no reasonable cause to believe his conduct was unlawful. Section 145 further provides that a corporation similarly may indemnify any such person serving in any such capacity who was or is a party or is threatened to be made a party to any threatened, pending or completed action or suit by or in the right of the corporation to procure a judgment in its favor by reason of the fact that he is or was a director, officer, employee or agent of the corporation or is or was serving at the request of the corporation as a director, officer, employee or agent of another corporation, partnership, joint venture, trust or other enterprise, against expenses (including attorneys’ fees) actually and reasonably incurred in connection with the defense or settlement of such action or suit if he acted in good faith and in a manner he reasonably believed to be in or not opposed to the best interests of the corporation and except that no indemnification shall be made in respect of any claim, issue or matter as to which such person shall have been adjudged to be liable to the corporation unless and only to the extent that the Delaware Court of Chancery or such other court in which such action or suit was brought shall determine upon application that, despite the adjudication of liability but in view of all of the circumstances of the case, such person is fairly and reasonably entitled to indemnity for such expenses which the Delaware Court of Chancery or such other court shall deem proper.
The Company’s certificate of incorporation provides that indemnification shall be to the fullest extent permitted by the DGCL for all current or former directors or officers of the Company. As permitted by the DGCL, the Company’s certificate of incorporation provides that directors of the Company shall have no personal liability to the Company or its stockholders for monetary damages for breach of fiduciary duty as a director, except to the extent that exculpation from liability is not permitted under the DGCL as in effect when such liability is determined.
II-1
Table of Contents
Item 15. Recent Sales of Unregistered Securities
Set forth below is certain information regarding securities issued by the registrant during the last three years in transactions that were not registered under the Securities Act of 1933, as amended (the “Securities Act”), including the consideration, if any, received by the registrant for such issuances.
In connection with its formation in January 2014, the Company issued 100 shares of its common stock to Memorial Resource Development LLC in exchange for consideration of $1.00. The issuance of these shares was exempt from the registration requirements of the Securities Act of 1933, as amended, or the Securities Act, pursuant to Section 4(2) of the Securities Act.
Item 16. Exhibits and Financial Statement Schedules
(a) Exhibits
See the Exhibit Index immediately following the signature page hereto, which is incorporated by reference as if fully set forth herein.
(b) Financial Statement Schedules
Schedules are omitted because they either are not required or are not applicable or because equivalent information has been included in the financial statements, the notes thereto or elsewhere herein.
Item 17. Undertakings
The undersigned registrant hereby undertakes to provide to the underwriters at the closing specified in the Underwriting Agreement certificates in such denominations and registered in such names as required by the underwriters to permit prompt delivery to each purchaser.
Insofar as indemnification for liabilities arising under the Securities Act of 1933 (the “Securities Act”) may be permitted to directors, officers and controlling persons of the registrant pursuant to the foregoing provisions, or otherwise, the registrant has been advised that in the opinion of the SEC such indemnification is against public policy as expressed in the Securities Act and is, therefore, unenforceable. In the event that a claim for indemnification against such liabilities (other than the payment by the registrant of expenses incurred or paid by a director, officer or controlling person of the Registrant in the successful defense of any action, suit or proceeding) is asserted by such director, officer or controlling person in connection with the securities being registered, the registrant will, unless in the opinion of its counsel the matter has been settled by controlling precedent, submit to a court of appropriate jurisdiction the question whether such indemnification by it is against public policy as expressed in the Securities Act and will be governed by the final adjudication of such issue.
The undersigned registrant hereby undertakes:
| (1) | For purposes of determining any liability under the Securities Act, the information omitted from the form of prospectus filed as part of this registration statement in reliance upon Rule 430A and contained in a form of prospectus filed by the Registrant pursuant to Rule 424(b)(1) or (4) or 497(h) under the Securities Act shall be deemed to be part of this registration statement as of the time it was declared effective. |
| (2) | For the purpose of determining any liability under the Securities Act, each post-effective amendment that contains a form of prospectus shall be deemed to be a new registration statement relating to the securities offered therein, and the offering of such securities at that time shall be deemed to be the initial bona fide offering thereof. |
II-2
Table of Contents
SIGNATURES
Pursuant to the requirements of the Securities Act of 1933, the registrant has duly caused this registration statement to be signed on its behalf by the undersigned, thereunto duly authorized, in Houston, Texas on the 4th day of April, 2014.
| MEMORIAL RESOURCE DEVELOPMENT CORP. | ||
| By: | /s/ John A. Weinzierl | |
| John A. Weinzierl | ||
| Chief Executive Officer | ||
POWER OF ATTORNEY
Each person whose signature appears below hereby constitutes and appoints John A. Weinzierl and Kyle N. Roane, and each of them, his true and lawful attorney-in-fact and agent with full power of substitution and resubstitution, for him and his name place and stead, in any and all capacities, to execute any and all amendments (including post-effective amendments) to this registration statement, to sign any registration statement filed pursuant to Rule 462(b) of the Securities Act of 1933, and to cause the same to be filed with all exhibits thereto, and all documents in connection therewith, with the Securities and Exchange Commission, granting unto said attorneys-in-fact and agents, and each of them, full power and authority to do and perform each and every act and thing requisite and desirable to be done in and about the premises as fully and to all intents and purposes as the undersigned might or could do in person, hereby ratifying and confirming all acts and things that said attorneys-in-fact and agents or any of them, or their or his substitute or substitutes may lawfully do or cause to be done by virtue hereof.
Pursuant to the requirements of the Securities Act of 1933, this registration statement has been signed below by the following persons in the capacities and on the dates indicated below.
| Signature |
Title |
Date | ||
| /s/ Tony R. Weber Tony R. Weber |
Chairman |
April 4, 2014 | ||
| /s/ John A. Weinzierl John A. Weinzierl |
Chief Executive Officer and Director (Principal Executive Officer) | April 4, 2014 | ||
| /s/ Dennis G. Venghaus Dennis G. Venghaus |
Chief Accounting Officer (Principal Financial and Accounting Officer) | April 4, 2014 | ||
| /s/ Scott A. Gieselman Scott A. Gieselman |
Director |
April 4, 2014 | ||
| /s/ Kenneth A. Hersh Kenneth A. Hersh |
Director |
April 4, 2014 | ||
Table of Contents
| Exhibit No. |
Exhibit Description | |||
| 1.1** | Form of Underwriting Agreement | |||
| 2.1## | Purchase and Sale Agreement between Memorial Resource Development LLC and Memorial Production Operating LLC, dated as of July 15, 2013 (incorporated by reference to Exhibit 2.5 to Memorial Production Partners LP’s Form 8-K (File No. 001-35364), filed with the SEC on July 16, 2013) | |||
| 3.3** | Form of Amended and Restated Certificate of Incorporation of Memorial Resource Development Corp. | |||
| 3.4** | Form of Amended and Restated Bylaws of Memorial Resource Development Corp. | |||
| 5.1** | Opinion of Akin Gump Strauss Hauer & Feld LLP as to the legality of securities being registered | |||
| 10.1** | Memorial Resource Development Corp. 2014 Incentive Award Plan | |||
| 10.2** | Voting Agreement, dated as of , 2014, between Memorial Resource Development LLC and Anthony Bahr and Jay Graham | |||
| 10.3** | Form of Registration Rights Agreement among Memorial Resource Development Corp. and certain stockholders | |||
| 10.4** | Services Agreement, dated as of , 2014, between Memorial Resource Development Corp. and WildHorse Resources Management Company, LLC | |||
| 10.5** | Credit Agreement, dated as of , 2014, by and among Memorial Resource Development, as the Borrower, the Lenders party thereto, , as Administrative Agent and Collateral Agent, and the other parties party thereto | |||
| 10.6** | Form of Change of Control Agreement | |||
| 21.1** | Subsidiaries of Memorial Resource Development Corp. | |||
| 23.1* | Consent of KPMG LLP, an independent registered public accounting firm | |||
| 23.2* | Consent of Netherland, Sewell & Associates, Inc. | |||
| 23.3** | Consent of Akin Gump Strauss Hauer & Feld LLP (contained in Exhibit 5.1) | |||
| 24.1* | Powers of attorney (included on the signature page to this registration statement) | |||
| 99.1* | Netherland, Sewell & Associates, Inc. reserve report for Memorial Resource Development LLC related to proved reserves as of December 31, 2013 (included as Appendix B-1 to the prospectus) | |||
| 99.2* | Netherland, Sewell & Associates, Inc. audit letter for Memorial Resource Development LLC related to management’s report of probable and possible reserves as of December 31, 2013 (included as Appendix B-2 to the prospectus) | |||
| 99.3* | Netherland, Sewell & Associates, Inc. reserve report for Memorial Production Partners LP as of December 31, 2013 | |||
| * | Filed herewith |
| ** | To be filed by amendment |
| ## | Pursuant to Item 601(b)(2) of Regulation S-K, the registrant agrees to furnish supplementally a copy of any omitted exhibit or schedule to the SEC upon request. |