Attached files
| file | filename |
|---|---|
| 8-K - 8-K - CBRE GROUP, INC. | a14-9897_18k.htm |
Exhibit 99.1
|
|
April 2014 CBRE GROUP, INC. Investor Presentation |
|
|
This presentation contains statements that are forward looking within the meaning of the Private Securities Litigation Reform Act of 1995, including statements regarding our future growth momentum, operations, financial performance, business outlook and ability to successfully integrate businesses we have acquired with our existing operations. These statements should be considered as estimates only and actual results may ultimately differ from these estimates. Except to the extent required by applicable securities laws, we undertake no obligation to update or publicly revise any of the forward-looking statements that you may hear today. Please refer to our most recent earnings report, filed on Form 8-K, our current annual report on Form 10-K and our current quarterly report on Form 10-Q, in particular any discussion of risk factors or forward-looking statements, which are filed with the SEC and available at the SEC’s website (www.sec.gov), for a full discussion of the risks and other factors that may impact any estimates that you may hear today. We may make certain statements during the course of this presentation, which include references to “non-GAAP financial measures,” as defined by SEC regulations. As required by these regulations, we have provided reconciliations of these measures to what we believe are the most directly comparable GAAP measures, which are attached hereto within the appendix. FORWARD-LOOKING STATEMENTS |
|
|
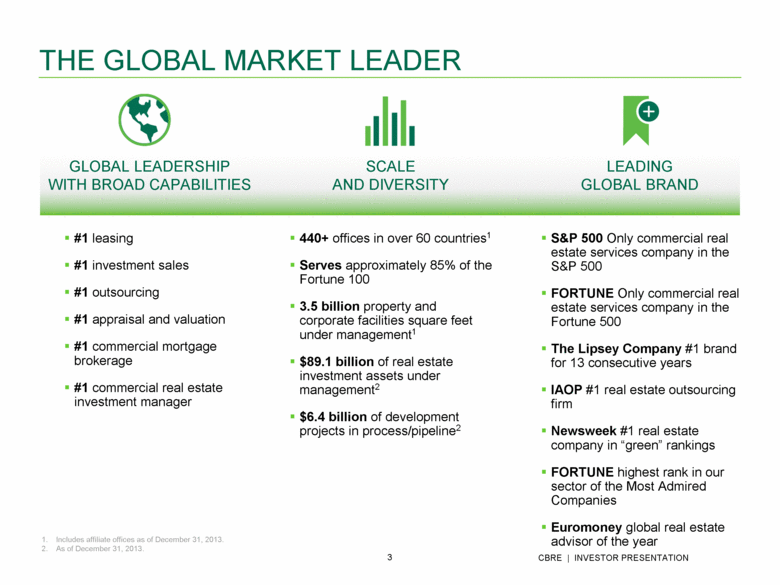
THE GLOBAL MARKET LEADER GLOBAL LEADERSHIP WITH BROAD CAPABILITIES SCALE AND DIVERSITY LEADING GLOBAL BRAND Includes affiliate offices as of December 31, 2013. As of December 31, 2013. #1 leasing #1 investment sales #1 outsourcing #1 appraisal and valuation #1 commercial mortgage brokerage #1 commercial real estate investment manager 440+ offices in over 60 countries1 Serves approximately 85% of the Fortune 100 3.5 billion property and corporate facilities square feet under management1 $89.1 billion of real estate investment assets under management2 $6.4 billion of development projects in process/pipeline2 S&P 500 Only commercial real estate services company in the S&P 500 FORTUNE Only commercial real estate services company in the Fortune 500 The Lipsey Company #1 brand for 13 consecutive years IAOP #1 real estate outsourcing firm Newsweek #1 real estate company in “green” rankings FORTUNE highest rank in our sector of the Most Admired Companies Euromoney global real estate advisor of the year |
|
|
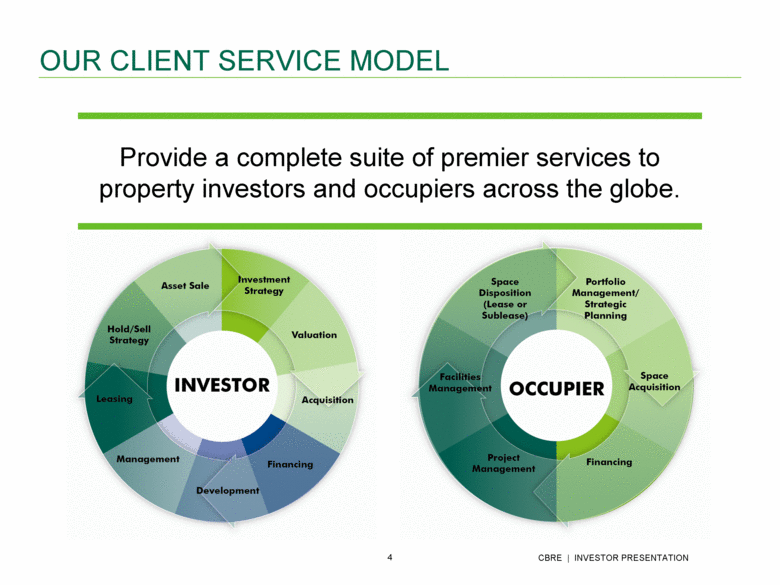
OUR CLIENT SERVICE MODEL Provide a complete suite of premier services to property investors and occupiers across the globe. |
|
|
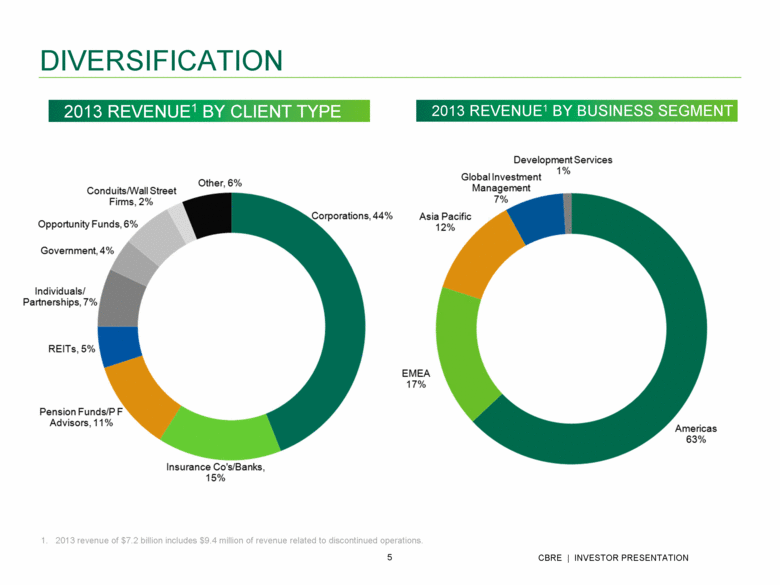
DIVERSIFICATION 2013 REVENUE1 BY CLIENT TYPE 2013 REVENUE1 BY BUSINESS SEGMENT 2013 revenue of $7.2 billion includes $9.4 million of revenue related to discontinued operations. |
|
|
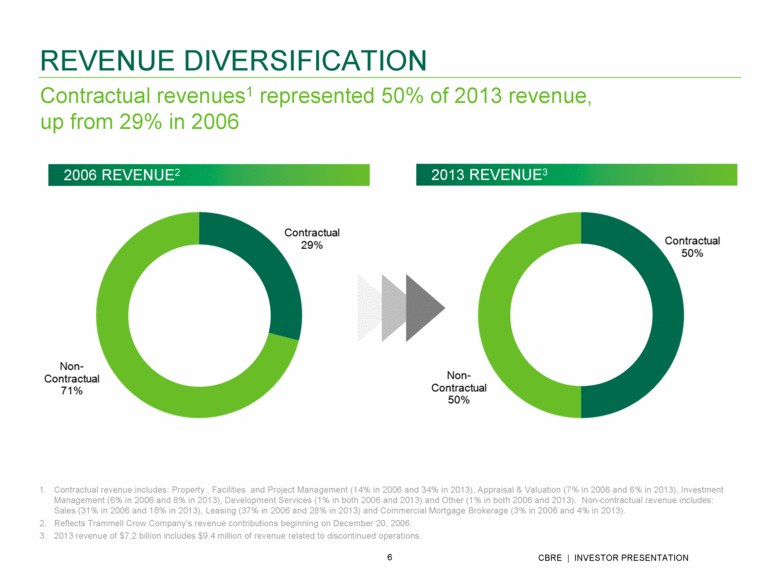
REVENUE DIVERSIFICATION Contractual revenue includes: Property , Facilities and Project Management (14% in 2006 and 34% in 2013), Appraisal & Valuation (7% in 2006 and 6% in 2013), Investment Management (6% in 2006 and 8% in 2013), Development Services (1% in both 2006 and 2013) and Other (1% in both 2006 and 2013). Non-contractual revenue includes: Sales (31% in 2006 and 18% in 2013), Leasing (37% in 2006 and 28% in 2013) and Commercial Mortgage Brokerage (3% in 2006 and 4% in 2013). Reflects Trammell Crow Company’s revenue contributions beginning on December 20, 2006. 2013 revenue of $7.2 billion includes $9.4 million of revenue related to discontinued operations. 2006 REVENUE2 2013 REVENUE3 Contractual revenues1 represented 50% of 2013 revenue, up from 29% in 2006 |
|
|
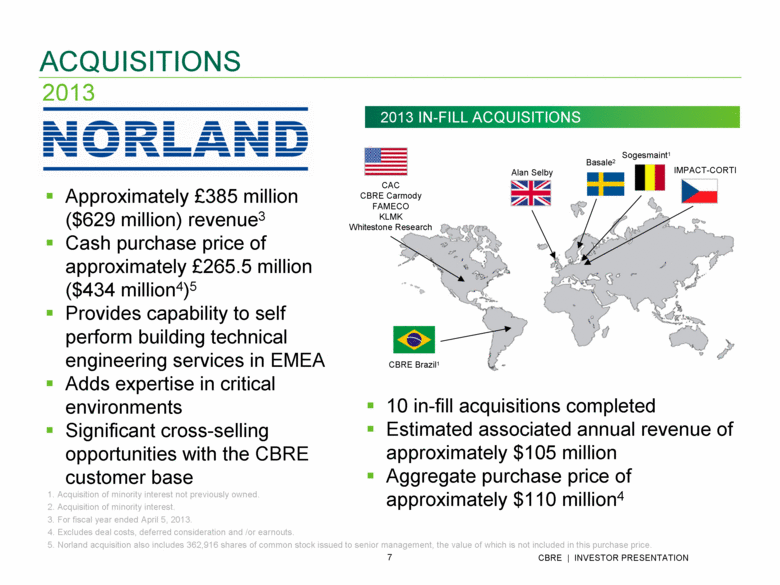
ACQUISITIONS 2013 Approximately £385 million ($629 million) revenue3 Cash purchase price of approximately £265.5 million ($434 million4)5 Provides capability to self perform building technical engineering services in EMEA Adds expertise in critical environments Significant cross-selling opportunities with the CBRE customer base CAC CBRE Carmody FAMECO KLMK Whitestone Research Alan Selby Sogesmaint1 10 in-fill acquisitions completed Estimated associated annual revenue of approximately $105 million Aggregate purchase price of approximately $110 million4 IMPACT-CORTI Basale2 CBRE Brazil1 2013 IN-FILL ACQUISITIONS Acquisition of minority interest not previously owned. Acquisition of minority interest. For fiscal year ended April 5, 2013. Excludes deal costs, deferred consideration and /or earnouts. Norland acquisition also includes 362,916 shares of common stock issued to senior management, the value of which is not included in this purchase price. |
|
|
Asia Pacific Revenue ▲7% ▲15% in local currency Growth led by property sales (up 50% in local currency) 2013 Region Highlights BUSINESS OVERVIEW EMEA Revenue▲18%▲17% in local currency Continued resurgence in property sales Double-digit growth across most major business lines Americas Revenue ▲10% Double-digit growth in sales, leasing and occupier outsourcing (in local currency) |
|
|
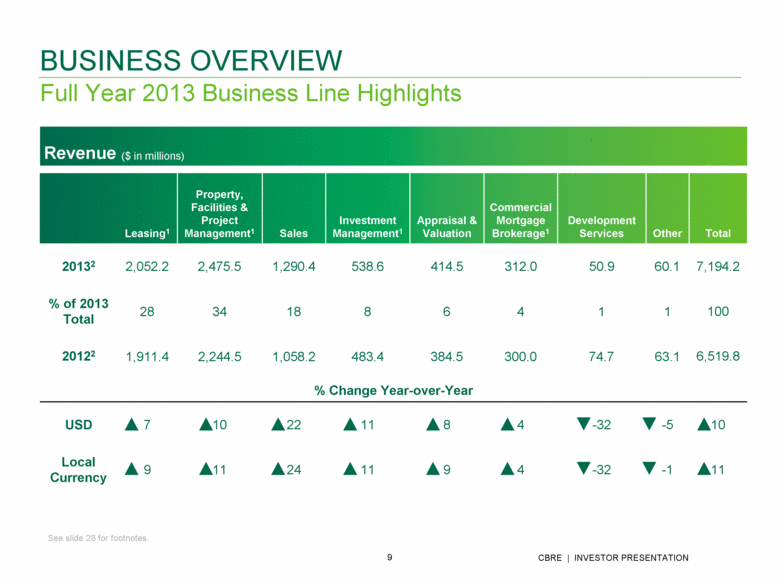
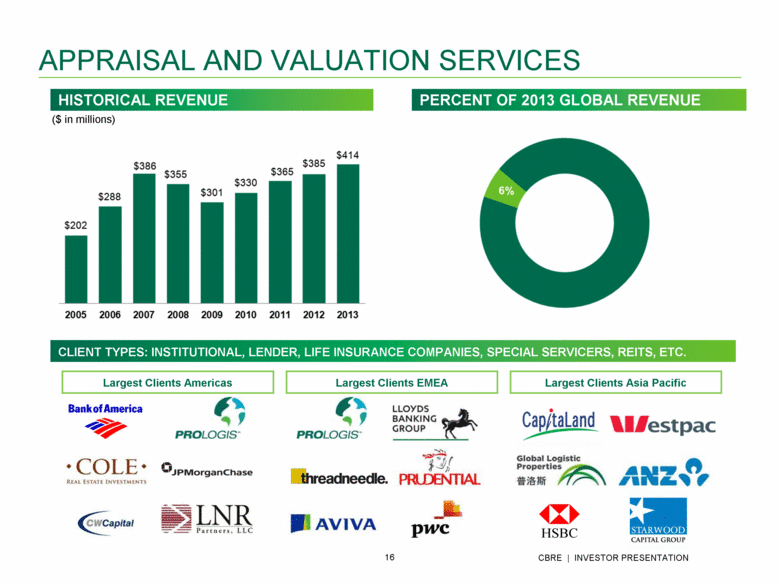
BUSINESS OVERVIEW Full Year 2013 Business Line Highlights Revenue ($ in millions) Leasing1 Property, Facilities & Project Management1 Sales Investment Management1 Appraisal & Valuation Commercial Mortgage Brokerage1 Development Services Other Total 20132 2,052.2 2,475.5 1,290.4 538.6 414.5 312.0 50.9 60.1 7,194.2 % of 2013 Total 28 34 18 8 6 4 1 1 100 20122 1,911.4 2,244.5 1,058.2 483.4 384.5 300.0 74.7 63.1 6,519.8 % Change Year-over-Year USD 7 10 22 11 8 4 -32 -5 10 Local Currency 9 11 24 11 9 4 -32 -1 11 See slide 28 for footnotes. |
|
|
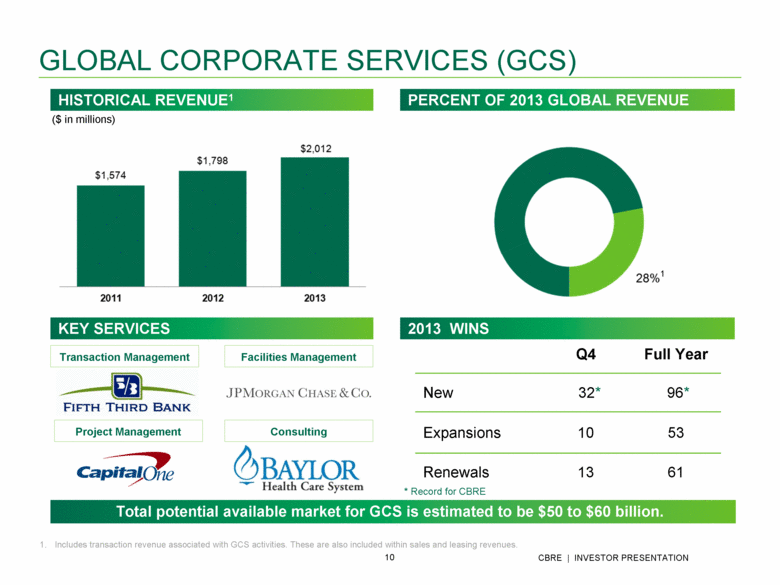
GLOBAL CORPORATE SERVICES (GCS) Includes transaction revenue associated with GCS activities. These are also included within sales and leasing revenues. Transaction Management Project Management Facilities Management Consulting Q4 Full Year New 32* 96* Expansions 10 53 Renewals 13 61 Total potential available market for GCS is estimated to be $50 to $60 billion. HISTORICAL REVENUE1 PERCENT OF 2013 GLOBAL REVENUE KEY SERVICES * Record for CBRE 1 2013 WINS ($ in millions) |
|
|
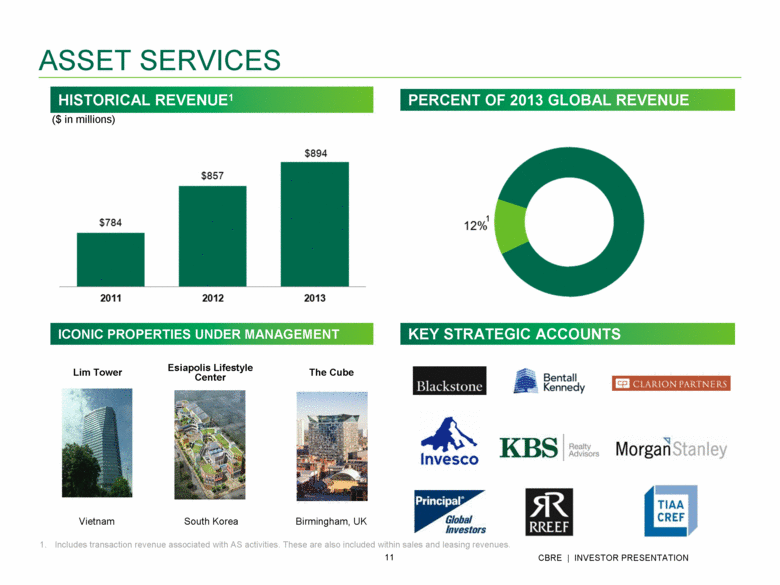
ASSET SERVICES ICONIC PROPERTIES UNDER MANAGEMENT HISTORICAL REVENUE1 PERCENT OF 2013 GLOBAL REVENUE Vietnam South Korea Birmingham, UK 2.0M SF 1.2M SF 800,000 SF Lim Tower Esiapolis Lifestyle Center The Cube KEY STRATEGIC ACCOUNTS ($ in millions) Includes transaction revenue associated with AS activities. These are also included within sales and leasing revenues. 1 |
|
|
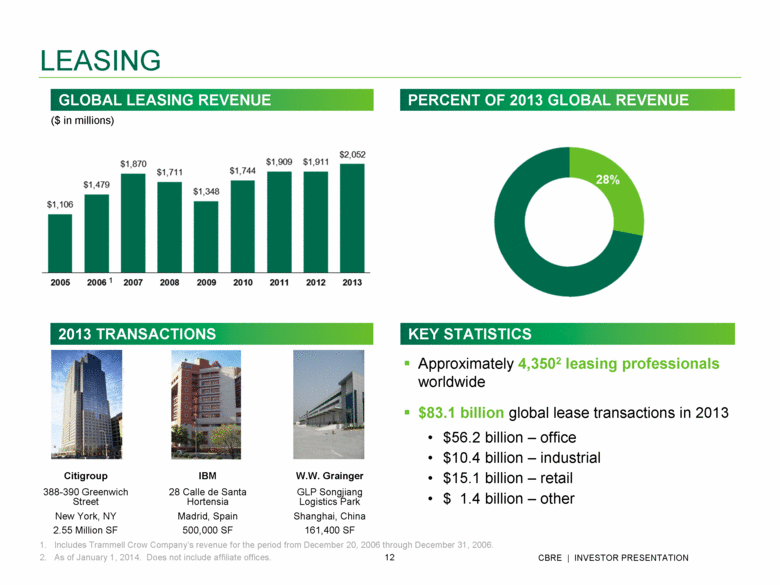
LEASING Includes Trammell Crow Company’s revenue for the period from December 20, 2006 through December 31, 2006. As of January 1, 2014. Does not include affiliate offices. GLOBAL LEASING REVENUE PERCENT OF 2013 GLOBAL REVENUE 1 ($ in millions) 2013 TRANSACTIONS Citigroup IBM W.W. Grainger 388-390 Greenwich Street 28 Calle de Santa Hortensia GLP Songjiang Logistics Park New York, NY Madrid, Spain Shanghai, China 2.55 Million SF 500,000 SF 161,400 SF KEY STATISTICS Approximately 4,3502 leasing professionals worldwide $83.1 billion global lease transactions in 2013 $56.2 billion – office $10.4 billion – industrial $15.1 billion – retail $ 1.4 billion – other |
|
|
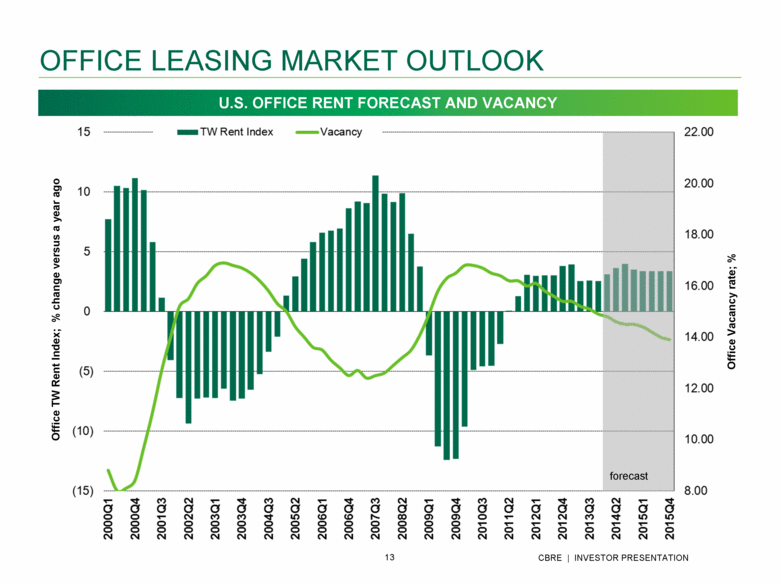
OFFICE LEASING MARKET OUTLOOK forecast Office TW Rent Index; % change versus a year ago Office Vacancy rate; % U.S. OFFICE RENT FORECAST AND VACANCY |
|
|
Sweden Chicago Miami Singapore Starwood Capital PREI Fund Hewlett-Packard $600 Million $225 Million $319 Million Property Acquisition Acquisition Financing Property Sale CAPITAL MARKETS Includes Trammell Crow Company’s revenue for the period from December 20, 2006 through December 31, 2006. As of January 1, 2014. Does not include affiliate offices. GLOBAL SALES REVENUE PERCENT OF 2013 GLOBAL REVENUE 1 ($ in millions) Commercial Mortgage Brokerage Property Sales 2013 TRANSACTIONS Retail Portfolio 222 W. Washington Street 1111 Brickell Avenue Hewlett-Packard Property KEY STATISTICS Approximately 1,7502 investment sales and mortgage brokerage specialists worldwide $140.1 billion global sales in 2013 $59.9 billion – office $19.0 billion – industrial $21.6 billion – retail $26.3 billion – multi-family $13.3 billion – other $26.9 billion global mortgage activity in 2013 |
|
|
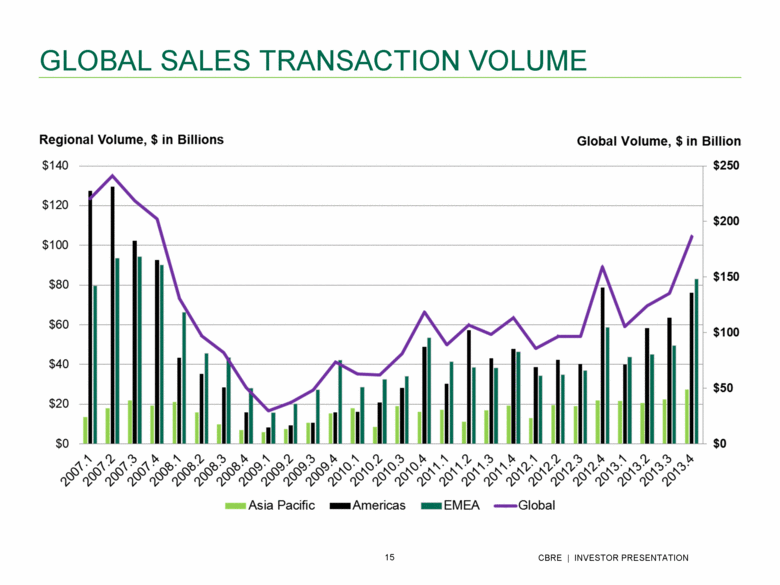
GLOBAL SALES TRANSACTION VOLUME |
|
|
APPRAISAL AND VALUATION SERVICES CLIENT TYPES: INSTITUTIONAL, LENDER, LIFE INSURANCE COMPANIES, SPECIAL SERVICERS, REITS, ETC. Largest Clients Americas Largest Clients EMEA Largest Clients Asia Pacific HISTORICAL REVENUE PERCENT OF 2013 GLOBAL REVENUE ($ in millions) |
|
|
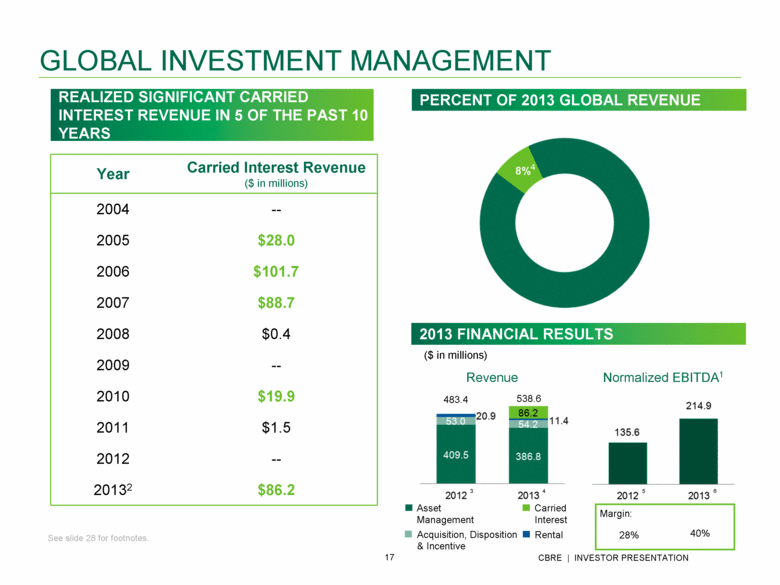
GLOBAL INVESTMENT MANAGEMENT See slide 28 for footnotes. PERCENT OF 2013 GLOBAL REVENUE 3 REALIZED SIGNIFICANT CARRIED INTEREST REVENUE IN 5 OF THE PAST 10 YEARS Year Carried Interest Revenue ($ in millions) 2004 -- 2005 $28.0 2006 $101.7 2007 $88.7 2008 $0.4 2009 -- 2010 $19.9 2011 $1.5 2012 -- 20132 $86.2 4 483.4 538.6 Rental Carried Interest Revenue Asset Management Acquisition, Disposition & Incentive 28% 40% ($ in millions) Margin: 2013 FINANCIAL RESULTS 3 6 5 Normalized EBITDA1 4 |
|
|
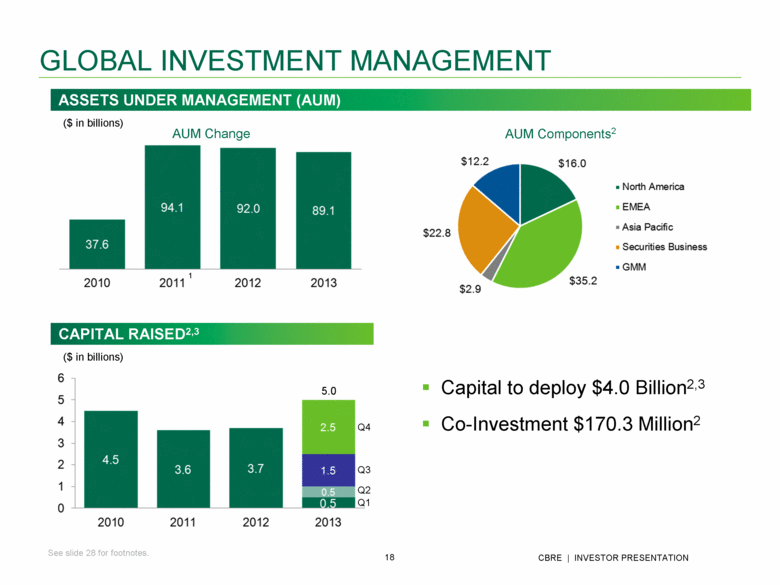
GLOBAL INVESTMENT MANAGEMENT Q1 Q2 Q3 Q4 CAPITAL RAISED2,3 ($ in billions) 5.0 Capital to deploy $4.0 Billion2,3 Co-Investment $170.3 Million2 1 ASSETS UNDER MANAGEMENT (AUM) See slide 28 for footnotes. ($ in billions) AUM Change AUM Components2 |
|
|
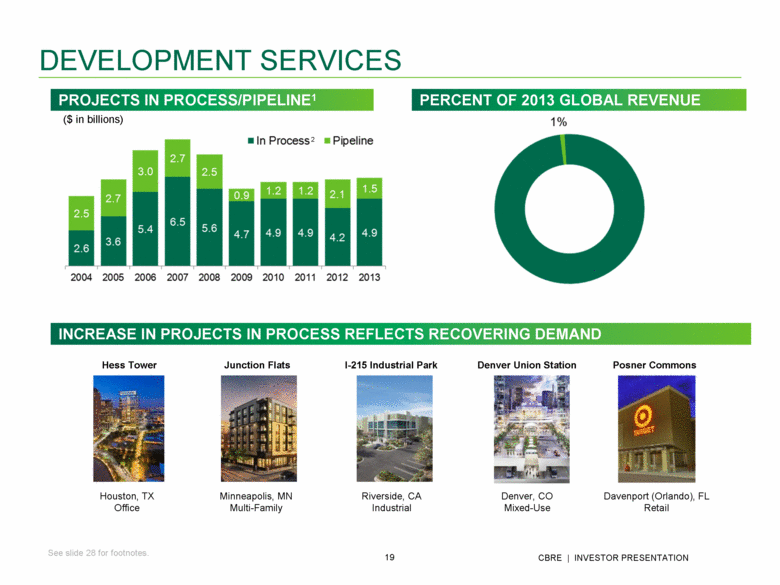
Houston, TX Office Minneapolis, MN Multi-Family Riverside, CA Industrial Denver, CO Mixed-Use Davenport (Orlando), FL Retail 2.0M SF 1.2M SF 800,000 SF 537,000 SF 387,000 SF DEVELOPMENT SERVICES 2 ($ in billions) Hess Tower Junction Flats I-215 Industrial Park Denver Union Station Posner Commons PROJECTS IN PROCESS/PIPELINE1 PERCENT OF 2013 GLOBAL REVENUE INCREASE IN PROJECTS IN PROCESS REFLECTS RECOVERING DEMAND See slide 28 for footnotes. |
|
|
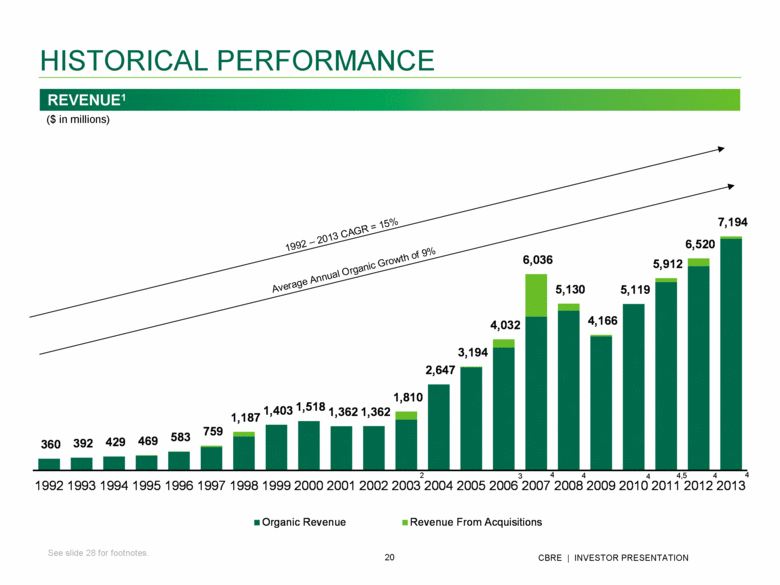
HISTORICAL PERFORMANCE 1992 – 2013 CAGR = 15% Average Annual Organic Growth of 9% REVENUE1 2 3 4 4 4 4,5 4 4 See slide 28 for footnotes. ($ in millions) 360 392 429 469 583 759 1,187 1,403 1,518 1,362 1,362 1,810 2,647 3,194 4,032 6,036 5,130 4,166 5,119 5,912 6,520 7,194 1992 1993 1994 1995 1996 1997 1998 1999 2000 2001 2002 2003 2004 2005 2006 2007 2008 2009 2010 2011 2012 2013 Organic Revenue Revenue From Acquisitions |
|
|
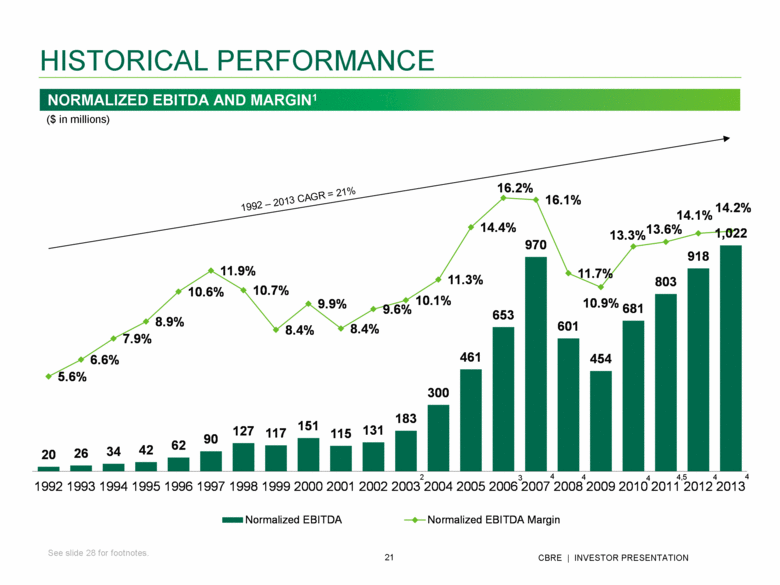
HISTORICAL PERFORMANCE 1992 – 2013 CAGR = 21% 2 3 4 4 4 4,5 4 4 ($ in millions) NORMALIZED EBITDA AND MARGIN1 See slide 28 for footnotes. 20 26 34 42 62 90 127 117 151 115 131 183 300 461 653 970 601 454 681 803 918 1,022 5.6% 6.6% 7.9% 8.9% 10.6% 11.9% 10.7% 8.4% 9.9% 8.4% 9.6% 10.1% 11.3% 14.4% 16.2% 16.1% 11.7% 10.9% 13.3% 13.6% 14.1% 14.2% 1992 1993 1994 1995 1996 1997 1998 1999 2000 2001 2002 2003 2004 2005 2006 2007 2008 2009 2010 2011 2012 2013 Normalized EBITDA Normalized EBITDA Margin |
|
|
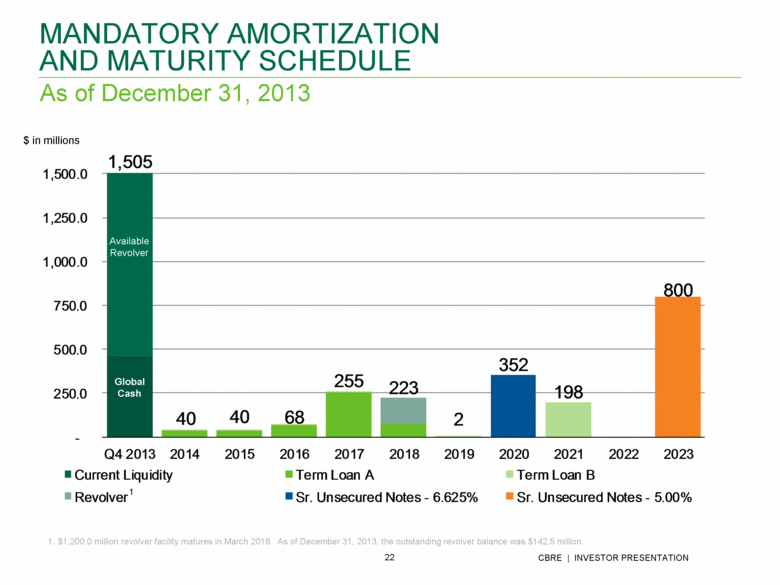
As of December 31, 2013 MANDATORY AMORTIZATION AND MATURITY SCHEDULE $ in millions $1,200.0 million revolver facility matures in March 2018. As of December 31, 2013, the outstanding revolver balance was $142.5 million. 1 Global Cash Available Revolver 1,505 40 40 68 255 223 2 352 198 800 - 250.0 500.0 750.0 1,000.0 1,250.0 1,500.0 Q4 2013 2014 2015 2016 2017 2018 2019 2020 2021 2022 2023 Current Liquidity Term Loan A Term Loan B Revolver Sr. Unsecured Notes - 6.625% Sr. Unsecured Notes - 5.00% |
|
|
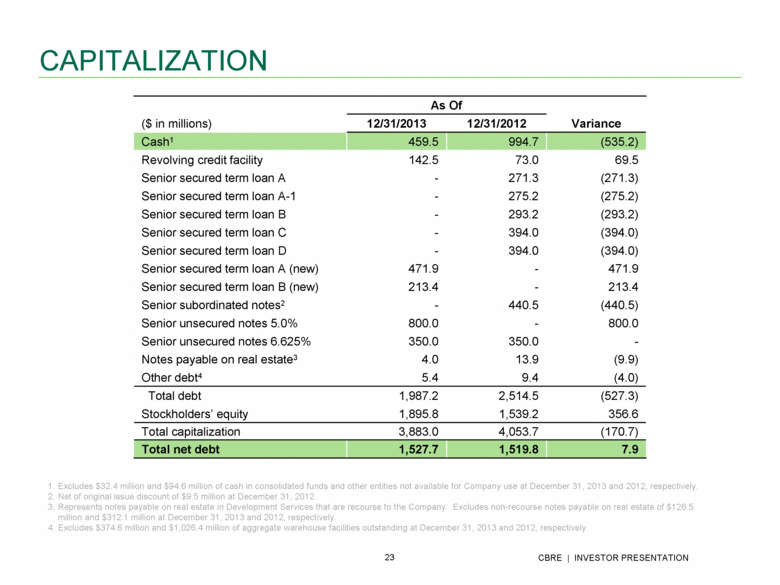
CAPITALIZATION Excludes $32.4 million and $94.6 million of cash in consolidated funds and other entities not available for Company use at December 31, 2013 and 2012, respectively. Net of original issue discount of $9.5 million at December 31, 2012. Represents notes payable on real estate in Development Services that are recourse to the Company. Excludes non-recourse notes payable on real estate of $126.5 million and $312.1 million at December 31, 2013 and 2012, respectively. Excludes $374.6 million and $1,026.4 million of aggregate warehouse facilities outstanding at December 31, 2013 and 2012, respectively. As Of ($ in millions) 12/31/2013 12/31/2012 Variance Cash1 459.5 994.7 (535.2) Revolving credit facility 142.5 73.0 69.5 Senior secured term loan A - 271.3 (271.3) Senior secured term loan A-1 - 275.2 (275.2) Senior secured term loan B - 293.2 (293.2) Senior secured term loan C - 394.0 (394.0) Senior secured term loan D - 394.0 (394.0) Senior secured term loan A (new) 471.9 - 471.9 Senior secured term loan B (new) 213.4 - 213.4 Senior subordinated notes2 - 440.5 (440.5) Senior unsecured notes 5.0% 800.0 - 800.0 Senior unsecured notes 6.625% 350.0 350.0 - Notes payable on real estate3 4.0 13.9 (9.9) Other debt4 5.4 9.4 (4.0) Total debt 1,987.2 2,514.5 (527.3) Stockholders’ equity 1,895.8 1,539.2 356.6 Total capitalization 3,883.0 4,053.7 (170.7) Total net debt 1,527.7 1,519.8 7.9 |
|
|
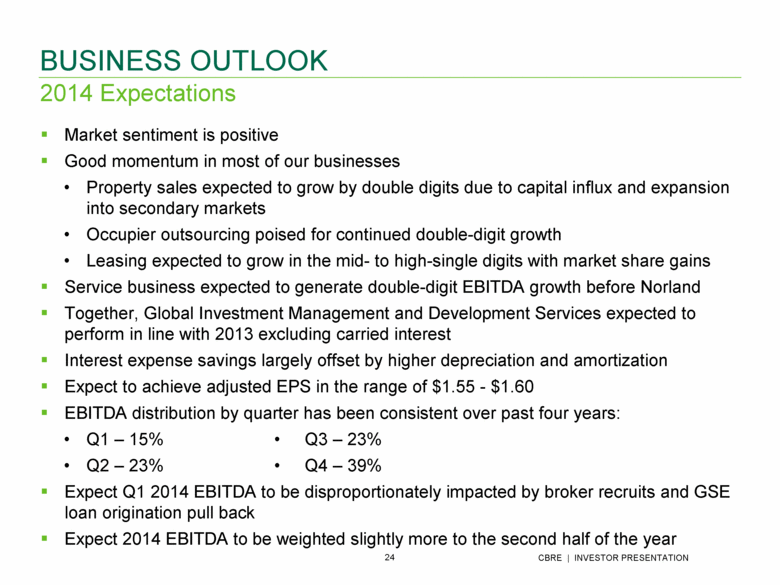
Market sentiment is positive Good momentum in most of our businesses Property sales expected to grow by double digits due to capital influx and expansion into secondary markets Occupier outsourcing poised for continued double-digit growth Leasing expected to grow in the mid- to high-single digits with market share gains Service business expected to generate double-digit EBITDA growth before Norland Together, Global Investment Management and Development Services expected to perform in line with 2013 excluding carried interest Interest expense savings largely offset by higher depreciation and amortization Expect to achieve adjusted EPS in the range of $1.55 - $1.60 EBITDA distribution by quarter has been consistent over past four years: Q1 – 15% • Q3 – 23% Q2 – 23% • Q4 – 39% Expect Q1 2014 EBITDA to be disproportionately impacted by broker recruits and GSE loan origination pull back Expect 2014 EBITDA to be weighted slightly more to the second half of the year 2014 Expectations BUSINESS OUTLOOK |
|
|
APPENDIX |
|
|
RECONCILIATION OF NORMALIZED EBITDA TO EBITDA TO NET INCOME Notes: Includes EBITDA related to discontinued operations of $7.9 million for the year ended December 31, 2013, $5.6 million for the year ended December 31, 2012, $14.1 million for the year ended December 31, 2011, and $16.4 million for the year ended December 31, 2010. Carried interest incentive compensation is related to a fund that began recording carried interest expense in Q2 2013. Includes depreciation and amortization related to discontinued operations of $0.9 million for the year ended December 31, 2013, $1.3 million for the year ended December 31, 2012, $1.2 million for the year ended December 31, 2011, and $0.6 million for the year ended December 31, 2010. Includes interest expense related to discontinued operations of $3.3 million for the year ended December 31, 2013, $1.6 million for the year ended December 31, 2012, $3.2 million for the year ended December 31, 2011, and $1.6 million for the year ended December 31, 2010. Includes provision for income taxes related to discontinued operations of $1.3 million for the year ended December 31, 2013, $1.0 million for the year ended December 31, 2012, $4.0 million the year ended December 31, 2011, and $5.4 million for the year ended December 31, 2010. Includes revenue related to discontinued operations of $9.4 million for the year ended December 31, 2013, $5.7 million for the year ended December 31, 2012, $6.7 million for the year ended December 31, 2011, and $3.9 million for the year ended December 31, 2010. ($ in millions) 2013 2012 2011 2010 2009 Normalized EBITDA 1 1,022.3 $ 918.4 $ 802.6 $ 681.3 $ 453.9 $ Less: Integration and other costs related to acquisitions 12.6 39.2 68.8 7.2 5.7 Cost containment expenses 17.6 17.6 31.1 15.3 43.6 Carried interest incentive compensation expense 2 9.2 - - - - Write-down of impaired assets - - 9.4 11.3 32.5 EBITDA 1 982.9 861.6 693.3 647.5 372.1 Add: Interest income 6.3 7.6 9.4 8.4 6.1 Less: Depreciation and amortization 3 191.3 170.9 116.9 109.0 99.5 Non-amortizable intangible asset impairment 98.1 19.8 Interest expense 4 138.4 176.6 153.5 192.7 189.1 Write-off of financing costs 56.3 - - 18.1 29.3 Provision for income taxes 5 188.6 186.3 193.1 135.8 27.0 Net income attributable to CBRE Group, Inc. 316.5 $ 315.6 $ 239.2 $ 200.3 $ 33.3 $ Revenue 6 7,194.2 $ 6,519.8 $ 5,912.1 $ 5,119.2 $ 4,165.8 $ Normalized EBITDA Margin 14.2% 14.1% 13.6% 13.3% 10.9% Year Ended December 31, |
|
|
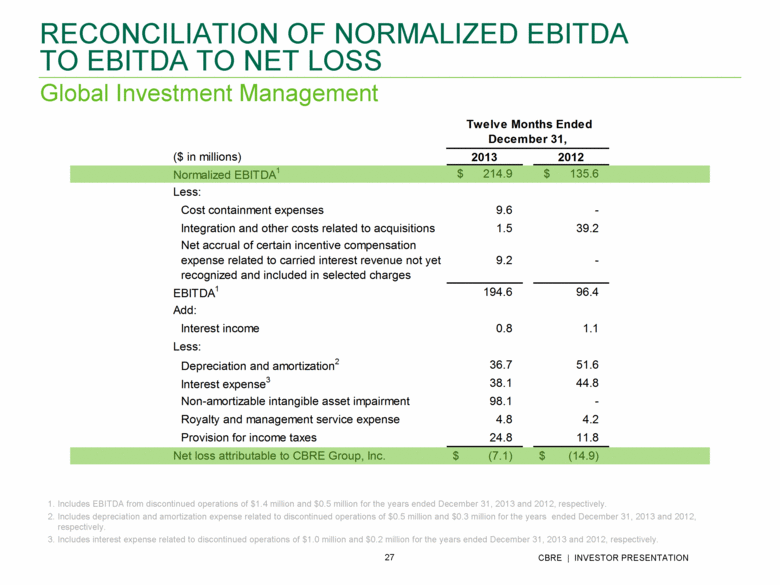
Global Investment Management Includes EBITDA from discontinued operations of $1.4 million and $0.5 million for the years ended December 31, 2013 and 2012, respectively. Includes depreciation and amortization expense related to discontinued operations of $0.5 million and $0.3 million for the years ended December 31, 2013 and 2012, respectively. Includes interest expense related to discontinued operations of $1.0 million and $0.2 million for the years ended December 31, 2013 and 2012, respectively. RECONCILIATION OF NORMALIZED EBITDA TO EBITDA TO NET LOSS ($ in millions) 2013 2012 Normalized EBITDA 1 $ 214.9 $ 135.6 Less: Cost containment expenses 9.6 - Integration and other costs related to acquisitions 1.5 39.2 Net accrual of certain incentive compensation expense related to carried interest revenue not yet recognized and included in selected charges 9.2 - EBITDA 1 194.6 96.4 Add: Interest income 0.8 1.1 Less: Depreciation and amortization 2 36.7 51.6 Interest expense 3 38.1 44.8 Non-amortizable intangible asset impairment 98.1 - Royalty and management service expense 4.8 4.2 Provision for income taxes 24.8 11.8 Net loss attributable to CBRE Group, Inc. $ (7.1) $ (14.9) Twelve Months Ended December 31, |
|
|
FOOTNOTES Slide 9 Contains recurring revenue aggregating approximately 60% and 59% of total revenue for the twelve months ended December 31, 2013 and 2012, respectively. Includes $9.4 million and $5.7 million of revenue from discontinued operations for the twelve months ended December 31, 2013 and 2012, respectively. Slide 19 As of December 31 for each year presented . In Process figures include Long-Term Operating Assets (LTOA) of $0.9 billion for Q4 13, $1.2 billion for Q4 12, $1.5 billion for Q4 11, $1.6 billion for Q4 10, $1.4 billion for Q4 09 and $0.4 billion for Q4 08. LTOA are projects that have achieved a stabilized level of occupancy or have been held 18-24 months following shell completion or acquisition. Slide 21 Normalized EBITDA excludes merger-related and other non-recurring costs, integration and other costs related to acquisitions, cost containment expenses, certain carried interest incentive compensation expense, one-time IPO-related compensation expense, gains/losses on trading securities acquired in the Trammell Crow Company acquisition and the write-down of impaired assets. Includes Insignia activity for the period July 23, 2003 through December 31, 2003. Includes Trammell Crow Company activity for the period December 20, 2006 through December 31, 2006. Includes EBITDA related to discontinued operations of $6.5 million for the year ended December 31, 2007, $16.9 million for the year ended December 31, 2008, $16.4 million for the year ended December 31, 2010, $14.1 million for the year ended December 31, 2011, $5.6 million for the year ended December 31, 2012 and $9.4 million for the year ended December 31, 2013. Includes activity from ING CRES, ING REIM Asia and ING REIM Europe beginning July 1, October 3 and October 31, 2011, respectively. Slide 20 No reimbursements are included for the period 1992 through 1996, as amounts were immaterial. Reimbursements for 1997 through 2001 have been estimated. For 2002 and forward, reimbursements are included. Includes Insignia activity for the period July 23, 2003 through December 31, 2003. Includes Trammell Crow Company activity for the period December 20, 2006 through December 31, 2006. Includes revenue from discontinued operations, which totaled $2.1 million for the year ended December 31, 2007, $1.3 million for the year ended December 31, 2008, $3.9 million for the year ended December 31, 2010, $6.7 million for the year ended December 31, 2011, $5.7 million for the year ended December 31, 2012 and $7.9 million for the year ended December 31, 2013. Includes activity from ING CRES, ING REIM Asia and ING REIM Europe beginning July 1, October 3 and October 31, 2011, respectively. Slide 17 Normalized EBITDA excludes cost containment expenses, integration and other costs related to acquisitions and certain carried interest expense. The Company began to normalize out carried interest incentive compensation expense accruals for funds that began recording carried interest expense in the second quarter of 2013 and beyond. The Company will recognize this expense in normalized EBITDA when the carried interest revenue is recorded in future periods (thereby matching the revenue and expense). Includes revenue from discontinued operations of $0.8 million for the twelve months ended December 31, 2012. Includes revenue from discontinued operations of $1.5 million for the twelve months ended December 31, 2013. Includes EBITDA from discontinued operations of $0.5 million for the twelve months ended December 31, 2012. Includes EBITDA from discontinued operations of $1.4 million for the twelve months ended December 31, 2013. . Slide 18 In 2011, CBRE acquired the real estate investment management operations of ING Group in Europe, Asia and its global securities business. As of December 31, 2013. Excludes securities business. |


