Attached files
| file | filename |
|---|---|
| EX-23.3 - EX-23.3 - ADVANCED DRAINAGE SYSTEMS, INC. | d695165dex233.htm |
| EX-23.1 - EX-23.1 - ADVANCED DRAINAGE SYSTEMS, INC. | d695165dex231.htm |
Table of Contents
As filed with the Securities and Exchange Commission on April 2, 2014
Registration No. 333-
UNITED STATES
SECURITIES AND EXCHANGE COMMISSION
Washington, D.C. 20549
FORM S-1
REGISTRATION STATEMENT
UNDER
THE SECURITIES ACT OF 1933
Advanced Drainage Systems, Inc.
(Exact name of registrant as specified in its charter)
| Delaware | 3084 | 51-0105665 | ||
| (State or other jurisdiction of incorporation or organization) |
(Primary Standard Industrial Classification Code Number) |
(I.R.S. Employer Identification Number) |
4640 Trueman Boulevard
Hilliard, Ohio 43026
(614) 658-0050
(Address, including zip code, and telephone number, including area code, of registrant’s principal executive offices)
Joseph A. Chlapaty
Chairman, President & Chief Executive Officer
4640 Trueman Boulevard
Hilliard, Ohio 43026
(614) 658-0050
(Name, address, including zip code, and telephone number, including area code, of agent for service)
Copies to:
| Stephen C. Mahon, Esq. Fredric L. Smith, Esq. Aaron A. Seamon, Esq. Squire Sanders (US) LLP 41 South High Street, Suite 2000 Columbus, Ohio 43215 |
Kirk A. Davenport II, Esq. Ian D. Schuman, Esq. New York, New York 10022 (212) 906-1200 |
Approximate date of commencement of proposed sale of the securities to the public: As soon as practicable after this Registration Statement becomes effective.
If any of the securities being registered on this Form are to be offered on a delayed or continuous basis pursuant to Rule 415 under the Securities Act of 1933, check the following box. ¨
If this Form is filed to register additional securities for an offering pursuant to Rule 462(b) under the Securities Act, check the following box and list the Securities Act registration statement number of the earlier effective registration statement for the same offering. ¨
If this Form is a post-effective amendment filed pursuant to Rule 462(c) under the Securities Act, check the following box and list the Securities Act registration statement number of the earlier effective registration statement for the same offering. ¨
If this Form is a post-effective amendment filed pursuant to Rule 462(d) under the Securities Act, check the following box and list the Securities Act registration statement number of the earlier effective registration statement for the same offering. ¨
Indicate by check mark whether the registrant is a large accelerated filer, an accelerated filer, a non-accelerated filer, or a smaller reporting company. See the definitions of “large accelerated filer,” “accelerated filer” and “smaller reporting company” in Rule 12b-2 of the Exchange Act.
| Large accelerated filer | ¨ | Accelerated filer | ¨ | |||
| Non-accelerated filer | x (Do not check if a smaller reporting company) | Smaller reporting company | ¨ | |||
CALCULATION OF REGISTRATION FEE
|
| ||||
| Title of Each Class of Securities to be Registered |
Proposed Maximum Aggregate Offering Price (1) |
Amount of Registration Fee | ||
| Common Stock, $0.01 par value per share |
$100,000,000 | $12,880 | ||
|
| ||||
|
| ||||
| (1) | Estimated solely for the purpose of calculating the amount of the registration fee pursuant to Rule 457(o) promulgated under the Securities Act of 1933, as amended. Includes offering price of shares of Common Stock that may be sold upon exercise of the underwriters’ option to purchase additional shares. |
The Registrant hereby amends this Registration Statement on such date or dates as may be necessary to delay its effective date until the Registrant shall file a further amendment which specifically states that this Registration Statement shall thereafter become effective in accordance with Section 8(a) of the Securities Act of 1933 or until this Registration Statement shall become effective on such date as the Securities and Exchange Commission, acting pursuant to said Section 8(a), may determine.
Table of Contents
The information in this preliminary prospectus is not complete and may be changed. These securities may not be sold until the registration statement filed with the Securities and Exchange Commission is effective. This preliminary prospectus is not an offer to sell these securities and it is not soliciting an offer to buy these securities in any state or jurisdiction where the offer or sale is not permitted.
Subject to Completion, dated April 2, 2014
PROSPECTUS
Shares

Advanced Drainage Systems, Inc.
Common Stock
This is the initial public offering of common stock of Advanced Drainage Systems, Inc.
We are offering shares of common stock in this offering. The selling stockholder identified in this prospectus is offering shares of common stock in this offering. We will not receive any of the proceeds from the sale of shares of common stock by the selling stockholder. Prior to this offering, there has been no public market for our common stock.
It is currently estimated that the initial public offering price per share will be between $ and $ . We intend to apply to list our common stock on the New York Stock Exchange under the symbol “WMS.”
Investing in our common stock involves risks. See “Risk Factors” beginning on page 19 of this prospectus.
| Per Share | Total | |||||||
| Price to the public |
$ | $ | ||||||
| Underwriting discounts and commissions(1) |
$ | $ | ||||||
| Proceeds to us (before expenses) |
$ | $ | ||||||
| Proceeds to the selling stockholder (before expenses) |
$ | $ | ||||||
| (1) | We refer you to “Underwriting” beginning on page 163 of this prospectus for additional information regarding total underwriter compensation. |
The underwriters also may purchase up to additional shares of common stock from us and up to additional shares of common stock from the selling stockholder at the initial public offering price less the underwriting discounts and commissions.
Neither the Securities and Exchange Commission nor any state securities commission has approved or disapproved of these securities or passed upon the adequacy or accuracy of this prospectus. Any representation to the contrary is a criminal offense.
The underwriters expect to deliver the shares of common stock on or about , 2014.
| Barclays | Deutsche Bank Securities |
| Citigroup | RBC Capital Markets |
Prospectus dated , 2014
Table of Contents
| Page | ||||
| ii | ||||
| ii | ||||
| ii | ||||
| iii | ||||
| 1 | ||||
| 19 | ||||
| Special Note Regarding Forward-Looking Statements And Information |
40 | |||
| 42 | ||||
| 43 | ||||
| 44 | ||||
| 46 | ||||
| 47 | ||||
| Management’s Discussion and Analysis of Financial Condition and Results of Operations |
52 | |||
| 81 | ||||
| 91 | ||||
| 111 | ||||
| 121 | ||||
| 141 | ||||
| 144 | ||||
| 145 | ||||
| 147 | ||||
| 153 | ||||
| 155 | ||||
| Material U.S. Federal Tax Considerations for Non-U.S. Holders |
159 | |||
| 163 | ||||
| 170 | ||||
| 170 | ||||
| 170 | ||||
| F-1 | ||||
Through and including , 2014 (the 25th day after the date of this prospectus), all dealers effecting transactions in these securities, whether or not participating in this offering, may be required to deliver a prospectus. This is in addition to a dealer’s obligation to deliver a prospectus when acting as an underwriter and with respect to an unsold allotment or subscription.
We, the selling stockholder and the underwriters have not authorized anyone to provide any information or to make any representations other than those contained in this prospectus or in any free writing prospectuses we have prepared. We take no responsibility for, and can provide no assurance as to the reliability of, any other information that others may give you. This prospectus is an offer to sell only the shares offered hereby but only in circumstances and in jurisdictions where it is lawful to do so. The information contained in this prospectus is accurate only as of its date, regardless of the time of delivery of this prospectus or any sale of the shares.
- i -
Table of Contents
We use various trademarks, service marks and brand names that we deem particularly important to the marketing activities and operation of our various lines of business, and some of these marks are registered in the United States and, in some cases, other jurisdictions. This prospectus also refers to the brand names, trademarks or service marks of other companies. All brand names and other trademarks or service marks referenced in this prospectus, including N-12®, SaniTite®, StormTech®, Nyloplast®, Inserta Tee®, BaySeparator™, BayFilter™ and FleXstorm™, are the property of their respective holders. Solely for convenience, we refer to trademarks, service marks and brand names in this prospectus without ™, SM and ® symbols. We do not intend our use or display of other parties’ trademarks, service marks or brand names to imply, and such use or display should not be construed to imply, a relationship with, or endorsement or sponsorship of us by, these other parties.
This prospectus includes estimates regarding market and industry data and forecasts, which are based on publicly-available information, industry publications and surveys, reports from government agencies, reports by market research firms and our own estimates based on our management’s knowledge of and experience in the market sectors in which we compete. These estimates and forecasts are based on data from third-party sources, including certain market and industry data provided on a subscription basis by the Freedonia Group, Inc., an independent research firm and industry consultant based in Cleveland, Ohio, which we refer to as Freedonia. We also base certain estimates and forecasts related to stormwater retention/detention and water quality on a special study that we commissioned for a fee specifically for the purpose of this offering by Freedonia Custom Research, Inc., an affiliate of Freedonia, which we refer to in this prospectus as the Freedonia Special Report. We have not independently verified market and industry data provided by Freedonia, or by other third-party sources such as McGraw Hill, the U.S. Environmental Protection Agency, Reed Construction Data, the American Institute of Architects, the U.S. Census Bureau, the National Association of Realtors, the St. Louis Federal Reserve, HIRI / IHS Global Insight, The Ohio State University and the U.S. Department of Agriculture, although we believe such market and industry data included in this prospectus is reliable. This information cannot always be verified with complete certainty due to the limits on the availability and reliability of raw data, the voluntary nature of the data gathering process and other limitations and uncertainties inherent in surveys of market size.
Unless the context otherwise indicates or requires, as used in this prospectus, the terms “we,” “our,” “us,” “ADS” and the “Company” refer to Advanced Drainage Systems, Inc. and its directly- and indirectly-owned subsidiaries as a combined entity, except where it is clear that the terms mean only Advanced Drainage Systems, Inc. exclusive of its subsidiaries.
Because our fiscal year ends on March 31, any reference to a fiscal year means the fiscal year ended March 31 of the same calendar year. For example, references to “fiscal year 2014” mean the fiscal year ending March 31, 2014 and references to “fiscal year 2013,” “fiscal year 2012” and “fiscal year 2011” mean the fiscal years ended March 31, 2013, March 31, 2012 and March 31, 2011, respectively.
Our consolidated financial statements include our ownership interests in various consolidated joint ventures through which we conduct operations in Mexico and Central America. We also have an ownership interest in an unconsolidated joint venture through which we conduct operations in South America, which we refer to in this prospectus as our South American Joint Venture, and an unconsolidated joint venture through which we conduct certain operations in the United States, which we refer to in this prospectus as our BaySaver Joint Venture. Our equity interest in the operating results of both the South American Joint Venture and the BaySaver Joint Venture
- ii -
Table of Contents
is presented in our consolidated financial statements as equity in net (income) loss of unconsolidated affiliates in accordance with U.S. generally accepted accounting principles, or GAAP. Although not consolidated under GAAP, we treat the South American Joint Venture and the BaySaver Joint Venture as if they are consolidated subsidiaries for internal reporting purposes. Throughout this prospectus, when we refer to our financial results or operations, we are referring to our financial results and operations as presented in our consolidated financial statements under GAAP, which do not consolidate our South American Joint Venture or our BaySaver Joint Venture, unless the context otherwise indicates.
We also sponsor a tax-qualified employee stock ownership plan, or ESOP, that covers our employees who meet certain service requirements. The ESOP was originally funded with a 30-year term loan from us as well as shares of our convertible preferred stock through a transfer of assets from our profit sharing retirement plan. The loan is secured by a pledge of unallocated shares of convertible preferred stock purchased by the ESOP that has not yet been released from the pledge and allocated to ESOP accounts. The 2.50% Cumulative Convertible Voting Preferred Stock held by the ESOP is referred to in this prospectus as our convertible preferred stock. The ESOP operates as a leveraged ESOP and was designed to enable eligible employees to acquire stock ownership interests in their accounts under the ESOP. See “Description of Employee Stock Ownership Plan” for a description of the ESOP.
Unless otherwise indicated, all information in this prospectus assumes the following:
| • | a -for- stock split to be effected immediately prior to the effectiveness of the registration statement of which this prospectus forms a part; |
| • | no exercise by the underwriters of their option to purchase additional shares; |
| • | the filing of our amended and restated certificate of incorporation and the adoption of our amended and restated bylaws immediately prior to the closing of this offering; and |
| • | an initial public offering price of $ per share, which is the midpoint of the price range set forth on the cover of this prospectus. |
PRESENTATION OF CERTAIN FINANCIAL MEASURES
For purposes of calculating the weighted average number of shares outstanding and net income per share in this prospectus, we divide net income available to common stockholders by the weighted average number of shares of common stock outstanding. These items are described below in “—Summary Consolidated Financial Data” and “Selected Historical Consolidated Financial Data.”
We refer in this prospectus to Redeemable Common Stock, which represents shares of our common stock that are held by certain stockholders who hold in excess of 15% of our common stock. These stockholders entered into an amended and restated stockholders’ agreement, which provides such stockholders with the right to cause the shares to be repurchased by us at fair value in certain specified circumstances as described in Note 17 to our consolidated financial statements included elsewhere in this prospectus. As this right is considered for purposes of GAAP to be a redemption right, which is outside our control, we have classified the shares of common stock held by such stockholders in the mezzanine section of our consolidated balance sheets and changes in fair value are recorded in retained earnings. We anticipate that the stockholders’ agreement will be terminated upon completion of this offering and the rights associated with these shares, which require them to be classified in mezzanine equity, will no longer be in effect. Accordingly, we anticipate reclassifying these balances to total stockholders’ equity upon the completion of this offering. Our Redeemable Common Stock is also described below in “—Summary Consolidated Financial Data” and “Selected Historical Consolidated Financial Data.”
We also refer in this prospectus to Redeemable Convertible Preferred Stock, which represents our convertible preferred stock held by our ESOP. Prior to this offering, the trustee of our ESOP has the ability to
- iii -
Table of Contents
require us to repurchase the shares of convertible preferred stock at fair value in the event that it needs cash to pay for distributions, pre-retirement diversification, or other expenses, causing the shares to be repurchased at the option of the holder as described in Note 17 to our consolidated financial statements included elsewhere in this prospectus. As this right is considered for purposes of GAAP to be a redemption right, which is outside our control, we have classified the shares of convertible preferred stock in the mezzanine section of our consolidated balance sheets and changes in fair value are recorded in retained earnings. Upon completion of this offering, the rights associated with these shares, which require them to be classified in mezzanine equity, will no longer be in effect. Accordingly, we anticipate reclassifying these balances to total stockholders’ equity upon completion of this offering. Our Redeemable Convertible Preferred Stock is also described below in “—Summary Consolidated Financial Data” and “Selected Historical Consolidated Financial Data.”
Certain financial measures presented in this prospectus, such as System-Wide Net Sales, Net Income Per Share As Adjusted—Basic and Diluted, EBITDA, Adjusted EBITDA, Segment EBITDA and Segment Adjusted EBITDA, are not recognized under GAAP. For definitions of System-Wide Net Sales, Net Income Per Share As Adjusted—Basic and Diluted, EBITDA, Adjusted EBITDA, Segment EBITDA and Segment Adjusted EBITDA and reconciliations of those measures to the most directly comparable GAAP measures, see “Selected Historical Consolidated Financial Data” and “Management’s Discussion and Analysis of Financial Condition and Results of Operations—Components of Results of Operations.”
- iv -
Table of Contents
The following summary highlights information contained elsewhere in this prospectus. This summary does not contain all of the information that you should consider before investing in our common stock. You should read this entire prospectus carefully, especially the information set forth under “Risk Factors,” “Management’s Discussion and Analysis of Financial Condition and Results of Operations,” and the financial statements and notes included elsewhere in this prospectus, before making an investment decision.
Our Company
We are the leading manufacturer of high performance thermoplastic corrugated pipe, providing a comprehensive suite of water management products and superior drainage solutions for use in the construction and infrastructure marketplace. Our innovative products are used across a broad range of end markets and applications, including non-residential, residential, agriculture and infrastructure applications. We have established a leading position in many of these end markets by leveraging our national sales and distribution platform, our overall product breadth and scale and our manufacturing excellence. In North America, our national footprint combined with our strong local presence and broad product offering makes us the leader in an otherwise highly fragmented sector comprised of many smaller competitors. We believe the markets we serve in the United States represent approximately $10.1 billion of annual revenue opportunity. In addition, we believe the increasing acceptance of thermoplastic pipe products in international markets represents an attractive growth opportunity. For the nine months ended December 31, 2013, we generated net sales of $887.8 million, net income of $24.7 million and Adjusted EBITDA of $130.6 million. For a reconciliation of Adjusted EBITDA to the most directly comparable GAAP measure, see “Selected Historical Consolidated Financial Data.”
Our products are generally lighter, more durable, more cost effective and easier to install than comparable alternatives made with traditional materials. Following our entrance into the non-residential construction market with the introduction of N-12 corrugated polyethylene pipe in the late 1980s, our pipe has been displacing traditional materials, such as reinforced concrete, corrugated steel and polyvinyl chloride, or PVC, across an ever expanding range of end markets. This has allowed us to consistently gain share and achieve above market growth throughout economic cycles. We expect to continue to drive conversion to our products from traditional products as contractors, civil design engineers and municipal agencies increasingly acknowledge the superior physical attributes and compelling value proposition of our thermoplastic products. In addition, we believe that overall demand for our products will benefit as the regulatory environment continues to evolve.
Our broad product line includes corrugated high density polyethylene (or HDPE) pipe, polypropylene (or PP) pipe and related water management products. Building on our core drainage businesses, we have aggressively pursued attractive ancillary product categories such as storm and septic chambers, PVC drainage structures, fittings and filters, and water quality filters and separators. We refer to these ancillary product categories as Allied Products. Given the scope of our overall sales and distribution platform, we have been able to drive growth within our Allied Products and believe there are significant growth opportunities going forward.
We have an extensive domestic network of 48 manufacturing plants and 19 distribution centers allowing us to effectively serve all major markets in all 50 U.S. states. The effective shipping radius for our pipe products is approximately 200 miles, thus competition in our industry tends to be on a regional and local basis with minimal competition from distant markets and imports. We are the only supplier in our industry with a national footprint, thereby allowing us to efficiently service those customers that value having one source of supply throughout their entire distribution network. We believe our extensive national footprint creates a cost and service advantage versus our HDPE pipe producing competitors, the largest of which has only 10 domestic HDPE pipe manufacturing plants. Internationally, we have two manufacturing plants and three distribution centers in Canada, four manufacturing plants in Mexico, four manufacturing plants and five distribution centers in South America and one distribution center in Europe.
- 1 -
Table of Contents
We have long-standing distribution relationships with many of the largest national and independent waterworks distributors, including Ferguson, HD Supply and WinWholesale, who sell primarily to the storm sewer and sanitary sewer markets. We also utilize a network of hundreds of small to medium-sized independent distributors across the United States. We have strong relationships with major national retailers that carry drainage products, including The Home Depot, Lowe’s, Ace Hardware, Menards and Do it Best, and also sell to buying groups and co-ops in the United States that serve the plumbing, hardware, irrigation and landscaping markets. The combination of our large sales force, long-standing retail and contractor customer relationships and extensive network of manufacturing and distribution facilities complements and strengthens our broad customer and market coverage.
We believe the ADS brand has long been associated with quality products and market-leading performance. Our trademarked green stripe, which is prominently displayed on many of our products, serves as clear identification of our commitment to the customers and markets we serve.
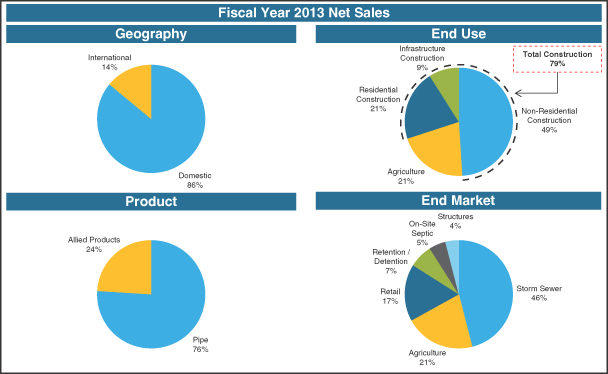
As illustrated in the charts below, we provide a broad range of high performance thermoplastic corrugated pipe and related water management products to a highly diversified set of end markets and geographies.
- 2 -
Table of Contents
Our Strengths
We believe that we benefit significantly from the following competitive strengths:
Market leader with unmatched scale. We are the leading manufacturer of high performance thermoplastic corrugated pipe and a leading manufacturer of related water management products. We believe our extensive national footprint of 48 manufacturing plants and 19 distribution centers creates a cost and service advantage versus our HDPE pipe producing competitors, the largest of which has only 10 domestic HDPE pipe manufacturing plants. We maintain an in-house fleet of approximately 625 tractor-trailers and approximately 1,100 trailers that are specially designed to haul our lightweight pipe and fittings products. Our effective shipping radius is approximately 200 miles from one of our manufacturing plants or distribution centers. Our world-class manufacturing expertise and extensive national distribution and fleet network allow us to service customers across the United States on a cost-effective and timely basis. Our long-standing customer relationships also provide us with visibility to attractive market opportunities.
Well positioned to drive continued material conversion. Our products are generally lighter, more durable, more cost effective and easier to install than comparable alternatives made with traditional materials. For example, concrete pipe generally weighs more than 20 times as much per foot as our thermoplastic pipe, resulting in the significant handling advantages that our product line enjoys during installation by contractors. These advantages typically provide our thermoplastic pipe with an installed cost advantage of approximately 20% over concrete pipe. High performance thermoplastic corrugated pipe represented approximately 25% of the total storm sewer market in 2012, up from what we believe was less than 10% ten years ago and less than 1% twenty years ago. We believe the penetration rate will continue to increase over time, as contractors, engineers and municipal agencies increasingly acknowledge the superior attributes and compelling value proposition of our thermoplastic products. We believe the recent introduction of our PP pipe products will also help accelerate this conversion given the additional applications for which our PP pipe products can be used. We continue to drive this material conversion through extensive sales force training and education of our customers. We have been at the forefront of educating an industry undergoing significant change in the regulatory environment, while pushing for expanded approvals of our products in new markets and geographies. Since 2006, 32 states have enhanced their approval of our pipe products, and an average of approximately 60 state, county and municipal approvals have been added or enhanced each year over the past five years.
Broad portfolio of Allied Products. Our Allied Products include storm and septic chambers, PVC drainage structures, fittings and filters and water separators. These products complement our pipe product lines and allow us to offer a comprehensive water management solution to our customers and drive organic growth. We have a long history of leveraging our broad distribution platform to develop or acquire, and market, complementary Allied Products that provide new technologies and product capabilities. Given our strong brand recognition, network of customer and distributor relationships and large team of trained salespeople, we believe we are the acquirer of choice for many providers of ancillary products who wish to partner with an industry leader. Our broad product line and reputation for quality provide our sales force with a competitive advantage in sourcing new opportunities and cross-selling products.
Industry-leading manufacturing and technical expertise. We believe we have developed a reputation in the industry for products that deliver technically-superior performance with lower installation and maintenance costs versus competing products. Our products are lightweight and flexible, strong, resistant to corrosion and resistant to abrasion. These characteristics allow for easy and low-cost installation, provide strength comparable to much heavier materials (as a result of the corrugated profile design of our thermoplastic pipe products) and provide an excellent service life expectancy. Our significant investment in custom-designed mold and die tooling ($173 million investment over the last nine years) allows us to manufacture a variety of corrugated pipe sizes and provides us with the flexibility to meet demand fluctuations in local regions. In addition, we rotate these setups across our network of manufacturing plants as needed to meet demand, which provides us with a unique
- 3 -
Table of Contents
competitive advantage. We employ proprietary resin blending technology to minimize raw material cost and optimize production efficiency, while maintaining a consistent level of product performance. Utilizing this technology has allowed us to increase our ratio of recycled resin as a percent of total resin from approximately 24% in 2005 to approximately 52% in 2013, resulting in significant cost savings and reduced exposure to fluctuations in raw material costs.
Long-term customer relationships. We believe we have the largest and most experienced sales force in the industry, which allows us to maintain strong, long-standing relationships with key distributors, contractors and engineers. The combination of our technical expertise, product selection and customer delivery capabilities allows us to meet our customers’ critical installation schedules and positions us as a strategic partner. We strive to educate the regulatory and design community while offering the distributor and contractor network a comprehensive product suite. Our products are manufactured, assembled, delivered and serviced from a network of plants and yards that are strategically positioned in close proximity to most major domestic geographic markets. Our national scale combined with our local presence, dedication to service and broad product offering has enabled us to maintain our long-standing customer relationships.
Highly diversified across end markets, channels and geographies. We are strategically diversified across a broad range of end markets, distribution channels and geographies. Our products are used globally in a diverse range of end markets across non-residential construction, residential construction, agriculture and infrastructure. These end markets include storm sewer systems, agriculture, retail, stormwater retention/detention, on-site septic systems and structures. We maintain and service these end markets through strong product distribution relationships with many of the largest national and independent waterworks distributors, a network of hundreds of small to medium-sized distributors across the United States, major national retailers that carry drainage products and a broad variety of buying groups and co-ops in the United States. We serve our customers in all 50 U.S. states as well as approximately 90 other countries. Our domestic sales, which represented approximately 86% of our net sales in fiscal year 2013, are diversified across all regions of the United States. Approximately 14% of our net sales in fiscal year 2013 were generated outside of the United States.
Experienced management team with successful operating record and significant equity ownership. Our management team, led by our Chief Executive Officer, Joe Chlapaty, has an average of over 23 years of industry experience. We have a long history of generating profitable growth, attractive margins and cash flow. During periods of weaker economic conditions, we believe we have benefitted from an increased market focus on our products as a cost effective alternative to traditional materials. In stronger economic cycles, we have delivered profitable growth and an ability to leverage our scale and excess production capacity to meet rapid increases in demand.
After the completion of this offering, our management and directors will own approximately % of our common stock on a fully-converted basis. In addition, after the completion of this offering, the convertible preferred stock held by our ESOP will account for approximately % of our common stock on a fully-converted basis. This high level of management and employee ownership ensures that incentives are closely aligned with equity holders.
- 4 -
Table of Contents
Our Business Strategy
We intend to grow our net sales, improve our profitability and enhance our position as the leading provider of high performance thermoplastic corrugated pipe and related water management products by executing on the following strategies.
Continue to drive conversion to our products. Our products are generally lighter, more durable, more cost effective and easier to install than comparable alternatives made with traditional materials such as concrete, steel and PVC. We intend to continue to drive conversion to our products from traditional products as contractors, engineers and municipal agencies increasingly acknowledge the superior attributes and compelling value proposition of our thermoplastic products. Expanded regulatory approvals allow for their use in new markets and geographies, and we continue to invest heavily in industry education. We believe we are the industry leader in these efforts as regulatory approvals are essential to the specification and acceptance of these product lines.
Expand our product offering and markets served. Our strong market position provides us with insight into the evolving needs of our customers, which has allowed us to proactively develop and deliver comprehensive water management solutions. The strength of our overall sales and distribution platform has allowed us to acquire new Allied Products and deliver solution-based product portfolios that typically result in significantly higher net sales post-acquisition than the products generated before the addition to our product portfolio. Our ability to further develop our offering of Allied Products represents an attractive opportunity to capture additional growth and improve our overall margins. We will continue to focus on enhancing our core products and expanding our Allied Products through cross-selling opportunities in order to further penetrate untapped markets and customers. We also expect to continue to enter into selective adjacent new markets that leverage our sales and engineering capabilities, customer relationships and national distribution network and provide more water management solutions to our customers.
Expand our presence in attractive new geographies. Outside of the United States, we believe thermoplastic corrugated pipe represents a small part of the overall market. We further believe there is significant opportunity to convert new geographies based on the overall performance and value of our products, similar to what continues to occur in our existing markets. To date, in order to increase our speed to market, we have expanded internationally primarily through joint ventures with best-in-class local partners. Our existing joint ventures provide us with access to markets such as Brazil, Chile, Argentina, Mexico, Peru and Colombia. Combining a local partner’s customer relationships, brand recognition and local management talent, with our world-class manufacturing and process expertise, broad product portfolio and innovation, creates a strong platform with additional opportunities for international expansion. In the future, we will continue to identify new geographies to access markets through joint venture relationships with domestic partners in targeted areas.
Capitalize on growth related to the recovery in our primary end markets. We believe we are well positioned to take advantage of renewed growth and recovery in the non-residential and residential construction and infrastructure markets in the United States. Additionally, we believe we have the potential to capitalize on a substantial backlog of deferred infrastructure spending in the United States as a result of upgrades and repairs that were delayed in the recent economic downturn. Spending on the replacement of aging water drainage and sewer infrastructure (estimated to cost approximately $298 billion between 2013 and 2033, according to the American Society of Civil Engineers, or ASCE) and stricter U.S. Environmental Protection Agency, or EPA, guidelines for stormwater and wastewater management will drive additional demand for our products.
Continue our focus on operational excellence. Our focus on continuously improving operating efficiencies, reducing costs and improving product quality has enabled us to improve our position as a leading low-cost provider. We constantly strive to achieve operating and cost efficiencies across all facets of our business. For
- 5 -
Table of Contents
example, we employ sophisticated resin blending technology to minimize raw material costs and optimize production efficiency, while maintaining a high level of product quality and performance. We believe this and our other initiatives, combined with continued prudent management of our overhead, and the operating leverage inherent in our business model will allow us to maximize profitability as we continue to grow.
Selectively pursue strategic acquisitions. By utilizing our customer relationships and sales force, we have a demonstrated ability to identify and integrate numerous strategic acquisitions. We believe our strong reputation for product growth has allowed us to become the acquirer of choice, attracting acquisition opportunities that provide new technologies and product capabilities. We have remained one of the strongest and best capitalized companies in the industry throughout the recent economic cycle and are well positioned to capitalize on current market dynamics to selectively acquire key products and technologies. We have strong industry relationships and maintain an active acquisition pipeline.
Industry Overview and Trends
We serve a broad range of end markets across non-residential construction, residential construction, agriculture and infrastructure. We are the leading manufacturer of high performance thermoplastic corrugated pipe and a leading manufacturer of related water management products. We compete against other HDPE pipe producers, as well as pipe manufacturers selling products made from traditional materials such as concrete, corrugated steel and PVC on a national, regional and local basis. We compete primarily in the United States and Canada; however, we have also expanded internationally in Mexico, Central America and South America through our joint ventures. We believe the markets we serve in the United States represent approximately $10.1 billion of annual revenue opportunity. In addition, we believe the increasing acceptance of thermoplastic pipe products in international markets represents an attractive growth opportunity.
Core Product Categories
Pipe Market
Demand for our products is largely driven by residential and non-residential construction, transportation and related water drainage infrastructure spending and the repair and replacement of aging stormwater management infrastructure. Freedonia estimates that demand for large diameter pipe (defined as 15” diameter or larger depending on industry standards by material type) in the United States will increase at an average of 6.2% per year from approximately 146 million feet in 2011, to 197 million feet in 2016. We compete in the storm sewer, drainage, sanitary sewer and irrigation markets, which collectively represent approximately 70% of the overall large diameter pipe market in the United States. According to Freedonia, sanitary and storm sewers, which represent approximately 50% of the total large diameter pipe market demand, are expected to continue to drive growth for the large diameter pipe market through 2016. Additionally, Freedonia estimates that the largest expected growth in the forecast period will come from the drainage market, as non-residential and residential construction continues to rebound. According to Freedonia, HDPE, the primary material in our products, is projected to become a larger portion of the overall large diameter pipe market as states and municipalities are expected to continue to adopt this product as a result of its superior attributes and approve its use in a broader range of applications.
- 6 -
Table of Contents
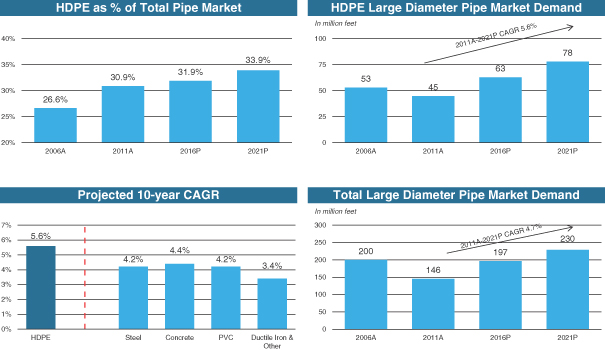
Source: Freedonia
Positive end market trends in the non-residential construction, residential construction, agricultural and infrastructure markets are also expected to drive increased demand for pipe products in Canada. Growth in fixed investment spending is expected to result in a higher number of sewer and drainage infrastructure projects. Housing starts in Canada are forecasted to grow from 185,000 in 2012 to 215,000 by 2017, according to Freedonia. We believe the large industry around forestry, minerals, petroleum and natural gas markets in Canada provide opportunity for pipe applications.
The GDP in Mexico is forecasted to expand at 3.7% annually through 2017. Construction growth in Mexico is driven by demand for housing, non-residential property and additional investment in public infrastructure. Freedonia forecasts HDPE pipe demand to grow 8% annually through 2017 in Mexico, to 50,000 metric tons, the fastest growth rate of any plastic resin.
The largest pipe markets in South America are Brazil and Chile. Other South American countries such as Argentina, Colombia, Ecuador and Peru are also forecasted to see strong growth in construction. Brazil has large infrastructure investment occurring related to the country hosting the 2014 FIFA World Cup and 2016 Summer Olympics. HDPE pipe is taking market share from concrete and PVC pipe in drainage and sewer applications in these markets. In Argentina, primary end markets for HDPE pipe are construction, natural resources and agriculture.
Related Water Management Solutions Market
We also offer a wide range of Allied Products to meet our customers’ water management requirements across various markets. The demand for these products is largely driven by residential and non-residential construction, transportation and related water drainage infrastructure spending and the replacement of aging stormwater management infrastructure.
- 7 -
Table of Contents
Stormwater Retention/Detention
Current EPA regulations require any development of one acre or larger to retain stormwater on site and gradually release it over time. This requirement is met by either using natural solutions, such as retention ponds, or structural solutions, which include systems constructed underground. According to the Freedonia Special Report, demand in this market is forecasted to grow 7.5% annually from 2013 to 2016. Growth of structural solutions is forecasted to grow 8.5% over this period, compared to 5.4% for natural solutions.
On-Site Septic
According to the EPA, an estimated 20% of total U.S. housing units depend upon on-site septic systems for the treatment and disposal of household sewage. An on-site septic system allows for effluent to be leached into the soil for treatment. The market is driven by new residential construction and, to a lesser extent, the repair and replacement of existing systems. Our plastic septic chamber products perform their septic treatment functions with gravel, reducing the cost to the contractor and homeowner over traditional pipe and stone systems that are also used for these systems.
Structures
Drainage structures are used in all major storm projects and are used to move surface-collected stormwater vertically down to pipe conveyance systems. The predominant products used today are concrete structures. We compete in this market with our Nyloplast product line, an engineered drainage structure made from PVC. Our Nyloplast product reduces construction cost and increases speed of installation compared to traditional precast concrete structures.
Water Quality
EPA regulations also limit the amount of sediment or other pollutants in discharged water. Similar to stormwater management, these requirements are met through the use of either natural or structural solutions. Freedonia forecasts that demand for these solutions will increase 10.1% annually through 2016, with natural and structural solutions growing at nearly the same rate. We provide structural solutions for water quality through our BaySaver and FlexStorm product lines.
Geosynthetics
We offer geosynthetic products through resale agreements with leading suppliers. Geosynthetics are used in a wide range of environmental and civil engineering applications to promote drainage, retain soils, control the flow of liquids and construct natural soil structures. Demand in this market is primarily driven by trends in non-residential and transportation construction activity. According to a December 2013 study by Freedonia on world geosynthetics demand, U.S. geosynthetic demand is forecasted to grow 6.5% annually through 2017.
Core End Markets
Non-Residential Construction (49% of Domestic Net Sales in Fiscal Year 2013)
For fiscal year 2013, our net sales in the U.S. non-residential construction market were $430.1 million, which represented 49% of our domestic net sales. Reed Construction Data is forecasting U.S. non-residential construction, consisting of commercial, institutional, manufacturing and warehouse construction, to grow 6.6% annually from 2013 to 2016 and increase 8.2% in 2014 over 2013.
- 8 -
Table of Contents
Residential Construction (21% of Domestic Net Sales in Fiscal Year 2013)
For fiscal year 2013, our net sales in the U.S. residential construction market were $184.3 million, which represented 21% of our domestic net sales. U.S. residential new construction has begun to recover since reaching historic lows during the recent economic downturn. While new housing starts demonstrated an annual growth rate of 16% from 2010 to 2013, current levels remain substantially below the long-term average of 1.5 million starts since the U.S. Census Bureau began reporting the data in 1959. According to McGraw Hill, residential new housing is expected to increase to 1.13 million starts, or 17%, in 2014, and increase to 1.36 million starts, or 20%, in 2015. As of September 2013, the Home Improvement Research Institute projects that U.S. sales of repair, renovation and improvement products will grow at a rate of 5.4% in 2013, 6.8% in 2014 and 7.0% in 2015, driven by the improving economy, rising home prices and greater consumer confidence.
Agriculture (21% of Domestic Net Sales in Fiscal Year 2013)
For fiscal year 2013, our net sales in the U.S. agriculture market were $184.3 million, which represented 21% of our domestic net sales. U.S. and global demand for corn and soybeans, net farm income and corn use for ethanol are significant drivers of our agriculture business and are leading indicators in regards to our product demand. According to the U.S. Department of Agriculture, agricultural exports were a record $140.9 billion in 2013 and are forecasted to increase 1% in 2014. According to the U.S. Department of Agriculture, net farm income increased to $130.5 billion in 2013, up from $85.0 billion in 2008. The U.S. Department of Agriculture estimates that 40% of corn production in the United States is consumed by ethanol production, with requirements not expected to decline in the near future.
Infrastructure (9% of Domestic Net Sales in Fiscal Year 2013)
For fiscal year 2013, our net sales in the U.S. infrastructure market were $79.0 million, which represented 9% of our domestic net sales. The main drivers of our products in the infrastructure market include the construction of streets and highways, storm and sanitary sewers, airports and railroads. ASCE rated the overall U.S. infrastructure a grade of D+ in its recent 2013 report card, and estimates that $298 billion is needed over the next 20 years to replace and upgrade the existing wastewater infrastructure in the United States. ASCE’s primary concern is the need to address sanitary and combined sewer overflows. Citing the 2008 Clean Watersheds Needs Survey, the ASCE report states $64 billion is needed to address combined sewer overflows and stormwater management over the 20-year period. There are four million miles of public roads and highways in the United States, primarily constructed over 50 years ago. The Federal Highway Administration estimates that $170 billion is needed annually to improve the condition of the nation’s roads and highways, a significant increase from the $101 billion that is needed to just maintain their current condition.
- 9 -
Table of Contents
Ownership and Corporate Information
We have a long history of employee ownership as well as ownership by financial sponsors. Our current ownership is comprised of members of our management team and other non-employee stockholders, ASP ADS Investco, LLC, an affiliate of American Securities LLC, or American Securities, and our ESOP in which our employees participate. For more information regarding our ESOP, see “Description of Employee Stock Ownership Plan.”
The following chart illustrates our ownership and organizational structure, including stock ownership percentages, after giving effect to this offering (assuming no exercise of the underwriters’ option to purchase additional shares):
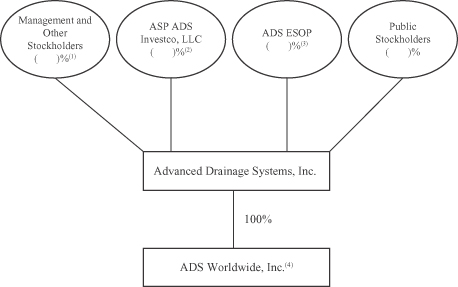
| (1) | Excludes (on a post-stock split basis) million shares of common stock issuable upon exercise of options outstanding as of December 31, 2013 at a weighted average exercise price of $ per share. |
| (2) | ASP ADS Investco, LLC is an affiliate of American Securities. |
| (3) | The ESOP currently holds all outstanding shares of our convertible preferred stock, which converts at the election of the ESOP into shares of our common stock as further described below under “Description of Employee Stock Ownership Plan.” The percentage ownership for the ESOP is on an as-converted basis. |
| (4) | ADS Worldwide, Inc. is our wholly-owned subsidiary through which we hold interests in the various international joint ventures through which we operate in Mexico, Central America and South America. |
- 10 -
Table of Contents
Summary of Risk Factors
Our business is subject to a number of risks of which you should be aware and carefully consider before making an investment decision. These risks are discussed in “Risk Factors,” and include but are not limited to the following:
| • | fluctuations in the price and availability of resins, our principal raw material, and our inability to pass on resin price increases to customers; |
| • | our inability to obtain adequate supplies of resins from suppliers; |
| • | disruption or volatility in general business and economic conditions in the markets in which we operate, such as non-residential and residential construction, agriculture and infrastructure markets ; |
| • | our ability to convert current demand for competitive products into demand for our products; |
| • | effect of weather or seasonality; |
| • | loss of any of our significant customers; |
| • | failure to collect monies owed from customers; |
| • | exposure of our international operations to political, economic and regulatory risks; |
| • | risks associated with conducting a portion of our operations through joint ventures; |
| • | our ability to successfully expand into new geographic or product markets; |
| • | risks associated with acquisitions; |
| • | risks associated with increased fuel and energy prices; |
| • | risks associated with manufacturing process, construction defect and product liability and legal proceedings; |
| • | our current levels of indebtedness and related restrictions and limitations imposed on us; |
| • | securities or industry analysts may not publish research or may publish misleading or unfavorable research about our business; and |
| • | fulfilling our obligations incident to being a public company. |
Corporate Information
We were founded in 1966 and are a Delaware corporation. Our principal executive offices are located at 4640 Trueman Boulevard, Hilliard, Ohio 43026, and our telephone number at that address is (614) 658-0050. Our corporate website is www.ads-pipe.com. Information on, and which can be accessed through, our website is not part of, and is not incorporated by reference in this prospectus.
- 11 -
Table of Contents
The Offering
| Common stock offered by us |
shares ( shares if the underwriters exercise in full their option to purchase additional shares). |
| Common stock offered by the selling stockholder |
shares ( shares if the underwriters exercise in full their option to purchase additional shares). |
| Common stock outstanding immediately after this offering |
shares ( shares if the underwriters exercise in full their option to purchase additional shares). |
| Option to purchase additional shares of common stock |
The underwriters have a 30-day option to purchase up to an additional shares of common stock from us and up to an additional shares of common stock from the selling stockholder. |
| Proposed New York Stock Exchange symbol |
“WMS.” |
| Use of proceeds |
We intend to use the net proceeds from this offering (together with cash on hand, if necessary) to repay at least $ million of outstanding indebtedness under the revolving portion of our credit facility. We intend to use the remaining proceeds (if any) for general corporate purposes. We will not receive any proceeds from the sale of shares by the selling stockholder. See “Use of Proceeds.” |
| Risk factors |
See “Risk Factors” and other information included in this prospectus for a discussion of factors that you should carefully consider before deciding whether to invest in shares of our common stock. |
| Dividend policy |
We have a history of paying dividends to our stockholders when sufficient cash is available, and we currently intend to pay dividends in the future after this offering. Any determination to pay dividends on our capital stock in the future will be at the discretion of our board of directors, subject to applicable laws and the provisions of our amended and restated certificate of incorporation (including those relating to the payment of dividends on our convertible preferred stock), and will depend on our financial condition, results of operations, capital requirements, general business conditions and other factors that our board of directors considers relevant. In addition, the terms of our credit facilities contain restrictions on our ability to pay dividends. See “Dividend Policy.” |
The number of shares of common stock to be outstanding immediately following this offering gives effect to a -for- stock split to be effected immediately prior to the effectiveness of the registration statement of which this prospectus forms a part, and includes (i) shares of our common stock outstanding as of , 2014, and (ii) shares of common stock offered by us in connection with this offering (assuming no exercise of the underwriters’ option to purchase additional shares), and excludes (on a post-stock split basis):
| • | million shares of restricted stock outstanding as of , 2014 under our 2008 Restricted Stock Plan; |
- 12 -
Table of Contents
| • | million shares of common stock issuable upon exercise of options outstanding as of December 31, 2013 at a weighted average exercise price of $ per share; and |
| • | million shares of common stock reserved for future issuance under our 2013 Stock Option Plan. |
Unless otherwise indicated, all information in this prospectus assumes the following:
| • | a -for- stock split to be effected immediately prior to the effectiveness of the registration statement of which this prospectus forms a part; |
| • | no exercise by the underwriters of their option to purchase additional shares; |
| • | the filing of our amended and restated certificate of incorporation and the adoption of our amended and restated bylaws immediately prior to the closing of this offering; and |
| • | an initial public offering price of $ per share, which is the midpoint of the price range set forth on the cover of this prospectus. |
- 13 -
Table of Contents
Summary Consolidated Financial Data
The summary consolidated financial data presented below as of March 31, 2012 and 2013 and for fiscal years 2011, 2012 and 2013 have been derived from our audited consolidated financial statements included elsewhere in this prospectus. The summary consolidated financial data presented below as of December 31, 2013 and for the nine months ended December 31, 2012 and 2013 have been derived from our unaudited condensed consolidated financial statements included elsewhere in this prospectus. The summary consolidated financial data presented below as of March 31, 2011 have been derived from our audited consolidated financial statements which are not included in this prospectus.
The results indicated below and elsewhere in this prospectus are not necessarily indicative of our future performance. You should read this data in conjunction with “Management’s Discussion and Analysis of Financial Condition and Results of Operations” and our consolidated financial statements and the related notes included elsewhere in this prospectus. This summary consolidated financial data does not reflect the earnings per share and dividends per share impact of our -for- stock split to be effected immediately prior to the effectiveness of the registration statement of which this prospectus forms a part.
| Fiscal Year Ended March 31, |
Nine Months Ended December 31, |
|||||||||||||||||||
| (Amounts in thousands, except per share data) | 2011 | 2012 | 2013 | 2012 | 2013 | |||||||||||||||
| Consolidated statement of income data: |
||||||||||||||||||||
| Net sales |
$ | 863,138 | $ | 1,013,756 | $ | 1,017,041 | $ | 832,565 | $ | 887,777 | ||||||||||
| Cost of goods sold |
692,164 | 818,398 | 807,730 | 659,283 | 698,791 | |||||||||||||||
|
|
|
|
|
|
|
|
|
|
|
|||||||||||
| Gross profit |
170,974 | 195,358 | 209,311 | 173,282 | 188,986 | |||||||||||||||
| Selling expenses |
63,103 | 67,625 | 69,451 | 52,847 | 52,433 | |||||||||||||||
| General and administrative expenses |
61,648 | 65,927 | 67,712 | 48,913 | 54,354 | |||||||||||||||
| Gain on sale of assets/ business |
— | (44,634 | ) | (2,210 | ) | (2,210 | ) | (4,848 | ) | |||||||||||
| Intangibles amortization |
7,294 | 11,387 | 11,295 | 8,119 | 8,576 | |||||||||||||||
|
|
|
|
|
|
|
|
|
|
|
|||||||||||
| Income from operations |
38,929 | 95,053 | 63,063 | 65,613 | 78,471 | |||||||||||||||
| Interest expense |
27,121 | 21,837 | 16,095 | 12,465 | 11,860 | |||||||||||||||
| Other miscellaneous (income) expense, net |
(847 | ) | 2,425 | 283 | 176 | 398 | ||||||||||||||
|
|
|
|
|
|
|
|
|
|
|
|||||||||||
| Income before income taxes |
12,655 | 70,791 | 46,685 | 52,972 | 66,213 | |||||||||||||||
| Income tax expense |
4,053 | 27,064 | 16,894 | 20,112 | 40,845 | |||||||||||||||
| Equity in net (income) loss of unconsolidated affiliates |
(736 | ) | (704 | ) | (387 | ) | (402 | ) | 714 | |||||||||||
|
|
|
|
|
|
|
|
|
|
|
|||||||||||
| Net income |
9,338 | 44,431 | 30,178 | 33,262 | 24,654 | |||||||||||||||
| Less net income attributable to the noncontrolling interest |
3,342 | 1,171 | 2,019 | 1,654 | 1,360 | |||||||||||||||
|
|
|
|
|
|
|
|
|
|
|
|||||||||||
| Net income attributable to ADS |
5,996 | 43,260 | 28,159 | 31,608 | 23,294 | |||||||||||||||
|
|
|
|
|
|
|
|
|
|
|
|||||||||||
| Change in fair value of Redeemable Convertible Preferred Stock |
(3,541 | ) | (10,257 | ) | (5,869 | ) | (3,682 | ) | (8,492 | ) | ||||||||||
| Dividends paid to Redeemable Convertible Preferred Stockholders |
(844 | ) | (668 | ) | (736 | ) | (554 | ) | (640 | ) | ||||||||||
| Dividends paid to unvested restricted stockholders |
(104 | ) | (34 | ) | (52 | ) | (39 | ) | (47 | ) | ||||||||||
|
|
|
|
|
|
|
|
|
|
|
|||||||||||
| Net income available to common stockholders and participating securities |
1,507 | 32,301 | 21,502 | 27,333 | 14,115 | |||||||||||||||
| Undistributed income allocated to participating securities |
— | (3,241 | ) | (2,042 | ) | (2,703 | ) | (1,184 | ) | |||||||||||
|
|
|
|
|
|
|
|
|
|
|
|||||||||||
| Net income available to common stockholders |
$ | 1,507 | $ | 29,060 | $ | 19,460 | $ | 24,630 | $ | 12,931 | ||||||||||
|
|
|
|
|
|
|
|
|
|
|
|||||||||||
- 14 -
Table of Contents
| Fiscal Year Ended March 31, |
Nine Months Ended December 31, |
|||||||||||||||||||
| (Amounts in thousands, except per share data) | 2011 | 2012 | 2013 | 2012 | 2013 | |||||||||||||||
| Weighted average common shares outstanding: |
||||||||||||||||||||
| Basic |
10,127 | 9,835 | 9,921 | 9,917 | 9,980 | |||||||||||||||
| Diluted |
10,346 | 9,996 | 10,038 | 10,033 | 10,087 | |||||||||||||||
| As adjusted — Basic (2) |
||||||||||||||||||||
| As adjusted — Diluted (2) |
||||||||||||||||||||
| Net income per share: |
||||||||||||||||||||
| Basic |
$ | 0.15 | $ | 2.95 | $ | 1.96 | $ | 2.48 | $ | 1.30 | ||||||||||
| Diluted |
$ | 0.15 | $ | 2.91 | $ | 1.94 | $ | 2.45 | $ | 1.28 | ||||||||||
| As adjusted — Basic (2) |
$ | 0.49 | $ | 3.88 | $ | 2.48 | $ | 2.81 | $ | 2.05 | ||||||||||
| As adjusted — Diluted (2) |
$ | 0.47 | $ | 3.81 | $ | 2.45 | $ | 2.75 | $ | 2.00 | ||||||||||
| Cash dividends declared per share |
$ | 0.44 | $ | 0.44 | $ | 0.48 | $ | 0.33 | $ | 0.36 | ||||||||||
| Fiscal Year Ended March 31, |
Nine Months Ended December 31, |
|||||||||||||||||||
| (Amounts in thousands, except percentages) | 2011 | 2012 | 2013 | 2012 | 2013 | |||||||||||||||
| Other financial data: |
||||||||||||||||||||
| Capital expenditures |
$ | 30,041 | $ | 26,467 | $ | 40,004 | $ | 35,421 | $ | 27,097 | ||||||||||
| Adjusted EBITDA (3) |
100,780 | 116,873 | 129,759 | 115,731 | 130,567 | |||||||||||||||
| Adjusted EBITDA margin (4) |
11.7 | % | 11.5 | % | 12.8 | % | 13.9 | % | 14.7 | % | ||||||||||
| As of March 31, |
As of December 31, |
|||||||||||||||||
| (Amounts in thousands) | 2011 (1) | 2012 | 2013 | 2013 | ||||||||||||||
| Consolidated balance sheet data: |
||||||||||||||||||
| Cash |
$ | 2,151 | $ | 2,082 | $ | 1,361 | $ | 5,335 | ||||||||||
| Working capital (5) |
204,061 | 208,268 | 220,276 | 208,097 | ||||||||||||||
| Total assets |
866,798 | 905,028 | 907,739 | 885,948 | ||||||||||||||
| Long-term debt |
374,746 | 370,672 | 349,990 | 306,265 | ||||||||||||||
| Total liabilities |
618,351 | 615,314 | 585,115 | 545,632 | ||||||||||||||
| Total mezzanine equity (6) |
493,674 | 557,563 | 608,346 | 678,175 | ||||||||||||||
| Total stockholders’ equity |
(245,227 | ) | (267,849 | ) | (285,722 | ) | (337,859 | ) | ||||||||||
| Total mezzanine equity and stockholders’ equity |
248,447 | 289,714 | 322,624 | 340,316 | ||||||||||||||
| Fiscal Year Ended March 31, |
Nine Months Ended December 31, |
|||||||||||||||||||
| (Amounts in thousands) | 2011 | 2012 | 2013 | 2012 | 2013 | |||||||||||||||
| Statement of cash flows data: |
||||||||||||||||||||
| Net cash from operating activities |
$ | 37,233 | $ | 56,997 | $ | 68,215 | $ | 60,176 | $ | 88,104 | ||||||||||
| Net cash from investing activities |
(53,237 | ) | (35,833 | ) | (47,199 | ) | (42,079 | ) | (30,116 | ) | ||||||||||
| Net cash from financing activities |
15,134 | (21,233 | ) | (21,737 | ) | (15,987 | ) | (54,014 | ) | |||||||||||
| (1) | The presentation of our summary consolidated financial data as of March 31, 2011 has been adjusted to comply with the retrospective application of our inventory accounting principle change. See Note 1, Background and Summary of Significant Accounting Policies, within our consolidated financial statements included elsewhere in this prospectus for further details regarding our inventory accounting principle change. |
| (2) | Net Income Per Share As Adjusted — Basic and Diluted, which are non-GAAP measures, have been presented in this prospectus as supplemental measures of financial performance that are not required by, or presented in accordance with generally accepted accounting principles or GAAP. As described elsewhere in this prospectus, upon completion of this offering, the redemption rights associated with these shares, which require them to be classified as mezzanine equity, will be no longer in effect and, as such, we anticipate reclassifying these balances to total stockholders’ equity upon the completion of this offering. We calculate Net Income Per Share As Adjusted — Basic, |
- 15 -
Table of Contents
| and the corresponding Weighted Average Common Shares Outstanding As Adjusted — Basic, by adjusting our historical net income per share and weighted average common shares outstanding amounts for the reclassification of Redeemable Convertible Preferred Stock from mezzanine equity to total stockholders’ equity in order to present historical amounts as if this reclassification occurred as of the beginning of the earliest period presented. |
To effect this adjustment, we have (1) removed the adjustment for the change in fair value of Redeemable Convertible Preferred Stock classified as mezzanine equity from the numerator of the Basic Net Income Per Share computation, and (2) made a corresponding adjustment to the amount allocated to participating securities under the two-class earnings per share computation method.
We have also made adjustments to Net Income Per Share as Adjusted – Diluted, and the corresponding Weighted Average Common Shares Outstanding As Adjusted – Diluted, to assume share settlement of the Redeemable Convertible Preferred Stock to the extent that the if-converted computation method is more dilutive than the two-class computation method.
Net Income Per Share As Adjusted — Basic and Diluted are included in this prospectus because they are key metrics used by management and our board of directors to assess our financial performance. Net Income Per Share As Adjusted — Basic and Diluted are not necessarily comparable to other similarly titled captions of other companies due to different methods of calculation.
The following table presents a reconciliation of Net Income Per Share As Adjusted — Basic and Diluted, and the corresponding Weighted Average Common Shares Outstanding As Adjusted — Basic and Diluted to our historical net income per share and corresponding historical weighted average common share amounts, the most comparable GAAP measure, for each of the periods indicated.
| Fiscal Year Ended March 31, |
Nine Months Ended |
|||||||||||||||||||
| (Amounts in thousands, except per share data) | 2011 | 2012 | 2013 | 2012 | 2013 | |||||||||||||||
| Net Income Per Share As Adjusted — Basic |
||||||||||||||||||||
| Net income available to common stockholders |
$ | 1,507 | $ | 29,060 | $ | 19,460 | $ | 24,630 | $ | 12,931 | ||||||||||
| Adjustment for: |
||||||||||||||||||||
| Change in fair value of Redeemable Convertible Preferred Stock |
3,541 | 10,257 | 5,869 | 3,682 | 8,492 | |||||||||||||||
| Undistributed income allocated to participating securities |
(76 | ) | (1,189 | ) | (716 | ) | (418 | ) | (997 | ) | ||||||||||
|
|
|
|
|
|
|
|
|
|
|
|||||||||||
| Net income available to common stockholders used to calculate Net Income Per Share As Adjusted — Basic |
$ | 4,972 | $ | 38,128 | $ | 24,613 | $ | 27,894 | $ | 20,426 | ||||||||||
|
|
|
|
|
|
|
|
|
|
|
|||||||||||
| Weighted average common shares outstanding: |
||||||||||||||||||||
| Basic |
10,127 | 9,835 | 9,921 | 9,917 | 9,980 | |||||||||||||||
| As adjusted — Basic |
10,127 | 9,835 | 9,921 | 9,917 | 9,980 | |||||||||||||||
| Net Income Per Share As Adjusted — Diluted |
||||||||||||||||||||
| Net income available to common stockholders used to calculate Net Income Per Share As Adjusted — Basic |
$ | 4,972 | $ | 38,128 | $ | 24,613 | $ | 27,894 | $ | 20,426 | ||||||||||
| Adjustment for: |
||||||||||||||||||||
| Undistributed income allocated to participating Redeemable Convertible Preferred Stock |
74 | — | — | 2,972 | 2,071 | |||||||||||||||
| Dividends paid to Redeemable Convertible Preferred Stockholders, net of tax impact |
557 | — | — | 360 | 416 | |||||||||||||||
| Other adjustments |
(4 | ) | — | — | (5 | ) | 45 | |||||||||||||
|
|
|
|
|
|
|
|
|
|
|
|||||||||||
| Net income available to common stockholders used to calculate Net Income Per Share As Adjusted — Diluted |
$ | 5,599 | $ | 38,128 | $ | 24,613 | $ | 31,221 | $ | 22,958 | ||||||||||
|
|
|
|
|
|
|
|
|
|
|
|||||||||||
| Weighted average common shares outstanding |
||||||||||||||||||||
| Diluted |
10,346 | 9,996 | 10,038 | 10,033 | 10,087 | |||||||||||||||
| Conversion of the outstanding Redeemable Convertible Preferred Stock on an as converted basis |
1,607 | — | — | 1,305 | 1,366 | |||||||||||||||
|
|
|
|
|
|
|
|
|
|
|
|||||||||||
| As adjusted — Diluted |
11,953 | 9,996 | 10,038 | 11,338 | 11,453 | |||||||||||||||
| Net income (loss) per share: |
||||||||||||||||||||
| As adjusted — Basic |
$ | 0.49 | $ | 3.88 | $ | 2.48 | $ | 2.81 | $ | 2.05 | ||||||||||
| As adjusted — Diluted |
$ | 0.47 | $ | 3.81 | $ | 2.45 | $ | 2.75 | $ | 2.00 | ||||||||||
| (3) | EBITDA and Adjusted EBITDA, which are non-GAAP financial measures, have been presented in this prospectus as supplemental measures of financial performance that are not required by, or presented in accordance with generally accepted accounting principles or GAAP. We calculate EBITDA as net income attributable to ADS before interest, income taxes, depreciation and amortization. We calculate Adjusted EBITDA as EBITDA before stock based compensation expense, non-cash charges and certain other expenses. |
- 16 -
Table of Contents
EBITDA and Adjusted EBITDA are included in this prospectus because they are key metrics used by management and our board of directors to assess our financial performance. EBITDA and Adjusted EBITDA are frequently used by analysts, investors and other interested parties to evaluate companies in our industry. In addition to covenant compliance and executive performance evaluations, we use Adjusted EBITDA to supplement GAAP measures of performance to evaluate the effectiveness of our business strategies, to make budgeting decisions and to compare our performance against that of other peer companies using similar measures.
EBITDA and Adjusted EBITDA are not GAAP measures of our financial performance or liquidity and should not be considered as alternatives to net income as a measure of financial performance or cash flows from operations as a measure of liquidity, or any other performance measure derived in accordance with GAAP and they should not be construed as an inference that our future results will be unaffected by unusual or non-recurring items. Additionally, EBITDA and Adjusted EBITDA are not intended to be measures of free cash flow for management’s discretionary use, as they do not reflect certain cash requirements such as tax payments, debt service requirements, capital expenditures and certain other cash costs that may recur in the future. EBITDA and Adjusted EBITDA contain certain other limitations, including the failure to reflect our cash expenditures, cash requirements for working capital needs and cash costs to replace assets being depreciated and amortized. In evaluating Adjusted EBITDA, you should be aware that in the future we will incur expenses that are the same as or similar to some of the adjustments in this presentation, such as stock based compensation expense, derivative fair value adjustments, and foreign currency transaction losses. Our presentation of Adjusted EBITDA should not be construed to imply that our future results will be unaffected by any such adjustments. Management compensates for these limitations by relying on our GAAP results in addition to using EBITDA and Adjusted EBITDA supplementally. Our measures of EBITDA and Adjusted EBITDA are not necessarily comparable to other similarly titled captions of other companies due to different methods of calculation.
The following table presents a reconciliation of EBITDA and Adjusted EBITDA to Net income, the most comparable GAAP measure, for each of the periods indicated.
| Fiscal Year Ended March 31, |
Nine Months Ended December 31, |
|||||||||||||||||||
| (Amounts in thousands) | 2011 | 2012 | 2013 | 2012 | 2013 | |||||||||||||||
| Net income attributable to ADS |
$ | 5,996 | $ | 43,260 | $ | 28,159 | $ | 31,608 | $ | 23,294 | ||||||||||
| Depreciation and amortization (a) |
56,327 | 59,356 | 56,926 | 42,188 | 43,076 | |||||||||||||||
| Interest expense, net |
27,121 | 21,837 | 16,095 | 12,465 | 11,860 | |||||||||||||||
| Income tax expense |
4,053 | 27,064 | 16,894 | 20,112 | 40,845 | |||||||||||||||
|
|
|
|
|
|
|
|
|
|
|
|||||||||||
| EBITDA |
93,497 | 151,517 | 118,074 | 106,373 | 119,075 | |||||||||||||||
| Derivative fair value adjustments (b) |
(1,365 | ) | 2,315 | (4 | ) | 220 | 54 | |||||||||||||
| Foreign currency transaction losses (c) |
332 | 378 | 1,085 | 659 | 251 | |||||||||||||||
| Gain on sale of Septic Chamber business (d) |
— | (44,634 | ) | — | — | — | ||||||||||||||
| Unconsolidated affiliates interest and tax (e) |
624 | 915 | 729 | 488 | 347 | |||||||||||||||
| One-time management fee to minority interest holder (f) |
— | — | — | — | 739 | |||||||||||||||
| Stock based compensation (g) |
2,725 | 1,425 | 2,592 | 1,207 | 2,640 | |||||||||||||||
| ESOP deferred stock based compensation (h) |
4,564 | 4,957 | 7,283 | 6,784 | 7,343 | |||||||||||||||
| Transaction costs (i) |
403 | — | — | — | 118 | |||||||||||||||
|
|
|
|
|
|
|
|
|
|
|
|||||||||||
| Adjusted EBITDA |
$ | 100,780 | $ | 116,873 | $ | 129,759 | $ | 115,731 | $ | 130,567 | ||||||||||
|
|
|
|
|
|
|
|
|
|
|
|||||||||||
| (a) | Includes our proportionate share of depreciation and amortization expense of $552, $985 and $1,321 related to our South American Joint Venture and our BaySaver Joint Venture, which amounts are included in equity in net income of unconsolidated affiliates in our consolidated statements of income for fiscal years 2011, 2012 and 2013, respectively, and $977 and $1,031 included in equity in net income of unconsolidated affiliates in our condensed consolidated statements of income for the nine months ended December 31, 2012 and 2013, respectively. Depreciation and amortization expense for fiscal year 2012 also includes a charge of $3,200 related to the impairment of one of our trademarks. |
| (b) | Represents the non-cash gains and losses arising from changes in mark-to-market values for derivative contracts related to diesel fuel and interest rate swaps. The impact of resin physical and financial derivatives is included in cost of goods sold. |
| (c) | Represents the gains and losses incurred on purchases, sales and intercompany loans and dividends denominated in non-functional currencies. |
| (d) | Represents a gain recognized on the sale of our septic chamber business in January 2012. |
| (e) | Represents our proportional share of income taxes and interest related to our South American Joint Venture and our BaySaver Joint Venture, which are accounted for under the equity method of accounting. |
- 17 -
Table of Contents
| (f) | Represents management fee paid to a minority interest holder of a consolidated subsidiary. |
| (g) | Represents the non-cash stock based compensation cost related to our stock options and restricted stock awards. |
| (h) | Represents the non-cash stock based compensation expense attributable to the shares of convertible preferred stock allocated to employee ESOP accounts during the applicable period. |
| (i) | Represents expenses recorded related to legal, accounting and other professional fees incurred in connection with our recent debt refinancing and in connection with this offering. |
| (4) | Adjusted EBITDA margin for any period represents Adjusted EBITDA as a percentage of net sales for that period. |
| (5) | Working capital is the difference between our current assets and current liabilities. Working capital is an indication of liquidity and potential need for short-term funding. |
| (6) | Our mezzanine equity consists of the Redeemable Convertible Preferred Stock held by our ESOP and Redeemable Common Stock held by certain stockholders who have certain rights associated with such shares, which rights are considered for purposes of GAAP to be a redemption right, which is beyond our control. See Note 17, Mezzanine Equity, within our consolidated financial statements included elsewhere in this prospectus for further information regarding the accounting treatment for our mezzanine equity. Upon completion of this offering, the redemption rights associated with these shares, which require them to be classified in mezzanine equity, will be no longer be in effect. As a result, we anticipate reclassifying these balances to total stockholders’ equity upon the completion of this offering. |
- 18 -
Table of Contents
Investing in our common stock involves a high degree of risk. Before you make your investment decision, you should carefully consider the risks described below and the other information contained in this prospectus, including our consolidated financial statements and the related notes. If any of the following risks actually occur, our business, financial condition, results of operations and cash flows could be materially adversely affected. In these circumstances, the market price of our common stock could decline, and you may lose all or part of your investment.
Risks Relating to Our Business
Fluctuations in the price and availability of resins, our principal raw materials, and our inability to obtain adequate supplies of resins from suppliers and pass on resin price increases to customers could adversely affect our business, financial condition, results of operations and cash flows.
The principal raw materials that we use in our high performance thermoplastic corrugated pipe and Allied Products are virgin and recycled resins. Our ability to operate profitably depends, to a large extent, on the markets for these resins. In particular, as resins are derived either directly or indirectly from crude oil derivatives and natural gas liquids, resin prices fluctuate substantially as a result of changes in crude oil and natural gas prices, changes in existing refining capabilities and the capacity of resin suppliers. The petrochemical industry historically has been cyclical and volatile. The cycles are generally characterized by periods of tight supply, followed by periods of oversupply, primarily resulting from significant capacity additions. For example, resin prices have increased since 2010 due to increased demand in the broader economy. The weighted average market cost for the types of resin that we use increased by approximately 7.2% and 0.9% for fiscal years 2012 and 2013, respectively. Unanticipated changes in and disruptions to existing refining capacities could also significantly increase resin prices, often within a short period of time, even if crude oil and natural gas prices remain low.
Our ability to offer our core products depends on our ability to obtain adequate resins, which we purchase directly from major petrochemical and chemical suppliers. We have long-standing relationships as well as supply contracts with some of these suppliers but we have no fixed-price contracts with any of our major suppliers. Prices are typically negotiated on a continuous basis. We have implemented a limited resin price hedging program which has historically covered less than 50% of our virgin resin purchases. The loss of, or substantial decrease in the availability of, raw materials from our suppliers, or the failure by our suppliers to continue to provide us with raw materials on commercially reasonable terms, or at all, could adversely affect our business, financial condition, results of operations and cash flows. In addition, supply interruptions could arise from labor disputes or weather conditions affecting supplies or shipments, transportation disruptions or other factors beyond our control. A disruption in the timely availability of raw materials from our key suppliers would result in a decrease in our revenues and profitability.
Our ability to maintain profitability heavily depends on our ability to pass through to our customers the full amount of any increase in raw material costs, which are a large portion of our overall product costs. We may be unable to do so in a timely manner, or at all, due to competition in the markets in which we operate. In addition, certain of our largest customers historically have exerted significant pressure on their outside suppliers to keep prices low because of their market share. If increases in the cost of raw materials cannot be passed on to our customers, or the duration of time associated with a pass through becomes extended, our business, financial condition, results of operations and cash flows will be adversely affected.
Any disruption or volatility in general business and economic conditions in the markets in which we operate could have a material adverse effect on the demand for our products and services.
The markets in which we operate are sensitive to general business and economic conditions in the United States and worldwide, including availability of credit, interest rates, fluctuation in capital and business and consumer confidence. The capital and credit markets have in recent years been experiencing significant volatility
- 19 -
Table of Contents
and disruption. These conditions, combined with price fluctuations in crude oil derivatives and natural gas liquids, declining business and consumer confidence and increased unemployment, precipitated an economic slowdown and severe recession in recent years. The difficult conditions in these markets and the overall economy affect our business in a number of ways. For example:
| • | The slowdown and volatility of the United States economy in general is having an adverse effect on our sales that are dependent on the non-residential construction market. According to the U.S. Census Bureau, actual non-residential construction put-in-place in the United States during 2013 remained 13.5% lower than 2009 levels. Continued uncertainty about current economic conditions will continue to pose a risk to our business units that serve the non-residential construction market, as participants in this industry may postpone spending in response to tighter credit, negative financial news and/or declines in income or asset values, which could have a continued material adverse effect on the demand for our products and services. |
| • | The homebuilding industry has undergone a significant decline from its peak in 2005. While new housing starts demonstrated an annual growth rate of 16% from 2010 to 2013, current levels remain substantially below the long-term average of 1.5 million starts since the U.S. Census Bureau began reporting the data in 1959. |
| • | The mortgage markets continue to experience disruption and reduced availability of mortgages for potential homebuyers due to more restrictive standards to qualify for mortgages, including with respect to new home construction loans. The multi-year downturn in the homebuilding industry resulted in a substantial reduction in demand for our products and services in this market, which in turn had a significant adverse effect on our financial condition and results of operations during the period from 2008 to 2013, as compared to peak levels. |
| • | Our business depends to a great extent upon general activity levels in the agriculture market. Changes in corn production, soybean production, farm income, farmland value and the level of farm output in the geographic locations in which we operate are all material factors that could adversely affect the agriculture market and result in a decrease in the amount of products that our customers purchase. The nature of the agriculture market is such that a downturn in demand can occur suddenly, resulting in excess inventories, un-utilized production capacity and reduced prices for pipe products. These downturns may be prolonged and our revenue and profitability would be harmed. |
| • | Demand for our products and services depends to a significant degree on spending on infrastructure, which is inherently cyclical. Infrastructure spending is affected by a variety of factors beyond our control, including interest rates, availability and commitment of public funds for municipal spending and highway spending and general economic conditions. Our products sales may be adversely impacted by budget cuts by governments, including as a result of lower than anticipated tax revenues. |
All of our markets are sensitive to changes in the broader economy. Downturns or lack of substantial improvement in the economy in any region in which we operate have adversely affected and could continue to adversely affect our business, financial condition and results of operations. While we operate in many markets, our business is particularly impacted by changes in the economies of the United States, Canada and Mexico, which represented approximately 86.5%, 6.2% and 5.8%, respectively, of our net sales for fiscal year 2013 and collectively represented approximately 98.4% of our net sales for fiscal year 2013.
We cannot predict the duration of current economic conditions, or the timing or strength of any future recovery of activities in our markets. Continued weakness in the market in which we operate could have a material adverse effect on our business, financial condition, results of operations and cash flows. We may have to close under-performing facilities from time to time as warranted by general economic conditions and/or weakness in the markets in which we operate. In addition to a reduction in demand for our products, these factors may also reduce the price we are able to charge for our products and restrict our ability to pass raw material cost increases to our customers. This, combined with an increase in excess capacity, will negatively impact our profitability, cash flows and our financial condition, generally.
- 20 -
Table of Contents
Demand for our products and services could decrease if we are unable to compete effectively, and our success depends largely on our ability to convert current demand for competitive products into demand for our products.
We compete with both manufacturers of high performance thermoplastic corrugated pipe and manufacturers of alternative products, such as concrete, steel and PVC pipe products, on the basis of a number of considerations, including product characteristics such as durability, design, ease of installation, price on a price-to-value basis and service. In particular, we compete on a global, national and local basis with pipe products made of traditional materials which our high performance thermoplastic corrugated pipe products are designed to replace. For example, our N-12 and SaniTite HP products face competition from concrete, steel and PVC pipe products in the small- and large-diameter size segments of the market.
Our ability to successfully compete and grow depends largely on our ability to continue to convert the current demand for concrete, steel and PVC pipe products into demand for our high performance thermoplastic corrugated pipe and Allied Products. To increase our market share we will need to increase material conversion by educating our customers about the value of our products in comparison to existing alternatives, working with government agencies to expand approvals for our products and working with civil engineering firms which may influence the specification of our products on construction projects. No assurance can be given that our efforts to increase or maintain the current rate of material conversion will be successful, and our failure to do so would have a material adverse effect on our business, financial condition, results of operations and cash flows.
We also expect that new competitors may develop over time. No assurance can be given that we will be able to respond effectively to such competitive pressures. Increased competition by existing and future competitors could result in reductions in sales, prices, volumes and gross margins that would materially adversely affect our business, financial condition, results of operations and cash flows. Furthermore, our success will depend, in part, on our ability to maintain our market share and gain market share from competitors.
Certain of our competitors have financial and other resources that are greater than ours and may be better able to withstand price competition, especially with respect to traditional products. In addition, consolidation by industry participants could result in competitors with increased market share, larger customer bases, greater diversified product offerings and greater technological and marketing expertise, which would allow them to compete more effectively against us. Moreover, our competitors may develop products that are superior to our products or may adapt more quickly to new technologies or evolving customer requirements. Technological advances by our competitors may lead to new manufacturing techniques and make it more difficult for us to compete. In many markets in which we operate there are no significant entry barriers that would prevent new competitors from entering the market, especially on the local level, or existing competitors from expanding in the market. In addition, because we do not have long-term arrangements with many of our customers, these competitive factors could cause our customers to cease purchasing our products.
In addition, our contracts with municipalities are often awarded and renewed through periodic competitive bidding. We may not be successful in obtaining or renewing these contracts on financially attractive terms or at all, which could adversely affect our business, financial condition, results of operations and cash flows.
Our results of operations could be adversely affected by the effects of weather.
Although weather patterns affect our operating results throughout the year, adverse weather historically has reduced construction activity in our third and fourth fiscal quarters. In contrast, our highest volume of net sales historically has occurred in our first and second fiscal quarters.
Most of our business units experience seasonal variation as a result of the dependence of our customers on suitable weather to engage in construction projects. Generally, during the winter months, construction activity declines due to inclement weather, frozen ground and shorter daylight hours. For example, during the spring of 2013 and 2014, the extremely cold weather significantly reduced the level of construction activities in the United States, thereby impacting our revenues. In addition, to the extent that hurricanes, severe storms, floods, other
- 21 -
Table of Contents
natural disasters or similar events occur in the geographic regions in which we operate, our results of operations may be adversely affected. For example, Hurricane Andrew in Florida in 1992 and the extensive flooding of the Mississippi River in 2011 resulted in temporary interruption in business activity in these areas. We anticipate that fluctuations of our operation results from period to period due to seasonality will continue in the future.
The loss of any of our significant customers could adversely affect our business, financial condition, results of operations and cash flows.
Our 10 largest customers in the United States generated approximately 35.1% of our domestic net sales in fiscal year 2013. We cannot guarantee that we will maintain or improve our relationships with these customers or that we will continue to supply these customers at historical levels. Because we do not have long-term arrangements with many of our customers, such customers may cease purchasing our products without notice or upon short notice to us. During the economic downturn, some of our customers reduced their operations. For example, some homebuilder customers exited or severely curtailed building activity in certain of our markets. There is no assurance that our customers will increase their activity level or return it to historic levels. A slow economic recovery could continue to have material adverse effect on our business, financial condition, results of operations and cash flows.
In addition, consolidation among customers could also result in a loss of some of our present customers to our competitors. The loss of one or more of our significant customers, a significant customer’s decision to purchase our products in significantly lower quantities than they have in the past, or deterioration in our relationship with any of them could have a material adverse effect on our business, financial condition, results of operations and cash flows.
The majority of our net sales are credit sales which are made primarily to customers whose ability to pay is dependent, in part, upon the economic strength of the industry and geographic areas in which they operate, and the failure to collect monies owed from customers could adversely affect our financial condition.
The majority of our net sales volume is facilitated through the extension of credit to our customers whose ability to pay is dependent, in part, upon the economic strength of the industry in the areas where they operate. Our business units offer credit to customers, either through unsecured credit that is based solely upon the creditworthiness of the customer, or secured credit for materials sold for a specific job where the security lies in lien rights associated with the material going into the job. The type of credit offered depends both on the financial strength of the customer and the nature of the business in which the customer is involved. End users, resellers and other non-contractor customers generally purchase more on unsecured credit than secured credit. The inability of our customers to pay off their credit lines in a timely manner, or at all, would adversely affect our business, financial condition, results of operations and cash flows. Furthermore, our collections efforts with respect to non-paying or slow-paying customers could negatively impact our customer relations going forward.
Because we depend on the creditworthiness of certain of our customers, if the financial condition of our customers declines, our credit risk could increase. Significant contraction in our markets, coupled with tightened credit availability and financial institution underwriting standards, could adversely affect certain of our customers. Should one or more of our larger customers declare bankruptcy, it could adversely affect the collectability of our accounts receivable, bad debt reserves and net income.
Our international operations expose us to political, economic and regulatory risks not normally faced by businesses that operate only in the United States.
International operations are exposed to different political, economic and regulatory risks that are not faced by businesses that operate solely in the United States. Some of our operations are outside the United States, with manufacturing and distribution facilities in Canada and several Latin American countries. Our international operations are subject to risks similar to those affecting our operations in the United States in addition to a number of other risks, including:
| • | difficulties in enforcing contractual and intellectual property rights; |
- 22 -
Table of Contents
| • | impositions or increases of withholding and other taxes on remittances and other payments by subsidiaries and affiliates; |
| • | exposure to different legal standards; |
| • | fluctuations in currency exchange rates; |
| • | impositions or increases of investment and other restrictions by foreign governments; |
| • | the requirements of a wide variety of foreign laws; |
| • | political and economic instability; |
| • | terrorist acts; |
| • | war; and |
| • | difficulties in staffing and managing operations, particularly in remote locations. |
As a result of our international operations we could be adversely affected by violations of the U.S. Foreign Corrupt Practices Act and similar foreign anti-corruption laws.
The U.S. Foreign Corrupt Practices Act, or the FCPA, and similar foreign anti-corruption laws generally prohibit companies and their intermediaries from making improper payments or providing anything of value to influence foreign government officials for the purpose of obtaining or retaining business or obtaining an unfair advantage. Recent years have seen a substantial increase in the global enforcement of anti-corruption laws, with more frequent voluntary self-disclosures by companies, aggressive investigations and enforcement proceedings by both the U.S. Department of Justice and the U.S. Securities and Exchange Commission, or SEC, resulting in record fines and penalties, increased enforcement activity by non-U.S. regulators, and increases in criminal and civil proceedings brought against companies and individuals.
We have operations in Canada as well as existing joint ventures in Mexico, Central America and South America. Our internal policies provide for compliance with all applicable anti-corruption laws for both us and for our joint venture operations. Our continued operation and expansion outside the United States, including in developing countries, could increase the risk of such violations in the future. Despite our training and compliance programs, we cannot assure you that our internal control policies and procedures always will protect us from unauthorized reckless or criminal acts committed by our employees, agents or joint venture partners. In the event that we believe or have reason to believe that our employees, agents or joint venture partners have or may have violated applicable anti-corruption laws, including the FCPA, we may be required to investigate or have outside counsel investigate the relevant facts and circumstances, which can be expensive and require significant time and attention from senior management. Violations of these laws may result in severe criminal or civil sanctions, which could disrupt our business and result in a material adverse effect on our reputation, financial condition, results of operations and cash flows.
Conducting a portion of our operations through joint ventures exposes us to risks and uncertainties, many of which are outside of our control.
With respect to our existing joint ventures in Mexico, Central America and South America, any differences in views among the joint venture participants may result in delayed decisions or in failures to agree on major issues. We also cannot control the actions of our joint venture partners, including any nonperformance, default or bankruptcy of our joint venture partners. As a result, we may be unable to control the quality of products produced by the joint ventures or achieve consistency of product quality as compared with our other operations. In addition to net sales and market share, this may have a material negative impact on our brand and how it is perceived thereafter. Moreover, if our partners also fail to invest in the joint venture in the manner that is anticipated or otherwise fail to meet their contractual obligations, the joint ventures may be unable to adequately perform and conduct their respective operations, requiring us to make additional investments or perform
- 23 -
Table of Contents
additional services to ensure the adequate performance and delivery of products and/or services to the joint ventures’ customers, which could have a material adverse effect on our business, financial condition, results of operations and cash flows.
We may not be able to successfully expand into new geographic or product markets.
We may expand into new geographic or product markets based on our existing manufacturing, design and engineering capabilities and services. Our business depends in part on our ability to identify future products and product lines that complement existing products and product lines and that respond to our customers’ needs. We may not be able to compete effectively unless our product selection keeps up with trends in the markets in which we compete or trends in new products. In addition, our ability to integrate new products and product lines into our distribution network could impact our ability to compete. Furthermore, the success of new products and new product lines will depend on market demand and there is a risk that new products and new product lines will not deliver expected results, which could negatively impact our future sales and results of operations.
Our expansion into new markets may present competitive, distribution and regulatory challenges that differ from current ones. We may be less familiar with the target customers and may face different or additional risks, as well as increased or unexpected costs, compared to existing operations. Expansion into new markets may also bring us into direct competition with companies with whom we have little or no past experience as competitors. To the extent we rely upon expansion into new geographic or product markets for growth and do not meet the new challenges posed by such expansion, our future sales growth could be negatively impacted, our operating costs could increase, and our business operations and financial results could be adversely affected.
We may not achieve the acquisition component of our growth strategy.
Acquisitions may continue to be an important component of our growth strategy; however, there can be no assurance that we will be able to continue to grow our business through acquisitions as we have done historically or that any businesses acquired will perform in accordance with expectations or that business judgments concerning the value, strengths and weaknesses of businesses acquired will prove to be correct. Future acquisitions may result in the incurrence of debt and contingent liabilities, an increase in interest expense and amortization expense and significant charges relative to integration costs. Our strategy could be impeded if we do not identify suitable acquisition candidates and our financial condition and results of operations will be adversely affected if we are unable to properly evaluate acquisition targets.
Acquisitions involve a number of special risks, including:
| • | problems implementing disclosure controls and procedures for the newly acquired business; |
| • | unforeseen difficulties extending internal control over financial reporting and performing the required assessment at the newly acquired business; |
| • | potential adverse short-term effects on operating results through increased costs or otherwise; |
| • | diversion of management’s attention and failure to recruit new, and retain existing, key personnel of the acquired business; |
| • | failure to successfully implement infrastructure, logistics and systems integration; |
| • | our business growth could outpace the capability of our systems; and |
| • | the risks inherent in the systems of the acquired business and risks associated with unanticipated events or liabilities, any of which could have a material adverse effect on our business, financial condition and results of operations. |
In addition, we may not be able to obtain financing necessary to complete acquisitions on attractive terms or at all.
- 24 -
Table of Contents
Increased fuel and energy prices, and our inability to obtain sufficient quantities of fuel to operate our in-house delivery fleet, could adversely affect our business, financial condition, results of operations and cash flows.
Energy and petroleum prices have fluctuated significantly in recent years. Prices and availability of petroleum products are subject to political, economic and market factors that are outside our control. Political events in petroleum-producing regions as well as hurricanes and other weather-related events may cause the price of fuel to increase.
We consume a large amount of energy and petroleum products in our operations, including the manufacturing process and delivering a significant volume of products to our customers by our in-house fleet. While we have implemented a diesel hedging program covering approximately 50% of our in-house fleet to mitigate against higher fuel prices, our operating profit will be adversely affected if we are unable to obtain the energy and fuel we require or to fully offset the anticipated impact of higher energy and fuel prices through increased prices or surcharges to our customers or through other hedging strategies. If shortages occur in the supply of energy or necessary petroleum products and we are not able to pass along the full impact of increased energy or petroleum prices to our customers, our business, financial condition, results of operations and cash flows would be adversely affected.
We have substantial fixed costs and, as a result, our income from operations is sensitive to changes in our net sales.
A significant portion of our expenses are fixed costs (including personnel), which do not fluctuate with net sales. Consequently, a percentage decline in our net sales could have a greater percentage effect on our income from operations if we do not act to reduce personnel or take other cost reduction actions. Any decline in our net sales would cause our profitability to be adversely affected. Moreover, a key element of our strategy is managing our assets, including our substantial fixed assets, more effectively, including through sales or other disposals of excess assets. Our failure to rationalize our fixed assets in the time, and within the costs, we expect could have a material adverse effect on our business, financial condition, results of operations and cash flows.
Our business is subject to risks associated with manufacturing processes.
We internally manufacture our own products at our facilities. While we maintain insurance covering our manufacturing and production facilities and have significant flexibility to manufacture and ship our own products from various facilities, a catastrophic loss of the use of certain of our facilities due to accident, fire, explosion, labor issues, weather conditions, other natural disaster or otherwise, whether short or long-term, could have a material adverse effect on our business, financial condition, results of operations and cash flows.
Unexpected failures of our equipment and machinery may result in production delays, revenue loss and significant repair costs, injuries to our employees, and customer claims. Any interruption in production capability may limit our ability to supply enough products to customers and may require us to make large capital expenditures to remedy the situation, which could have a negative impact on our profitability and cash flows. Our business interruption insurance may not be sufficient to offset the lost revenues or increased costs that we may experience during a disruption of our operations.
We provide product warranties that could expose us to claims, which could in turn damage our reputation and adversely affect our business, financial condition, results of operations and cash flows.
We generally provide limited product warranties on our products against defects in materials and workmanship in normal use and service. Most of our pipe products have a warranty that is not limited in duration. The warranty period for other products such as our StormTech chambers, our Inserta Tee product line, our BaySaver product line and our FleXstorm inlet protection systems is generally one year. Estimating the required warranty reserves requires a high level of judgment. Management estimates warranty reserves, based in
- 25 -
Table of Contents
part upon historical warranty costs, as a proportion of sales by product line. Management also considers various relevant factors, including its stated warranty policies and procedures, as part of its evaluation of its liability. Because warranty issues may surface later in the product life cycle, management continues to review these estimates on a regular basis and considers adjustments to these estimates based on actual experience compared to historical estimates. Although management believes that our warranty reserves at December 31, 2013 are adequate, actual results may vary from these estimates.
The nature of our business exposes us to construction defect and product liability claims as well as other legal proceedings.
We are exposed to construction defect and product liability claims relating to our various products if our products do not meet customer expectations. Such liabilities may arise out of the quality of raw materials we purchase from third-party suppliers, over which we do not have direct control. We also operate a large fleet of trucks and other vehicles and therefore face the risk of traffic accidents.
While we currently maintain insurance coverage to address a portion of these types of liabilities, we cannot make assurances that we will be able to obtain such insurance on acceptable terms in the future, if at all, or that any such insurance will provide adequate coverage against potential claims. Further, while we intend to seek indemnification against potential liability for products liability claims from relevant parties, we cannot guarantee that we will be able to recover under any such indemnification agreements. Product liability claims can be expensive to defend and can divert the attention of management and other personnel for significant time periods, regardless of the ultimate outcome. An unsuccessful product liability defense could be highly costly and accordingly result in a decline in revenues and profitability. In addition, even if we are successful in defending any claim relating to the products we distribute, claims of this nature could negatively impact customer confidence in us and our products.
From time to time, we are also involved in government inquiries and investigations, as well as consumer, employment, tort proceedings and other litigation. We cannot predict with certainty the outcomes of these legal proceedings and other contingencies, including potential environmental remediation and other proceedings commenced by government authorities. The outcome of some of these legal proceedings and other contingencies could require us to take actions which would adversely affect our operations or could require us to pay substantial amounts of money. Additionally, defending against these lawsuits and proceedings may involve significant expense and diversion of management’s attention and resources from other matters.
Because our business is working capital intensive, we rely on our ability to manage our supply purchasing and customer credit policies.
Our operations are working capital intensive, and our inventories, accounts receivable and accounts payable are significant components of our net asset base. We manage our inventories and accounts payable through our purchasing policies and our accounts receivable through our customer credit policies. If we fail to adequately manage our supply purchasing or customer credit policies, our working capital and financial condition may be adversely affected.
Our operations are affected by various laws and regulations in the markets in which we operate, and our failure to obtain or maintain approvals by municipalities, state departments of transportation, engineers and developers may affect our results of operations.
Our operations are principally affected by various statutes, regulations and laws in the United States, Canada and Latin America. While we are not engaged in a regulated industry, we are subject to various laws applicable to businesses generally, including laws affecting land usage, zoning, the environment, health and safety, transportation, labor and employment practices (including pensions), competition, immigration and other matters. Additionally, approvals by municipalities, state departments of transportation, engineers and developers may affect the products our customers are allowed to use, and, consequently, failure to obtain or maintain such
- 26 -
Table of Contents
approvals may affect the saleability of our products. Building codes may also affect the products our customers are allowed to use, and, consequently, changes in building codes may also affect the saleability of our products. Changes in applicable regulations governing the sale of some of our products could increase our costs of doing business. In addition, changes to applicable tax laws and regulations could increase our costs of doing business. We cannot provide assurance that we will not incur material costs or liabilities in connection with regulatory requirements.
We deliver products to many of our customers through our own fleet of vehicles. The U.S. Department of Transportation, or DOT, regulates our operations in domestic interstate commerce. We are subject to safety requirements governing interstate operations prescribed by the DOT. Vehicle dimensions and driver hours of service also remain subject to both federal and state regulation. More restrictive limitations on vehicle weight and size, trailer length and configuration, or driver hours of service could increase our costs, which, if we are unable to pass these cost increases on to our customers, would reduce our gross margins and net income (loss) and increase our selling, general and administrative expenses.
We cannot predict whether future developments in law and regulations concerning our business units will affect our business, financial condition and results of operations in a negative manner. Similarly, we cannot assess whether our business units will be successful in meeting future demands of regulatory agencies in a manner which will not materially adversely affect our business, financial condition, results of operations and cash flows.
Interruptions in the proper functioning of IT systems could disrupt operations and cause unanticipated increases in costs or decreases in revenues, or both.
Because we use our information systems to, among other things, manage inventories and accounts receivable, make purchasing decisions and monitor our results of operations, the proper functioning of our IT systems is important to the successful operation of our business. Although our IT systems are protected through physical and software safeguards and remote processing capabilities exist, IT systems are still vulnerable to natural disasters, power losses, unauthorized access, telecommunication failures and other problems. If critical IT systems fail, or are otherwise unavailable, our ability to process orders, track credit risk, identify business opportunities, maintain proper levels of inventories, collect accounts receivable and pay expenses and otherwise manage our business units would be adversely affected.
Management uses information systems to support decision making and to monitor business performance. We may fail to generate accurate financial and operational reports essential for making decisions at various levels of management. Failure to adopt systematic procedures to maintain quality IT general controls could disrupt our business. In addition, if we do not maintain adequate controls such as reconciliations, segregation of duties and verification to prevent errors or incomplete information, our ability to operate our business could be limited.
Third-party service providers are responsible for managing a significant portion of our IT systems. Our business and results of operations may be adversely affected if the third-party service provider does not perform satisfactorily. Additionally, there is no guarantee that we will continue to have access to these third-party IT systems after our current license agreements expire, and, if we do not obtain licenses to use effective replacement IT systems, our financial condition and operating results could be adversely affected.
The implementation of our technology initiatives could disrupt our operations in the near term, and our technology initiatives might not provide the anticipated benefits or might fail.
We have made, and will continue to make, significant technology investments in each of our business units and in our administrative functions. Our technology initiatives are designed to streamline our operations to allow our associates to continue to provide high quality service to our customers and to provide our customers a better experience, while improving the quality of our internal control environment. The cost and potential problems and interruptions associated with the implementation of our technology initiatives could disrupt or reduce the
- 27 -
Table of Contents
efficiency of our operations in the near term. In addition, our new or upgraded technology might not provide the anticipated benefits, it might take longer than expected to realize the anticipated benefits or the technology might fail altogether.
We may experience a failure in or breach of our operational or information security systems, or those of our third-party service providers, as a result of cyber-attacks or information security breaches.
Information security risks have generally increased in recent years because of the proliferation of new technologies and the increased sophistication and activities of perpetrators of cyber-attacks. A failure in or breach of our operational or information security systems, or those of our third-party service providers, as a result of cyber-attacks or information security breaches could disrupt our business, result in the disclosure or misuse of confidential or proprietary information, damage our reputation, increase our costs and/or cause losses. As a result, cyber security and the continued development and enhancement of the controls and processes designed to protect our systems, computers, software, data and networks from attack, damage or unauthorized access remain a priority for us. As cyber threats continue to evolve, we may be required to expend additional significant resources to continue to enhance our information security measures and/or to investigate and remediate any information security vulnerabilities.
If we become subject to material liabilities under our self-insured programs, our financial results may be adversely affected.
We provide workers’ compensation, automobile and product/general liability coverage through a high deductible insurance program. In addition, we provide medical coverage to some of our employees through a self-insured preferred provider organization. Though we believe that we have adequate insurance coverage in excess of self-insured retention levels, our business, financial condition, results of operations and cash flows may be adversely affected if the number and severity of insurance claims increases.
We may see increased costs arising from health care reform.
In March 2010, the United States government enacted comprehensive health care reform legislation which, among other things, includes guaranteed coverage requirements, eliminates pre-existing condition exclusions and annual and lifetime maximum limits, restricts the extent to which policies can be rescinded and imposes new and significant taxes on health insurers and health care benefits. The legislation imposes implementation effective dates which began in 2010 and extend through 2020, and many of the changes require additional guidance from government agencies or federal regulations. Therefore, due to the phased-in nature of the implementation and the lack of interpretive guidance, it is difficult to determine at this time what impact the health care reform legislation will have on our financial results. Possible adverse effects of the health reform legislation include increased costs, exposure to expanded liability and requirements for us to revise ways in which we provide healthcare and other benefits to our employees. As a result, our business, financial condition, results of operations and cash flows could be materially adversely affected.
Our success depends upon our ability to control labor costs and to attract, train and retain highly-qualified employees and key personnel.
To be successful, we must attract, train and retain a large number of highly qualified employees while controlling related labor costs. Our ability to control labor costs is subject to numerous external factors, including prevailing wage rates and health and other insurance costs. We compete with other businesses for these employees and invest significant resources in training and motivating them. There is no assurance that we will be able to attract or retain highly-qualified employees in the future, including, in particular, those employed by companies we acquire. None of our domestic employees are currently covered by collective bargaining or other similar labor agreements. However, if a number of our employees were to unionize, including in the wake of any future legislation that makes it easier for employees to unionize, the effect on us may be negative. Any inability by us to negotiate acceptable new contracts under any collective bargaining arrangements could cause strikes or other
- 28 -
Table of Contents
work stoppages, and new contracts could result in increased operating costs. If any such strikes or other work stoppages occur, or if employees become represented by a union, we could experience a disruption of our operations and higher labor costs. Labor relations matters affecting our suppliers of products and services could also adversely affect our business from time to time.
In addition, our business results of operations depend largely upon our chief executive officer and senior management team as well as our plant managers and sales personnel, including those of companies recently acquired, and their experience, knowledge of local market dynamics and specifications and long-standing customer relationships. We customarily sign executive responsibility agreements with certain key personnel who are granted restricted stock or stock options under our employee incentive compensation programs, which contain confidentiality and non-competition provisions. However, in certain jurisdictions, non-competition provisions may not be enforceable or may not be enforceable to their full extent. Our inability to retain or hire qualified plant managers or sales personnel at economically reasonable compensation levels would restrict our ability to grow our business, limit our ability to continue to successfully operate our business and result in lower operating results and profitability.
If we are unable to protect our intellectual property rights, or we infringe on the intellectual property rights of others, our ability to compete could be negatively impacted.
Our ability to compete effectively depends, in part, upon our ability to protect and preserve proprietary aspects of our intellectual property, which we attempt to do, both in the United States and in foreign countries, through a combination of patent, trademark, copyright and trade secret laws, as well as licensing agreements and third-party nondisclosure and assignment agreements. Because of the differences in foreign trademark, patent and other laws concerning proprietary rights, our intellectual property rights may not receive the same degree of protection in foreign countries as they would in the United States. Our failure to obtain or maintain adequate protection of our intellectual property rights for any reason could have a material adverse effect on our business, results of operations and financial condition.
We have applied for patent protection relating to certain existing and proposed products, processes and services. While we generally apply for patents in those countries where we primarily intend to make, have made, use, or sell patented products, we may not accurately predict all of the countries where patent protection will ultimately be desirable. If we fail to timely file a patent application in any such country, we may be precluded from doing so at a later date. Furthermore, we cannot assure you that any of our patent applications will be approved. We also cannot assure you that the patents issuing as a result of our foreign patent applications will have the same scope of coverage as our United States patents. The patents we own could be challenged, invalidated or circumvented by others and may not be of sufficient scope or strength to provide us with any meaningful protection or commercial advantage. Further, we cannot assure you that competitors will not infringe our patents, or that we will have adequate resources to enforce our patents.
We also rely on unpatented proprietary technology. It is possible that others will independently develop the same or similar technology or otherwise obtain access to our unpatented technology. To protect our trade secrets and other proprietary information, we generally require applicable employees, consultants, advisors and collaborators to enter into confidentiality agreements. We cannot assure you that these agreements will provide meaningful protection for our trade secrets, know-how or other proprietary information in the event of any unauthorized use, misappropriation or disclosure of such trade secrets, know-how or other proprietary information. If we are unable to maintain the proprietary nature of our technologies, we could be materially adversely affected.
We rely on our trademarks, trade names and brand names to distinguish our products from the products of our competitors, and have registered or applied to register many of these trademarks. We cannot assure you that our trademark applications will be approved. Third parties may also oppose our trademark applications or otherwise challenge our use of the trademarks. In the event that our trademarks are successfully challenged, we could be forced to rebrand our products, which could result in loss of brand recognition, and could require us to
- 29 -
Table of Contents
devote resources to advertising and marketing new brands. Further, we cannot assure you that competitors will not infringe our trademarks or that we will have adequate resources to enforce our trademarks. We also license third parties to use certain of our trademarks. In an effort to preserve our trademark rights, we enter into license agreements with these third parties which govern the use of our trademarks and which require our licensees to abide by quality control standards with respect to the goods and services that they provide under our trademarks. Although we make efforts to police the use of our trademarks by our licensees, we cannot assure you that these efforts will be sufficient to ensure that our licensees abide by the terms of their licenses. In the event that our licensees fail to do so, our trademark rights could be diluted.
Although we rely on copyright laws to protect the works of authorship (including software) created by us, we generally do not register the copyrights in any of our copyrightable works. Copyrights of United States origin must be registered before the copyright owner may bring an infringement suit in the United States. Furthermore, if a copyright of United States origin is not registered within three months of publication of the underlying work, the copyright owner is precluded from seeking statutory damages or attorneys’ fees in any United States enforcement action, and is limited to seeking actual damages and lost profits. Accordingly, if one of our unregistered copyrights of United States origin is infringed by a third party, we will need to register the copyright before we can file an infringement suit in the United States, and our remedies in any such infringement suit may be limited.
The misuse of our intellectual property rights by others could adversely impact our ability to compete, cause our net sales to decrease or otherwise harm our business. If it became necessary for us to resort to litigation to protect our intellectual property rights, any proceedings could be burdensome and costly, and we may not prevail.
Also, we cannot be certain that the products that we sell do not and will not infringe issued patents or other intellectual property rights of others. Further, we are subject to legal proceedings and claims in the ordinary course of our business, including claims of alleged infringement of the patents, trademarks and other intellectual property rights of third parties by us or our customers, whom we generally indemnify in connection with their use of the products that we manufacture. These claims could divert management’s attention and resources and may require us to initiate or defend protracted and costly litigation on behalf of ourselves or our customers, regardless of the merits of the claims. Should we be found liable for infringement, we may be required to enter into licensing agreements (if available on acceptable terms or at all) or pay damages and cease making or selling certain products. Moreover, we may need to redesign or sell different products to avoid future infringement liability. Any of the foregoing could cause us to incur significant costs, prevent us from selling our products or negatively impact our ability to compete.
Income tax payments may ultimately differ from amounts currently recorded by us. Future tax law changes may materially increase our prospective income tax expense.
We are subject to income taxation in many jurisdictions in the United States as well as foreign jurisdictions. Judgment is required in determining our worldwide income tax provision and, accordingly, there are many transactions and computations for which our final income tax determination is uncertain. We are routinely audited by income tax authorities in many tax jurisdictions. Although we believe the recorded tax estimates are reasonable, the ultimate outcome from any audit (or related litigation) could be materially different from amounts reflected in our income tax provisions and accruals. Future settlements of income tax audits may have a material effect on earnings between the period of initial recognition of tax estimates in the financial statements and the point of ultimate tax audit settlement. Additionally, it is possible that future income tax legislation in any jurisdiction to which we are subject may be enacted that could have a material impact on our worldwide income tax provision beginning with the period that such legislation becomes effective.
We could incur significant costs in complying with environmental, health and safety laws or permits or as a result of satisfying any liability or obligation imposed under such laws or permits.
Our operations are subject to various federal, state, local and foreign environmental, health and safety laws and regulations. Among other things, these laws regulate the emission or discharge of materials into the
- 30 -
Table of Contents
environment, govern the use, storage, treatment, disposal and management of hazardous substances and wastes, protect the health and safety of our employees and the end users of our products, regulate the materials used in and the recycling of products and impose liability for the costs of investigating and remediating, and damages resulting from, present and past releases of hazardous substances. Violations of these laws and regulations, failure to obtain or maintain required environmental permits or non-compliance with any conditions contained in any environmental permit can result in substantial fines or penalties, injunctive relief, requirements to install pollution or other controls or equipment, civil and criminal sanctions, permit revocations and/or facility shutdowns. We could be held liable for the costs to address contamination of any real property we have ever owned, leased, operated or used, including as a disposal site. We could also incur fines, penalties, sanctions or be subject to third-party claims for property damage, personal injury or nuisance or otherwise as a result of violations of or liabilities under environmental laws in connection with releases of hazardous or other materials.
In addition, changes in, or new interpretations of, existing laws, regulations or enforcement policies, the discovery of previously unknown contamination, or the imposition of other environmental liabilities or obligations in the future, including additional investigation or other obligations with respect to any potential health hazards of our products or business activities or the imposition of new permit requirements, may lead to additional compliance or other costs that could have material adverse effect on our business, financial condition, results of operations and cash flows.
Our failure to maintain effective disclosure controls and internal control over financial reporting could adversely affect our business, financial position and results of operations.
Upon completion of this offering, we will be required to evaluate the effectiveness of our disclosure controls and internal control over financial reporting on a periodic basis and publicly disclose the results of these evaluations and related matters, in accordance with the requirements of Section 404 of the Sarbanes-Oxley Act of 2002. These reporting and other obligations place significant additional demands on our management and administrative and operational resources, including our accounting resources, which could adversely affect our operations among other things. To comply with these requirements, we have upgraded, and are continuing to upgrade our systems, including information technology, implemented additional financial and management controls, reporting systems and procedures. We cannot be certain that we will be successful in maintaining adequate control over our financial reporting and financial processes. Furthermore, as we grow our business, our disclosure controls and internal controls will become more complex, and we may require significantly more resources to ensure that these controls remain effective. If we are unable to continue upgrading our financial and management controls, reporting systems, information technology and procedures in a timely and effective fashion, additional management and other resources may need to be devoted to assist in compliance with the disclosure and financial reporting requirements and other rules that apply to reporting companies, which could adversely affect our business, financial position and results of operations.
We have not been required to have and have not had our independent registered public accounting firm perform an evaluation of our internal control over financial reporting as of the end of our last fiscal year in accordance with the provisions of the Sarbanes-Oxley Act of 2002. Had our independent registered public accounting firm performed an evaluation of our internal control over financial reporting in accordance with the provisions of the Sarbanes-Oxley Act of 2002, additional control deficiencies may have been identified by our independent registered public accounting firm and those control deficiencies could have also represented one or more material weaknesses.
Future changes in financial accounting standards may significantly change our reported results of operations.
In an exposure draft issued in August 2010 and revised in May 2013, the Financial Accounting Standards Board, or FASB, together with the International Accounting Standards Board, proposed a comprehensive set of changes in accounting for leases. The lease accounting model contemplated by these changes is a “right of use” model that assumes that each lease creates an asset (the lessee’s right to use the leased asset) and a liability (the
- 31 -
Table of Contents
future rent payment obligations) which should be reflected on a lessee’s balance sheet to fairly represent the lease transaction and the lessee’s related financial obligations. We conduct some of our operations under leases that are accounted for as operating leases, with no related assets and liabilities on our balance sheet. The proposed changes would require that substantially all of our operating leases be recognized as assets and liabilities on our balance sheet. The effective date has not been determined. Comments on the revised exposure draft were due by September 13, 2013. Changes in lease accounting rules or their interpretation, or changes in underlying assumptions, estimates or judgments by us could significantly change our reported or expected financial performance.
A change in our product mix could adversely affect our results of operations.
Our results may be affected by a change in our product mix on which our gross margin depends. Our Allied Products typically provide higher gross margin than our pipe products. Changes in our product mix may result from marketing activities to existing customers and needs communicated to us from existing and prospective customers. Our outlook, budgeting and strategic planning assume a certain product mix of sales. If actual results vary from this projected product mix of sales, our financial results could be negatively impacted.
We may be affected by global climate change or by legal, regulatory or market responses to such potential change.
Concern over climate change, including the impact of global warming, has led to significant federal, state, and international legislative and regulatory efforts to limit greenhouse gas, or GHG, emissions. For example, in the past several years, the U.S. Congress has considered various bills that would regulate GHG emissions. While these bills have not yet received sufficient Congressional support for enactment, some form of federal climate change legislation is possible in the future. Even in the absence of such legislation, the EPA, spurred by judicial interpretation of the Clean Air Act, has begun regulating GHG emissions following its issuance of the “Tailoring Rule” that determines which stationary sources require permits for greenhouse emissions. EPA has issued rules that require monitoring and reporting of annual GHG emissions, as well as performance standards for CO2 emissions from new fossil-fuel electric utility generating units. Thus far, EPA has addressed vehicle and mobile source emissions by implementing Renewable Fuel Standard regulations and by working with manufacturers to improve fuel efficiency in new vehicles. However, EPA has been directed by President Obama to develop and issue new fuel efficiency standards for medium- and heavy-duty vehicles by March 2016, especially diesel engine emissions, and this could impose substantial costs on us. These costs include an increase in the cost of the fuel and other energy we purchase and capital costs associated with updating or replacing our internal fleet of trucks and other vehicles in order to comply with application regulations. In addition, new laws or future regulation could directly and indirectly affect our customers and suppliers (through an increase in the cost of production or their ability to produce satisfactory products) and our business (through the impact on our inventory availability, cost of sales, operations or demands for the products we sell). Until the timing, scope and extent of any future regulation becomes known, we cannot predict its effect on our cost structure or our operating results. Notwithstanding our dedication to being a responsible corporate citizen, it is reasonably possible that such legislation or regulation could impose material costs on us.
Anti-terrorism measures and other disruptions to the raw material supply network could impact our operations.
Our ability to provide efficient distribution of products to our customers is an integral component of our overall business strategy. In the aftermath of terrorist attacks in the United States, federal, state and local authorities have implemented and continue to implement various security measures that affect the raw material supply network in the United States and abroad. If security measures disrupt or impede the receipt of sufficient raw materials, we may fail to meet the needs of our customers or may incur increased expenses to do so.
- 32 -
Table of Contents
Risks Relating to Our Indebtedness
We have substantial debt and may incur substantial additional debt, which could adversely affect our financial health, reduce our profitability, limit our ability to obtain financing in the future and pursue certain business opportunities and reduce the value of your investment.
As of December 31, 2013, we had an aggregate principal amount of $306.3 million of outstanding debt. In the nine months ended December 31, 2013, we incurred $11.9 million of interest expense.
The amount of our debt or such other obligations could have important consequences for holders of our common stock, including, but not limited to:
| • | a substantial portion of our cash flow from operations must be dedicated to the payment of principal and interest on our indebtedness, thereby reducing the funds available to us for other purposes; |
| • | our ability to obtain additional financing for working capital, capital expenditures, acquisitions, debt service requirements or general corporate purposes and other purposes may be impaired in the future; |
| • | we are exposed to the risk of increased interest rates because a portion of our borrowings is at variable rates of interest; |
| • | we may be at a competitive disadvantage compared to our competitors with less debt or with comparable debt at more favorable interest rates and that, as a result, may be better positioned to withstand economic downturns; |
| • | our ability to refinance indebtedness may be limited or the associated costs may increase; |
| • | our ability to engage in acquisitions without raising additional equity or obtaining additional debt financing may be impaired in the future; |
| • | it may be more difficult for us to satisfy our obligations to our creditors, resulting in possible defaults on and acceleration of such indebtedness; |
| • | we may be more vulnerable to general adverse economic and industry conditions; and |
| • | our flexibility to adjust to changing market conditions and our ability to withstand competitive pressures could be limited, or we may be prevented from making capital investments that are necessary or important to our operations in general, growth strategy and efforts to improve operating margins of our business units. |
If our cash flow and capital resources are insufficient to fund our debt service obligations, we may be forced to reduce or delay capital expenditures, sell assets, seek to obtain additional equity capital or refinance our debt. We cannot make assurances that we will be able to refinance our debt on terms acceptable to us, or at all. In the future, our cash flow and capital resources may not be sufficient for payments of interest on and principal of our debt, and such alternative measures may not be successful and may not permit us to meet our scheduled debt service obligations.
We cannot make assurances that we will be able to refinance any of our indebtedness, or obtain additional financing, particularly because of our high levels of debt and the debt incurrence restrictions imposed by the agreements governing our debt, as well as prevailing market conditions. We could face substantial liquidity problems and might be required to dispose of material assets or operations to meet our debt service and other obligations. Subject to certain exceptions, our Senior Loan Facilities and our Senior Notes, which we have defined in “Description of Certain Indebtedness,” restrict our ability to dispose of assets and how we use the proceeds from any such dispositions. We cannot make assurances that we will be able to consummate those dispositions, or if we do, what the timing of the dispositions will be or whether the proceeds that we realize will be adequate to meet our debt service obligations, when due.
- 33 -
Table of Contents
Despite our current level of indebtedness, we may still be able to incur substantially more debt. This could further exacerbate the risks to our financial condition described above.
We may be able to incur significant additional indebtedness in the future. Although the agreements governing our indebtedness contain restrictions on the incurrence of additional indebtedness, these restrictions are subject to a number of qualifications and exceptions, and the additional indebtedness incurred in compliance with these restrictions could be substantial. These restrictions also will not prevent us from incurring obligations that do not constitute indebtedness, including obligations under lease arrangements that are currently recorded as operating leases even if operating leases were to be treated as debt under GAAP. In addition, our Revolving Credit Facility provides an aggregate commitment of up to $325.0 million. As of December 31, 2013, we had an additional $218 million of availability under the Revolving Credit Facility plus $12 million in indebtedness outstanding under a separate revolving credit facility with our subsidiary, ADS Mexicana, S.A. de C.V. If new debt is added to our current debt levels, the related risks that we now face could intensify. See “Description of Certain Indebtedness.”
The agreements and instruments governing our debt contain restrictions and limitations that could significantly impact our ability to operate our business and adversely affect the holders of our common stock.
The covenants contained in our Senior Loan Facilities and our Senior Notes, which we refer to collectively as our Credit Facilities, are consistent. These covenants, among other things, restrict or limit our ability to:
| • | dispose of assets; |
| • | incur additional indebtedness (including guarantees of additional indebtedness); |
| • | prepay or amend our various debt instruments; |
| • | pay dividends and make certain payments; |
| • | redeem stock or make other distributions; |
| • | create liens on assets; |
| • | make certain investments; |
| • | engage in certain asset sales, mergers, acquisitions, consolidations or sales of all, or substantially all, of our assets; and |
| • | engage in certain transactions with affiliates. |
Our ability to comply with the covenants and restrictions contained in the Credit Facilities may be affected by economic, financial and industry conditions beyond our control. The breach of any of these covenants or restrictions could result in a default under the Credit Facilities that would permit the applicable lenders or noteholders, as the case may be, to declare all amounts outstanding thereunder to be due and payable, together with accrued and unpaid interest. If we are unable to repay indebtedness, secured parties having secured obligations, such as the lenders under the Credit Facilities, could proceed against the collateral securing the secured obligations. This could have serious consequences to our financial condition and results of operations and could cause us to become bankrupt or insolvent.
We may have future capital needs and may not be able to obtain additional financing on acceptable terms.
Although we believe that our current cash position and the additional committed funding available under our Credit Facilities is sufficient for our current operations, any reductions in our available borrowing capacity, or our inability to renew or replace our debt facilities, when required or when business conditions warrant, could have a material adverse effect on our business, financial condition and results of operations. The economic conditions, credit market conditions, and economic climate affecting our industry, as well as other factors, may constrain our financing abilities. Our ability to secure additional financing, if available, and to satisfy our financial obligations under indebtedness outstanding from time to time will depend upon our future operating performance, the availability of credit generally, economic conditions and financial, business and other factors,
- 34 -
Table of Contents
many of which are beyond our control. The market conditions and the macroeconomic conditions that affect our industry could have a material adverse effect on our ability to secure financing on favorable terms, if at all.
If financing is not available when needed, or is available on unfavorable terms, we may be unable to take advantage of business opportunities or respond to competitive pressures, any of which could have a material adverse effect on our business, financial condition and results of operations. If we raise additional funds through further issuances of equity, convertible debt securities or other securities convertible into equity, our existing stockholders could suffer significant dilution in their percentage ownership, and any new securities we issue could have rights, preferences and privileges senior to those of holders of our common stock.
Increases in interest rates would increase the cost of servicing our debt and could reduce our profitability.
A significant portion of our outstanding debt, including the debt under our Senior Loan Facilities, bears interest at variable rates. As a result, increases in interest rates would increase the cost of servicing our debt and could materially reduce our profitability and cash flows. Each 1.0% increase in interest rates on our variable-rate debt would increase our annual forecasted interest expense by approximately $0.8 million based on balances as of December 31, 2013. Assuming all revolving loans were fully drawn, each 1.0% increase in interest rates would result in a $2.8 million increase in annual cash interest expense on our Credit Facilities.
With respect to the indebtedness outstanding under our Credit Facilities that bear interest at variable rates, such variable rates are determined based upon specified pricing terms. As a result, if our leverage ratios increase, then such variable rates could also increase. See “Description of Certain Indebtedness.”
We may not be able to satisfy our outstanding obligations upon a change of control.
Under the Senior Loan Facility, a change of control (as defined therein) constitutes an event of default that permits the lenders to accelerate the maturity of borrowings under the agreement and terminate their commitments to lend. Additionally, under the Senior Notes, a change of control (as defined therein) constitutes an event of default that permits the noteholders to declare all of their notes to be immediately due and payable. In order to avoid events of default under each of our Credit Facilities, we may therefore have to avoid certain change of control transactions that would otherwise be beneficial to us.
Risks Relating to Our Common Stock and This Offering
Our ability to make future dividend payments, if any, may be restricted.
We have a history of paying dividends to our stockholders when sufficient cash is available, and we currently intend to pay dividends in the future after this offering. Any determination to pay dividends on our capital stock in the future will be at the discretion of our board of directors, subject to applicable laws and the provisions of our amended and restated certificate of incorporation (including those relating to the payment of dividends on our convertible preferred stock), and will depend on our financial condition, results of operations, capital requirements, general business conditions and other factors that our board of directors considers relevant. For more information on our convertible preferred stock, see “Description of Capital Stock — Preferred Stock.” In addition, the terms of our Credit Facilities contain restrictions on our ability to pay dividends. Also, Delaware law may impose requirements that may restrict our ability to pay dividends to holders of our common stock. See “Dividend Policy.”
Our common stock has no prior public market and the market price of our common stock may be volatile and could decline after this offering.
Prior to this offering, there has not been a public market for our common stock, and an active market for our common stock may not develop or be sustained after this offering. We will negotiate the initial public offering price per share with the representatives of the underwriters and therefore, that price may not be indicative of the market price of our common stock after this offering. We cannot assure you that an active public market for our
- 35 -
Table of Contents
common stock will develop after this offering or, if it does develop, will be sustained. In the absence of a public trading market, you may not be able to liquidate your investment in our common stock. In addition, the market price of our common stock may fluctuate significantly. Among the factors that could affect our stock price are:
| • | industry or general market conditions; |
| • | domestic and international economic factors unrelated to our performance; |
| • | changes in our customers’ preferences; |
| • | new regulatory pronouncements and changes in regulatory guidelines; |
| • | actual or anticipated fluctuations in our quarterly operating results; |
| • | changes in securities analysts’ estimates of our financial performance or lack of research and reports by industry analysts; |
| • | action by institutional stockholders or other large stockholders (including ASP ADS Investco, LLC), including future sales; |
| • | speculation in the press or investment community; |
| • | investor perception of us and our industry; |
| • | changes in market valuations or earnings of similar companies; |
| • | announcements by us or our competitors of significant products, contracts, acquisitions or strategic partnerships; |
| • | developments or disputes concerning patents or proprietary rights, including increases or decreases in litigation expenses associated with intellectual property lawsuits we may initiate, or in which we may be named as defendants; |
| • | failure to complete significant sales; |
| • | any future sales of our common stock or other securities; and |
| • | additions or departures of key personnel. |
In particular, we cannot assure you that you will be able to resell your shares at or above the initial public offering price. The stock markets have experienced extreme volatility in recent years that has been unrelated to the operating performance of particular companies. These broad market fluctuations may adversely affect the trading price of our common stock. In the past, following periods of volatility in the market price of a company’s securities, class action litigation has often been instituted against such company. Any litigation of this type brought against us could result in substantial costs and a diversion of our management’s attention and resources, which would harm our business, operating results and financial condition.
Future sales of shares by existing stockholders, including our ESOP, could cause our stock price to decline.
Sales of substantial amounts of our common stock in the public market following this offering, or the perception that these sales could occur, could cause the market price of our common stock to decline. Based on shares outstanding as of December 31, 2013, upon completion of this offering, we will have outstanding shares of common stock (or outstanding shares of common stock, assuming exercise in full by the underwriters of their option to purchase additional shares). All of the shares sold pursuant to this offering will be immediately tradeable without restriction under the Securities Act of 1933, as amended, unless held by “affiliates,” as that term is defined in Rule 144 under the Securities Act. The remaining shares of common stock outstanding upon completion of this offering will be restricted securities within the meaning of Rule 144 under the Securities Act. Restricted securities may be sold in the public market only if their offer and sale is registered under the Securities Act or if the offer and sale of those securities qualify for an exemption from registration, including exemptions provided by Rules 144 and 701 under the Securities Act, subject to the terms of the lock-up agreements entered into among us, Barclays Capital Inc. and Deutsche Bank Securities Inc., as the representatives of the underwriters, and stockholders holding more than % of our common stock prior to this offering. Upon completion
- 36 -
Table of Contents
of this offering, we intend to file one or more registration statements under the Securities Act to register the shares of common stock to be issued under our equity compensation plans and, as a result, all shares of common stock acquired upon exercise of stock options granted under our plans will also be freely tradable under the Securities Act, subject to the terms of the lock-up agreements, unless purchased by our affiliates. As of December 31, 2013, there were stock options outstanding to purchase a total of approximately shares of our common stock. In addition, shares of common stock are reserved for future issuance under our 2013 Stock Option Plan.
We, stockholders holding more than % of our common stock prior to this offering and our executive officers and directors have agreed to a “lock-up,” meaning that, subject to certain exceptions, neither we nor they will sell any shares of our common stock without the prior consent of Barclays Capital Inc. and Deutsche Bank Securities Inc., as the representatives of the underwriters, for 180 days after the date of this prospectus. Following the expiration of this 180-day lock-up period, approximately million shares of our common stock will be eligible for future sale, subject to the applicable volume, manner of sale, holding period and other limitations of Rule 144. See “Shares of Common Stock Eligible for Future Sale” for a discussion of the shares of common stock that may be sold into the public market in the future. In addition, certain of our significant stockholders may distribute shares that they hold to their investors who themselves may then sell into the public market following the expiration of the lock-up period. Such sales may not be subject to the volume, manner of sale, holding period and other limitations of Rule 144. As resale restrictions end, the market price of our common stock could decline if the holders of those shares sell them or are perceived by the market as intending to sell them. Barclays Capital Inc. and Deutsche Bank Securities Inc., as the representatives of the underwriters, may, in their sole discretion and at any time, release all or any portion of the securities subject to lock-up agreements entered into in connection with this offering. See “Underwriting.”
All of the shares of our convertible preferred stock held by our ESOP may be converted into our common stock at any time by action of the ESOP trustee, and will be automatically converted into our common stock upon distributions of such shares allocated to the ESOP accounts of ESOP participants upon a distribution event such as retirement and other termination of employment. Such distributed common stock will not be subject to any lock-up agreement and will be eligible for future sale, subject to the applicable volume, manner of sale, holding period and other limitations of Rule 144. As of December 31, 2013, there were approximately 5,562,020 shares of convertible preferred stock held by our ESOP, which in aggregate could be converted into approximately 4,278,305 shares of our common stock. All of these shares will be eligible for future sale, either by the ESOP trustee or by ESOP participants, subject to the limitations of Rule 144. After the completion of this offering, the convertible preferred stock held by our ESOP will account for approximately % of our common stock on a fully-converted basis, assuming no exercise of the underwriters’ option to purchase additional shares, or %, assuming exercise in full of the underwriters’ option to purchase additional shares. See “Description of Employee Stock Ownership Plan” for shares relating to distributions and diversifications during fiscal years 2012, 2013 and 2014.
In the future, we may issue additional shares of common stock or other equity or debt securities convertible into common stock in connection with a financing, acquisition, litigation settlement or employee arrangement or otherwise. Any of these issuances could result in substantial dilution to our existing stockholders and could cause the trading price of our common stock to decline.
If securities or industry analysts do not publish research or publish misleading or unfavorable research about our business, our stock price and trading volume could decline.
The trading market for our common stock will depend in part on the research and reports that securities or industry analysts publish about us or our business. We do not currently have and may never obtain research coverage by securities and industry analysts. If there is no coverage of us by securities or industry analysts, the trading price for our stock would be negatively impacted. In the event we obtain securities or industry analyst coverage, if one or more of these analysts downgrades our stock or publishes misleading or unfavorable research about our business, our stock price would likely decline. If one or more of these analysts ceases coverage of us or fails to publish reports on us regularly, demand for our stock could decrease, which could cause our stock price or trading volume to decline.
- 37 -
Table of Contents
The trustee of our ESOP has certain limited powers to vote a large block of shares on matters presented to stockholders for approval.
In general, the trustee of the ESOP votes the shares of stock held by the ESOP as directed by the ESOP’s committee. Consequently, the trustee of the ESOP, per the ESOP committee’s discretion, has the ability to vote a significant block of shares on certain matters presented to shareholders for approval. However, in the event of either a corporate matter with respect to the approval or disapproval of any corporate merger or consolidation, recapitalization, reclassification, liquidation, dissolution, sale of substantially all of the assets of a trade or business or with respect to any tender or exchange offer, or a request or invitation for tenders or exchanges, each participant in the ESOP may direct the trustee of the ESOP on how to vote the shares of stock allocated to the participant’s ESOP accounts; and the trustee must vote any unallocated stock and allocated stock for which no participant instructions were received in the same proportion as the allocated stock for which participants’ voting instructions have been received is voted.
Fulfilling our obligations incident to being a public company, including with respect to the requirements of and related rules under the Sarbanes-Oxley Act of 2002, will be expensive and time-consuming, and any delays or difficulties in satisfying these obligations could have a material adverse effect on our future results of operations and our stock price.
Following this offering, we will be subject to the reporting and corporate governance requirements, the listing standards of the New York Stock Exchange, or the NYSE, and the Sarbanes-Oxley Act of 2002, that apply to issuers of listed equity, which will impose certain new compliance costs and obligations upon us. The changes necessitated by publicly listing our equity will require a significant commitment of additional resources and management oversight which will increase our operating costs. These changes will also place additional demands on our finance and accounting staff and on our financial accounting and information systems. Other expenses associated with being a public company include increases in auditing, accounting and legal fees and expenses, investor relations expenses, increased directors’ fees and director and officer liability insurance costs, registrar and transfer agent fees and listing fees, as well as other expenses. As a public company, we will be required, among other things, to:
| • | define and expand the roles and the duties of our board of directors and its committees; and |
| • | institute more comprehensive compliance, investor relations and internal audit functions. |
In particular, beginning with the year ending March 31, 2016, our independent registered public accounting firm will be required to provide an attestation report on the effectiveness of our internal control over financial reporting pursuant to Section 404(b) of the Sarbanes-Oxley Act of 2002. If our independent registered public accounting firm is unable to provide us with an unqualified report regarding the effectiveness of our internal control over financial reporting (at such time as it is required to do so), investors could lose confidence in the reliability of our financial statements. This could result in a decrease in the value of our common stock. Failure to comply with the Sarbanes-Oxley Act of 2002 could potentially subject us to sanctions or investigations by the SEC, NYSE, or other regulatory authorities.
Anti-takeover provisions in our charter documents and Delaware law could discourage, delay or prevent a change in control of us and may affect the trading price of our common stock.
Our amended and restated certificate of incorporation and amended and restated bylaws will include a number of provisions that may discourage, delay or prevent a change in our management or control over us that stockholders may consider favorable. For example, our amended and restated certificate of incorporation and amended and restated bylaws will:
| • | authorize the issuance of “blank check” preferred stock that could be issued by our board of directors to thwart a takeover attempt; |
- 38 -
Table of Contents
| • | maintain a classified board of directors, as a result of which our board will continue to be divided into three classes, with each class serving for staggered three-year terms, which prevents stockholders from electing an entirely new board of directors at an annual meeting; |
| • | limit the ability of stockholders to remove directors; |
| • | provide that vacancies on our board of directors, including newly-created directorships, may be filled only by a majority vote of directors then in office; |
| • | prohibit stockholders from calling special meetings of stockholders; |
| • | prohibit stockholder action by written consent, thereby requiring all actions to be taken at a meeting of the stockholders; |
| • | not give the holders of our common stock cumulative voting rights with respect to the election of directors, which means that the holders of a majority of our outstanding shares of common stock can elect all directors standing for election; |
| • | establish advance notice requirements for nominations for election to our board of directors or for proposing matters that can be acted upon by stockholders at stockholder meetings; |
| • | require a super-majority stockholders vote of 75% to approve any reorganization, recapitalization, share exchange, share reclassification, consolidation, merger, conversion or sale of all or substantially all assets to which we are a party that is not approved by the affirmative vote of at least 75% of the members of our board of directors; and |
| • | require the approval of holders of at least 75% of the outstanding shares of our voting common stock to amend the bylaws and certain provisions of the certificate of incorporation. |
Any provision of our amended and restated certificate of incorporation, amended and restated bylaws or DGCL that has the effect of delaying or deterring a change in control could limit the opportunity for our stockholders to receive a premium for their shares of our common stock, and could also affect the price that some investors are willing to pay for our common stock. See “Description of Capital Stock — Anti-Takeover Effects of our Certificate of Incorporation and Bylaws.”
Our amended and restated certificate of incorporation and amended and restated bylaws may also make it difficult for stockholders to replace or remove our management. These provisions may facilitate management entrenchment that may delay, deter, render more difficult or prevent a change in our control, which may not be in the best interests of our stockholders.
Investors purchasing common stock in this offering will experience immediate and substantial dilution as a result of this offering and future equity issuances.
If you purchase shares of our common stock in this offering, you will incur immediate and substantial dilution in the book value of your stock, because the price that you pay will be substantially greater than the net tangible book value per share of the shares you acquire. As a result, you will pay a price per share that substantially exceeds the book value of our assets after subtracting our liabilities. The net tangible book value per share, calculated as of December 31, 2013 and after giving effect to the offering (assuming an initial public offering price of $ per share, the midpoint of the price range set forth on the cover page of this prospectus), is $ . Investors purchasing common stock in this offering will experience immediate and substantial dilution of $ a share, based on an initial public offering price of $ , which is the midpoint of the price range set forth on the cover page of this prospectus. In addition, we have issued options to acquire common stock at prices significantly below the initial public offering price. To the extent outstanding options are ultimately exercised, there will be further dilution to investors in this offering. In addition, if the underwriters exercise in full their option to purchase additional shares, or if we issue additional equity securities in the future, investors purchasing common stock in this offering will experience additional dilution. See “Dilution.”
- 39 -
Table of Contents
SPECIAL NOTE REGARDING FORWARD-LOOKING STATEMENTS AND INFORMATION
This prospectus includes forward-looking statements. Some of the forward-looking statements can be identified by the use of terms such as “believes,” “expects,” “may,” “will,” “should,” “could,” “seeks,” “intends,” “plans,” “estimates,” “anticipates” or other comparable terms. These forward-looking statements include all matters that are not related to present facts or current conditions or that are not historical facts. They appear in a number of places throughout this prospectus and include statements regarding our intentions, beliefs or current expectations concerning, among other things, our consolidated results of operations, financial condition, liquidity, prospects and growth strategies and the industries in which we operate and including, without limitation, statements relating to our future performance.
Forward-looking statements are subject to known and unknown risks and uncertainties, many of which are beyond our control. We caution you that forward-looking statements are not guarantees of future performance and that our actual consolidated results of operations, financial condition and liquidity, and industry development may differ materially from those made in or suggested by the forward-looking statements contained in this prospectus. In addition, even if our consolidated results of operations, financial condition and liquidity, and industry development are consistent with the forward-looking statements contained in this prospectus, those results or developments may not be indicative of results or developments in subsequent periods. A number of important factors could cause actual results to differ materially from those contained in or implied by the forward-looking statements, including the risks and uncertainties discussed in this prospectus under the headings “Prospectus Summary,” “Risk Factors,” “Management’s Discussion and Analysis of Financial Condition and Results of Operations,” and “Business.” Factors that could cause actual results to differ from those reflected in forward-looking statements relating to our operations and business include:
| • | fluctuations in the price and availability of resins and other raw materials and our ability to pass any increased costs of raw materials on to our customers in a timely manner; |
| • | volatility in general business and economic conditions in the markets in which we operate, including without limitation, factors relating to availability of credit, interest rates, fluctuations in capital and business and consumer confidence; |
| • | cyclicality and seasonality of the non-residential and residential construction markets and infrastructure spending; |
| • | the risks of increasing competition in our existing and future markets, including competition from both manufacturers of high performance thermoplastic corrugated pipe and manufacturers of products using alternative materials; |
| • | our ability to continue to convert current demand for concrete, steel and PVC pipe products into demand for our high performance thermoplastic corrugated pipe and Allied Products; |
| • | the effect of weather or seasonality; |
| • | the loss of any of our significant customers; |
| • | the risks of doing business internationally; |
| • | the risks of conducting a portion of our operations through joint ventures; |
| • | our ability to expand into new geographic or product markets; |
| • | our ability to achieve the acquisition component of our growth strategy; |
| • | the risk associated with manufacturing processes; |
| • | our ability to manage our assets; |
| • | the risks associated with our product warranties; |
| • | our ability to manage our supply purchasing and customer credit policies; |
- 40 -
Table of Contents
| • | the risks associated with our self-insured programs; |
| • | our ability to control labor costs and to attract, train and retain highly-qualified employees and key personnel; |
| • | our ability to protect our intellectual property rights; |
| • | changes in laws and regulations, including environmental laws and regulations; |
| • | our ability to project product mix; |
| • | the risks associated with our current levels of indebtedness; |
| • | our ability to meet future capital requirements and fund our liquidity needs; and |
| • | other risks and uncertainties, including those listed under “Risk Factors.” |
All forward-looking statements are made only as of the date of this prospectus and we do not undertake any obligation, other than as may be required by law, to update or revise any forward-looking statements to reflect future events or developments. Comparisons of results for current and any prior periods are not intended to express any future trends, or indications of future performance, unless expressed as such, and should only be viewed as historical data.
- 41 -
Table of Contents
Based upon an assumed initial public offering price of $ per share, which is the mid-point of the price range set forth on the cover page of this prospectus, we estimate that we will receive net proceeds from this offering of approximately $ million (or approximately $ million if the underwriters exercise in full their option to purchase additional shares), after deducting estimated underwriting discounts and commissions in connection with this offering and estimated offering expenses payable by us. We will not receive any proceeds from the sale of shares by the selling stockholder.
We intend to use the net proceeds from this offering (together with cash on hand, if necessary) to repay at least $ million of outstanding indebtedness under the revolving portion of our credit facility. We intend to use the remaining proceeds (if any) for general corporate purposes, including working capital. The revolving portion of our credit facility consists of a $325.0 million secured revolving credit facility, with an interest rate based on a fluctuating rate of interest, currently at approximately 2.3%, which matures on June 12, 2018. Our revolving credit facility and other indebtedness is described below under “Description of Certain Indebtedness — Senior Loan Facilities.” In the last 12 months, we borrowed under our revolving credit facility to pay a $108.1 million special dividend and to fund working capital.
Assuming no exercise of the underwriters’ option to purchase additional shares, a $1.00 increase or decrease in the assumed initial public offering price of $ per share (the mid-point of the price range set forth on the cover page of this prospectus) would increase or decrease the net proceeds to us from this offering by $ million assuming the number of shares offered by us remains the same and after deducting estimated underwriting discounts and commission and estimated offering expenses payable by us. An increase or decrease of 1,000,000 shares in the number of shares offered by us would increase or decrease the net proceeds to us to us by $ million, assuming no change in the assumed initial public offering price of $ per share (the mid-point of the price range set forth on the cover page of this prospectus) and after deducting the estimated underwriting discounts and commissions and estimated offering expenses payable by us.
- 42 -
Table of Contents
We have a history of paying dividends to our stockholders when sufficient cash is available, and we currently intend to pay regular quarterly dividends in the future after this offering. Our quarterly dividend will initially be set at $ per share of our common stock (including, on an as-converted basis, our shares of convertible preferred stock). During fiscal years 2013 and 2012, we declared dividends on our common stock of approximately $4.8 million and $4.3 million, respectively. Through December 31, 2013, we declared dividends on our common stock of approximately $4.0 million. All such declared dividends were paid in quarterly installments.
Any determination to pay dividends on our capital stock in the future will be at the discretion of our board of directors, subject to applicable laws and the provisions of our amended and restated certificate of incorporation (including those relating to the payment of dividends on our convertible preferred stock), and will depend on our financial condition, results of operations, capital requirements, general business conditions and other factors that our board of directors considers relevant. In addition, the terms of our credit facilities contain restrictions on our ability to pay dividends.
- 43 -
Table of Contents
The following table sets forth our cash and capitalization on a consolidated basis as of December 31, 2013:
| • | on an actual basis; and |
| • | on an as adjusted basis to give effect to (i) the sale by us of shares of our common stock in this offering at an assumed initial public offering price of $ per share (the mid-point of the price range set forth on the cover page of this prospectus) and (ii) the use of the net proceeds from this offering as described in “Use of Proceeds.” |
You should read this table in conjunction with the sections of this prospectus entitled “Use of Proceeds,” “Selected Historical Consolidated Financial Data,” “Management’s Discussion and Analysis of Financial Condition and Results of Operations,” “Description of Certain Indebtedness” and our consolidated financial statements and related notes included elsewhere in this prospectus.
| As of December 31, 2013 | ||||||||
| Actual | As Adjusted (1) | |||||||
| (Amounts in thousands, except per share amounts) | ||||||||
| Cash |
$ | 5,335 | ||||||
|
|
|
|
|
|||||
| Long Term Debt (including current portion) |
||||||||
| Revolving Credit Facility |
$ | 98,400 | ||||||
| Term Loan |
98,750 | |||||||
| Senior Notes |
100,000 | |||||||
| Other debt |
9,115 | |||||||
|
|
|
|
|
|||||
| Total Long Term Debt (including current portion) |
306,265 | |||||||
| Mezzanine equity |
||||||||
| Redeemable Common Stock; $0.01 par value: (i) actual: 8,141 shares issued and outstanding and (ii) as adjusted: no shares issued and outstanding (2) |
578,020 | — | ||||||
| Redeemable Convertible Preferred Stock; $0.01 par value: 10,000 authorized: (i) actual: 5,562 issued and outstanding and (ii) as adjusted: issued and outstanding (3) |
307,581 | — | ||||||
| Deferred compensation — unearned ESOP shares (3) |
(207,426 | ) | — | |||||
|
|
|
|
|
|||||
| Total mezzanine equity |
678,175 | — | ||||||
| Stockholders’ equity: |
||||||||
| Convertible preferred stock, $0.01 par value per share, (i) actual: no shares authorized, issued and outstanding and (ii) as adjusted: shares authorized and shares issued and outstanding |
— | |||||||
| Common stock, $0.01 par value per share: (i) actual: 23,359 shares authorized and issued and 1,875 shares outstanding and (ii) as adjusted: shares authorized and issued and shares outstanding |
11,957 | |||||||
| Paid-in capital |
40,991 | |||||||
| Common stock in treasury, at cost |
(448,963 | ) | ||||||
| Accumulated other comprehensive loss |
(6,122 | ) | ||||||
| Retained earnings |
42,159 | |||||||
|
|
|
|
|
|||||
| Total ADS stockholders’ equity |
(359,978 | ) | ||||||
| Noncontrolling interest in subsidiaries |
22,119 | |||||||
|
|
|
|
|
|||||
| Total stockholders’ equity |
(337,859 | ) | ||||||
|
|
|
|
|
|||||
| Total capitalization |
$ | 646,581 | ||||||
|
|
|
|
|
|||||
- 44 -
Table of Contents
| (1) | Each $1.00 increase or decrease in the assumed initial public offering price of $ per share (the mid-point of the price range set forth on the cover page of this prospectus) would increase or decrease, as applicable, our as adjusted cash, paid-in capital and stockholders’ equity by $ million, assuming that the number of shares offered by us as set forth on the cover page of this prospectus remains the same and after deducting estimated underwriting discounts and commissions and estimated offering expenses. Each 1,000,000 increase or decrease in the number of shares offered by us would increase or decrease, as applicable, our as adjusted cash, paid-in capital and stockholders’ equity by $ million assuming no change in the assumed initial public offering price of $ per share (the mid-point of the price range set forth on the cover page of this prospectus) and after deducting estimated underwriting discounts and commissions and estimated offering expenses. |
The share information as of December 31, 2013 shown in the table above excludes (on a post-stock split basis):
| • | million shares of restricted stock outstanding as of , 2014 under our 2008 Restricted Stock Plan; |
| • | million shares of common stock issuable upon exercise of options outstanding as of December 31, 2013 at a weighted average exercise price of $ per share; and |
| • | million shares of common stock reserved for future issuance under our 2013 Stock Option Plan. |
| (2) | Upon completion of this offering, the redemption rights associated with these shares, which require them to be classified in mezzanine equity, will be no longer be in effect. As a result, we anticipate reclassifying these balances to total stockholders’ equity upon the completion of this offering. |
| (3) | Upon completion of this offering, the redemption rights associated with these shares, which require them to be classified in mezzanine equity, will be no longer be in effect. As a result, we anticipate reclassifying these balances to total stockholders’ equity upon the completion of this offering. |
- 45 -
Table of Contents
If you invest in our common stock, the book value of your ownership interest will be immediately diluted to the extent of the difference between the initial public offering price per share of our common stock and the net tangible book value per share of our common stock immediately after this offering.
Our net tangible book value as of December 31, 2013 was approximately $184.8 million, and net tangible book value per share was $ . Net tangible book value per share before the offering has been determined by dividing net tangible book value (total book value of tangible assets less total liabilities) by the number of shares of common stock outstanding at December 31, 2013, after giving effect to a -for- stock split to be effected immediately prior to the effectiveness of the registration statement of which this prospectus forms a part.
After giving effect to the sale of shares of our common stock in this offering at an assumed initial public offering price of $ per share (the mid-point of the price range set forth on the cover page of this prospectus) and after deducting the estimated underwriting discounts and commissions and estimated offering expenses payable by us, our net tangible book value at December 31, 2013 would have been $ million, or $ per share. This represents an immediate decrease in net tangible book value per share of $ to the existing stockholders and dilution in net tangible book value per share of $ to new investors who purchase shares in this offering. The following table illustrates this per share dilution to new investors:
| Assumed initial public offering price per share |
$ | |||||||
| Net tangible book value per share as of December 31, 2013 |
$ | |||||||
| Increase per share attributable to this offering |
||||||||
|
|
|
|||||||
| Net tangible book value, as adjusted to give effect to this offering |
||||||||
|
|
|
|||||||
| Dilution in net tangible book value to new investors in this offering |
$ | |||||||
|
|
|
A $1.00 increase or decrease in the assumed initial offering price of $ per share (the mid-point of the price range set forth on the cover page of this prospectus) would increase or decrease our net tangible book value as adjusted to give effect to this offering by $ per share, assuming that the number of shares offered by us set forth on the cover page of this prospectus remains the same, and after deducting the estimated underwriting discounts and commissions and estimated offering expenses payable by us. An increase or decrease of 1,000,000 shares in the number of shares offered by us would increase or decrease our net tangible book value as adjusted to give effect to this offering by $ per share, assuming the assumed initial offering price of $ per share (the mid-point of the price range set forth on the cover page of this prospectus) remains the same, and after deducting the estimated underwriting discounts and commissions and estimated offering expenses payable by us.
The following table summarizes, as of December 31, 2013, the total number of shares of common stock purchased from us, the total consideration paid to us and the average price per share paid by the existing stockholders and by new investors purchasing shares in this offering:
| Shares Purchased | Total Consideration | Average Price Per Share |
||||||||||||||||
| Number | Percent | Amount | Percent | |||||||||||||||
| Existing Stockholders |
% | $ | % | $ | ||||||||||||||
| New investors |
||||||||||||||||||
|
|
|
|
|
|
|
|
|
|
||||||||||
| Total |
% | $ | % | $ | ||||||||||||||
The share information as of December 31, 2013 shown in the table above excludes:
| • | approximately million shares of common stock issuable upon exercise of options outstanding as of December 31, 2013 at a weighted average exercise price of $ per share; and |
| • | million shares of common stock reserved for future issuance under our 2013 Stock Option Plan, 2008 Restricted Stock Plan and Amended 2000 Incentive Stock Option Plan. |
- 46 -
Table of Contents
SELECTED HISTORICAL CONSOLIDATED FINANCIAL DATA
The selected historical consolidated financial data presented below as of March 31, 2012 and 2013 and for fiscal years 2011, 2012 and 2013 have been derived from our audited consolidated financial statements included elsewhere in this prospectus. The selected historical consolidated financial data presented below as of December 31, 2013 and for the nine months ended December 31, 2012 and 2013 have been derived from our unaudited condensed consolidated financial statements included elsewhere in this prospectus. The selected historical consolidated financial data presented below as of March 31, 2009, 2010 and 2011 and for fiscal years 2009 and 2010 have been derived from our audited consolidated financial statements which are not included in this prospectus.
The results indicated below and elsewhere in this prospectus are not necessarily indicative of our future performance. You should read this data in conjunction with “Management’s Discussion and Analysis of Financial Condition and Results of Operations” and our consolidated financial statements and the related notes included elsewhere in this prospectus. This selected historical consolidated financial data does not reflect the earnings per share and dividends per share impact of our -for- stock split to be effected immediately prior to the effectiveness of the registration statement of which this prospectus forms a part.
| Fiscal Year Ended March 31, |
Nine Months Ended December 31, |
|||||||||||||||||||||||||||
| (Amounts in thousands, except per share data) | 2009 (1) | 2010 (1) | 2011 | 2012 | 2013 | 2012 | 2013 | |||||||||||||||||||||
| Consolidated statement of income data: |
||||||||||||||||||||||||||||
| Net sales |
$ | 963,478 | $ | 751,237 | $ | 863,138 | $ | 1,013,756 | $ | 1,017,041 | $ | 832,565 | $ | 887,777 | ||||||||||||||
| Cost of goods sold |
793,479 | 553,863 | 692,164 | 818,398 | 807,730 | 659,283 | 698,791 | |||||||||||||||||||||
|
|
|
|
|
|
|
|
|
|
|
|
|
|
|
|||||||||||||||
| Gross profit |
169,999 | 197,374 | 170,974 | 195,358 | 209,311 | 173,282 | 188,986 | |||||||||||||||||||||
| Selling expenses |
64,546 | 58,801 | 63,103 | 67,625 | 69,451 | 52,847 | 52,433 | |||||||||||||||||||||
| General and administrative expenses |
66,813 | 61,872 | 61,648 | 65,927 | 67,712 | 48,913 | 54,354 | |||||||||||||||||||||
| Gain on sale of assets/ business |
— | — | — | (44,634 | ) | (2,210 | ) | (2,210 | ) | (4,848 | ) | |||||||||||||||||
| Intangibles amortization |
4,800 | 4,636 | 7,294 | 11,387 | 11,295 | 8,119 | 8,576 | |||||||||||||||||||||
|
|
|
|
|
|
|
|
|
|
|
|
|
|
|
|||||||||||||||
| Income from operations |
33,840 | 72,065 | 38,929 | 95,053 | 63,063 | 65,613 | 78,471 | |||||||||||||||||||||
| Interest expense |
13,958 | 10,725 | 27,121 | 21,837 | 16,095 | 12,465 | 11,860 | |||||||||||||||||||||
| Other miscellaneous (income) expense, net (2) |
4,382 | (26,875 | ) | (847 | ) | 2,425 | 283 | 176 | 398 | |||||||||||||||||||
|
|
|
|
|
|
|
|
|
|
|
|
|
|
|
|||||||||||||||
| Income before income taxes |
15,500 | 88,215 | 12,655 | 70,791 | 46,685 | 52,972 | 66,213 | |||||||||||||||||||||
| Income tax expense |
4,568 | 33,067 | 4,053 | 27,064 | 16,894 | 20,112 | 40,845 | |||||||||||||||||||||
| Equity in net (income) loss of unconsolidated affiliates |
(2,573 | ) | (2,404 | ) | (736 | ) | (704 | ) | (387 | ) | (402 | ) | 714 | |||||||||||||||
|
|
|
|
|
|
|
|
|
|
|
|
|
|
|
|||||||||||||||
| Net income |
13,505 | 57,552 | 9,338 | 44,431 | 30,178 | 33,262 | 24,654 | |||||||||||||||||||||
| Less net income attributable to the noncontrolling interest |
9,188 | 3,677 | 3,342 | 1,171 | 2,019 | 1,654 | 1,360 | |||||||||||||||||||||
|
|
|
|
|
|
|
|
|
|
|
|
|
|
|
|||||||||||||||
| Net income attributable to ADS |
4,317 | 53,875 | 5,996 | 43,260 | 28,159 | 31,608 | 23,294 | |||||||||||||||||||||
|
|
|
|
|
|
|
|
|
|
|
|
|
|
|
|||||||||||||||
| Change in fair value of Redeemable Convertible Preferred Stock |
6,010 | (11,890 | ) | (3,541 | ) | (10,257 | ) | (5,869 | ) | (3,682 | ) | (8,492 | ) | |||||||||||||||
| Dividends paid to Redeemable Convertible Preferred Stockholders |
(1,091 | ) | (1,029 | ) | (844 | ) | (668 | ) | (736 | ) | (554 | ) | (640 | ) | ||||||||||||||
| Dividends paid to unvested restricted stockholders |
(29 | ) | (6 | ) | (104 | ) | (34 | ) | (52 | ) | (39 | ) | (47 | ) | ||||||||||||||
|
|
|
|
|
|
|
|
|
|
|
|
|
|
|
|||||||||||||||
| Net income available to common stockholders and participating securities |
9,207 | 40,950 | 1,507 | 32,301 | 21,502 | 27,333 | 14,115 | |||||||||||||||||||||
| Undistributed income allocated to participating securities |
(820 | ) | (6,058 | ) | — | (3,241 | ) | (2,042 | ) | (2,703 | ) | (1,184 | ) | |||||||||||||||
|
|
|
|
|
|
|
|
|
|
|
|
|
|
|
|||||||||||||||
| Net income available to common stockholders |
$ | 8,387 | $ | 34,892 | $ | 1,507 | $ | 29,060 | $ | 19,460 | $ | 24,630 | $ | 12,931 | ||||||||||||||
|
|
|
|
|
|
|
|
|
|
|
|
|
|
|
|||||||||||||||
- 47 -
Table of Contents
| Fiscal Year Ended March 31, |
Nine Months Ended December 31, |
|||||||||||||||||||||||||||
| (Amounts in thousands, except per share data) | 2009 (1) | 2010 (1) | 2011 | 2012 | 2013 | 2012 | 2013 | |||||||||||||||||||||
| Weighted average common shares outstanding: |
||||||||||||||||||||||||||||
| Basic |
10,647 | 10,437 | 10,127 | 9,835 | 9,921 | 9,917 | 9,980 | |||||||||||||||||||||
| Diluted |
11,003 | 10,742 | 10,346 | 9,996 | 10,038 | 10,033 | 10,087 | |||||||||||||||||||||
| As adjusted — Basic (3) |
||||||||||||||||||||||||||||
| As adjusted — Diluted (3) |
||||||||||||||||||||||||||||
| Net income per share: |
||||||||||||||||||||||||||||
| Basic |
$ | 0.79 | $ | 3.34 | $ | 0.15 | $ | 2.95 | $ | 1.96 | $ | 2.48 | $ | 1.30 | ||||||||||||||
| Diluted |
$ | 0.76 | $ | 3.25 | $ | 0.15 | $ | 2.91 | $ | 1.94 | $ | 2.45 | $ | 1.28 | ||||||||||||||
| As adjusted — Basic (3) |
$ | 0.30 | $ | 4.29 | $ | 0.49 | $ | 3.88 | $ | 2.48 | $ | 2.81 | $ | 2.05 | ||||||||||||||
| As adjusted — Diluted (3) |
$ | 0.29 | $ | 4.17 | $ | 0.47 | $ | 3.81 | $ | 2.45 | $ | 2.75 | $ | 2.00 | ||||||||||||||
| Cash dividends declared per share |
$ | 0.40 | $ | 0.40 | $ | 0.44 | $ | 0.44 | $ | 0.48 | $ | 0.33 | $ | 0.36 | ||||||||||||||
| Fiscal Year Ended March 31, |
Nine Months Ended December 31, |
|||||||||||||||||||||||||||
| (Amounts in thousands, except percentages) |
2009 (1) | 2010 (1) | 2011 | 2012 | 2013 | 2012 | 2013 | |||||||||||||||||||||
| Other financial data: |
||||||||||||||||||||||||||||
| Capital expenditures |
$ | 27,562 | $ | 23,140 | $ | 30,041 | $ | 26,467 | $ | 40,004 | $ | 35,421 | $ | 27,097 | ||||||||||||||
| Adjusted EBITDA (4) |
82,237 | 127,228 | 100,780 | 116,873 | 129,759 | 115,731 | 130,567 | |||||||||||||||||||||
| Adjusted EBITDA margin (5) |
8.5 | % | 16.9 | % | 11.7 | % | 11.5 | % | 12.8 | % | 13.9 | % | 14.7 | % | ||||||||||||||
| As of March 31, |
As of December 31, |
|||||||||||||||||||||||
| (Amounts in thousands) | 2009 (1) | 2010 (1) | 2011 (1) | 2012 | 2013 | 2013 | ||||||||||||||||||
| Consolidated balance sheet data: |
||||||||||||||||||||||||
| Cash |
$ | 10,137 | $ | 3,021 | $ | 2,151 | $ | 2,082 | $ | 1,361 | $ | 5,335 | ||||||||||||
| Working capital (6) |
146,482 | 166,125 | 204,061 | 208,268 | 220,276 | 208,097 | ||||||||||||||||||
| Total assets |
714,310 | 794,049 | 866,798 | 905,028 | 907,739 | 885,948 | ||||||||||||||||||
| Long-term debt |
259,547 | 251,446 | 374,746 | 370,672 | 349,990 | 306,265 | ||||||||||||||||||
| Total liabilities |
424,381 | 457,138 | 618,351 | 615,314 | 585,115 | 545,632 | ||||||||||||||||||
| Total mezzanine equity (7) |
93,418 | 104,859 | 493,674 | 557,563 | 608,346 | 678,175 | ||||||||||||||||||
| Total stockholders’ equity |
196,511 | 232,052 | (245,227 | ) | (267,849 | ) | (285,722 | ) | (337,859 | ) | ||||||||||||||
| Total mezzanine equity and stockholders’ equity |
289,929 | 336,911 | 248,447 | 289,714 | 322,624 | 340,316 | ||||||||||||||||||
| Fiscal Year Ended March 31, |
Nine Months Ended December 31, |
|||||||||||||||||||||||||||
| (Amounts in thousands) | 2009 (1) | 2010 (1) | 2011 | 2012 | 2013 | 2012 | 2013 | |||||||||||||||||||||
| Statement of cash flows data: |
||||||||||||||||||||||||||||
| Net cash from operating activities |
$ | 102,348 | $ | 70,343 | $ | 37,233 | $ | 56,997 | $ | 68,215 | $ | 60,176 | $ | 88,104 | ||||||||||||||
| Net cash from investing activities |
(27,562 | ) | (47,011 | ) | (53,237 | ) | (35,833 | ) | (47,199 | ) | (42,079 | ) | (30,116 | ) | ||||||||||||||
| Net cash from financing activities |
(72,524 | ) | (30,448 | ) | 15,134 | (21,233 | ) | (21,737 | ) | (15,987 | ) | (54,014 | ) | |||||||||||||||
| (1) | The presentation of our selected historical consolidated financial data as of March 31, 2009, 2010 and 2011 and for fiscal years 2009 and 2010 has been adjusted to comply with the retrospective application of our inventory accounting principle change. See Note 1, Background and Summary of Significant Accounting Policies, within our consolidated financial statements included elsewhere in this prospectus for further details regarding our inventory accounting principle change. |
| (2) | Other miscellaneous (income) expense, net for fiscal year ended March 31, 2010 includes a gain of $25,952 from the purchase of the controlling interest of an unconsolidated affiliate. |
| (3) | Net Income Per Share As Adjusted — Basic and Diluted, which are non-GAAP measures, have been presented in this prospectus as supplemental measures of financial performance that are not required by, or presented in accordance with generally accepted accounting principles or GAAP. As described elsewhere in this prospectus, upon completion of this offering, the redemption rights associated with these shares, which require them to be classified as mezzanine equity, will be no longer in effect and, as such, we anticipate reclassifying these balances to total stockholders’ equity upon the completion of this offering. We calculate Net Income Per Share As Adjusted — Basic, and the corresponding Weighted Average Common Shares Outstanding As Adjusted — Basic, by adjusting our historical net income per share and weighted average common shares outstanding amounts for the reclassification of Redeemable Convertible |
- 48 -
Table of Contents
| Preferred Stock from mezzanine equity to total stockholders’ equity in order to present historical amounts as if this reclassification occurred as of the beginning of the earliest period presented. |
To effect this adjustment, we have (1) removed the adjustment for the change in fair value of Redeemable Convertible Preferred Stock classified as mezzanine equity from the numerator of the Basic Net Income Per Share computation, and (2) made a corresponding adjustment to the amount allocated to participating securities under the two-class earnings per share computation method.
We have also made adjustments to Net Income Per Share as Adjusted – Diluted, and the corresponding Weighted Average Common Shares Outstanding As Adjusted – Diluted, to assume share settlement of the Redeemable Convertible Preferred Stock to the extent that the if-converted computation method is more dilutive than the two-class computation method.
Net Income Per Share As Adjusted — Basic and Diluted are included in this prospectus because they are key metrics used by management and our board of directors to assess our financial performance. Net Income Per Share As Adjusted — Basic and Diluted are not necessarily comparable to other similarly titled captions of other companies due to different methods of calculation.
The following table presents a reconciliation of Net Income Per Share As Adjusted — Basic and Diluted, and the corresponding Weighted Average Common Shares Outstanding As Adjusted — Basic and Diluted to our historical net income per share and corresponding historical weighted average common share amounts, the most comparable GAAP measure, for each of the periods indicated.
| Fiscal Year Ended March 31, |
Nine Months Ended |
|||||||||||||||||||||||||||
| (Amounts in thousands, except per share data) | 2009 | 2010 | 2011 | 2012 | 2013 | 2012 | 2013 | |||||||||||||||||||||
| Net Income Per Share As Adjusted — Basic |
||||||||||||||||||||||||||||
| Net income available to common stockholders |
$ | 8,387 | $ | 34,892 | $ | 1,507 | $ | 29,060 | $ | 19,460 | $ | 24,630 | $ | 12,931 | ||||||||||||||
| Adjustment for: |
||||||||||||||||||||||||||||
| Change in fair value of Redeemable Convertible Preferred Stock |
(6,010 | ) | 11,890 | 3,541 | 10,257 | 5,869 | 3,682 | 8,492 | ||||||||||||||||||||
| Undistributed income allocated to participating securities |
820 | (1,959 | ) | (76 | ) | (1,189 | ) | (716 | ) | (418 | ) | (997 | ) | |||||||||||||||
|
|
|
|
|
|
|
|
|
|
|
|
|
|
|
|||||||||||||||
| Net income available to common stockholders used to calculate Net Income Per Share As Adjusted — Basic |
$ | 3,197 | $ | 44,823 | $ | 4,972 | $ | 38,128 | $ | 24,613 | $ | 27,894 | $ | 20,426 | ||||||||||||||
|
|
|
|
|
|
|
|
|
|
|
|
|
|
|
|||||||||||||||
| Weighted average common shares outstanding: |
||||||||||||||||||||||||||||
| Basic |
10,647 | 10,437 | 10,127 | 9,835 | 9,921 | 9,917 | 9,980 | |||||||||||||||||||||
| As adjusted — Basic |
10,647 | 10,437 | 10,127 | 9,835 | 9,921 | 9,917 | 9,980 | |||||||||||||||||||||
| Net Income Per Share As Adjusted — Diluted |
||||||||||||||||||||||||||||
| Net income available to common stockholders used to calculate Net Income Per Share As Adjusted — Basic |
$ | 3,197 | $ | 44,823 | $ | 4,972 | $ | 38,128 | $ | 24,613 | $ | 27,894 | $ | 20,426 | ||||||||||||||
| Adjustment for: |
||||||||||||||||||||||||||||
| Undistributed income allocated to participating Redeemable Convertible Preferred Stock |
— | — | 74 | — | — | 2,972 | 2,071 | |||||||||||||||||||||
| Dividends paid to Redeemable Convertible Preferred Stockholders, net of tax impact |
— | — | 557 | — | — | 360 | 416 | |||||||||||||||||||||
| Other adjustments |
— | — | (4 | ) | — | — | (5 | ) | 45 | |||||||||||||||||||
|
|
|
|
|
|
|
|
|
|
|
|
|
|
|
|||||||||||||||
| Net income available to common stockholders used to calculate Net Income Per Share As Adjusted — Diluted |
$ | 3,197 | $ | 44,823 | $ | 5,599 | $ | 38,128 | $ | 24,613 | $ | 31,221 | $ | 22,958 | ||||||||||||||
|
|
|
|
|
|
|
|
|
|
|
|
|
|
|
|||||||||||||||
| Weighted average common shares outstanding |
||||||||||||||||||||||||||||
| Diluted |
11,003 | 10,742 | 10,346 | 9,996 | 10,038 | 10,033 | 10,087 | |||||||||||||||||||||
| Conversion of the outstanding Redeemable Convertible Preferred Stock on an as converted basis |
— | — | 1,607 | — | — | 1,305 | 1,366 | |||||||||||||||||||||
|
|
|
|
|
|
|
|
|
|
|
|
|
|
|
|||||||||||||||
| As adjusted — Diluted |
11,003 | 10,742 | 11,953 | 9,996 | 10,038 | 11,338 | 11,453 | |||||||||||||||||||||
| Net income (loss) per share: |
||||||||||||||||||||||||||||
| As adjusted — Basic |
$ | 0.30 | $ | 4.29 | $ | 0.49 | $ | 3.88 | $ | 2.48 | $ | 2.81 | $ | 2.05 | ||||||||||||||
| As adjusted — Diluted |
$ | 0.29 | $ | 4.17 | $ | 0.47 | $ | 3.81 | $ | 2.45 | $ | 2.75 | $ | 2.00 | ||||||||||||||
| (4) | EBITDA and Adjusted EBITDA, which are non-GAAP financial measures, have been presented in this prospectus as supplemental measures of financial performance that are not required by, or presented in accordance with generally accepted accounting principles or GAAP. We calculate EBITDA as net income attributable to ADS before interest, income taxes, depreciation and amortization. We calculate Adjusted EBITDA as EBITDA before stock-based compensation expense, non-cash charges and certain other expenses. |
- 49 -
Table of Contents
EBITDA and Adjusted EBITDA are included in this prospectus because they are key metrics used by management and our board of directors to assess our financial performance. EBITDA and Adjusted EBITDA are frequently used by analysts, investors and other interested parties to evaluate companies in our industry. In addition to covenant compliance and executive performance evaluations, we use Adjusted EBITDA to supplement GAAP measures of performance to evaluate the effectiveness of our business strategies, to make budgeting decisions and to compare our performance against that of other peer companies using similar measures.
EBITDA and Adjusted EBITDA are not GAAP measures of our financial performance or liquidity and should not be considered as alternatives to net income as a measure of financial performance or cash flows from operations as a measure of liquidity, or any other performance measure derived in accordance with GAAP and they should not be construed as an inference that our future results will be unaffected by unusual or non-recurring items. Additionally, EBITDA and Adjusted EBITDA are not intended to be measures of free cash flow for management’s discretionary use, as they do not reflect certain cash requirements such as tax payments, debt service requirements, capital expenditures and certain other cash costs that may recur in the future. EBITDA and Adjusted EBITDA contain certain other limitations, including the failure to reflect our cash expenditures, cash requirements for working capital needs and cash costs to replace assets being depreciated and amortized. In evaluating Adjusted EBITDA, you should be aware that in the future we will incur expenses that are the same as or similar to some of the adjustments in this presentation, such as stock based compensation expense, derivative fair value adjustments, and foreign currency transaction losses. Our presentation of Adjusted EBITDA should not be construed to imply that our future results will be unaffected by any such adjustments. Management compensates for these limitations by relying on our GAAP results in addition to using EBITDA and Adjusted EBITDA supplementally. Our measures of EBITDA and Adjusted EBITDA are not necessarily comparable to other similarly titled captions of other companies due to different methods of calculation.
The following table presents a reconciliation of EBITDA and Adjusted EBITDA to Net income, the most comparable GAAP measure, for each of the periods indicated.
| Fiscal Year End March 31, |
Nine Months Ended December 31, |
|||||||||||||||||||||||||||
| (Amounts in thousands) | 2009 | 2010 | 2011 | 2012 | 2013 | 2012 | 2013 | |||||||||||||||||||||
| Net income attributable to ADS |
$ | 4,317 | $ | 53,875 | $ | 5,996 | $ | 43,260 | $ | 28,159 | $ | 31,608 | $ | 23,294 | ||||||||||||||
| Depreciation and amortization (a) |
49,940 | 50,033 | 56,327 | 59,356 | 56,926 | 42,188 | 43,076 | |||||||||||||||||||||
| Interest expense, net |
13,958 | 10,725 | 27,121 | 21,837 | 16,095 | 12,465 | 11,860 | |||||||||||||||||||||
| Income tax expense |
4,568 | 33,067 | 4,053 | 27,064 | 16,894 | 20,112 | 40,845 | |||||||||||||||||||||
|
|
|
|
|
|
|
|
|
|
|
|
|
|
|
|||||||||||||||
| EBITDA |
72,783 | 147,700 | 93,497 | 151,517 | 118,074 | 106,373 | 119,075 | |||||||||||||||||||||
| Derivative fair value adjustments (b) |
1,915 | (1,665 | ) | (1,365 | ) | 2,315 | (4 | ) | 220 | 54 | ||||||||||||||||||
| Foreign currency transaction losses (c) |
— | — | 332 | 378 | 1,085 | 659 | 251 | |||||||||||||||||||||
| Gain on sale of Septic Chamber business (d) |
— | — | — | (44,634 | ) | — | — | — | ||||||||||||||||||||
| Unconsolidated affiliates interest and tax (e) |
— | 166 | 624 | 915 | 729 | 488 | 347 | |||||||||||||||||||||
| Gain from purchase of the controlling interest of an unconsolidated affiliate (f) |
— | (25,952 | ) | — | — | — | — | — | ||||||||||||||||||||
| One-time management fee to minority interest holder (g) |
— | — | — | — | — | — | 739 | |||||||||||||||||||||
| Stock based compensation (h) |
1,349 | 1,823 | 2,725 | 1,425 | 2,592 | 1,207 | 2,640 | |||||||||||||||||||||
| ESOP deferred stock based compensation (i) |
6,190 | 5,156 | 4,564 | 4,957 | 7,283 | 6,784 | 7,343 | |||||||||||||||||||||
| Transaction costs (j) |
— | — | 403 | — | — | — | 118 | |||||||||||||||||||||
|
|
|
|
|
|
|
|
|
|
|
|
|
|
|
|||||||||||||||
| Adjusted EBITDA |
$ | 82,237 | $ | 127,228 | $ | 100,780 | $ | 116,873 | $ | 129,759 | $ | 115,731 | $ | 130,567 | ||||||||||||||
|
|
|
|
|
|
|
|
|
|
|
|
|
|
|
|||||||||||||||
| (a) | Includes our proportionate share of depreciation and amortization expense of $0, $233, $552, $985 and $1,321 related to our South American Joint Venture and our BaySaver Joint Venture, which amounts are included in equity in net income of unconsolidated affiliates in our consolidated statements of income for fiscal years 2009, 2010, 2011, 2012 and 2013, respectively, and $977 and $1,031 included in equity in net income of unconsolidated affiliates in our condensed consolidated statements of income for the nine months ended December 31, 2012 and 2013, respectively. Depreciation and amortization expense for fiscal year 2012 also includes a charge of $3,200 related to the impairment of one of our trademarks. |
| (b) | Represents the non-cash gains and losses arising from changes in mark-to-market values for derivative contracts related to diesel fuel and interest rate swaps. The impact of resin physical and financial derivatives is included in cost of goods sold. |
| (c) | Represents the gains and losses incurred on purchases, sales and intercompany loans and dividends denominated in non-functional currencies. |
| (d) | Represents a gain recognized on the sale of our septic chamber business in January 2012. |
| (e) | Represents our proportional share of income taxes and interest related to our South American Joint Venture and our BaySaver Joint Venture, which are accounted for under the equity method of accounting. |
| (f) | Represents a gain from fair value re-measurement of investment in an unconsolidated affiliate upon acquiring the controlling interest of the affiliate. |
| (g) | Represents management fee paid to a minority interest holder of a consolidated subsidiary. |
| (h) | Represents the non-cash stock based compensation cost related to our stock options and restricted stock awards. |
- 50 -
Table of Contents
| (i) | Represents the non-cash stock based compensation expense attributable to the shares of convertible preferred stock allocated to employee ESOP accounts during the applicable period. |
| (j) | Represents expenses recorded related to legal, accounting and other professional fees incurred in connection with our recent debt refinancing and in connection with this offering. |
| (5) | Adjusted EBITDA margin for any period represents Adjusted EBITDA as a percentage of net sales for that period. |
| (6) | Working capital is the difference between our current assets and current liabilities. Working capital is an indication of liquidity and potential need for short-term funding. |
| (7) | Our mezzanine equity consists of the Redeemable Convertible Preferred Stock held by our ESOP and Redeemable Common Stock held by certain stockholders who have certain rights associated with such shares, which rights are considered for purposes of GAAP to be a redemption right, which is beyond our control. See Note 17, Mezzanine Equity, within our consolidated financial statements included elsewhere in this prospectus for further information regarding the accounting treatment for our mezzanine equity. Upon completion of this offering, the redemption rights associated with these shares, which require them to be classified in mezzanine equity, will be no longer be in effect. As a result, we anticipate reclassifying these balances to total stockholders’ equity upon the completion of this offering. |
- 51 -
Table of Contents
MANAGEMENT’S DISCUSSION AND ANALYSIS
OF FINANCIAL CONDITION AND RESULTS OF OPERATIONS
The following discussion and analysis of the financial condition and results of our operations should be read in conjunction with the consolidated financial statements and related footnotes included elsewhere in this prospectus. This discussion contains forward-looking statements that are based on the beliefs of our management, as well as assumptions made by, and information currently available to, our management. Our actual results could differ materially from those discussed below. Factors that could cause or contribute to such differences include, but are not limited to, those identified below, and those discussed in the sections titled “Risk Factors” and “Special Note Regarding Forward-Looking Statements and Information” included elsewhere in this prospectus. You should read the following discussion together with the sections titled “Risk Factors,” “Selected Historical Consolidated Financial Data” and our consolidated financial statements, including the related footnotes, included elsewhere in this prospectus.
We consolidate all of our joint ventures for purposes of GAAP, except for our South American Joint Venture and our BaySaver Joint Venture.
Overview
We are the leading manufacturer of high performance thermoplastic corrugated pipe, providing a comprehensive suite of water management products and superior drainage solutions for use in the construction and infrastructure marketplace. Our innovative products are used across a broad range of end markets and applications, including non-residential, residential, agriculture and infrastructure applications. We have established a leading position in many of these end markets by leveraging our national sales and distribution platform, our overall product breadth and scale and our manufacturing excellence. In North America, our national footprint combined with our strong local presence and broad product offering makes us the leader in an otherwise highly fragmented sector comprised of many smaller competitors. We believe the markets we serve in the United States represent approximately $10.1 billion of annual revenue opportunity. In addition, we believe the increasing acceptance of thermoplastic pipe products in international markets represents an attractive growth opportunity.
Our products are generally lighter, more durable, more cost effective and easier to install than comparable alternatives made with traditional materials. Following our entrance into the non-residential construction market with the introduction of N-12 corrugated polyethylene pipe in the late 1980s, our pipe has been displacing traditional materials, such as reinforced concrete, corrugated steel and polyvinyl chloride, or PVC, across an ever expanding range of end markets. This has allowed us to consistently gain share and achieve above market growth throughout economic cycles. We expect to continue to drive conversion to our products from traditional products as contractors, civil design engineers and municipal agencies increasingly acknowledge the superior physical attributes and compelling value proposition of our thermoplastic products. In addition, we believe that overall demand for our products will benefit as the regulatory environment continues to evolve.
Our broad product line includes corrugated high density polyethylene (or HDPE) pipe, polypropylene (or PP) pipe and related water management products. Building on our core drainage businesses, we have aggressively pursued attractive ancillary product categories such as storm and septic chambers, PVC drainage structures, fittings and filters, and water quality filters and separators. We refer to these ancillary product categories as Allied Products. Given the scope of our overall sales and distribution platform, we have been able to drive growth within our Allied Products and believe there are significant growth opportunities going forward.
- 52 -
Table of Contents
Key Factors Affecting Our Results of Operations
Product Demand
There are numerous factors that influence demand for our products. Our businesses are cyclical in nature and sensitive to general economic conditions, primarily in the United States, Canada, Mexico and South America. The non-residential, residential, agricultural and infrastructure markets we serve are affected by the availability of credit, lending practices, interest rates and unemployment rates. Demand for new homes, farm income, commercial development and highway infrastructure spending have a direct impact on our financial condition and results of operations. Accordingly, the following factors may have a direct impact on our business in the markets in which our products are sold:
| • | the strength of the economy; |
| • | the amount and type of non-residential and residential construction; |
| • | funding for infrastructure spending; |
| • | farm income and agricultural land values; |
| • | inventory of improved housing lots; |
| • | changes in raw material prices; |
| • | the availability and cost of credit; |
| • | non-residential occupancy rates; |
| • | commodity prices; and |
| • | demographic factors such as population growth and household formation. |
Product Pricing
The price of our products is impacted by competitive pricing dynamics in our industry as well as by raw material input costs. Our industry is highly competitive and the sales prices for our products may vary based on the sales policies of our competitors. Raw material costs represent a significant portion of the cost of goods sold for our pipe products, or Pipe. We aim to increase our product selling prices in order to cover raw material price increases, but the inability to do so could impact our profitability. Movements in raw material costs and resulting changes in the selling prices may also impact changes in period-to-period comparisons of net sales.
Material Conversion
Our HDPE and PP pipe and related water management product lines compete with other manufacturers of corrugated polyethylene pipe as well as manufacturers of alternative products made with traditional materials, such as concrete, steel and PVC. Our net sales are driven by market trends, including the continued increase in adoption of thermoplastic corrugated pipe products as a replacement for traditional materials. Thermoplastic corrugated pipe is generally lighter, more durable, more cost effective and easier to install than comparable products made from traditional materials. High performance thermoplastic corrugated pipe represented approximately 25% of the total storm sewer market in 2012, up from what we believe was less than 10% ten years ago and less than 1% twenty years ago. We believe this trend will continue as customers continue to acknowledge the superior attributes and compelling value proposition of our thermoplastic products and expanded regulatory approvals allow for their use in new markets and geographies. In addition, we believe that the recent introduction of PP pipe products will also help accelerate conversion given the additional applications for which our PP pipe products can be used.
We believe the adoption of HDPE and PP pipe outside of the United States and Europe is still in its early stages and represents a significant opportunity for us to continue to increase the conversion to our products from traditional products in these markets, including Canada, Mexico and South America where we operate.
- 53 -
Table of Contents
Growth in Allied Products
Our Allied Products include storm and septic chambers, PVC drainage structures, fittings and filters and water separators. These products complement our pipe product lines and allow us to offer a comprehensive water management solution to our customers and drive organic growth. Our leading market position in pipe products allows us to cross-sell Allied Products effectively. Our comprehensive offering of Allied Products also helps us increase pipe sales in certain markets. Our Allied Products typically carry higher gross margins as compared to our pipe product lines and are less sensitive to increases in resin prices since resin prices represent a smaller percentage of the cost of goods sold for Allied Products.
Our leading position in the pipe market has allowed us to increase organic growth of our Allied Products. We also expect to expand our Allied Product offerings through acquisitions. Sales of Allied Products have increased from $201.4 million for the nine months ended December 31, 2012 to $215.1 million for the nine months ended December 31, 2013. For fiscal years 2011, 2012 and 2013, we generated sales of Allied Products of $195.3 million, $230.7 million and $248.6 million, respectively.
Raw Material Costs
Our raw material costs and product selling prices fluctuate with changes in the prices of resins utilized in production. Virgin and recycled resins, which are derived either directly or indirectly from crude oil derivatives and natural gas liquids, currently account for over 60% of our cost of goods sold for pipe products. Raw materials account for a significantly smaller percentage of the cost of our Allied Products. We actively manage our resin purchases and typically pass fluctuations in the cost of resin through to our customers in order to maximize our profitability. Fluctuations in the price of crude oil and natural gas prices may impact the cost of resin. For example, the weighted average market cost for the types of resin that we use increased by approximately 7.3% and 0.9% for fiscal years 2012 and 2013, respectively. In addition, unanticipated changes in and disruptions to existing ethylene or polyethylene capacities could also significantly increase resin prices, often within a short period of time, even if crude oil and natural gas prices remain low. Our ability to pass through raw material price increases to our customers may, in some cases, lag the increase in our costs of goods sold.
We currently purchase in excess of 700 million pounds of virgin and recycled resin annually from over 450 suppliers in North America. As a high-volume buyer of resin, we are able to achieve economies of scale to negotiate favorable terms and pricing. Our purchasing strategies differ based on the material (virgin resin versus recycled material) ordered for delivery to our production locations. The price movements of the different materials also vary, resulting in the need to use a number of strategies to reduce volatility and successfully pass on cost increases to our customer through timely selling price increases when needed.
Our raw material strategies for managing our cost of goods sold include the following:
| • | increasing the use of less price-volatile recycled HDPE resin in our pipe products in place of virgin resin; |
| • | internally processing an increasing percentage of our recycled HDPE resin in order to closely monitor quality and minimize costs (approximately 64% of our recycled HDPE resin was internally processed in fiscal year 2014); |
| • | managing a resin hedging program targeting monthly fixed price contracts that hedge approximately 50% of our anticipated virgin HDPE resin purchases on a rolling 12 month basis; and |
| • | implementing financial hedges for propylene, with a goal of hedging a similar portion of our anticipated virgin PP resin purchases on a rolling 12 month basis. |
The goal of these strategies is to reduce the volatility of raw material costs in the future.
- 54 -
Table of Contents
We also consume a large amount of energy and other petroleum products in our operations, including the electricity we use in our manufacturing process as well as the diesel fuel consumed in delivering a significant volume of products to our customers through our in-house fleet. As a result, our operating profit also depends upon our ability to manage the cost of the energy and fuel we require, as well as our ability to pass through increased prices or surcharges to our customers.
Seasonality
Our operating results are impacted by seasonality. Historically, sales of our products have been higher in the first and second quarters of each fiscal year due to favorable weather and longer daylight conditions accelerating construction project activity during these periods while fourth quarter results are impacted by the timing of spring in the northern domestic regions and Canada. Seasonal variations in operating results may also be significantly impacted by inclement weather conditions, such as cold or wet weather, which can delay projects, resulting in decreased net sales for one or more quarters, but we believe that these delayed projects generally result in increased net sales during subsequent quarters.
In the non-residential, residential and infrastructure markets in the northern United States and Canada, the construction season typically begins to gain momentum in late March and lasts through November, before winter sets in, significantly slowing the construction markets. In the southern and western United States, Mexico, Central America and South America, the construction markets are less seasonal. The agricultural drainage market is concentrated in the early spring just prior to planting and in the fall just after crops are harvested prior to freezing of the ground in winter.
Currency Exchange Rates
Although we sell and manufacture our products in many countries, our sales and production costs are primarily denominated in U.S. dollars. We have wholly–owned facilities in Canada and Puerto Rico and joint venture facilities in Mexico, Chile, Brazil, Argentina, Colombia and Peru. The functional currencies in the areas in which we have wholly–owned facilities and joint venture facilities are the Canadian dollar, Euro, Mexican peso, Chilean peso, Brazilian real, Argentine peso and Colombian peso, respectively. We have not hedged foreign currency exposures related to transactions denominated in currencies other than U.S. dollars. From time to time, we use derivatives to reduce our exposure to currency fluctuations. In 2013, we entered into Euro-denominated forwards to hedge transactions related to the procurement of new equipment, which expired prior to December 31, 2013. Also in 2013, our South American Joint Venture entered into multiple non-deliverable forward contracts to reduce its exposure to fluctuations in the U.S. dollar relative to the Chile peso, Argentina peso, Colombia peso and Brazil real.
Description of our Segments
We operate a geographically diverse business, serving customers in approximately 90 countries. For fiscal year 2013, approximately 86% ($877.7 million) of net sales were attributable to customers located in the United States and approximately 14% ($139.3 million) of net sales were attributable to customers outside of the United States.
Our operations are organized into two reportable segments based on the markets we serve: Domestic and International. We generate a greater proportion of our net sales and gross profit in our Domestic segment, which consists of all regions of the United States. We expect the percentage of total net sales and gross profit derived from our International segment to continue to increase in future periods as we continue to expand globally. See Note 21, “Business Segments Information,” to our audited consolidated financial statements included elsewhere in this prospectus.
- 55 -
Table of Contents
Domestic
In the United States, the markets we serve were strong through 2007, but slowed significantly beginning in 2008 in tandem with the decline in general economic conditions in the United States associated with the global financial crisis. Since 2011, a modest recovery in the markets in the United States has had a favorable impact on our product sales. Our operating results have been, and will continue to be, impacted by macroeconomic trends in the United States. For fiscal years 2011, 2012 and 2013, we generated net sales attributable to our Domestic segment of $738.4 million, $888.7 million and $877.7 million, respectively, and for the nine months ended December 31, 2012 and 2013, we generated net sales attributable to our Domestic segment of $718.9 million and $778.3 million, respectively.
International
Our International segment manufactures and markets products in regions outside of the United States, with a growth strategy focused on our owned facilities in Canada and those markets serviced through our joint ventures in Mexico, Central America and South America. Pipe manufactured in these countries is primarily sold into the same region. Our joint venture strategy has provided us with local and regional access to new markets. The outlook for our International segment has improved. Since 2011, a modest recovery in the international markets has had a favorable impact on our product sales, which experienced year-over-year growth in each of fiscal years 2012 and 2013. For fiscal years 2011, 2012 and 2013, we generated net sales attributable to our International segment of $124.8 million, $125.1 million and $139.3 million, respectively, and for the nine months ended December 31, 2012 and 2013, we generated net sales attributable to our International segment of $113.6 million and $109.4 million, respectively. Net sales of our South American Joint Venture are accounted for under the equity method and not consolidated for financial reporting purposes. These unconsolidated sales were $41.9 million, $57.7 million and $64.8 million in fiscal years 2011, 2012 and 2013, respectively, and were $47.5 million and $48.3 million for the nine months ended December 31, 2012 and 2013, respectively.
Components of Results of Operations
Net sales
Net sales consist of the consideration received or receivable for the sale of products in the ordinary course of our business and is presented net of rebates and discounts. We derive our net sales from selling Pipe and Allied Products. We ship products to customers primarily by our internal fleet of trucks with a much smaller portion being shipped by third-party carriers. Net sales are recognized when delivery has occurred or services have been rendered, price to the buyer is fixed and determinable and collectability is reasonably assured. In fiscal year 2013, we served approximately 17,000 customers and no single customer generated more than 10% of our total net sales.
Cost of goods sold
Cost of goods sold consists of the direct cost of raw materials and labor used in the manufacture of our products as well as indirect costs such as labor, depreciation, insurance, supplies, tools, repairs and shipping and handling. Our principal products are manufactured primarily from polyethylene and polypropylene resins with chemical additives that enable the end products to better resist weathering, ultraviolet degradation and chemical exposure. For Pipe, the majority of the cost to manufacture and deliver the products are variable in nature including raw materials, processing costs (including direct labor) and delivery costs (freight). Our fixed production costs (including facility overhead, depreciation, etc.) currently represent approximately 10% of net sales. For Allied Products, cost of goods sold varies by product line and consists of raw material/purchase costs, processing costs and delivery costs.
Selling Expenses
Selling expenses consist of personnel costs (salaries, benefits and variable sales commissions), travel and entertainment expenses, marketing, promotion and advertising expenses, as well as bad debt provisions.
- 56 -
Table of Contents
General and Administrative Expenses
General and administrative expenses consist of personnel costs (salaries, benefits and other personnel-related expenses, including stock-based compensation), recruitment and relocation expenses, accounting and legal fees, business travel expenses, rent and utilities for the administrative offices, director fees, investor relations, membership fees, office supplies, insurance and other miscellaneous expenses.
Intangibles Amortization
Intangibles amortization consists of the amortization of intangibles purchased as part of business combinations, acquired technology, patents and technology licenses, which are amortized using the straight-line method over their estimated useful lives.
Interest Expense
Interest expense consist of interest payment on our Credit Facilities, including our Senior Loan Facilities, Senior Notes and the amortizing of deferred financing costs related to debt borrowings. See Note 11 to our consolidated financial statements included elsewhere in this prospectus.
Income Tax Expense
Income tax expense consists of federal, state, local and foreign taxes based on income in multiple jurisdictions, including the United States, Canada, Mexico, Chile, Brazil and Puerto Rico. We expect our effective tax rate to decrease over time as our earnings grow reducing the impact of permanent M’s in our Domestic tax calculations.
EBITDA and Adjusted EBITDA
EBITDA and Adjusted EBITDA, including Segment EBITDA and Segment Adjusted EBITDA, which are non-GAAP financial measures, have been presented in this prospectus as supplemental measures of financial performance that are not required by, or presented in accordance with generally accepted accounting principles or GAAP. We calculate EBITDA as net income attributable to ADS before interest, income taxes, depreciation and amortization. We calculate Adjusted EBITDA as EBITDA before stock-based compensation expense, non-cash charges and certain other expenses.
EBITDA and Adjusted EBITDA are included in this prospectus because they are key metrics used by management and our board of directors to assess our financial performance. EBITDA and Adjusted EBITDA are frequently used by analysts, investors and other interested parties to evaluate companies in our industry. In addition to covenant compliance and executive performance evaluations, we use Adjusted EBITDA to supplement GAAP measures of performance to evaluate the effectiveness of our business strategies, to make budgeting decisions and to compare our performance against that of other peer companies using similar measures.
EBITDA and Adjusted EBITDA are not GAAP measures of our financial performance or liquidity and should not be considered as alternatives to net income as a measure of financial performance or cash flows from operations as a measure of liquidity, or any other performance measure derived in accordance with GAAP and they should not be construed as an inference that our future results will be unaffected by unusual or non-recurring items. Additionally, EBITDA and Adjusted EBITDA are not intended to be measures of free cash flow for management’s discretionary use, as they do not reflect certain cash requirements such as tax payments, debt service requirements, capital expenditures and certain other cash costs that may recur in the future. EBITDA and Adjusted EBITDA contain certain other limitations, including the failure to reflect our cash expenditures, cash requirements for working capital needs and cash costs to replace assets being depreciated and amortized. In
- 57 -
Table of Contents
evaluating Adjusted EBITDA, you should be aware that in the future we will incur expenses that are the same as or similar to some of the adjustments in this presentation, such as stock based compensation expense, derivative fair value adjustments, and foreign currency transaction losses. Our presentation of Adjusted EBITDA should not be construed to imply that our future results will be unaffected by any such adjustments. Management compensates for these limitations by relying on our GAAP results in addition to using EBITDA and Adjusted EBITDA supplementally. Our measures of EBITDA and Adjusted EBITDA are not necessarily comparable to other similarly titled captions of other companies due to different methods of calculation.
The following table presents a reconciliation of EBITDA and Adjusted EBITDA to Net income, the most comparable GAAP measure, for each of the periods indicated:
| Fiscal Year Ended March 31, |
Nine Months Ended December 31, |
|||||||||||||||||||
| (Amounts in thousands) | 2011 | 2012 | 2013 | 2012 | 2013 | |||||||||||||||
| Net income attributable to ADS |
$ | 5,996 | $ | 43,260 | $ | 28,159 | $ | 31,608 | $ | 23,294 | ||||||||||
| Depreciation and amortization (a) |
56,327 | 59,356 | 56,926 | 42,188 | 43,076 | |||||||||||||||
| Interest expense, net |
27,121 | 21,837 | 16,095 | 12,465 | 11,860 | |||||||||||||||
| Income tax expense |
4,053 | 27,064 | 16,894 | 20,112 | 40,845 | |||||||||||||||
|
|
|
|
|
|
|
|
|
|
|
|||||||||||
| EBITDA |
93,497 | 151,517 | 118,074 | 106,373 | 119,075 | |||||||||||||||
| Derivative fair value adjustments (b) |
(1,365 | ) | 2,315 | (4 | ) | 220 | 54 | |||||||||||||
| Foreign currency transaction losses (c) |
332 | 378 | 1,085 | 659 | 251 | |||||||||||||||
| Gain on sale of Septic Chamber business (d) |
— | (44,634 | ) | — | — | — | ||||||||||||||
| Unconsolidated affiliates interest and tax (e) |
624 | 915 | 729 | 488 | 347 | |||||||||||||||
| One-time management fee to minority interest holder (f) |
— | — | — | — | 739 | |||||||||||||||
| Stock based compensation (g) |
2,725 | 1,425 | 2,592 | 1,207 | 2,640 | |||||||||||||||
| ESOP deferred stock based compensation (h) |
4,564 | 4,957 | 7,283 | 6,784 | 7,343 | |||||||||||||||
| Transaction costs (i) |
403 | — | — | — | 118 | |||||||||||||||
|
|
|
|
|
|
|
|
|
|
|
|||||||||||
| Adjusted EBITDA |
$ | 100,780 | $ | 116,873 | $ | 129,759 | $ | 115,731 | $ | 130,567 | ||||||||||
|
|
|
|
|
|
|
|
|
|
|
|||||||||||
| (a) | Includes our proportionate share of depreciation and amortization expense of $552, $985 and $1,321 related to our South American Joint Venture and our BaySaver Joint Venture, which amounts are included in equity in net income of unconsolidated affiliates in our consolidated statements of income for fiscal years 2011, 2012 and 2013, respectively, and $977 and $1,031 included in equity in net income of unconsolidated affiliates in our condensed consolidated statements of income for the nine months ended December 31, 2012 and 2013, respectively. Depreciation and amortization expense for fiscal year 2012 also includes a charge of $3,200 related to the impairment of one of our trademarks. |
| (b) | Represents the non-cash gains and losses arising from changes in mark-to-market values for derivative contracts related to diesel fuel and interest rate swaps. The impact of resin physical and financial derivatives is included in cost of goods sold. |
| (c) | Represents the gains and losses incurred on purchases, sales and intercompany loans and dividends denominated in non-functional currencies. |
| (d) | Represents a gain recognized on the sale of our septic chamber business in January 2012. |
| (e) | Represents our proportional share of income taxes and interest related to our South American Joint Venture and our BaySaver Joint Venture, which are accounted for under the equity method of accounting. |
| (f) | Represents management fee paid to a minority interest holder of a consolidated subsidiary. |
| (g) | Represents the non-cash stock based compensation cost related to our stock options and restricted stock awards. |
| (h) | Represents the non-cash stock based compensation expense attributable to the shares of convertible preferred stock allocated to employee ESOP accounts during the applicable period. |
| (i) | Represents expenses recorded related to legal, accounting and other professional fees incurred in connection with our recent debt refinancing and in connection with this offering. |
- 58 -
Table of Contents
The following table presents a reconciliation of Segment EBITDA and Segment Adjusted EBITDA to Net income, the most comparable GAAP measure, for each of the periods indicated:
| Fiscal Year Ended March 31, |
Nine Months Ended December 31, |
|||||||||||||||||||||||||||||||||||||||
| (Amounts in thousands) | 2011 | 2012 | 2013 | 2012 | 2013 | |||||||||||||||||||||||||||||||||||
| Domestic | International | Domestic | International | Domestic | International | Domestic | International | Domestic | International | |||||||||||||||||||||||||||||||
| Net income attributable to ADS |
$ | (1,492 | ) | $ | 7,488 | $ | 37,894 | $ | 5,366 | $ | 18,332 | $ | 9,827 | $ | 22,700 | $ | 8,908 | $ | 18,835 | $ | 4,459 | |||||||||||||||||||
| Depreciation and amortization (a) |
51,237 | 5,090 | 52,832 | 6,524 | 50,691 | 6,235 | 37,653 | 4,535 | 38,439 | 4,637 | ||||||||||||||||||||||||||||||
| Interest expense, net |
26,870 | 251 | 21,597 | 240 | 16,045 | 50 | 12,430 | 35 | 11,815 | 45 | ||||||||||||||||||||||||||||||
| Income tax expense |
2,088 | 1,965 | 25,855 | 1,209 | 14,787 | 2,107 | 17,639 | 2,473 | 38,998 | 1,847 | ||||||||||||||||||||||||||||||
|
|
|
|
|
|
|
|
|
|
|
|
|
|
|
|
|
|
|
|
|
|||||||||||||||||||||
| Segment EBITDA |
78,703 | 14,794 | 138,178 | 13,339 | 99,855 | 18,219 | 90,422 | 15,951 | 108,087 | 10,988 | ||||||||||||||||||||||||||||||
| Derivative fair value adjustments (b) |
(1,365 | ) | — | 2,315 | — | (4 | ) | — | 220 | — | 54 | — | ||||||||||||||||||||||||||||
| Foreign currency transaction losses (c) |
— | 332 | — | 378 | — | 1,085 | — | 659 | — | 251 | ||||||||||||||||||||||||||||||
| Gain on sale of Septic Chamber business (d) |
— | — | (44,634 | ) | — | — | — | — | ||||||||||||||||||||||||||||||||
| Unconsolidated affiliates interest and tax (e) |
— | 624 | — | 915 | — | 729 | — | 488 | — | 347 | ||||||||||||||||||||||||||||||
| Management fee to minority interest holder JV (f) |
— | — | — | — | — | — | — | — | — | 739 | ||||||||||||||||||||||||||||||
| Stock based compensation (g) |
2,725 | — | 1,425 | — | 2,592 | — | 1,207 | — | 2,640 | — | ||||||||||||||||||||||||||||||
| ESOP deferred compensation (h) |
4,564 | — | 4,957 | — | 7,283 | — | 6,784 | — | 7,343 | — | ||||||||||||||||||||||||||||||
| Transaction costs (i) |
403 | — | — | — | — | — | — | — | 118 | — | ||||||||||||||||||||||||||||||
|
|
|
|
|
|
|
|
|
|
|
|
|
|
|
|
|
|
|
|
|
|||||||||||||||||||||
| Segment Adjusted EBITDA |
$ | 85,030 | $ | 15,750 | $ | 102,241 | $ | 14,632 | $ | 109,726 | $ | 20,033 | $ | 98,633 | $ | 17,098 | $ | 118,242 | $ | 12,325 | ||||||||||||||||||||
|
|
|
|
|
|
|
|
|
|
|
|
|
|
|
|
|
|
|
|
|
|||||||||||||||||||||
| (a) | Includes our proportionate share of depreciation and amortization expense of $552, $985 and $1,321 related to our South American Joint Venture and our BaySaver Joint Venture, which amounts are included in equity in net income of unconsolidated affiliates in our consolidated statements of income for fiscal years 2011, 2012 and 2013, respectively, and $977 and $1,031 included in equity in net income of unconsolidated affiliates in our condensed consolidated statements of income for the nine months ended December 31, 2012 and 2013, respectively. Depreciation and amortization expense for fiscal year 2012 also includes a charge of $3,200 related to the impairment of one of our trademarks. |
| (b) | Represents the non-cash gains and losses arising from changes in mark-to-market values for derivative contracts related to diesel fuel and interest rate swaps. The impact of resin physical and financial derivatives is included in cost of goods sold. |
| (c) | Represents the gains and losses incurred on purchases, sales and intercompany loans and dividends denominated in non-functional currencies. |
| (d) | Represents a gain recognized on the sale of our septic chamber business in January 2012. |
| (e) | Represents our proportional share of income taxes and interest related to our South American Joint Venture and our BaySaver Joint Venture, which are accounted for under the equity method of accounting. |
| (f) | Represents management fee paid to a minority interest holder of a consolidated subsidiary. |
| (g) | Represents the non-cash stock based compensation cost related to our stock options and restricted stock awards. |
| (h) | Represents the non-cash stock based compensation expense attributable to the shares of convertible preferred stock allocated to employee ESOP accounts during the applicable period. |
| (i) | Represents expenses recorded related to legal, accounting and other professional fees incurred in connection with our recent debt refinancing and in connection with this offering. |
System-Wide Net Sales
System-Wide Net Sales is a non-GAAP measure which equals the sum of the net sales of our Domestic and International segments plus all net sales from our unconsolidated joint ventures (our South American Joint Venture and our BaySaver Joint Venture). We use this metric to measure the overall performance of our business across all of our geographies and markets we serve.
Our South American Joint Venture is managed as an integral part of our International segment and our BaySaver Joint Venture is managed as an integral part of our Domestic segment. However, they are not consolidated under GAAP. System-Wide Net Sales is prepared as if our South American Joint Venture and our BaySaver Joint Venture were accounted for as consolidated subsidiaries for management and segment reporting purposes.
- 59 -
Table of Contents
The reconciliation of our System-Wide Net Sales to net sales is as follows:
| Fiscal Year Ended March 31, |
Nine Months Ended December 31, |
|||||||||||||||||||
| (Amounts in thousands) | 2011 | 2012 | 2013 | 2012 | 2013 | |||||||||||||||
| Reconciliation of System-Wide Net Sales to Net Sales: |
||||||||||||||||||||
| Net sales |
$ | 863,138 | $ | 1,013,756 | $ | 1,017,041 | $ | 832,565 | $ | 887,777 | ||||||||||
| Net sales associated with our unconsolidated affiliates: |
||||||||||||||||||||
| South American Joint Venture (a) |
41,872 | 57,687 | 64,834 | 47,539 | 48,314 | |||||||||||||||
| BaySaver Joint Venture (b) |
— | — | — | — | 3,592 | |||||||||||||||
|
|
|
|
|
|
|
|
|
|
|
|||||||||||
| System-Wide Net Sales |
$ | 905,010 | $ | 1,071,443 | $ | 1,081,875 | $ | 880,104 | $ | 939,683 | ||||||||||
|
|
|
|
|
|
|
|
|
|
|
|||||||||||
| (a) | On July 31, 2009, we entered into an arrangement to form our South American Joint Venture. |
| (b) | On July 15, 2013, we entered into an arrangement to form our BaySaver Joint Venture. |
Results of Operations
Nine Months Ended December 31, 2013 Compared with Nine Months Ended December 31, 2012
The following table summarizes certain financial information relating to our operating results that have been derived from our consolidated financial statements for the nine months ended December 31, 2013 and 2012. Also included is certain information relating to the operating results as a percentage of net sales. We believe this presentation is useful to investors in comparing historical results.
| (Amounts in thousands) | Nine Months Ended December 31, 2012 |
% of Net Sales |
Nine Months Ended December 31, 2013 |
% of Net Sales |
% Variance |
|||||||||||||||
| Consolidated Statements of Income data: |
||||||||||||||||||||
| Net sales |
$ | 832,565 | 100.0 | % | $ | 887,777 | 100.0 | % | 6.6 | % | ||||||||||
| Cost of goods sold |
659,283 | 79.2 | 698,791 | 78.7 | 6.0 | |||||||||||||||
|
|
|
|
|
|
|
|
|
|
|
|||||||||||
| Gross profit |
173,282 | 20.8 | 188,986 | 21.3 | 9.1 | |||||||||||||||
| Selling expenses |
52,847 | 6.3 | 52,433 | 5.9 | (0.8 | ) | ||||||||||||||
| General and administrative expenses |
48,913 | 5.9 | 54,354 | 6.1 | 11.1 | |||||||||||||||
| Gain on sale of assets/business |
(2,210 | ) | (0.3 | ) | (4,848 | ) | (0.5 | ) | (119.4 | ) | ||||||||||
| Intangible amortization |
8,119 | 1.0 | 8,576 | 1.0 | 5.6 | |||||||||||||||
|
|
|
|
|
|
|
|
|
|
|
|||||||||||
| Income from operations |
65,613 | 7.9 | 78,471 | 8.8 | 19.6 | |||||||||||||||
| Interest expense |
12,465 | 1.5 | 11,860 | 1.3 | (4.9 | ) | ||||||||||||||
| Other miscellaneous (income) expenses, net |
176 | 0.0 | 398 | 0.0 | 126.1 | |||||||||||||||
|
|
|
|
|
|
|
|
|
|
|
|||||||||||
| Income before income taxes |
52,972 | 6.4 | 66,213 | 7.5 | 25.0 | |||||||||||||||
| Income tax expense |
20,112 | 2.4 | 40,845 | 4.6 | 103.1 | |||||||||||||||
| Equity in net (income) loss of unconsolidated affiliates |
(402 | ) | (0.0 | ) | 714 | 0.1 | (277.6 | ) | ||||||||||||
|
|
|
|
|
|
|
|
|
|
|
|||||||||||
| Net income |
33,262 | 4.0 | 24,654 | 2.8 | (25.9 | ) | ||||||||||||||
| Less net income attributable to the non-controlling interests |
1,654 | 0.2 | 1,360 | 0.2 | (17.8 | ) | ||||||||||||||
|
|
|
|
|
|
|
|
|
|
|
|||||||||||
| Net income attributable to ADS |
$ | 31,608 | 3.8 | % | $ | 23,294 | 2.6 | % | (26.3 | )% | ||||||||||
|
|
|
|
|
|
|
|
|
|
|
|||||||||||
| Other financial data: |
||||||||||||||||||||
| Adjusted EBITDA |
115,731 | 13.9 | % | 130,567 | 14.7 | % | 12.8 | % | ||||||||||||
| System-Wide Net Sales |
880,104 | 105.7 | % | 939,683 | 105.8 | % | 6.8 | % | ||||||||||||
- 60 -
Table of Contents
Net sales
Net sales totaled $887.8 million in the first nine months of fiscal year 2014, increasing $55.2 million, or 6.6%, as compared to the same period in fiscal year 2013. Our Domestic sales increased $59.4 million, or 8.3%, as compared to the same period in fiscal year 2013 due to increases in Pipe and Allied Product sales of $45.5 million, or 8.4%, and $13.9 million, or 7.7%, respectively. Continued strong recovery in our markets, impacted by an increase in residential construction, modest increases in non-residential construction and further gains from conversion to our products from traditional products, were the primary drivers of the increase in the volume of Domestic Pipe and Allied Product sales. Pipe selling prices remained flat as compared to the prior year. The increase in Domestic Pipe and Allied Product sales was partially offset by lower International sales, which declined $4.2 million, or 3.7%, to $109.4 million in the first nine months of fiscal year 2014 as compared to $113.6 million in the same period in the prior year. International Pipe sales were primarily lower in Mexico due to the impact of the loss of a national certification (which has since been regained in December 2013) and in Canada due to weather conditions and slower construction markets. System-Wide Net Sales were $939.7 million in the first nine months of fiscal year 2014, an increase of $59.6 million, or 6.8%, over System-Wide Net Sales of $880.1 million in the first nine months of fiscal year 2013. Net sales at our South American Joint Venture were relatively flat in first nine months of fiscal year 2014.
Gross profit
Gross profit increased $15.7 million, or 9.1%, to $189.0 million during the first nine months of fiscal year 2014 as compared to $173.3 million during the same period in fiscal year 2013. The increase in gross profit was primarily driven by growth in Domestic Pipe and Allied Product sales which resulted in an increase in Domestic gross profit of $17.9 million, or 12.1%, in the first nine months of fiscal year 2014 compared to the same period in fiscal year 2013. Gross profit from our International segment decreased $2.2 million or 8.4% due to lower sales volume in Canada and Mexico. Gross profit as a percentage of net sales, which we refer to as gross margin, increased to 21.3% from 20.8% due primarily to increased sales of Allied Products, which typically carry a higher gross margin, as well as lower Domestic freight costs. Allied Products sales grew 6.8% in the first nine months of fiscal year 2014 compared to Pipe sales growing 6.6% in the same period. Domestic freight costs declined to 9.7% of Domestic net sales in the first nine months of fiscal year 2014 as compared to 10.3% of Domestic net sales in the same period in fiscal year 2013. The decrease in Domestic freight costs was partially offset by increased Domestic Pipe raw material prices of 3.9% due to higher virgin raw material prices, which we were not able to immediately pass through to customers during the period.
Selling expenses
Selling expenses decreased $0.4 million, or 0.8%, to $52.4 million during the first nine months of fiscal year 2014 compared to $52.8 million in fiscal year 2013. As a percentage of net sales, selling expenses totaled 5.9% of net sales in fiscal year 2014 compared to 6.3% of net sales in fiscal year 2013. Selling expenses were impacted by lower Domestic field selling and customer services expenses of $0.7 million which were offset by an increase in International commissions of $0.3 million during the period.
General and administrative expenses
General and administrative expenses increased $5.4 million, or 11.1%, to $54.4 million in the first nine months of fiscal year 2014 compared to $49.0 million in the first nine months of fiscal year 2013. As a percentage of net sales, general and administrative expenses totaled 6.1% of net sales in fiscal year 2014 compared to 5.9% of net sales in fiscal year 2013. This increase was due to non-cash stock based compensation expense which increased by $1.4 million, increases in personnel costs of $3.0 million due to additional headcount and compensation tied to company performance, higher legal and consulting fees of $0.8 million and other miscellaneous increases of $0.2 million.
- 61 -
Table of Contents
Intangibles amortization
Intangibles amortization totaled $8.6 million in the first nine months of fiscal year 2014 compared to $8.1 million in the first nine months of fiscal year 2013. The $0.5 million increase was due to the amortization of intangibles from recent acquisitions.
Interest expense
Interest expense decreased $0.6 million, or 4.9%, to $11.9 million in the first nine months of fiscal year 2014 compared to $12.5 million in the first nine months of fiscal year 2013. The decrease was due to a combination of lower average debt and lower interest rates on our Senior Loan Facilities and Senior Notes in fiscal year 2014 compared to fiscal year 2013.
Other miscellaneous (income) expenses, net
Our miscellaneous (income)/expense increased $0.2 million in the first nine months of fiscal year 2014 to net expense of $0.4 million as other miscellaneous expenses were up $0.2 million in the first nine months of fiscal year 2014.
Income tax expense
The provision for income taxes totaled $40.8 million in the first nine months of fiscal year 2014 compared to $20.1 million in the first nine months of fiscal year 2013, an increase of $20.7 million or 103.1%. Our effective tax rate was 61.7% in the first nine months of fiscal year 2014 compared to 38.0% in same period for fiscal year 2013. The increase in our effective tax rate was primarily driven by the expected special dividend payment to participants in the ESOP, which increased our effective tax rate by 19%.
Income attributed to non-controlling interests
Income attributed to non-controlling interests decreased $0.3, or 17.8%, to $1.4 million in the first nine months of fiscal year 2014 compared to $1.7 million in the first nine months of fiscal year 2013. Non-controlling interests are held in our International operations which generated lower earnings in the first nine months of fiscal year 2014 compared to the first nine months of fiscal year 2013.
Net income attributed to ADS
Net income attributable to ADS was $23.3 million in the first nine months of fiscal year 2014, a decrease of $8.3 million, or 26.3%, compared to the same period in fiscal year 2013.
Adjusted EBITDA
Adjusted EBITDA totaled $130.6 million in the first nine months of fiscal year 2014, an increase of $14.8 million, or 12.8%, compared to $115.7 million in the first nine months of fiscal year 2013. Domestic Adjusted EBITDA increased $19.6 million, or 19.9%, to $118.2 million in the first nine months of fiscal year 2014 compared to $98.6 million in the same period in fiscal year 2013. International Adjusted EBITDA declined $4.8 million in the first nine months of fiscal year 2014 to $12.3 million compared to $17.1 million in the first nine months of fiscal year 2013. Adjusted EBITDA as a percentage of net sales increased to 14.7% in the first nine months of fiscal year 2014 compared to 13.9% in the same period of fiscal year 2013.
- 62 -
Table of Contents
Fiscal Year Ended March 31, 2013 Compared with Fiscal Year Ended March 31, 2012
The following table summarizes certain financial information relating to our operating results that have been derived from our consolidated financial statements for fiscal years 2013 and 2012. Also included is certain information relating to the operating results as a percentage of net sales. We believe this presentation is useful to investors in comparing historical results.
| (Amounts in thousands) | Fiscal Year Ended March 31, 2012 |
% of Net Sales |
Fiscal Year Ended March 31, 2013 |
% of Net Sales |
% Variance |
|||||||||||||||
| Consolidated Statements of Income data: |
||||||||||||||||||||
| Net sales |
$ | 1,013,756 | 100.0 | % | $ | 1,017,041 | 100.0 | % | 0.3 | % | ||||||||||
| Cost of goods sold |
818,398 | 80.7 | 807,730 | 79.4 | (1.3 | ) | ||||||||||||||
|
|
|
|
|
|
|
|
|
|
|
|||||||||||
| Gross profit |
195,358 | 19.3 | 209,311 | 20.6 | 7.1 | |||||||||||||||
| Selling expenses |
67,625 | 6.7 | 69,451 | 6.8 | 2.7 | |||||||||||||||
| General and administrative expenses |
65,927 | 6.5 | 67,712 | 6.7 | 2.7 | |||||||||||||||
| Gain on sale of assets/business |
(44,634 | ) | (4.4 | ) | (2,210 | ) | (0.2 | ) | (95.0 | ) | ||||||||||
| Intangible amortization |
11,387 | 1.1 | 11,295 | 1.1 | (0.8 | ) | ||||||||||||||
|
|
|
|
|
|
|
|
|
|
|
|||||||||||
| Income from operations |
95,053 | 9.4 | 63,063 | 6.2 | (33.7 | ) | ||||||||||||||
| Interest expense |
21,837 | 2.2 | 16,095 | 1.6 | (26.3 | ) | ||||||||||||||
| Other miscellaneous (income) expenses, net |
2,425 | 0.2 | 283 | 0.0 | (88.3 | ) | ||||||||||||||
|
|
|
|
|
|
|
|
|
|
|
|||||||||||
| Income before income taxes |
70,791 | 7.0 | 46,685 | 4.6 | (34.1 | ) | ||||||||||||||
| Income tax expense |
27,064 | 2.7 | 16,894 | 1.7 | (37.6 | ) | ||||||||||||||
| Equity in net (income) loss of unconsolidated affiliates |
(704 | ) | (0.1 | ) | (387 | ) | (0.0 | ) | (45.0 | ) | ||||||||||
|
|
|
|
|
|
|
|
|
|
|
|||||||||||
| Net income |
44,431 | 4.4 | 30,178 | 3.0 | (32.1 | ) | ||||||||||||||
| Less net income attributable to the non-controlling interests |
1,171 | 0.1 | 2,019 | 0.2 | 72.4 | |||||||||||||||
|
|
|
|
|
|
|
|
|
|
|
|||||||||||
| Net income attributable to ADS |
$ | 43,260 | 4.3 | % | $ | 28,159 | 2.8 | % | (34.9 | )% | ||||||||||
|
|
|
|
|
|
|
|
|
|
|
|||||||||||
| Other Data: |
||||||||||||||||||||
| Adjusted EBITDA |
116,873 | 11.5 | % | 129,759 | 12.8 | % | 11.0 | % | ||||||||||||
| System-Wide Net Sales |
1,071,443 | 105.7 | % | 1,081,875 | 106.4 | % | 1.0 | % | ||||||||||||
Net sales
Net sales totaled $1,017.0 million in fiscal year 2013, an increase of $3.3 million, or 0.3%, compared to $1,013.8 million in fiscal year 2012. The increase in net sales was attributable primarily to an increase in the selling price of our Domestic Pipe, which contributed $20.5 million to net sales in fiscal year 2013, and an $13.9 million, or 6.6%, increase in sales of Domestic Allied Products, partially offset by a decline in the volume of Domestic Pipe sales in fiscal year 2013. The $45.0 million decline in Domestic Pipe sales volume was partially a result of weather related issues impacting agriculture sales (a late start to spring at the end of fiscal year 2013 delayed the agricultural installation season) and N-12 sales in the midwest and northeast regions of the country. The decline in our sales volume was also attributable to a soft non-residential end market, while partially offset by increased demand from the residential end market and continued conversion to our products from traditional materials. Our International net sales totaled $139.3 million in fiscal year 2013 compared to $125.1 million in fiscal year 2012, an increase of $14.2 million, or 11.4%. Growth was experienced across most international markets, led by Canada, with International Pipe sales increasing $10.2 million, or 9.8%, in fiscal year 2013 compared to fiscal year 2012 and Allied Products increasing $4.0 million, or 18.9%, in fiscal year 2013 compared to fiscal year 2012. System-Wide Net Sales were $1,081.9 million in fiscal year 2013, an increase of $10.5 million, or 1.0%, over System-Wide Net Sales of $1,071.4 million in fiscal year 2012. Net sales at our South American Joint Venture totaled $64.8 million in fiscal year 2013 compared to $57.7 million in fiscal year 2012. Pipe market penetration in Brazil led the increase, partially offset by weaknesses in Pipe sales to the copper mining markets in Chile.
- 63 -
Table of Contents
Gross profit
Gross profit increased $14.0 million, or 7.1%, to $209.3 million during fiscal year 2013 as compared to $195.4 million in fiscal year 2012. Our Domestic gross profit increased $7.2 million in fiscal year 2013 as compared to fiscal year 2012 due to increased volume of Allied Products sales, which contributed additional gross profit of $7.5 million, partially offset by a decrease in the volume of Domestic Pipe sales, which negatively impacted gross profit by $0.3 million. International gross profit increased 27.2%, or $6.8 million, in fiscal year 2013 due to increases of $2.7 million and $4.1 million for Pipe and Allied Products gross profit, respectively. Gross margin increased to 20.6% in fiscal year 2013 from 19.3% in fiscal year 2012 due to increased sales of our higher margin Allied Products as well as increased Pipe gross margins attributable to lower freight costs and increased selling prices. Allied Products sales grew 7.8% in fiscal year 2013 totaling 24.4% of net sales compared to 22.8% in fiscal year 2012 as our market penetration for these products increased. Domestic Pipe selling prices increased 3.3% in fiscal year 2013, with gross margin being partially offset by a 1% increase in raw material prices as compared to fiscal year 2012. Freight costs declined slightly to 9.8% of net sales in fiscal year 2013 as compared to 9.9% of net sales in fiscal year 2012.
Selling expenses
Selling expenses increased $1.8 million, or 2.7%, to $69.5 million during fiscal year 2013 compared to $67.6 million in fiscal year 2012. As a percentage of net sales, selling expenses totaled 6.8% in fiscal year 2013 compared to 6.7% in fiscal year 2013. Commissions increased $0.4 million, field selling expenses increased $1.0 million and customer service expenses increased $0.5 million in fiscal year 2013 as compared to fiscal year 2012.
General and administrative expenses
General and administrative expenses increased $1.8 million, or 2.7%, to $67.7 million during fiscal year 2013 compared to $65.9 million in fiscal year 2012. General and administrative expenses increased to 6.7% of net sales in fiscal year 2013, up from 6.5% of net sales in fiscal year 2012. This increase was due to stock based compensation expense which increased by $1.2 million, higher plant administrative expenses of $0.8 million due to recently opened manufacturing facilities in the agricultural markets and higher other administrative expenses of $1.7 million, partially offset by lower transaction costs of $1.9 million in fiscal year 2013 as compared to fiscal year 2012.
Gain on sale of assets/business
We recognized a gain of $2.2 million in fiscal year 2013 resulting from the sale of our plastic edging product line as compared to a $44.6 million gain recognized in fiscal year 2012 resulting from the sale of our septic chamber product line to Infiltrator Systems. As part of the sale in fiscal year 2012, we entered into a Distribution Agreement to continue to sell septic chambers manufactured by Infiltrator Systems.
Intangibles amortization
Intangibles amortization totaled $11.3 million in fiscal year 2013, down $0.1 million from intangible amortization in fiscal year 2012.
Interest expense
Interest expense decreased $5.7 million, or 26.3%, to $16.1 million during fiscal year 2013 as compared to $21.8 million in fiscal year 2012. The decrease was due to a combination of lower average debt and interest rates in fiscal year 2013 as compared to fiscal year 2012. In fiscal year 2013, ADS achieved a leverage ratio of Adjusted EBITDA to Debt below 3-to-1 which reduced our interest rates by 0.5% for our Senior Loan Facilities and 2.0% for our Senior Notes, resulting in a decrease in interest expense of $3.4 million or 15.6%.
- 64 -
Table of Contents
Other miscellaneous (income) expenses, net
Our miscellaneous (income)/expense decreased $2.1 million in fiscal year 2013 as mark to market losses on our fuel and interest rate hedges of $2.3 million in fiscal year 2012 compared to no change in fiscal year 2013. Earnings from our unconsolidated South American Joint Venture declined $0.3 million in fiscal year 2013 and other miscellaneous expenses increased $0.2 million in fiscal year 2013 as compared to fiscal year 2012.
Income tax expense
The provision for income taxes totaled $16.9 million in fiscal year 2013 compared to $27.1 million in fiscal year 2012, a decrease of $10.2 million, or 37.6%. Our effective tax rate was 35.9% in fiscal year 2013 compared 37.9% in fiscal year 2012. The primary factors for the decline in our effective tax rate were lower state and local taxes (3.0% in fiscal year 2013 compared to 3.6% in fiscal year 2012) and an increase in International income which is taxed at lower rates.
Income attributed to non-controlling interests
Income attributed to non-controlling interests increased $0.8, or 72.4%, to $2.0 million in fiscal year 2013 as compared to $1.2 million in fiscal year 2012. Non-controlling interests are held in our International operations which generated higher earnings in fiscal year 2013 compared to fiscal year 2012.
Net income attributed to ADS
Net income attributable to ADS was $28.2 million in fiscal year 2013, a decrease of $15.1 million, or 34.9%, compared to fiscal year 2012. This decrease was primarily due to the $44.6 million gain from the sale of our U.S. septic chamber business in fiscal year 2012.
Adjusted EBITDA
Adjusted EBITDA totaled $129.8 million in fiscal year 2013, an increase of $12.9 million, or 11.0%, compared to $116.9 million in fiscal year 2012. Domestic Adjusted EBITDA increased $7.5 million, or 7.3%, to $109.7 million in fiscal year 2013 compared to $102.2 million in fiscal year 2012. International Adjusted EBITDA increased $5.4 million in fiscal year 2013 to $20.0 million as compared to $14.6 million in fiscal year 2013. Adjusted EBITDA as a percentage of net sales increased to 12.8% in fiscal year 2013 compared to 11.5% in fiscal year 2012.
- 65 -
Table of Contents
Fiscal Year Ended March 31, 2012 Compared with Fiscal Year Ended March 31, 2011
The following table summarizes certain financial information relating to our operating results that have been derived from our consolidated financial statements for fiscal years 2012 and 2011. Also included is certain information relating to the operating results as a percentage of net sales. We believe this presentation is useful to investors in comparing historical results.
| (Amounts in thousands) | Fiscal Year Ended March 31, 2011 |
% of Net Sales |
Fiscal Year Ended March 31, 2012 |
% of Net Sales |
% Variance |
|||||||||||||||
| Consolidated Statements of Income data: |
||||||||||||||||||||
| Net sales |
$ | 863,138 | 100.0 | % | $ | 1,013,756 | 100.0 | % | 17.5 | % | ||||||||||
| Costs of goods sold |
692,164 | 80.2 | 818,398 | 80.7 | 18.2 | |||||||||||||||
|
|
|
|
|
|
|
|
|
|
|
|||||||||||
| Gross profit |
170,974 | 19.8 | 195,358 | 19.3 | 14.3 | |||||||||||||||
| Selling expenses |
63,103 | 7.3 | 67,625 | 6.7 | 7.2 | |||||||||||||||
| General and administrative expenses |
61,648 | 7.1 | 65,927 | 6.5 | 6.9 | |||||||||||||||
| Gain on sale of assets/business |
— | — | (44,634 | ) | (4.4 | ) | N/A | |||||||||||||
| Intangible amortization |
7,294 | 0.8 | 11,387 | 1.1 | 56.1 | |||||||||||||||
|
|
|
|
|
|
|
|
|
|
|
|||||||||||
| Income from operations |
38,929 | 4.5 | 95,053 | 9.4 | 144.2 | |||||||||||||||
| Interest expense |
27,121 | 3.1 | 21,837 | 2.2 | (19.5 | ) | ||||||||||||||
| Other miscellaneous (income) expenses, net |
(847 | ) | (0.1 | ) | 2,425 | 0.2 | (386.3 | ) | ||||||||||||
|
|
|
|
|
|
|
|
|
|
|
|||||||||||
| Income before income taxes |
12,655 | 1.5 | 70,791 | 7.0 | 459.4 | |||||||||||||||
| Income tax expense |
4,053 | 0.5 | 27,064 | 2.7 | 567.8 | |||||||||||||||
| Equity in net (income) loss of unconsolidated affiliates |
(736 | ) | (0.1 | ) | (704 | ) | (0.1 | ) | (4.3 | ) | ||||||||||
|
|
|
|
|
|
|
|
|
|
|
|||||||||||
| Net income |
9,338 | 1.1 | 44,431 | 4.4 | 375.8 | |||||||||||||||
| Less net income attributable to the non-controlling interests |
3,342 | 0.4 | 1,171 | 0.1 | (65.0 | ) | ||||||||||||||
|
|
|
|
|
|
|
|
|
|
|
|||||||||||
| Net income attributable to ADS |
$ | 5,996 | 0.7 | % | $ | 43,260 | 4.3 | % | 621.5 | % | ||||||||||
|
|
|
|
|
|
|
|
|
|
|
|||||||||||
| Other Data: |
||||||||||||||||||||
| Adjusted EBITDA |
100,780 | 11.7 | % | 116,873 | 11.5 | % | 16.0 | % | ||||||||||||
| System-Wide Net Sales |
905,010 | 104.9 | % | 1,071,443 | 105.7 | % | 18.4 | % | ||||||||||||
Net sales
Net sales totaled $1,013.8 million in fiscal year 2012, an increase of $150.7 million, or 17.5%, compared to $863.1 million in fiscal year 2011. The increase in net sales was attributable primarily to an increase in the selling price of our Domestic Pipe, which contributed $42.4 million to net sales in fiscal year 2012, an increase in Domestic sales of Allied Products of $34.2 million, or 19.5%, and an increase in the volume of Domestic Pipe sales of $64.3 million, as compared to fiscal year 2011. The increase in Domestic Pipe sales volume was a result of favorable weather conditions helped by an early start to spring in the fourth quarter of fiscal year 2012, which resulted in increased demand from the agriculture market, as well as continued conversion to our products from traditional materials. The increase in Domestic Pipe sales volume was partially offset by continued weakness in the non-residential, residential and infrastructure end markets. Our International net sales increased $0.3 million in fiscal year 2012 due to an increase in volume of $1.2 million, or 6.0%, in Allied Products primarily in Canada, and was partially offset by a decline in Pipe volume of $0.9 million, or 0.8%, due to lower Pipe sales in Mexico which were impacted by the loss of a national certification (which has since been regained in December 2013), as compared to fiscal year 2011. System-Wide Net Sales were $1,071.4 million in fiscal year 2012, an increase of $166.4 million, or 18.4%, over System-Wide Net Sales of $905.0 million in fiscal year 2011. Net sales at our South American Joint Venture totaled $57.7 million in fiscal year 2012, an increase of 37.7%, compared to $41.9 million in fiscal year 2011. In addition, the increase in System-Wide Net Sales was aided by increased penetration and increased Pipe sales in Chile, Peru and Brazil.
- 66 -
Table of Contents
Gross profit
Gross profit increased $24.4 million, or 14.3%, to $195.4 million during fiscal year 2012 as compared to $171.0 million in fiscal year 2011. Our Domestic gross profit increased $27.5 million in fiscal year 2012 as compared to fiscal year 2011. International gross profit declined $3.1 million in fiscal year 2012 as compared to fiscal year 2011. Gross margin decreased to 19.3% in fiscal year 2012 from 19.8% in fiscal year 2011 due to lower Allied Products margins, while partially offset by decreased Domestic freight costs. Allied Products margins decreased as a result of the sale of our septic chamber manufacturing business, which resulted in a $4.9 million reduction in gross profit in fiscal year 2012 as compared to fiscal year 2011 and the acquisition of a lower margin precast concrete business. Domestic freight costs as a percentage of Domestic net sales decreased to 10.5% in fiscal year 2012 compared to 11.4% in fiscal year 2011, which was helped by the increased sales mix into the agricultural markets where freight as a percentage of net sales is lower than other markets. Raw material prices increased 7.2% as compared to fiscal year 2011.
Selling expenses
Selling expenses increased $4.5 million, or 7.2%, to $67.6 million during fiscal year 2012 as compared to fiscal year 2011. As a percentage of net sales, selling expenses totaled 6.7% of in fiscal year 2012 compared to 7.3% in fiscal year 2011. Variable selling commissions tied to sales growth represented $2.4 million of the higher selling expenses in fiscal year 2012 compared to fiscal year 2011 while field selling expenses were $2.1 million in fiscal year 2012 as additional sales personnel were added to support the growth in net sales.
General and administrative expenses
General and administrative expenses increased $4.3 million, or 6.9%, to $65.9 million during fiscal year 2012 compared to fiscal year 2011. This increase in fiscal year 2012 as compared to fiscal year 2011 was due to higher corporate administrative expenses of $3.6 million for personnel costs, legal expenses, outside consulting expenses and travel expenses and higher transaction costs of $1.4 million and higher plant administrative expenses of $0.4 million, while partially offset by a $1.3 million decline in stock based compensation expense. General and administrative expenses decreased to 6.5% of net sales in fiscal year 2012 compared to 7.1% of net sales in fiscal year 2011.
Gain on sale of assets/business
We recognized a gain of $44.6 million in fiscal year 2012 resulting from the sale of our septic chamber product line to Infiltrator Systems.
Intangibles amortization
Intangibles amortization totaled $11.4 million in fiscal year 2012, an increase of $4.1 million, or 56.1%, compared to fiscal year 2011. Amortization of intangibles related to new acquisitions and a $3.2 million impairment charge for the Hancor trademark intangible were the factors resulting in the increase.
Interest expense
Interest expense decreased $5.3 million to $21.8 million, or 19.5%, during fiscal year 2012 as compared to $27.1 million in fiscal year 2011. The decrease was primarily due to a $9.5 million make-whole payment made on notes prepaid in October 2010 increasing fiscal year 2011 interest expense being partially offset by higher average debt levels in fiscal year 2012 resulting from our October 2010 recapitalization.
- 67 -
Table of Contents
Other miscellaneous (income) expenses, net
Our miscellaneous (income)/expense increased $3.3 million in fiscal year 2012 as mark to market losses on our fuel and interest rate hedges of $2.3 million in fiscal year 2012 compared to a gain of $1.4 million in fiscal year 2011. Earnings from our South American Joint Venture was flat in fiscal year 2012 and other miscellaneous expenses decreased $0.4 million in fiscal year 2012 as compared to fiscal year 2011.
Income tax expense
The provision for income taxes totaled $27.1 million in fiscal year 2012 compared to $4.1 million in fiscal year 2011. The effective rate for our provision was 37.9% in fiscal year 2012 as compared to 30.3% in fiscal year 2011. Lower effective tax rates in International and decreased Domestic net income in fiscal year 2011 were the major factors impacting the rate change.
Income attributed to non-controlling interests
Income attributed to non-controlling interest totaled $1.2 million in fiscal year 2012 compared to $3.3 million in fiscal year 2011. Lower earnings were generated in these operations resulted in the decrease in our non-controlled portion.
Net income attributed to ADS
Net income attributable to ADS was $43.3 million in fiscal year 2012, an increase of $37.3 million compared to fiscal year 2011. The large one time gain was primarily attributable to the sale of our septic chamber business in fiscal year 2012 of $44.6 million.
Adjusted EBITDA
Adjusted EBITDA totaled $116.9 million in fiscal year 2012, an increase of $16.1 million, or 16.0%, compared to $100.8 million in fiscal year 2011. Domestic Adjusted EBITDA increased $17.2 million or 20.2%, to $102.2 million in fiscal year 2012 compared to $85.0 million in fiscal year 2011. International Adjusted EBITDA decreased $1.1 million in the fiscal year 2012 to $14.6 million compared to $15.7 million in fiscal year 2011. Adjusted EBITDA as a percentage of net sales decreased to 11.5% in fiscal year 2012 compared to 11.7% in fiscal year 2011.
- 68 -
Table of Contents
Results of Operations by Segment
The following table presents our net sales, net sales as a percentage of total net sales, Segment Adjusted EBITDA and Segment Adjusted EBITDA as a percentage of total Adjusted EBITDA by segment for the periods presented.
| Fiscal Year Ended March 31, |
Nine Months Ended December 31, |
|||||||||||||||||||||||||||||||||||||||
| (Amounts in thousands) | 2011 | 2012 | 2013 | 2012 | 2013 | |||||||||||||||||||||||||||||||||||
| Net Sales by Segment |
||||||||||||||||||||||||||||||||||||||||
| Domestic: |
||||||||||||||||||||||||||||||||||||||||
| Pipe |
$ | 562,854 | 65 | % | $ | 678,934 | 67 | % | $ | 654,068 | 64 | % | $ | 539,043 | 65 | % | $ | 584,567 | 66 | % | ||||||||||||||||||||
| Allied Products |
175,529 | 21 | % | 209,736 | 21 | % | 223,676 | 22 | % | 179,890 | 21 | % | 193,763 | 22 | % | |||||||||||||||||||||||||
|
|
|
|
|
|
|
|
|
|
|
|
|
|
|
|
|
|
|
|
|
|||||||||||||||||||||
| 738,383 | 86 | % | 888,670 | 88 | % | 877,744 | 86 | % | 718,933 | 86 | % | 778,330 | 88 | % | ||||||||||||||||||||||||||
| International: |
||||||||||||||||||||||||||||||||||||||||
| Pipe |
104,971 | 12 | % | 104,107 | 10 | % | 114,349 | 11 | % | 92,185 | 11 | % | 88,126 | 10 | % | |||||||||||||||||||||||||
| Allied Products |
19,784 | 2 | % | 20,979 | 2 | % | 24,948 | 3 | % | 21,447 | 3 | % | 21,321 | 2 | % | |||||||||||||||||||||||||
|
|
|
|
|
|
|
|
|
|
|
|
|
|
|
|
|
|
|
|
|
|||||||||||||||||||||
| 124,755 | 14 | % | 125,086 | 12 | % | 139,297 | 14 | % | 113,632 | 14 | % | 109,447 | 12 | % | ||||||||||||||||||||||||||
|
|
|
|
|
|
|
|
|
|
|
|
|
|
|
|
|
|
|
|
|
|||||||||||||||||||||
| Total net sales |
$ | 863,138 | 100 | % | $ | 1,013,756 | 100 | % | $ | 1,017,041 | 100 | % | $ | 832,565 | 100 | % | $ | 887,777 | 100 | % | ||||||||||||||||||||
|
|
|
|
|
|
|
|
|
|
|
|
|
|
|
|
|
|
|
|
|
|||||||||||||||||||||
| Segment Adjusted EBITDA |
||||||||||||||||||||||||||||||||||||||||
| Domestic |
$ | 85,030 | 84 | % | $ | 102,241 | 87 | % | $ | 109,726 | 85 | % | $ | 98,633 | 85 | % | $ | 118,242 | 91 | % | ||||||||||||||||||||
| International |
15,750 | 16 | % | 14,632 | 13 | % | 20,033 | 15 | % | 17,098 | 15 | % | 12,325 | 9 | % | |||||||||||||||||||||||||
|
|
|
|
|
|
|
|
|
|
|
|
|
|
|
|
|
|
|
|
|
|||||||||||||||||||||
| Total Adjusted EBITDA |
$ | 100,780 | 100 | % | $ | 116,873 | 100 | % | $ | 129,759 | 100 | % | $ | 115,731 | 100 | % | $ | 130,567 | 100 | % | ||||||||||||||||||||
|
|
|
|
|
|
|
|
|
|
|
|
|
|
|
|
|
|
|
|
|
|||||||||||||||||||||
Quarterly Net Sales Information
The following tables set forth certain historical unaudited consolidated quarterly net sales for each of the quarters during the year ended March 31, 2013 and the nine months ended December 31, 2013. This unaudited information has been prepared on a basis consistent with our annual financial statements and includes all adjustments (consisting only of normal recurring adjustments) necessary for the fair presentation of the unaudited quarterly data. This information should be read together with our consolidated financial statements and the related notes, included elsewhere in this prospectus. The results of operations for any quarter are not necessarily indicative of results that we may achieve for any subsequent periods.
| (Amounts in thousands) | Quarters Ended During the Fiscal Year Ended March 31, 2013 |
Quarters Ended During the Nine Months Ended December 31, 2013 |
||||||
| Net Sales by Quarter |
||||||||
| Three months ended June 30 |
$ | 298,390 | $ | 293,102 | ||||
| Three months ended September 30 |
285,749 | 333,495 | ||||||
| Three months ended December 31 |
248,425 | 261,180 | ||||||
| Three months ended March 31 |
184,477 | — | ||||||
|
|
|
|
|
|||||
| Total net sales |
$ | 1,017,041 | $ | 887,777 | ||||
|
|
|
|
|
|||||
Liquidity and Capital Resources
Our primary liquidity requirements are working capital, capital expenditures, debt service, and dividend payments for our convertible preferred stock and common stock. We have historically funded, and expect to continue to fund, our operation primarily through equity issuance, internally generated cash flow and debt financings. From time to time we may explore additional financing methods and other means to raise capital. There can be no assurance that any additional financing will be available to us on acceptable terms or at all.
- 69 -
Table of Contents
As of December 31, 2013, we had $5,322 in cash that was held by our foreign subsidiaries. Our intent is to indefinitely reinvest our earnings in foreign subsidiaries. In the event that foreign earnings are repatriated, these amounts will be subject to income tax liabilities in the appropriate tax jurisdiction. No restrictions exist on our liquidity that is impacted by the significance of cash held by foreign subsidiaries.
Working Capital and Cash Flows
During the nine months ended December 31, 2013, our source of funds was primarily driven by an increase in operating earnings and higher inventory turnover. During fiscal year 2013, our use of cash was primarily driven by increased capital expenditures. During fiscal year 2012, our use of cash was primarily driven by net acquisition activity. During fiscal year 2011, our use of cash was primarily driven by repurchases of common stock and acquisition activities.
As of December 31, 2013, we had $235.4 million in liquidity, including $5.3 million of cash and cash equivalents and $230.1 million in borrowings available under our Revolving Credit Facility, described below. We believe that our cash on hand, together with the availability of borrowings under our Revolving Credit Facility and other financing arrangements and cash generated from operations, will be sufficient to meet our working capital requirements, anticipated capital expenditures, scheduled interest payments on our indebtedness and dividend payment requirement for our convertible preferred stock for at least the next twelve months. We are not dependent on this offering to meet our liquidity needs during that period.
As of December 31, 2013, we had total consolidated indebtedness of approximately $306.3 million. We anticipate that we will repay a portion of our outstanding indebtedness with the proceeds from this offering. See “Use of Proceeds.”
The following table sets forth the major sources and uses of cash for each of the periods presented:
| Fiscal Year Ended March 31, |
Nine Months Ended December 31, |
|||||||||||||||||||
| (Amounts in thousands) | 2011 | 2012 | 2013 | 2012 | 2013 | |||||||||||||||
| Statement of Cash Flows data: |
||||||||||||||||||||
| Net cash from operating activities |
$ | 37,233 | $ | 56,997 | $ | 68,215 | $ | 60,176 | $ | 88,104 | ||||||||||
| Net cash from investing activities |
(53,237 | ) | (35,833 | ) | (47,199 | ) | (42,079 | ) | (30,116 | ) | ||||||||||
| Net cash from financing activities |
15,134 | (21,233 | ) | (21,737 | ) | (15,987 | ) | (54,014 | ) | |||||||||||
Working Capital
Working capital is an indication of liquidity and potential need for short-term funding. We define working capital as the difference between our current assets and current liabilities.
Working capital decreased to $208.1 million as of December 31, 2013, from $220.3 million as of March 31, 2013, primarily due to an increase in accounts payable and accrued expenses and accrued income taxes, partially offset by higher accounts receivable and inventories reflecting higher sales volume.
Working capital increased to $220.3 million as of March 31, 2013, from $208.3 million as of March 31, 2012, primarily due to higher inventories which offset a decrease in accounts receivable.
Working capital increased to $208.3 million as of March 31, 2012, from $204.1 million as of March 31, 2011, primarily due to higher receivables from fourth quarter sales, which offset a decline in inventories and an increase in accrued taxes.
- 70 -
Table of Contents
Operating Cash Flows
Cash flow from operating activities for the nine months ended December 31, 2013 was $88.1 million as compared with cash provided by operating activities of $60.2 million for the nine month ended December 31, 2012. Cash flow during the nine months ended December 31, 2013 was driven by higher revenues and favorable changes in working capital.
Cash flow from operating activities in fiscal year 2013 was $68.2 million as compared with cash generated by operating activities of $57.0 million for fiscal year 2012. Cash flow for fiscal year 2012 was driven by improved operating margins.
Cash flow from operating activities in fiscal year 2012 was $57.0 million as compared with cash generated by operating activities of $37.2 million for fiscal year 2011. The increase of cash in fiscal year 2013 was driven by higher revenues and operating margins.
Investing Cash Flows
During the nine months ended December 31, 2013, cash used for investing activities was $30.1 million, primarily due to capital expenditures in support of operations. During the nine months ended December 31, 2012, cash used for investing activities was $42.1 million, primarily due to capital expenditures in support of operations.
During fiscal year 2013, cash used in investing activities was $47.2 million, primarily driven by capital expenditures ($40.0 million).
During fiscal year 2012, cash used in investing activities was $35.8 million, primarily driven by capital expenditures ($26.5 million) and net acquisition activity ($8.8 million).
During fiscal year 2011, cash used in investing activities was $53.2 million, primarily driven by capital expenditures ($30.0 million) and net acquisition activities ($20.3 million).
Financing Cash Flows
During the nine months ended December 31, 2013, cash used in financing activities was $54.0 million, utilizing our operating cash flow to pay down debt (net debt pay down of $43.7 million) and for dividends and redemption of our convertible preferred stock in connection with the ESOP. During the nine months ended December 31, 2012, cash used in financing activities was $16.0 million primarily due to payments on various term and revolving debt ($17.2 million) with the balance used for dividends and redemption of convertible preferred stock in connection with the ESOP.
During fiscal year 2013, cash used by financing activities was $21.7 million as compared to cash used by financing activities of $21.2 million for fiscal year 2012. Our net cash flow was directed to pay down term debt, dividends, and redemption of our convertible preferred stock in connection with the ESOP.
During the fiscal year 2012, cash used for financing activities was $21.2 million primarily due to payments of term debt, dividends, and redemption of our convertible preferred stock in connection with the ESOP.
During the fiscal year 2011, cash provided by financing activities was $15.1 million primarily due to proceeds from the sale of common stock and new debt financing offsetting the purchase of our common stock and our convertible preferred stock.
Capital Expenditures
We had capital expenditures of $30.0 million, $26.5 million and $40.0 million in fiscal years 2011, 2012 and 2013, respectively. Our capital expenditures in fiscal year 2013 were used primarily to support the growth of HP N-12 pipe production capacity, expansion of our recycled resin initiatives and other capital projects.
- 71 -
Table of Contents
We currently anticipate that we will make capital expenditures of approximately $33.0 million to $35.0 million in each of fiscal years 2014 and 2015. We expect our total capital expenditures to be relatively similar to the past several fiscal years. Such capital expenditures are expected to be financed using funds generated by operations. As of December 31, 2013, there were no material contractual obligations or commitments related to these planned capital expenditures.
Financing Transactions
Senior Loan Facilities
On September 24, 2010, we entered into a credit agreement with PNC Bank, National Association, or PNC, as administrative agent, and the other lenders parties thereto. The credit agreement, as amended and restated on June 12, 2013 and subsequently further amended, provides for our Senior Loan Facilities consisting of (i) the Revolving Credit Facility providing for revolving loans and letters of credit of up to a maximum aggregate principal amount of $325.0 million and (ii) the Term Loan Facility providing for the Term Loans in an aggregate original principal amount of $100.0 million. The Senior Loan Facilities also permit us to add additional commitments to the Revolving Credit Facility or the Term Loan Facility not to exceed $50 million in the aggregate. The proceeds of the Revolving Credit Facility are primarily used to provide for our ongoing working capital and capital expenditure needs, to finance acquisitions and distributions, and for our other general corporate purposes. The proceeds of the Term Loan Facility were primarily used for our general corporate purposes. The interest rates on the Senior Loan Facilities are determined by certain base rates or LIBOR rates, plus an applicable margin. The obligations under the Senior Loan Facilities are guaranteed by certain of our subsidiaries and secured by substantially all of our personal property assets. For further information about the Senior Loan Facilities, see “Description of Certain Indebtedness — Senior Loan Facilities.” As of December 31, 2013, the outstanding principal drawn on the Revolving Credit Facility was $98.4 million, with $218.1 million available to be drawn, subject to customary conditions precedent. As of December 31, 2013, the outstanding principal balance of the Term Loan was $98.8 million. On December 20, 2013, we amended the Revolving Credit Facility to, among other things, permit the payment of a cash dividend.
We intend to use the net proceeds from this offering (together with cash on hand, if necessary) to repay a portion of our outstanding indebtedness under the Revolving Credit Facility.
Mexicana Revolving Credit Facility
On September 24, 2010, our joint venture ADS Mexicana entered into a credit agreement with PNC, as administrative agent, and the other lenders parties thereto. The credit agreement, as amended and restated on June 12, 2013 and subsequently further amended, provides for revolving loans and letters of credit of up to a maximum aggregate principal amount of $12.0 million. The proceeds of the revolving credit facility are primarily used to cover working capital needs. The interest rates of the revolving credit facilities are determined by certain base rates or LIBOR rates, plus an applicable margin. The obligations under the revolving credit facility are guaranteed by us and certain of our subsidiaries and secured by substantially all of our assets. For further information about the Senior Loan Facilities, see “Description of Certain Indebtedness — Senior Loan Facilities.” As of December 31, 2013, there was no outstanding principal drawn on the revolving credit facility and the entire $12 million was available to be drawn.
Senior Notes
On December 11, 2009, we entered into a private shelf agreement with Prudential Investment Management Inc., or Prudential, which agreement, as amended and restated on September 24, 2010 and subsequently further amended, provides for the issuance by us of senior secured promissory notes to Prudential or its affiliates from time to time in the aggregate principal amount up to $100.0 million. Pursuant to the private shelf agreement, on September 27, 2010, we issued $75.0 million in aggregate principal amount of the 5.60% Senior Series A Notes
- 72 -
Table of Contents
due September 24, 2018 to repurchase outstanding shares of common stock from certain of our stockholders and to repurchase outstanding shares of convertible preferred stock from the ESOP. On July 24, 2013, we issued $25.0 million in aggregate principal amount of the 4.05% Senior Series B Notes due September 24, 2019 for our general corporate purposes. The Senior Notes are guaranteed by certain of our subsidiaries and secured by substantially all of our assets. For further information about the Senior Notes, see “Description of Certain Indebtedness — Senior Notes.” We have no further amount available for issuance of senior notes under the private shelf agreement. On December 20, 2013, we amended the private shelf agreement to, among other things, make certain amendments in order to permit the payment of a cash dividend.
Covenant Compliance
Our outstanding debt agreements and instruments contain various restrictive covenants including, but not limited to, limitations on additional indebtedness and capital distributions, including dividend payments. The two primary debt covenants include a Leverage Ratio and a Fixed Charge Ratio maintenance covenant. For any relevant period of determination, the Leverage Ratio is calculated by dividing Total Consolidated Indebtedness (funded debt plus guarantees) by Consolidated EBITDA. The current upper limit is 4.0 times. The Fixed Charge Ratio is calculated by dividing the sum of Consolidated EBITDA minus Capital Expenditures minus cash Income Taxes paid, by the sum of Fixed Charges. Fixed Charges include cash Interest expense, scheduled principal payments on Indebtedness, and ESOP Capital Distributions in excess of $10 million in a given fiscal year. The current minimum ratio is 1.25 times. For further information, see “Description of Certain Indebtedness.” We were in compliance with our debt covenants as of December 31, 2013.
Contractual Obligation as of December 31, 2013
| Payments Due by Period | ||||||||||||||||||||
| (Amounts in thousands) | Total | Less than 1 Year |
1-3 Years | 3-5 Years | More than 5 Years |
|||||||||||||||
| Contractual obligations: |
||||||||||||||||||||
| Long-term debt (1) |
$ | 306,265 | $ | 8,240 | $ | 47,560 | $ | 225,225 | $ | 25,240 | ||||||||||
| Interest payments (2) |
45,667 | 11,566 | 21,401 | 11,940 | 760 | |||||||||||||||
| Operating leases |
68,222 | 18,580 | 29,851 | 12,848 | 6,943 | |||||||||||||||
| Contractual purchase obligations (3) |
87,563 | 87,563 | — | — | — | |||||||||||||||
|
|
|
|
|
|
|
|
|
|
|
|||||||||||
| Total |
$ | 507,717 | $ | 125,949 | $ | 98,812 | $ | 250,013 | $ | 32,943 | ||||||||||
|
|
|
|
|
|
|
|
|
|
|
|||||||||||
| (1) | The current Revolving Credit Facility and Term Loan mature in June, 2018. |
| (2) | Based on applicable rates and pricing margins as of December 31, 2013, including interest rate swaps. |
| (3) | Purchase obligations include various commitments with vendors to purchase goods and services, primarily inventory, machinery, supplies and other equipment. |
Off-Balance Sheet Arrangements
We do not have any off-balance sheet arrangements, with the exception of the guarantee of 50% of certain debt of our unconsolidated South American Joint Venture, as further discussed in Note 10 of our Notes to Consolidated Financial Statements. As of December 31, 2013, our South American Joint Venture had approximately $11.6 million of outstanding debt. We do not believe that this guarantee will have a current or future effect on our financial condition, results of operations, liquidity, or capital resources.
Critical Accounting Policies and Estimates
The preparation of our consolidated financial statements in conformity with accounting principles generally accepted in the United States of America requires management to make estimates and assumptions that affect the reported amounts of assets and liabilities, the disclosure of contingent assets and liabilities at the date of the consolidated financial statements and the reported amounts of revenues and expenses during the reporting period.
- 73 -
Table of Contents
Significant estimates include, but are not limited to, our allowance for doubtful accounts, useful lives of our property, plant and equipment and amortizing intangible assets, valuation allowance on deferred tax assets, reserves for uncertain tax positions, evaluation of goodwill, intangible assets and other long-lived assets for impairment, accounting for stock based compensation and our ESOP, reserves for general liability, workers’ compensation, and medical insurance, cash discounts and customer rebates and valuation of our Redeemable Common Stock and Redeemable Convertible Preferred Stock. Management’s estimates and assumptions are evaluated on an ongoing basis and are based on historical experience, current conditions and available information. Management believes the accounting estimates are appropriate and reasonably determined; however, due to the inherent uncertainties in making these estimates, actual results could differ from those estimates.
Consolidation and Investments
Our consolidated financial statements include us, our wholly-owned subsidiaries and VIEs of which we are the primary beneficiary. The non-controlling interests in our subsidiaries that are consolidated but not wholly owned by us are included in the accompanying financial statements. We use the equity method of accounting for equity investments where we exercise significant influence but do not hold a controlling financial interest, including our South American Joint Venture and our BaySaver Joint Venture. Such investments are recorded in Other Assets in the balance sheets and equity earnings are included in Equity Earnings of Unconsolidated Subsidiaries in the statements of income. All intercompany balances and transactions have been eliminated in consolidation.
Allowance for Doubtful Accounts
We hold receivables from customers in various countries. Credit is extended to customers based on an evaluation of their financial condition and collateral is generally not required. The evaluation of the customer’s financial condition is performed to reduce the risk of loss. Accounts receivable are evaluated for collectability based on numerous factors, including the length of time individual receivables are past due, past transaction history with customers, their credit worthiness and the economic environment. An allowance for doubtful accounts is estimated as a percentage of aged receivables. This estimate is periodically adjusted when management becomes aware of a specific customer’s inability to meet its financial obligations (e.g., bankruptcy filing) or as a result of changes in historical collection patterns.
Goodwill
We account for costs of acquired assets in excess of fair value, or Goodwill, and other intangible assets not subject to amortization in accordance with FASB Accounting Standards Codification, or ASC, Topic 350, “Intangibles — Goodwill and Other.” Goodwill is reviewed annually for impairment as of March 31 or whenever events or changes in circumstances indicate the carrying value may not be recoverable. The goodwill impairment analysis is comprised of two steps. The first step requires the comparison of the fair value of the applicable reporting unit to its respective carrying value. If the fair value of the reporting unit exceeds the carrying value of the net assets assigned to that unit, goodwill is not considered impaired and we would not be required to perform further testing. If the carrying value of the net assets assigned to the reporting unit exceeds the fair value of the reporting unit, then we must perform the second step of the impairment test in order to determine the implied fair value of the reporting unit’s goodwill. If the carrying value of a reporting unit’s goodwill exceeds its implied fair value, then we would record an impairment loss equal to the difference. With respect to this testing, our reporting units are generally one level below our operating segments for which discrete financial information is available and reviewed by segment management. However, components of an operating segment can be aggregated as one reporting unit if the components have similar economic characteristics. Our reporting units include Domestic, Mexico, Puerto Rico, Canada, Chile and Europe. Implied fair value of goodwill is determined by considering both the income and market approach. Determining the fair value of a reporting unit is judgmental in nature and involves the use of significant estimates and assumptions. These estimates and assumptions include revenue
- 74 -
Table of Contents
growth rates and operating margins used to calculate projected future cash flows, risk-adjusted discount rates, future economic and market conditions, and determination of appropriate market comparables. The fair value estimates are based on assumptions management believes to be reasonable, but are inherently uncertain.
We did not incur any impairment expense for goodwill in the years ended 2013 and 2012.
Intangible Assets
Definite-lived intangible assets are tested for recoverability whenever events or changes in circumstances indicate that carrying amounts of the asset group may not be recoverable. Asset groups are established primarily by determining the lowest level of cash flows available. If the estimated undiscounted future cash flows are less than the carrying amounts of such assets, an impairment loss is recognized to the extent the fair value of the asset less any costs of disposition is less than the carrying amount of the asset. Determining the fair value of these assets is judgmental in nature and involves the use of significant estimates and assumptions. Future events and unanticipated changes to assumptions could require a provision for impairment in a future period.
In April 2011, we recharacterized the Hancor trademark previously classified as indefinite lived since 2005 to definite lived based on management’s decision to discontinue to the use of the trademark over the next 15 years. When such a change is made, the asset is required to be tested for impairment. We tested the trademark for impairment using the relief from royalty valuation method and recorded an impairment charge of $3,200 in General and administrative expenses in the Consolidated Statements of Income, resulting in the carrying value of the trademark being reduced, and thus equal, to the estimated fair value, which will be amortized over a 15-year period.
No additional impairment charges were recorded in fiscal years 2011, 2012 or 2013.
Indefinite-lived intangible assets are tested for impairment annually as of March 31 or whenever events or changes in circumstances indicate the carrying value may be greater than fair value. Determining the fair value of these assets is judgmental in nature and involves the use of significant estimates and assumptions. We base our fair value estimates on assumptions we believe to be reasonable, but that are inherently uncertain. To estimate the fair value of these indefinite-lived intangible assets, we use an income approach, which utilizes a market derived rate of return to discount anticipated performance. An impairment loss is recognized when the estimated fair value of the intangible asset is less than the carrying value.
We did not record any impairment in fiscal years 2011, 2012 or 2013 other than the Hancor trademark impairment described previously. Future events and unanticipated changes to assumptions could require a provision for impairment in a future period.
Revenue Recognition
We recognize revenue and cost of goods sold when persuasive evidence of an agreement exists, delivery has occurred, the price to the buyer is fixed and determinable and collectability is reasonably assured.
We ship products to customers predominantly by internal fleet and to a lesser extent by third-party carriers. Revenues, net of sales tax and allowances for returns, rebates and discounts are recognized from product sales when title to the products is passed to the customer which generally occurs upon delivery.
Employee Benefit Plans
Employee Stock Ownership Plan (ESOP)
Unallocated shares of convertible preferred stock held by our ESOP in the ESOP’s loan suspense account are allocated each year to employee-participants’ ESOP stock accounts upon the ESOP making its annual ESOP loan payment. The annual allocation of convertible preferred stock to the ESOP stock accounts of ESOP participants is accounted for as share based compensation expense as part of our overall employee benefits
- 75 -
Table of Contents
expense. Such shares of convertible preferred stock are valued based on an annual valuation completed by management with the assistance of an independent third-party appraisal firm. When shares of convertible preferred stock are allocated to the ESOP stock accounts of ESOP participants, we reduce the amount of deferred compensation reflected in Deferred compensation — unearned ESOP shares in mezzanine equity. The amount of deferred compensation is reduced by the number of allocated shares of convertible preferred stock, multiplied by the value of the convertible preferred stock when originally issued. The difference between the current share value and the original value is credited to the equity account paid in capital.
Stock-Based Compensation Plans
We have several programs for stock based payments to employees and directors in accordance with FASB ASC Topic 718, Compensation — Stock Compensation. Equity-classified awards are measured based on the grant-date estimated fair value of each award, net of estimated forfeitures, and liability-classified awards are re-measured at their fair value, net of estimated forfeitures, at each reporting date for accounting purposes. Compensation expense is recognized over the employee’s requisite service period, which is generally the vesting period of the grant. Compensation expense is recorded for new awards and existing awards that are modified, repurchased or forfeited.
The fair value of restricted stock equals the fair value of the underlying common stock as of the date of the grant, as discussed in “— Valuation of Redeemable Common Stock and Redeemable Convertible Preferred Stock — Valuation of Redeemable Common Stock.”
The fair value of each stock option granted is estimated, as of the date of the grant, using the Black-Scholes option pricing model. Determining the fair value of stock options under the Black-Scholes option-pricing model requires judgment, including estimating the fair value per share of our common stock as a private company prior to this offering, volatility, expected term of the awards, dividend yield and the risk-free interest rate. The assumptions used in calculating the fair value of stock options represent our best estimates, based on management’s judgment and subjective future expectations. These estimates involve inherent uncertainties. If any of the assumptions used in the model change significantly, stock based compensation recorded for future awards may differ materially from that recorded for awards granted previously.
We developed our assumptions as follows:
| • | Fair value of common stock. As our common stock is not publicly traded, we estimate the fair value of common stock as discussed in “— Valuation of Redeemable Common Stock and Redeemable Convertible Preferred Stock — Valuation of Redeemable Common Stock.” |
| • | Volatility. The expected price volatility for our common stock is estimated by taking the median historic price volatility for industry peers based on daily prices over a period equivalent to the expected term of the stock option grants. |
| • | Expected term. The expected term represents the period of time that options granted are expected to be outstanding based on historical experience. |
| • | Risk-free interest rate. The risk-free interest rate is based on the yields of United States Treasury securities with maturities similar to the expected term of the options. |
| • | Dividend yield. The dividend yield is based on our anticipated dividend payments over the remaining expected holding period. |
We estimate potential forfeitures of grants and adjust stock-based compensation expense accordingly. The estimate of forfeitures is adjusted over the requisite service period to the extent that actual forfeitures differ from the prior estimates. We estimate forfeitures based upon our historical experience, and, at each period, review the estimated forfeiture rate and make changes as factors affecting the forfeiture rate calculations and assumptions change.
- 76 -
Table of Contents
Valuation of Redeemable Common Stock and Redeemable Convertible Preferred Stock
Valuation of Redeemable Common Stock
Certain of our outstanding shares of common stock are subject to agreements that permit the holder of those shares to put its shares to us for cash. This Redeemable Common Stock is recorded at its fair value in the mezzanine section of our consolidated balance sheets and changes in fair value are recorded in retained earnings. The fair value of our common stock is based on the most recent contemporaneous third-party valuation report, which historically applied industry-appropriate multiples to EBITDA and performed a discounted cash flow analysis. Under the industry-appropriate multiples approach, to arrive at concluded multiples, we considered differences between the risk and return characteristics of us and the guideline companies. Under the discounted cash flow analysis, the cash flows expected to be generated by us are discounted to their present value equivalent using a rate of return that reflects the relative risk of an investment in us, as well as the time value of money. This return is an overall rate based upon the individual rates of return for invested capital (equity and interest-bearing debt). The return, known as the weighted average cost of capital, or WACC, is calculated by weighting the required returns on interest-bearing debt and common stock in proportion to their estimated percentages in an expected capital structure. The categorization of the framework used to price this temporary equity is considered a Level 3, due to the subjective nature of the unobservable inputs used to determine the fair value.
Valuation of Redeemable Convertible Preferred Stock
The trustee of our ESOP has the ability to put the shares of our Redeemable Convertible Preferred Stock to us. Our Redeemable Convertible Preferred Stock is recorded at its fair value in the mezzanine section of our consolidated balance sheets and changes in fair value are recorded in retained earnings. Accordingly, we estimated the fair value of the Redeemable Convertible Preferred Stock through estimating the fair value of our common stock and applying certain adjustments including for the fair value of the total dividends to be received and assuming conversion of the preferred stock to common stock at the stated conversion ratio per our certificate of incorporation. The categorization of the framework used to price this temporary equity is considered a Level 3, due to the subjective nature of the unobservable inputs used to determine the fair value.
Income Taxes
Income taxes are accounted for under the asset and liability method. Deferred tax assets and liabilities are recognized and represent the future tax consequences attributable to differences between the financial statement carrying amounts of existing assets and liabilities and their respective tax bases. They are measured using the enacted tax rates expected to apply to taxable income in the years in which the related temporary differences are expected to be recovered or settled. The effect on deferred tax assets and liabilities of a change in tax rates is recognized in income in the period that includes the enactment date. The deferred income tax provision represents the change during the reporting period in the deferred tax assets and deferred tax liabilities. Penalties and interest recorded on income taxes payable are recorded as part of income taxes.
We follow the GAAP guidance for uncertain tax positions within ASC 740, Income Taxes. ASC 740 provides guidance related to the financial statement recognition and measurement of tax positions taken or expected to be taken in a tax return. The standard prescribes the minimum recognition threshold that a tax position is required to meet before being recognized in the financial statements. ASC 740 also provides guidance on derecognition, classification, interest and penalties, accounting in interim periods and disclosure. Initial recognition, derecognition and measurement is based on management’s judgment given the facts, circumstances and information available at the reporting date. If these judgments are not accurate then future income tax expense or benefit could be different.
- 77 -
Table of Contents
Recently Adopted Accounting Pronouncements
Fair value measurement
In May 2011, the FASB issued Accounting Standard Update (ASU) No. 2011-04, Fair Value Measurement (Topic 820), which clarifies the measurement of fair value for certain assets and liabilities and expands the disclosure requirements for Level 3 fair value investments. The amendments in this ASU are intended to improve the comparability of fair value measurements presented and disclosed in financial statements prepared in accordance with GAAP and International Financial Reporting Standards. ASU No. 2011-04 became effective for us in fiscal year 2013. The adoption of the amended guidance did not have a material impact on our consolidated financial statements and related disclosures.
Comprehensive income: Presentation
In June 2011, the FASB issued ASU No. 2011-05, Comprehensive Income (Topic 220), accounting guidance related to the presentation of comprehensive income in ASC 220, Comprehensive Income. The objective of this ASU is to improve the comparability, consistency and transparency of financial reporting and to increase the prominence of items reported in other comprehensive income. Under this guidance, entities are required to report the components of net income and comprehensive income either in one continuous statement or in two separate but consecutive statements. The option to present items of other comprehensive income in the statement of changes in equity was eliminated. The guidance became effective for us in fiscal year 2013. We elected to present items of other comprehensive income in two but consecutive statements.
Comprehensive income: Reclassifications
In February 2013, the FASB issued ASU No. 2013-02, Comprehensive Income (Topic 220), accounting guidance related to the presentation of comprehensive income in ASC 220, Comprehensive Income. This ASU supersedes and replaces the presentation requirements for reclassifications out of accumulated other comprehensive income in ASU 2011-05, which were deferred indefinitely under ASU No. 2011-12, “Deferral of the Effective Date for Amendments to the Presentation of Reclassification of Items out of Accumulated Other Comprehensive Income in Accounting Standards Update No. 2011-05” which was issued in December 2011. The amendments in ASU 2013-02 would require an entity to provide additional information about reclassifications out of accumulated other comprehensive income by the respective line items of net income. For public entities, the provisions of this ASU became effective for reporting periods beginning after December 15, 2012. The adoption of the amended guidance did not have a material impact on our consolidated financial statements and related disclosures.
Income Taxes
In July 2013, the FASB issued ASU No. 2013-11, Income Taxes (Topic 740), which requires that an unrecognized tax benefit, or a portion of an unrecognized tax benefit, be presented in the financial statements as a reduction to a deferred tax asset for a net operating loss carryforward, a similar tax loss, or a tax credit carry forward. However, if a net operating loss carry forward, a similar tax loss, or a tax credit carry forward is not available at the reporting date under the tax law of the applicable jurisdiction to settle any additional income taxes that would result from the disallowance of a tax position or the tax law of the applicable jurisdiction does not require the entity to use, and the entity does not intend to use, the deferred tax asset for such purpose, the unrecognized tax benefit should be presented in the financial statements as a liability and should not be combined with deferred tax assets. The amendments are effective for fiscal years, and interim periods within those years, beginning after December 15, 2013. The amendments are not expected to have a material impact on our consolidated financial statements and related disclosures.
- 78 -
Table of Contents
Quantitative and Qualitative Disclosure About Market Risk
We are subject to various market risks, primarily related to changes in interest rates, raw material supply prices, and to a lesser extent, foreign currency exchange rates. Our financial position, results of operations or cash flows may be negatively impacted in the event of adverse movements in the respective market rates or prices in each of these risk categories. Our exposure in each category is limited to those risks that arise in the normal course of business, as we do not engage in speculative, non-operating transactions.
Interest Rate Risk
We are subject to interest rate risk associated with our debt. Changes in interest rates impact the fair value of our fixed-rate debt, but there is no impact to earnings and cash flow. Alternatively, changes in interest rates do not affect the fair value of our variable-rate debt, but they do affect future earnings and cash flow. The Revolving Credit Facility, the Term Loan Facility, and our industrial development revenue bond, or IDRB, notes bear variable interest rates. The Revolving Credit Facility and Term Loan Facility bear interest either at LIBOR or the Prime Rate, at our option, plus applicable pricing margins. The IDRB notes bear interest at weekly commercial paper rates, plus applicable pricing margins. A 1% increase in interest rates on our variable rate debt would increase our annual forecasted interest expense by approximately $.8 million based on our borrowings as of December 31, 2013. Assuming the Revolving Credit Facility is fully drawn, each 1% increase or decrease in the applicable interest rate would change our interest expense by approximately $2.8 million per year. To mitigate the impact of interest rate volatility, we have two interest rate swaps in effect as of December 31, 2013. The first swap is at $70 million notional value, amortizing $2.5 million per quarter at a fixed LIBOR rate of 1.105%, and expires in September, 2014. The other swap is a $50 million notional value, non-amortizing swap at a LIBOR rate of 0.86% which expires in September, 2016. A third $50 million notional value swap will take effect on September 1, 2014 and expires on September 1, 2016. The rate is at a fixed LIBOR of 1.08%.
Credit Risk
Financial instruments that potentially subject us to a concentration of credit risk consist principally of accounts receivable. We provide our products to customers based on an evaluation of the customers’ financial condition, generally without requiring collateral. Exposure to losses on receivables is principally dependent on each customer’s financial condition. We monitor the exposure for credit losses and maintains allowances for anticipated losses. Concentrations of credit risk with respect to our accounts receivable are limited due to the large number of customers comprising our customer base and their dispersion among many different geographies.
Raw Material and Commodity Price Risk
Our primary raw materials used in the production of our products are polyethylene and polypropylene resins. As these resins are hydrocarbon-based materials, changes in the price of feedstocks, such as crude oil and natural gas, as well as changes in the market supply and demand may cause the cost of these resins to fluctuate significantly. Raw materials account for the majority of our cost of goods sold. Given the significance of these costs and the inherent volatility in supplier pricing, our ability to reflect these changes in the cost of resins in our product selling prices in an efficient manner, passing the increase on to our customers, contributes to the management of our overall supply price risk and the potential impact on our results of operations.
We manage supply risk with financial and physical hedge contracts for the HDPE and PP resins used in the manufacture of our Pipe and Allied Products, as well as for the diesel fuel used by our in-house fleet of delivery trucks. Our physical hedge contracts for HDPE resins are typically at a fixed price and volume over time. We use to a limited extent financial derivatives for PP resin in the form of fixed price swaps based on propylene monomer. For diesel fuel, we have utilized option contracts in the form of collars with put and call options.
- 79 -
Table of Contents
We have supply contracts that typically include supply periods of greater than one year. Except for physical-hedged resin contracts, we generally do not enter into long-term purchase orders for the delivery of raw materials. Our orders with suppliers are flexible and do not normally contain minimum purchase volumes or fixed prices. Accordingly, our suppliers may change their selling prices or other relevant terms on a monthly basis, exposing us to pricing risk. Our use of pricing and forecasting tools, centralized procurement, additional sources of supply and incorporation of vertical integration for recycled material have increased our focus on efficiency and resulted in lower overall supply costs. If the price of HDPE and PP virgin resin increased or decreased by 5%, it would result in a material change to our cost of goods sold.
Inflation
Our cost of goods sold is subject to inflationary pressures and price fluctuations of the raw materials we use, primarily high density polyethylene and polypropylene resins. Historically, we have generally been able over time to recover the effects of inflation and price fluctuations through sales price increases and production efficiencies related to technological enhancements and improvements. However, we cannot reasonably estimate our ability to successfully recover any price increases.
Financial Instruments
We have operations in countries outside of the United States, all of which use the respective local foreign currency as their functional currency. Each of these operations may enter into contractual arrangements with customers or vendors that are denominated in currencies other than its respective functional currency. Consequently, our results of operations may be affected by exposure to changes in foreign currency exchange rates and economic conditions in the regions in which we sell or distribute our products. Exposure to variability in foreign currency exchange rates from these transactions is managed, to the extent possible, by natural hedges which result from purchases and sales occurring in the same foreign currency within a similar period of time, thereby offsetting each other to varying degrees.
In addition, to the transaction-related gains and losses that are reflected within the results of operations, we are subject to foreign currency translation risk, as the financial statements for our foreign subsidiaries are measured and recorded in the respective subsidiary’s functional currency and translated into U.S. dollars for consolidated financial reporting purposes. The resulting translation adjustments are recorded net of tax impact in the Consolidated Statement of Income.
- 80 -
Table of Contents
We compete in the multi-billion dollar global pipe and related water management solutions market. Our end markets include non-residential construction, residential construction, agriculture and infrastructure, focused primarily in the United States and Canada. We also compete in Mexico, Central America and South America through our joint ventures. We believe the markets we serve in the United States represent approximately $10.1 billion of annual revenue opportunity. In addition, we believe the increasing acceptance of thermoplastic pipe products in international markets represents an attractive growth opportunity.
We estimate that HDPE pipe and PP pipe represent approximately 25% of all domestic storm pipe sales, up from what we believe was less than 10% ten years ago, and less than 1% twenty years ago. Market penetration is expected to continue to grow significantly as the regulatory environment continues to change and as contractors, civil design engineers and municipal agencies fully recognize the superior physical attributes and compelling value proposition of HDPE and PP pipe. In part due to the efforts and success of our corporate and field civil engineers, an average of approximately 60 state, county and municipal approvals have been added or enhanced each year over the past five years, including 32 states over the past eight years.
Core Product Categories
Pipe Market
Demand for our products is largely driven by non-residential and residential construction, transportation and related water drainage infrastructure spending and the repair and replacement of aging stormwater management infrastructure. Freedonia estimates that demand for large diameter pipe (defined as 15” diameter or larger depending on industry standards by material type) in the United States will increase at an average of 6.2% per year from approximately 146 million feet in 2011, to 197 million feet in 2016, driven by the recovery of general economic and construction activity, as well as the need to repair and upgrade aging and obsolete sewer, drain and water distribution networks. We compete in the storm sewer, drainage, sanitary sewer and irrigation markets, which collectively represent approximately 70% of the overall large diameter pipe market in the United States.
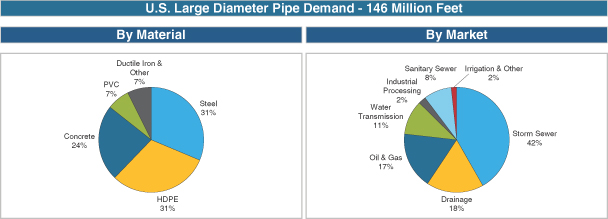
Source: Freedonia
According to Freedonia, demand for HDPE pipe is projected to grow at 7.0% annually through 2016, to 62.8 million feet due to the material’s competitive cost, light weight, resistance to corrosion, longer life and lower installed costs versus traditional materials such as concrete, steel and ductile iron. According to Freedonia, HDPE, the primary material in our products, is projected to become a larger portion of the overall large diameter pipe market as states and municipalities are expected to continue to adopt this product as a result of its superior attributes and approve its use in a broader range of applications.
- 81 -
Table of Contents
Since the introduction of PP pipe for use in the storm sewer market did not occur until 2012, the Freedonia growth projections referenced above do not take into account the potential impact that PP pipe may have in the larger diameter pipe market. Pipe manufactured from PP material has demonstrated improved stiffness and strength that allows for storm and sanitary sewer applications, which we believe will result in increased market share over concrete and PVC products. We further believe that our product line made from PP, in combination with our HDPE product line, provides us with a unique opportunity to grow market share in the large diameter pipe market.
According to Freedonia, sanitary and storm sewers, which represent approximately 50% of the total large diameter pipe market demand, are expected to continue to drive growth for the large diameter pipe market through 2016. Freedonia estimates that a large part of the growth will come from population increases in the South and West regions of the United States. EPA requirements and regulations are expected to continue to drive growth in the sanitary and storm sewer markets. Additionally, Freedonia estimates that the largest expected growth in the forecast period will come from the drainage market, as non-residential and residential construction continues to rebound.
Source: Freedonia
In the United States, our market diversification positions us to take advantage of cyclical recovery in the non-residential and residential construction end markets, increased spending from the expected replacement of aging water drainage and sewer infrastructure, stricter EPA regulations for stormwater and wastewater management, and the need for increased crop production. According to the U.S. Department of Agriculture, demand for U.S. crops is expected to remain steady with a growing worldwide population and increased demand from developing nations. Steady global economic growth supports gains in worldwide food demand. Economic growth in developing countries is especially important because food consumption and feed use are responsive to income growth in these countries, with movement away from traditional staple foods to an increased diversification of diets.
- 82 -
Table of Contents
Positive end market trends in the non-residential construction, residential construction, agricultural and infrastructure markets are also expected to drive increased demand for pipe products in Canada. A growing population, increased economic development, and rising export demand for food are leading to further growth in the Canadian pipe market. In Mexico, Central America and South America, additional investments in modern storm and sanitary sewer systems are needed to support the economic growth and development occurring in those nations.
The construction sector is responsible for a majority of the pipe use and demand in Canada. According to Freedonia, HDPE pipe is expected to grow 6.5% annually through 2017 to 81,000 metric tons, the fastest growth of any plastic resin. Both non-residential and residential end markets will provide good opportunity for growth. Growth in fixed investment spending is expected to result in a higher number of sewer and drainage infrastructure projects. Housing starts in Canada are forecasted to grow from 185,000 in 2012 to 215,000 by 2017, according to Freedonia. A large industry around forestry, minerals, petroleum and natural gas also provides opportunity for pipe applications.
The GDP in Mexico is forecasted to expand at 3.7% annually through 2017. Construction demand accounted for 60% of the total pipe demand in Mexico in 2012. Freedonia forecasts HDPE pipe demand to grow 8% annually through 2017 to 50,000 metric tons, the fastest rate of any plastic resin. Construction growth in Mexico is driven by demand for housing, non-residential property development and additional investment in public infrastructure.
In South America, HDPE pipe demand is forecasted by Freedonia to increase 8.5% annually to 173,000 metric tons by 2017. Investment in sewer and drainage networks is associated with growth in the construction sector. The largest pipe markets in this geography are Brazil and Argentina.
Brazil is the largest country in South America in terms of population, area and economic output. Construction accounted for 75% of the total pipe demand in 2012 and is forecasted to stay near those levels through 2017. Freedonia forecasts HDPE pipe to grow 5.8% annually to 53,000 metric tons by 2017. HDPE is taking market share from PVC in drainage and sewer applications. Brazil has large infrastructure investment occurring related to the country hosting the 2014 FIFA World Cup and the 2016 Summer Olympics.
Argentina is the second largest pipe market in South America and Freedonia forecasts HDPE pipe demand to increase 8.4% annually to 24,000 metric tons by 2017. Primary end markets are construction, natural resources and agriculture. HDPE is expected to see wider use in drainage and sewer use due to its performance advantages compared to other competitive materials.
According to Freedonia, HDPE pipe is also expected to see solid growth in construction applications in other South American countries such as Colombia, Chile, Ecuador and Peru.
Related Water Management Solutions Market
Stormwater Retention/Detention
Current EPA regulations require any development of one acre or larger to retain stormwater on site and gradually release it over time. This is typically accomplished by holding the stormwater in a pond or in an underground system that allows the water to leach gradually into surrounding soil or be discharged at a regulated rate. Underground systems are an economical alternative to retention ponds as they maximize the use of the available land. Ponds also require more maintenance, use valuable land, and present inherent design, aesthetic and safety issues.
Growth in the stormwater retention/detention market is primarily driven by the continued recovery in the construction markets as well as current EPA regulations regulating the discharge of pollutants. According to the Freedonia Special Report, growth of retention/detention solutions is forecasted to grow 7.5% annually from 2013
- 83 -
Table of Contents
to 2016. Over this period, structural solutions such as pipe and plastic chambers are forecasted to grow 8.5%, while natural solutions such as ponds are forecasted to grow at a slower rate of 5.4%. Freedonia forecasts annual growth of 9.0% and 11.5% for plastic pipe and plastic chambers, respectively, from 2013 to 2016 as compared to other alternatives. This growth is due in part to plastic systems offering advantages from ease of installation, lower freight costs, space efficiencies and better corrosion resistance.
Our key product offerings in this market include our N-12 pipe, HP pipe and StormTech chambers. StormTech chambers are durable, chemically-resistant underground chambers that function as stormwater detention or retention systems. The chambers allow for the storage of large stormwater volumes at minimal depths and are primarily used in non-residential applications.
On-Site Septic
According to the EPA, an estimated 20% of total U.S. housing units depend upon on-site septic systems for the treatment and disposal of household sewage. Many of these systems consist of a septic tank and a soil absorption area where effluent is leached into the soil. A common component of all soil absorption lines and/or fields is a type of conduit that distributes the effluent throughout the soil, and the soil has the function of absorbing and treating effluent. The market is driven by new residential construction and, to a lesser extent, the repair and replacement of existing systems.
Structures
Drainage structures, such as manholes, catch basins and inlet structures, are used in all major storm projects in the non-residential, residential and infrastructure markets. Drainage structures move surface collected stormwater vertically down to the pipe conveyance systems. The predominant material used for structures today is concrete. The precast market is highly fragmented with a heavy concentration of local and regional competitors, due to the high freight costs incurred for transportation of the product.
Growth will be driven by the cyclical recovery in the construction markets. We compete in the structures market with our Nyloplast product line. Nyloplast products are an engineered drainage structure with a PVC body combined with ductile iron grates to create effective surface drainage solutions. Nyloplast structures are customized to site specific requirements and delivered ready to install. Limited field fabrication or other job site work such as concrete grouting or brick and mortar is required, which reduces construction cost and increases speed of installation compared to traditional precast concrete structures.
Water Quality
Due to the fact that stormwater runoff collects trash, oil, sediment and other pollutants, EPA regulations require development of one acre or larger to limit the level of sediment or other pollutants in discharged water. Water quality requirements are satisfied through the use of natural water quality systems, such as ponds and wetlands, or structural water quality systems, such as filters and separators. Each state in the United States has a preferred method of water treatment based primarily on environmental factors.
Similar to the retention/detention market, future growth and demand for water quality solutions is supported by increased construction activity, EPA regulations and increasing awareness of ecological issues of water quality. According to the Freedonia Special Report, water quality solutions are forecasted to grow 10.1% annually from 2013 to 2016. Both structural and natural solutions are anticipated to have similar growth rates. Within structural solutions, both separators and filters are forecasted to grow at an annual rate of 10.1%. Structural solutions are ideal for urbanized areas or where land is expensive or not available for natural solutions.
We compete in this market with our Water Quality Units and our BaySaver and FleXstorm products. We offer a water quality solution that fits a specific state’s requirements and assists owners, developers and design engineers in remaining compliant with the EPA regulations.
- 84 -
Table of Contents
Geosynthetics
The geosynthetics market consists of geotextile, geomembrane, georid and geonet products. Geosynthetics are used in a wide range of environmental and civil engineering applications to promote drainage, retain soils, control the flow of liquids and construct natural soil structures. Demand in this market is primarily driven by trends in nonbuilding and transportation construction activity. In 2012, approximately 60% of the geosynthetics area demand was in the infrastructure and construction markets. According to a study by Freedonia on world Geosynthetics demand (December 2013), U.S. geosynthetics demand is forecasted to grow 6.5% annually to 1.1 billion square meters by 2017, from 765 million square meters in 2012. We offer geotextile products by resale agreements with leading suppliers. We are able to combine our broad product offering with our sales and distribution network to bundle and deliver geotextile products in an efficient and cost effective way for our customers.
Core End Markets
Our end markets include the non-residential construction, residential construction, agricultural and infrastructure markets.
Total Non-Residential and Residential Construction (70% of Domestic Net Sales in Fiscal Year 2013)
For fiscal year 2013, our total net sales in the U.S. non-residential and residential construction markets were $614.4 million, which represented 70% of our domestic net sales. Our products are used in a diverse range of construction projects, including the construction of streets and highways, storm and sanitary sewer systems for non-residential, residential and industrial projects, golf courses, athletic fields and other construction projects where water management solutions are needed.
Combined non-residential and residential spending reached bottom in 2009 and began to slowly recover. Driven by a recovery in the residential construction market, the combination of these two end markets is forecasted to have a CAGR of 18% from 2012 to 2016, according to McGraw Hill.
Non-Residential Construction (49% of Domestic Net Sales in Fiscal Year 2013)
For fiscal year 2013, our net sales in the U.S. non-residential construction market were $430.1 million, which represented 49% of our domestic net sales. The main drivers of our products in the non-residential construction markets include the construction of commercial buildings and office parks, shopping centers and other large retail sites, healthcare facilities and hospitals, schools and education facilities and other institutional buildings. The Federal Clean Water Act and other EPA regulations impact the stormwater management and sewer construction markets of the non-residential sector.
- 85 -
Table of Contents
Reed Construction Data is forecasting U.S. non-residential construction, consisting of commercial, institutional, manufacturing and warehouse construction, to grow 6.6% annually from 2013 to 2016 and increase 8.2% in 2014 over 2013.
U.S. Non-Residential Building Construction Starts
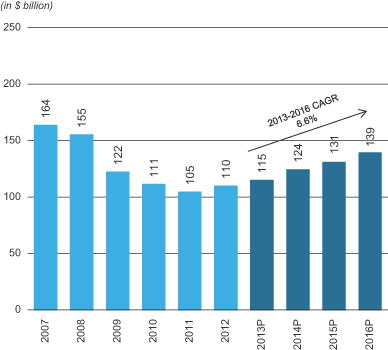
Source: Reed Construction Data
Additionally, the American Institute of Architects’ survey tracking billing activity for the industrial, residential, non-residential and institutional sectors indicates that the building construction markets continue to recover.
Architectural Billings Index Market Activity
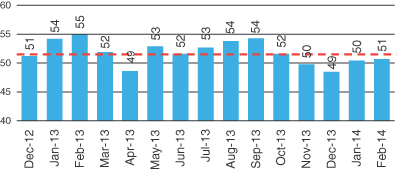
Source: American Institute of Architects
| Note: | An ABI reading above 50 indicates an increase in month-to-month seasonally adjusted billings and a reading below 50 indicates a decrease in month-to-month seasonally adjusted billings. |
- 86 -
Table of Contents
Residential Construction (21% of Domestic Net Sales in Fiscal Year 2013)
For fiscal year 2013, our net sales in the U.S. residential construction market were $184.3 million, which represented 21% of our domestic net sales. The main drivers of our products in the residential construction market include large community developments, single-family home construction, multi-family construction and home improvement spending through our various retail channels.
U.S. residential new construction has begun to recover since reaching historic lows during the recent economic downturn. According to the U.S. Census Bureau, new housing starts peaked in 2005 at approximately 2.1 million units, and subsequently declined to approximately 554,000 units in 2009. Housing starts began to recover in 2010, and strengthened to 925,000 in 2013, according to U.S. Census Bureau data. While new housing starts demonstrated an annual growth rate of 16% from 2010 to 2013, current levels remain substantially below the long-term average of 1.5 million starts since the U.S. Census Bureau began reporting the data in 1959. According to McGraw Hill, residential new housing is expected to increase to 1.13 million starts, or 17%, in 2014, and increase to 1.36 million starts, or 20%, in 2015.
As the housing market declined, homebuilders were left with excess inventory of improved lots with existing water drainage infrastructure already in place. From 2010 to 2012, as the housing market began to recover, new home sales and related construction activity occurred on those previously developed lots. As a result, we did not see an increase in sales in the residential real estate market during the early period of the housing recovery, since new home construction was occurring on parcels already developed. As this inventory of previously developed existing lots has been depleted, home builders are now looking for land acquisition and development of new housing construction, a trend which we believe will have a greater positive impact on our sales in this end market moving forward, as compared to sales that occurred during the beginning of the recovery of the housing market.
According to the American Housing Survey by the U.S. Census Bureau and the U.S. Department of Housing and Urban Development, more than 61% of the current U.S. housing stock was built before 1980 and the median estimated home age has increased from 23 years in 1985 to 37 years in 2011. We expect the home improvement market to continue to become a larger growth driver as housing markets continue to show growth and home equity values continue to increase. As of September 2013, the Home Improvement Research Institute projects that U.S. sales of repair, renovation and improvement products will grow at a rate of 5.4% in 2013, 6.8% in 2014 and 7.0% in 2015, driven by the improving economy, rising home prices and greater consumer confidence.
| Total U.S. Housing Starts | Residential Repair, Renovation and Remodeling | |
|
|
| |
| Source: McGraw Hill | Source: HIRI / IHS Global Insight | |
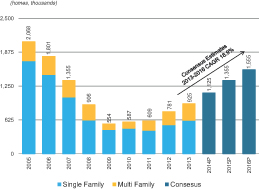
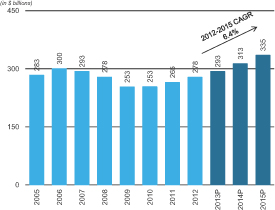
- 87 -
Table of Contents
Agriculture (21% of Domestic Net Sales in Fiscal Year 2013)
For fiscal year 2013, our net sales in the U.S. agriculture market were $184.3 million, which represented 21% of our domestic net sales. Draining cropland improves root development, resulting in stronger crops, as well as allowing for earlier planting in the spring, thereby extending the growing season. Draining cropland also reduces soil erosion by moving water underground rather than allowing it to flow over the soil surface. We have maintained a strong presence in the agriculture market for decades, as local and corporate farmers continue to appreciate the value proposition and increased crop yield associated with the use of our pipe products. The Renewable Fuel Standard mandated by the EPA, as part of the Energy Independence and Security Act of 2007, establishes levels of renewable fuels that apply to gasoline or diesel produced or imported for use. The standard currently mandates approximately 15 billion gallons of ethanol used for gasoline or diesel use. The U.S. Department of Agriculture estimates that approximately 40% of corn production in the United States is consumed by ethanol production. With ethanol requirements not expected to decline, this combined with the needs of corn for human and livestock consumption, is anticipated to keep demand at strong levels for the foreseeable future.
According to a 1998 study published by The Ohio State University (in cooperation with several U.S. Department of Agriculture agencies and other Midwest land grant universities), improved harvesting technology, including the use of drainage pipe, can improve crop yields and therefore drive growth in the agriculture market. As compared to the previous five-year period from 2004 to 2008, U.S. agricultural exports increased by nearly $230 billion between 2009 and 2013. The past five years represent the strongest five-year period for agricultural exports in the history of the United States.
U.S. and global demand for corn and soybeans, net farm income and corn use for ethanol are significant drivers of our agriculture business and are leading indicators in regards to our product demand. According to the U.S. Department of Agriculture, agricultural exports were a record $140.9 billion in 2013 and are forecasted to increase 1% in 2014. The average yield of corn for grain production in the United States is estimated at 158.8 bushels per acre, up 35.4 bushels from the 2012 average yield of 123.4. Area harvested for grain is estimated at 87.7 million acres, up slightly from 2012. The average yield per acre of soybean production is estimated at 43.3 bushels, 3.5 bushels above last year’s yield. Harvested area is down slightly from 2012 to 75.9 million acres. Increases in production levels generate market demand for our products.
A rise in net farm income is a driving factor in growth in the drainage products industry. According to the U.S. Department of Agriculture, net farm income increased to $130.5 billion in 2013, up from $85.0 billion in 2008. The U.S. Department of Agriculture estimates that 40% of corn production in the United States is consumed by ethanol production, with requirements not expected to decline in the near future.
- 88 -
Table of Contents
The average value of cropland in the United States has risen from $1,750 per acre in 2004 to $4,000 in 2013, which in combination with the rise in net farm income leads to greater net worth for farmers. This makes drainage an attractive investment leading to higher land values for improved land, increased yields and lower cost for the farmer.
Average Cropland Value — United States
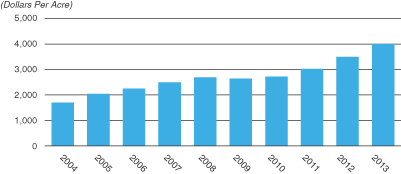
Source: U.S. Department of Agriculture
Infrastructure (9% of Domestic Net Sales in Fiscal Year 2013)
For fiscal year 2013, our net sales in the U.S. infrastructure market were $79.0 million, which represented 9% of our domestic net sales. The main drivers of our products in the infrastructure market include the construction of streets and highways, storm and sanitary sewers, airports and railroads. The infrastructure market includes publicly-funded projects which often require local, state or federal government approvals. Many sanitary sewer construction and repair projects are funded through the implementation of increased water and drainage rates, levies and taxes.
- 89 -
Table of Contents
The aging infrastructure in the United States is expected to require repair or replacement in the coming years. The U.S. road network and sewer systems consist of approximately four million and 800,000 miles, respectively, of public road and highways and sewer mains that were primarily constructed over 50 years ago. The American Society of Civil Engineers, or ASCE, rated the overall U.S. infrastructure a grade of D+ in its recent 2013 report card, and estimates that $298 billion is needed over the next 20 years to replace and upgrade the existing wastewater infrastructure in the United States. ASCE’s primary concern is the need to address sanitary and combined sewer overflows. Citing the 2008 Clean Watersheds Needs Survey, the ASCE report states $64 billion is needed to address combined sewer overflows and stormwater management over the 20-year period (CSOs). At times of significant rainfall, the capacity of the CSO is exceeded, leading to a combination of storm and sanitary wastewater being discharged into streams and rivers. The ASCE report states that 32% of major roads are in poor or mediocre condition. The report also states that 42% of the urban highways remain congested, costing $101 billion in wasted time and fuel. There are four million miles of public roads and highways in the United States, primarily constructed over 50 years ago. The Federal Highway Administration estimates that $170 billion is needed annually to improve the condition of the nation’s roads and highways, a significant increase from the $101 billion that is needed to just maintain their current condition.
| Street and Highway Spending | Sewer Spending | |
|
|
|
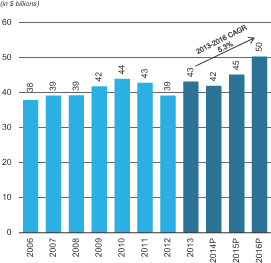
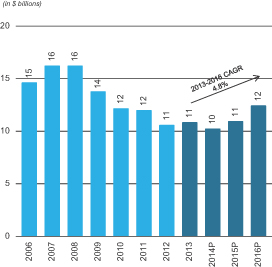
Source: McGraw Hill
The recently enacted highway bill, “Moving Ahead for Progress in the 21st Century (MAP-21),” was signed into law in July 2012 and provides funding for federal transportation programs through the U.S. federal government’s fiscal year ending September 30, 2014 with annual funding levels approximating the levels in the U.S. federal government’s fiscal year ended September 30, 2012. Typically, federal funding for road construction represents 25-35% of a state’s transportation budget, but analysts believe that the federal program heavily impacts each State’s overall ability to plan and fund the majority of larger state/local road construction projects, which generally range in duration from one to five years. Most notable within MAP-21 is the “Transportation Infrastructure Finance and Innovation Act (TIFIA)” program’s expansion and simplification, which could potentially increase the overall reach of the federal construction budget by about 50%. The majority of Map-21’s direct budget authority is through regular highway grants, which provides states with funding of $37.5 billion in the U.S. federal government’s fiscal year ended September 30, 2013 and $37.8 billion in the U.S. federal government’s fiscal year ending September 30, 2014, essentially flat versus the U.S. federal government’s fiscal year ended September 30, 2012.
- 90 -
Table of Contents
Company Overview
We are the leading manufacturer of high performance thermoplastic corrugated pipe, providing a comprehensive suite of water management products and superior drainage solutions for use in the construction and infrastructure marketplace. Our innovative products are used across a broad range of end markets and applications, including non-residential, residential, agriculture and infrastructure applications. We have established a leading position in many of these end markets by leveraging our national sales and distribution platform, our overall product breadth and scale and our manufacturing excellence. In North America, our national footprint combined with our strong local presence and broad product offering makes us the leader in an otherwise highly fragmented sector comprised of many smaller competitors. We believe the markets we serve in the United States represent approximately $10.1 billion of annual revenue opportunity. In addition, we believe the increasing acceptance of thermoplastic pipe products in international markets represents an attractive growth opportunity. For the nine months ended December 31, 2013, we generated net sales of $887.8 million, net income of $24.7 million and Adjusted EBITDA of $130.6 million. For a reconciliation of Adjusted EBITDA to the most directly comparable GAAP measure, see “Selected Historical Consolidated Financial Data.”
Our products are generally lighter, more durable, more cost effective and easier to install than comparable alternatives made with traditional materials. Following our entrance into the non-residential construction market with the introduction of N-12 corrugated polyethylene pipe in the late 1980s, our pipe has been displacing traditional materials, such as reinforced concrete, corrugated steel and polyvinyl chloride, or PVC, across an ever expanding range of end markets. This has allowed us to consistently gain share and achieve above market growth throughout economic cycles. We expect to continue to drive conversion to our products from traditional products as contractors, civil design engineers and municipal agencies increasingly acknowledge the superior physical attributes and compelling value proposition of our thermoplastic products. In addition, we believe that overall demand for our products will benefit as the regulatory environment continues to evolve.
Our broad product line includes corrugated high density polyethylene (or HDPE) pipe, polypropylene (or PP) pipe and related water management products. Building on our core drainage businesses, we have aggressively pursued attractive ancillary product categories such as storm and septic chambers, PVC drainage structures, fittings and filters, and water quality filters and separators. We refer to these ancillary product categories as Allied Products. Given the scope of our overall sales and distribution platform, we have been able to drive growth within our Allied Products and believe there are significant growth opportunities going forward.
We have an extensive domestic network of 48 manufacturing plants and 19 distribution centers allowing us to effectively serve all major markets in all 50 U.S. states. The effective shipping radius for our pipe products is approximately 200 miles, thus competition in our industry tends to be on a regional and local basis with minimal competition from distant markets and imports. We are the only supplier in our industry with a national footprint, thereby allowing us to efficiently service those customers that value having one source of supply throughout their entire distribution network. We believe our extensive national footprint creates a cost and service advantage versus our HDPE pipe producing competitors, the largest of which has only 10 domestic HDPE pipe manufacturing plants. Internationally, we have two manufacturing plants and three distribution centers in Canada, four manufacturing plants in Mexico, four manufacturing plants and five distribution centers in South America and one distribution center in Europe.
The majority of our sales are made through long-standing distribution relationships with many of the largest national and independent waterworks distributors, including Ferguson, HD Supply and WinWholesale, who sell primarily to the storm sewer and sanitary sewer markets. We also utilize a network of hundreds of small to medium-sized independent distributors across the United States. We have strong relationships with major national retailers that carry drainage products, including The Home Depot, Lowe’s, Ace Hardware, Menards and Do it Best, and also sell to buying groups and co-ops in the United States that serve the plumbing, hardware,
- 91 -
Table of Contents
irrigation and landscaping markets. The combination of our large sales force, long-standing retail and contractor customer relationships and extensive network of manufacturing and distribution facilities complements and strengthens our broad customer and market coverage.
We believe the ADS brand has long been associated with quality products and market-leading performance. Our trademarked green stripe, which is prominently displayed on many of our products, serves as clear identification of our commitment to the customers and markets we serve.
As illustrated in the charts below, we provide a broad range of high performance thermoplastic corrugated pipe and related water management products to a highly diversified set of end markets and geographies.
Our Strengths
We believe that we benefit significantly from the following competitive strengths:
Market leader with unmatched scale
We are the leading manufacturer of high performance thermoplastic corrugated pipe and a leading manufacturer of related water management products. Our significant scale and market share position enable us to manufacture and distribute a broad range of high quality, attractively priced products. Our industry-leading manufacturing, engineering excellence, product innovation and world-class reputation are significant competitive advantages. We believe we have the largest sales force in the industry, with approximately 230 dedicated direct sales professionals that call on engineers, contractors and developers, allowing us to achieve direct access to numerous selling opportunities and end users. We believe our extensive national footprint of 48 manufacturing plants and 19 distribution centers creates a cost and service advantage versus our HDPE pipe producing competitors, the largest of which has only 10 domestic HDPE pipe manufacturing plants. We maintain an in-house fleet of approximately 625 tractor-trailers and approximately 1,100 trailers that are specially designed to
- 92 -
Table of Contents
haul our lightweight pipe and fittings products. Our effective shipping radius is approximately 200 miles from one of our manufacturing plants or distribution centers. Our world-class manufacturing expertise and extensive national distribution and fleet network allow us to service customers across the United States on a cost-effective and timely basis. Our long-standing customer relationships also provide us with visibility to attractive market opportunities.
Well positioned to drive continued material conversion
Our products are generally lighter, more durable, more cost effective and easier to install than comparable alternatives made with traditional materials. For example, concrete pipe generally weighs more than 20 times as much per foot as our thermoplastic pipe, resulting in the significant handling advantages that our product line enjoys during installation by contractors. These advantages typically provide our thermoplastic pipe with an installed cost advantage of approximately 20% over concrete pipe. High performance thermoplastic corrugated pipe represented approximately 25% of the total storm sewer market in 2012, up from what we believe was less than 10% ten years ago and less than 1% twenty years ago. We believe the penetration rate will continue to increase over time, as contractors, engineers and municipal agencies increasingly acknowledge the superior attributes and compelling value proposition of our thermoplastic products. We believe the recent introduction of our PP pipe products will also help accelerate this conversion given the additional applications for which our PP pipe products can be used. We continue to drive this material conversion through extensive sales force training and education of our customers. Our direct sales team is supported by approximately 50 field-based engineers who work closely with government agencies to obtain regulatory approval for our products, as well as with civil engineering firms influencing the specification of our products on construction projects. We have been at the forefront of educating an industry undergoing significant change in the regulatory environment, while pushing for expanded approvals of our products in new markets and geographies. Since 2006, 32 states have enhanced their approval of our pipe products, and an average of approximately 60 state, county and municipal approvals have been added or enhanced each year over the past five years.
Broad portfolio of Allied Products
Our Allied Products include storm and septic chambers, PVC drainage structures, fittings and filters and water separators. These products complement our pipe product lines and allow us to offer a comprehensive water management solution to our customers and drive organic growth.
We have a long history of leveraging our broad distribution platform to develop or acquire, and market, complementary Allied Products that provide new technologies and product capabilities, such as Nyloplast, StormTech, FleXstorm and Inserta Tee. Given our strong brand recognition, network of customer and distributor relationships and large team of trained salespeople, we believe we are the acquirer of choice for many providers of ancillary products who wish to partner with an industry leader. Our broad product line and reputation for quality provide our sales force with a competitive advantage in sourcing new opportunities and cross-selling products. Our broadly diversified product offering presents our customers with the ability to purchase a comprehensive water management solution from a single vendor. The breadth of our product offering allows distributors to minimize their number of transactions and keep order minimums low. Our ability to offer a diverse product suite is a key selling strategy and a driver of our growth and profitability.
Industry-leading manufacturing and technical expertise
We believe we have developed a reputation in the industry for products that deliver technically-superior performance with lower installation and maintenance costs versus competing products. Our products are: (i) lightweight and flexible — allowing for easy and low-cost installation and thereby significantly reducing the need for heavy equipment; (ii) strong — the corrugated profile design of our thermoplastic pipe products provides strength comparable to much heavier materials; (iii) resistant to corrosion — polyethylene and
- 93 -
Table of Contents
polypropylene are chemically inert materials; and (iv) resistant to abrasion — polyethylene and polypropylene have an excellent service life expectancy. We believe these characteristics provide our products with a competitive advantage over traditional products.
Our manufacturing process utilizes proprietary production equipment, designed by us in partnership with our equipment suppliers, that we believe is faster and more efficient than the equipment available to other companies. Our significant investment in custom-designed mold and die tooling ($173 million investment over the last nine years) allows us to manufacture a variety of corrugated pipe sizes and provides us with the flexibility to meet demand fluctuations in local regions. In addition, we rotate these setups across our network of manufacturing plants as needed to meet demand, which provides us with a unique competitive advantage. We believe that the footprint of our manufacturing plants, combined with our manufacturing technology and a low-cost production profile, provide a significant competitive advantage. The broad range of pipe sizes and custom products that we produce and maintain in finished goods inventory at numerous manufacturing plants and distribution centers provides our customers with a rapid delivery cycle, which is important to project contractors. We employ proprietary resin blending technology to minimize raw material cost and optimize production efficiency, while maintaining a consistent level of product performance. Utilizing this technology has allowed us to increase our ratio of recycled resin as a percent of total resin from approximately 24% in 2005 to approximately 52% in 2013, resulting in significant cost savings and reduced exposure to fluctuations in raw material costs.
Long-term customer relationships
We believe we have the largest and most experienced sales force in the industry, which allows us to maintain strong, long-standing relationships with key distributors, contractors and engineers. We also have sales agreements with many of the premier national distributor groups.
The combination of our technical expertise, product selection and customer delivery capabilities allows us to meet our customers’ critical installation schedules and positions us as a strategic partner. We strive to educate the regulatory and design community while offering the distributor and contractor network a comprehensive product suite. Our products are manufactured, assembled, delivered and serviced from a network of plants and yards that are strategically positioned in close proximity to most major domestic geographic markets.
We strive to be meaningfully involved in all phases of the project cycle, including design, bidding, award and installation. Many of our 230 sales professionals have technical or engineering backgrounds, which helps them educate design specialists on the benefits of our products. Our direct sales force is supported by approximately 50 field-based engineers who work closely with government agencies to obtain regulatory approval for our products and also help educate design engineers to encourage the specification and inclusion of our products into new projects. We consistently maintain thousands of touch-points with customers and regulatory authorities, continuously educating them on new product innovations, regulatory changes and the benefits of our products over traditional products. Our national scale combined with our local presence, dedication to service and broad product offering has enabled us to maintain our long-standing customer relationships.
Highly diversified across end markets, channels and geographies
We are strategically diversified across a broad range of end markets, distribution channels and geographies. We believe the markets we serve in the United States represent approximately $10.1 billion of annual revenue opportunity. Our products are used globally in a diverse range of end markets across non-residential construction, residential construction, agriculture and infrastructure. These end markets include storm sewer systems, agriculture, retail, stormwater retention/detention, on-site septic systems and structures. We maintain and service these end markets through strong product distribution relationships with many of the largest national and
- 94 -
Table of Contents
independent waterworks distributors, including Ferguson, HD Supply and WinWholesale, who sell primarily to the storm sewer and sanitary sewer markets. We also maintain relationships with a network of hundreds of small to medium-sized distributors across the United States. We also have strong relationships with major national retailers that carry drainage products, including The Home Depot, Lowe’s, Ace Hardware, Menards and Do it Best. We also sell through a broad variety of buying groups and co-ops in the United States. These groups are made up of related distribution members that leverage their collective buying power under a unified association. In addition to our large sales force and manufacturing footprint, our preferred vendor status with these groups allows us to reach thousands of locations in an effective manner. Organized buying groups include, but are not limited to, building products, waterworks, plumbing, landscaping, irrigation and hardware.
We serve our customers in all 50 U.S. states as well as approximately 90 other countries. Our domestic sales, which represented approximately 86% of our net sales in fiscal year 2013, are diversified across all regions of the United States. Approximately 14% of our net sales in fiscal year 2013 were generated outside of the United States. Our international growth strategy is focused on expanding our Canadian business and our joint ventures with best-in-class local partners in Mexico, Central America and South America. This joint venture strategy has provided us with local and regional access to markets such as Brazil, Chile, Argentina, Peru and Colombia.
Experienced management team with successful operating record and significant equity ownership
Our management team, led by our Chief Executive Officer, Joe Chlapaty, has an average of over 23 years of industry experience. We have a long history of generating profitable growth, attractive margins and cash flow. During periods of weaker economic conditions, we believe we have benefitted from an increased market focus on our products as a cost effective alternative to traditional materials. In stronger economic cycles, we have delivered profitable growth and an ability to leverage our scale and excess production capacity to meet rapid increases in demand. We believe we have managed our industry-leading cost profile and profitability throughout economic cycles by driving continuous improvement initiatives in our manufacturing, distribution and service operations. Raw material costs are a significant portion of the cost of our pipe products, but we have been successful over time at passing through raw material cost increases to maintain our margins.
Our management and directors own approximately 19.2% of our capital stock on a fully-converted basis while our employees own an additional approximately 29.7% on a fully-converted basis through our employee stock ownership plan, or ESOP. After the completion of this offering, our management and directors will own approximately % of our common stock on a fully-converted basis. In addition, after the completion of this offering, the convertible preferred stock held by our ESOP will account for approximately % of our common stock on a fully-converted basis. This high level of management and employee ownership ensures that incentives are closely aligned with equity holders.
Our Business Strategy
We intend to grow our net sales, improve our profitability and enhance our position as the leading provider of high performance thermoplastic corrugated pipe and related water management products by executing on the following strategies.
Continue to drive conversion to our products
Our products are generally lighter, more durable, more cost effective and easier to install than comparable alternatives made with traditional materials such as concrete, steel and PVC. For example, concrete pipe generally weighs more than 20 times as much per foot as our thermoplastic pipe, resulting in the significant handling advantages that our product line enjoys during installation by contractors. These advantages typically provide our thermoplastic pipe with an installed cost advantage of approximately 20% over concrete pipe. We
- 95 -
Table of Contents
intend to continue to drive conversion to our products from traditional products as contractors, engineers and municipal agencies increasingly acknowledge the superior attributes and compelling value proposition of our thermoplastic products. Expanded regulatory approvals allow for their use in new markets and geographies, and we continue to invest heavily in industry education. We believe we are the industry leader in these efforts, particularly in promoting N-12 and SaniTite HP for storm and sanitary sewer systems, as regulatory approvals are essential to the specification and acceptance of these product lines.
The market conversion opportunities in Canada are similar to those in the United States except that the storm sewer market for HDPE and PP corrugated pipe is less developed. Recent approvals are accelerating the replacement of traditional materials. In Mexico, Central America and South America, sales opportunities to replace PVC pipe and concrete pipe in storm sewer, sanitary sewer, highway and electrical conduit markets continue to gain momentum as our sales force focuses on future market development.
Expand our product offering and markets served
We are able to successfully capitalize on our product development capabilities through our market presence, sales and distribution channels and customer relationships. Our ability to further develop our offering of Allied Products represents an attractive opportunity to capture additional growth and improve our overall margins. We have a dedicated team focused solely on selling Allied Products to our various end markets. We will continue to focus on enhancing our core products and expanding our Allied Products through cross-selling opportunities in order to further penetrate untapped markets and customers.
Our strong market position provides us with insight into the evolving needs of our customers, which has allowed us to proactively develop and deliver comprehensive water management solutions. The strength of our overall sales and distribution platform has allowed us to acquire new Allied Products and deliver solution-based product portfolios that typically result in significantly higher net sales post-acquisition than the products generated before the addition to our product portfolio.
We recently developed and introduced several innovative new products: SaniTite HP pipe for the storm sewer and sanitary sewer markets and StormTech Mega-Chamber products for the stormwater retention/detention market. These products are opening new avenues of growth for us and are providing access to new customers, selling opportunities and product conversion.
| • | SaniTite HP is a higher-performance polypropylene-based version of our popular N-12 product that is the result of more than three years and $3 million of R&D as well as $25 million of investments in production capacity. SaniTite HP offers us a large diameter (12” to 60”) storm and sanitary sewer product line to compete with PVC, concrete and steel pipe in the storm and sanitary sewer markets. Higher performance characteristics are driving sales growth through new and expanded regulatory approvals. |
| • | Our StormTech Mega-Chamber stormwater retention/detention chambers are innovative new products that deliver increased underground storage with a compact product installation footprint, providing an attractive design option for engineers working on project sites where land is limited and/or expensive. These new chambers enable us to continue to accelerate our market share capture from large diameter corrugated metal pipe and pond-based retention/detention while accelerating the growth of Nyloplast basins, related water quality filters and pipe product sales. |
We also expect to continue to enter into selective adjacent new markets that leverage our sales and engineering capabilities, customer relationships and national distribution network and provide more water management solutions to our customers.
- 96 -
Table of Contents
Expand our presence in attractive new geographies
Outside of the United States, we believe thermoplastic corrugated pipe represents a small part of the overall market. We further believe there is significant opportunity to convert new geographies based on the overall performance and value of our products, similar to what continues to occur in our existing markets. For example, in terms of opportunity for our products, the Canadian market is similar to the United States. The establishment of our facilities, sales and engineering teams in Canada strengthens our position and gives us a local presence in order to capitalize on these opportunities. To date, in order to increase our speed to market, we have expanded internationally primarily through joint ventures with best-in-class local partners. Our existing joint ventures provide us with access to markets such as Brazil, Chile, Argentina, Mexico, Peru and Colombia. Combining a local partner’s customer relationships, brand recognition and local management talent, with our world-class manufacturing and process expertise, broad product portfolio and innovation, creates a strong platform with additional opportunities for international expansion. Our South American Joint Venture recently opened a second manufacturing plant in northeast Brazil to better service our growing business in this portion of the country, as well as doubling our production capacity to make N-12 pipe.
The introduction of our products in Brazil, Chile and other South American countries offers additional growth opportunities in areas where there is an increasing focus on the positive impact of drainage for roads and non-residential and residential construction. In the future, we will continue to identify new geographies to access markets through joint venture relationships with domestic partners in targeted areas.
Capitalize on growth related to the recovery in our primary end markets
We believe we are well positioned to take advantage of renewed growth and recovery in the non-residential and residential construction and infrastructure markets in the United States. As it has in prior cycles, the recovery in non-residential construction has lagged residential recovery but began to improve modestly in 2012. According to the U.S. Census Bureau, the new residential construction market in the United States is in the midst of a recovery after declining to an historic low of 554,000 housing starts in 2009. In 2013, new housing starts were 925,000, and McGraw Hill projects growth of 22% in 2014, 20% in 2015 and 15% in 2016, when total housing starts are expected to reach their 50-year average of 1.5 million. Additionally, we believe we have the potential to capitalize on a substantial backlog of deferred infrastructure spending in the United States as a result of upgrades and repairs that were delayed in the recent economic downturn. Spending on the replacement of aging water drainage and sewer infrastructure (estimated to cost approximately $298 billion between 2013 and 2033, according to ASCE), and stricter U.S. Environmental Protection Agency, or EPA, guidelines for stormwater and wastewater management will drive additional demand for our products.
Continue our focus on operational excellence
Our focus on continuously improving operating efficiencies, reducing costs and improving product quality has enabled us to improve our position as a leading low-cost provider. We believe our lower production cost profile and a rapid customer delivery cycle serves as a significant competitive advantage.
We constantly strive to achieve operating and cost efficiencies across all facets of our business. For example, we employ sophisticated resin blending technology to minimize raw material costs and optimize production efficiency, while maintaining a high level of product quality and performance. We have implemented continuous improvement practices across all plants; and currently have three plant sites with comprehensive lean-six sigma-5S programs in early phases of implementation. We are already realizing benefits from these initiatives in many areas including product quality, productivity, safety, uptime and customer service.
Our production lines are built with transportable mold and die tooling, which provides us with the flexibility to maximize production capacity and leverage capital expenditures. We have a dedicated team of approximately 40 skilled tradesmen (tool and die machinists, fabricators, electricians) who build, service and maintain our
- 97 -
Table of Contents
molds and dies along with various plant equipment. This affords us high levels of uptime, equipment consistency and standardization and a low cost basis versus externally sourced machine shop services. We also have a specialized group of approximately 15 mechanical and industrial engineers who focus on optimizing efficiency, outfitting facilities and training employees and ensuring that we employ best practices across all of our locations.
Selectively pursue strategic acquisitions
By utilizing our customer relationships and sales force, we have a demonstrated ability to identify and integrate numerous strategic acquisitions. We believe our strong reputation for product growth has allowed us to become the acquirer of choice, attracting acquisition opportunities that provide new technologies and product capabilities. The acquisitions of strategic product lines such as BaySaver, FleXstorm, Nyloplast, Inserta Tee and StormTech have strengthened our market position while enhancing long-term growth and profitability. These strategic additions have allowed us to expand our suite of water management products.
We have remained one of the strongest and best capitalized companies in the industry throughout the recent economic cycle and are well positioned to capitalize on current market dynamics to selectively acquire key products and technologies. We have strong industry relationships and maintain an active acquisition pipeline.
- 98 -
Table of Contents
Product Portfolio
We design, manufacture and market a complete line of high performance thermoplastic corrugated pipe and related water management products for use in a wide range of end markets. Our product line includes: single, double and triple wall corrugated polypropylene and polyethylene pipe, or Pipe, and a variety of Allied Products including: storm and septic chambers, or Chambers; PVC drainage structures, or Structures; fittings and filters, or Fittings; and water quality filters and separators, or Water Quality. We also sell various complementary products distributed through resale agreements, including geotextile soil stabilization products, or Other Resale.
An overview of our product offerings is provided below:
| Product Offering |
Description |
Brands/Offerings |
Images | |||
| Pipe (76% of Total Net Sales in Fiscal Year 2013) | ||||||
| High density polyethylene and polypropylene pipe | Dual Wall Corrugated Pipe, HP Storm Pipe, SaniTite HP Pipe, Single Wall Corrugated Pipe, Triple Wall Corrugated Pipe, Smoothwall HDPE Pipe |

| ||||
| Allied Products (24% of Total Net Sales in Fiscal Year 2013) |
||||||
| Chambers |
Underground chambers made from polypropylene that can function as stormwater detention, retention, and/or “first flush” storage systems | StormTech, ARC (Septic Chambers), BioDiffuser (Septic Chambers) |

| |||
| Structures |
Drainage structures consisting of inline drains, drain basins, curb inlet structures, and drop-in grates in diameters ranging from 8” to 30” | Nyloplast, Inserta Tee |


| |||
| Fittings |
Standard and fabricated joining systems | Fittings |

| |||
| Water Quality |
Water quality structures and filters | BaySeparator, BayFilter, Water Quality Units, FleXstorm |

| |||
| Other Resale |
Complementary products providing services adjacent to core expertise | Geotextiles |

| |||
- 99 -
Table of Contents
Pipe
Dual Wall Corrugated Pipe
Our N-12 is a dual wall HDPE pipe with a corrugated exterior for strength and a smooth interior wall for hydraulics and flow capacity. Our N-12 pipe competes in the storm sewer and drainage markets that are also served by concrete pipe.
Our N-12 pipe is available in 17 different diameters ranging from 2” to 60” and in sections ranging from 10’ to 30’ in length. N-12 provides joint integrity, with integral bell and spigot joints for fast push-together installation, and is also sold with watertight and soil-tight coupling and fitting systems.
Our corrugated polyethylene pipe offers many benefits including ease of installation, job-site handling and resistance to corrosion and abrasion. Corrugated pipe can easily be cut or coupled together, providing precise laying lengths while minimizing installation waste and difficulty.
HP Storm Pipe and SaniTite HP Pipe
Our HP Storm pipe utilizes polypropylene resin, which provides (i) increased pipe stiffness relative to HDPE; (ii) higher Environmental Stress Crack Resistance, or ESCR; and (iii) improved thermal properties, which improves joint performance. These improved physical characteristics result in a reduced need for select backfill, which creates installation savings for customers, and increase the effective service life of the product, which reduces the overall product cost and expands the range of possible product applications.
Our SaniTite HP pipe utilizes the same polypropylene resins as our HP Storm pipe but includes a smooth third exterior wall in 30” to 60” pipe. The highly engineered polypropylene resin along with the triple wall design enables SaniTite HP to surpass the 46 pounds per square inch, or psi, stiffness requirement for sanitary sewer applications. SaniTite HP offers cost and performance advantages relative to reinforced concrete pipe (such as improved hydraulics and better joint integrity) and PVC pipe (such as impact resistance).
Single Wall Corrugated Pipe
Our single-wall corrugated HDPE pipe is ideal for drainage projects where flexibility, light weight and low cost are important. Single wall HDPE pipe products have been used for decades in agricultural drainage, highway edge drains, septic systems and other construction applications. In the agricultural market, improved technology has highlighted the impact of drainage on crop yields. For homeowners, it is an economical and easily-installed solution for downspout run-offs, foundation drains, driveway culverts and general lawn drainage. Single wall pipe is also used for golf courses, parks and athletic fields to keep surfaces dry by channeling away excess underground moisture.
Standard single-wall products are available in 2” to 24” diameters and sold in varying lengths. Pipe with 2” to 6” diameters is typically sold in coils ranging from 25’ to 3,000’ in length, while larger diameter pipe is typically sold in 20’ lengths. Pipe can be either perforated or non-perforated depending on the particular drainage application.
Triple Wall Corrugated Pipe and Smoothwall HDPE Pipe
Our ADS-3000 Triple Wall pipe, small diameter triple wall corrugated pipe, consists of a corrugated polyethylene wall molded between a smooth white outer wall and a smooth black inner wall. This combination of the three wall design adds strength and stiffness, while reducing weight as compared to PVC 2729. Triple Wall is produced in two sizes, 3” and 4”, and sold through our distribution network.
- 100 -
Table of Contents
We also manufacture smoothwall HDPE pipe in 3”, 4”, and 6” diameters that are sold into the residential drainage and on-site septic systems markets.
Allied Products
We produce a range of additional water management products that are complementary to our pipe products. Our Allied Products offer adjacent technologies to our core pipe offering, presenting a complete drainage solution for our clients and customers. This combination of pipe and Allied Products is a key strategy in our sales growth, profitability and market share penetration. The practice of selling a drainage system is attractive for distributors and the end user, by providing a broad package of products that can be sold on individual projects, and strengthens our competitive advantage in the marketplace. We aggressively seek and evaluate new products, technologies and regulatory changes that impact our customers’ needs for Allied Products.
Using the strength of our overall sales and distribution platform, our Allied Product strategy allows us to more deeply penetrate our end markets and anticipate the evolving needs of our customers. The underground construction industry has historically been project (not product) driven, creating the impetus for owners, engineers and contractors to seek manufacturers that deliver solution-based product portfolios. Many of the components of underground construction are related and require linear compatibility of function, regulatory approval and technology.
Storm and Septic Chambers
We produce and sell our StormTech chambers that are used for the stormwater retention, detention and “first flush” underground water storage systems on non-residential site development and public projects. These highly engineered chambers are injection molded from high density polyethylene and polypropylene resins into a proprietary design which provides strength, durability, and resistance to corrosion. The chambers allow for the efficient storage of stormwater volume at minimum depths, reducing the underground construction footprint and costs to the contractors, developers, and property owners. Our StormTech chambers offer great flexibility in design and layout of underground water storage system. They are an attractive alternative to open ponds by reducing ongoing maintenance and liability and providing more useable land for development. Stormwater runoff is collected and stored in rows of chambers and gradually reenters the water table through a gravel base, reducing erosion and protecting waterways. The chambers are open bottom, which allows for high density stacking in both storage and shipment. This freight-efficient feature drives favorable cost-competitiveness in serving long-distance export markets. These chamber systems typically incorporate our other product lines such as corrugated pipe, fabricated fittings, water quality units and geotextiles.
Our ARC and BioDiffuser products are chambers that are used in on-site septic systems for residential and small volume non-residential wastewater treatment and disposal. Rural homes and communities that do not have access to central sewer lines require an on-site septic solution. Our ARC and BioDiffuser chamber products are installed and perform their septic treatment function without gravel, reducing costs to the contractor and homeowner over traditional pipe and stone systems. States and municipalities have different sizing criteria for on-site septic treatment systems based on soil and site conditions. The innovative design of our ARC chamber is generally approved for a footprint reduction, further reducing the cost of the septic system. Injection-molded from high density polyethylene, these products are strong, durable, and chemical-resistant. These interconnecting chambers are favored by septic contractors because they are lightweight, easy to install and offer articulating features which increase site-specific design flexibility.
Structures
Our Nyloplast PVC drainage structures are used in non-residential, residential and municipal site development, road and highway construction, as well as landscaping, recreational, industrial and mechanical applications. The product family includes inline drains, drain basins, curb inlets and water control structures
- 101 -
Table of Contents
which move surface-collected stormwater vertically down to pipe conveyance systems. These custom structures are fabricated from sections of PVC pipe using a thermo-forming process to achieve exact site-specific hydraulic design requirements. Our Nyloplast products are a preferred alternative to heavier and larger concrete structures, by offering greater design flexibility and improved ease of installation which reduces overall project costs and timelines. The structures incorporate rubber gaskets to ensure watertight connections, preventing soil infiltration which plagues competitive products.
Our Inserta Tee product line consists of a PVC hub, rubber sleeve and stainless steel band. Inserta Tee is compression fit into the cored wall of a mainline pipe and can be used with all pipe material types and profiles. This product offers an easy tap-in to existing sanitary and storm sewers by limiting the excavation needed for installation compared to competitive materials.
Fittings
We produce fittings and couplings utilizing blow molding, injection molding and custom fabrication in addition to protective filters on our pipe products. Our innovative coupling and fitting products are highly complementary to our broader product suite, and include both soil-tight and water-tight capabilities across the full pipe diameter spectrum. Our fittings are sold in all end markets where we sell our current pipe products.
Water Quality
Our BaySaver product line targets the removal of sediment, debris, oils and suspended solids throughout a stormwater rain event by separating and/or filtering unwanted pollutants. Our BaySeparators can be fabricated into multiple sizing combinations to fit a variety of applications and customer requirements. These products assist owners, developers and design engineers in remaining compliant with discharge requirements set forth by the EPA as well as state and local regulatory agencies. Our BaySaver product line coupled with our pipe, StormTech chambers, fabricated fittings, Nyloplast structures, FleXstorm inlet protection systems and geotextiles make up a comprehensive stormwater management solution.
Construction Fabrics & Geotextiles
We purchase and distribute construction fabrics and other geosynthetic products for soil stabilization, reinforcement, filtration, separation, erosion control, and sub-surface drainage. Constructed of woven and non-woven polypropylene, geotextile products provide permanent, cost-efficient site-development solutions. Construction fabrics and geotextiles have applications in all of our end markets.
Customers
We have a large, active customer base of over 17,000 customers, with no customer representing more than 10% of fiscal year 2013 net sales. Our customer base is diversified across the range of end markets that we serve.
A majority of our sales are made through distributors, including many of the largest national and independent waterworks distributors, with whom we have long-standing distribution relationships. These include Ferguson, HD Supply and WinWholesale, who sell primarily to the storm sewer and sanitary sewer markets. We also utilize a network of hundreds of small to medium-sized independent distributors across the United States. We have strong relationships with major national retailers that carry drainage products, including The Home Depot, Lowe’s, Ace Hardware, Menards and Do it Best. We offer the most complete line of HDPE products in the industry and are the only national manufacturer that can service the “Big-Box” retailers from coast-to-coast. We also sell to buying groups and co-ops in the United States that serve the plumbing, hardware, irrigation and landscaping markets. Selling to buying groups and co-ops provides us a further presence on a national, regional and local basis for the distribution of our products. Our preferred vendor status with these groups allows us to reach thousands of locations in an effective manner. Members of these groups and co-ops generally are
- 102 -
Table of Contents
independent businesses with strong relationships and brand recognition with smaller contractors and homeowners in their local markets. The combination of our large sales force, long-standing retail and contractor customer relationships and extensive network of manufacturing and distribution facilities complements and strengthens our broad customer and market coverage.
An important element of our growth strategy has been our focus on industry education efforts to drive regulatory approvals for our core HDPE products at national, state and local levels. We employ a team of approximately 50 field-based engineers who work closely with government agencies to obtain regulatory approvals for our products, and also with civil engineering firms to specify our products on non-residential construction and road-building projects. We consistently maintain an active dialogue with customers, civil engineers and municipal authorities, continuously educating them on new product innovations and their advantages relative to traditional products. With the introduction of our N-12 HP storm and sanitary pipe, we have refocused our efforts calling on state departments of transportation to enhance their approval of our pipe products. Additional state and local regulatory approvals will continue to present new growth opportunities in new and existing geographic markets for us.
For example, we have recently obtained approval for HP pipe use in several areas that had previously not approved our N-12 HDPE product — Colorado DOT, Missouri DOT, City of Atlanta, Metro St. Louis Sewer District, City of Indianapolis, Denver Metro Wastewater Reclamation District, and New York City Department of Buildings.
Our customer service organization of more than 100 employees is supplemented by the employees of our 58 manufacturing plants, 28 distribution centers and drivers of our approximately 625 tractor-trailers. In conjunction with our field sales and engineering team, this highly-trained and competent staff allows us to maintain more customer touch points and interaction than any of our competitors.
We staff and operate four regional customer service call centers located in three time zones where orders are processed. With some of our larger customers, we process orders electronically via electronic data interchange (EDI). Additionally, we send advance shipment notifications and invoices electronically to these customers. These capabilities strengthen the supply chain integration with large customers such as The Home Depot, Lowes, Ferguson and HD Supply. New orders are entered into our Oracle system, assigned to our closest manufacturing plant or distribution center in that geography, and then consolidated to optimize freight efficiency, payload and lead-time performance to meet customer requirements.
Sales and Marketing
We believe we have the largest and most experienced sales force in the industry, with approximately 230 dedicated direct sales professionals that call on engineers, contractors, distributors and developers. Offering the broadest product line in the industry enables our sales force to source the greatest number of new opportunities and more effectively cross-sell products than any of our competitors. We consistently maintain thousands of touch-points with customers, civil engineers and municipal authorities, continuously educating them on new product innovations and their advantages relative to traditional products. We believe we are the industry leader in these efforts and we view this work as an important part of our marketing strategy, particularly in promoting N-12 and SaniTite HP for storm and sanitary sewer systems, as regulatory approvals are essential to the specification and acceptance of these product lines.
Our sales and marketing strategy is divided into four components — comprehensive market coverage, diverse product offerings, readily-available local inventory and specification efforts. Our goal is to provide the distributor/owner with the most complete, readily-available product line in our industry. We strive to use our manufacturing footprint, product portfolio and market expertise to efficiently service our customers.
Our sales and engineering objective is to influence, track and quote all selling opportunities as early in the project life cycle as possible. Conceptual project visibility allows sales and engineering professionals the ability
- 103 -
Table of Contents
to influence design specifications and increase the probability of inclusion of our products in bid documents. We strive to be meaningfully involved in all phases of the project cycle, including design, bidding, award and installation. In addition to direct channel customers, we also maintain and develop relationships with federal agencies, municipal agencies, national standard regulators, private consulting engineers and architects. Our consistent interaction with these market participants enables us to continue our market penetration. This ongoing dialogue has positioned us as an industry resource for design guidance and product development and as a respected expert in water management solutions.
Seasonality
Historically, sales of our products have been higher in the first and second quarters of each fiscal year due to favorable weather and longer daylight conditions accelerating construction activity during these periods. Seasonal variations in operating results may also be impacted by inclement weather conditions, such as cold or wet weather, which can delay projects.
In the non-residential, residential and infrastructure markets in the northern United States and Canada, construction activity typically begins to increase in late March and is slower in December, January and February. In the southern and western United States, Mexico, Central America and South America, the construction markets are less seasonal. The agricultural drainage market is concentrated in the early spring just prior to planting and in the fall just after crops are harvested prior to freezing of the ground in winter.
Manufacturing and Distribution Platform
We have a leading domestic and international manufacturing and distribution infrastructure, serving customers in all 50 U.S. states as well as approximately 90 other countries through 58 manufacturing plants and 28 distribution centers including the facilities owned or leased by our joint ventures. We also operate an in-house fleet of 625 tractor-trailers. Our effective shipping radius is approximately 200 miles from one of our manufacturing plants or distribution centers. Our scale and extensive network of facilities provide a critical cost advantage versus our competitors, as we are able to more efficiently transport products to our customers and end users and to promote faster product shipments due to our proximity to the delivery location.
The combination of a dedicated fleet and team of company drivers allows greater flexibility and responsiveness in meeting dynamic customer jobsite delivery expectations. We strive to achieve less than three-day lead-time on deliveries, and have the added benefit of redeploying fleet and driver assets to respond to short-term regional spikes in sales activity. For deliveries that are outside an economic delivery radius of our truck fleet, common carrier deliveries are tendered using Nistevo, a customized software platform to ensure that lowest delivered freight costs are achieved. In addition, in the United States and Canada, more than 10% of our pipe volume is sold on a pick-up or walk-in basis at our plant and yard locations, further leveraging our footprint and lowering freight cost per pound and per revenue dollar.
Our North American truck fleet incorporates approximately 1,100 trailers that are specially designed to haul our lightweight pipe and fittings products. These designs maximize payload versus conventional over the road trailers and facilitate unassisted unloading of our products at the jobsites by our drivers. The scope of fleet operations also includes backhaul of purchased raw materials providing a lower delivered cost to our plant locations.
We have expanded internationally primarily through joint ventures with best-in-class local partners. This joint venture strategy has provided us with local and regional access to markets such as Brazil, Chile, Argentina, Mexico, Peru and Colombia. These international facilities produce pipe and related products to be sold in their respective regional markets. Combining a local partner’s customer relationships, brand recognition and local management talent, with our world-class manufacturing and process expertise, broad product portfolio and innovation, creates a powerful platform and exciting opportunities for continued international expansion.
- 104 -
Table of Contents
Manufacturing Process
We manufacture our corrugated pipe products in 17 different diameters ranging from 2” to 60” using a continuous extrusion process, where molten polyethylene or polypropylene is pushed through a die into a moving series of corrugated U-shaped molds. Blow air and vacuum are used to form the corrugations of the pipe which is pulled through a corrugator and then cut to length. We utilize customized and proprietary production equipment, which we believe is faster and more cost efficient than other pipe making equipment generally available in the market.
Domestically, we operate approximately 120 pipe production lines that collectively are capable of producing more than one billion pounds of pipe annually on a standard five-day day per week schedule. Significant unused capacity is in place to support growth in our N-12 pipe sales volume requiring minimal additional capital for molds. To produce our broad range of pipe sizes, we own and utilize approximately 250 mold and die setups, which had an original capital cost of approximately $130 million and most of which are moved between manufacturing plants. Our production equipment is built to accept transportable molds and die tooling over a certain range of sizes so each plant is not required to house the full range of tooling at any given time. This transportability provides us with the flexibility to optimize our capacity through centrally-coordinated production planning, which helps to adapt to shifting sales demand patterns while reducing the capital needed for tooling. With our large manufacturing footprint in place, we can support rapid seasonal growth in demand, focusing on customer service while minimizing transportation costs.
The standard fittings products (tees, wyes, elbows, etc.) that we produce and sell to connect our pipe on jobsites are blow molded or injection molded at four domestic plants. In addition, customized fabricated fittings (e.g., more complex dual wall pipe reducers, bends or structures) are produced in 17 of our North American plants. In addition to the extrusion of pipe, and blow molding and injection molding of fittings, we also use a variety of other processes in our manufacturing facilities. These processes include thermoforming, rotational molding, compression molding, and custom plastic welding and fabrication. The wide variety of production processes and expertise allow us to provide cost-effective finished goods at competitive prices delivered in a timely fashion to our customers.
Our manufacturing plants have no process related by-products released into the atmosphere, waterways, or solid waste discharge. During pipe production start-ups and size change-overs, non-compliant scrap and any damaged finished goods pipe are recycled through a grinder for internal re-use.
We have two internal quality control laboratory facilities equipped and staffed to evaluate and confirm incoming raw material and finished goods quality in addition to the quality testing that is done at our manufacturing facilities. We conduct annual safety, product and process quality audits at each of our facilities, using centralized internal resources in combination with external third-party services. In the quality area, various national agencies such as NTPEP, IAPMO, BNQ and CSA (Canada) and numerous state DOT and municipal authorities (e.g., Illinois, Michigan, Massachusetts, City of Columbus) conduct both scheduled and unscheduled inspections of our plants to verify product quality and compliance to applicable standards.
Core to our commitment and enablement of a safe and productive manufacturing environment are our operational and management training programs. Through our ADS Academy, we deliver targeted role-specific training to our operations team members through a blended curriculum of on-line and hands-on training experiences covering safety, quality, product knowledge and manufacturing process. Our learning management system, which hosts over 400 custom modules, serves as the foundation of our operational training programs and provides us with appropriate scale, efficiency, and governance to support our growth. We have a strong commitment to the training of our manufacturing supervisors and managers in technical, management, and leadership subjects through intense role-based assimilation plans, e-learning and classroom-based development experiences.
- 105 -
Table of Contents
Raw Materials
Virgin and recycled resins, which are derived either directly or indirectly from crude oil derivatives and natural gas liquids, are the principal raw materials utilized in our production process. We currently purchase in excess of 700 million pounds of virgin and recycled resin annually from over 450 suppliers in North America. As a high-volume buyer of resin, we are able to achieve economies of scale to negotiate favorable terms and pricing. Our purchasing strategies differ based on the material (virgin resin v. recycled material) ordered for delivery to our production locations. The price movements of the different materials also vary, resulting in the need to use a number of strategies to reduce volatility and successfully pass on cost increases to our customer through timely selling price increases when needed.
In 2008, as the price of crude oil reached unprecedented levels, we began to further augment our raw material blending and processing technologies to produce an HDPE pipe that incorporates recycled resin. This new product, which meets an American Society for Testing and Materials (ASTM) standard, replaces a majority of the virgin resin that is used in the American Association of State Highway and Transportation Officials (AASHTO) product with recycled materials. To further develop our recycled material strategies, we established Green Line Polymers, Inc., or GLP, as our wholly-owned recycling subsidiary in 2012. GLP procures and processes recycled raw materials that can be used in products we produce and sell. Our first production facilities were established in Ohio and Georgia and are focused on processing post-industrial HDPE recycled materials. Based on the success of this strategy, we expanded our efforts toward post-consumer material processing by acquiring the business of a vendor who was supplying clean, post-consumer recycled HDPE to our upper Midwest plants and established a second post-consumer processing plant, in Pennsylvania, to support our plants in Ohio, Michigan and the eastern and southern United States. In 2013, 64% of our non-virgin HDPE raw material needs were internally processed (enhanced) through our GLP operations.
We believe that we are well positioned for future growth as we add additional recycled material processing facilities and expand our supplier base for virgin resin. With the significant increase in U.S. shale gas extraction expected to continue, along with related increases in natural gas production, we anticipate continued growth in the availability of ethylene and propylene and their polymer derivatives at competitive prices.
We have managed a resin price hedging program since early in 2010. Our program is designed to target a monthly volume of fixed price contracts that hedge a significant portion of our virgin resin purchases. In conjunction with our forward price hedging program, we also maintain supply agreements with our major resin suppliers that provide multi-year terms and volumes that are in excess of our projected consumption. In addition, we recently began implementing financial hedges for virgin PP resin to reduce the potential price volatility of that material, with a goal of hedging a significant portion of our annual purchases.
We began a diesel hedging program in 2008 which is executed through several financial swaps covering future months demand for diesel fuel and are designed to decrease our exposure to escalating fuel costs. These hedges cover a significant portion of the diesel fuel consumed by the truck fleet that we operate to deliver products to our customers.
Suppliers
We have developed relationships with all of the North American producers of virgin high density polyethylene and impact copolymer polypropylene producers that produce the grades we purchase for our new SaniTite HP product line and rapidly expanding StormTech retention/detention product line, including Braskem Americas, Chevron Phillips Chemical Co. LP, Dow Chemicals, Equistar Chemicals, ExxonMobil Chemical Company, Formosa Plastics, Ineos O&P USA and Phillips 66.
We also maintain relationships with several of the largest environmental companies such as Waste Management, Inc., Republic Services, Inc., Rumpke, Inc. and QRS, Inc., which provide us with post-consumer
- 106 -
Table of Contents
HDPE recycled materials. We also maintain relationships with several key post-industrial HDPE suppliers, including Dupont, Silgan Plastics, Consolidated Container Company and Alpla, which provide us with materials that cannot otherwise be utilized in their respective production processes.
The North American capacity for ethylene and polyethylene derivatives is being expanded primarily as a result of the new supplies of natural gas liquids being produced through shale gas exploration and production. This low-cost stream of feedstocks (ethane and propane) has positioned several companies such as Lyondell Basell, ExxonMobil, Chevron Phillips Chemical Co. LP and Dow Chemical to begin the permitting and engineering phases for significant amounts of ethylene and propylene feedstocks. We anticipate that the first wave of derivative capacity will begin coming on stream during 2015 and extending through 2018.
Competition
We operate in a highly fragmented industry and hold leading positions in multiple market sectors. Competition, including our competitors and specific competitive factors, varies for each market sector.
We believe the principal competitive factors for our market sectors include local selling coverage, product availability, breadth and cost of products, technical knowledge and expertise, customer and supplier relationships, reliability and accuracy of service, effective use of technology, delivery capabilities and timeliness, pricing of products, and the provision of credit. We believe that our competitive strengths and strategy allow us to compete effectively in our market sectors.
The stormwater drainage industry in particular is highly fragmented with many smaller specialty and regional competitors providing a variety of product technologies and solutions. We compete against concrete pipe, corrugated steel pipe and PVC pipe producers on a national, regional and local basis. In addition, there are several HDPE pipe producers in the United States.
In the United States, our primary competitors are concrete pipe producers, including Cemex, Hanson and Oldcastle CRH Precast, as well as smaller, regional competitors. In the corrugated steel pipe sector, our primary national competitor is Contech Engineered Solutions, and we compete with Lane Enterprises, Pacific Corrugated and Southeast Culvert on a regional level, as well as other smaller competitors. In the PVC pipe sector, we compete primarily with JM Eagle, Diamond Plastics and North American Pipe. We are the only corrugated HDPE pipe producer with a national footprint, and our competitors operate primarily on a regional and local level. In the corrugated HDPE pipe sector in the United States, our primary competitors on a regional basis are JM Eagle, Lane Enterprises and Prinsco.
The superior attributes of HDPE and PP and ongoing product innovation have allowed thermoplastic pipe manufacturers generally, and us in particular, to capture market share across all end market categories. This substitution trend is expected to continue as more states and municipalities recognize the benefits of HDPE and our N-12 HP PP pipe by approving it for use in a broader range of applications.
Properties
Real Property
We operate across all 50 U.S. states and 10 Canadian provinces through 72 locations in the United States and Canada, with 50 total manufacturing plants and 22 total distribution centers. We also have joint ventures that operate through 13 locations in Mexico, Central America and South America. We currently own approximately 36,000 square feet of office space in Hilliard, Ohio for our corporate headquarters.
As of March 31, 2014, we had a network of 58 plant locations, of which 39 were owned and 19 were leased. We generally prefer to own our locations, with a typical pipe manufacturing facility consisting of approximately
- 107 -
Table of Contents
40,000 square feet and 15-20 acres of land for storage of pipe and related products. We believe that our properties have been adequately maintained, are in good condition generally and are suitable and adequate for its business as presently conducted. The extent to which we use our properties varies by property and from time to time, but all distribution centers carry single wall and dual wall pipe and fittings and Allied Products per needs of the local market.
Our manufacturing plants and distribution centers, including those operated through our joint ventures, are shown in the map below.
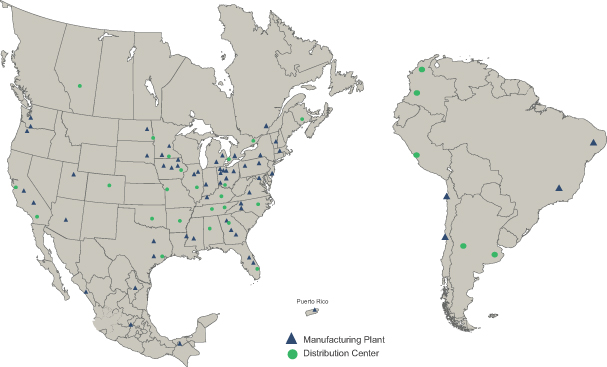
In-house Fleet
As of December 31, 2013, our in-house fleet consisted of approximately 625 tractor-trailers and approximately 1,100 trailers that are specially designed to haul our lightweight pipe and fittings products.
Intellectual Property
Intellectual property is an important aspect of our business. We rely upon a combination of patents, trademarks, trade names, licensing arrangements, trade secrets, know-how and proprietary technology in order to secure and protect our intellectual property rights, both in the United States and in foreign countries.
We seek to protect our new technologies with patents and trademarks and defend against patent infringement allegations. We hold a significant amount of intellectual property rights pertaining to product patents, process patents and trademarks. We continually seek to expand and improve our existing product offerings through product development and acquisitions. Although our intellectual property is important to our business operations and in the aggregate constitutes a valuable asset, we do not believe that any single patent, trademark or trade secret is critical to the success of our business as a whole. We cannot be certain that our patent applications will be issued or that any issued patents will provide us with any competitive advantages or will not be challenged by third parties.
- 108 -
Table of Contents
In addition to the foregoing protections, we generally control access to and use of our proprietary and other confidential information through the use of internal and external controls, including contractual protections with employees, distributors and others. Despite these protections, we may be unable to prevent third parties from using our intellectual property without our authorization, breaching any nondisclosure agreements with us, or independently developing products that are similar to ours, particularly in those countries where the laws do not protect our proprietary rights as fully as in the United States.
See “Risk Factors — Risks Relating to Our Business — If we are unable to protect our intellectual property rights, or we infringe on the intellectual property rights of others, our ability to compete could be negatively impacted.”
Information Technology
We recently completed a company-wide systems and software upgrade that was intended to serve as a scalable platform to support the next phase of our growth. This information technology project began in 2007 and was fully implemented in 2011. It has further enhanced our shared services strategy for all of our global operations. Our Oracle software platform has been configured to implement best practices across all of our business processes, and has greatly enhanced firm-wide integration, providing consistent internal system controls, data tracking, reporting and analytical capabilities. The capacity and flexibility of our systems allow us to support and enhance organic growth and profitability, as well as increase the ease of future acquisition integration. In addition, we developed an enterprise data warehouse system, downloading data from our Oracle software to provide timely reporting across our organization utilizing Microsoft SQL technology, which we use to more efficiently run our business.
Employees
In domestic and international operations, we averaged approximately 3,700 employees in the fiscal year ended March 31, 2014, consisting of approximately 2,500 hourly personnel and approximately 1,200 salaried employees. As of March 1, 2014, none of our hourly workforce was covered by collective bargaining agreements.
Regulation
Our operations are affected by various statutes, regulations and laws in the markets in which we operate, which historically have not had a material effect on our business. We are subject to various laws applicable to businesses generally, including laws affecting land usage, zoning, the environment, health and safety, transportation, labor and employment practices, competition, immigration and other matters. Additionally, building codes may affect the products our customers are allowed to use, and, consequently, changes in building codes may affect the saleability of our products. The transportation and disposal of many of our products are also subject to federal regulations. The DOT regulates our operations in domestic interstate commerce. We are subject to safety requirements governing interstate operations prescribed by the DOT. Vehicle dimensions and driver hours of service also remain subject to both federal and state regulation.
We have been able to consistently capitalize on changes in both local and federal regulatory statutes relating to storm and sanitary sewer construction, repair and replacement. Most noteworthy is the Federal Clean Water Act of 1972 and the subsequent EPA Phase I, II and sustainable infrastructure regulations relating to storm sewer construction, storm water quantity, storm water quality, and combined sewer separation. The diversity of products offering a solution based selling approach coupled with detailed market knowledge makes us an integral industry resource in both regulatory changes and compliance.
- 109 -
Table of Contents
Environmental, Health and Safety Matters
We are subject to a broad range of foreign, federal, state and local environmental, health and safety laws and regulations, including those pertaining to air emissions, water discharges, the handling, disposal and transport of solid and hazardous materials and wastes, the investigation and remediation of contamination and otherwise relating to health and safety and the protection of the environment and natural resources. As our operations, and those of many of the companies we have acquired, to a limited extent involve and have involved the handling, transport and distribution of materials that are, or could be classified as, toxic or hazardous, there is some risk of contamination and environmental damage inherent in our operations and the products we handle, transport and distribute. Our environmental, health and safety liabilities and obligations may result in significant capital expenditures and other costs, which could negatively impact our business, financial condition and results of operations. We may be fined or penalized by regulators for failing to comply with environmental, health and safety laws and regulations, or we may be held responsible for such failures by companies we have acquired. In addition, contamination resulting from our current or past operations, and those of many of the companies we have acquired, may trigger investigation or remediation obligations, which may have a material adverse effect on our business, financial condition and results of operations.
Legal Proceedings
We are involved in litigation from time to time in the ordinary course of business. In management’s opinion, none of the proceedings are material in relation to our consolidated operations, cash flows, or financial position, and we have adequate reserves to cover our estimated probable loss exposure.
- 110 -
Table of Contents
The following table sets forth certain information concerning our executive officers and directors. The respective age of each individual in the table below is as of March 31, 2014.
| Name |
Age | Position(s) | ||
| Joseph A. Chlapaty |
68 | Chairman of the Board of Directors, Director, President and Chief Executive Officer | ||
| Mark B. Sturgeon |
59 | Executive Vice President, Chief Financial Officer, Secretary and Treasurer | ||
| Thomas M. Fussner |
56 | Executive Vice President and Co-Chief Operating Officer | ||
| Ronald R. Vitarelli |
47 | Executive Vice President and Co-Chief Operating Officer | ||
| Robert M. Klein |
51 | Executive Vice President, Sales | ||
| Ewout Leeuwenburg |
47 | Senior Vice President, International | ||
| Robert M. Eversole |
51 | Director | ||
| Alexander R. Fischer |
46 | Director | ||
| Tanya Fratto |
53 | Director | ||
| M.A. (Mark) Haney |
59 | Director | ||
| David L. Horing |
51 | Director | ||
| C. Robert Kidder |
69 | Director | ||
| Mark A. Lovett |
32 | Director | ||
| Richard A. Rosenthal |
81 | Director | ||
| Abigail S. Wexner |
52 | Director | ||
| Scott M. Wolff |
36 | Director |
Joseph A. Chlapaty joined us in 1980 and has served as Chairman of our board of directors since 2008, a director since 1988, President since 1994 and Chief Executive Officer since 2004. From 1980 to 1994, Mr. Chlapaty served as our Vice President and Chief Financial Officer. Before joining us Mr. Chlapaty served as Corporate Accounting Manager, Assistant Treasurer, and Treasurer for Lindberg Corporation and prior to that was with Arthur Andersen LLP. Mr. Chlapaty serves on the advisory board to Fifth Third Bank of Columbus, and is also a member or former member of several not-for profit boards, including Nationwide Children’s Hospital, KIPP Journey Academy, Ohio Foundation of Independent Colleges, the University of Dubuque and Marietta College. Mr. Chlapaty holds a bachelor’s degree in Business Administration from the University of Dubuque and an MBA from DePaul University. We believe that Mr. Chlapaty’s leadership capabilities, his thorough knowledge of all facets of our business and operations and his deep understanding of our history, culture and the markets in which we operate make him qualified to serve as a member of our board of directors.
Mark B. Sturgeon joined us in March 1981 and has served as Executive Vice President and Chief Financial Officer since February 1994. Mr. Sturgeon has held the positions of Corporate Cost and Budget Manager and Market Planning Manager positions and was named Corporate Controller in October 1988. Prior to joining us he spent three years as a Budget & Financial Analyst for Borden Company and a year with Touche Ross & Company. Mr. Sturgeon holds both a bachelor’s and master’s degree in Accounting from Penn State University.
Thomas M. Fussner joined us in October 1989 and has served as Executive Vice President since February 2006 and Co-Chief Operating Officer since November 2009. Mr. Fussner joined us as Director, Supplier Relations and has held advancing leadership roles in our manufacturing and operations functions, including being named Vice President, Manufacturing Operations in July 1995 and Senior Vice President, Manufacturing Operations in January 2009. He currently oversees our manufacturing, logistics, procurement, manufacturing engineering, operational services, human resources, and information technology functions. Prior to joining us, he spent seven years at the lighting division of General Electric in plant, product, and customer service management positions. Mr. Fussner holds a bachelor’s degree in Chemistry from Colgate University and an M.B.A. with a concentration in Operations Management from the University of Michigan.
- 111 -
Table of Contents
Ronald R. Vitarelli joined us in November 1988 and has served as Executive Vice President & Co-Chief Operating Officer since November 2011. Mr. Vitarelli joined us as a Sales Representative and was promoted to Regional Sales Manager in December 1995. In July 2003, he was named General Manager of Stormtech LLC, a manufacturer of underground storm water retention and detention systems that was a 50/50 joint venture of ours with Infiltrator Systems, Inc. Upon our acquisition of the remaining 50% interest in Stormtech from Infiltrator in November 2009, Mr. Vitarelli rejoined us and continued to lead the Stormtech business until March 2010, when he was named Vice President, Storm & Sanitary Markets. He currently oversees our sales, product development, market management, and engineering functions. Mr. Vitarelli holds a bachelor’s degree in Marketing from Providence College.
Robert M. Klein joined us in June 1992 and has served as Executive Vice President, Sales since February 2006. Upon joining us, Mr. Klein held several leadership positions in operations including Manager, Regional Manufacturing, Manager, Distribution Yards, Director, Purchasing and was named Vice President, Manufacturing Services in January 2009. In July 2001, he was named Vice President, Sales and Marketing and began providing leadership to our field sales, corporate account sales, marketing, customer service, and market analysis functions. Prior to joining us he spent seven years at The Gerstenslager Company in manufacturing management positions. Mr. Klein holds a bachelor’s degree in Business Administration from Ashland College.
Ewout Leeuwenburg joined us in April 2001 and has served as Senior Vice President, International since November 2011. He began leading our international operations in December 2007 and was named Vice President, International in July 2008. Mr. Leeuwenburg joined us upon the completion of our acquisition of the Inline Drain & Drain Basin division of Nyloplast, USA in 2001. At the time of the acquisition, Mr. Leeuwenburg had been with Nyloplast, USA Inc. since July 1988 in various business development, operations, sales, and marketing manager positions, and had served as President, United States since July 1996. Upon joining us, he served as General Manager, Nyloplast and expanded his responsibilities to Director, Allied Products in September 2002. Mr. Leeuwenburg holds a bachelor’s degree in Mechanical Engineering from Hogeschool Rotterdam in the Netherlands.
Robert M. Eversole became a director in 2008. Mr. Eversole is a Principal of Stonehenge Partners, Inc., a private investment capital firm and has been continuously employed as such since 2007. Prior to joining Stonehenge Partners, Mr. Eversole spent 22 years with Fifth Third Bank, most recently as President and Chief Executive Officer of Central Ohio, and additionally served as Regional President for Fifth Third Bancorp affiliate banks in Western Ohio, Central Florida and Ohio Valley. He also served as a member of the Fifth Third Bancorp Operating Committee. Mr. Eversole currently serves on the boards of directors for certain privately-held companies and also serves on the boards of Nationwide Children’s Hospital Foundation, the Dean’s Advisory Council for The Ohio State University Fisher College of Business and the Catholic Foundation. Mr. Eversole is a graduate of The Ohio State University and has completed a number of executive education programs. We believe that Mr. Eversole’s extensive background in private equity and commercial banking, his expertise on financial matters and his extensive leadership and management experience make him qualified to serve as a member of our board of directors.
Alexander R. Fischer became a director in 2014. Mr. Fischer has been the President and CEO of the Columbus Partnership, an organization of CEOs focused on civic, philanthropic, education and economic development opportunities in Columbus, Ohio, since 2009. Prior to his role at the Columbus Partnership, Mr. Fischer worked at Battelle Memorial Institute, a science and technology company, from 2002-2009, where he served as Senior Vice President for Business and Economic Development, Vice President of Commercialization, and Director of Technology Transfer and Economic Development. Mr. Fischer has also worked in the public sector, as Commissioner of Economic Development, Deputy Governor and the Chief of Staff for the State of Tennessee from 1997 to 2002. In the past he has served on the boards of directors for a variety of for-profit and not-for profit organizations, and currently serves on the boards of N8 Medical, Nationwide Children’s Hospital, the Columbus Chamber of Commerce, Experience Columbus, Columbus 2020, Tech Columbus and The Ohio State Innovation Foundation. Mr. Fischer graduated from The University of Tennessee with a B.S. in Economics and Public Administration and also received a Master’s of Science in Urban
- 112 -
Table of Contents
Planning and Economic Development from The University of Tennessee. We believe that Mr. Fischer’s executive management experience, his knowledge of economic development and commercialization and the knowledge he has gained from his extensive involvement in the public policy sectors make him qualified to serve as a member of our board of directors.
Tanya Fratto became a director in 2013. Ms. Fratto spent 25 years with General Electric, prior to her retirement in 2011. From 2000 to 2011, Ms. Fratto served as President and CEO of General Electric’s Superabrasives division, a leading supplier of manufactured diamond, cubic boron nitride, and polycrystalline products. Her career at General Electric also included leadership roles in GE Plastics, Corporate Sourcing, GE Appliances and GE Consumer Services. She currently sits on the boards of Boart Longyear, a mining products and services company, and Smiths Global Plc, a global technology company. We believe that Ms. Fratto’s extensive executive and management experience as well as her experience managing global operations and the insights gained from those experiences make her qualified to serve as a member of our board of directors.
M.A. (Mark) Haney became a director in 2014. Mr. Haney retired in December 2011 from Chevron Phillips Chemical Company LP, a chemical producer, where he served as Executive Vice President of Olefins and Polyolefins from January 2011 until his retirement. From 2008 to 2011, Mr. Haney served as Senior Vice President, Specialties, Aromatics and Styrenics. He also served as Vice President of Polyethylene and President of Performance Pipe. Prior to joining Chevron, Mr. Haney served in numerous roles at Phillips Petroleum Company including business manager for Advanced Plastics, plant manager of Phillips Drislopipe and plant manager of the K-Resin plant, President of P66 Propane Company, Phillips Woods Cross business general manger, and President of Driscopipe. Mr. Haney currently serves on the board of directors of Phillips 66 Partners LP. Mr. Haney attended West Texas University and majored in chemistry. We believe that Mr. Haney’s extensive executive and management experience and his understanding of the petro-chemicals industry and the raw materials used in our products make him qualified to serve as a member of our board of directors.
David L. Horing became a director in 2010 and was appointed to our board of directors by ASP ADS Investco, LLC, an affiliate of American Securities. Mr. Horing is a Managing Director of American Securities, an investment firm, and is a Managing Member of the general partner of certain funds managed by American Securities. Before joining American Securities in 1995, he spent seven years at The Dyson-Kissner-Moran Corporation, a middle-market private equity investment firm and previously worked in Salomon Brothers’ Investment Banking division and with The Boston Consulting Group. He currently is a director of Healthy Directions, LLC, Liberty Tire Recycling Co., LLC, SpecialtyCare, Inc. and Tekni-Plex, Inc. Mr. Horing holds a bachelor’s degree in Engineering and a bachelor’s degree in Economics from the University of Pennsylvania and an M.B.A. from the Harvard Business School. We believe that Mr. Horing’s business education, extensive private equity experience, his industry and financial expertise and his years of experience providing strategic advisory services to complex organizations, as well as his understanding of American Securities, make him qualified to serve as a member of our board of directors.
C. Robert Kidder became a director in 2014. Mr. Kidder served as Chairman and Chief Executive Officer of 3Stone Advisors LLC, a private investment firm, from 2006 to 2011, and as non-executive Chairman of the Board of Chrysler Group LLC from 2009 to 2011. He was a Principal at Stonehenge Partners, Inc., a private investment firm, from 2004 to 2006. Mr. Kidder served as President of Borden Capital, Inc., a company that provided financial and strategic advice to the Borden family of companies, from 2001 to 2003. He was Chairman of the Board from 1995 to 2004 and Chief Executive Officer from 1995 to 2002 of Borden Chemical, Inc. (formerly Borden, Inc.), a forest products and industrial chemicals company. Mr. Kidder was Chairman and Chief Executive Officer and President and Chief Executive Officer of Duracell International Inc. Prior to joining Duracell International Inc. Mr. Kidder worked in planning and development at Dart Industries as well as a management consultant with McKinsey & Co. Mr. Kidder currently serves on the boards of directors of Merck & Co., Inc., Morgan Stanley, and Microvi Biotech Inc. He is also a director of Wildcat Discovery Technologies, Inc., a private technology research company. Mr. Kidder earned a B.S. in industrial engineering from the University of Michigan and a graduate degree in industrial economics from Iowa State University. We believe
- 113 -
Table of Contents
Mr. Kidder’s extensive financial and senior executive experience, including in business development, operations and strategic planning, as well as knowledge he has gained through his directorship service at other public companies, make him qualified to serve as a member of our board of directors.
Mark A. Lovett became a director in 2013 and was appointed to our board of directors by ASP ADS Investco, LLC, an affiliate of American Securities. Mr. Lovett is a Vice President at American Securities, focusing primarily on buyouts in the industrials and chemicals sectors. Since joining American Securities in 2007, Mr. Lovett has been actively involved in several of the firm’s portfolio companies and was a member of the transaction team that executed American Securities’ investments in each of MECS, Inc., Liberty Tire Recycling, LLC, and Tekni-Plex, Inc. Mr. Lovett previously worked at Liberty Tire Recycling and at UBS in the investment banking division. He holds a bachelor’s degree in Economics from Yale University and an M.B.A. from the Wharton School at the University of Pennsylvania. Mr. Lovett currently serves on the board of directors of Tekni-Plex and Liberty Tire Recycling. We believe that Mr. Lovett’s extensive private equity experience, his industry and financial expertise and his years of experience providing strategic advisory services to complex organizations, as well as his understanding of American Securities, make him qualified to serve on our board of directors.
Richard A. Rosenthal became a director in 1988. Mr. Rosenthal retired from the University of Notre Dame in 1995 after successfully serving as Athletic Director for eight years. Prior to his service as athletic director and following a professional basketball career, Mr. Rosenthal held several leadership roles in banking, including as Executive Vice President of Indiana Bank & Trust as well as serving over 25 years as Chairman and CEO of St. Joseph Bancorp. He formerly served on the boards of directors of LaCrosse Footwear, St. Joseph Capital Bank, Beck Corp., and two advisory boards of venture capital funds. Mr. Rosenthal holds a bachelor’s degree in Finance from the University of Notre Dame. We believe that Mr. Rosenthal’s extensive financial and senior executive experience, as well as knowledge he has gained through his directorship service with other companies, make him qualified to serve as a member of our board of directors.
Abigail S. Wexner became a director in 2014. Mrs. Wexner is a member and former Chair of the boards of directors of Nationwide Children’s Hospital Inc. and Nationwide Children’s Hospital. She is Founder and Chair of the boards of the Center for Family Safety & Healing (f/k/a Columbus Coalition Against Family Violence) and KidsOhio.org, Vice Chair of the board of KIPP Journey Academy, and a Trustee of The Wexner Center Foundation and the United States Equestrian Team Foundation. Mrs. Wexner also serves as a director of L Brands (formerly Limited Brands, Inc.). Mrs. Wexner graduated from Columbia University and New York University School of Law. We believe Mrs. Wexner’s executive and legal experience, as well as her expertise with respect to a wide range of organizational, philanthropic and public policy issues make her qualified to serve as a member of our board of directors.
Scott M. Wolff became a director in 2010 and was appointed to our board of directors by ASP ADS Investco, LLC, an affiliate of American Securities. Mr. Wolff is a Managing Director of American Securities, an investment firm, and joined American Securities in 2002. Before joining American Securities, Mr. Wolff was with Merrill Lynch where he worked in the Mergers & Acquisitions Group, focusing on a variety of industries including consumer products, food, packaging, and automotive. He currently serves on the boards of directors of Arizona Chemical, SeaStar Solutions, HHI Group Holdings, GT Technologies, and Lakeside Energy. Mr. Wolff holds a bachelor’s degree in Finance from Indiana University and an MBA from the University of Pennsylvania, Wharton School. We believe Mr. Wolff’s extensive private equity experience, his industry and financial expertise and his years of experience providing strategic advisory services to complex organizations, as well as his understanding of American Securities, make him qualified to serve as a member of our board of directors.
Corporate Governance
Board Composition
Our business and affairs are managed under the direction of our board of directors. We currently have eleven directors. Our directors hold office until their successors have been elected and qualified or until the earlier of their resignation or removal.
- 114 -
Table of Contents
Our board of directors is divided into three classes of directors serving staggered terms of three years each. At each annual meeting of stockholders, a class of directors will be elected for a three-year term to succeed the class whose term is then expiring. The terms of our current directors will expire upon the election and qualification of successor directors at the annual meeting of stockholders to be held during fiscal year 2015 for the Class I directors, fiscal year 2016 for the Class II directors and fiscal year 2017 for the Class III directors:
Our Class I directors are Joseph A. Chlapaty, Robert M. Eversole, Tanya Fratto and David L. Horing;
Our Class II directors are Alexander R. Fischer, M.A. (Mark) Haney and Scott M. Wolff; and
Our Class III directors are Abigail S. Wexner, Mark A. Lovett, Richard A. Rosenthal and C. Robert Kidder.
Any vacancies in our classified board of directors will be filled by the remaining directors and the elected person will serve the remainder of the term of the class to which he or she is appointed. Any additional directorships resulting from an increase in the number of directors will be distributed among the three classes so that, as nearly as possible, each class will consist of one-third of the directors.
When considering whether directors and nominees have the experience, qualifications, attributes or skills, taken as a whole, to enable our board of directors to satisfy their oversight responsibilities effectively in light of our business and structure, our board of directors focused primarily on each person’s background and experience as reflected in the information discussed in each of the directors’ individual biographies set forth immediately above. We believe that our directors provide an appropriate mix of experience and skills relevant to the size and nature of our business. We also value the experience that our directors bring from their service on other boards.
Director Independence
Upon the completion of this offering, we intend to have our common stock listed on the NYSE. Under the rules of the NYSE, independent directors must comprise a majority of our board of directors within a specified period after the completion of this offering. In addition, the rules of the NYSE require that, subject to specified exceptions, each member of a listed company’s audit, compensation, and nominating and governance committees be independent. Audit committee members must also satisfy the independence criteria set forth in Rule 10A-3 under the Securities Exchange Act of 1934, as amended. Under the rules of the NYSE, a director will only qualify as an “independent director” if, in the opinion of that company’s board of directors, that person does not have a relationship that would interfere with the exercise of independent judgment in carrying out the responsibilities of a director.
In order to be considered to be independent for purposes of Rule 10A-3, a member of an audit committee of a listed company may not, other than in his or her capacity as a member of the audit committee, our board of directors, or any other board committee: (i) accept, directly or indirectly, any consulting, advisory, or other compensatory fee from the listed company or any of its subsidiaries or (ii) be an affiliated person of the listed company or any of its subsidiaries.
In fiscal year 2014, our board of directors undertook a review of its composition, the composition of its committees, and the independence of each director. Based upon information requested from and provided by each director concerning his background, employment, and affiliations, including family relationships, our board of directors has determined that none of our directors except for Mr. Chlapaty has a relationship that would interfere with the exercise of independent judgment in carrying out the responsibilities of a director and that each of these directors, other than Mr. Chlapaty, is “independent” as that term is defined under the rules of the NYSE.
Except as otherwise described below, our board of directors has determined that those directors who serve on our audit committee, compensation committee and nominating and governance committee satisfy the independence standards for those committees established by the rules of the NYSE and (in the case of the audit committee) the applicable SEC rules. In making this determination, our board of directors considered the
- 115 -
Table of Contents
relationships that each non-employee director has with us and all other facts and circumstances our board of directors deemed relevant in determining their independence, including the beneficial ownership of our capital stock by each non-employee director.
Board Leadership Structure
Our board of directors does not have a formal policy on whether the roles of Chief Executive Officer and Chairman of our board of directors should be separate. The positions of the Chief Executive Officer and Chairman have historically been combined. Upon completion of this offering, Joseph A. Chlapaty will continue to serve as both Chief Executive Officer and Chairman. We believe that our stockholders are best served by having one person serve both positions. We further believe that combining the roles fosters accountability, effective decision-making and alignment between interests of our board of directors and management. Mr. Chlapaty also is able to use the in-depth focus and perspective gained in his executive function to assist our board of directors in addressing both internal and external issues affecting us.
Our board of directors recognizes that depending on future circumstances, other leadership models may become more appropriate. Accordingly, our board of directors will periodically review its leadership structure.
Board’s Role in Risk Oversight
The entire board of directors is engaged in risk management oversight. At the present time, our board of directors has not established a separate committee to facilitate its risk oversight responsibilities. Our board of directors expects to continue to monitor and assess whether such a committee would be appropriate. The audit committee assists our board of directors in its oversight of our risk management and the process established to identify, measure, monitor, and manage risks, in particular major financial risks. Our board of directors will receive regular reports from management, as well as from the audit committee, regarding relevant risks and the actions taken by management to address those risks.
Committees of the Board of Directors
Our board of directors has established an audit committee, a compensation committee, a nominating and governance committee and an executive committee, each of which will have the composition and responsibilities described below. Our board of directors intends to adopt written charters for the committees that comply with current federal law and applicable NYSE rules relating to corporate governance matters, which will be available on our website upon completion of this offering. Our board of directors may also establish from time to time any other committees that it deems necessary or desirable.
Audit committee
Our audit committee is comprised of Messrs. Eversole, Fischer, Haney, Lovett and Ms. Fratto, with Mr. Eversole serving as the chairperson of the audit committee. Our board of directors has determined that Mr. Lovett is not independent for the purposes of audit committee membership because he is affiliated with our significant stockholder, American Securities. All of the members of the audit committee are financially literate and have accounting or related financial management expertise within the meaning of the rules of the NYSE. Our board of directors has determined that Mr. Eversole qualifies as an “audit committee financial expert,” as that term is defined under the SEC rules implementing Section 407 of the Sarbanes-Oxley Act of 2002.
Our audit committee will be responsible for, among other things:
| • | reviewing and approving the selection of our independent auditors, and approving the audit and non-audit services to be performed by our independent auditors; |
| • | monitoring the integrity of our financial statements and our compliance with legal and regulatory requirements as they relate to financial statements or accounting matters; |
- 116 -
Table of Contents
| • | reviewing the adequacy and effectiveness of our internal control policies and procedures; |
| • | discussing the scope and results of the audit with the independent auditors and reviewing with management and the independent auditors our interim and year-end operating results; and |
| • | preparing the audit committee report that the SEC requires in our annual proxy statement. |
Compensation committee
Our compensation committee is comprised of Messrs. Kidder, Horing, Rosenthal and Ms. Wexner. Mr. Kidder is the chairperson of our compensation committee. The compensation committee will be responsible for, among other things:
| • | overseeing our compensation policies, plans, and benefit programs; |
| • | reviewing and approving for our executive officers: the annual base salary, the annual incentive bonus, including the specific goals and amount, equity compensation, employment agreements, severance arrangements and change in control arrangements, and any other benefits, compensations or arrangements; |
| • | reviewing the succession planning for our executive officers; |
| • | preparing the compensation committee report that the SEC requires to be included in our annual proxy statement; and |
| • | administrating our equity compensation plans. |
Nominating and corporate governance committee
Our nominating and corporate governance committee is comprised of Messrs. Kidder, Fischer, Wolff and Ms. Wexner. Ms. Wexner is the chairperson of our nominating and corporate governance committee. The nominating and corporate governance committee will be responsible for, among other things:
| • | assisting our board of directors in identifying prospective director nominees and recommending nominees for each annual meeting of stockholders to our board of directors; |
| • | reviewing developments in corporate governance practices and developing and recommending governance principles applicable to our board of directors; |
| • | overseeing the evaluation of our board of directors and management; and |
| • | recommending members for each board committee to our board of directors. |
Executive committee
The executive committee is comprised of Messrs. Chlapaty, Horing and Rosenthal, meets between meetings of our board of directors, as needed, and has the power to exercise all the powers and authority of our board of directors with respect to matters delegated to the executive committee by our board of directors, except for the limitations under Section 141(c) of the Delaware General Corporation Law and/or applicable limitations under our organizational documents. Mr. Chlapaty is the chairperson of our executive committee.
Code of Conduct and Guidelines for Ethical Behavior
Prior to the completion of this offering, our board of directors will establish a Code of Ethics for Senior Executive and Financial Officers that applies to our senior executive and financial officers including our principal executive officer, principal financial officer, principal accounting officer, or persons performing similar functions. A copy of the Code of Ethics for Senior Executive and Financial Officers will be available on our website at www.ads-pipe.com. We will promptly disclose any future amendments to this code on our website as
- 117 -
Table of Contents
well as any waivers from this code for executive officers and directors. Copies of this code will also be available in print from our Corporate Secretary, without charge, upon request. We also maintain a Standards of Ethical and Legal Conduct policy that governs all of our employees.
Compensation Committee Interlocks and Insider Participation
There are no interlocking relationships between any member of our Compensation Committee and any of our executive officers that require disclosure under the applicable rules promulgated under the federal securities laws.
Director Compensation
From April 1, 2013 to February 27, 2014, non-employee director compensation reflected a combination of a $30,000 annual retainer and a $2,500 per meeting attendance fee for each board of directors meeting attended, paid on a quarterly basis. Members of the management development & compensation committee (now referred to as the compensation committee) and audit committee also received a $2,500 per meeting attendance fee for each committee meeting attended.
In fiscal year 2014 we performed a review of the compensation structure and levels for non-employee directors in connection with the planning process for this offering and in connection with changes to the composition of our board of directors implemented prior to this offering. We engaged Towers Watson to assist in the review and development of recommended changes to non-employee director compensation structure and levels. Based on this review and the recommendations prepared by management, our board of directors modified its non-employee director compensation policy effective as of February 27, 2014.
Under the new policy, each non-employee director receives an annual cash retainer of $75,000. Each member of a committee of our board of directors receives an additional cash retainer as follows: $8,000 for a member of the audit committee, $6,000 for a member of the compensation committee and $4,000 for a member of the nominating and governance committee (to be established prior to the completion of this offering). The chairman of each committee of our board of directors also receives an additional cash retainer as follows: $10,000 for the chairman of the audit committee, $8,000 for the chairman of the compensation committee and $6,000 for the chairman of the nominating and governance committee. None of our directors receive meeting fees in addition to these retainers. The new cash compensation described above was prorated for the period beginning on February 27, 2014 and continuing through March 31, 2014.
The new non-employee director compensation policy further provides that upon completion of this offering and continuing each fiscal year thereafter until changed, each non-employee director who is not affiliated with American Securities will be granted restricted stock in an amount equal to $75,000 at the date of grant that will vest on the one year anniversary of the grant date (provided that the initial grant made to directors under the new compensation policy for fiscal year 2015 after completion of this offering will vest on February 27, 2015), subject to cancellation and forfeiture of unvested shares upon termination of service with our board of directors. Non-employee directors will also continue to receive reimbursement of all reasonable travel and other expenses for attending meetings of our board of directors or other Company-related functions. Non-employee directors who are affiliated with American Securities are awarded an annual fee of $150,000 in cash, along with fees for service on the various committees as described above, which fees are paid directly to American Securities and not to the director individually.
- 118 -
Table of Contents
Fiscal Year 2014 Director Compensation
The following table summarizes the total compensation earned by each of our directors for the year ended March 31, 2014.
| Name |
Fees Earned or Paid in Cash ($) |
Stock Awards ($) |
All Other Compensation ($) |
Total ($) |
||||||||||||
| Joseph A. Chlapaty (1) |
— | — | — | — | ||||||||||||
| Robert M. Eversole (2)(12) |
54,250 | — | — | 60,500 | ||||||||||||
| David L. Horing (3) |
60,500 | — | — | 60,500 | ||||||||||||
| Tanya Fratto (4) |
60,000 | — | 45,833 | (6) | 105,833 | |||||||||||
| David E. West (4)(5) |
48,000 | — | — | 48,000 | ||||||||||||
| William P. Sexton (5)(2)(12) |
48,000 | — | — | 48,000 | ||||||||||||
| Scott M. Wolff (7) |
60,500 | — | — | 60,500 | ||||||||||||
| Richard A. Rosenthal (8)(12) |
54,250 | — | — | 60,500 | ||||||||||||
| Fredric L. Smith (5)(9)(12) |
40,500 | — | — | 40,500 | ||||||||||||
| Mark A. Lovett (10) |
58,000 | — | — | 58,000 | ||||||||||||
| Alexander R. Fischer (11) |
12,500 | — | — | 12,500 | ||||||||||||
| M.A. (Mark) Haney (11) |
12,500 | — | — | 12,500 | ||||||||||||
| C. Robert Kidder (11) |
12,500 | — | — | 12,500 | ||||||||||||
| Abigail S. Wexner (11) |
12,500 | — | — | 12,500 | ||||||||||||
| (1) | Mr. Chlapaty serves as our Chief Executive Officer and therefore receives no compensation for his service as a director. |
| (2) | Represents quarterly payments of annual retainer for membership on our board of directors, attendance fees for meetings of our board of directors and attendance fees for audit committee meetings. |
| (3) | Represents quarterly payments of annual retainer for membership on our board of directors, attendance fees for meetings of our board of directors and attendance fees for compensation committee meetings. During fiscal year 2014, Mr. Horing served as a Managing Director at American Securities. Such fees are paid directly to American Securities and not to the director individually. |
| (4) | Represents quarterly payments of annual retainer for membership on our board of directors, attendance fees for meetings of our board of directors and attendance fees for compensation committee meetings. |
| (5) | Resigned from our board of directors effective as of February 27, 2014. |
| (6) | Represents consulting fees paid pursuant to a consulting agreement entered into between us and Ms. Fratto on April 1, 2013, pursuant to which Ms. Fratto received $12,500 per calendar quarter for providing certain consulting services to us. Ms. Fratto’s consulting arrangement terminated on February 27, 2014. |
| (7) | Represents quarterly payments of annual retainer for membership on our board of directors, attendance fees for meetings of our board of directors and attendance fees for audit committee meetings. During fiscal year 2014, Mr. Wolff served as a Managing Director at American Securities. Such fees are paid directly to American Securities and not to the director individually. |
| (8) | Represents quarterly payments of annual retainer for membership on our board of directors, attendance fees for meetings of our board of directors and attendance fees for compensation committee meetings. |
| (9) | Represents quarterly payments of annual retainer for membership on our board of directors and attendance fees for meetings of our board of directors. |
| (10) | Represents quarterly payments of annual retainer for membership on our board of directors, attendance fees for meetings of our board of directors and attendance fees for audit committee meetings. During fiscal year 2014, Mr. Lovett served as a Vice President at American Securities. Such fees are paid directly to American Securities and not to the director individually. |
| (11) | Joined our board of directors effective as of February 27, 2014. Amounts represent fees earned for service on our board of directors under the new non-employee director compensation policy described above. |
| (12) | Each of Messrs. Eversole, Rosenthal, Sexton and Smith elected to receive shares of common stock in lieu of a portion of their respective cash compensation pursuant to the deferred fee program for non-employee directors described below. Each director elected to receive the following amounts of cash compensation in the form of common stock (i) Mr. Eversole: $32,500, (ii) Mr. Rosenthal: $50,000, (iii) Mr. Sexton: $35,000 and (iv) Mr. Smith: $50,000. The number of shares of common stock granted in lieu of cash compensation was based on the aggregate grant date fair value of our common stock computed in accordance with FASB ASC Topic 718, Compensation — Stock Compensation. We calculated the estimated fair value of the shares of common stock issued in lieu of cash compensation on the date of grant as described above under “Management’s Discussion and Analysis of Financial Condition and Results of Operations — Critical Accounting Policies and Estimates — Employee Benefit Plans — Stock-Based Compensation Plans.” Each participating director agreed to pay cash to us if and to the extent that the grant date fair market value of the shares of common stock awarded exceeded the actual amount of fees otherwise payable to the director as compensation during the fiscal year, with such refund payment due and payable on the earlier of the end of the fiscal year or at the request of our board of directors. |
- 119 -
Table of Contents
Fiscal Year 2014 Deferred Fee Program for Non-Employee Directors
For fiscal year 2014, our board of directors established a program pursuant to which non-employee directors were permitted to receive a portion of director fees in the form of shares of common stock, up to a maximum of $50,000. In general, at the beginning of fiscal year 2014, each director was permitted to make an election to receive an amount of fees otherwise payable as cash during the fiscal year in the form of common stock, which shares of common stock were then awarded as of the beginning of the fiscal year based on the grant date fair market value. Each participating director agreed to pay cash to us if and to the extent that the grant date fair market value of the shares of common stock awarded exceeded the actual amount of fees otherwise payable to the director as compensation during the fiscal year, with such refund payment due and payable on the earlier of the end of the fiscal year or at the request of our board of directors. Four directors elected to receive a portion of director fees in the form of common stock as described in the fiscal year 2014 director compensation table above. We intend to adopt a non-employee incentive compensation program prior to the completion of this offering, pursuant to which non-employee directors may elect to receive a portion of their director fees in the form of shares of our common stock.
Non-Employee Director Stock Ownership Guidelines
To encourage equity ownership among non-employee directors, our board of directors intends to adopt stock ownership guidelines applicable to all non-employee directors other than those directors who are affiliated with American Securities that would become effective upon the completion of this offering. Under the stock ownership guidelines, each non-employee director who is not otherwise affiliated with American Securities, upon completion of this offering will be expected to own common stock having a value of at least three times their annual cash retainer. The non-employee directors will have five years from the later of the completion of this offering or the date of their election to fulfill this ownership requirement. The stock ownership guidelines will require each non-employee director to retain all shares received, net of shares sold for tax purposes, until the ownership requirements are met.
- 120 -
Table of Contents
Compensation Discussion and Analysis
The following Compensation Discussion and Analysis provides information regarding the material elements of our fiscal year 2014 compensation program for our “named executive officers,” also referred to as the “NEOs.” Our NEOs for the fiscal year ended March 31, 2014 were:
| • | Joseph A. Chlapaty, our President and Chief Executive Officer; |
| • | Mark B. Sturgeon, our Executive Vice President, Chief Financial Officer, Secretary and Treasurer; |
| • | Thomas M. Fussner, our Executive Vice President and Co-Chief Operating Officer; |
| • | Ronald R. Vitarelli, our Executive Vice President and Co-Chief Operating Officer; and |
| • | Robert M. Klein, our Executive Vice President of Sales. |
The Compensation Committee of our board of directors, or the Committee, pursuant to its charter, is responsible for establishing, implementing and reviewing on an annual basis our compensation programs and actual compensation paid to our NEOs, except for our Chief Executive Officer, with respect to whom the Committee’s decisions are subject to review and final approval by our board of directors.
Executive Summary
We believe our compensation practices and the overall level of executive compensation are competitive when compared to the marketplace and reflect our commitment to performance-based pay. Our compensation programs are intended to align our NEOs’ interests with those of our stockholders by rewarding performance that meets or exceeds the goals the Committee establishes, with the objective of increasing long-term stockholder value. Further, our executive compensation programs are intended to align with our financial performance.
At the beginning of fiscal year 2014 the Committee requested that management complete a review of our existing executive compensation programs as compared to market practice and in light of our current business model and growth strategy. While we have historically used a performance-based pay system for compensation, and have arm’s-length-negotiated employment agreements with each NEO, it was the view of the Committee that there were design elements in our cash-based incentive plan and long-term equity-based incentive plan that, if adjusted, could further align these plans with the interests of stockholders. Our human resources department, in consultation with our Chief Executive Officer and the Chair of the Committee, completed an assessment of all cash and equity compensation plans, including an analysis of the competitive market range for each executive position, and presented these findings, along with recommended changes, for the review and approval of the Committee in August of 2013. Recommended changes for the compensation plans of the Chief Executive Officer were also reviewed and approved by our board of directors in September of 2013 and implemented for the remainder of fiscal year 2014.
The executive compensation plans implemented in fiscal year 2014 are intended to serve as a multi-year framework, with the awards made in fiscal year 2014 intended to manage the transition to the new plans and their potential implications for total compensation of our executives, including our NEOs. Key changes in fiscal year 2014 to the components of compensation for our NEOs are as follows:
| • | Base salary — Above-market annual base salary adjustments were provided effective September 1, 2013 based on an assessment of each NEO’s performance, position versus the competitive marketplace, and elapsed time since their last base salary adjustment. |
| • | Annual Cash Incentive Plan — Transitioned from a profit sharing pool-based incentive design to a plan design with explicit performance goals based on performance versus the prior year and corresponding |
- 121 -
Table of Contents
| awards (established as a percent of salary) for each NEO. Financial performance across two measures constitutes 80% of the target award with the remaining 20% allocated to individual performance. |
| • | Long-Term Equity-Based Incentives — For the past several years, including in May 2013, the Committee recommended and our board of directors approved restricted stock grants to executives, including the NEOs which grants were made based on the aggregate grant date fair value of the restricted stock awarded. As part of the review of the executive compensation program in fiscal year 2014 the Committee determined that non-qualified stock option grants would better align the compensation of our NEOs with our long-term growth. Effective September 1, 2013 the Committee recommended and our board of directors approved non-qualified stock option grants to the NEOs, which are designed to be multi-year awards to encourage the retention and motivation of the executives through the transition to becoming a public company. |
The changes implemented resulted in a shift of the total compensation mix of the NEOs from short to long-term compensation, which the Committee believes further aligns the interests of our executives with those of our stockholders.
Our Compensation Philosophy and Principles
Our culture is based on delivering sustainable results; a philosophy we believe is best embodied by our core values of:
| • | focusing on long-term growth and profitability; |
| • | creating an environment that promotes loyalty among employees, customers, and suppliers; |
| • | being sales and marketing driven; |
| • | being committed to innovation in product, process, and technology; and |
| • | ensuring quality throughout our products and organization. |
Compensation Philosophy
The Committee and our management believe that fostering the core values referenced above requires a strong performance culture and compensation programs that align our executives’ interests with those of all of our stockholders by rewarding performance that meets or exceeds the goals established by the Committee and our board of directors.
Compensation Principles
Our executive compensation programs are designed according to the following principles:
| • | emphasizing pay-for-performance to motivate both short and long-term performance; |
| • | placing greater emphasis on variable pay versus fixed pay; |
| • | linking the total compensation of our executives to the sustained value they create for our stockholders through the use of equity-based compensation; |
| • | structuring total compensation levels within competitive range for similar executive roles; and |
| • | attracting, retaining and motivating top executive talent. |
Determining Executive Compensation
Role of our Compensation Committee. Pursuant to authority delegated by our board of directors, the Committee is responsible for the design and implementation of our executive compensation policies and programs and determines the compensation for each of our executive officers other than the Chief Executive
- 122 -
Table of Contents
Officer consistent with the terms of the employment agreement for each NEO. In fiscal year 2014, our board of directors determined the compensation of Mr. Chlapaty, our Chief Executive Officer, based on the Committee’s recommendations and in accordance with Mr. Chlapaty’s employment agreement. A summary of the employment agreements currently in effect with each of our NEOs is described below under “— Employment Agreements.”
Role of Management. Our human resources department, in partnership with the Committee, supports the design and implementation of all executive compensation programs. Our finance department supports this process by providing financial analysis and input as part of the review of program design. Except with respect to his own compensation, our Chief Executive Officer has final management-level review of any compensation program before it is sent to the Committee for consideration and approval. The Committee has responsibility for approving our material compensation programs, including our equity compensation program. Management frequently consults with the Committee during the design process to obtain their direction and feedback on how the design of our executive compensation programs supports our overall strategy.
Use of Comparator Data. For consideration in the review and approval of the fiscal year 2014 executive compensation programs, neither we nor the Committee retained the services of any third-party compensation consultants to benchmark our compensation policies against a targeted peer group of companies. Instead, the Chief Executive Officer and the Committee utilized a market analysis prepared by the human resources department to provide an understanding of the competitive market for use in the development, review, and approval of the fiscal year 2014 executive compensation programs.
To provide competitive market range information for fiscal year 2014, a market analysis was performed based on ownership, industry, and revenue, as most recently taken from the 2012 Mercer Executive Compensation Survey (2,541 organizations participating) and the 2012 Towers Watson Executive Compensation Survey (534 organizations participating). The market segmentation used for base salary and short-term incentive comparisons was private companies of all industries and revenue between $500 million and $1.5 billion. The market segmentation used for long-term compensation comparison was public and private companies of all industries and revenue between $500 million and $1.5 billion. To establish market ranges, data from the two surveys were averaged together and a low and high range established from the calculated median data. For base salary and short-term incentives, a plus or minus factor of 20% was applied to establish the low and high market ranges and for long-term compensation a plus or minus factor of 25% factor was applied to establish the low and high market ranges.
Role of Compensation Consultants. While the Committee did not engage the services of a compensation consultant in connection with the revisions made to our incentive programs in fiscal year 2014, in January 2014, our vice president of human resources, at the direction of the Chief Executive Officer, engaged Towers Watson, a third-party executive compensation consultant, to assist management in connection with a further review of our existing and proposed director and executive officer compensation programs, in anticipation of this offering. Towers Watson also assisted management with respect to the review of this prospectus and the disclosures related to executive compensation. Towers Watson did not provide any services to us, or receive any payments from us, other than in their capacity as a consultant to our management for the limited purposes described above.
Setting Pay Levels
When setting pay levels the Committee exercises its discretion to position individual pay levels higher or lower in the competitive market range based on a subjective assessment of individual facts and circumstances, including:
| • | the strategic importance of the position to our growth objectives; |
| • | the individual experience, competency, skill, performance, and potential; |
- 123 -
Table of Contents
| • | the overall performance and contribution of the individual to the business performance; and |
| • | the elapsed time since the last compensation adjustment. |
Components of Compensation
For fiscal year 2014, the principal components of compensation for the named executive officers were:
| • | base salary; |
| • | annual cash incentive compensation; |
| • | long-term equity-based compensation; and |
| • | benefits and executive perquisites. |
The Committee has responsibility for determining all elements of compensation granted to the NEOs and reviews each element of compensation, as well as the relative mix or weighting of elements, on an annual basis.
Base Salary
Base salary is the primary fixed element of total compensation and serves as the foundation for the executive’s compensation structure, since the annual cash incentive program is directly linked to base salary levels. Our NEOs are covered by employment agreements and, accordingly, we pay annual base salaries initially as set forth in these agreements as thereby adjusted, which are determined based on each NEOs position and responsibility and on available market data. Base salaries for each NEO are reviewed on an annual basis and compared against the competitive range for similar positions based on survey data provided by our human resources department. Each year, the Chief Executive Officer, with input from the human resources department, proposes base salary increases, if any, for all NEOs, excluding himself, based on the aforementioned criteria. His proposal is subject to review and approval (with or without modifications) by the Committee. Changes to Mr. Chlapaty’s base salary are initiated and approved by the Committee directly, subject to the review and final approval of our board of directors.
As part of our overall review of our executive compensation programs, the Committee recommended an increase in the fiscal year 2014 base salary for our Chief Executive Officer, following its review of Mr. Chlapaty’s performance, the compensation information from the comparison survey data referenced above and the elapsed time since his last base salary adjustment, which was May 2010. For all the other NEOs, the Committee increased 2014 salary levels taking into account the recommendations from the Chief Executive Officer, the performance of each NEO, the compensation information from the comparison survey data referenced above and the elapsed time since the last base salary adjustment for each NEO. For Mr. Sturgeon, Mr. Fussner, and Mr. Klein their last base salary adjustment was May of 2010. Mr. Vitarelli’s last salary adjustment was in November of 2011 as part of his promotion to Executive Vice President and Co-Chief Operating Officer.
The table below shows the adjustments in base salary for the NEOs in fiscal year 2014. Base salary adjustments were effective as of September 1, 2013 with no adjustments or annualization for amounts paid prior to the adjustment date for fiscal year 2014.
| Named Executive Officer |
Base Salary As of August 31, 2013($) |
Base Salary After Adjustment($) |
Change | |||||||||
| Joseph A. Chlapaty |
425,000 | 475,000 | 12 | % | ||||||||
| Mark B. Sturgeon |
250,000 | 285,000 | 14 | % | ||||||||
| Thomas M. Fussner |
300,000 | 315,000 | 5 | % | ||||||||
| Ronald R. Vitarelli |
250,000 | 275,000 | 10 | % | ||||||||
| Robert M. Klein |
250,000 | 270,000 | 8 | % | ||||||||
- 124 -
Table of Contents
Annual Cash Incentive Compensation
Prior to fiscal year 2014, the executive annual cash incentive plan functioned as a profit-sharing pool in which a designated percentage of our annual operating earnings were allocated to an incentive pool. Our Chief Executive Officer, subject to the approval of our board of directors, received a pre-established percentage of the allocated incentive pool. For all other executives, including all NEOs except himself, the CEO would recommend a distribution for the review and approval of the Committee from the incentive pool for each executive based on the assessment of the executive’s individual performance and contribution to our overall annual performance. As part of the assessment discussed above under “— Executive Summary,” the design of this program was evaluated and changes to the design were recommended and approved by the Committee and our board of directors for fiscal year 2014.
The fiscal year 2014 ADS Cash Incentive Plan, or the Cash Incentive Plan, provides annual cash incentive compensation opportunities based on two performance measures related to our financial performance, as well as an individual performance measure based upon the performance of the NEO as compared to their annual performance objectives. By tying a significant portion of the executive’s total annual cash compensation to annual variable pay, the Committee believes it further reinforces our pay for performance culture and focuses our executives on critical short-term financial and operational objectives, which also support our long-term financial goals.
Establishing Target Payouts
Under the Cash Incentive Plan, target payouts for each NEO are reviewed on an annual basis and compared against the competitive range for similar positions based on survey data provided by the human resources department. The Chief Executive Officer, with input from the human resources department, proposes annual target payout adjustments, if any, for all NEOs, excluding himself, based on the aforementioned performance measures. His proposal is subject to review and approval (with or without modifications) by the Committee. Changes to Mr. Chlapaty’s targeted payout from the Cash Incentive Plan are initiated and approved by the Committee directly, subject to the review and final approval of our board of directors.
Consistent with our compensation principles, the target payouts from the Cash Incentive Program are a significant portion of the target annual cash compensation for our NEOs. In general, the annual target percentages for each of the NEOs is high in the competitive range as compared to the survey data. The Committee believes the established targets enhance the alignment to our pay-for-performance and stakeholder alignment principles. The target annual cash incentive payouts for 2014 as a percentage of salary were as follows:
| Target Payout (as a percent of salary) | ||||
| Joseph A. Chlapaty |
140 | % | ||
| Mark B. Sturgeon |
75 | % | ||
| Thomas M. Fussner |
75 | % | ||
| Ronald R. Vitarelli |
75 | % | ||
| Robert M. Klein |
65 | % | ||
In making award determinations under the Cash Incentive Plan, the Committee also has the authority and discretion to take into consideration the impact of other factors or events that positively or negatively affected our business during the year and adjust any payout awards accordingly.
Performance Measures
The Committee believes that the following measures reflect key value drivers for purposes of establishing payouts under the Cash Incentive Plan:
| • | EBITDA — earnings before interest, taxes, depreciation and amortization. |
| • | Average Debt Balance — trailing twelve month average long-term debt. |
- 125 -
Table of Contents
| • | Individual Goal Achievement — performance of the executives versus their annual performance objectives. |
Minimum, target, and maximum performance thresholds are established based on the Committee’s assessment of performance targets that appropriately drive and reward the achievement of growth versus our prior year performance levels.
For fiscal year 2014, 70% of the incentive award is based upon the achievement of certain levels of EBITDA, 10% is based upon certain levels of average debt balance, while 20% is based upon attainment of certain personal performance goals. The foregoing percentages are then multiplied by the NEO’s target percentage of base annual salary as of September 1, 2013 to arrive at the target amounts.
Consistent with our pay-for-performance compensation principle, the Cash Incentive Plan includes a funding trigger that requires the achievement of the established threshold performance level for EBITDA in order for any potential payout based on the Average Debt Balance or Individual Goal Achievement measures.
The minimum performance goals required to achieve a threshold payout of 50% of target for EBITDA and average debt balance reflect our prior year actual performance levels. For fiscal 2014, the Committee approved the establishment of a target range for the financial measures in the Plan, for which performance within the range earns a 100% payout. The bottom of the target range for the EBITDA performance measure represents15% growth versus prior year and the top of the target range represents 26% growth versus prior year. The bottom of the target range for the average debt balance represents a 5% reduction versus the prior year and the top of the target range represents a 10% reduction versus the prior year. The maximum performance goals required to achieve a threshold payout of 200% of target for EBITDA and average debt balance reflect 51% growth and 19% reduction versus prior year, respectively. Payout percentages for performance between the minimum performance goal and bottom of the target range as well as from the top of the target range to the maximum performance goal are determined using linear interpolation.
The Cash Incentive Plan also includes an individual goal achievement measure to provide the Chief Executive Officer, the Committee, and our board of directors the opportunity to distinguish individual performance. For each NEO, at the beginning of the fiscal year the Committee approved individual annual performance objectives supportive of key business and operational strategies. The individual objectives were based on objective and subjective criteria. Payments based upon this measure in the Cash Incentive Plan are recommended by the Chief Executive Officer, excluding himself, based on his assessment of the performance of the NEOs versus the established annual performance objectives approved for the fiscal year. The recommendations are subject to the review and final approval of the Committee. Similarly, the Committee assesses the performance of the Chief Executive Officer versus his established annual performance objectives and recommends a payout percentage for the measure that is subject to the review and final approval of our board of directors.
Long-Term Equity-Based Compensation
We maintain several equity-based incentive plans, including:
| • | the ADS Amended 2000 Incentive Stock Option Plan (or the 2000 Plan), |
| • | the ADS 2008 Restricted Stock Plan (or the 2008 Plan), and |
| • | the ADS 2013 Stock Option Plan (or the 2013 Plan). |
Our NEOs participate in all of the aforementioned plans (except that Mr. Chlapaty received no award grants under the 2000 Plan). We no longer make awards under the 2000 Plan, although additional options may continue to be issued on a periodic basis pursuant to the reload feature of the 2000 Plan.
- 126 -
Table of Contents
Long-term incentive compensation is an integral part of the total compensation for Company executives. The long-term equity-based incentives of the NEOs are reviewed on an annual basis. Each year, the Chief Executive Officer, with input from human resources, proposes long-term equity-based incentive grants, if any, for all NEOs, excluding himself, based on the aforementioned criteria. His proposal is subject to review and approval (with or without modifications) by the Committee. The long-term equity-based incentive grant, if any, for Mr. Chlapaty is initiated and approved by the Committee directly, subject to the review and final approval of our board of directors.
The Committee requested that management review the design of the long-term equity-based incentive program in consideration of the compensation guiding principles and the potential for an initial public offering.
Through May 2013, shares of restricted stock from the ADS 2008 Restricted Stock Plan were primarily used for long-term equity compensation for all executives, including NEOs. As part of the review of the executive compensation program in fiscal year 2014 the Committee determined non-qualified stock option grants would better align the compensation of our NEOs with our long-term growth. Accordingly, the Committee recommended and our board of directors approved adoption of the 2013 Plan.
In determining the amount of long-term equity incentives to grant in fiscal year 2014, the Committee considered (i) the comparison to the competitive marketplace for each executive, including NEOs, (ii) the comparative potential decrease, over the next several years, in compensation from the change in design of the annual cash incentive plan impacting all executives, including NEOs, and (iii) the potential for an initial public offering and the need to retain the executives thereafter. Upon consideration of these factors, the Committee approved a grant of options on September 1, 2013 to each of the executives to further encourage the retention and motivation of the executives throughout a potential transition to a public company.
Consistent with prior equity incentive grants, the non-qualified stock options awarded to the NEOs under the 2013 Plan in fiscal year 2014 are subject to a five-year vesting schedule (except for Mr. Chlapaty, whose options are subject to a four-year vesting schedule).
Benefits and Executive Perquisites
The benefits provided to our NEOs are generally the same as those provided to our other salaried associates and include medical, vision and dental insurance, basic life insurance and accidental death and dismemberment insurance, short- and long-term disability insurance.
All of the NEOs, with the exception of Mr. Chlapaty, participate in our tax-qualified ESOP that covers employees who meet certain service requirements. See “— Equity-Based Incentive Plans —Employee Stock Ownership Plan” and “Description of Employee Stock Ownership Plan” for additional information regarding the ESOP.
All of the NEOs participate in a fully-insured executive medical reimbursement plan. In consideration of this benefit, Mr. Chlapaty contributed $12,000 in calendar year 2013 and the rest of the NEO’s contributed $6,000 in calendar year 2013 for dual participation in this plan as well as our medical, dental and vision plans. These contributions are deducted on a pre-tax basis.
All of the NEOs are provided with an individually owned life insurance policy providing $200,000 of permanent whole life coverage with a term rider providing an initial death benefit of $200,000. This benefit is in recognition of the carve-out under our group term life insurance program that reduces the maximum benefit available from $450,000 to $50,000 for executives, including NEOs. The death benefit under the term rider is gradually replaced by paid-up additional permanent life insurance provided by the dividends on the policies. The policies also accrue cash values which are owned by the executive, or their designee, and may be available to them while the policies are in effect. Premiums for each policy are paid for by us and the premium is considered taxable income to the NEO.
- 127 -
Table of Contents
We also provide our NEOs with certain perquisites. These perquisites include use of Company-owned or leased cars and reimbursement of car-related expenses, payment of automobile insurance premiums for Company provided and personal vehicles, reimbursement of country club or fitness membership dues. The Committee has determined that it is appropriate to provide these perquisites in order to attract and retain our NEOs by offering them compensation opportunities that are competitive with those offered by companies of similar size and scope. In determining the total compensation payable to our NEOs, the Committee considers perquisites in the context of the total compensation which our NEOs are eligible to receive. However, given the fact that perquisites represent a relatively small portion of the NEO’s total compensation, the availability of these perquisites does not materially influence the decisions made by the Committee with respect to other elements of the total compensation to which our NEOs are entitled or to which they are awarded.
Pursuant to the terms of his employment agreement, Mr. Chlapaty is entitled to the use of any Company-owned or leased aircraft at our expense for travel related to the performance of his duties on behalf of us and/or charitable uses and purposes. Mr. Chlapaty and certain other NEOs are also permitted to make personal use of Company aircraft. In fiscal year 2014, Mr. Chlapaty and Mr. Sturgeon made personal use of Company aircraft. The incremental cost of personal use of Company aircraft is calculated based on the average variable operating cost per hour flown, which includes fuel costs, aircraft maintenance and supplies, landing fees and trip related hanger and parking costs. Fixed costs that do not change based on usage such as hanger rental, aircraft lease payments, insurance and certain administrative expenses are excluded from the incremental cost calculation. If an aircraft flies empty before picking up or after dropping off a passenger flying for personal reasons, this “deadhead” segment is included in the incremental cost of the personal use. If an NEO is traveling on business utilizing Company aircraft and there is otherwise room available on the aircraft for the NEO’s spouse to accompany the NEO, the spouse is permitted to do so.
For a description of the perquisites received by our NEOs during fiscal year 2014, see the “All Other Compensation” column of our Summary Compensation Table below.
Tax and Accounting Considerations
While the accounting and tax treatment of compensation generally has not been a consideration in determining the amounts of compensation for our executive officers, the Committee and management have taken into account the accounting and tax impact of various program designs to balance the potential cost to us with the value to the executive.
The expenses associated with executive compensation issued to our executive officers and other key associates are reflected in our financial statements. We account for stock-based programs in accordance with the requirements of ASC Topic 718, which requires companies to recognize in the income statement the grant date value of equity-based compensation issued to associates over the vesting period of such awards.
Risk in Relation to Compensation Programs
We have performed an internal review of all of our material compensation programs and have concluded that there are no plans that provide meaningful incentives for employees, including our NEOs and additional executive officers, to take risks that would be reasonably likely to have a material adverse effect on us.
- 128 -
Table of Contents
Summary Compensation Table for Fiscal Year 2014
The following table summarizes the total compensation earned by each of our NEOs for the fiscal year ended March 31, 2014:
| Name and |
Fiscal Year |
Salary $ (1) |
Bonus $ |
Stock Awards $ (2) |
Option Awards $ (3) |
Non-Equity Incentive Plan Compensation $ (4) |
All Other Compensation $ (5) |
Total $ |
||||||||||||||||||||||||
| Joseph A. Chlapaty |
2014 | 454,167 | — | 385,200 | 3,221,680 | — | 151,015 | 4,212,062 | ||||||||||||||||||||||||
| President & Chief Executive Officer |
||||||||||||||||||||||||||||||||
| Mark B. Sturgeon |
2014 | 270,417 | — | 128,400 | 1,075,871 | — | 44,403 | 1,519,091 | ||||||||||||||||||||||||
| Executive Vice President, Chief Financial Officer, Secretary and Treasurer |
||||||||||||||||||||||||||||||||
| Thomas M. Fussner |
2014 | 308,750 | — | 160,500 | 1,025,080 | — | 26,692 | 1,521,022 | ||||||||||||||||||||||||
| Executive Vice President and |
||||||||||||||||||||||||||||||||
| Ronald R. Vitarelli |
2014 | 264,583 | — | 160,500 | 1,025,080 | — | 23,094 | 1,473,257 | ||||||||||||||||||||||||
| Executive Vice President and |
||||||||||||||||||||||||||||||||
| Robert M. Klein |
2014 | 261,667 | — | 96,300 | 878,640 | — | 18,122 | 1,254,729 | ||||||||||||||||||||||||
| Executive Vice President of Sales |
||||||||||||||||||||||||||||||||
| (1) | Reflects adjustment to NEO salaries that went into effect as of September 1, 2013. |
| (2) | The amounts reported in this column are based on the aggregate grant date fair value of restricted stock awarded, computed in accordance FASB ASC Topic 718, Compensation — Stock Compensation. We calculated the estimated fair value of each share of restricted stock on the date of grant as described under “Management’s Discussion and Analysis of Financial Condition and Results of Operations — Critical Accounting Policies and Estimates — Employee Benefit Plans — Stock-Based Compensation Plans.” |
| (3) | The amounts reported in this column are based on the aggregate grant date fair value of stock options awarded, computed in accordance with the FASB ASC Topic 718. We calculated the estimated fair value of each option award on the date of grant using a Black-Scholes option pricing model as described under “Management’s Discussion and Analysis of Financial Condition and Results of Operations — Critical Accounting Policies and Estimates — Employee Benefit Plans — Stock-Based Compensation Plans.” The amount in this column for Mr. Sturgeon also includes the grant date fair value of reload options issued in connection with the exercise of previously granted options under the 2000 Plan. The dollar amount of the option awards in fiscal year 2014 related to reload options for Mr. Sturgeon is $50,791. |
| (4) | The amounts reported in this column consist of amounts to be paid under the Cash Incentive Plan for services rendered in fiscal year 2014, which amounts, if any, cannot presently be determined. It is estimated that such determination will be made in the first quarter of fiscal year 2015, at which time the bonus payment amount, if any, will be disclosed. or a discussion of the Cash Incentive Plan, see the discussion above under “—Compensation Discussion and Analysis — Components of Compensation — Annual Cash Incentive Compensation.” |
| (5) | The All Other Compensation column is made up of the following amounts for fiscal year 2014: |
| Name |
Medical Reimbursement Plan Premiums |
Life Insurance Premiums |
Dividends on Unvested Restricted Stock (a) |
Automobile Expenses (b) |
Aircraft Use (c) |
Social Membership Dues |
Total $ | |||||||||||||||||||||
| Joseph A. Chlapaty |
$ | 250 | $ | 4,204 | $ | 45,000 | $ | 1,361 | $ | 88,132 | $ | 12,068 | $ | 151,015 | ||||||||||||||
| Mark B. Sturgeon |
$ | 250 | $ | 3,664 | $ | 15,000 | $ | 4,880 | $ | 13,244 | $ | 7,365 | $ | 44,403 | ||||||||||||||
| Thomas M. Fussner |
$ | 250 | $ | 3,834 | $ | 18,750 | $ | 2,238 | — | $ | 1,620 | $ | 26,692 | |||||||||||||||
| Ronald R. Vitarelli |
$ | 250 | $ | 4,094 | $ | 18,750 | — | — | — | $ | 23,094 | |||||||||||||||||
| Robert M. Klein |
$ | 250 | $ | 2,854 | $ | 11,250 | $ | 1,100 | — | $ | 2,668 | $ | 18,122 | |||||||||||||||
| (a) | On January 15, 2014, we paid a special cash dividend of $7.50 per share to all stockholders of record on January 2, 2014. In connection with this dividend and based on their respective equity holdings, our NEOs received such dividend payments with respect to unvested shares of restricted common stock, including those shares of restricted stock awarded to each NEO in fiscal year 2014. |
| (b) | Includes amounts associated with personal use of automobile and related automobile liability insurance expense. |
- 129 -
Table of Contents
| (c) | Relates to the incremental cost for personal use of Company aircraft by the NEO. The incremental cost of personal use of Company aircraft is calculated based on the average variable operating cost per hour flown, which includes fuel costs, aircraft maintenance and supplies, landing fees and trip related hanger and parking costs. Fixed costs that do not change based on usage such as hanger rental, aircraft lease payments, insurance and certain administrative expenses are excluded from the incremental cost calculation. If an aircraft flies empty before picking up or after dropping off a passenger flying for personal reasons, this “deadhead” segment is included in the incremental cost of the personal use. If an NEO is traveling on business utilizing Company aircraft and there is otherwise room available on the aircraft for the NEO’s spouse to accompany the NEO, the spouse is permitted to do so. As there is no incremental cost to us for the spouse accompanying the executive on such flight, no amount has been included in the Summary Compensation Table with respect to such usage. |
- 130 -
Table of Contents
Grants of Plan-Based Awards for Fiscal Year 2014
The following table provides information concerning awards granted to the NEOs in the last fiscal year under any plan:
| Name |
Grant Date | Estimated Possible Payouts Under Non-Equity Incentive Plan Awards (1) |
All Other Stock Awards: Number of Shares of Stock (#) |
All Other Option Awards: Number of Securities Underlying Options (#) |
Exercise or Base Price of Option Awards ($/Sh) |
Grant Date Fair Value of Stock and Option Awards ($) (5) |
||||||||||||||||||||||||||
| Threshold $ |
Target $ |
Maximum $ |
||||||||||||||||||||||||||||||
| Joseph A. Chlapaty |
N/A | 332,500 | 665,000 | 1,330,000 | — | — | — | — | ||||||||||||||||||||||||
| 5/01/2013 | (2) | — | — | — | 6,000 | — | — | 385,200 | ||||||||||||||||||||||||
| 9/01/2013 | (3) | — | — | — | — | 110,000 | 64.20 | 3,221,680 | ||||||||||||||||||||||||
| Mark B. Sturgeon |
N/A | 106,875 | 213,750 | 427,500 | — | — | — | — | ||||||||||||||||||||||||
| 5/01/2013 | (2) | — | — | — | 2,000 | — | — | 128,400 | ||||||||||||||||||||||||
| 8/01/2013 | (4) | — | — | — | — | 1,734.18 | 64.20 | 50,791 | ||||||||||||||||||||||||
| 9/01/2013 | (3) | — | — | — | — | 35,000 | 64.20 | 1,025,080 | ||||||||||||||||||||||||
| Thomas M. Fussner |
N/A | 118,125 | 236,250 | 472,500 | — | — | — | — | ||||||||||||||||||||||||
| 5/01/2013 | (2) | — | — | — | 2,500 | — | — | 160,500 | ||||||||||||||||||||||||
| 9/01/2013 | (3) | — | — | — | — | 35,000 | 64.20 | 1,025,080 | ||||||||||||||||||||||||
| Ronald R. Vitarelli |
N/A | 103,125 | 206,250 | 412,500 | — | — | — | — | ||||||||||||||||||||||||
| 5/01/2013 | (2) | — | — | — | 2,500 | — | — | 160,500 | ||||||||||||||||||||||||
| 9/01/2013 | (3) | — | — | — | — | 35,000 | 64.20 | 1,025,080 | ||||||||||||||||||||||||
| Robert M. Klein |
N/A | 87,750 | 175,500 | 351,000 | — | — | — | — | ||||||||||||||||||||||||
| 5/01/2013 | (2) | — | — | — | 1,500 | — | — | 96,300 | ||||||||||||||||||||||||
| 9/01/2013 | (3) | — | — | — | — | 30,000 | 64.20 | 878,640 | ||||||||||||||||||||||||
| (1) | The amounts shown reflect the estimated payouts for fiscal year 2014 under the Cash Incentive Plan that the respective NEO would be eligible for assuming no use of discretion by the Committee in authorizing such payments. See above under “— Compensation Discussion and Analysis — Components of Compensation — Annual Cash Incentive Compensation” for a discussion of the Cash Incentive Plan. For fiscal year 2014, 70% of the incentive award is based upon the achievement of certain levels of EBITDA, 10% is based upon certain levels of average debt balance, while 20% is based upon attainment of certain personal performance goals. The foregoing percentages are then multiplied by the NEO’s target percentage of base annual salary rate as of September 1, 2013 to arrive at the target amounts reflected in this table. The Cash Incentive Plan threshold reflects 50% of the applicable target percentage and the maximum reflects 200% of the applicable target percentage. The actual payout under the Cash Incentive Plan for fiscal year 2014 cannot presently be determined. It is estimated that such determination will be made in the first quarter of fiscal year 2015, at which time the amounts, if any, will be disclosed in the Non-Equity Incentive Plan Compensation column of the Summary Compensation Table above. |
| (2) | Represents restricted stock awards granted under the 2008 Plan as part of our annual long-term equity grant, which vest over a five-year period in 20% installments each year, beginning with the first anniversary following the grant date. |
| (3) | Represents option awards granted under the 2013 Plan as part of our annual long-term equity grant, which vest over a five-year period in 20% installments each year, beginning with the first anniversary following the grant date (except for Mr. Chlapaty’s option award, which options vest over a four-year period in 25% installments each year, beginning with the first anniversary following the grant date). The vesting terms of these options will not accelerate upon completion of this offering. |
| (4) | Represents option award granted pursuant to the reload option provisions of outstanding option agreements under the 2000 Plan. For more information regarding reload options under the 2000 Plan, see “— Equity Based Incentive Plans — 2000 Incentive Stock Option Plan.” The reload option awards granted to Mr. Sturgeon vest in one-third increments beginning in the fifth year, provided however that all reload option awards will vest in full upon completion of this offering. |
| (5) | The amounts shown are based on the aggregate grant date fair value of restricted stock and stock options awarded, computed in accordance with FASB ASC Topic 718. We calculated the estimated fair value of (i) each restricted stock award on the date of grant and (ii) each option award on the date of grant using a Black-Scholes option pricing model, as described under “Management’s Discussion and Analysis of Financial Condition and Results of Operations — Critical Accounting Policies and Estimates — Employee Benefit Plans — Stock-Based Compensation Plans.” |
- 131 -
Table of Contents
Outstanding Equity Awards at Fiscal Year Ended March 31, 2014
The following table sets forth the unexercised and unvested stock options and restricted stock held by NEOs at fiscal year-end. Each equity grant is shown separately for each NEO.
| Option Awards | Stock Awards | |||||||||||||||||||||||||||||
| Option Grant Date |
Number of Securities Underlying Unexercised Options That Are Exercisable |
Number of Securities Underlying Unexercised Options That Are Not Exercisable |
Option Exercise Price |
Option Expiration Date |
Stock Award Grant Date |
Number of Shares or Units of Stock That Have Not Vested |
Market Value of Shares or Units of Stock That Have Not Vested (4) | |||||||||||||||||||||||
| Shares | Shares | $ | Shares | $ | ||||||||||||||||||||||||||
| Joseph A. Chlapaty |
||||||||||||||||||||||||||||||
| Stock Options (1) |
9/01/13 | — | 110,000 | 64.20 | 3/31/23 | |||||||||||||||||||||||||
| Restricted Stock (3) |
7/09 | 1,200 | ||||||||||||||||||||||||||||
| Restricted Stock (3) |
4/10 | 2,400 | ||||||||||||||||||||||||||||
| Restricted Stock (3) |
5/11 | 1,800 | ||||||||||||||||||||||||||||
| Restricted Stock (3) |
5/12 | 4,800 | ||||||||||||||||||||||||||||
| Restricted Stock (3) |
5/13 | 6,000 | ||||||||||||||||||||||||||||
| Mark B. Sturgeon |
||||||||||||||||||||||||||||||
| Stock Options (2) |
4/27/05 | 3,321 | — | 21.37 | 3/31/15 | |||||||||||||||||||||||||
| Stock Options (2) |
4/26/06 | 11,600 | — | 36.15 | 3/31/16 | |||||||||||||||||||||||||
| Stock Options (2) |
4/25/07 | 6,325.152 | 3,115.374 | 50.70 | 3/31/17 | |||||||||||||||||||||||||
| Stock Options (2) |
7/22/09 | — | 6,092.872 | 44.40 | 3/31/19 | |||||||||||||||||||||||||
| Stock Options (2) |
7/21/10 | — | 3,072.063 | 50.60 | 3/31/20 | |||||||||||||||||||||||||
| Stock Options (2) |
8/01/12 | — | 1,921.657 | 59.25 | 3/31/22 | |||||||||||||||||||||||||
| Stock Options (2) |
9/01/13 | — | 1,734.177 | 64.20 | 3/31/23 | |||||||||||||||||||||||||
| Stock Options (1) |
9/01/13 | — | 35,000 | 64.20 | 3/31/23 | |||||||||||||||||||||||||
| Restricted Stock (3) |
7/09 | 300 | ||||||||||||||||||||||||||||
| Restricted Stock (3) |
4/10 | 800 | ||||||||||||||||||||||||||||
| Restricted Stock (3) |
10/10 | 1,200 | ||||||||||||||||||||||||||||
| Restricted Stock (3) |
5/11 | 600 | ||||||||||||||||||||||||||||
| Restricted Stock (3) |
5/12 | 1,600 | ||||||||||||||||||||||||||||
| Restricted Stock (3) |
5/13 | 2,000 | ||||||||||||||||||||||||||||
| Thomas M. Fussner |
||||||||||||||||||||||||||||||
| Stock Options (2) |
4/25/07 | 2,891.720 | 1,424.280 | 50.70 | 3/31/23 | |||||||||||||||||||||||||
| Stock Options (2) |
7/22/09 | — | 10,738 | 44.40 | 3/31/19 | |||||||||||||||||||||||||
| Stock Options (2) |
7/21/10 | — | 5,168 | 50.60 | 7/31/20 | |||||||||||||||||||||||||
| Stock Options (2) |
5/03/11 | — | 4,675 | 50.35 | 3/31/21 | |||||||||||||||||||||||||
| Stock Options (2) |
8/01/12 | — | 3,935 | 59.25 | 3/31/22 | |||||||||||||||||||||||||
| Stock Options (1) |
9/01/13 | — | 35,000 | 64.20 | 3/31/23 | |||||||||||||||||||||||||
| Restricted Stock (3) |
7/09 | 400 | ||||||||||||||||||||||||||||
| Restricted Stock (3) |
4/10 | 1,600 | ||||||||||||||||||||||||||||
| Restricted Stock (3) |
5/11 | 1,200 | ||||||||||||||||||||||||||||
| Restricted Stock (3) |
5/12 | 2,400 | ||||||||||||||||||||||||||||
| Restricted Stock (3) |
5/13 | 2,500 | ||||||||||||||||||||||||||||
| Robert M. Klein |
||||||||||||||||||||||||||||||
| Stock Options (2) |
4/27/05 | 7,140 | — | 21.37 | 3/31/15 | |||||||||||||||||||||||||
| Stock Options (2) |
4/26/06 | 12,000 | — | 36.15 | 3/31/16 | |||||||||||||||||||||||||
| Stock Options (2) |
4/25/07 | 5,940 | 3,060 | 50.70 | 3/31/17 | |||||||||||||||||||||||||
| Stock Options (2) |
8/01/12 | — | 6,849.95 | 59.25 | 3/31/22 | |||||||||||||||||||||||||
| Stock Options (1) |
9/01/13 | — | 30,000 | 64.20 | 3/31/23 | |||||||||||||||||||||||||
| Restricted Stock (3) |
7/09 | 400 | ||||||||||||||||||||||||||||
| Restricted Stock (3) |
4/10 | 800 | ||||||||||||||||||||||||||||
| Restricted Stock (3) |
5/11 | 600 | ||||||||||||||||||||||||||||
| Restricted Stock (3) |
5/12 | 1,200 | ||||||||||||||||||||||||||||
| Restricted Stock (3) |
5/13 | 1,500 | ||||||||||||||||||||||||||||
| Ronald R. Vitarelli |
||||||||||||||||||||||||||||||
| Stock Options (1) |
9/01/13 | — | 35,000 | 64.20 | 3/31/23 | |||||||||||||||||||||||||
| Restricted Stock (3) |
4/10 | 200 | ||||||||||||||||||||||||||||
| Restricted Stock (3) |
5/11 | 600 | ||||||||||||||||||||||||||||
| Restricted Stock (3) |
5/12 | 1,600 | ||||||||||||||||||||||||||||
| Restricted Stock (3) |
5/13 | 2,500 | ||||||||||||||||||||||||||||
- 132 -
Table of Contents
| (1) | Stock options issued pursuant to the 2013 Plan, which vest over a five-year period in 20% installments each year, beginning with the first anniversary following the grant date (except for Mr. Chlapaty’s option award, which vest over a four-year period in 25% installments each year). The vesting terms of these options will not accelerate upon completion of this offering. |
| (2) | Stock options issued pursuant to the 2000 Plan, which vest over a three-year period in one-third installments each year, beginning with the fifth anniversary following the grant date, provided however that all remaining unvested options will vest in full immediately prior to the completion of this offering. |
| (3) | Restricted stock issued pursuant to the 2008 Plan, which vest over a five-year period in 20% installments each year, beginning with the first anniversary following the grant date. |
| (4) | The market price for our common stock is based on the assumed initial public offering price of our common stock of $ per share, which is the midpoint of the price range on the cover page of this prospectus. |
Option Exercises and Stock Vested for Fiscal Year 2014
The following table sets forth for each NEO the exercises of stock options and the vesting of stock awards during fiscal year 2014:
Option Exercises and Stock Vested
| Option Awards | Stock Awards | |||||||||||||||
| Name |
Number of Shares Acquired on Exercise |
Value Realized on Exercise (1) |
Number of Shares Acquired on Vesting (2) |
Value Realized on Vesting (1) |
||||||||||||
| # | $ | # | $ | |||||||||||||
| Joseph A. Chlapaty |
— | — | 5,400 | 346,680 | ||||||||||||
| Mark B. Sturgeon |
8,679 | 388,702 | 2,160 | 138,672 | ||||||||||||
| Thomas M. Fussner |
8,316 | 170,466 | 2,600 | 166,920 | ||||||||||||
| Robert M. Klein |
20,860 | 961,354 | 1,700 | 109,140 | ||||||||||||
| Ronald R. Vitarelli |
— | — | 720 | 46,224 | ||||||||||||
| (1) | Amounts shown represent (i) with respect to option awards, the difference between the fair market value of our common stock and the option exercise price at the time of the options’ exercise and (ii) with respect to stock awards, the value of the restricted shares that vest based on the fair market value of our common stock. The foregoing values do not necessarily equate to cash realized from the sale of shares acquired upon the exercise of options or vesting of restricted stock as shares were not sold on exercise or upon vesting, but continue to be held by the NEO. Value realized on exercise and vesting is calculated based upon the fair market value of our common stock as of the date of exercise or vesting, as applicable, as described under “Management’s Discussion and Analysis of Financial Condition and Results of Operations — Critical Accounting Policies and Estimates — Employee Benefit Plans — Stock-Based Compensation Plans.” |
| (2) | Restricted stock vests over a five year period in 20% installments each year, beginning with the first anniversary following the grant date. The number of shares listed in this column reflects the total number of shares of restricted stock that vested during fiscal year 2014. |
Pension Benefits and Nonqualified Deferred Compensation for Fiscal Year 2014
We do not provide any defined benefit plans or nonqualified deferred compensation plans to our NEOs.
Employment Agreements
Our NEOs have each entered into an employment agreement with us, which were negotiated between each NEO and us at arms-length. Certain elements of the compensation payable to our NEOs are set forth in these employment agreements, including initial base salary (subject to periodic adjustment) and scope of incentive compensation and benefits. These employment agreements also require us to make certain payments upon termination or change in control, as set forth below in “— Potential Payments upon Termination or Change in Control.” We intend to enter into amended and restated employment agreements with each of our NEOs prior to the commencement of this offering.
- 133 -
Table of Contents
Joseph A. Chlapaty. On January 29, 2009, we entered into an employment agreement with Mr. Chlapaty, our Chief Executive Officer, which was further amended on January 27, 2010. The employment agreement, as amended, provides for an initial employment period ending March 31, 2015. Beginning on January 1, 2015 and each January 1 thereafter, the then remaining term of the employment agreement will be extended automatically for an additional one-year period until termination pursuant to its terms, including termination by either party through notice prior to the January 1 renewal date. Mr. Chlapaty’s current annual base salary as adjusted as of September 1, 2013 is $475,000. The employment agreement also contains customary non-competition and non-solicitation covenants of Mr. Chlapaty that apply during his employment and within a period of two years following the termination of his employment with us and a confidentiality covenant of indefinite duration.
Mark B. Sturgeon. On January 29, 2009, we entered into an employment agreement with Mr. Sturgeon, our Chief Financial Officer, which was further amended on January 27, 2010. The employment agreement, as amended, provides for an initial employment period ending March 31, 2015. Beginning on January 1, 2015 and each January 1 thereafter, the then remaining term of the employment agreement will be extended automatically for an additional one-year period until termination pursuant to its terms, including termination by either party through notice prior to the January 1 renewal date. Mr. Sturgeon’s current annual base salary as adjusted as of September 1, 2013 is $285,000 and he is entitled to receive annual incentive compensation. The employment agreement also contains customary non-competition and non-solicitation covenants of Mr. Sturgeon that apply during his employment and within a period of two years following the termination of his employment with us. It also includes a confidentiality covenant of indefinite duration.
Thomas M. Fussner. On January 29, 2009, we entered into an employment agreement with Mr. Fussner, our Co-Chief Operating Officer, which was further amended on January 27, 2010. The employment agreement, as amended, provides for an initial employment period ending March 31, 2015. Beginning on January 1, 2015 and each January 1 thereafter, the then remaining term of the employment agreement will be extended automatically for an additional one-year period until termination pursuant to its terms, including termination by either party through notice prior to the January 1 renewal date. Mr. Fussner’s current annual base salary as adjusted as of September 1, 2013 is $315,000 and he is entitled to receive annual incentive compensation. The employment agreement also contains customary non-competition and non-solicitation covenants of Mr. Fussner that apply during his employment and within a period of two years following the termination of his employment with us. It also includes a confidentiality covenant of indefinite duration.
Ronald R. Vitarelli. On July 5, 2012, we entered into an employment agreement with Mr. Vitarelli, our Co-Chief Operating Officer. The employment agreement, as amended, provides for an initial employment period ending March 31, 2017. Beginning on January 1, 2017 and each January 1 thereafter, the then remaining term of the employment agreement will be extended automatically for an additional one-year period until termination pursuant to its terms, including termination by either party through notice prior to the January 1 renewal date. Mr. Vitarelli’s current annual base salary as adjusted as of September 1, 2013 is $275,000 and he is entitled to receive annual incentive compensation. The employment agreement also contains customary non-competition and non-solicitation covenants of Mr. Vitarelli that apply during his employment and within a period of two years following the termination of his employment with us. It also includes a confidentiality covenant of indefinite duration.
Robert M. Klein. On January 29, 2009, we entered into an employment agreement with Mr. Klein, our Executive Vice President, which was further amended on January 27, 2010. The employment agreement, as amended, provides for an initial employment period ending March 31, 2015. Beginning on January 1, 2015 and each January 1 thereafter, the then remaining term of the employment agreement will be extended automatically for an additional one-year period until termination pursuant to its terms, including termination by either party through notice prior to the January 1 renewal date. Mr. Klein’s current annual base salary as adjusted as of September 1, 2013 is $270,000 and he is entitled to receive annual incentive compensation. The employment agreement also contains customary non-competition and non-solicitation covenants of Mr. Klein that apply during his employment and within a period of two years following the termination of his employment with us. It also includes a confidentiality covenant of indefinite duration.
- 134 -
Table of Contents
Potential Payments upon Termination or Change in Control
We have outstanding employment agreements with each of our NEOs as described above under “— Employment Agreements” which require the payment of certain benefits to each NEO under certain specified circumstances, which we refer to as Specified Circumstances. We intend to enter into amended and restated employment agreements with each NEO prior to the commencement of this offering to modify certain of the payments and benefits that our NEOs are entitled to receive. Our existing employment agreements with each NEO identify the following as Specified Circumstances that would require the payment of certain benefits:
| • | termination by us at the end of the executive’s initial employment period or renewal period by giving three-month notice, |
| • | death or disability, |
| • | termination by the executive at the end of the executive’s initial employment period or renewal period by giving three-month notice, if the executive will have attained the age of 65 years (or 68 years in the case of Mr. Chlapaty) on the employment termination date, |
| • | termination by the executive upon our breach of material covenant in the employment agreement and failure to cure after receiving notice of such breach, |
| • | termination by the executive for good reason, which includes the following without the executive’s consent: (i) a reduction in base salary; (ii) our action which would adversely affect the executive’s participation in, or materially reduce his benefits under, any material benefit plan or equity incentive plan; (iii) our action which would adversely affect or reduce the executive’s participation in, or materially reduces the maximum potential incentive compensation available to the executive under any of our material incentive compensation plan or program; (iv) the assignment of the executive to a position of a materially lesser status or degree of responsibility; or (v) the assignment of the executive to a primary work location (A) outside the United States or (B) at which (I) neither we nor our affiliates maintain a significant manufacturing facility or significant office or (II) by virtue of such location, the ability of the executive to perform his duties is materially impaired, and |
| • | termination by us for no reason or for any reason other than mutual agreement for termination or termination for cause. “Cause” includes the executive’s non-performance of duties, failure to adhere to our policies, misappropriation of our property, conviction of felony or equivalent, or other crimes subject to possible imprisonment or involving theft, misappropriation, embezzlement, fraud or dishonesty. |
In the event of termination as a result of the Specified Circumstances described above, each NEO shall be entitled to receive payments and benefits as follows:
| • | for the 24 months (or 18 months in the case of Mr. Vitarelli) following the termination date, we will continue to pay the executive’s base salary, subject to reduction by the proceeds actually paid to the executive under any disability insurance policies maintained by us if the termination is due to the executive’s disability, |
| • | after the conclusion of our fiscal year in which the termination occurs, we will make a lump sum cash payment in an amount equal to the executive’s accrued bonus for the prior fiscal year, |
| • | after the conclusion of our first full fiscal year immediately following the conclusion of our fiscal year in which the termination occurs, we will pay the executive (except for Mr. Vitarelli) a lump sum cash payment, which we refer to as the Termination Bonus I, as calculated under the applicable employment agreement, and |
| • | after the conclusion of our second full fiscal year immediately following the conclusion of our fiscal year in which the termination occurs, we will pay the executive (except for Mr. Vitarelli) a lump sum cash payment, which we refer to as the Termination Bonus II, as calculated under the applicable employment agreement. |
- 135 -
Table of Contents
The payment of the above 24 months base salary, Termination Bonus I and Termination Bonus II is conditioned upon the executive’s release of claims against us.
If the executive terminates employment with us at the end of his initial employment period or renewal period by giving three-month notice, but the executive will not have attained the age of 65 years (or 68 years in the case of Mr. Chlapaty) on the employment termination date, then after the conclusion of the fiscal year in which the termination occurs, we will pay to the executive a lump sum cash payment in an amount equal to the accrued bonus for this fiscal year.
The employment agreements also provide that, notwithstanding anything to the contrary in any equity incentive plan or related agreements, if the executive’s employment is terminated by us for any reason other than for cause, all unvested restricted shares under the 2008 Plan and all unvested options under the 2000 Plan (or only the restricted shares under the 2008 Plan in the case of Mr. Chlapaty) awarded to the executive will fully vest at the employment termination date. Such vested options will be exercisable during the 90 consecutive day period immediately following the employment termination date.
Our stock option agreements with each NEO under the 2000 Plan and the 2013 Plan provide that (i) upon death or disability of the executive, all the options may be exercised during the one-year period commencing on the date of the executive’s death or disability and (ii) upon termination of employment of the executive for any reason other than for death, disability or for cause, all the options may be exercised during the three-month period commencing on the employment termination date.
Change in Control. Under the 2000 Plan, our stock option agreements with the executives provide that all the options may be exercised by the executives commencing at the time of a “change in control.” A “change in control” for this purpose refers to: (i) our entry into an agreement to merge, consolidate or reorganize into or with another corporation or other legal person, and as a result less than 51% of the combined voting power of the then-outstanding securities of such corporation or person immediately after such transaction will be held in the aggregate by officers, directors and holders of a beneficial interest in our voting securities immediately prior to such transaction; (ii) our entry into an agreement to sell or otherwise transfer all or substantially all of its assets to any other corporation or other legal person, and as a result a beneficial interest in less than 51% of the combined voting power of the then-outstanding securities of such corporation or person immediately after such sale or transfer is held in the aggregate by officers, directors and holders of a beneficial interest in our voting securities immediately prior to such sale or transfer; or (iii) during any continuous 12-month period our stockholders’ sale of or entry into an agreement or agreements to sell to anyone other than us our securities representing 50% or more of our combined voting power at the beginning of such 12-month period.
Under the 2008 Plan, our restricted stock agreements with the executives provide that the restricted shares will vest effective at the time of a “change in control.” A “change in control” for this purpose refers to the occurrence of a transaction or series of transactions following which less than a majority of the voting power of us a successor entity is held by the persons who hold the same with respect to us immediately prior to such transaction or series of transactions.
Under the 2013 Plan, our stock option agreements with the executives provide that all the options may be exercised by the executives commencing at the time of a “change in control.” A “change in control” for this purpose refers to the occurrence of a transaction or series of transactions following which less than a majority of the voting power of us a successor entity is held by the persons who hold the same with respect to us immediately prior to such transaction or series of transactions.
- 136 -
Table of Contents
Potential Payment. The following table describes the potential payments and benefits that each NEO who was serving as an NEO as of March 31, 2014 would have received if the NEO’s employment had terminated as of March 31, 2014 under the circumstances set forth below, assuming in the case of each NEO that the amended and restated employment agreement for each NEO to be entered into prior to the commencement of this offering was in effect as of March 31, 2014. The actual amounts to be paid can only be determined at the time of such NEO’s separation from us and could therefore be more or less than the amounts set forth below.
| Name |
Severance Payment ($) |
Bonus Payment ($) |
Value of Accelerated Equity ($) |
Total ($) | ||||
| Joseph A. Chlapaty |
||||||||
| Termination under Specified Circumstances |
||||||||
| Other Terminations |
||||||||
| Change in Control |
||||||||
| Mark B. Sturgeon |
||||||||
| Termination under Specified Circumstances |
||||||||
| Other Terminations |
||||||||
| Change in Control |
||||||||
| Thomas M. Fussner |
||||||||
| Termination under Specified Circumstances |
||||||||
| Other Terminations |
||||||||
| Change in Control |
||||||||
| Ronald R. Vitarelli |
||||||||
| Termination under Specified Circumstances |
||||||||
| Other Terminations |
||||||||
| Change in Control |
||||||||
| Robert M. Klein |
||||||||
| Termination under Specified Circumstances |
||||||||
| Other Terminations |
||||||||
| Change in Control |
||||||||
- 137 -
Table of Contents
Equity-Based Incentive Plans
2000 Incentive Stock Option Plan
Options granted pursuant to the 2000 Plan constitute incentive stock options for the federal income tax purposes. Any option granted pursuant to the 2000 Plan must be granted within 10 years from the effective date of its adoption. As of September 2008, further grants under the 2000 Plan were discontinued, although existing stock option grants continue to vest and grant recipients may continue to receive reload options under the 2000 Plan as described below.
Shares Under the Plan. The maximum aggregate number of shares available to be issued under the 2000 Plan is 1,000,000, subject to adjustment in the event of changes in our capitalization. As of December 31, 2013, options to purchase 253,863 shares of our common stock were still outstanding and 249,686 shares of our common stock were available for future grant under the 2000 Plan. The maximum aggregate fair market value (determined as of the time the option is granted) of all stock with respect to which incentive stock options may be exercisable by an optionee for the first time in any calendar year under the 2000 Plan and any of our other incentive stock option plans cannot exceed $100,000. Shares issued under the 2000 Plan may be authorized and unissued shares or shares held by us in our treasury.
Terms and Conditions of Options. Each option will be evidenced by a written option agreement in such form as approved by our board of directors. The option agreement may contain conditions for grant of options (such as an employee’s entry into an employment agreement with us or such employee’s agreement on continued employment with us) and adjustment of the underlying shares upon changes in our capitalization. The option agreement shall set forth the number of underlying shares, option price no less than 100% of the fair market value of the underlying share as of the date of grant, period of exercise no longer than 10 years after the date of grant, and dates and conditions for exercise of the option. The option price may be paid in cash, shares of our common stock, a combination of cash and shares or such other consideration as determined by our board. If an optionee exercises an option and pays some or all of the option price with shares of our common stock, such optionee shall be granted a reload option to purchase the number of shares equal to the number of shares used as payment of the option price, subject to adjustment made pursuant to the limitations on the number of shares available for grant under the 2000 Plan. Pursuant to the terms of each incentive stock option award agreement, the vesting for all option awards shall accelerate and become fully vested upon completion of this offering.
Reload Options. In the event that an option holder exercises an option and pays some or all of the option price with shares of common stock, such option holder will receive a reload option to purchase the same number of shares as used to pay the exercise price, with the grant date for any reload option being the next date during the month of July during which our board of directors holds a meeting or, if no such meeting is held, the next date thereafter on which our board of directors holds a meeting. Such reload options shall have the same terms and conditions associated with grants under the 2000 Plan, including applicable vesting requirements. The exercise price for any new reload option shall equal to the then current fair market value for common stock. Given the discontinuation of the 2000 Plan, the only additional options that are issued under the 2000 Plan are those associated with reload options.
2008 Restricted Stock Plan
The purpose of the 2008 Plan is to afford an incentive to, and encourage stock ownership by, our key employees so that such employees may acquire or increase their proprietary interest in our success and be encouraged to remain in our employ. Awards under the 2008 Plan must be made before September 15, 2018.
- 138 -
Table of Contents
Administration. Our board of directors supervises the administration of the 2008 Plan. Subject to the provisions of the 2008 Plan, the board has conclusive authority to construe the 2008 Plan and any restricted stock agreement entered thereunder, and to establish and amend the administrative policies for the administration of the 2008 Plan.
Eligibility. Any of our or our subsidiaries’ directors or employees is eligible to participate in the 2008 Plan.
Shares Available. The maximum aggregate number of shares available to be issued under the 2008 Plan is 215,000, subject to adjustment in the event of changes in our capitalization. Such shares must be made available solely from our treasury shares. As of December 31, 2013, 68,830 restricted shares of our common stock were available for future grant under the 2008 Plan.
Participation. Our board of directors will select participants and determine the terms of the awards under the 2008 Plan, which will set forth in a restricted stock agreement.
Terms of Awards. The awards of restricted stock will be subject to the terms and restrictions as determined by our board of directors, which may also modify, or accelerate the termination of, such restrictions. During the period in which any shares are subject to restrictions, the board may grant to the recipient of the award all or any of the rights of a shareholder with respect to such shares, including the right to vote and to receive dividends. The 2008 Plan authorizes our board of directors (i) to grant awards to any participant calculated as a percentage of such participant’s base pay and (ii) to determine the amount of such award based on achievement of a target. In addition, the board may choose, at the time of the grant of an award, to include as part of such award an entitlement to receive dividends or dividend equivalents, subject to such terms and restrictions as the board may establish. The grant of awards is contingent upon the participant’s execution of an executive responsibility agreement, or such other non-competition, non-solicitation and/or nondisclosure agreement as we may require.
Amendment. We may, by action of our board of directors, amend or terminate the 2008 Plan at any time, or, by action of the board with the consent of the anticipant, to amend or terminate any outstanding award of restricted stock.
2013 Stock Option Plan
The purpose of the 2013 Plan is to afford an incentive to, and encourage stock ownership by, our officers and other key employees so that such employees may acquire or increase their proprietary interest in our success and be encouraged to remain in our employ. Options granted pursuant to the 2013 Plan will not constitute incentive stock options for the federal income tax purposes unless expressly designated by our board of directors. Any option granted pursuant to the 2013 Plan must be granted within 10 years from the effective date of its adoption.
Shares Under the Plan. The maximum aggregate number of shares available to be issued under the 2013 Plan is 500,000, subject to adjustment in the event of changes in our capitalization. As of December 31, 2013, options to purchase 416,000 shares of our common stock were still outstanding and 84,000 shares of our common stock were available for future grant under the 2013 Plan. The maximum aggregate fair market value (determined as of the time the option is granted) of all stock with respect to which incentive stock options may be exercisable by an optionee for the first time in any calendar year under the 2013 Plan and any of our other incentive stock option plans cannot exceed $100,000. Shares issued under the 2013 Plan may be authorized and unissued shares or shares held by us in our treasury.
Administration. Our board of directors administers the 2013 Plan. Subject to the provisions of the 2013 Plan, the board has the discretion to determine the employees to be granted options and the number of shares subject to each option (except that options granted to members of the board are subject to the approval of a majority of the our disinterested directors), the time to grant options, the option price, the time and duration to exercise the
- 139 -
Table of Contents
options. Subject to the terms of the 2013 Plan, the board also has the discretion to specify additional conditions to the grant and exercise of any option as well as interpret the provisions of, and any option granted under, the 2013 Plan.
Eligible Employees. Options will be granted to our officers and other key employees as our board of directors select from time to time. However, for any incentive stock options, (i) no employee can be granted an option if such employee owns stock possessing more than 10% of the total combined voting power of all classes of stock of ours or of any of our subsidiaries unless the option price is at least 110% of the fair market value of the underlying shares and such option is not exercisable after the expiration of five years from the date such option is granted, and (ii) such employees must execute a non-competition and non-disclosure agreement in order to receive grant of the options.
Terms and Conditions of Options. Each option will be evidenced by a written option agreement in such form as approved by our board of directors. The option agreement may contain conditions for grant of options (such as an employee’s entry into an employment agreement with us or such employee’s agreement on continued employment with us) and adjustment of the underlying shares upon changes in our capitalization. The option agreement shall set forth the number of underlying shares, option price no less than 100% of the fair market value of the underlying share as of the date of grant, period of exercise no longer than 10 years after the date of grant, and dates and conditions for exercise of the option. The option price may be paid in cash, shares of our common stock, a combination of cash and shares or such other consideration as determined by our board. If an optionee exercises an option and pays some or all of the option price with shares of our common stock, such optionee shall be granted a reload option to purchase the number of shares equal to the number of shares used as payment of the option price, subject to adjustment made pursuant to the limitations on the number of shares available for grant under the 2013 Plan. Option awards under the 2013 Plan shall not fully vest or further accelerate upon completion of this offering.
Amendment. Our board of directors may, with respect to any shares of our common stock not subject to options at such time, discontinue or amend the 2013 Plan in any respect as it deems advisable. However, without the approval of our shareholders, the board cannot increase the aggregate number of shares subject to the 2013 Plan, change the eligibility of employees for participation in the 2013 Plan, issue options with an option price of less than 100% of the fair market value of the shares, or make other amendments which will cause options issued to fail to qualify as incentive stock options for the federal income tax purposes.
Reload Options. In the event that an option holder exercises an option and pays some or all of the option price with shares of common stock, such option holder will receive a reload option to purchase the same number of shares as used to pay the exercise price, with the grant date for any reload option being the next date during the month of July during which our board of directors holds a meeting or, if no such meeting is held, the next date thereafter on which our board of directors holds a meeting. Such reload options shall have the same terms and conditions associated with grants under the 2000 Plan, including applicable vesting requirements. The exercise price for any new reload option shall equal to the then current fair market value for common stock.
Employee Stock Ownership Plan
We sponsor a tax-qualified employee stock ownership plan and trust, or ESOP, that covers our employees who meet certain service requirements, including all of our NEOs except for Mr. Chlapaty, who does not participate in the ESOP. The ESOP was established effective April 1, 1993, and was originally funded with a 30-year term loan from us as well as shares of our convertible preferred stock through a transfer of assets from our profit sharing retirement plan. The loan is secured by a pledge of unallocated convertible preferred stock purchased by the ESOP with such loan proceeds that has not yet been released from the pledge (as a result of ESOP payments on the loan) and allocated to ESOP accounts. The ESOP operates as a leveraged ESOP and was designed to enable eligible employees to acquire stock ownership interests in us by virtue of their accounts under the ESOP. See “Description of Employee Stock Ownership Plan” for a description of the ESOP.
- 140 -
Table of Contents
PRINCIPAL AND SELLING STOCKHOLDERS
The following table sets forth information as of , 2014 with respect to the beneficial ownership of our common stock by:
| • | each person known to own beneficially more than 5% of our common stock; |
| • | each of the named executive officers; |
| • | each director; |
| • | all directors and executive officers as a group; and |
| • | the selling stockholder. |
The amounts and percentages of shares beneficially owned are reported on the basis of SEC regulations governing the determination of beneficial ownership of securities. Under SEC rules, a person is deemed to be a “beneficial owner” of a security if that person has or shares voting power or investment power, which includes the power to dispose of or to direct the disposition of such security. A person is also deemed to be a beneficial owner of any securities of which that person has a right to acquire beneficial ownership within 60 days of the determination date, which in the case of the following table is , 2014. Securities that can be so acquired are deemed to be outstanding for purposes of computing such person’s ownership percentage, but not for purposes of computing any other person’s percentage. Under these rules, more than one person may be deemed to be a beneficial owner of the same securities and a person may be deemed to be a beneficial owner of securities as to which such person has no economic interest.
The percentage of beneficial ownership prior to this offering is based on shares of our common stock outstanding as of , 2014, as adjusted to reflect a -for- stock split to be effected immediately prior to the effectiveness of the registration statement of which this prospectus forms a part. The percentage of beneficial ownership following this offering is based on shares of common stock outstanding (assuming no exercise of the overallotment option) or shares of common stock outstanding (assuming full exercise of the overallotment option), in each case after giving effect to the -for- stock split to be effected immediately prior to the effectiveness of the registration statement of which this prospectus forms a part.
- 141 -
Table of Contents
Except as otherwise indicated in the footnotes to this table, each of the beneficial owners listed has, to our knowledge, sole voting and investment power with respect to the indicated shares of common stock. Unless otherwise indicated, the address for each individual listed below is c/o Advanced Drainage Systems, Inc., 4640 Trueman Boulevard, Hilliard, Ohio 43026.
| Shares Beneficially Owned Before this Offering |
Number of Shares Being Offered |
Shares Beneficially Owned After this Offering |
Shares Beneficially Owned After this Offering Assuming Full Exercise of Overallotment Option | |||||||||||
| Name of Beneficial Owner |
Number of Shares |
Percentage of Shares |
Number of Shares |
Percentage of Shares |
Number of Shares |
Percentage of Shares | ||||||||
| Greater than 5% Stockholders |
||||||||||||||
| ASP ADS Investco, LLC (1) |
||||||||||||||
| ESOP (2) |
||||||||||||||
| University of Notre Dame (3) |
||||||||||||||
| Joseph A. Chlapaty (4) |
||||||||||||||
| Directors and Named Executive Officers (not listed above): |
||||||||||||||
| Mark B. Sturgeon (5) |
||||||||||||||
| Thomas M. Fussner (6) |
||||||||||||||
| Ronald R. Vitarelli (7) |
||||||||||||||
| Robert M. Klein (8) |
||||||||||||||
| Robert M. Eversole |
||||||||||||||
| Alexander R. Fischer |
||||||||||||||
| Tanya Fratto |
||||||||||||||
| M.A. (Mark) Haney |
||||||||||||||
| David L. Horing (9) |
||||||||||||||
| C. Robert Kidder |
||||||||||||||
| Mark A. Lovett (10) |
||||||||||||||
| Richard A. Rosenthal |
||||||||||||||
| Abigail S. Wexner |
||||||||||||||
| Scott M. Wolff (11) |
||||||||||||||
| All current directors and executive officers as a group (15 persons) |
||||||||||||||
| * | Less than 1% |
| (1) | Represents shares held by ASP ADS Investco, LLC, a Delaware limited liability company. American Securities Partners V, L.P., American Securities Partners V(B), L.P. and American Securities Partners V(C), L.P., collectively referred to as the ASP Sponsors, are owners of more than 99% of the membership interests in ASP ADS Investco, LLC. American Securities Associates V, LLC is the general partner of each ASP Sponsor. American Securities LLC provides investment advisory services to each ASP Sponsor and to American Securities Associates V, LLC, and as such may be deemed to have indirect beneficial ownership of the shares held by ASP ADS Investco, LLC. The address for ASP ADS Investco, LLC is c/o American Securities LLC, 299 Park Avenue, 34th Floor, New York, NY 10171. As referenced in footnotes (9), (10) and (11) below, each of Messrs. Horing, Lovett and Wolff may be deemed to have shared voting and investment power over the shares held by ASP ADS Investco, LLC. Such individuals disclaim beneficial ownership of the shares of common stock held by ASP ADS Investco, LLC, except to the extent of their pecuniary interests therein. |
| (2) | Consists of shares of common stock issuable upon the exercise of conversion option for all the 5,562,020 shares of 2.50% Cumulative Convertible Voting Preferred Stock held by the ESOP at a ratio of 1-to-0.7692. See “Description of Employee Stock Ownership Plan.” |
| (3) | The address of the University of Notre Dame is University of Notre Dame, Investment office, Eddy Street Commons at Notre Dame, 1251 N. Eddy St., Suite 400, South Bend, IN 46617-1403. |
| (4) | Includes, with respect to Joseph A. Chlapaty, shares of common stock directly owned by Mr. Chlapaty, restricted shares of common stock owned by Mr. Chlapaty as to which Mr. Chlapaty has sole voting power, shares of common stock owned of record by the Joseph A. Chlapaty Trust, as to which Mr. Chlapaty and Fifth Third Bank, as trustees, have shared voting and investment power, and shares of common stock issuable upon the exercise of vested stock options (or vesting within 60 days of , 2014), but excludes shares of common stock directly owned by Mr. Chlapaty’s children and shares of |
- 142 -
Table of Contents
| common stock beneficially owned by Mr. Chlapaty’s children through irrevocable trusts of which Mr. Chlapaty is not a trustee. Mr. Chlapaty disclaims beneficial ownership of the above excluded shares except to the extent of any pecuniary interest (as defined in Rule 16a–1(a)(2) promulgated under the Exchange Act) that he may have as such excluded shares. |
| (5) | Includes, with respect to Mark B. Sturgeon, shares of common stock directly owned by Mr. Sturgeon, restricted shares of common stock owned by Mr. Sturgeon as to which Mr. Sturgeon has sole voting power, and shares of common stock issuable upon the exercise of vested stock options (or vesting within 60 days of , 2014). |
| (6) | Includes, with respect to Thomas M. Fussner, shares of common stock directly owned by Mr. Fussner, restricted shares of common stock owned by Mr. Fussner as to which Mr. Fussner has sole voting power, and shares of common stock issuable upon the exercise of vested stock options (or vesting within 60 days of , 2014). |
| (7) | Includes, with respect to Ronald R. Vitarelli, shares of common stock directly owned by Mr. Vitarelli, restricted shares of common stock owned by Mr. Vitarelli as to which Mr. Vitarelli has sole voting power, and shares of common stock issuable upon the exercise of vested stock options (or vesting within 60 days of , 2014). |
| (8) | Includes, with respect to Robert M. Klein, shares of common stock directly owned by Mr. Klein, restricted shares of common stock owned by Mr. Klein as to which Mr. Klein has sole voting power, and shares of common stock issuable upon the exercise of vested stock options (or vesting within 60 days of , 2014). |
| (9) | Mr. Horing may be deemed to have shared voting and investment power of the shares held by ASP ADS Investco LLC in his capacity as a Managing Director of American Securities and as a managing member of certain funds managed by American Securities as referenced in footnote (1) above. Mr. Horing disclaims beneficial ownership of the shares of common stock owned by ASP ADS Investco, LLC, except to the extent of his pecuniary interest therein, as such shares are owned and held by the ASP Sponsors referenced in footnote (1) above. |
| (10) | Mr. Lovett may be deemed to have shared voting and investment power of the shares held by ASP ADS Investco LLC in his capacity as a Vice President of American Securities, and serves on our board of directors as a representative of ASP ADS Investco, LLC. Mr. Lovett disclaims beneficial ownership of the shares of common stock owned by ASP ADS Investco, LLC, except to the extent of his pecuniary interest therein, as such shares are owned and held by the ASP Sponsors referenced in footnote (1) above. |
| (11) | Mr. Wolff may be deemed to have shared voting and investment power of the shares held by ASP ADS Investco LLC in his capacity as a Managing Director of American Securities, and serves on our board of directors as a representative of ASP ADS Investco, LLC. Mr. Wolff disclaims beneficial ownership of the shares of common stock owned by ASP ADS Investco, LLC, except to the extent of his pecuniary interest therein, as such shares are owned and held by the ASP Sponsors referenced in footnote (1) above. |
The following table sets forth information as of , 2014 with respect to the beneficial ownership of our convertible preferred stock, all of which is owned by the ESOP. None of our current directors or executive officers owns any of the outstanding shares of our convertible preferred stock.
| Title of class |
Name and address of beneficial owner |
Amount and nature of beneficial ownership |
Percent of class |
|||||||
| 2.50% Cumulative Convertible Voting Preferred Stock |
ADS Employee Stock Ownership Plan c/o Advanced Drainage Systems, Inc., 4640 Trueman Boulevard, Hilliard, Ohio 43026 |
5,562,020 | 100 | % | ||||||
- 143 -
Table of Contents
CERTAIN RELATIONSHIPS AND RELATED-PARTY TRANSACTIONS
Stockholders’ agreement and stockholder arrangements
In connection with the investment in our common stock by ASP ADS Investco, LLC, an affiliate of American Securities, in 2010, certain of our stockholders, including ASP ADS Investco, LLC, entered into an amended and restated stockholders’ agreement which amended and restated the original stockholders’ agreement established in June of 1988 by certain stockholders and previous equity sponsors. The stockholders’ agreement provides, among other things, that ASP ADS Investco, LLC is currently entitled to elect (or cause to be elected) four out of ten of our directors. The stockholders’ agreement will be terminated contingent upon, and effective at the time of, consummation of this offering and it will be replaced by a registration rights agreement with certain of our stockholders, including ASP ADS Investco, LLC.
Registration Rights Agreement
Contingent upon, and effective at the time of, consummation of this offering, we will be a party to a registration rights agreement, or the Registration Rights Agreement, with certain of our stockholders, including ASP ADS Investco, LLC. The Registration Rights Agreement will grant to certain of our stockholders, including ASP ADS Investco, LLC, the right to cause us, generally at our own expense, to use our reasonable best efforts to register certain of our securities held by ASP ADS Investco, LLC for public resale, subject to certain limitations. In the event we register any of our common stock following our initial public offering, certain of our stockholders, including ASP ADS Investco, LLC, will also have the right to require us to use our reasonable best efforts to include in such registration statement shares of our common stock held by them, subject to certain limitations, including as determined by the underwriters. The Registration Rights Agreement will also provide for us to indemnify certain of our stockholders and their affiliates in connection with the registration of our common stock.
Indemnification agreements
We have entered into indemnification agreements with our directors and senior officers. The indemnification agreements will provide the directors and senior officers with contractual rights to the indemnification and expense advancement rights provided under our amended and restated bylaws, as well as contractual rights to additional indemnification as provided in the indemnification agreements. See “Description of Capital Stock — Limitations on Liability and Indemnification.”
Transactions with Other Related Parties
In connection with our business, we procure services from thousands of suppliers, some of which may be affiliated with American Securities. We estimate that we purchased services from a consulting firm deriving a meaningful percentage of its business from its work for American Securities and its affiliates for approximately $44,000 for the nine months ended December 31, 2012 and $13,000 for the nine months ended December 31, 2013. Management believes such services were purchased on an arm’s length basis at prices that an unrelated third party would pay.
Policies and procedures for related party transactions
Our board of directors will adopt a written related person transaction policy to be effective upon completion of this offering to set forth the policies and procedures for the review and approval or ratification of related person transactions. This policy will cover, with certain exceptions set forth in Item 404 of Regulation S-K under the Securities Act, any transaction, arrangement, or relationship, or any series of similar transactions, arrangements, or relationships in which we were or are to be a participant, the amount involved exceeds $120,000, and a related person had or will have a direct or indirect material interest, including, without limitation, purchases of goods or services by or from the related person or entities in which the related person has a material interest, indebtedness, guarantees of indebtedness, and employment by us of a related person. We anticipate that our full board of directors will review related party transactions.
- 144 -
Table of Contents
DESCRIPTION OF EMPLOYEE STOCK OWNERSHIP PLAN
We sponsor a tax-qualified employee stock ownership plan, or ESOP, that covers our employees who meet certain service requirements. The ESOP was established effective April 1, 1993, and was originally funded with a 30-year term loan from us as well as shares of our convertible preferred stock through a transfer of assets from our profit sharing retirement plan. The loan is secured by a pledge of unallocated convertible preferred stock, purchased by the ESOP in 1993 with loan proceeds, that has not yet been released from the pledge and allocated to ESOP accounts. The ESOP operates as a leveraged ESOP and was designed to enable eligible employees to acquire stock ownership interests in their accounts under the ESOP.
We make annual contributions to the ESOP, which, when aggregated with the ESOP’s dividends and investment earnings, equal at least the amount necessary to enable the ESOP to make its regularly scheduled payments of principal and interest due on its term loan to us. As the ESOP makes annual payments of principal and interest on the term loan to us,
| • | Convertible preferred stock is released from the ESOP’s unallocated loan suspense account and allocated to eligible employees’ ESOP accounts in accordance with the ESOP’s plan terms and applicable regulations under the U.S. Internal Revenue Code of 1986, as amended, or the Code; and |
| • | We recognize a non-cash compensation expense equal to the fair value of the allocated shares determined by the ESOP’s independent appraiser. A portion of the expense is allocated to cost of goods sold and a portion is allocated to selling and administrative expense, based on the number of shares allocated to the accounts of manufacturing employees and other employees. Subject to limitations under the Code, annual allocations are made among participants in the ratio that the compensation of each participant in the year bears to the total compensation of all participants. |
Required dividends on allocated shares are paid in cash (i.e., passed through) to the participants, and required dividends on unallocated shares in the ESOP’s loan suspense account are paid in cash to, and retained by, the ESOP and allocated among the participants’ ESOP cash accounts (unless, in the ESOP committee’s discretion, such dividends are used to service the ESOP’s debt on the term loan. Pursuant to the direction of the ESOP committee, the January 15, 2014 special dividend on the ESOP’s allocated shares was paid in cash (i.e., passed through) to participants, and the special dividend on the ESOP’s unallocated shares was retained by the ESOP and allocated among the participants’ ESOP cash accounts.
In general, the trustee of the ESOP votes the shares of stock held by the ESOP as directed by the ESOP’s committee. However, in the event of either a corporate matter with respect to the approval or disapproval of any corporate merger or consolidation, recapitalization, reclassification, liquidation, dissolution, sale of substantially all of the assets of a trade or business or with respect to any tender or exchange offer, or a request or invitation for tenders or exchanges, each participant in the ESOP may direct the trustee of the ESOP on how to vote the shares of stock allocated to the participant’s ESOP accounts; and the trustee must vote any unallocated stock and allocated stock for which no participant instructions were received in the same proportion as the allocated stock for which participants’ voting instructions have been received is voted.
Upon distributions from the ESOP resulting from retirement, disability, death or vested terminations, a participant or designated beneficiary may elect to receive the vested amount credited to his or her ESOP account in the form of cash or our common stock, with any fractional shares paid in cash. We have been obligated by the Code and the terms of the ESOP to repurchase shares of common stock received by participants or designated beneficiaries in the event they exercise their put option rights relating to such shares. Such put option rights will terminate upon completion of this offering and the creation of a public market for our common stock. For fiscal years 2012, 2013 and 2014, we had repurchase obligations with respect to 87,829, 59,318 and 82,406 shares of convertible preferred stock, respectively, with common stock equivalents of 67,558, 45,627 and 63,387 shares, respectively.
- 145 -
Table of Contents
Participants in the ESOP who attain age 50 and have seven years of participation in the ESOP may elect to diversify between 25% and 50% of the shares of convertible preferred stock allocated to their ESOP accounts while still employed by us. Although we have had a financial obligation to liquidate such diversified shares, upon completion of this offering such diversified shares of convertible preferred stock will be convertible by the ESOP trustee into shares of our common stock and sold, thereby eliminating our financial obligations with respect to diversification. For fiscal years 2012, 2013 and 2014, the diversified shares of convertible preferred stock were 2,670, 6,077 and 5,968 shares, respectively, with common stock equivalents of 2,053, 4,675 and 4,590 shares, respectively.
Upon completion of the offering made by this prospectus, we will continue to make annual contributions to the ESOP as described above and recognize non-cash compensation expenses each year. We disregard the ESOP compensation expense in calculating Adjusted EBITDA, because it is a non-cash charge. The ESOP compensation expense is recognized each year when shares are allocated to participants’ accounts, but it is not ongoing share-based compensation. We believe our employees receive competitive compensation excluding the shares allocated to them under the ESOP.
- 146 -
Table of Contents
General
Upon the closing of this offering, our authorized capital stock will consist of shares of common stock, par value $0.01 per share, shares of undesignated preferred stock, par value $0.01 per share and shares of 2.50% Cumulative Convertible Voting Preferred Stock, par value $0.01 per share, or convertible preferred stock, which funds our ESOP as described above under “Description of Employee Stock Ownership Plan.” Upon the closing of this offering there will be shares of our common stock issued and outstanding not including shares of our common stock issuable upon exercise of outstanding stock options and shares of common stock reserved for issuance upon conversion of our convertible preferred stock.
In connection with this offering, we will amend and restate our certificate of incorporation and bylaws. The following descriptions of our capital stock, amended and restated certificate of incorporation and amended and restated bylaws are intended as summaries only and are qualified in their entirety by reference to our amended and restated certificate of incorporation and amended and restated bylaws, which will become effective upon the completion of this offering and which are filed as exhibits to the registration statement, of which this prospectus forms a part, and to the applicable provisions of the Delaware General Corporation Law.
Common Stock
Holders of common stock will be entitled:
| • | to cast one vote for each share held of record on all matters submitted to a vote of the stockholders; |
| • | to receive, on a pro rata basis, dividends and distributions, if any, that our board of directors may declare out of legally available funds, subject to preferences that may be applicable to preferred stock, if any, then outstanding; and |
| • | upon our liquidation, dissolution or winding up, to share equally and ratably in any assets remaining after the payment of all debt and other liabilities, subject to the prior rights, if any, of holders of any outstanding shares of preferred stock. |
Any dividends declared on the common stock will not be cumulative. Our ability to pay dividends on our common stock is subject to the restrictions set forth in the Credit Facilities. See “Dividend Policy.”
The holders of our common stock will not have any preemptive, cumulative voting, subscription, conversion, redemption or sinking fund rights. The common stock will not be subject to future calls or assessments by us. The rights and privileges of holders of our common stock are subject to any series of preferred stock that we may issue in the future, as described below.
Before the date of this prospectus, there has been no public market for our common stock.
As of March 31, 2014, we had shares of common stock outstanding and holders of record of our common stock.
Preferred Stock
General
Upon completion of this offering, under our amended and restated certificate of incorporation, our board of directors will have the authority, without further action by our stockholders, except as described below, to issue up to shares of preferred stock in one or more series and to fix the voting powers, designations, preferences and the relative participating, optional or other special rights and the qualifications, limitations and restrictions of each series, including dividend rights, conversion rights, voting rights, terms of redemption,
- 147 -
Table of Contents
liquidation preferences and the number of shares constituting any series. Upon completion of the offering, no shares of our authorized preferred stock will be outstanding except for our convertible preferred stock. Because our board of directors will have the power to establish the preferences and rights of the shares of any additional series of preferred stock, it may afford holders of any preferred stock preferences, powers and rights, including voting and dividend rights, senior to the rights of holders of the common stock, which could adversely affect the holders of the common stock and could delay, discourage or prevent a takeover of us even if a change of control of us would be beneficial to the interests of our stockholders.
Convertible Preferred Stock
In connection with the establishment of our ESOP in 1993, we sold 469,200 shares of convertible preferred stock to the ESOP for approximately $34.5 million, which shares were subsequently adjusted pursuant to a 20-for-1 stock split in 2006. In establishing the ESOP, $5.0 million was transferred from our tax-qualified profit sharing retirement plan to the ESOP, which the ESOP used to purchase $5.0 million of our convertible preferred stock. We extended a term loan to the ESOP for approximately $29.5 million to purchase the balance of the convertible preferred stock, which term loan is secured by a pledge of the convertible preferred stock purchased by the ESOP with such loan proceeds.
We are obligated to make payments to the ESOP in order for the ESOP to make annual payments of principal and interest due under the term loan and to fund diversification elections of participants who are eligible to diversify shares of convertible preferred stock allocated to their ESOP accounts. As payments on the term loan are made, shares of convertible preferred stock are released from the ESOP’s unallocated loan suspense account and allocated to eligible employees’ accounts. All shares of convertible preferred stock not so released and allocated continue to be unallocated under the ESOP.
The shares of convertible preferred stock will be held in the name of the ESOP trustee until redemption or conversion. In the event of any transfer of shares of the convertible preferred stock to any person other than the ESOP trustee, the shares so transferred, upon such transfer, will be automatically converted into shares of Common Stock.
Each share of convertible preferred stock (after effecting the -for- stock split to be effected immediately prior to the effectiveness of the registration statement of which this prospectus forms a part) has an applicable value of $ ; bears an annual cumulative dividend of 2.5% or $ per share; is convertible into 0.7692 shares of Common Stock, subject to adjustment in certain circumstances; has a liquidation preference of $ , plus any accrued and unpaid dividends; and generally votes together as a single class with the Common Stock on matters upon which the Common Stock is entitled to vote except as otherwise required by the laws of the State of Delaware. If full cumulative dividends on the convertible preferred stock have not been declared and paid or set apart for payment when due, we (i) may pay only ratable dividends (in proportion to the full amounts to which holders of convertible preferred stock would otherwise be entitled) on the convertible preferred stock and (ii) may not pay dividends, or make any other distribution, repurchases, redemption or retirements on the Common Stock or any other class of stock ranking junior to the convertible preferred stock.
In addition to the cumulative dividends payable with respect to the outstanding shares of convertible preferred stock, if dividends are declared by our board of directors on Common Stock, the holders of convertible preferred stock are entitled to receive dividends in such amount as they would be entitled to receive if their shares of convertible preferred stock had been converted into shares of Common Stock on the applicable record date.
The shares of convertible preferred stock are not redeemable at our option. At the option of the holder, who is the trustee of the ESOP, at any time and from time to time, we must redeem the shares of convertible preferred stock for cash at a redemption price equal to the greater of (i) the fair market value of the convertible preferred stock or (ii) $ per share (subject to appropriate adjustment in the event of any stock dividend, stock split, combination or other similar recapitalization affecting such shares), plus accumulated and unpaid dividends to
- 148 -
Table of Contents
the date fixed for redemption, upon notice to us given not less than five business days prior to the date fixed by the holder in such notice for such redemption, upon certification by such holder to us when and to the extent necessary for such holder to provide for distributions required to be made to participants under our ESOP, or any successor plan.
In general, the trustee of the ESOP votes the shares of stock held by the ESOP as directed by the ESOP’s committee. However, in the event of either a corporate matter with respect to the approval or disapproval of any corporate merger or consolidation, recapitalization, reclassification, liquidation, dissolution, sale of substantially all of the assets of a trade or business or with respect to any tender or exchange offer, or a request or invitation for tenders or exchanges, each participant in the ESOP may direct the trustee of the ESOP on how to vote the shares of stock allocated to the participant’s ESOP accounts; and the trustee must vote any unallocated stock and allocated stock for which no participant instructions were received in the same proportion as the allocated stock for which participants’ voting instructions have been received is voted.
Anti-Takeover Effects of our Certificate of Incorporation and Bylaws
The provisions of our amended and restated certificate of incorporation and amended and restated bylaws and of the Delaware General Corporation Law summarized below may have an anti-takeover effect and may delay, defer or prevent a tender offer or takeover attempt that you might consider in your best interest, including an attempt that might result in your receipt of a premium over the market price for your shares. These provisions are also designed, in part, to encourage persons seeking to acquire control of us to first negotiate with our board of directors, which could result in an improvement of their terms.
Undesignated preferred stock. As discussed above, our board of directors has the ability to issue preferred stock with voting or other rights or preferences that could impede the success of any attempt to change control of us. These and other provisions may have the effect of deterring hostile takeovers or delaying changes in control or changes to our management.
Classified board of directors. Our board of directors is divided into three classes, as nearly equal in number as possible, with members of each class serving staggered three-year terms. Our amended and restated certificate of incorporation will provide that the authorized number of directors may be changed only by resolution of our board of directors. Any additional directorships resulting from an increase in the number of directors will be distributed among the three classes so that, as nearly as possible, each class will consist of one-third of the directors. Our amended and restated certificate of incorporation will also provide that any vacancy on our board of directors, including a vacancy resulting from an enlargement of our board of directors, may be filled only by vote of a majority of our directors then in office. Our classified board of directors could have the effect of delaying or discouraging an acquisition of us or a change in our management.
Special meetings of stockholders. Our amended and restated certificate of incorporation will provide that a special meeting of stockholders may be called only by or at the direction of our board of directors pursuant to a resolution adopted by a majority of our board of directors. Stockholders will not be permitted to call a special meeting.
No stockholder action by written consent. Our amended and restated certificate of incorporation will provide that stockholder action may be taken only at an annual meeting or special meeting of stockholders and may not be taken by written consent in lieu of a meeting.
Removal of directors. Our amended and restated certificate of incorporation and amended and restated bylaws will provide that directors may be removed from office only for cause and only upon the affirmative vote of holders of at least 75% of the votes which all the stockholders would be entitled to cast.
No cumulative voting. Our amended and restated certificate of incorporation and amended and restated bylaws do not permit cumulative voting in the election of directors. Cumulative voting allows a stockholder to
- 149 -
Table of Contents
vote a portion or all of its shares for one or more candidates for seats on our board of directors. Without cumulative voting, a minority stockholder may not be able to gain as many seats on our board of directors as the stockholder would be able to gain if cumulative voting were permitted. The absence of cumulative voting makes it more difficult for a minority stockholder to gain a seat on our board of directors to influence our board’s decision regarding a takeover.
Stockholder advance notice procedure. Our amended and restated bylaws will establish an advance notice procedure for stockholders to make nominations of candidates for election as directors or to bring other business before an annual meeting of our stockholders. The amended and restated bylaws will provide that any stockholder wishing to nominate persons for election as directors at, or bring other business before, an annual meeting must deliver to our Secretary a written notice of the stockholder’s intention to do so. These provisions may have the effect of precluding the conduct of certain business at a meeting if the proper procedures are not followed. We expect that these provisions may also discourage or deter a potential acquirer from conducting a solicitation of proxies to elect the acquirer’s own slate of directors or otherwise attempting to obtain control of us. To be timely, the stockholder’s notice must be delivered to our corporate Secretary at our principal executive offices not fewer than 90 days nor more than 120 days before the first anniversary date of the annual meeting for the preceding year; provided, however, that in the event that the annual meeting is set for a date that is more than 30 days before or more than 70 days after the first anniversary date of the preceding year’s annual meeting, a stockholder’s notice must be delivered to our Secretary (x) not earlier than 120 days prior to the meeting or (y) no later than the close of business on the later of the 90th day prior to such annual meeting or the 10th day following the day on which a public announcement of the date of the such meeting is first made by us.
Super-majority vote requirement. Our amended and restated certificate of incorporation will require a super-majority stockholders vote of 75% to approve any reorganization, recapitalization, share exchange, share reclassification, consolidation, merger, conversion or sale of all or substantially all assets to which we are a party that is not approved by the affirmative vote of at least 75% of the members of our board of directors.
Amendments to certificate of incorporation and bylaws. The DGCL generally provides that the affirmative vote of a majority of the outstanding stock entitled to vote on any matter is required to amend a corporation’s certificate of incorporation or bylaws, unless either a corporation’s certificate of incorporation or bylaws require a greater percentage. Our amended and restated certificate of incorporation will provide that specified provisions of our amended and restated certificate of incorporation may not be amended, altered or repealed unless the amendment is approved by the affirmative vote of the holders of at least 75% of the outstanding shares of our common stock then entitled to vote at any annual or special meeting of stockholders, including the provisions governing the liability and indemnification of directors, the elimination of stockholder action by written consent and the prohibition on the rights of stockholders to call a special meeting.
In addition, our amended and restated certificate of incorporation and amended and restated bylaws will provide that our amended and restated bylaws may be amended, altered or repealed, or new bylaws may be adopted, by the affirmative vote of a majority of the members of our board of directors, or by the affirmative vote of the holders of at least 75% of the outstanding shares of our common stock then entitled to vote at any annual or special meeting of stockholders.
These provisions make it more difficult for any person to remove or amend any provisions in our amended and restated certificate of incorporation and amended and restated bylaws that may have an anti-takeover effect.
Section 203 of the DGCL. In our amended and restated certificate of incorporation, we will elect not to be governed by Section 203 of the DGCL, as permitted under and pursuant to subsection (b)(3) of Section 203. Section 203, with specified exceptions, prohibits a Delaware corporation from engaging in any “business combination” with any “interested stockholder” for a period of three years following the time that the stockholder became an interested stockholder unless:
| • | prior to such time, the board of directors of the corporation approved either the business combination or the transaction which resulted in the stockholder becoming an interested stockholder; |
- 150 -
Table of Contents
| • | upon consummation of the transaction which resulted in the stockholder becoming an interested stockholder, the interested stockholder owned at least 85% of the voting stock of the corporation outstanding at the time the transaction commenced, excluding for purposes of determining the voting stock outstanding, but not the outstanding voting stock owned by the interested stockholder, those shares owned (i) by persons who are directors and also officers and (ii) employee stock plans in which employee participants do not have the right to determine confidentially whether shares held subject to the plan will be tendered in a tender or exchange offer; or |
| • | at or subsequent to such time, the business combination is approved by the board of directors and authorized at an annual or special meeting of stockholders, and not by written consent, by the affirmative vote of at least two-thirds of the outstanding voting stock that is not owned by the interested stockholder. |
Section 203 defines “business combination” to include the following:
| • | any merger or consolidation of the corporation with the interested stockholder; |
| • | any sale, lease, exchange, mortgage, transfer, pledge or other disposition of 10% or more of the assets of the corporation involving the interested stockholder; |
| • | subject to specified exceptions, any transaction that results in the issuance or transfer by the corporation of any stock of the corporation to the interested stockholder; |
| • | any transaction involving the corporation that has the effect of increasing the proportionate share of the stock of any class or series of the corporation beneficially owned by the interested stockholder; or |
| • | any receipt by the interested stockholder of the benefit of any loans, advances, guarantees, pledges or other financial benefits provided by or through the corporation. |
An “interested stockholder” is any entity or person who, together with affiliates and associates, owns, or within the previous three years owned, 15% or more of the outstanding voting stock of the corporation.
Limitations on Liability and Indemnification
Our amended and restated certificate of incorporation will contain provisions permitted under Delaware General Corporation Law relating to the liability of directors. These provisions will eliminate a director’s personal liability to the fullest extent permitted by the Delaware General Corporation Law for monetary damages resulting from a breach of fiduciary duty, except in circumstances involving:
| • | any breach of the director’s duty of loyalty; |
| • | acts or omissions not in good faith or which involve intentional misconduct or a knowing violation of the law; |
| • | under Section 174 of the Delaware General Corporation Law (unlawful dividends); or |
| • | any transaction from which the director derives an improper personal benefit. |
The principal effect of the limitation on liability provision is that a stockholder will be unable to prosecute an action for monetary damages against a director unless the stockholder can demonstrate a basis for liability for which indemnification is not available under the Delaware General Corporation Law. These provisions, however, should not limit or eliminate our rights or any stockholder’s rights to seek non-monetary relief, such as an injunction or rescission, in the event of a breach of director’s fiduciary duty. These provisions will not alter a director’s liability under federal securities laws. The inclusion of this provision in our amended and restated certificate of incorporation may discourage or deter stockholders or management from bringing a lawsuit against directors for a breach of their fiduciary duties, even though such an action, if successful, might otherwise have benefited us and our stockholders.
- 151 -
Table of Contents
Our amended and restated bylaws will require us to indemnify and advance expenses to our directors and officers to the fullest extent permitted by the Delaware General Corporation Law and other applicable law, except in certain cases of a proceeding instituted by the director or officer without the approval of our board of directors. Our amended and restated bylaws will provide that we are required to indemnify our directors and officers, to the fullest extent permitted by law, for all judgments, fines, settlements, legal fees and other expenses incurred in connection with pending or threatened legal proceedings because of the director’s or officer’s positions with us or another entity that the director or officer serves at our request, subject to various conditions, and to advance funds to our directors and officers to enable them to defend against such proceedings.
We have entered into indemnification agreements with our directors and senior officers. The indemnification agreements will provide the directors and senior officers with contractual rights to the indemnification and expense advancement rights provided under our amended and restated bylaws, as well as contractual rights to additional indemnification as provided in the indemnification agreements.
Choice of Forum
Our amended and restated certificate of incorporation will provide that the Court of Chancery of the State of Delaware will be the exclusive forum for (i) any derivative action or proceeding brought on our behalf, (ii) any action asserting a claim of breach of a fiduciary duty owed to us or our stockholders by our directors, officers, employees or agents, (iii) any action asserting a claim against us arising under the Delaware General Corporation Law, the amended and restated certificate of incorporation and the amended and restated bylaws or (iv) any action asserting a claim against us that is governed by the internal affairs doctrine. It is possible that a court could rule that this provision is not applicable or is unenforceable. We may consent in writing to alternative forums. Stockholders will be deemed to have notice of and consented to this provision of our amended and restated certificate of incorporation.
Market Listing
We intend to apply to list our common stock on the NYSE under the symbol “WMS.”
Transfer Agent and Registrar
Upon the completion of this offering, the transfer agent and registrar for our common stock will be .
- 152 -
Table of Contents
SHARES OF COMMON STOCK ELIGIBLE FOR FUTURE SALE
Immediately prior to this offering, there was no public market for our common stock. Some shares of our common stock will not be available for sale for a certain period of time after this offering because they are subject to contractual and legal restrictions on resale, some of which are described below. Sales of substantial amounts of common stock in the public market after these restrictions lapse, or the perception that these sales could occur, could adversely affect the prevailing market price and our ability to raise equity capital in the future.
Sales of Restricted Securities
After this offering, shares of our common stock will be outstanding. Of these shares, all of the shares sold in this offering will be freely tradable without restriction under the Securities Act, unless purchased by our “affiliates,” as that term is defined in Rule 144 under the Securities Act. The remaining shares of our common stock that will be outstanding after this offering are “restricted securities” within the meaning of Rule 144 under the Securities Act. Restricted securities may be sold in the public market only if they are registered under the Securities Act or are sold pursuant to an exemption from registration. Subject to the lock-up agreements described below, shares held by our affiliates that are not restricted securities or that have been owned for more than one year may be sold subject to compliance with Rule 144 of the Securities Act without regard to the prescribed one-year holding period under Rule 144.
Lock-up Agreements
All of our directors and executive officers and the holders of more than % of our common stock prior to this offering have signed lock-up agreements under which they have agreed not to sell, transfer or dispose of, directly or indirectly, any shares of our common stock or any securities convertible into or exercisable or exchangeable for shares of our common stock without the prior written consent of the representatives of the underwriters for a period of 180 days, subject to certain exceptions and possible extension under certain circumstances, after the date of this prospectus. These agreements are described below under “Underwriting.”
Rule 144
In general, under Rule 144, beginning 90 days after the date of this prospectus, a person who is not our affiliate and has not been our affiliate at any time during the preceding three months will be entitled to sell any shares of our common stock that such person has beneficially owned for at least six months, including the holding period of any prior owner other than one of our affiliates, without regard to volume limitations. Sales of our common stock by any such person would be subject to the availability of current public information about us if the shares to be sold were beneficially owned by such person for less than one year.
In addition, under Rule 144, a person may sell shares of our common stock immediately upon the closing of this offering, without regard to volume limitations or the availability of public information about us, if:
| • | the person is not our affiliate and has not been our affiliate at any time during the preceding three months; and |
| • | the person has beneficially owned the shares to be sold for at least one year, including the holding period of any prior owner other than one of our affiliates. |
Beginning 90 days after the date of this prospectus, and subject to the lock up agreements described above, our affiliates who have beneficially owned shares of our common stock for at least six months, including the holding period of any prior owner other than one of our affiliates, would be entitled to sell within any three-month period a number of shares that does not exceed the greater of:
| • | 1% of the number of shares of our common stock then outstanding, which will equal approximately shares immediately after this offering; and |
- 153 -
Table of Contents
| • | the average weekly trading volume in our common stock on the NYSE during the four calendar weeks preceding the date of filing of a Notice of Proposed Sale of Securities Pursuant to Rule 144 with respect to the sale. |
Sales under Rule 144 are also subject to manner of sale provisions and notice requirements.
Rule 701
Any of our employees, officers or directors who acquired shares under a written compensatory plan or contract may be entitled to sell them in reliance on Rule 701. Rule 701 permits affiliates to sell their Rule 701 shares under Rule 144 without complying with the holding period requirements of Rule 144. Rule 701 further provides that non-affiliates may sell these shares in reliance on Rule 144 without complying with the holding period, public information, volume limitation or notice provisions of Rule 144. All holders of Rule 701 shares are required to wait until 90 days after the date of this prospectus before selling those shares. However, all shares issued under Rule 701 are subject to lock-up agreements and will only become eligible for sale when the 180-day lock-up agreements expire.
Equity Incentive Plans
Prior to completion of this offering, we had three employee share-based incentive plans, our 2000 Stock Option Plan, our 2008 Restricted Stock Plan and our 2013 Stock Option Plan. We expect to adopt one or more new plans, prior to the completion of this offering, to enable us to better align our compensation programs with those typical of companies with publicly-traded securities.
As of December 31, 2013, we had outstanding approximately 659,863 options to purchase shares of common stock, of which approximately 167,946 options to purchase shares of common stock were vested. Following this offering, we intend to file one or more registration statements on Form S-8 under the Securities Act to register all of the shares of common stock issuable upon exercise of outstanding options as well as all shares of our common stock reserved for future issuance under our equity plans. See “Executive Compensation — Equity-Based Incentive Plans” for additional information regarding these plans. Shares of our common stock issued under the S-8 registration statement will be available for sale in the public market, subject to the Rule 144 provisions applicable to affiliates, and subject to any vesting restrictions and lock-up agreements applicable to these shares.
- 154 -
Table of Contents
DESCRIPTION OF CERTAIN INDEBTEDNESS
General
Our senior funded indebtedness consists of secured Senior Loan Facilities (as defined below) and secured Senior Notes (as defined below).
Senior Loan Facilities
Our bank credit facilities consist of: (i) a secured revolving credit facility (which we refer to as the Revolving Credit Facility), providing for revolving loans and letters of credit of up to a maximum aggregate principal amount of $325.0 million and (ii) a secured term loan facility (which we refer to as the Term Loan Facility and, together with the Revolving Credit Facility, as the Senior Loan Facilities), providing for term loans, which we refer to as the Term Loans, in an aggregate original principal amount of $100.0 million. A portion of the Revolving Credit Facility is available for letters of credit ($15.0 million sublimit) and swing line loans ($20.0 million sublimit).
The Senior Loan Facilities also permit us to add one or more revolving credit facility commitments to be included in the Revolving Credit Facility, to increase the existing revolving credit facility commitments by requesting supplemental revolving credit facility commitments, to add one or more incremental term loan facilities to be included in the Term Loan Facility, or to increase the existing term loans by requesting supplemental term loan commitments. Such additional commitments to the Revolving Credit Facility or the Term Loan Facility shall not exceed $50.0 million in the aggregate.
The proceeds of the Revolving Credit Facility are primarily used to provide for our ongoing working capital and capital expenditure needs, to finance acquisitions and distributions, and for our other general corporate purposes. The proceeds of the Term Loans were primarily used for our general corporate purposes.
As of December 31, 2013, the outstanding principal drawn on the Revolving Credit Facility was $98.4 million, with $218.1 million available to be drawn under all outstanding letters of credit issued under the Revolving Credit Facility. As of December 31, 2013, the outstanding principal balance of the Term Loans was $98.8 million.
Maturity; Prepayment
The advances under the Revolving Credit Facility and the Term Loans may be prepaid at our option at any time without premium or penalty (other than customary payments related to increased costs, LIBOR breakage and indemnities). Subject to certain exceptions, the Senior Loan Facilities will be subject to mandatory prepayment in an amount equal to a portion of the net cash proceeds received by us or any other Loan Party from certain asset sales, insurance recovery events, debt incurrences and equity issuances. Further, the Revolving Credit Facility will be subject to mandatory prepayment if the outstanding Revolving Credit Facility exceeds the aggregate commitments with respect thereto, in an amount equal to such excess. Mandatory prepayments of outstanding obligations under the Revolving Credit Facility will not result in a permanent reduction of the lenders’ commitments under the Revolving Credit Facility.
The Senior Loan Facilities will mature on June 12, 2018, which we refer to as the Maturity Date. The Term Loans are payable in nineteen consecutive quarterly installments of principal as follows: (i) four quarterly principal payments, each in the amount of $1,250,000, on October 1, 2013, January 1, 2014, April 1, 2014 and July 1, 2014; (ii) four quarterly principal payments, each in the amount of $1,875,000, on October 1, 2014, January 1, 2015, April 1, 2015 and July 1, 2015; (iii) eleven quarterly principal payments, each in the amount of $2,500,000, commencing on October 1, 2015 and continuing on the first day of January, April, July and October thereafter through and including April 1, 2018, with all remaining principal on the Term Loans due and payable on the Maturity Date.
- 155 -
Table of Contents
Guarantee; Security
Our obligations under the Senior Loan Facilities are guaranteed by our existing and subsequently acquired or organized direct or indirect domestic material subsidiaries, which we refer to as Subsidiary Guarantors, to the extent permitted by applicable law, regulation and contractual provision.
The obligations under the Senior Loan Facilities are secured by: (i) all capital stock of all first-tier domestic subsidiaries owned by ADS and the Subsidiary Guarantors and 65% of the capital stock of any first-tier foreign subsidiary owned directly by ADS or any Subsidiary Guarantor (with any domestic subsidiary whose principal purpose is to hold the ownership interests of one or more foreign subsidiaries generally being deemed to be a foreign subsidiary) and (ii) substantially all other tangible and intangible personal property owned by ADS and each Subsidiary Guarantor, in each case to the extent permitted by applicable law. Pursuant to the Intercreditor and Collateral Agency Agreement (defined below), our obligations under the Senior Loan Facilities are secured by the collateral on a pari passu basis with our obligations under the Senior Notes (as defined below) to the extent set forth in the Intercreditor and Collateral Agency Agreement.
Interest; Fees
The interest rates applicable to the loans under the Senior Loan Facilities are based on a fluctuating rate of interest measured by reference to either, at our option: (i) an adjusted London inter-bank offered rate (adjusted for statutory reserve requirements), plus a borrowing margin determined on a quarterly basis by reference to a pricing grid corresponding to our then applicable Leverage Ratio or (ii) an alternate base rate, plus a borrowing margin determined on a quarterly basis by reference to a pricing grid corresponding to our then applicable Leverage Ratio.
Customary fees are payable in respect of the Senior Loan Facilities and the ongoing utilization and maintenance thereof.
Covenants
The Senior Loan Facilities contain a number of negative covenants that, among other things, limit or restrict our ability and, in certain cases, certain of our subsidiaries’ ability to carry out acquisitions, mergers or consolidations; to pay dividends; to incur other indebtedness (including guarantees of other indebtedness); to grant or permit certain liens; to pay dividends or make other restricted payments, including investments; to prepay or amend the terms of other indebtedness; to enter into certain types of transactions with affiliates; to sell certain assets; or to sell or otherwise dispose of all or substantially all of its assets.
The Senior Loan Facilities also contain certain affirmative covenants, including financial and other reporting requirements.
Events of Default
The Senior Loan Facilities provide for customary events of default, including non-payment of principal, interest or fees, violation of covenants, material inaccuracy of representations or warranties, specified cross default and cross acceleration to other material indebtedness, change of control, certain bankruptcy events, certain ERISA events, material invalidity of guarantees or security interests and material judgments.
Senior Notes
On September 27, 2010, we issued $75.0 million aggregate principal amount of 5.60% Senior Series A Secured Notes due September 24, 2018 (which we refer to as the Senior Series A Notes) at par. Each of the Senior Series A Notes bears interest at a rate of 5.6% per annum. Accrued interest on each of the Senior Series A Notes is payable quarterly on each December 24, March 24, June 24 and September 24. Principal on each of the Senior Series A Notes is payable in three (3) equal installments on September 24, 2016, September 24, 2017 and September 24, 2018.
- 156 -
Table of Contents
On July 24, 2013, we issued $25.0 million aggregate principal amount of 4.05% Senior Series B Secured Notes due September 24, 2019 (which we refer to as the Senior Series B Notes and, together with the Senior Series A Notes, as the Senior Notes) at par. Each of the Senior Series B Notes bears interest at a rate of 4.05% per annum. Accrued interest on each of the Senior Series B Notes is payable quarterly on each December 24, March 24, June 24 and September 24. Principal on each of the Senior Series B Notes is payable on September 24, 2019.
The proceeds of the Senior Series A Notes were primarily used to repurchase outstanding shares of common stock from certain of our stockholders and to repurchase outstanding shares of convertible preferred stock from the ESOP. The proceeds of the Senior Series B Notes were primarily used for our general corporate purposes.
As of December 31, 2013, the outstanding principal balance of the Senior Series A Notes was $75.0 million. As of December 31, 2013, the outstanding principal balance of the Senior Series B Notes was $25.0 million.
Guarantees; Security
Consistent with the Senior Loan Facilities, the Senior Notes are guaranteed by the Subsidiary Guarantors, to the extent permitted by applicable law and regulation.
Our obligations under the Senior Notes are secured by: (i) all capital stock of all domestic subsidiaries owned by ADS and the Subsidiary Guarantors and 65% of the capital stock of any first-tier foreign subsidiary owned directly by ADS or any Subsidiary Guarantor (with any domestic subsidiary created to hold the stock of foreign subsidiary generally being deemed to be a foreign subsidiary) and (ii) substantially all other tangible and intangible personal property owned by ADS and each Subsidiary Guarantor, in each case to the extent permitted by applicable law. Pursuant to the Intercreditor and Collateral Agency Agreement, our obligations under the Senior Notes are secured by the collateral on a pari passu basis with our obligations under the Senior Loan Facilities to the extent set forth in the Intercreditor and Collateral Agency Agreement.
Prepayments
The Senior Notes of each series are subject to prepayment at our option, in whole at any time or from time to time in part at 100% of the principal amount so prepaid plus interest thereon to the prepayment date plus a yield maintenance amount with respect to such note.
Subject to certain exceptions, if we or any of the Subsidiary Guarantors receives net cash proceeds from certain asset sales, insurance recovery events, debt incurrences or equity issuances, we must use a portion of such net cash proceeds to make an offer to prepay the Senior Notes. A noteholder may accept or reject such offer of prepayment.
Covenants
Consistent with the terms of the Senior Loan Facilities, the Senior Notes contain restrictive covenants that, among other things, limit the ability of ADS and, in certain cases, certain of our subsidiaries, to: incur more indebtedness; pay dividends, redeem stock or make other distributions; make investments; grant or permit certain liens; transfer or sell assets; merge or consolidate; and enter into certain transactions with ADS’s affiliates.
Consistent with the terms of the Senior Loan Facilities, the Senior Notes also contain certain affirmative covenants, including financial and other reporting requirements.
Events of Default
Consistent with the terms of the Senior Loan Facilities, the Senior Notes provide for customary events of default, including non-payment of principal, interest or fees, violation of covenants, material inaccuracy of
- 157 -
Table of Contents
representations or warranties, specified cross default and cross acceleration to other material indebtedness, change of control, certain bankruptcy events, certain ERISA events, material invalidity of guarantees or security interests and material judgments.
Intercreditor Agreement
On June 12, 2013, the administrative agent for and on behalf of the lenders under the Senior Loan Facilities and the holders of the Senior Notes, among others entered into an intercreditor and collateral agency agreement, which we refer to as the Intercreditor and Collateral Agency Agreement. Pursuant to the Intercreditor and Collateral Agency Agreement, the administrative agent was appointed as the collateral agent (which we refer to as the Collateral Agent) and secured party for the benefit of, among others, the lenders under the Senior Loan Facilities and the holders of the Senior Notes and the parties agreed that our obligations under the Senior Loan Facilities and the Senior Notes are secured by the collateral on a pari passu basis to the extent provided in the Intercreditor and Collateral Agency Agreement.
- 158 -
Table of Contents
MATERIAL U.S. FEDERAL TAX CONSIDERATIONS FOR NON-U.S. HOLDERS
The following is a discussion of certain material U.S. federal income and estate tax considerations relating to the purchase, ownership and disposition of our common stock by Non-U.S. Holders (as defined below) that purchase our common stock pursuant to this offering and hold such common stock as a “capital asset” within the meaning of Section 1221 of the Code. This discussion is based on the Code, U.S. Treasury regulations promulgated or proposed thereunder, and administrative and judicial interpretations thereof, all as in effect on the date hereof and all of which are subject to change, possibly with retroactive effect, or to different interpretation. This discussion does not address all of the U.S. federal income tax considerations that may be relevant to specific Non-U.S. Holders in light of their particular circumstances, including the impact of the unearned income Medicare contribution tax, or to Non-U.S. Holders subject to special treatment under U.S. federal income tax law (such as banks, insurance companies, dealers in securities or other Non-U.S. Holders that generally mark their securities to market for U.S. federal income tax purposes, controlled foreign corporations, passive foreign investment companies, foreign governments, international organizations, tax-exempt entities, certain former citizens or residents of the United States, or Non-U.S. Holders that hold our common stock as part of a straddle, hedge, conversion or other integrated transaction). This discussion does not address any U.S. state or local or non-U.S. tax considerations or any U.S. federal gift or alternative minimum tax considerations.
As used in this discussion, the term “Non-U.S. Holder” means a beneficial owner of our common stock that, for U.S. federal income tax purposes, is:
| • | an individual who is neither a citizen nor a resident of the United States; |
| • | a corporation that is not created or organized in or under the laws of the United States, any state thereof, or the District of Columbia; |
| • | an estate that is not subject to U.S. federal income tax on income from non-U.S. sources which is not effectively connected with the conduct of a trade or business within the United States; or |
| • | a trust unless (i) it is subject to the primary supervision of a court within the United States and one or more United States persons have the authority to control all of its substantial decisions or (ii) it has in effect a valid election under applicable U.S. Treasury regulations to be treated as a United States person. |
If an entity treated as a partnership for U.S. federal income tax purposes invests in our common stock, the U.S. federal income tax considerations relating to such investment will depend in part upon the status and activities of such entity and the particular partner. Any such entity should consult its own tax adviser regarding the U.S. federal tax considerations applicable to it and its partners relating to the purchase, ownership and disposition of our common stock.
PERSONS CONSIDERING AN INVESTMENT IN OUR COMMON STOCK SHOULD CONSULT THEIR OWN TAX ADVISORS REGARDING THE U.S. FEDERAL, STATE AND LOCAL AND NON-U.S. INCOME, ESTATE AND OTHER TAX CONSIDERATIONS RELATING TO THE PURCHASE, OWNERSHIP AND DISPOSITION OF OUR COMMON STOCK IN LIGHT OF THEIR PARTICULAR CIRCUMSTANCES.
Distributions on Common Stock
If we make a distribution of cash or other property (other than certain pro rata distributions of our common stock or rights to acquire our common stock) in respect of a share of our common stock, the distribution will generally be treated as a dividend to the extent it is paid from our current or accumulated earnings and profits (as determined under U.S. federal income tax principles). If the amount of a distribution exceeds our current and accumulated earnings and profits, such excess generally will be treated first as a tax-free return of capital to the extent of the Non-U.S. Holder’s tax basis in such share of our common stock, and then as capital gain.
- 159 -
Table of Contents
Except as described below, dividends paid to or for the account of a Non-U.S. Holder are subject to withholding of U.S. federal income tax at a 30% rate, or at a lower rate if provided by an applicable tax treaty and the Non-U.S. Holder has furnished to us or another payor:
| • | a valid IRS Form W-8BEN or an acceptable substitute form upon certifying, under penalties of perjury, the status of the Non-U.S. Holder as (or, in the case of a Non-U.S. Holder that is a partnership or an estate or trust, such forms certifying the status of each partner in the partnership or beneficiary of the estate or trust as) a non-U.S. person and the Non-U.S. Holder’s entitlement to the lower treaty rate with respect to such payments, or |
| • | in the case of payments made outside the United States to an offshore account (generally, an account maintained at an office or branch of a bank or other financial institution at any location outside the United States), other documentary evidence establishing the entitlement of the Non-U.S. Holder to the lower treaty rate in accordance with U.S. Treasury regulations. |
If a Non-U.S. Holder is eligible for a reduced rate of U.S. withholding tax under a tax treaty, such Non-U.S. Holder may obtain a refund of any amounts withheld in excess of that rate by filing a refund claim with the IRS.
If dividends paid to a Non-U.S. Holder are “effectively connected” with the conduct of a trade or business within the United States, and, if required by a tax treaty, the dividends are attributable to a permanent establishment (or fixed base, in the case of an individual) maintained in the United States, we and other payors generally are not required to withhold tax from the dividends, provided that the Non-U.S. Holder has furnished to us or another payor a valid IRS Form W-8ECI or an acceptable substitute form representing, under penalties of perjury, that:
| • | the Non-U.S. Holder is a non-U.S. person, and |
| • | the dividends are effectively connected with the conduct of a trade or business within the United States and are includible in the gross income of the Non-U.S. Holder. |
“Effectively connected” dividends are taxed at rates applicable to U.S. citizens, resident aliens, and domestic U.S. corporations.
In the case of a corporate Non-U.S. Holder, “effectively connected” dividends may, under certain circumstances, be subject to an additional “branch profits tax” at a 30% rate or at a lower rate if the Non-U.S. Holder is eligible for the benefits of an income tax treaty that provides for a lower rate.
Sale, Exchange or Other Disposition of Common Stock
A Non-U.S. Holder generally will not be subject to U.S. federal income tax on gain recognized on a disposition of our common stock unless:
| • | the gain is “effectively connected” with the conduct of a trade or business in the United States, and the gain is attributable to a permanent establishment (or fixed base, in the case of an individual) maintained in the United States, if that is required by an applicable income tax treaty as a condition for subjecting the Non-U.S. Holder to U.S. taxation on a net income basis, |
| • | such Non-U.S. Holder is an individual who is present in the United States for 183 or more days in the taxable year of the disposition, and certain other conditions exist (except as provided by an applicable treaty), or |
| • | we are or have been a “United States real property holding corporation” for U.S. federal income tax purposes; provided that a Non-U.S. Holder will not be subject to U.S. federal income tax on the gain on a disposition of our common stock if either (i) our common stock is regularly traded on an established securities market in the year the Non-U.S. Holder disposes of the stock and such Non-U.S. Holder did not hold, directly or indirectly, more than 5% of our common stock at any time during the five-year |
- 160 -
Table of Contents
| period ending on the date of disposition or (ii) the Non-U.S. Holder is eligible for any treaty exemption. We have not been, are not, and do not anticipate becoming a United States real property holding corporation for U.S. federal income tax purposes. |
In the case of a corporate Non-U.S. Holder, “effectively connected” gains that are recognized may also, under certain circumstances, be subject to an additional “branch profits tax” at a 30% rate or at a lower rate if the Non-U.S. Holder is eligible for the benefits of an income tax treaty that provides for a lower rate.
The foregoing discussion is subject to the discussion below under “— FATCA Withholding” and “— Information Reporting and Backup Withholding.”
FATCA Withholding
Under the Foreign Account Tax Compliance Act provisions of the Code and related Treasury guidance, or FATCA, a withholding tax of 30% will be imposed in certain circumstances on payments of (a) distributions on our common stock on or after July 1, 2014 and (b) gross proceeds from the sale or other disposition of our common stock on or after January 1, 2017. In the case of payments made to a “foreign financial institution” (generally including an investment fund), as a beneficial owner or as an intermediary, the tax generally will be imposed, subject to certain exceptions, unless such institution (i) enters into (or is otherwise subject to) and complies with an agreement with the U.S. government, which we refer to as a FATCA Agreement, or (ii) is required by and complies with applicable foreign law enacted in connection with an intergovernmental agreement between the United States and a foreign jurisdiction, which we refer to as an IGA, in either case to, among other things, collect and provide to the U.S. or other relevant tax authorities certain information regarding U.S. account holders of such institution. In the case of payments made to a foreign entity that is not a financial institution (as a beneficial owner), the tax generally will be imposed, subject to certain exceptions, unless such entity provides the withholding agent with a certification that it does not have any “substantial” U.S. owner (generally, any specified U.S. person that directly or indirectly owns more than a specified percentage of such entity) or that identifies its “substantial” U.S. owners. If our common stock is held through a foreign financial institution that enters into (or is otherwise subject to) a FATCA Agreement, such foreign financial institution (or, in certain cases, a person paying amounts to such foreign financial institution) generally will be required, subject to certain exceptions, to withhold such tax on payments of dividends and proceeds described above made to (x) a person (including an individual) that fails to comply with certain information requests or (y) a foreign financial institution that has not entered into (and is not otherwise subject to) a FATCA Agreement and is not otherwise exempted from FATCA pursuant to applicable foreign law enacted in connection with an IGA. Coordinating rules may limit duplicative withholding in cases where the withholding described above in “— Distributions on Common Stock” or below in “— Information Reporting and Backup Withholding” also applies. Each Non-U.S. Holder should consult its own tax advisor regarding the application of FATCA to the ownership and disposition of our common stock.
Information Reporting and Backup Withholding
Amounts treated as payments of dividends on our common stock paid to a Non-U.S. Holder and the amount of any tax withheld from such payments must be reported annually to the IRS and to such Non-U.S. Holder.
The information reporting and backup withholding rules that apply to payments of dividends to certain U.S. persons generally will not apply to payments of dividends on our common stock to a Non-U.S. Holder if such Non-U.S. Holder certifies under penalties of perjury that it is not a United States person (generally by providing an IRS Form W-8BEN) or otherwise establishes an exemption.
Proceeds from the sale, exchange or other disposition of our common stock by a Non-U.S. Holder effected through a non-U.S. office of a U.S. broker or of a non-U.S. broker with certain specified U.S. connections generally will be subject to information reporting (but not backup withholding) unless such Non-U.S. Holder certifies under penalties of perjury that it is not a United States person (generally by providing an IRS
- 161 -
Table of Contents
Form W-8BEN) or otherwise establishes an exemption. Proceeds from the sale, exchange or other disposition of our common stock by a Non-U.S. Holder effected through a U.S. office of a broker generally will be subject to information reporting and backup withholding unless such Non-U.S. Holder certifies under penalties of perjury that it is not a United States person (generally by providing an IRS Form W-8BEN) or otherwise establishes an exemption.
Backup withholding is not an additional tax. Any amounts withheld under the backup withholding rules generally will be allowed as a refund or a credit against a Non-U.S. Holder’s U.S. federal income tax liability if the required information is furnished by such Non-U.S. Holder on a timely basis to the IRS.
U.S. Federal Estate Tax
Shares of our common stock owned or treated as owned by an individual Non-U.S. Holder at the time of his or her death will be included in his or her gross estate for U.S. federal estate tax purposes and may be subject to U.S. federal estate tax unless an applicable estate tax treaty provides otherwise.
- 162 -
Table of Contents
Barclays Capital Inc. and Deutsche Bank Securities Inc. are acting as the representatives of the underwriters and Barclays Capital Inc., Deutsche Bank Securities Inc., Citigroup Global Markets Inc. and RBC Capital Markets, LLC are acting as joint book-running managers of this offering. Under the terms of an underwriting agreement, which will be filed as an exhibit to the registration statement, each of the underwriters named below has severally agreed to purchase from us and the selling stockholder the respective number of shares of common stock shown opposite its name below:
| Underwriters |
Number of Shares | |
| Barclays Capital Inc. |
||
| Deutsche Bank Securities Inc. |
||
| Citigroup Global Markets Inc. |
||
| RBC Capital Markets, LLC |
||
|
| ||
| Total |
||
|
|
The underwriting agreement provides that the underwriters’ obligation to purchase shares of common stock depends on the satisfaction of the conditions contained in the underwriting agreement including:
| • | the obligation to purchase all of the shares of common stock offered hereby (other than those shares of common stock covered by their option to purchase additional shares as described below), if any of the shares are purchased; |
| • | the representations and warranties made by us and the selling stockholder to the underwriters are true; |
| • | there is no material change in our business or the financial markets; and |
| • | we and the selling stockholder deliver customary closing documents to the underwriters. |
Commissions and Expenses
The following table summarizes the underwriting discounts and commissions we and the selling stockholder will pay to the underwriters. These amounts are shown assuming both no exercise and full exercise of the underwriters’ option to purchase additional shares. The underwriting fee is the difference between the initial price to the public and the amount the underwriters pay to us and the selling stockholder for the shares.
| Us | Selling Stockholder | |||||||||||||||
| No Exercise | Full Exercise | No Exercise | Full Exercise | |||||||||||||
| Per Share |
$ | $ | $ | $ | ||||||||||||
| Total |
$ | $ | $ | $ | ||||||||||||
The representatives have advised us that the underwriters propose to offer the shares of common stock directly to the public at the public offering price on the cover of this prospectus and to selected dealers, which may include the underwriters, at such offering price less a selling concession not in excess of $ per share. After the offering, the representatives may change the offering price and other selling terms.
The expenses of the offering that are payable by us and the selling stockholder are estimated to be approximately $ (excluding underwriting discounts and commissions).
Option to Purchase Additional Shares
We and the selling stockholder have granted the underwriters an option exercisable for 30 days after the date of this prospectus to purchase, from time to time, in whole or in part, up to an aggregate of shares from
- 163 -
Table of Contents
us and shares from the selling stockholder at the public offering price less underwriting discounts and commissions. To the extent that this option is exercised, each underwriter will be obligated, subject to certain conditions, to purchase its pro rata portion of these additional shares based on the underwriter’s percentage underwriting commitment in the offering as indicated in the table at the beginning of this Underwriting Section.
Lock-Up Agreements
We, all of our directors and executive officers, holders of more than % of our outstanding stock and the selling stockholder have agreed that, for a period of 180 days after the date of this prospectus subject to certain limited exceptions, we and they will not directly or indirectly, without the prior written consent of Barclays Capital Inc. and Deutsche Bank Securities Inc., (1) offer for sale, sell, pledge, or otherwise dispose of (or enter into any transaction or device that is designed to, or could be expected to, result in the disposition by any person at any time in the future of) any shares of common stock (including, without limitation, shares of common stock that may be deemed to be beneficially owned by us or them in accordance with the rules and regulations of the SEC and shares of common stock that may be issued upon exercise of any options or warrants) or securities convertible into or exercisable or exchangeable for common stock (other than the stock and shares issued pursuant to employee benefit plans, qualified stock option plans, or other employee compensation plans existing on the date of this prospectus or pursuant to currently outstanding options, warrants or rights not issued under one of those plans), or sell or grant options, rights or warrants with respect to any shares of common stock or securities convertible into or exchangeable for common stock (other than the grant of options pursuant to option plans existing on the date of this prospectus), (2) enter into any swap or other derivatives transaction that transfers to another, in whole or in part, any of the economic benefits or risks of ownership of shares of common stock, whether any such transaction described in clause (1) or (2) above is to be settled by delivery of common stock or other securities, in cash or otherwise, (3) make any demand for or exercise any right or file or cause to be filed a registration statement, including any amendments thereto, with respect to the registration of any shares of common stock or securities convertible, exercisable or exchangeable into common stock or any of our other securities (other than any registration statement on Form S-8), or (4) publicly disclose the intention to do any of the foregoing.
If:
| • | during the last 17 days of the 180-day restricted period, we issue an earnings release or material news or a material event relating to us occurs; or |
| • | prior to the expiration of the 180-day restricted period, we announce that we will release earnings results during the 16-day period beginning on the last day of the 180-day period, |
the 180-day restricted period described above will be extended (and the restrictions above will continue to apply) until the expiration of the 18-day period beginning on the issuance of the earnings release or the announcement of the material news or occurrence of the material event, unless Barclays Capital Inc. and Deutsche Bank Securities Inc. (in their sole discretion) confirm to us in writing that such extension will not be required.
Barclays Capital Inc. and Deutsche Bank Securities Inc., in their sole discretion, may release the common stock and other securities subject to the lock-up agreements described above in whole or in part at any time. When determining whether or not to release common stock and other securities from lock-up agreements, Barclays Capital Inc. and Deutsche Bank Securities Inc. will consider, among other factors, the holder’s reasons for requesting the release, the number of shares of common stock and other securities for which the release is being requested and market conditions at the time. At least three business days before the effectiveness of any release or waiver of any of the restrictions described above with respect to an officer or director of us, Barclays Capital Inc. and Deutsche Bank Securities Inc. will notify us of the impending release or waiver and we have agreed to announce the impending release or waiver by press release through a major news service at least two business days before the effective date of the release or waiver, except where the release or waiver is effected
- 164 -
Table of Contents
solely to permit a transfer of common stock that is not for consideration and where the transferee has agreed in writing to be bound by the same terms as the lock-up agreements described above to the extent and for the duration that such terms remain in effect at the time of transfer.
Offering Price Determination
Prior to this offering, there has been no public market for our common stock. The initial public offering price was negotiated between the representatives and us. In determining the initial public offering price of our common stock, the representatives considered:
| • | the history and prospects for the industry in which we compete; |
| • | our financial information; |
| • | the ability of our management and our business potential and earning prospects; |
| • | the prevailing securities markets at the time of this offering; and |
| • | the recent market prices of, and the demand for, publicly traded shares of generally comparable companies. |
Indemnification
We and the selling stockholder have agreed to indemnify the underwriters against certain liabilities, including liabilities under the Securities Act, and to contribute to payments that the underwriters may be required to make for these liabilities.
Stabilization, Short Positions and Penalty Bids
The representatives may engage in stabilizing transactions, short sales and purchases to cover positions created by short sales, and penalty bids or purchases for the purpose of pegging, fixing or maintaining the price of the common stock, in accordance with Regulation M under the Exchange Act:
| • | Stabilizing transactions permit bids to purchase the underlying security so long as the stabilizing bids do not exceed a specified maximum. |
| • | A short position involves a sale by the underwriters of shares in excess of the number of shares the underwriters are obligated to purchase in the offering, which creates the syndicate short position. This short position may be either a covered short position or a naked short position. In a covered short position, the number of shares involved in the sales made by the underwriters in excess of the number of shares they are obligated to purchase is not greater than the number of shares that they may purchase by exercising their option to purchase additional shares. In a naked short position, the number of shares involved is greater than the number of shares in their option to purchase additional shares. The underwriters may close out any short position by either exercising their option to purchase additional shares and/or purchasing shares in the open market. In determining the source of shares to close out the short position, the underwriters will consider, among other things, the price of shares available for purchase in the open market as compared to the price at which they may purchase shares through their option to purchase additional shares. A naked short position is more likely to be created if the underwriters are concerned that there could be downward pressure on the price of the shares in the open market after pricing that could adversely affect investors who purchase in the offering. |
| • | Syndicate covering transactions involve purchases of the common stock in the open market after the distribution has been completed in order to cover syndicate short positions. |
| • | Penalty bids permit the representatives to reclaim a selling concession from a syndicate member when the common stock originally sold by the syndicate member is purchased in a stabilizing or syndicate covering transaction to cover syndicate short positions. |
- 165 -
Table of Contents
These stabilizing transactions, syndicate covering transactions and penalty bids may have the effect of raising or maintaining the market price of our common stock or preventing or retarding a decline in the market price of the common stock. As a result, the price of the common stock may be higher than the price that might otherwise exist in the open market. These transactions may be effected on the NYSE or otherwise and, if commenced, may be discontinued at any time.
Neither we nor any of the underwriters make any representation or prediction as to the direction or magnitude of any effect that the transactions described above may have on the price of the common stock. In addition, neither we nor any of the underwriters make any representation that the representatives will engage in these stabilizing transactions or that any transaction, once commenced, will not be discontinued without notice.
Listing on the NYSE
We intend to apply to list our common stock on the NYSE under the symbol “WMS.”
Discretionary Sales
The underwriters have informed us that they do not expect to sell more than 5% of the common stock in the aggregate to accounts over which they exercise discretionary authority.
Stamp Taxes
If you purchase shares of common stock offered in this prospectus, you may be required to pay stamp taxes and other charges under the laws and practices of the country of purchase, in addition to the offering price listed on the cover page of this prospectus.
Other Relationships
The underwriters and certain of their affiliates are full service financial institutions engaged in various activities, which may include securities trading, commercial and investment banking, financial advisory, investment management, investment research, principal investment, hedging, financing and brokerage activities. The underwriters and certain of their affiliates have, from time to time, performed, and may in the future perform, various commercial and investment banking and financial advisory services for the issuer and its affiliates, for which they received or may in the future receive customary fees and expenses.
In the ordinary course of their various business activities, the underwriters and certain of their affiliates may make or hold a broad array of investments and actively trade debt and equity securities (or related derivative securities) and financial instruments (including bank loans) for their own account and for the accounts of their customers, and such investment and securities activities may involve securities and/or instruments of the issuer or its affiliates. If the underwriters or their affiliates have a lending relationship with us, certain other of those underwriters or their affiliates may hedge, their credit exposure to us consistent with their customary risk management policies. Typically, the underwriters and their affiliates would hedge such exposure by entering into transactions which consist of either the purchase of credit default swaps or the creation of short positions in our securities or the securities of our affiliates, including potentially the shares of common stock offered hereby. Any such credit default swaps or short positions could adversely affect future trading prices of the shares of common stock offered hereby. The underwriters and certain of their affiliates may also communicate independent investment recommendations, market color or trading ideas and/or publish or express independent research views in respect of such securities or instruments and may at any time hold, or recommend to clients that they acquire, long and/or short positions in such securities and instruments.
- 166 -
Table of Contents
Selling Restrictions
European Economic Area
In relation to each Member State of the European Economic Area which has implemented the Prospectus Directive, which we refer to as a Relevant Member State, an offer to the public of any common stock which are the subject of the offering contemplated herein may not be made in that Relevant Member State, except that an offer to the public in that Relevant Member State of any common stock may be made at any time under the following exemptions under the Prospectus Directive, if they have been implemented in that Relevant Member State:
| • | to legal entities which are qualified investors as defined under the Prospectus Directive; |
| • | by the underwriters to fewer than 100, or, if the Relevant Member State has implemented the relevant provisions of the 2010 PD Amending Directive, 150, natural or legal persons (other than qualified investors as defined in the Prospectus Directive), as permitted under the Prospectus Directive, subject to obtaining the prior consent of the representatives of the underwriters for any such offer; or |
| • | in any other circumstances falling within Article 3(2) of the Prospectus Directive, provided that no such offer of common stock shall result in a requirement for us, the selling stockholders or any underwriter to publish a prospectus pursuant to Article 3 of the Prospectus Directive or supplement a prospectus pursuant to Article 16 of the Prospectus Directive. |
Each person in a Relevant Member State who receives any communication in respect of, or who acquires any common stock under, the offers contemplated here in this prospectus will be deemed to have represented, warranted and agreed to and with each underwriter, the selling stockholder and us that:
| • | it is a qualified investor as defined under the Prospectus Directive; and |
| • | in the case of any common stock acquired by it as a financial intermediary, as that term is used in Article 3(2) of the Prospectus Directive, (i) the common stock acquired by it in the offering have not been acquired on behalf of, nor have they been acquired with a view to their offer or resale to, persons in any Relevant Member State other than qualified investors, as that term is defined in the Prospectus Directive, or in the circumstances in which the prior consent of the representatives of the underwriters has been given to the offer or resale or (ii) where common stock have been acquired by it on behalf of persons in any Relevant Member State other than qualified investors, the offer of such common stock to it is not treated under the Prospectus Directive as having been made to such persons. |
For the purposes of this representation and the provision above, the expression an “offer of common stock to the public” in relation to any common stock in any Relevant Member State means the communication in any form and by any means of sufficient information on the terms of the offer and any common stock to be offered so as to enable an investor to decide to purchase or subscribe for the common stock, as the same may be varied in that Relevant Member State by any measure implementing the Prospectus Directive in that Relevant Member State, the expression “Prospectus Directive” means Directive 2003/71/EC (and amendments thereto, including the 2010 PD Amending Directive, to the extent implemented in the Relevant Member State), and includes any relevant implementing measure in each Relevant Member State and the expression “2010 PD Amending Directive” means Directive 2010/73/EU.
United Kingdom
This prospectus has only been communicated or caused to have been communicated and will only be communicated or caused to be communicated as an invitation or inducement to engage in investment activity (within the meaning of Section 21 of the Financial Services and Markets Act of 2000, or FSMA) as received in connection with the issue or sale of the common stock in circumstances in which Section 21(1) of the FSMA does not apply to us. All applicable provisions of the FSMA will be complied with in respect to anything done in relation to the common stock in, from or otherwise involving the United Kingdom.
- 167 -
Table of Contents
Switzerland
The shares may not be publicly offered in Switzerland and will not be listed on the SIX Swiss Exchange, or SIX, or on any other stock exchange or regulated trading facility in Switzerland. This document has been prepared without regard to the disclosure standards for issuance prospectuses under art. 652a or art. 1156 of the Swiss Code of Obligations or the disclosure standards for listing prospectuses under art. 27 ff. of the SIX Listing Rules or the listing rules of any other stock exchange or regulated trading facility in Switzerland. Neither this document nor any other offering or marketing material relating to the shares or the offering may be publicly distributed or otherwise made publicly available in Switzerland.
Neither this document nor any other offering or marketing material relating to the offering, us or the shares have been or will be filed with or approved by any Swiss regulatory authority. In particular, this document will not be filed with, and the offer of shares will not be supervised by, the Swiss Financial Market Supervisory Authority FINMA (FINMA), and the offer of shares has not been and will not be authorized under the Swiss Federal Act on Collective Investment Schemes, or CISA. The investor protection afforded to acquirers of interests in collective investment schemes under the CISA does not extend to acquirers of shares.
Dubai International Financial Centre
This prospectus relates to an Exempt Offer in accordance with the Offered Securities Rules of the Dubai Financial Services Authority, or DFSA. This prospectus is intended for distribution only to persons of a type specified in the Offered Securities Rules of the DFSA. It must not be delivered to, or relied on by, any other person. The DFSA has no responsibility for reviewing or verifying any documents in connection with Exempt Offers. The DFSA has not approved this prospectus nor taken steps to verify the information set forth herein and has no responsibility for the prospectus. The shares to which this prospectus relates may be illiquid and/or subject to restrictions on their resale. Prospective purchasers of the shares offered should conduct their own due diligence on the shares. If you do not understand the contents of this prospectus you should consult an authorized financial advisor.
Australia
No placement document, prospectus, product disclosure statement or other disclosure document has been lodged with the Australian Securities and Investments Commission, or ASIC, in relation to the offering. This prospectus does not constitute a prospectus, product disclosure statement or other disclosure document under the Corporations Act 2001, or the Corporations Act, and does not purport to include the information required for a prospectus, product disclosure statement or other disclosure document under the Corporations Act.
Any offer in Australia of the shares may only be made to persons, which we refer to as Exempt Investors, who are “sophisticated investors” (within the meaning of section 708(8) of the Corporations Act), “professional investors” (within the meaning of section 708(11) of the Corporations Act) or otherwise pursuant to one or more exemptions contained in section 708 of the Corporations Act so that it is lawful to offer the shares without disclosure to investors under Chapter 6D of the Corporations Act.
The shares applied for by Exempt Investors in Australia must not be offered for sale in Australia in the period of 12 months after the date of allotment under the offering, except in circumstances where disclosure to investors under Chapter 6D of the Corporations Act would not be required pursuant to an exemption under section 708 of the Corporations Act or otherwise or where the offer is pursuant to a disclosure document which complies with Chapter 6D of the Corporations Act. Any person acquiring shares must observe such Australian on-sale restrictions.
This prospectus contains general information only and does not take account of the investment objectives, financial situation or particular needs of any particular person. It does not contain any securities
- 168 -
Table of Contents
recommendations or financial product advice. Before making an investment decision, investors need to consider whether the information in this prospectus is appropriate to their needs, objectives and circumstances, and, if necessary, seek expert advice on those matters.
Hong Kong
The shares have not been offered or sold and will not be offered or sold in Hong Kong, by means of any document, other than (a) to “professional investors” as defined in the Securities and Futures Ordinance (Cap. 571) of Hong Kong and any rules made under that Ordinance; or (b) in other circumstances which do not result in the document being a “prospectus” as defined in the Companies Ordinance (Cap. 32) of Hong Kong or which do not constitute an offer to the public within the meaning of that Ordinance. No advertisement, invitation or document relating to the shares has been or may be issued or has been or may be in the possession of any person for the purposes of issue, whether in Hong Kong or elsewhere, which is directed at, or the contents of which are likely to be accessed or read by, the public of Hong Kong (except if permitted to do so under the securities laws of Hong Kong) other than with respect to the shares which are or are intended to be disposed of only to persons outside Hong Kong or only to “professional investors” as defined in the Securities and Futures Ordinance and any rules made under that Ordinance.
Japan
The shares have not been and will not be registered under the Financial Instruments and Exchange Law of Japan (Law No. 25 of 1948, as amended) and, accordingly, will not be offered or sold, directly or indirectly, in Japan, or for the benefit of any Japanese Person or to others for re-offering or resale, directly or indirectly, in Japan or to any Japanese Person, except in compliance with all applicable laws, regulations and ministerial guidelines promulgated by relevant Japanese governmental or regulatory authorities in effect at the relevant time. For the purposes of this paragraph, “Japanese Person” shall mean any person resident in Japan, including any corporation or other entity organized under the laws of Japan.
- 169 -
Table of Contents
The validity of the common stock offered in this offering will be passed upon for us by Squire Sanders (US) LLP, Columbus, Ohio. Various legal matters relating to this offering will be passed upon for the underwriters by Latham & Watkins LLP, New York, New York. As of the date of this prospectus, an attorney employed by Squire Sanders (US) LLP beneficially owns 2,211 shares of our common stock.
WHERE YOU CAN FIND MORE INFORMATION
We have filed with the SEC a registration statement on Form S-1 under the Securities Act, with respect to the common stock offered hereby. This prospectus does not contain all of the information set forth in the registration statement and the exhibits and schedules thereto. Some items are omitted in accordance with the rules and regulations of the SEC. For further information with respect to us and the common stock offered hereby, we refer you to the registration statement and the exhibits and schedules filed therewith. Statements contained in this prospectus as to the contents of any contract, agreement or any other document referred to are summaries of the material terms of the respective contract, agreement or other document. With respect to each of these contracts, agreements or other documents filed as an exhibit to the registration statement, reference is made to the exhibits for a more complete description of the matter involved.
A copy of the registration statement, and the exhibits and schedules thereto, may be inspected without charge at the public reference facilities maintained by the SEC at 100 F Street, N.E., Washington, D.C. 20549. Copies of these materials may be obtained by writing to the Public Reference Section of the SEC at 100 F Street, N.E., Washington, D.C. 20549. Please call the SEC at 1-800-SEC-0330 for further information on the operation of the public reference facilities. The SEC maintains a website that contains reports, proxy and information statements and other information regarding registrants that file electronically with the SEC. The address of the SEC’s website is http://www.sec.gov.
Upon the completion of this offering, we will become subject to the information and periodic reporting requirements of the Exchange Act and, accordingly, will file annual reports containing financial statements audited by an independent public accounting company, quarterly reports containing unaudited financial statements, current reports, proxy statements and other information with the SEC. You will be able to inspect and copy these reports, proxy statements and other information at the public reference facilities maintained by the SEC at the address noted above. You will also be able to obtain copies of this material from the Public Reference Room of the SEC as described above, or inspect them without charge at the SEC’s website. Upon completion of this offering, you will also be able to access, free of charge, our reports filed with the SEC (for example, our Annual Report on Form 10-K, our Quarterly Reports on Form 10-Q and our Current Reports on Form 8-K and any amendments to those forms) through the “Investor Relations” portion of our Internet website (http://www.ads-pipe.com). Reports filed with or furnished to the SEC will be available as soon as reasonably practicable after they are filed with or furnished to the SEC. Our website is included in this prospectus as an inactive textual reference only. The information found on our website is not part of this prospectus or any report filed with or furnished to the SEC.
The consolidated financial statements as of March 31, 2013 and 2012, and for each of the three years in the period ended March 31, 2013, included in this prospectus and the related consolidated financial statement schedule included elsewhere in the Registration Statement, have been audited by Deloitte & Touche LLP, an independent registered public accounting firm, as stated in their report appearing herein and elsewhere in this prospectus, forming part of this Registration Statement. Such consolidated financial statements and consolidated financial statement schedule have been so included in reliance upon the report of such firm given upon their authority as experts in accounting and auditing.
- 170 -
Table of Contents
ADVANCED DRAINAGE SYSTEMS, INC. AND SUBSIDIARIES
INDEX TO CONSOLIDATED FINANCIAL STATEMENTS
| Page | ||||
| Audited Consolidated Financial Statements |
||||
| F-2 | ||||
| F-3 | ||||
| Consolidated Statements of Income for the fiscal years ended March 31, 2011, 2012 and 2013 |
F-4 | |||
| F-5 | ||||
| Consolidated Statements of Cash Flows for the fiscal years ended March 31, 2011, 2012 and 2013 |
F-6 | |||
| F-7 | ||||
| F-10 | ||||
| Unaudited Condensed Consolidated Financial Statements |
||||
| Condensed Consolidated Balance Sheets as of March 31, 2013 and December 31, 2013 |
F-43 | |||
| Condensed Consolidated Statements of Income for the nine months ended December 31, 2012 and 2013 |
F-44 | |||
| F-45 | ||||
| Condensed Consolidated Statements of Cash Flows for the nine months ended December 31, 2012 and 2013 |
F-46 | |||
| F-47 | ||||
| F-48 | ||||
| Schedule II — Consolidated Valuation and Qualifying Accounts |
F-67 | |||
F-1
Table of Contents
REPORT OF INDEPENDENT REGISTERED PUBLIC ACCOUNTING FIRM
To the Board of Directors of
Advanced Drainage Systems, Inc. and subsidiaries:
We have audited the accompanying consolidated balance sheets of Advanced Drainage Systems, Inc. and subsidiaries (collectively, the “Company”) as of March 31, 2013 and 2012, and the related consolidated statements of income, comprehensive income, cash flows, and stockholders’ equity and mezzanine equity for each of the three years in the period ended March 31, 2013. Our audits also included the financial statement schedule listed in the Index. These consolidated financial statements and financial statement schedule are the responsibility of the Company’s management. Our responsibility is to express an opinion on the consolidated financial statements and financial statement schedule based on our audits.
We conducted our audits in accordance with the standards of the Public Company Accounting Oversight Board (United States). Those standards require that we plan and perform the audit to obtain reasonable assurance about whether the financial statements are free of material misstatement. The Company is not required to have, nor were we engaged to perform, an audit of its internal control over financial reporting. Our audits included consideration of internal control over financial reporting as a basis for designing audit procedures that are appropriate in the circumstances, but not for the purpose of expressing an opinion on the effectiveness of the Company’s internal control over financial reporting. Accordingly, we express no such opinion. An audit also includes examining, on a test basis, evidence supporting the amounts and disclosures in the financial statements, assessing the accounting principles used and significant estimates made by management, as well as evaluating the overall financial statement presentation. We believe that our audits provide a reasonable basis for our opinion.
In our opinion, such consolidated financial statements present fairly, in all material respects, the financial position of the Company as of March 31, 2013 and 2012, and the results of its operations and its cash flows for each of the three years in the period ended March 31, 2013, in conformity with accounting principles generally accepted in the United States of America. Also, in our opinion, such financial statement schedule, when considered in relation to the consolidated financial statements taken as a whole, presents fairly, in all material respects, the information set forth therein.
/s/ Deloitte & Touche LLP
Columbus, Ohio
April 2, 2014
F-2
Table of Contents
ADVANCED DRAINAGE SYSTEMS, INC. AND SUBSIDIARIES
CONSOLIDATED BALANCE SHEETS
| As of March 31, | ||||||||
| (Amounts in thousands, except par value) | 2012 | 2013 | ||||||
| ASSETS |
||||||||
| Current assets: |
||||||||
| Cash |
$ | 2,082 | $ | 1,361 | ||||
| Receivables (less allowance for doubtful accounts of $4,169 and $4,689, respectively) |
166,794 | 146,478 | ||||||
| Inventories |
196,677 | 232,409 | ||||||
| Deferred income taxes and other current assets |
11,135 | 7,173 | ||||||
|
|
|
|
|
|||||
| Total current assets |
376,688 | 387,421 | ||||||
| Property, plant and equipment, net |
284,731 | 294,901 | ||||||
| Other assets: |
||||||||
| Goodwill |
85,702 | 86,259 | ||||||
| Intangible assets, net |
90,233 | 78,717 | ||||||
| Other assets |
67,674 | 60,441 | ||||||
|
|
|
|
|
|||||
| Total assets |
$ | 905,028 | $ | 907,739 | ||||
|
|
|
|
|
|||||
| LIABILITIES, MEZZANINE EQUITY AND STOCKHOLDERS’ EQUITY |
||||||||
| Current liabilities: |
||||||||
| Current maturities of debt obligations |
$ | 11,882 | $ | 11,942 | ||||
| Accounts payable |
110,070 | 110,251 | ||||||
| Other accrued liabilities |
37,008 | 35,441 | ||||||
| Accrued income taxes |
9,460 | 9,511 | ||||||
|
|
|
|
|
|||||
| Total current liabilities |
168,420 | 167,145 | ||||||
| Long-term debt obligation |
358,790 | 338,048 | ||||||
| Deferred tax liabilities |
82,837 | 74,114 | ||||||
| Other liabilities |
5,267 | 5,808 | ||||||
|
|
|
|
|
|||||
| Total liabilities |
615,314 | 585,115 | ||||||
| Commitments and contingencies (see Note 13) |
||||||||
| Mezzanine equity: |
||||||||
| Redeemable Common Stock; $0.01 par value: 8,135 issued and outstanding |
482,006 | 522,276 | ||||||
| Redeemable Convertible Preferred Stock; $0.01 par value: 10,000 authorized: 9,384 issued, 5,705 and 5,640 outstanding, respectively |
264,429 | 282,547 | ||||||
| Deferred compensation — unearned ESOP shares |
(188,872 | ) | (196,477 | ) | ||||
|
|
|
|
|
|||||
| Total mezzanine equity |
557,563 | 608,346 | ||||||
| Stockholders’ equity: |
||||||||
| Common stock; $0.01 par value: 23,365 authorized and issued: 1,786 and 1,867 outstanding, respectively |
11,957 | 11,957 | ||||||
| Paid-in capital |
39,661 | 41,152 | ||||||
| Common stock in treasury, at cost |
(449,583 | ) | (448,571 | ) | ||||
| Accumulated other comprehensive loss |
(1,375 | ) | (856 | ) | ||||
| Retained earnings |
110,863 | 87,331 | ||||||
|
|
|
|
|
|||||
| Total ADS stockholders’ equity |
(288,477 | ) | (308,987 | ) | ||||
| Noncontrolling interest in subsidiaries |
20,628 | 23,265 | ||||||
|
|
|
|
|
|||||
| Total stockholders’ equity |
(267,849 | ) | (285,722 | ) | ||||
|
|
|
|
|
|||||
| Total liabilities, mezzanine equity and stockholders’ equity |
$ | 905,028 | $ | 907,739 | ||||
|
|
|
|
|
|||||
See accompanying notes to consolidated financial statements.
F-3
Table of Contents
ADVANCED DRAINAGE SYSTEMS, INC. AND SUBSIDIARIES
CONSOLIDATED STATEMENTS OF INCOME
| Fiscal Years Ended March 31, |
||||||||||||
| (Amounts in thousands, except per share data) | 2011 | 2012 | 2013 | |||||||||
| Net sales |
$ | 863,138 | $ | 1,013,756 | $ | 1,017,041 | ||||||
| Cost of goods sold |
692,164 | 818,398 | 807,730 | |||||||||
|
|
|
|
|
|
|
|||||||
| Gross profit |
170,974 | 195,358 | 209,311 | |||||||||
| Operating expenses: |
||||||||||||
| Selling |
63,103 | 67,625 | 69,451 | |||||||||
| General and administrative |
61,648 | 65,927 | 67,712 | |||||||||
| Gain on sale of assets/business |
— | (44,634 | ) | (2,210 | ) | |||||||
| Intangible amortization |
7,294 | 11,387 | 11,295 | |||||||||
|
|
|
|
|
|
|
|||||||
| Income from operations |
38,929 | 95,053 | 63,063 | |||||||||
| Other (income) expense: |
||||||||||||
| Interest expense |
27,121 | 21,837 | 16,095 | |||||||||
| Other miscellaneous (income) expense, net |
(847 | ) | 2,425 | 283 | ||||||||
|
|
|
|
|
|
|
|||||||
| Income before income taxes |
12,655 | 70,791 | 46,685 | |||||||||
| Income tax expense |
4,053 | 27,064 | 16,894 | |||||||||
| Equity in net income of unconsolidated affiliates |
(736 | ) | (704 | ) | (387 | ) | ||||||
|
|
|
|
|
|
|
|||||||
| Net income |
9,338 | 44,431 | 30,178 | |||||||||
| Less net income attributable to noncontrolling interest |
3,342 | 1,171 | 2,019 | |||||||||
|
|
|
|
|
|
|
|||||||
| Net income attributable to ADS |
5,996 | 43,260 | 28,159 | |||||||||
|
|
|
|
|
|
|
|||||||
| Change in fair value of Redeemable Convertible Preferred Stock |
(3,541 | ) | (10,257 | ) | (5,869 | ) | ||||||
| Dividends paid to Redeemable Convertible Preferred Stockholders |
(844 | ) | (668 | ) | (736 | ) | ||||||
| Dividends paid to unvested restricted stockholders |
(104 | ) | (34 | ) | (52 | ) | ||||||
|
|
|
|
|
|
|
|||||||
| Net income available to common stockholders and participating securities |
1,507 | 32,301 | 21,502 | |||||||||
| Undistributed income allocated to participating securities |
— | (3,241 | ) | (2,042 | ) | |||||||
|
|
|
|
|
|
|
|||||||
| Net income available to common stockholders |
$ | 1,507 | $ | 29,060 | $ | 19,460 | ||||||
|
|
|
|
|
|
|
|||||||
| Weighted average common shares outstanding: |
||||||||||||
| Basic |
10,127 | 9,835 | 9,921 | |||||||||
| Diluted |
10,346 | 9,996 | 10,038 | |||||||||
| Net income per share: |
||||||||||||
| Basic |
$ | 0.15 | $ | 2.95 | $ | 1.96 | ||||||
| Diluted |
$ | 0.15 | $ | 2.91 | $ | 1.94 | ||||||
| Cash dividends declared per share |
$ | 0.44 | $ | 0.44 | $ | 0.48 | ||||||
| Supplemental pro forma net income per share (unaudited) |
||||||||||||
| Basic |
||||||||||||
| Diluted |
||||||||||||
| Weighted average common shares outstanding used to calculate supplemental pro forma net income per share |
||||||||||||
See accompanying notes to consolidated financial statements.
F-4
Table of Contents
ADVANCED DRAINAGE SYSTEMS, INC. AND SUBSIDIARIES
CONSOLIDATED STATEMENTS OF COMPREHENSIVE INCOME
| Fiscal Years Ended March 31, |
||||||||||||
| (Amounts in thousands) | 2011 | 2012 | 2013 | |||||||||
| Net income |
$ | 9,338 | $ | 44,431 | $ | 30,178 | ||||||
| Other comprehensive income (loss): |
||||||||||||
| Currency translation, before tax |
1,949 | (544 | ) | 2,040 | ||||||||
| Other, before tax |
(179 | ) | 44 | (41 | ) | |||||||
|
|
|
|
|
|
|
|||||||
| Total other comprehensive income (loss), before tax |
1,770 | (500 | ) | 1,999 | ||||||||
|
|
|
|
|
|
|
|||||||
| Tax attributes of items in other comprehensive (loss) income: |
||||||||||||
| Currency translation |
(1,065 | ) | 83 | (298 | ) | |||||||
| Other |
73 | (17 | ) | 16 | ||||||||
|
|
|
|
|
|
|
|||||||
| Total tax (benefit) expense |
(992 | ) | 66 | (282 | ) | |||||||
|
|
|
|
|
|
|
|||||||
| Comprehensive income |
10,116 | 43,997 | 31,895 | |||||||||
| Less other comprehensive (loss) income attributable to noncontrolling interest, net of tax |
(752 | ) | (506 | ) | 1,198 | |||||||
| Less net income attributable to noncontrolling interest |
3,342 | 1,171 | 2,019 | |||||||||
|
|
|
|
|
|
|
|||||||
| Total comprehensive income attributable to ADS |
$ | 7,526 | $ | 43,332 | $ | 28,678 | ||||||
|
|
|
|
|
|
|
|||||||
See accompanying notes to consolidated financial statements.
F-5
Table of Contents
ADVANCED DRAINAGE SYSTEMS, INC. AND SUBSIDIARIES
CONSOLIDATED STATEMENTS OF CASH FLOWS
| Fiscal Years Ended March 31, |
||||||||||||
| (Amounts in thousands) | 2011 | 2012 | 2013 | |||||||||
| Cash Flows from Operating Activities |
||||||||||||
| Net income |
$ | 9,338 | $ | 44,431 | $ | 30,178 | ||||||
| Adjustments to reconcile net income to net cash provided by operating activities: |
||||||||||||
| Depreciation and amortization |
55,775 | 55,171 | 55,605 | |||||||||
| Impairment of Hancor trademark |
— | 3,200 | — | |||||||||
| Deferred income taxes |
(773 | ) | (5,556 | ) | (4,804 | ) | ||||||
| Gain on sale of assets/business |
— | (44,634 | ) | (2,210 | ) | |||||||
| Gain on proceeds from fire loss |
(4,414 | ) | — | — | ||||||||
| ESOP and stock based compensation expense |
7,289 | 6,382 | 9,875 | |||||||||
| Amortization of deferred financing charges |
2,073 | 1,935 | 1,929 | |||||||||
| Other non-cash operating activities |
(1,488 | ) | 2,888 | 854 | ||||||||
| Changes in working capital (see Note 22) |
(30,567 | ) | (6,820 | ) | (23,212 | ) | ||||||
|
|
|
|
|
|
|
|||||||
| Net cash provided by operating activities |
37,233 | 56,997 | 68,215 | |||||||||
|
|
|
|
|
|
|
|||||||
| Cash Flows from Investing Activities |
||||||||||||
| Capital expenditures |
(30,041 | ) | (26,467 | ) | (40,004 | ) | ||||||
| Property insurance proceeds |
3,554 | 3,601 | — | |||||||||
| Proceeds from sale of assets/business |
— | 38,953 | 600 | |||||||||
| Cash paid for acquisitions |
(20,299 | ) | (45,225 | ) | (4,839 | ) | ||||||
| Investment in unconsolidated affiliate |
— | (2,500 | ) | — | ||||||||
| Life insurance premiums paid |
(794 | ) | (799 | ) | (567 | ) | ||||||
| Additions of capitalized software |
(5,657 | ) | (3,396 | ) | (2,389 | ) | ||||||
|
|
|
|
|
|
|
|||||||
| Net cash used in investing activities |
(53,237 | ) | (35,833 | ) | (47,199 | ) | ||||||
|
|
|
|
|
|
|
|||||||
| Cash Flows from Financing Activities |
||||||||||||
| Redemption of Redeemable Convertible Preferred Stock |
(49,649 | ) | (3,579 | ) | (3,031 | ) | ||||||
| Cash dividends paid |
(5,235 | ) | (4,931 | ) | (5,442 | ) | ||||||
| Purchase of treasury stock — common |
(365,947 | ) | (663 | ) | (249 | ) | ||||||
| Proceeds from sale of Redeemable Common Stock, net of issuance costs |
314,614 | — | — | |||||||||
| Loan (payments) on CSV life insurance policies |
6,490 | (6,490 | ) | 7,693 | ||||||||
| Payments of deferred financing costs |
(8,690 | ) | — | — | ||||||||
| Proceeds from Senior Notes |
75,000 | — | — | |||||||||
| Proceeds from term loan |
100,000 | — | — | |||||||||
| Payments on term loan |
(2,500 | ) | (10,000 | ) | (10,000 | ) | ||||||
| Payments of notes, mortgages, and other debt |
(98,900 | ) | (2,574 | ) | (1,882 | ) | ||||||
| Proceeds from Revolving Credit Facility |
356,600 | 389,000 | 331,200 | |||||||||
| Payments on Revolving Credit Facility |
(306,900 | ) | (380,500 | ) | (340,000 | ) | ||||||
| Other financing activities |
251 | (1,496 | ) | (26 | ) | |||||||
|
|
|
|
|
|
|
|||||||
| Net cash provided by (used in) financing activities |
15,134 | (21,233 | ) | (21,737 | ) | |||||||
|
|
|
|
|
|
|
|||||||
| Net change in cash and equivalents |
(870 | ) | (69 | ) | (721 | ) | ||||||
| Cash and equivalents at beginning of year |
3,021 | 2,151 | 2,082 | |||||||||
|
|
|
|
|
|
|
|||||||
| Cash and equivalents at end of year |
$ | 2,151 | $ | 2,082 | $ | 1,361 | ||||||
|
|
|
|
|
|
|
|||||||
See accompanying notes to consolidated financial statements.
F-6
Table of Contents
ADVANCED DRAINAGE SYSTEMS, INC. AND SUBSIDIARIES
CONSOLIDATED STATEMENTS OF STOCKHOLDERS’ EQUITY AND MEZZANINE EQUITY
| Common Stock | Paid- In Capital |
Common Stock in Treasury |
Accumulated Other Comprehensive Loss |
Retained Earnings |
Total ADS Stock- holders’ Equity |
Non- controlling Interest in Subsidiaries |
Total Stock- holders’ Equity |
Redeemable Common Stock |
Redeemable Convertible Preferred Stock |
Deferred Compensation — Unearned ESOP Shares |
Total Mezzanine Equity |
|||||||||||||||||||||||||||||||||||||||||||||||||||||||||||
| (Amounts in thousands) | Shares | Amount | Shares | Amount | Shares | Amount | Shares | Amount | Shares | Amount | ||||||||||||||||||||||||||||||||||||||||||||||||||||||||||||
| Balance at April 1, 2010 |
31,500 | 12,038 | 42,004 | 21,040 | (211,451 | ) | (2,977 | ) | 366,305 | 205,919 | 18,639 | 224,558 | — | — | 6,948 | 276,189 | 4,311 | (171,331 | ) | 104,858 | ||||||||||||||||||||||||||||||||||||||||||||||||||
|
|
|
|
|
|
|
|
|
|
|
|
|
|
|
|
|
|
|
|
|
|
|
|
|
|
|
|
|
|
|
|
|
|
|
|||||||||||||||||||||||||||||||||||||
| Cumulative effect of accounting change — LIFO to FIFO |
— | — | — | — | — | — | 7,495 | 7,495 | — | 7,495 | — | — | — | — | — | — | — | |||||||||||||||||||||||||||||||||||||||||||||||||||||
| Net income |
— | — | — | — | — | — | 5,996 | 5,996 | 3,342 | 9,338 | — | — | — | — | — | — | — | |||||||||||||||||||||||||||||||||||||||||||||||||||||
| Other comprehensive income (loss) |
— | — | — | — | — | 1,530 | — | 1,530 | (752 | ) | 778 | — | — | — | — | — | — | — | ||||||||||||||||||||||||||||||||||||||||||||||||||||
| Redeemable Convertible Preferred Stock dividend |
— | — | — | — | — | — | (744 | ) | (744 | ) | — | (744 | ) | — | — | — | — | — | — | — | ||||||||||||||||||||||||||||||||||||||||||||||||||
| Common stock dividend ($0.44 per share) |
— | — | — | — | — | — | (4,491 | ) | (4,491 | ) | — | (4,491 | ) | — | — | — | — | — | — | — | ||||||||||||||||||||||||||||||||||||||||||||||||||
| Dividend paid to noncontrolling interest holder |
— | — | — | — | — | — | — | — | (750 | ) | (750 | ) | — | — | — | — | — | — | — | |||||||||||||||||||||||||||||||||||||||||||||||||||
| Allocation of ESOP shares to participants for: |
||||||||||||||||||||||||||||||||||||||||||||||||||||||||||||||||||||||
| Compensation |
— | — | 15 | — | — | — | — | 15 | — | 15 | — | — | — | — | (115 | ) | 4,548 | 4,548 | ||||||||||||||||||||||||||||||||||||||||||||||||||||
| Dividend |
— | — | — | — | — | — | (100 | ) | (100 | ) | — | (100 | ) | — | — | — | — | (3 | ) | 100 | 100 | |||||||||||||||||||||||||||||||||||||||||||||||||
| Exercise of common stock options |
— | — | (969 | ) | (141 | ) | 3,009 | — | — | 2,040 | — | 2,040 | — | — | — | — | — | — | — | |||||||||||||||||||||||||||||||||||||||||||||||||||
| Redemption of common shares to exercise stock options |
— | — | 869 | 17 | (869 | ) | — | — | — | — | — | — | — | — | — | — | — | — | ||||||||||||||||||||||||||||||||||||||||||||||||||||
| Stock based compensation |
— | — | 961 | — | — | — | — | 961 | — | 961 | — | — | — | — | — | — | — | |||||||||||||||||||||||||||||||||||||||||||||||||||||
| Restricted stock awards |
— | — | 724 | (25 | ) | 508 | — | — | 1,232 | — | 1,232 | — | — | — | — | — | — | — | ||||||||||||||||||||||||||||||||||||||||||||||||||||
| Redemption of Redeemable Convertible Preferred Stock |
— | — | — | — | — | — | — | — | — | — | — | — | (1,153 | ) | (49,649 | ) | — | — | (49,649 | ) | ||||||||||||||||||||||||||||||||||||||||||||||||||
| Purchase of common stock |
— | — | — | 6,603 | (366,358 | ) | — | — | (366,358 | ) | — | (366,358 | ) | — | — | — | — | — | — | — | ||||||||||||||||||||||||||||||||||||||||||||||||||
| Sale of common stock |
(5,833 | ) | (58 | ) | — | (5,833 | ) | 124,870 | — | (124,812 | ) | — | — | — | 5,833 | 314,616 | — | — | — | — | 314,616 | |||||||||||||||||||||||||||||||||||||||||||||||||
| Reclassification of common stock to Redeemable Common Stock |
(2,297 | ) | (23 | ) | (3,902 | ) | — | — | — | (124,714 | ) | (128,639 | ) | — | (128,639 | ) | 2,297 | 128,639 | — | — | — | — | 128,639 | |||||||||||||||||||||||||||||||||||||||||||||||
| Adjustments to Redeemable Convertible Preferred Stock fair value measurement |
— | — | — | — | — | — | (3,541 | ) | (3,541 | ) | — | (3,541 | ) | — | — | — | 2,674 | — | 867 | 3,541 | ||||||||||||||||||||||||||||||||||||||||||||||||||
| Adjustments to Redeemable Common Stock fair value measurement |
— | — | — | — | — | — | 12,979 | 12,979 | — | 12,979 | — | (12,979 | ) | — | — | — | — | (12,979 | ) | |||||||||||||||||||||||||||||||||||||||||||||||||||
|
|
|
|
|
|
|
|
|
|
|
|
|
|
|
|
|
|
|
|
|
|
|
|
|
|
|
|
|
|
|
|
|
|
|
|||||||||||||||||||||||||||||||||||||
| Balance at March 31, 2011 |
23,370 | 11,957 | 39,702 | 21,661 | (450,291 | ) | (1,447 | ) | 134,373 | (265,706 | ) | 20,479 | (245,227 | ) | 8,130 | 430,276 | 5,795 | 229,214 | 4,193 | (165,816 | ) | 493,674 | ||||||||||||||||||||||||||||||||||||||||||||||||
|
|
|
|
|
|
|
|
|
|
|
|
|
|
|
|
|
|
|
|
|
|
|
|
|
|
|
|
|
|
|
|
|
|
|
|||||||||||||||||||||||||||||||||||||
F-7
Table of Contents
ADVANCED DRAINAGE SYSTEMS, INC. AND SUBSIDIARIES
CONSOLIDATED STATEMENTS OF STOCKHOLDERS’ EQUITY AND MEZZANINE EQUITY
| Common Stock | Paid- In Capital |
Common Stock in Treasury |
Accumulated Other Comprehensive Loss |
Retained Earnings |
Total ADS Stock- holders’ Equity |
Non- controlling Interest in Subsidiaries |
Total Stock- holders’ Equity |
Redeemable Common Stock |
Redeemable Convertible Preferred Stock |
Deferred Compensation — Unearned ESOP Shares |
Total Mezzanine Equity |
|||||||||||||||||||||||||||||||||||||||||||||||||||||||||||||
| (Amounts in thousands) | Shares | Amount | Shares | Amount | Shares | Amount | Shares | Amount | Shares | Amount | ||||||||||||||||||||||||||||||||||||||||||||||||||||||||||||||
| Balance at April 1, 2011 |
23,370 | 11,957 | 39,702 | 21,661 | (450,291 | ) | (1,447 | ) | 134,373 | (265,706 | ) | 20,479 | (245,227 | ) | 8,130 | 430,276 | 5,795 | 229,214 | 4,193 | (165,816 | ) | 493,674 | ||||||||||||||||||||||||||||||||||||||||||||||||||
|
|
|
|
|
|
|
|
|
|
|
|
|
|
|
|
|
|
|
|
|
|
|
|
|
|
|
|
|
|
|
|
|
|
|
|||||||||||||||||||||||||||||||||||||||
| Net income |
— | — | — | — | — | — | 43,260 | 43,260 | 1,171 | 44,431 | — | — | — | — | — | — | — | |||||||||||||||||||||||||||||||||||||||||||||||||||||||
| Other comprehensive income (loss) |
— | — | — | — | — | 72 | — | 72 | (506 | ) | (434 | ) | — | — | — | — | — | — | — | |||||||||||||||||||||||||||||||||||||||||||||||||||||
| Redeemable Convertible Preferred Stock dividend |
— | — | — | — | — | — | (564 | ) | (564 | ) | — | (564 | ) | — | — | — | — | — | — | — | ||||||||||||||||||||||||||||||||||||||||||||||||||||
| Common stock dividend ($0.44 per share) |
— | — | — | — | — | — | (4,367 | ) | (4,367 | ) | — | (4,367 | ) | — | — | — | — | — | — | — | ||||||||||||||||||||||||||||||||||||||||||||||||||||
| Dividend paid to noncontrolling interest holder |
— | — | — | — | — | — | — | — | (516 | ) | (516 | ) | — | — | — | — | — | — | — | |||||||||||||||||||||||||||||||||||||||||||||||||||||
| Allocation of ESOP shares to participants for: |
||||||||||||||||||||||||||||||||||||||||||||||||||||||||||||||||||||||||
| Compensation |
— | — | (420 | ) | — | — | — | — | (420 | ) | — | (420 | ) | — | — | — | — | (116 | ) | 5,377 | 5,377 | |||||||||||||||||||||||||||||||||||||||||||||||||||
| Dividend |
— | — | — | — | — | — | (104 | ) | (104 | ) | — | (104 | ) | — | — | — | — | (2 | ) | 104 | 104 | |||||||||||||||||||||||||||||||||||||||||||||||||||
| Exercise of common stock options |
— | — | (1,305 | ) | (103 | ) | 2,140 | — | — | 835 | — | 835 | — | — | — | — | — | — | — | |||||||||||||||||||||||||||||||||||||||||||||||||||||
| Redemption of common shares to exercise stock options |
— | — | 1,278 | 25 | (1,278 | ) | — | — | — | — | — | — | — | — | — | — | — | — | ||||||||||||||||||||||||||||||||||||||||||||||||||||||
| Stock based compensation |
— | — | 811 | — | — | — | — | 811 | — | 811 | — | — | — | — | — | — | — | |||||||||||||||||||||||||||||||||||||||||||||||||||||||
| Restricted stock awards |
— | — | (153 | ) | (18 | ) | 509 | — | — | 356 | — | 356 | — | — | — | — | — | — | — | |||||||||||||||||||||||||||||||||||||||||||||||||||||
| Redemption of Redeemable Convertible Preferred Stock |
— | — | — | — | — | — | — | — | — | — | — | — | (90 | ) | (3,579 | ) | — | — | (3,579 | ) | ||||||||||||||||||||||||||||||||||||||||||||||||||||
| Purchase of common stock |
— | — | — | 14 | (663 | ) | — | — | (663 | ) | — | (663 | ) | — | — | — | — | — | — | — | ||||||||||||||||||||||||||||||||||||||||||||||||||||
| Reclassification of common stock to Redeemable Common Stock |
(5 | ) | — | (252 | ) | — | — | — | — | (252 | ) | — | (252 | ) | 5 | 252 | — | — | — | — | 252 | |||||||||||||||||||||||||||||||||||||||||||||||||||
| Adjustments to Redeemable Convertible Preferred Stock fair value measurement |
— | — | — | — | — | — | (10,257 | ) | (10,257 | ) | — | (10,257 | ) | — | — | — | 38,794 | — | (28,537 | ) | 10,257 | |||||||||||||||||||||||||||||||||||||||||||||||||||
| Adjustments to Redeemable Common Stock fair value measurement |
— | — | — | — | — | — | (51,478 | ) | (51,478 | ) | — | (51,478 | ) | — | 51,478 | — | — | — | — | 51,478 | ||||||||||||||||||||||||||||||||||||||||||||||||||||
|
|
|
|
|
|
|
|
|
|
|
|
|
|
|
|
|
|
|
|
|
|
|
|
|
|
|
|
|
|
|
|
|
|
|
|
||||||||||||||||||||||||||||||||||||||
| Balance at March 31, 2012 |
23,365 | 11,957 | 39,661 | 21,579 | (449,583 | ) | (1,375 | ) | 110,863 | (288,477 | ) | 20,628 | (267,849 | ) | 8,135 | 482,006 | 5,705 | 264,429 | 4,075 | (188,872 | ) | 557,563 | ||||||||||||||||||||||||||||||||||||||||||||||||||
|
|
|
|
|
|
|
|
|
|
|
|
|
|
|
|
|
|
|
|
|
|
|
|
|
|
|
|
|
|
|
|
|
|
|
|||||||||||||||||||||||||||||||||||||||
F-8
Table of Contents
ADVANCED DRAINAGE SYSTEMS, INC. AND SUBSIDIARIES
CONSOLIDATED STATEMENTS OF STOCKHOLDERS’ EQUITY AND MEZZANINE EQUITY
| Common Stock | Paid- In Capital |
Common Stock in Treasury |
Accumulated Other Comprehensive Loss |
Retained Earnings |
Total ADS Stock- holders’ Equity |
Non- controlling Interest in Subsidiaries |
Total Stock- holders’ Equity |
Redeemable Common Stock |
Redeemable Convertible Preferred Stock |
Deferred Compensation — Unearned ESOP Shares |
Total Mezzanine Equity |
|||||||||||||||||||||||||||||||||||||||||||||||||||||||||||
| (Amounts in thousands) | Shares | Amount | Shares | Amount | Shares | Amount | Shares | Amount | Shares | Amount | ||||||||||||||||||||||||||||||||||||||||||||||||||||||||||||
| Balance at April 1, 2012 |
23,365 | 11,957 | 39,661 | 21,579 | (449,583 | ) | (1,375 | ) | 110,863 | (288,477 | ) | 20,628 | (267,849 | ) | 8,135 | 482,006 | 5,705 | 264,429 | 4,075 | (188,872 | ) | 557,563 | ||||||||||||||||||||||||||||||||||||||||||||||||
|
|
|
|
|
|
|
|
|
|
|
|
|
|
|
|
|
|
|
|
|
|
|
|
|
|
|
|
|
|
|
|
|
|
|
|||||||||||||||||||||||||||||||||||||
| Net income |
— | — | — | — | — | — | 28,159 | 28,159 | 2,019 | 30,178 | — | — | — | — | — | — | — | |||||||||||||||||||||||||||||||||||||||||||||||||||||
| Other comprehensive income (loss) |
— | — | — | — | — | 519 | — | 519 | 1,198 | 1,717 | — | — | — | — | — | — | — | |||||||||||||||||||||||||||||||||||||||||||||||||||||
| Redeemable Convertible Preferred Stock dividend |
— | — | — | — | — | — | (625 | ) | (625 | ) | — | (625 | ) | — | — | — | — | — | — | — | ||||||||||||||||||||||||||||||||||||||||||||||||||
| Common stock dividend ($0.48 per share) |
— | — | — | — | — | — | (4,817 | ) | (4,817 | ) | — | (4,817 | ) | — | — | — | — | — | — | — | ||||||||||||||||||||||||||||||||||||||||||||||||||
| Dividend paid to noncontrolling interest holder |
— | — | — | — | — | — | — | — | (580 | ) | (580 | ) | — | — | — | — | — | — | — | |||||||||||||||||||||||||||||||||||||||||||||||||||
| Allocation of ESOP shares to participants for: |
||||||||||||||||||||||||||||||||||||||||||||||||||||||||||||||||||||||
| Compensation |
— | — | (282 | ) | — | — | — | — | (282 | ) | — | (282 | ) | — | — | — | — | (151 | ) | 7,565 | 7,565 | |||||||||||||||||||||||||||||||||||||||||||||||||
| Dividend |
— | — | — | — | — | — | (110 | ) | (110 | ) | — | (110 | ) | — | — | — | — | (2 | ) | 110 | 110 | |||||||||||||||||||||||||||||||||||||||||||||||||
| Exercise of common stock options |
— | — | (403 | ) | (69 | ) | 1,436 | — | — | 1,033 | — | 1,033 | — | — | — | — | — | — | — | |||||||||||||||||||||||||||||||||||||||||||||||||||
| Redemption of common shares to exercise stock options |
— | — | 805 | 14 | (805 | ) | — | — | — | — | — | — | — | — | — | — | — | — | ||||||||||||||||||||||||||||||||||||||||||||||||||||
| Stock based compensation |
— | — | 539 | — | — | — | — | 539 | — | 539 | — | — | — | — | — | — | — | |||||||||||||||||||||||||||||||||||||||||||||||||||||
| Restricted stock awards |
— | — | 832 | (30 | ) | 630 | — | — | 1,462 | — | 1,462 | — | — | — | — | — | — | — | ||||||||||||||||||||||||||||||||||||||||||||||||||||
| Redemption of Redeemable Convertible Preferred Stock |
— | — | — | — | — | — | — | — | — | — | — | — | (65 | ) | (3,031 | ) | — | — | (3,031 | ) | ||||||||||||||||||||||||||||||||||||||||||||||||||
| Purchase of common stock |
— | — | — | 4 | (249 | ) | — | — | (249 | ) | — | (249 | ) | — | — | — | — | — | — | — | ||||||||||||||||||||||||||||||||||||||||||||||||||
| Reclassification of common stock to Redeemable Common Stock |
— | — | — | — | — | — | — | — | — | — | — | — | — | — | — | — | — | |||||||||||||||||||||||||||||||||||||||||||||||||||||
| Adjustments to Redeemable Convertible Preferred Stock fair value measurement |
— | — | — | — | — | — | (5,869 | ) | (5,869 | ) | — | (5,869 | ) | — | — | — | 21,149 | — | (15,280 | ) | 5,869 | |||||||||||||||||||||||||||||||||||||||||||||||||
| Adjustments to Redeemable Common Stock fair value measurement |
— | — | — | — | — | — | (40,270 | ) | (40,270 | ) | — | (40,270 | ) | — | 40,270 | — | — | — | — | 40,270 | ||||||||||||||||||||||||||||||||||||||||||||||||||
|
|
|
|
|
|
|
|
|
|
|
|
|
|
|
|
|
|
|
|
|
|
|
|
|
|
|
|
|
|
|
|
|
|
|
|||||||||||||||||||||||||||||||||||||
| Balance at March 31, 2013 |
23,365 | 11,957 | 41,152 | 21,498 | (448,571 | ) | (856 | ) | 87,331 | (308,987 | ) | 23,265 | (285,722 | ) | 8,135 | 522,276 | 5,640 | 282,547 | 3,922 | (196,477 | ) | 608,346 | ||||||||||||||||||||||||||||||||||||||||||||||||
|
|
|
|
|
|
|
|
|
|
|
|
|
|
|
|
|
|
|
|
|
|
|
|
|
|
|
|
|
|
|
|
|
|
|
|||||||||||||||||||||||||||||||||||||
See accompanying notes to consolidated financial statements.
F-9
Table of Contents
ADVANCED DRAINAGE SYSTEMS, INC. AND SUBSIDIARIES
NOTES TO CONSOLIDATED FINANCIAL STATEMENTS
(Amounts in thousands, except per share data)
| 1. | BACKGROUND AND SUMMARY OF SIGNIFICANT ACCOUNTING POLICIES |
Organization
Advanced Drainage Systems, Inc. and subsidiaries (collectively referred to as “ADS”, the “Company”, “we”, “us” and “our”), incorporated in Delaware, designs, manufactures and markets high performance thermoplastic corrugated pipe and related water management products, primarily in North and South America and Europe.
The Company is managed based primarily on the geographies in which it operates and reports results of operations in two reportable segments. The reportable segments are Domestic and International.
Principles of Consolidation
Our consolidated financial statements include the Company, our wholly owned subsidiaries, our majority owned subsidiaries and variable interest entities (“VIEs”) of which we are the primary beneficiary. We use the equity method of accounting for equity investments where we exercise significant influence but do not hold a controlling financial interest. Such investments are recorded in Other assets in our Consolidated Balance Sheets and the related equity earnings from these investments is included in Equity in net income of unconsolidated affiliates in our Consolidated Statements of Income. All intercompany balances and transactions have been eliminated in consolidation.
Estimates
The preparation of our consolidated financial statements in conformity with accounting principles generally accepted in the United States of America requires management to make estimates and assumptions that affect the reported amounts of assets and liabilities, the disclosure of contingent assets and liabilities at the date of the consolidated financial statements and the reported amounts of revenues and expenses during the reporting period. Significant estimates include, but are not limited to, our allowance for doubtful accounts, useful lives of our property, plant and equipment and amortizing intangible assets, valuation allowance on deferred tax assets, reserves for uncertain tax positions, evaluation of goodwill, intangible assets and other long-lived assets for impairment, accounting for stock based compensation and our ESOP, reserves for general liability, workers’ compensation, and medical insurance, cash discounts and customer rebates and valuation of our Redeemable Common Stock and Redeemable Convertible Preferred Stock. Management’s estimates and assumptions are evaluated on an ongoing basis and are based on historical experience, current conditions and available information. Management believes the accounting estimates are appropriate and reasonably determined; however, due to the inherent uncertainties in making these estimates, actual results could differ from those estimates.
Allowance for Doubtful Accounts
Credit is extended to customers based on an evaluation of their financial condition and collateral is generally not required. The evaluation of the customer’s financial condition is performed to reduce the risk of loss. Accounts receivable are evaluated for collectability based on numerous factors, including the length of time individual receivables are past due, past transaction history with customers, their credit worthiness and the economic environment. An allowance for doubtful accounts is estimated as a percentage of aged receivables. This estimate is periodically adjusted when management becomes aware of a specific customer’s inability to meet its financial obligations (e.g., bankruptcy filing) or as a result of changes in historical collection patterns.
F-10
Table of Contents
Change in Accounting Principle
In April 2011, the Company changed the method of valuing raw materials from the last-in, first-out (“LIFO”) method to the first-in, first-out (“FIFO”) method. The Company believes the FIFO method of inventory valuation is preferable for the raw materials valuation because FIFO provides a better matching of inventory costs of its products with the sales due to a lag in the pass-through of changes in resin costs to customers and enhances the comparability of results to our peers. As a result of this change, all prior period amounts have been retrospectively adjusted as of the beginning of the earliest period presented. The change from the LIFO method to the FIFO method increased beginning retained earnings by $7,495, which was net of income tax of $4,771, as of April 1, 2010.
The table below details the impact of this change in accounting principle by financial statement line item, including the impact to EPS.
| Fiscal Year Ended March 31, 2011 | ||||||||||||
| (Amounts in thousands) | As previously reported |
Effect of accounting principle change |
As reported |
|||||||||
| Cost of goods sold |
$ | 697,050 | $ | (4,886 | ) | $ | 692,164 | |||||
| Gross profit |
166,088 | 4,886 | 170,974 | |||||||||
| Income from operations |
34,043 | 4,886 | 38,929 | |||||||||
| Income before income taxes |
7,769 | 4,886 | 12,655 | |||||||||
| Income tax expense |
2,152 | 1,901 | 4,053 | |||||||||
| Net income |
6,353 | 2,985 | 9,338 | |||||||||
| Net income attributable to ADS |
$ | 3,011 | $ | 2,985 | $ | 5,996 | ||||||
| Net income per share: |
||||||||||||
| Basic |
$ | 0.29 | $ | 0.15 | ||||||||
| Diluted |
$ | 0.29 | $ | 0.15 | ||||||||
Inventories
Inventories are stated at the lower of cost or market value. The Company’s inventories are maintained on the FIFO method. Costs include the cost of acquiring materials, direct and indirect labor and factory overhead.
Market value of inventory is established based on the lower of cost or estimated net realizable value, with consideration given to deterioration, obsolescence, and other factors. The Company periodically evaluates the carrying value of inventories and adjustments are made whenever necessary to reduce the carrying value to market value.
Property, Plant, and Equipment and Depreciation Method
Property, plant, and equipment is stated at cost, less accumulated depreciation. Depreciation is computed using the straight-line method over the estimated useful lives of the assets as follows:
| Years | ||
| Buildings |
40 | |
| Machinery and equipment |
7 - 15 | |
| Leasehold improvements |
Life of lease | |
| Capitalized software costs |
3 - 5 |
Costs of additions and major improvements are capitalized, whereas maintenance and repairs that do not improve or extend the life of the asset are charged to expense as incurred. Construction in progress is also
F-11
Table of Contents
recorded at cost and includes capitalized interest, capitalized payroll costs and related costs such as taxes and other fringe benefits. When assets are retired or sold, the cost and related accumulated depreciation are removed from the asset accounts and any resulting gain or loss is reflected in our Consolidated Statements of Income.
Long-Lived Assets
Long-lived assets are tested for recoverability whenever events or changes in circumstances indicate that carrying amounts of an asset group may not be recoverable. Asset groups are established primarily by determining the lowest level of identifiable cash flows that are largely independent of the cash flows of other groups of assets and liabilities. If the estimated undiscounted cash flows are less than the carrying amounts of such assets, an impairment loss in an amount necessary to write down the assets to fair value is determined from expected future discounted cash flows. Determining the fair value of these assets is judgmental in nature and involves the use of significant estimates and assumptions.
The Company did not incur any impairment expense for long-lived assets in the fiscal years ended March 31, 2011, 2012 and 2013.
Goodwill
The Company accounts for costs of acquired assets in excess of fair value (“goodwill”) and other intangible assets not subject to amortization in accordance with Financial Accounting Standards Board (“FASB”) Accounting Standards Codification (“ASC”) Topic 350, “Intangibles — Goodwill and Other”. Goodwill is reviewed annually for impairment as of March 31 or whenever events or changes in circumstances indicate the carrying value may not be recoverable. The goodwill impairment analysis is comprised of two steps. The first step requires the comparison of the fair value of the applicable reporting unit to its respective carrying value. If the fair value of the reporting unit exceeds the carrying value of the net assets assigned to that unit, goodwill is not considered impaired and the Company would not be required to perform further testing. If the carrying value of the net assets assigned to the reporting unit exceeds the fair value of the reporting unit, then the Company must perform the second step of the impairment test in order to determine the implied fair value of the reporting unit’s goodwill. If the carrying value of a reporting unit’s goodwill exceeds its implied fair value, then we would record an impairment loss equal to the difference. With respect to this testing, a reporting unit is a component of the Company for which discrete financial information is available and regularly reviewed by management. Implied fair value of goodwill is determined by considering both the income and market approach. Determining the fair value of a reporting unit is judgmental in nature and involves the use of significant estimates and assumptions. These estimates and assumptions include revenue growth rates and operating margins used to calculate projected future cash flows, risk-adjusted discount rates, future economic and market conditions, and determination of appropriate market comparables. The fair value estimates are based on assumptions management believes to be reasonable, but are inherently uncertain.
The Company did not incur any impairment expense for goodwill in the fiscal years ended March 31, 2011, 2012 and 2013.
Intangible Assets — Definite Lived
Definite-lived intangible assets are amortized using the straight-line method over their estimated useful lives, and are tested for recoverability whenever events or changes in circumstances indicate that carrying amounts of the asset group may not be recoverable. Asset groups are established primarily by determining the lowest level of cash flows available. If the estimated undiscounted future cash flows are less than the carrying amounts of such assets, an impairment loss is recognized to the extent the fair value of the asset less any costs of disposition is less than the carrying amount of the asset. Determining the fair value of these assets is judgmental in nature and involves the use of significant estimates and assumptions.
F-12
Table of Contents
In April 2011, the Company recharacterized the Hancor trademark previously classified as indefinite lived since 2005, to definite lived based on management’s decision to discontinue the use of the trademark over the next 15 years. When such a change is made, the asset is required to be tested for impairment. The Company tested the trademark for impairment using the relief from royalty valuation method and recorded an impairment charge of $3,200 in General and administrative expenses in the Consolidated Statements of Income, resulting in the carrying value of the trademark being reduced, and thus equal, to the estimated fair value, which will be amortized over a 15-year period.
No additional impairment charges were recorded in the fiscal years ended March 31, 2011, 2012 or 2013.
Intangible Assets — Indefinite Lived
Indefinite-lived intangible assets are tested for impairment annually as of March 31 or whenever events or changes in circumstances indicate the carrying value may be greater than fair value. Determining the fair value of these assets is judgmental in nature and involves the use of significant estimates and assumptions. The Company bases its fair value estimates on assumptions it believes to be reasonable, but that are inherently uncertain. To estimate the fair value of these indefinite-lived intangible assets, the Company uses an income approach, which utilizes a market derived rate of return to discount anticipated performance. An impairment loss is recognized when the estimated fair value of the intangible asset is less than the carrying value.
The Company did not record any impairment in the fiscal years ended March 31, 2011, 2012 or 2013 other than the Hancor trademark impairment described previously.
Other Assets
Other assets include investments in unconsolidated affiliates accounted for under the equity method, capitalized software development costs, central parts, certain deferred financing costs and cash surrender value of officer life insurance on key senior management executives. The Company capitalizes software development costs for internal use. Capitalization of software development costs begins in the application development stage and ends when the asset is placed into service. The Company amortizes such costs using the straight-line method over estimated useful lives and is included in General and administrative expenses or Cost of goods sold within our Consolidated Statements of Income depending on the nature of the asset and its intended use. Amortization expense related to certain deferred financing costs is included in Interest expense within our Consolidated Statements of Income. Central parts represent spare production equipment items held by the Company which are used to replace broken production equipment parts and help reduce the risk of prolonged equipment outages.
Other assets as of the fiscal years ended March 31 consisted of the following:
| (Amounts in thousands) | 2012 | 2013 | ||||||
| Investments in unconsolidated affiliates |
$ | 20,758 | $ | 22,012 | ||||
| Capitalized software development costs |
18,017 | 15,912 | ||||||
| Central parts |
9,436 | 10,386 | ||||||
| Deferred financing costs |
7,256 | 5,260 | ||||||
| Cash surrender value of officer life insurance |
7,529 | 403 | ||||||
| Deposits |
2,198 | 2,172 | ||||||
| Note receivable |
— | 1,200 | ||||||
| Other |
2,480 | 3,096 | ||||||
|
|
|
|
|
|||||
| Total other assets |
$ | 67,674 | $ | 60,441 | ||||
|
|
|
|
|
|||||
F-13
Table of Contents
The following table sets forth amortization expense in each of the fiscal years ending March 31:
| (Amounts in thousands) | 2011 | 2012 | 2013 | |||||||||
| Capitalized software development costs |
$ | 4,721 | $ | 4,875 | $ | 4,494 | ||||||
| Deferred financing costs |
2,073 | 1,935 | 1,996 | |||||||||
Foreign Currency Translation
Assets and liabilities of foreign subsidiaries with a functional currency other than the U.S. dollar are translated into U.S. dollars at the current rate of exchange on the last day of the reporting period. Revenues and expenses are translated at a monthly average exchange rate and equity transactions are translated using either the actual exchange rate on the day of the transaction or a monthly average exchange rate.
Net Sales
ADS recognizes Net sales when persuasive evidence of an agreement exists, delivery has occurred, the price to the buyer is fixed and determinable and collectability is reasonably assured.
ADS ships products to customers predominantly by internal fleet and to a lesser extent by third-party carriers. Sales, net of sales tax and allowances for returns, rebates and discounts are recognized from product sales when title to the products is passed to the customer, which generally occurs upon delivery.
Shipping costs
Shipping costs are incurred to physically move our products from the production or storage facility to our customers. Shipping costs for the fiscal years ended March 31, 2011, 2012 and 2013 were $97,758, $107,293 and $108,908, respectively, and are included in Cost of goods sold. All shipping costs billed to customers are included in Net sales.
Stock Based Compensation
ADS has several programs for stock based payments to employees and directors in accordance with FASB ASC Topic 718, Compensation — Stock Compensation. Equity-classified awards are measured based on the grant-date estimated fair value of each award, net of estimated forfeitures, and liability-classified awards are re-measured at their fair value, net of estimated forfeitures, at each reporting date for accounting purposes. Compensation expense is recognized over the employee’s requisite service period, which is generally the vesting period of the grant. The fair value of each stock option granted is estimated using the Black-Scholes option pricing model. Compensation expense is recorded for new awards and existing awards that are modified, repurchased, or forfeited. For details of our stock based compensation award programs, please see Note 18, Stock Compensation.
Research and Development
Research and development costs are expensed as incurred. Research and development costs are recorded in General and administrative expenses in the Consolidated Statements of Income and are immaterial for the fiscal years ended March 31, 2011, 2012 and 2013.
Advertising
We expense advertising costs as incurred. Advertising costs are recorded in Selling expenses in the Consolidated Statements of Income. The total advertising costs were $2,884, $2,666 and $2,732 for the fiscal years ended March 31, 2011, 2012 and 2013, respectively.
F-14
Table of Contents
Self Insurance
ADS is self-insured for workers’ compensation insurance with stop-loss coverage for claims that exceed $250 per incident up to the respective state statutory limits. Total claims expense was $1,215, $1,597 and $1,250 for the fiscal years ended March 31, 2011, 2012 and 2013, respectively. Management has established a reserve for claims incurred but not reported based on our estimate of future claims related to current operations.
The Company provides life, accidental death and dismemberment and medical coverage for substantially all eligible employees. The Company is self-insured for medical and compensation claims up to the individual and aggregate stop-loss coverage limits. The Company contributed $26,955, $29,101 and $29,969 to fund the plan for the fiscal years ended March 31, 2011, 2012 and 2013, respectively.
Income Taxes
Income taxes are accounted for under the asset and liability method. Deferred tax assets and liabilities are recognized and represent the future tax consequences attributable to differences between the financial statement carrying amounts of existing assets and liabilities and their respective tax bases. They are measured using the enacted tax rates expected to apply to taxable income in the years in which the related temporary differences are expected to be recovered or settled. The effect on deferred tax assets and liabilities of a change in tax rates is recognized in income in the period that includes the enactment date. The deferred income tax provision represents the change during the reporting period in the deferred tax assets and deferred tax liabilities. Penalties and interest recorded on income taxes payable are recorded as part of income taxes.
Fair Values
The fair value framework requires the categorization of assets and liabilities into three levels based upon the assumptions (inputs) used to price the assets or liabilities. Level 1 provides the most reliable measure of fair value, whereas Level 3 generally requires significant management judgment. The three levels are defined as follows:
Level 1 — Unadjusted quoted prices in active markets for identical assets and liabilities.
Level 2 — Observable inputs other than those included in Level 1. For example, quoted prices for similar assets or liabilities in active markets or quoted prices for identical assets or liabilities in inactive markets.
Level 3 — Unobservable inputs reflecting management’s own assumptions about the inputs used in pricing the asset or liability.
The carrying amounts of current assets and liabilities approximate their fair market value because of the immediate or short-term maturity of these financial instruments. Management believes the carrying amount on the long-term debt is not materially different from its fair value as the interest rates and terms of the borrowings are similar to currently available borrowings. The categorization of the framework used to evaluate this debt is considered Level 2.
Concentrations of Credit Risk
Financial instruments that potentially subject the Company to a concentration of credit risk consist principally of accounts receivable. The Company provides its products to customers based on an evaluation of the customers’ financial condition, generally without requiring collateral. Exposure to losses on receivables is principally dependent on each customer’s financial condition. The Company monitors the exposure for credit losses and maintains allowances for anticipated losses. Concentrations of credit risk with respect to accounts receivable are limited due to the large number of customers comprising the Company’s customer base and their dispersion across many different geographies. The Company performs ongoing credit evaluations of its customers.
F-15
Table of Contents
Leases
Leases are reviewed for capital or operating classification at their inception under the guidance of FASB ASC Topic 840, Leases. The Company uses its incremental borrowing rate in the assessment of lease classification and assumes the initial lease term includes renewal options that are reasonably assured. For leases classified as operating leases, we record rent expense on a straight-line basis, over the lease term beginning with the date the Company has access to the property which in some cases is prior to commencement of lease payments. Accordingly, the amount of rental expense recognized in excess of lease payments is recorded as a deferred rent liability and is amortized to rental expense over the remaining term of the lease. Capital leases as of March 31, 2012 and 2013 are not material.
Derivatives
We recognize derivative instruments as either assets or liabilities and measure those instruments at fair value. We use interest rate swaps, commodity options in the form of collars, and foreign currency forward contracts to manage our various exposures to interest rate, commodity price, and exchange rate fluctuations. These instruments do not qualify for hedge accounting treatment under ASC 810-15 and therefore, gains and losses from contract settlements and changes in fair value of the derivative instruments are recognized in Other miscellaneous (income) expense, net in the Consolidated Statements of Income. Our policy is to present all derivative balances on a gross basis.
Unaudited Supplemental Pro Forma Information
In January 2014, the Board of Directors declared a Special Dividend of $108,101, which was financed through our Revolving Credit Facility. Additionally, we anticipate using a portion of the net proceeds from the offering to repay a portion of the amount borrowed under the Revolving Credit Facility used to fund the Special Dividend. In accordance with the SEC Staff Accounting Bulletin (“SAB”) 1.B.3 and SAB 3.A, we are presented with two required calculations to present unaudited supplemental pro forma net income per share amounts, calculated in accordance with Article 11 of Regulation S-X, which will be included in the Consolidated Statement of Income for the Fiscal Year Ended March 31, 2014. These calculations include a methodology outlined in SAB 1.B.3 as a result of the Special Dividend which was declared in contemplation of the offering, which may be in excess of current period earnings, and the methodology outlined in SAB 3.A, as of the result of the anticipation of a portion of the net proceeds from the offering being used to repay our Revolving Credit Facility. These calculations may yield differing amounts. For the fiscal year ending March 31, 2014, we anticipate presenting the most dilutive of the two methods to calculate unaudited supplemental pro forma net income per share. See Note 23 for further details regarding the Special Dividend.
Recent Accounting Pronouncements
Fair value measurement — In May 2011, the FASB issued ASU No. 2011-04, Fair Value Measurement (Topic 820), which clarifies the measurement of fair value for certain assets and liabilities and expands the disclosure requirements for Level 3 fair value investments. The amendments in this ASU are intended to improve the comparability of fair value measurements presented and disclosed in financial statements prepared in accordance with U.S. GAAP and International Financial Reporting Standards (“IFRS”). ASU No. 2011-04 became effective for the Company in the fiscal year ending March 31, 2013. The adoption of the amended guidance did not have a material impact on the Company’s consolidated financial statements and related disclosures.
Comprehensive income: Presentation — In June 2011, the FASB issued ASU No. 2011-05, Comprehensive Income (Topic 220), accounting guidance related to the presentation of comprehensive income in ASC 220, Comprehensive Income. The objective of this ASU is to improve the comparability, consistency and transparency of financial reporting and to increase the prominence of items reported in other comprehensive
F-16
Table of Contents
income. Under this guidance, entities are required to report the components of net income and comprehensive income either in one continuous statement or in two separate but consecutive statements. The option to present items of other comprehensive income in the statement of changes in equity was eliminated. The guidance became effective for the Company in the fiscal year ending March 31, 2013. The Company elected to present the components of net income and other comprehensive income in the two statement format.
Comprehensive income: Reclassifications — In February 2013, the FASB issued ASU No. 2013-02, Comprehensive Income (Topic 220), accounting guidance related to the presentation of comprehensive income in ASC 220, Comprehensive Income. This ASU supersedes and replaces the presentation requirements for reclassifications out of accumulated other comprehensive income in ASU 2011-05, which were deferred indefinitely under ASU No. 2011-12, “Deferral of the Effective Date for Amendments to the Presentation of Reclassification of Items out of Accumulated Other Comprehensive Income in Accounting Standards Update No. 2011-05” which was issued in December 2011. The amendments in ASU 2013-02 would require an entity to provide additional information about reclassifications out of accumulated other comprehensive income by the respective line items of net income. For public entities, the provisions of this ASU became effective for reporting periods beginning after December 15, 2012. The Company elected to early adopt this ASU, and the amended guidance did not have a material impact on the Company’s consolidated financial statements and related disclosures.
| 2. | EQUITY RECAPITALIZATION |
On September 27, 2010, we completed a capital restructuring (“recapitalization”) of our minority equity ownership. As part of the recapitalization, 4,370 common shares owned by a minority stockholder were repurchased by ADS at a fair value price of $56.00 per share for a total of $244,708. The fair value price was established under a common stock purchase agreement based upon independent bids submitted by equity investors. The new minority equity investor agreed to purchase 5,833 shares at the $56.00 per share price for a total investment of $326,648, or $314,616 net of issuance costs. In addition, we purchased 1,982 common shares from other holders including investment trusts, educational institutions, management, and various other holders for a total of $111,002.
In conjunction with the change in equity ownership, we elected to reduce the investment risk for our Employee Stock Ownership Plan (“ESOP”) by diversifying a certain percentage of the allocated preferred stock shares, which were comprised exclusively of ADS stock. A total of 1,040, or 40%, of the allocated shares were purchased by ADS for a total of $44,800 from the ESOP and reinvested by the ESOP in various other financial investments.
The recapitalization was financed by the new equity contribution and a refinancing of our existing credit facility. The $190,000 Revolving Credit Facility, which was scheduled to mature in 2012, was replaced with a new five-year $265,000 facility, as well as a $100,000 term note. As part of the refinancing of the debt, the credit facility for ADS Mexicana was refinanced for $12,000 with the same maturity as the new ADS facility.
In connection with the recapitalization, the unsecured private placement serial notes due June 27, 2015, were retired by paying a total of $89,141. The payment included the outstanding principal and accrued interest of $79,668, along with a “make whole” interest payment of $9,473 required by the note agreement for calling the notes prior to the stated maturity. The additional interest payment is included in Interest expense for the fiscal year ended March 31, 2011.
The remaining funds for the completion of the recapitalization were provided by a draw of $75,000 in senior promissory notes (“Senior Notes”) under the 2009 agreement with Prudential Investment Management, Inc.
F-17
Table of Contents
| 3. | SALE OF ASSETS/BUSINESSES |
On November 21, 2011, we entered into an asset purchase agreement (the “ISI Agreement”) to sell our septic chamber business to Infiltrator Systems, Inc. (“ISI”). The ISI Agreement defined the purchase price to consist of a cash payment of $40,000 (to be adjusted for the change in inventory value from the signing date to closing date), plus other consideration in the form of various future benefits (primarily reduced costs) provided to ADS as a result of amendments to existing supply agreements (“Intellectual Property Agreement” and “Manufacturing Agreement”) and the execution of a new Septic Chamber Distribution Agreement. The existing supply agreements resulted from the purchase of StormTech, LLC (“StormTech”) in 2010. The Septic Chamber Distribution Agreement allows ADS to continue to sell Biodiffuser and Arc chambers as a nonexclusive distributor, but provides purchase discounts and a rebate. The sale transaction closed on January 17, 2012.
At closing, we received a cash payment of $38,953 (adjusted for the change in inventory value). The amended Intellectual Property Agreement reduced the royalty rate on sales of StormTech chambers from 4% to 0%. Our liability for royalties owed to ISI as part of the purchase of StormTech was $11,317 as of the closing date. The fair values for the amended Manufacturing Agreement (reduced cost of StormTech chambers purchased by ADS from ISI) and the Septic Chamber Distribution Agreement (reduced costs for chamber purchases, plus a rebate) were determined by management with the assistance of an independent third-party valuation firm. The values established for the Manufacturing Agreement and Septic Chamber Distribution Agreement were $3,600 and $7,600, respectively. Consequently, the total consideration received from the sale of the septic chamber business amounted to $61,470. The net book value for the related assets, consisting of inventory, property, and equipment, and patents, was $13,116. As part of the transaction the Company wrote off $3,720 in goodwill, bringing the net gain recognized to $44,634. We also incurred $1,823 in transaction costs related to the sale of the business, which is recorded in General and administrative expenses. The values for the Manufacturing Agreement and the Septic Chamber Distribution Agreement are recorded in intangible assets and will be amortized ratably over the seven year term of the agreements.
Our continuing involvement with the septic chamber business precludes classification of these transactions as discontinued operations.
On December 21, 2012, we entered into an asset purchase agreement (the “Basalite Agreement”) to sell substantially all of the assets used in connection with our plastic edging product line to Basalite Concrete Products, LLC (“Basalite”) in exchange for cash and a note receivable. The Basalite Agreement defined the purchase price to consist of a cash payment of $600, plus other consideration in the form of an executed promissory note for $1,800. Under terms of the note, Basalite will pay ADS $600 cash on each of the first three one-year anniversaries of the closing date. The net book value for the related assets, consisting of inventory and property and equipment, was $190 bringing the net gain recognized to $2,210. The sale transaction closed on December 28, 2012.
| 4. | ACQUISITIONS |
The purchase price for business combinations is allocated to the estimated fair values of acquired tangible and intangible assets and assumed liabilities, including goodwill, where applicable. Additionally, we generally recognize customer relationships, trademarks and non-competition agreements as identifiable intangible assets. The assets are recorded at fair value as of the transaction date. The fair value of these intangibles is determined primarily using the income approach, which involves significant unobservable inputs (Level 3 inputs). These inputs include projected sales, margin, required rate of return and tax rate.
Fiscal 2011 Acquisitions
On April 1, 2010, we acquired the accounts receivable, inventory, equipment, and intangible assets related to the concrete pipe manufacturing operation of Foltz Concrete, LLC (“Foltz”) to grow our market share.
F-18
Table of Contents
The purchase price of Foltz was $9,717. The acquisition was financed through our existing line of credit facility. The results of operations of Foltz are included in our Consolidated Statements of Income as of April 1, 2010 and thereafter. The revenue and net income of Foltz since the acquisition date in our Consolidated Statements of Income for the fiscal year ended March 31, 2011 were $5,654 and $(679), respectively.
The purchase price allocation to the tangible and intangible assets is finalized and was determined based on fair market value. The assets acquired at the date of acquisition are summarized as follows:
| (Amounts in thousands) | ||||
| Accounts receivable |
$ | 396 | ||
| Inventory |
413 | |||
| Equipment |
6,806 | |||
| Intangible asset |
1,216 | |||
| Operating supplies |
44 | |||
| Goodwill |
842 | |||
|
|
|
|||
| Total assets acquired |
$ | 9,717 | ||
|
|
|
|||
The acquired intangible assets represent customer lists of $1,216 (seven-year useful life). The $842 of goodwill is deductible for tax purposes.
On July 1, 2010, we purchased all issued and outstanding shares of stock of Sewer Tap, Inc., doing business as Inserta Tee and acquired all assets (except cash) and all current liabilities of Inserta Tee to grow our market share. Inserta Tee designs, engineers, manufactures, markets, and sells a comprehensive line of watertight fittings used in storm, sanitary, and electrical applications. The purchase price of the Inserta Tee was $7,502, which was financed through our existing line of credit facility, plus additional contingent consideration with an estimated fair value of $996. The contingent consideration is comprised of royalty payments on future Inserta Tee sales to the previous owner through June 30, 2017, which we have agreed to pay. The agreement stipulates that 6% is paid on all covered product sales. In accordance with ASC 805, as of March 31, 2011, the contingent consideration was remeasured to fair market value of $1,332, of which $1,128 is recorded in other long-term liabilities at March 31, 2011. Management of the Company believes that the estimated amount is reasonable based on projections of future sales and assumptions known as of March 31, 2011.
The results of operations of Inserta Tee are included in our Consolidated Statements of Income as of July 1, 2010 and thereafter. The revenue and net income of Inserta Tee since the acquisition date in our Consolidated Statements of Income for the fiscal year ended March 31, 2011 were $2,200 and $484, respectively.
F-19
Table of Contents
The purchase price allocated to the tangible and intangible assets is finalized. The consideration paid for Inserta Tee and the allocation of the fair value of assets acquired and liabilities assumed as of March 31, 2011, are as follows:
| (Amounts in thousands) | ||||
| Consideration |
||||
| Cash paid |
$ | 7,502 | ||
| Estimated fair value of contingent consideration |
996 | |||
|
|
|
|||
| Total consideration for acquisition of InsertaTee |
$ | 8,498 | ||
| Recognized Amounts of Identifiable Assets Acquired and Liabilities Assumed |
||||
| Accounts receivable |
$ | 319 | ||
| Inventory |
190 | |||
| Equipment |
460 | |||
| Other assets |
4 | |||
| Customer listing |
961 | |||
| Intangible assets |
2,960 | |||
| Goodwill |
3,671 | |||
|
|
|
|||
| Total assets acquired |
8,565 | |||
| Accounts payable |
67 | |||
|
|
|
|||
| Total liabilities acquired |
67 | |||
|
|
|
|||
| Net assets acquired |
$ | 8,498 | ||
|
|
|
|||
The value of the contingent consideration related to this acquisition as of March 31 is as follows:
| (Amounts in thousands) | 2011 | 2012 | 2013 | |||||||||
| Inserta Tee |
$ | 1,332 | $ | 1,333 | $ | 1,064 | ||||||
The acquired intangible assets represent customer lists of $961 (seven-year useful life), developed technology of $1,511 (ten-year useful life), employee agreements of $176 (seven-year useful life), and trademarks of $1,273 (indefinite life). The $3,671 of goodwill is deductible for tax purposes.
We had other acquisitions which totaled $3,080 of aggregate purchase price in fiscal year 2011.
Fiscal 2012 Acquisitions
On February 9, 2012, we acquired the operating assets of the postconsumer recycled raw material processing operation of Corkery Industries, Inc. (“Corkery”) to enhance the supply of nonvirgin resin in our Midwest region, thereby reducing the risk of future supply disruption. The purchase price of Corkery was $6,225 in cash. The acquisition was financed through our existing line of credit facility. The results of operations of Corkery are included in our Consolidated Statements of Income as of February 9, 2012 and thereafter. The revenue and net income of Corkery since the acquisition date included in our Consolidated Statements of Income for the fiscal year ended March 31, 2012 were immaterial.
The purchase price allocation to the net assets was finalized and determined based on fair value. The net assets acquired at the date of acquisition are summarized as follows:
| (Amounts in thousands) | ||||
| Inventory |
$ | 395 | ||
| Equipment |
1,897 | |||
| Intangible assets |
3,920 | |||
| Goodwill |
13 | |||
|
|
|
|||
| Total net assets acquired |
$ | 6,225 | ||
|
|
|
|||
F-20
Table of Contents
The acquired intangible assets represent developed technology of $769 (10-year useful life), noncompete agreements of $360 (five-year useful life), and vendor relationships of $2,791 (seven-year useful life). The $13 of goodwill is deductible for tax purposes.
On March 9, 2012, we acquired the operating assets of the high-density polyethylene (“HDPE”) pipe business of Quality Culvert, Inc. (“Quality”), to grow our market share. The purchase price of the Quality was $39,000 in cash. The acquisition was financed through our existing line of credit facility. The results of operations of Quality are included in our Consolidated Statements of Income as of March 9, 2012 and thereafter. The revenue and net income of Quality since the acquisition date in our Consolidated Statements of Income for the fiscal year ended March 31, 2012 was immaterial.
The purchase price allocation to the net assets was finalized and determined based on fair value. The net assets acquired at the date of acquisition are summarized as follows:
| (Amounts in thousands) | ||||
| Equipment |
$ | 8,419 | ||
| Intangible assets |
14,090 | |||
| Goodwill |
16,491 | |||
|
|
|
|||
| Total net assets acquired |
$ | 39,000 | ||
|
|
|
|||
The acquired intangible assets represent customer relationships of $10,200 (seven-year useful life), developed technology of $2,800 (10-year useful life), and noncompete agreements of $1,090 (five-year useful life). The $16,491 of goodwill is deductible for tax purposes.
Fiscal 2013 Acquisitions
In fiscal year 2013, we completed the acquisition of two businesses that individually and in the aggregate were not significant. The aggregate purchase price of these acquisitions was $5,239, which included a note payable of $400 plus additional contingent consideration with an initial estimated fair value of $1,271. The consolidated financial statements include the results of operations from these business combinations from the date of each acquisition.
The following table contains unaudited pro forma Consolidated Statements of Income information assuming the acquisitions of Quality, Corkery, Inserta Tee and other 2011 acquisitions occurred on April 1, 2010 and includes adjustments for amortization of intangibles and interest expense. This pro forma information is presented for illustrative purposes only and is not indicative of what actual results would have been if the acquisitions had taken place on April 1, 2010 or of future results.
| (Amounts in thousands) | 2011 | 2012 | ||||||
| Net sales |
$ | 894,474 | $ | 1,041,960 | ||||
| Net income attributable to ADS |
6,948 | 43,739 | ||||||
Unaudited pro forma net income attributable to ADS has been calculated after adjusting the combined results of the Company to reflect additional intangible asset amortization expense, net of related income taxes, of $1,777 and additional interest expense, net of related income taxes, of $1,254 for the fiscal year ended March 31, 2011. Unaudited pro forma net income attributable to ADS has been calculated after adjusting the combined results of the Company to reflect additional intangible asset amortization expense, net of related income taxes, of $1,278 and additional interest expense, net of related income taxes, of $1,101 for the fiscal year ended March 31, 2012.
In fiscal years ended March 31, 2011 and 2012, we incurred $644 and $2,092 of transaction costs, respectively. In the fiscal year ended March 31, 2013, transaction costs were immaterial. These costs are
F-21
Table of Contents
included in General and administrative expenses in our Consolidated Statements of Income. The transaction costs for the fiscal year ended March 31, 2012 by transaction were as follows:
| (Amounts in thousands) | 2012 | |||
| Sale of septic chamber business (Note 3) |
$ | 1,823 | ||
| Quality |
187 | |||
| Corkery |
82 | |||
|
|
|
|||
| Total transaction costs |
$ | 2,092 | ||
|
|
|
|||
| 5. | PROPERTY, PLANT, AND EQUIPMENT |
Property, plant and equipment — net as of the fiscal years ended March 31 consisted of the following:
| (Amounts in thousands) | 2012 | 2013 | ||||||
| Land, buildings and improvements |
$ | 143,208 | $ | 149,974 | ||||
| Machinery and equipment |
464,067 | 504,853 | ||||||
|
|
|
|
|
|||||
| Total cost |
607,275 | 654,827 | ||||||
| Less accumulated depreciation |
(322,544 | ) | (359,926 | ) | ||||
|
|
|
|
|
|||||
| Property, plant and equipment — net |
$ | 284,731 | $ | 294,901 | ||||
|
|
|
|
|
|||||
The following table sets forth depreciation expense in each of the fiscal years ending March 31:
| (Amounts in thousands) | 2011 | 2012 | 2013 | |||||||||
| Depreciation expense |
$ | 43,723 | $ | 41,742 | $ | 37,490 | ||||||
| 6. | INVENTORIES |
Inventories as of the fiscal years ended March 31 consisted of the following:
| (Amounts in thousands) | 2012 | 2013 | ||||||
| Raw materials |
$ | 35,286 | $ | 45,455 | ||||
| Finished goods |
161,391 | 186,954 | ||||||
|
|
|
|
|
|||||
| Total inventory |
$ | 196,677 | $ | 232,409 | ||||
|
|
|
|
|
|||||
We had no work-in-process inventories as of March 31, 2012 and 2013.
| 7. | GOODWILL AND INTANGIBLE ASSETS |
Goodwill
The carrying amount of goodwill by reportable segment is as follows:
| (Amounts in thousands) | Domestic | International | Total | |||||||||
| Balance at April 1, 2011 |
$ | 72,918 | $ | — | $ | 72,918 | ||||||
| Acquisitions |
16,504 | — | 16,504 | |||||||||
| Divestitures |
(3,720 | ) | — | (3,720 | ) | |||||||
|
|
|
|
|
|
|
|||||||
| Balance at March 31, 2012 |
85,702 | — | 85,702 | |||||||||
| Acquisitions |
— | 532 | 532 | |||||||||
| Currency translation |
— | 25 | 25 | |||||||||
|
|
|
|
|
|
|
|||||||
| Balance at March 31, 2013 |
$ | 85,702 | $ | 557 | $ | 86,259 | ||||||
|
|
|
|
|
|
|
|||||||
F-22
Table of Contents
Intangible Assets
As discussed in Note 1, in April 2011, the Company recharacterized the Hancor trademark previously classified as indefinite lived since 2005, to definite lived based on management’s decision to discontinue the use of the trademark over the next 15 years.
Intangible assets as of the fiscal years ended March 31, 2012 and 2013 consisted of the following:
| (Amounts in thousands) | 2012 | 2013 | ||||||||||||||||||||||
| Gross Intangible |
Accumulated Amortization |
Net Intangible |
Gross Intangible |
Accumulated Amortization |
Net Intangible |
|||||||||||||||||||
| Definite-lived intangible assets |
||||||||||||||||||||||||
| Developed technology |
$ | 40,579 | $ | (14,955 | ) | $ | 25,624 | $ | 40,579 | $ | (18,773 | ) | $ | 21,806 | ||||||||||
| Customer lists |
39,252 | (12,277 | ) | 26,975 | 39,252 | (17,178 | ) | 22,074 | ||||||||||||||||
| Patents |
5,740 | (4,422 | ) | 1,318 | 5,669 | (2,293 | ) | 3,376 | ||||||||||||||||
| Contract agreements |
13,059 | (497 | ) | 12,562 | 11,493 | (2,320 | ) | 9,173 | ||||||||||||||||
| Trademarks |
12,931 | (950 | ) | 11,981 | 12,857 | (2,585 | ) | 10,272 | ||||||||||||||||
|
|
|
|
|
|
|
|
|
|
|
|
|
|||||||||||||
| Total definite-lived intangible assets |
111,561 | (33,101 | ) | 78,460 | 109,850 | (43,149 | ) | 66,701 | ||||||||||||||||
| Indefinite-lived intangible assets |
||||||||||||||||||||||||
| Trademarks |
11,773 | 11,773 | 12,016 | 12,016 | ||||||||||||||||||||
|
|
|
|
|
|
|
|
|
|
|
|
|
|||||||||||||
| Total intangible assets |
$ | 123,334 | $ | (33,101 | ) | $ | 90,233 | $ | 121,866 | $ | (43,149 | ) | $ | 78,717 | ||||||||||
|
|
|
|
|
|
|
|
|
|
|
|
|
|||||||||||||
The following table presents the weighted average amortization period for definite-lived intangible assets at March 31, 2013:
| Weighted Average Amortization Period (in years) |
||||
| Definite-lived intangible assets |
||||
| Developed technology |
10.7 | |||
| Customer lists |
8.4 | |||
| Patents |
9.2 | |||
| Contract agreements |
6.8 | |||
| Trademarks |
15.0 | |||
The following table sets forth amortization expense in each of the fiscal years ended March 31:
| (Amounts in thousands) | 2011 | 2012 | 2013 | |||||||||
| Amortization expense |
$ | 12,052 | $ | 13,429 | $ | 18,115 | ||||||
The following table presents the future intangible asset amortization expense based on existing intangible assets at March 31, 2013:
| Fiscal Year | ||||||||||||||||||||||||||||
| (Amounts in thousands) | 2014 | 2015 | 2016 | 2017 | 2018 | Thereafter | Total | |||||||||||||||||||||
| Amortization Expense |
$ | 11,895 | $ | 11,256 | $ | 8,985 | $ | 7,903 | $ | 6,860 | $ | 19,802 | $ | 66,701 | ||||||||||||||
| 8. | FAIR VALUE MEASUREMENT |
When applying fair value principles in the valuation of assets and liabilities, we are required to maximize the use of quoted market prices and minimize the use of unobservable inputs. The Company has not
F-23
Table of Contents
changed its valuation techniques used in measuring the fair value of any financial assets or liabilities during the fiscal years presented. Our fair value estimates take into consideration the credit risk of both the Company and our counterparties.
When active market quotes are not available for financial assets and liabilities, we use industry standard valuation models. Where applicable, these models project future cash flows and discount the future amounts to a present value using market-based observable inputs including credit risk, interest rate curves, foreign currency rates and forward and spot prices for currencies. In circumstances where market-based observable inputs are not available, management judgment is used to develop assumptions to estimate fair value. Generally, the fair value of our Level 3 instruments is estimated as the net present value of expected future cash flows based on internal and external inputs.
Recurring Fair Value Measurements
The assets, liabilities and mezzanine equity carried at fair value as of the fiscal years ended March 31 were as follows:
| 2012 | ||||||||||||||||
| (Amounts in thousands) | Total | Level 1 | Level 2 | Level 3 | ||||||||||||
| Assets: |
||||||||||||||||
| Derivative assets — diesel fuel contracts |
$ | 272 | $ | — | $ | 272 | $ | — | ||||||||
|
|
|
|
|
|
|
|
|
|||||||||
| Total assets at fair value on a recurring basis |
$ | 272 | $ | — | $ | 272 | $ | — | ||||||||
|
|
|
|
|
|
|
|
|
|||||||||
| Liabilities & Mezzanine Equity: |
||||||||||||||||
| Derivative liability — interest rate swaps |
$ | 1,303 | $ | — | $ | 1,303 | $ | — | ||||||||
| Derivative liability — currency forwards |
44 | — | 44 | — | ||||||||||||
| Contingent consideration for acquisitions |
1,333 | — | — | 1,333 | ||||||||||||
| Redeemable Common Stock |
482,006 | — | — | 482,006 | ||||||||||||
| Redeemable Convertible Preferred Stock |
264,429 | — | — | 264,429 | ||||||||||||
| Deferred compensation — unearned ESOP shares |
(188,872 | ) | — | — | (188,872 | ) | ||||||||||
|
|
|
|
|
|
|
|
|
|||||||||
| Total liabilities and mezzanine equity at fair value on a recurring basis |
$ | 560,243 | $ | — | $ | 1,347 | $ | 558,896 | ||||||||
|
|
|
|
|
|
|
|
|
|||||||||
| 2013 | ||||||||||||||||
| (Amounts in thousands) | Total | Level 1 | Level 2 | Level 3 | ||||||||||||
| Assets: |
||||||||||||||||
| Derivative assets — diesel fuel contracts |
$ | 55 | $ | — | $ | 55 | $ | — | ||||||||
|
|
|
|
|
|
|
|
|
|||||||||
| Total assets at fair value on a recurring basis |
$ | 55 | $ | — | $ | 55 | $ | — | ||||||||
|
|
|
|
|
|
|
|
|
|||||||||
| Liabilities & Mezzanine Equity: |
||||||||||||||||
| Derivative liability — interest rate swaps |
$ | 1,082 | $ | — | $ | 1,082 | $ | — | ||||||||
| Derivative liability — currency forwards |
3 | — | 3 | — | ||||||||||||
| Contingent consideration for acquisitions |
2,535 | — | — | 2,535 | ||||||||||||
| Redeemable Common Stock |
522,276 | — | — | 522,276 | ||||||||||||
| Redeemable Convertible Preferred Stock |
282,547 | — | — | 282,547 | ||||||||||||
| Deferred compensation — unearned ESOP shares |
(196,477 | ) | — | — | (196,477 | ) | ||||||||||
|
|
|
|
|
|
|
|
|
|||||||||
| Total liabilities and mezzanine equity at fair value on a recurring basis |
$ | 611,966 | $ | — | $ | 1,085 | $ | 610,881 | ||||||||
|
|
|
|
|
|
|
|
|
|||||||||
F-24
Table of Contents
Changes in the fair value of recurring fair value measurements using significant unobservable inputs (Level 3) for the fiscal years ended March 31, 2012 and 2013 were as follows (amounts in thousands):
| Balance as of April 1, 2011 |
$ | 495,006 | ||
| Change in estimate of contingent consideration |
1 | |||
| Allocation of ESOP shares to participants |
5,481 | |||
| Redemption of Redeemable Convertible Preferred Stock |
(3,579 | ) | ||
| Reclassification of common stock to Redeemable Common Stock |
252 | |||
| Change in fair value related to items recorded in mezzanine equity |
61,735 | |||
|
|
|
|||
| Balance as of March 31, 2012 |
558,896 | |||
|
|
|
|||
| Change in estimate of contingent consideration |
(269 | ) | ||
| Contingent consideration recognized for 2013 acquisition |
1,471 | |||
| Allocation of ESOP shares to participants |
7,675 | |||
| Redemption of Redeemable Convertible Preferred Stock |
(3,031 | ) | ||
| Change in fair value related to items recorded in mezzanine equity |
46,139 | |||
|
|
|
|||
| Balance as of March 31, 2013 |
$ | 610,881 | ||
|
|
|
For the fiscal years ended March 31, 2012 and 2013 there were no transfers in or out of Levels 1, 2, and 3.
Valuation of our Contingent Consideration for Acquisitions
The fair values of the contingent consideration payables were calculated with reference to the estimated future value of the Inserta Tee and Flexstorm businesses, which are based on a discounted cash flow model. The undiscounted value is discounted at the present value using a market discount rate. The categorization of the framework used to price this liability is considered a Level 3, due to the subjective nature of the unobservable inputs used to determine the fair value.
Valuation of our Redeemable Common Stock
The Company has certain shares of common stock outstanding whereby the holder may put its shares to us for cash. This Redeemable Common Stock is recorded at its fair value in the mezzanine equity section of our Consolidated Balance Sheets and changes in fair value are recorded in Retained earnings. Historically, the fair value of a share of common stock was determined by Management by applying industry-appropriate multiples to EBITDA and performing a discounted cash flow analysis. Under the industry-appropriate multiples approach, to arrive at concluded multiples, we considered differences between the risk and return characteristics of ADS and the guideline companies. Under the discounted cash flow analysis, the cash flows expected to be generated by the Company are discounted to their present value equivalent using a rate of return that reflects the relative risk of an investment in ADS, as well as the time value of money. This return is an overall rate based upon the individual rates of return for invested capital (equity and interest-bearing debt). The return, known as the weighted average cost of capital (“WACC”), is calculated by weighting the required returns on interest-bearing debt and common stock in proportion to their estimated percentages in an expected capital structure. The WACC used was 12.5% as of March 31, 2012 and 2013. An increase in the WACC would decrease the fair value of the Redeemable Common Stock. The categorization of the framework used to price this temporary equity is considered a Level 3, due to the subjective nature of the unobservable inputs used to determine the fair value.
Valuation of our Redeemable Convertible Preferred Stock
The Trustee of the Company’s ESOP has the ability to put the shares of our Redeemable Convertible Preferred Stock to the Company. Our Redeemable Convertible Preferred Stock is recorded at its fair value in the mezzanine equity section of our Consolidated Balance Sheets and changes in fair value are recorded in
F-25
Table of Contents
Retained earnings. Accordingly, we estimated the fair value of the Redeemable Convertible Preferred Stock through estimating the fair value of the Company’s common stock and applying certain adjustments including for the fair value of the total dividends to be received and assuming conversion of the preferred stock to common stock at the stated conversion ratio per our Articles of Incorporation. The categorization of the framework used to price this temporary equity is considered a Level 3, due to the subjective nature of the unobservable inputs used to determine the fair value.
Please refer to Note 17, Mezzanine Equity, for additional information on the Redeemable Common Stock and Redeemable Convertible Preferred Stock.
Nonrecurring Fair Value Measurements
Goodwill and indefinite lived intangible assets are tested for impairment annually as of March 31 or whenever events or changes in circumstances indicate the carrying value may be greater than fair value. Note 1 discusses the valuation techniques, including the estimates and assumptions used in those valuations, used to value the goodwill and indefinite lived intangibles. As discussed in Note 1, when the Company recharacterized the Hancor trademark previously classified as indefinite lived to definite lived, an impairment charge of $3,200 was recorded, resulting in the carrying value of the trademark being reduced, and thus equal, to the estimated fair value of $11,947. The categorization of the framework used to price these assets is considered a Level 3, due to the subjective nature of the unobservable inputs used to determine the fair value.
| 9. | VARIABLE INTEREST ENTITIES |
The accounting model for VIEs described in ASC 810-10 considers if a company has a controlling financial interest in a VIE. A controlling financial interest will have both (a) the power to direct the activities of a VIE that most significantly impact the VIE’s economic performance and (b) the obligation to absorb losses of a VIE that could potentially be significant to the VIE or the right to receive benefits from the VIE that could be potentially significant to the VIE. Entities are required to consolidate a VIE when it is determined that they have a controlling financial interest in a VIE and therefore, are the primary beneficiary of that VIE. In determining whether we are the primary beneficiary of a VIE, we consider factors such as voting rights including kick-out rights, whether we have the power to direct the VIE’s significant activities, variable interests held by related parties and other factors. We believe that significant assumptions and judgments were applied consistently.
We participate in joint ventures from time to time for the purpose of expanding upon our growth of manufacturing and selling HDPE corrugated pipe in emerging markets. Our investments in these joint ventures may create a variable interest in a VIE, depending upon the contractual terms of the arrangement. One of our joint ventures, ADS Mexicana, in which we own 50% controlling interest, was determined to be a VIE. We invest in this VIE for the purpose of expanding upon our growth of manufacturing and selling ADS licensed HDPE corrugated pipe and related products in the Mexican and Central American markets via the joint venture partner’s local presence and expertise throughout the region. We have executed a Technology, Patents and Trademarks Sub-License Agreement and a Distribution Agreement with ADS Mexicana that provides ADS Mexicana with the rights to manufacture and sell ADS licensed products in Mexico and Central America. We are the guarantor of 100% of ADS Mexicana’s credit facility and our maximum potential payment under this guarantee totals $12,000. We have concluded that we hold a variable interest in and are the primary beneficiary of ADS Mexicana based on our power to direct the most significant activities of ADS Mexicana and our obligation to absorb losses and our right to receive benefits that could be significant to ADS Mexicana. As the primary beneficiary, we are required to consolidate the assets and liabilities of ADS Mexicana. The equity owned by our joint venture partner is shown as Noncontrolling interest in subsidiaries in our Consolidated Balance Sheets and our joint venture partner’s portion of net income is shown as Net income attributable to noncontrolling interest in our Consolidated Statements of Income.
F-26
Table of Contents
The table below includes the assets and liabilities of ADS Mexicana that are consolidated as of March 31, 2012 and 2013. The balances exclude intercompany transactions that are eliminated upon consolidation.
| (Amounts in thousands) | ||||||||
| 2012 | 2013 | |||||||
| Assets |
||||||||
| Current assets |
$ | 31,691 | $ | 33,252 | ||||
| Property, plant and equipment, net |
21,616 | 23,655 | ||||||
| Other noncurrent assets |
2,261 | 3,144 | ||||||
|
|
|
|
|
|||||
| Total assets |
$ | 55,568 | $ | 60,051 | ||||
|
|
|
|
|
|||||
| 2012 | 2013 | |||||||
| Liabilities |
||||||||
| Current liabilities |
$ | 7,338 | $ | 9,777 | ||||
| Noncurrent liabilities |
5,184 | 2,283 | ||||||
|
|
|
|
|
|||||
| Total liabilities |
$ | 12,522 | $ | 12,060 | ||||
|
|
|
|
|
|||||
| 10. | INVESTMENT IN UNCONSOLIDATED AFFILIATES |
We participate in one unconsolidated joint venture, Tuberias Tigre — ADS Limitada (“Tigre ADS”), which is 50%-owned by ADS Chile. ADS Chile is a wholly-owned subsidiary of ADS. Our investment in this unconsolidated joint venture was formed for the purpose of expanding upon our growth of manufacturing and selling HDPE corrugated pipe in the South American market via the joint venture partner’s local presence and expertise throughout the region. We are the guarantor for 50% of Tigre ADS’ credit facility, and the debt guarantee is shared equally with the joint venture partner. Our maximum potential payment under this guarantee totals $7,000. We are not required to consolidate Tigre ADS under ASC 810-10 as we are not the primary beneficiary, although we do hold a significant variable interest in Tigre ADS through our equity investment and debt guarantee. The results of Tigre ADS are accounted for in the consolidated financial statements using the equity method of accounting. Our share of the income of this joint venture is reported in the Consolidated Statements of Income under Equity in net income of unconsolidated affiliates. Our investment in this joint venture is included in Other assets in the Consolidated Balance Sheets.
Summarized financial data as of the fiscal years ended March 31 for the Tigre ADS joint venture is as follows:
| 2012 | 2013 | |||||||||||||||
| (Amounts in thousands) | As reported on Balance Sheet |
Maximum Exposure |
As reported on Balance Sheet |
Maximum Exposure |
||||||||||||
| Investment in Tigre ADS |
$ | 20,758 | $ | 20,758 | $ | 22,012 | $ | 22,012 | ||||||||
| Receivable from Tigre ADS |
3,512 | 3,512 | 8,113 | 8,113 | ||||||||||||
| ADS’ Guarantee of Tigre ADS Debt |
— | 7,000 | — | 7,000 | ||||||||||||
F-27
Table of Contents
| 11. | DEBT |
Long-term debt as of the fiscal years ended March 31 consisted of the following:
| (Amounts in thousands) | 2012 | 2013 | ||||||
| a. Bank term loans: |
||||||||
| Revolving Credit Facility — ADS |
$ | 192,400 | $ | 186,100 | ||||
| Revolving Credit Facility — ADS Mexicana |
3,500 | 1,000 | ||||||
| Term note |
87,500 | 77,500 | ||||||
| b. Senior Notes payable |
75,000 | 75,000 | ||||||
| c. Mortgage notes payable |
4,667 | 4,200 | ||||||
| d. Industrial revenue bonds |
7,605 | 6,190 | ||||||
|
|
|
|
|
|||||
| Total |
370,672 | 349,990 | ||||||
| Current maturities |
(11,882 | ) | (11,942 | ) | ||||
|
|
|
|
|
|||||
| Long-term debt obligation |
$ | 358,790 | $ | 338,048 | ||||
|
|
|
|
|
|||||
| a. | Revolving Credit Facility: |
The current ADS Revolving Credit Facility (the “Revolving Credit Facility”) was implemented in 2010 and expires in September 2015. In December of 2011, we amended the agreement to reflect reduced interest spreads as a result of current market conditions and our leverage profile.
The amended agreement kept the upper limit of the Revolving Credit Facility at $265,000 for ADS and $12,000 for ADS Mexicana. The original $100,000 term note with a $2,500 principal payment due on the first day of every calendar quarter has a March 31, 2013, balance of $77,500. Both the Revolving Credit Facility and the term note share the same interest rate structure.
We are required to manage our interest exposure using an interest rate swap for a minimum of 50% of the variable rate debt. On October 7, 2010, we executed two spot interest rate swaps on the 90-day London InterBank Offered Rate (“LIBOR”) interest rate. One hedge relates to the $100,000 term debt and the fixed rate swap is 1.105% for a period of four years, expiring on September 1, 2014. The original $100,000 swap with a $2,500 notional reduction on the first day every calendar quarter has a March 31, 2013, value of $77,500. The second hedge is for $50,000 on the Revolving Credit Facility for a period of three years at a spot rate of 0.89% and expires on September 1, 2013. Applicable pricing spreads will apply to each of these spot rates.
The interest rate is variable and depends upon our “pricing ratio.” The interest rate is derived from the LIBOR or alternate base rate (prime rate) based upon our option. The average rate at March 31, 2013, was 3.014%. Any letters of credit outstanding reduce the availability on the revolver. We had outstanding letters of credit in the amount of $8,505 at March 31, 2013. The amount available for borrowing was $70,395, plus $11,000 in indebtedness outstanding under a separate revolving credit facility with our subsidiary, ADS Mexicana, at March 31, 2013.
| b. | Senior Notes payable: |
In December 2009, we signed an agreement with Prudential Investment Management, Inc., for the issuance of senior promissory notes (“Senior Notes”), for an aggregate amount of up to $100,000. We may make requests for purchases of the Senior Notes during the “Issuance Period,” defined as a three-year period beginning with the date of the agreement. The minimum purchase amount of Senior Notes is $10,000. Each Senior Note issued has a maximum term of no more than 10 years from the date of issuance. As part of the recapitalization in 2010, we drew $75,000. Interest is payable quarterly and is fixed at 5.6%. The rate is subject to an additional 200 basis point excess
F-28
Table of Contents
leverage fee if calculated leverage exceeds 3 to 1. A principal payment of $25,000 is due in each of fiscal years 2017, 2018, and 2019.
| c. | Mortgage notes payable: |
Two mortgage notes payable require monthly installments through 2015. One note has a variable interest rate of 2.454% at March 31, 2013 (New Miami, Ohio), and one note has a fixed rate of 5.1% (Hilliard, Ohio). In January 2012, a third mortgage was paid off (Ludlow, Massachusetts) at 6%. Land and buildings with a net book value of approximately $8,398 at March 31, 2013, collateralize the two mortgage notes.
| d. | Industrial revenue bonds: |
We issued industrial revenue bonds for the construction of four production facilities. The original bond values of $27,300 require periodic principal and interest payments through 2019. During fiscal year 2011, two of the four bonds were retired, leaving a remaining combined principal of $6,190 at March 31, 2013. The interest rates on the two remaining bonds are variable and are computed on a weekly basis. These bonds are not considered auction rate securities. The average rate on these bonds at March 31, 2013, was 4.435%, including a letter of credit fee of 4.25%. Land and buildings with a net book value of approximately $15,294 at March 31, 2013, collateralize the bonds.
The Revolving Credit Facility agreement and the Senior Notes require, among other provisions, that we (1) maintain a minimum fixed charge ratio; (2) maintain a minimum leverage ratio; and (3) establish certain limits on permitted transactions, principally for indebtedness, capital distributions, loans and investments, and acquisitions and dispositions of assets. Capital distributions are limited to $50 million in any fiscal year if the pro-forma leverage ratio exceeds 3.0 to 1.
Maturities of long-term debt (excluding interest) as of March 31, 2013 are summarized below (amounts in thousands):
| Fiscal Years Ending March 31, | ||||||||||||||||||||||||||||
| (Amounts in thousands) | 2014 | 2015 | 2016 | 2017 | 2018 | Thereafter | Total | |||||||||||||||||||||
| Principal maturities |
$ | 11,942 | $ | 14,903 | $ | 245,430 | $ | 25,870 | $ | 25,905 | $ | 25,940 | $ | 349,990 | ||||||||||||||
| 12. | DERIVATIVE TRANSACTIONS |
The Company uses interest rate swaps, commodity options in the form of collars, and foreign currency forward contracts to manage its various exposures to interest rate, commodity price, and exchange rate fluctuations. For interest rate swaps, the difference between the spot rate and applicable base rate is recorded in interest expense. For collars and forward contracts, contract settlement gains and losses are recorded in the Consolidated Statements of Income in Cost of goods sold. Gains and losses related to the mark-to-market adjustments for changes in fair value of the derivative contracts are recorded in the Consolidated Statements of Income as Other miscellaneous (income) expense, net. The Company recognized (gains) and losses on mark-to-market adjustments for changes in fair value on derivative contracts of $(1,365), $2,315 and $(4) for the fiscal years ending March, 31, 2011, 2012 and 2013, respectively.
A summary of the fair values for the various derivatives at March 31, 2012 and 2013 is presented below:
| 2012 | 2013 | |||||||||||||||
| (Amounts in thousands) | Asset | (Liability) | Asset | (Liability) | ||||||||||||
| Interest rate swaps |
$ | — | $ | (1,303 | ) | $ | — | $ | (1,082 | ) | ||||||
| Diesel fuel option collars |
272 | — | 55 | — | ||||||||||||
| Foreign exchange forward contracts |
— | (44 | ) | — | (3 | ) | ||||||||||
F-29
Table of Contents
| 13. | COMMITMENTS AND CONTINGENCIES |
Leases
We lease real estate, transportation, and office equipment under various noncancelable operating lease agreements that expire at various dates through fiscal year 2020.
Future minimum rental commitments under these leases as of March 31, 2013, are summarized below (amounts in thousands):
| Fiscal Years Ending March 31, | ||||||||||||||||||||||||||||
| (Amounts in thousands) | 2014 | 2015 | 2016 | 2017 | 2018 | Thereafter | Total | |||||||||||||||||||||
| Transportation equipment leases |
$ | 9,046 | $ | 7,935 | $ | 6,200 | $ | 4,318 | $ | 1,687 | $ | 3,285 | $ | 32,471 | ||||||||||||||
| Real estate leases and other |
4,185 | 3,574 | 3,027 | 2,377 | 1,246 | 3,815 | 18,224 | |||||||||||||||||||||
|
|
|
|
|
|
|
|
|
|
|
|
|
|
|
|||||||||||||||
| Total |
$ | 13,231 | $ | 11,509 | $ | 9,227 | $ | 6,695 | $ | 2,933 | $ | 7,100 | $ | 50,695 | ||||||||||||||
|
|
|
|
|
|
|
|
|
|
|
|
|
|
|
|||||||||||||||
Total rent expense was $16,472, $16,745 and $20,513 in the fiscal years ended March 31, 2011, 2012 and 2013, respectively.
Purchase Commitments
At March 31, 2013, commitments for the purchase of major property, plant, and equipment totaled approximately $17,448.
We will, from time to time, secure supplies of resin raw material by agreeing to purchase quantities during a future given period at a fixed price. These purchase contracts are short term in nature and occur in the ordinary course of business. Under such purchase contracts, we have agreed to purchase 24,000 pounds of resin over the period April 2013 through June 2013 at a committed purchase cost of $12,765.
Litigation
We have been named as a defendant in various litigation matters. Management intends to vigorously defend these outstanding claims. We believe we have adequate accrued loss contingencies and that current or threatened litigation matters will not have a material adverse impact on our consolidated results of operations or consolidated financial condition. Management estimates the maximum loss contingency is $404 and $448 at March 31, 2012 and 2013, respectively.
| 14. | EMPLOYEE BENEFIT PLANS |
Employee Stock Ownership Plan (ESOP)
We established the Advanced Drainage Systems, Inc. ESOP (the “ESOP”) on April 1, 1993. The Plan was funded through a contribution from our profit-sharing plan, as well as a 30-year term loan from ADS. The Plan operates as a qualified leveraged ESOP and was designed to enable eligible employees to acquire stock ownership interest in ADS. Employees of ADS who have reached the age of 18 are generally eligible to participate in the Plan after six months of service. Upon retirement, disability, death, or vested terminations, a participant or designated beneficiary may elect to receive the amount in their account in the form of cash or ADS stock with any fractional shares paid in cash. Upon attainment of age 50 and seven years of participation in the Plan, a participant may elect to diversify, via redemptions, 25% of the number of shares of ADS stock credited to the participant’s ESOP stock account.
We are obligated to make contributions to the Plan, which, when aggregated with the Plan’s dividends and interest earnings, equal the amount necessary to enable the Plan to make its regularly scheduled payments of principal and interest due on its term loan to ADS. As the Plan makes annual payments of principal and interest, an appropriate percentage of preferred stock is allocated to eligible employees’ accounts in accordance with applicable regulations under the Internal Revenue Code.
F-30
Table of Contents
Required dividends on allocated shares are paid in cash to the participants and required dividends on unallocated shares are paid in cash to the Plan and used to service the Plan’s debt.
In fiscal years ended March 31, 2012 and 2013, the ESOP committee directed the Plan trustee to keep $1,351 and $1,251, respectively, in dividends on unallocated shares rather than to service the Plan’s debt. These dividends were allocated to participants based on total shares in their account in relation to total shares allocated at March 31, 2012 and 2013.
In fiscal years ended March 31, 2012 and 2013, the Board of Directors approved the allocation of 118 and 153 shares of Redeemable Convertible Preferred Stock, respectively, to the ESOP participants, including, in addition to the cash dividends, 2 and 2 preferred shares allocated as dividends, respectively. See Note 17 for further details on the shares of Redeemable Convertible Preferred Stock held by our ESOP.
Profit-Sharing Plan
We have an employee profit-sharing plan covering substantially all eligible employees. We did not declare a contribution in fiscal years ended March 31, 2011, 2012 and 2013 to the profit-sharing plan.
| 15. | ACCUMULATED OTHER COMPREHENSIVE LOSS |
The following table presents the changes in the balances of each component of Accumulated other comprehensive loss (“AOCI”) for the fiscal years ended March 31:
| (Amounts in thousands) | Currency Translation |
Other | Accumulated Other Comprehensive Loss |
|||||||||
| Balance at April 1, 2010 |
$ | (3,085 | ) | $ | 108 | $ | (2,977 | ) | ||||
|
|
|
|
|
|
|
|||||||
| Other comprehensive loss before reclassifications |
2,701 | (179 | ) | 2,522 | ||||||||
| Amounts reclassified from AOCI |
— | — | — | |||||||||
| Income tax expense/(benefit) |
(1,065 | ) | 73 | (992 | ) | |||||||
|
|
|
|
|
|
|
|||||||
| Balance at March 31, 2011 |
(1,449 | ) | 2 | (1,447 | ) | |||||||
|
|
|
|
|
|
|
|||||||
| Other comprehensive loss before reclassifications |
(38 | ) | 44 | 6 | ||||||||
| Amounts reclassified from AOCI |
— | — | — | |||||||||
| Tax expense/(benefit) |
83 | (17 | ) | 66 | ||||||||
|
|
|
|
|
|
|
|||||||
| Balance at March 31, 2012 |
(1,404 | ) | 29 | (1,375 | ) | |||||||
|
|
|
|
|
|
|
|||||||
| Other comprehensive loss before reclassifications |
842 | (41 | ) | 801 | ||||||||
| Amounts reclassified from AOCI |
— | — | — | |||||||||
| Income tax expense/(benefit) |
(298 | ) | 16 | (282 | ) | |||||||
|
|
|
|
|
|
|
|||||||
| Balance at March 31, 2013 |
$ | (860 | ) | $ | 4 | $ | (856 | ) | ||||
|
|
|
|
|
|
|
|||||||
| 16. | STOCKHOLDERS’ EQUITY |
The common stockholders have entered into an agreement that grants ADS the right of first refusal to purchase shares in the event of death, disability, or termination of certain management stockholders.
The Board of Directors approved a quarterly $0.11, $0.11 and $0.12 per share cash dividend to all common stockholders of record during fiscal years ended March 31, 2011, 2012 and 2013, respectively. Total cash dividends paid on common stock during fiscal years ended March 31, 2011, 2012 and 2013 were $4,491, $4,367 and $4,817, respectively.
In fiscal years ended March 31, 2012 and 2013, we purchased 14 and 4 shares, respectively, from certain stockholders at a purchase price of $52.94 and $59.25 per share, respectively.
F-31
Table of Contents
| 17. | MEZZANINE EQUITY |
Redeemable Common Stock
As part of the recapitalization in September 2010, the new minority equity owner along with other shareholders who hold ownership in ADS of at least 15% (referred to as “Major Shareholders”) entered into an agreement which provides the Major Shareholders the right to put their common stock to the Company at fair value if, following the fifth anniversary of the recapitalization, a Major Shareholder demands that the Company effect an initial public offering (“IPO”) covering the registration of at least $50 million of securities, and either the Company advises the Major Shareholder that ADS will not begin preparations for an IPO within 180 days after delivery, or after such preparations have begun they are discontinued (the “Major Shareholders’ Put Right”). As the Major Shareholders’ Put Right is a redemption right which is outside the control of ADS, we have classified common stock held by the Major Shareholders in the mezzanine equity section of our Consolidated Balance Sheets at its fair value, and changes in fair value are recorded in Retained earnings. As of March 31, 2012 and 2013, there were 8,135 shares of common stock held by Major Shareholders.
Redeemable Convertible Preferred Stock
The Trustee of our ESOP has the ability to put the shares of preferred stock at fair value to the Company in the event that it needs cash to pay for distributions, pre-retirement diversification, or other expenses, causing the shares to be redeemable at the option of the holder. Given that this put right is outside the control of the Company, this results in the classification of our Redeemable Convertible Preferred Stock recorded in the mezzanine equity section of our Consolidated Balance Sheets at its fair value, and changes in fair value are recorded in Retained earnings.
The Redeemable Convertible Preferred Stock has a required cumulative 2.5% dividend ($0.092 per share) and is convertible to common stock at a rate of one share for every 0.7692 share of common stock. We guarantee the value of the Redeemable Convertible Preferred Stock at $3.68 per share. In fiscal years ended March 31, 2011, 2012 and 2013, the Board of Directors approved the 2.5% annual dividend to be paid by March 31 of each fiscal year to the stockholders of record as of March 15 of each fiscal year. The annual dividend was paid in cash and stock on the allocated shares. The Board of Directors also approved quarterly $0.0846, $0.0846 and $0.0923 per share discretionary cash dividend to all preferred stockholders of record during fiscal years ended March 31, 2011, 2012 and 2013, respectively. The discretionary dividend on unallocated shares of Redeemable Convertible Preferred Stock was allocated to participants rather than being used to service the Plan’s debt as described in Note 14.
Cash and stock dividends on Redeemable Convertible Preferred Stock for the fiscal years ended March 31, 2012 and 2013, respectively, are summarized as follows:
| (Amounts in thousands) | 2012 | 2013 | ||||||
| Quarterly cash dividends |
$ | 529 | $ | 592 | ||||
| Annual cash dividends |
35 | 34 | ||||||
|
|
|
|
|
|||||
| Total cash dividends |
564 | 626 | ||||||
| Annual stock dividend |
104 | 110 | ||||||
| Annual cash dividend |
35 | 34 | ||||||
|
|
|
|
|
|||||
| Total ESOP required dividends |
139 | 144 | ||||||
| Allocated shares |
1,512 | 1,565 | ||||||
| Required dividend per share |
0.092 | 0.092 | ||||||
|
|
|
|
|
|||||
| Required dividends |
$ | 139 | $ | 144 | ||||
|
|
|
|
|
|||||
F-32
Table of Contents
| 18. | STOCK COMPENSATION |
Deferred Compensation — Unearned ESOP Shares
The fair value of Redeemable Convertible Preferred Stock held by the ESOP trust, but not yet earned by the ESOP participants or used for dividends, is reported as Deferred compensation — unearned ESOP shares within the mezzanine equity section of our Consolidated Balance Sheets.
Compensation expense and related dividends paid with ESOP shares are recognized based upon the average annual fair value of the shares allocated. The shares allocated are for services rendered throughout the period and, therefore, a simple average is used to calculate average annual fair value. Deferred compensation — unearned ESOP shares are relieved at the fair value, with any difference between the annual average fair value and the fair value of shares when allocated being added to Additional paid in capital. The fair value of the shares allocated was $39.55, $46.35, and $50.10 per share of Redeemable Convertible Preferred Stock at March 31, 2011, 2012 and 2013, respectively, resulting in an average annual fair value per share of $39.65, $42.95 and $46.35 for the fiscal years ended March 31, 2011, 2012 and 2013, respectively. During the fiscal years ended March 31, 2011, 2012 and 2013, we recognized compensation expense of $4,564, $4,957 and $7,283, respectively.
Stock Options
Our 2000 stock option plan (“2000 Plan”) provides for the issuance of nonstatutory common stock options to management based upon the discretion of the Board of Directors. The plan generally provides for grants with the exercise price equal to fair value on the date of grant, which vest in three equal annual amounts beginning in year five and expire after 10 years from issuance. On an annual basis, management determines the fair value of the options with the assistance of an independent appraisal.
Management determines the fair value of the options based on the Black-Scholes option pricing model. This methodology requires significant inputs including the fair value of our common stock, which is determined with the assistance of an independent appraisal performed by a reputable valuation firm (See Note 8 for further details of the determination of the fair value of our common stock and Redeemable Common Stock). During the fiscal years ended March 31, 2011, 2012 and 2013, we recognized stock-based compensation expense of $961, $811 and $539, respectively, which was included with General and administrative expenses in our Consolidated Statements of Income. As of March 31, 2012 and 2013, there was a total of $868 and $597, respectively, of unrecognized compensation expense related to unvested stock option awards that will be recognized as an expense as the awards vest over the remaining service period. We had approximately 251 shares available for granting under this plan as of March 31, 2013.
F-33
Table of Contents
The stock option transactions for the fiscal years ended March 31 are summarized as follows:
| 2011 | 2012 | 2013 | ||||||||||||||||||||||||||||||||||
| Number of Shares |
Weighted Average Exercise Price |
Weighted Average Remaining Contractual Term |
Number of Shares |
Weighted Average Exercise Price |
Weighted Average Remaining Contractual Term |
Number of Shares |
Weighted Average Exercise Price |
Weighted Average Remaining Contractual Term |
||||||||||||||||||||||||||||
| Outstanding at beginning of year |
635 | $ | 26.45 | 3.8 | 439 | $ | 29.77 | 4.4 | 321 | $ | 32.76 | 3.9 | ||||||||||||||||||||||||
| Issued |
23 | 50.60 | 1 | 50.35 | 29 | 59.25 | ||||||||||||||||||||||||||||||
| Exercised |
(141 | ) | 15.84 | (103 | ) | 18.96 | (69 | ) | 23.00 | |||||||||||||||||||||||||||
| Forfeited |
(78 | ) | 33.02 | (16 | ) | 42.51 | — | |||||||||||||||||||||||||||||
|
|
|
|
|
|
|
|||||||||||||||||||||||||||||||
| Outstanding at end of year |
439 | 29.77 | 4.4 | 321 | 32.76 | 3.9 | 281 | 38.15 | 4.0 | |||||||||||||||||||||||||||
|
|
|
|
|
|
|
|||||||||||||||||||||||||||||||
| Exercisable and vested at year end |
189 | 17.27 | 2.6 | 147 | 20.86 | 2.3 | 139 | 27.06 | 2.2 | |||||||||||||||||||||||||||
|
|
|
|
|
|
|
|||||||||||||||||||||||||||||||
| Unvested at year end |
250 | 39.19 | 5.7 | 174 | 42.86 | 5.2 | 144 | 48.83 | 5.7 | |||||||||||||||||||||||||||
|
|
|
|
|
|
|
|||||||||||||||||||||||||||||||
| Vested and expected to vest at end of year |
412 | 28.90 | 4.3 | 296 | 31.80 | 4.0 | 256 | 37.18 | 4.6 | |||||||||||||||||||||||||||
|
|
|
|
|
|
|
|||||||||||||||||||||||||||||||
| Fair value of options granted during the year |
$ | 25.58 | $ | 24.40 | $ | 28.30 | ||||||||||||||||||||||||||||||
The following table summarizes information about the nonvested stock option grants as of the fiscal years ended March 31:
| 2012 | 2013 | |||||||||||||||
| Number of Shares |
Weighted Average Grant Date Fair Value |
Number of Shares |
Weighted Average Grant Date Fair Value |
|||||||||||||
| Unvested at beginning of year |
250 | $ | 21.67 | 174 | $ | 24.35 | ||||||||||
| Granted |
1 | 24.40 | 29 | 28.30 | ||||||||||||
| Vested |
(61 | ) | 12.54 | (59 | ) | 20.05 | ||||||||||
| Forfeited |
(16 | ) | 23.76 | — | — | |||||||||||
|
|
|
|
|
|||||||||||||
| Unvested at end of year |
174 | $ | 24.35 | 144 | $ | 21.42 | ||||||||||
|
|
|
|
|
|||||||||||||
We estimate the fair value of stock options granted after April 1, 2006 using a Black-Scholes option-pricing model, with assumptions as follows:
| 2011 | 2012 | 2013 | ||||||||||
| Expected stock price volatility |
48 | % | 48 | % | 48 | % | ||||||
| Risk-free interest rate |
2.7 | 1.7 | 1.2 | |||||||||
| Weighted-average expected option life (years) |
8 | 8 | 8 | |||||||||
| Dividend yield |
0.83 | 0.87 | 0.81 | |||||||||
Restricted Stock
On September 16, 2008, the Board of Directors adopted the restricted stock plan for which restricted stock awards may be granted to certain key employees. The restricted stock will vest ratably over a five-year period from the original restricted stock grant date with the risk of forfeiture being stipulated only by the employees’ continuous employment by ADS. A portion of the grants vested immediately. Under the restricted stock plan, the vested shares granted are considered issued and outstanding. Employees with
F-34
Table of Contents
restricted stock have the right to dividends on the shares awarded (vested and unvested) in addition to voting rights on nonforfeited shares. The Company recognized compensation expense of $1,232, $356, and $1,462 in the fiscal years ended March 31, 2011, 2012 and 2013, respectively, relating to the issuance of these shares; of this amount, $570, $316 and $533 relates to the restricted shares that vested immediately during the fiscal years ended March 31, 2011, 2012 and 2013, respectively. We had approximately 99 shares available for granting under this plan as of March 31, 2013.
The information about the unvested restricted stock grants as of March 31 is as follows:
| 2011 | 2012 | 2013 | ||||||||||||||||||||||
| Number of Shares |
Weighted Average Grant Date Fair Value |
Number of Shares |
Weighted Average Grant Date Fair Value |
Number of Shares |
Weighted Average Grant Date Fair Value |
|||||||||||||||||||
| Unvested at beginning of year |
24 | $ | 45.73 | 40 | $ | 48.69 | 38 | $ | 48.90 | |||||||||||||||
| Granted |
34 | 51.29 | 18 | 50.35 | 32 | 59.25 | ||||||||||||||||||
| Vested |
(13 | ) | 48.45 | (18 | ) | 47.97 | (10 | ) | 48.45 | |||||||||||||||
| Forfeited |
(5 | ) | 45.92 | (2 | ) | 48.45 | (2 | ) | 49.07 | |||||||||||||||
|
|
|
|
|
|
|
|||||||||||||||||||
| Unvested at end of year |
40 | $ | 48.69 | 38 | $ | 48.90 | 58 | $ | 54.75 | |||||||||||||||
We expect most, if not all, restricted stock grants to vest.
At March 31, 2012 and 2013, there was approximately $1,558 and $3,154, respectively, of unrecognized compensation expense related to the restricted stock that will be recognized over the remaining service period.
| 19. | INCOME TAXES |
The components of Income before income taxes for the fiscal years ended March 31 are as follows:
| (Amounts in thousands) | 2011 | 2012 | 2013 | |||||||||
| United States |
$ | (140 | ) | $ | 62,719 | $ | 32,730 | |||||
| Foreign |
12,795 | 8,072 | 13,955 | |||||||||
|
|
|
|
|
|
|
|||||||
| Total |
$ | 12,655 | $ | 70,791 | $ | 46,685 | ||||||
|
|
|
|
|
|
|
|||||||
The components of the provision for income taxes for the fiscal years ended March 31 consisted of the following (amounts in thousands):
| (Amounts in thousands) | 2011 | 2012 | 2013 | |||||||||
| Current: |
||||||||||||
| Federal |
$ | 1,905 | $ | 26,089 | $ | 16,096 | ||||||
| State and local |
1,313 | 4,731 | 3,217 | |||||||||
| Foreign |
1,608 | 1,800 | 2,385 | |||||||||
|
|
|
|
|
|
|
|||||||
| Total current tax provision |
4,826 | 32,620 | 21,698 | |||||||||
| Deferred: |
||||||||||||
| Federal |
(854 | ) | (4,199 | ) | (3,828 | ) | ||||||
| State and local |
(276 | ) | (766 | ) | (698 | ) | ||||||
| Foreign |
357 | (591 | ) | (278 | ) | |||||||
|
|
|
|
|
|
|
|||||||
| Total deferred tax benefit |
(773 | ) | (5,556 | ) | (4,804 | ) | ||||||
|
|
|
|
|
|
|
|||||||
| Total income tax provision |
$ | 4,053 | $ | 27,064 | $ | 16,894 | ||||||
|
|
|
|
|
|
|
|||||||
F-35
Table of Contents
For the fiscal years ended March 31, our effective tax rate varied from the statutory Federal income tax rate as a result of the following factors:
| (Amounts in thousands) | 2011 | 2012 | 2013 | |||||||||
| Federal statutory rate |
34.0 | % | 35.0 | % | 35.0 | % | ||||||
| Redeemable Convertible Preferred Stock dividend |
(1.9 | ) | (0.3 | ) | (0.5 | ) | ||||||
| ESOP stock appreciation |
10.5 | 2.2 | 5.0 | |||||||||
| Effect of tax rate of foreign subsidiaries |
(9.5 | ) | (1.5 | ) | (4.4 | ) | ||||||
| State and local taxes — net of federal income tax benefit |
5.6 | 3.6 | 3.0 | |||||||||
| Noncontrolling interest |
(7.7 | ) | (0.5 | ) | (1.5 | ) | ||||||
| Other |
(0.7 | ) | (0.6 | ) | (0.7 | ) | ||||||
|
|
|
|
|
|
|
|||||||
| Effective rate |
30.3 | % | 37.9 | % | 35.9 | % | ||||||
The Company’s effective tax rate will vary based on a variety of factors, including overall profitability, the geographical mix of income before taxes and the related tax rates in the jurisdictions where it operates, restructuring and other one-time charges, as well as discrete events, such as settlements of future audits.
The tax effect of temporary differences that give rise to significant portions of the deferred tax assets and deferred tax liabilities at March 31 were comprised of:
| (Amounts in thousands) | 2012 | 2013 | ||||||
| Deferred tax assets: |
||||||||
| State income taxes |
$ | 4,159 | $ | 3,915 | ||||
| ESOP loan repayment |
1,569 | 1,529 | ||||||
| Receivable and other allowances |
1,527 | 1,631 | ||||||
| Goodwill |
1,613 | 2,428 | ||||||
| Other assets and liabilities |
3,282 | 2,676 | ||||||
|
|
|
|
|
|||||
| Total deferred tax assets |
12,150 | 12,179 | ||||||
| Deferred tax liabilities: |
||||||||
| Intangible assets |
20,921 | 18,178 | ||||||
| Property, plant and equipment |
50,280 | 51,711 | ||||||
| Inventory and other assets and liabilities |
17,674 | 14,538 | ||||||
|
|
|
|
|
|||||
| Total deferred tax liabilities |
88,875 | 84,427 | ||||||
|
|
|
|
|
|||||
| Net deferred tax liability |
$ | 76,725 | $ | 72,248 | ||||
|
|
|
|
|
|||||
Net current deferred tax assets were included in Deferred income taxes and other current assets on the Consolidated Balance Sheets. The related balances at March 31 were as follows:
| (Amounts in thousands) | 2012 | 2013 | ||||||
| Net current deferred tax assets |
$ | 6,112 | $ | 1,867 | ||||
The Company has not provided for U.S. federal income taxes or foreign withholding taxes on approximately $30,306 of undistributed earnings of its foreign subsidiaries at March 31, 2013 because such earnings are intended to be reinvested indefinitely with the exception of cash dividends paid by our ADS Mexicana joint venture. It is not practicable to estimate the amount of U.S. tax that might be payable on the eventual remittance of such earnings.
Accounting for uncertain tax positions
Effective April 1, 2009, we adopted the amendments to ASC 740-Income Taxes, related to uncertain tax positions, which provides a consistent recognition threshold and a method for measuring the financial
F-36
Table of Contents
statement impact of a tax position taken, or expected to be taken, in a tax return. We recognized a liability of $1,615 recorded in Other long-term liabilities and a decrease to Retained earnings of $865 as a result of its adoption, of which $130 and $0 related to interest and penalties, respectively. The adjustments made relate to our estimated exposure attributed to state and local nexus in addition to federal uniform capitalization. The liability as of March 31, 2012 and 2013 is consistent with the amount recorded during the adoption. No changes are expected to be made to this liability during the next fiscal year.
We are currently open to audit under the statute of limitations by the Internal Revenue Service for the fiscal years ended March 31, 2010 through March 31, 2013. The majority of our state income tax returns are open to audit under the statute of limitations for the years ended March 31, 2010 through March 31, 2013. Our foreign income tax returns are open to audit under the statute of limitations for the years ended March 31, 2007 through March 31, 2011.
| 20. | NET INCOME PER SHARE |
Basic net income per share is calculated by dividing the Net income attributable to common stockholders by the weighted-average number of common shares outstanding during the period, without consideration for common stock equivalents. Diluted net income per share is computed by dividing the Net income attributable to common stockholders by the weighted-average number of common share equivalents outstanding for the period.
Holders of unvested restricted stock have nonforfeitable rights to dividends when declared on common stock, and holders Redeemable Convertible Preferred Stock participate in dividends on an as-converted basis when declared on common stock. As a result, unvested restricted stock and Redeemable Convertible Preferred Stock meet the definition of participating securities, which requires us to apply the two-class method to compute both basic and diluted net income per share. The two-class method is an earnings allocation formula that treats participating securities as having rights to earnings that would otherwise have been available to common stockholders.
The dilutive effect of stock options and unvested restricted stock is based on the more dilutive of the treasury stock method or the diluted two-class method. Diluted earnings per share assumes the Redeemable Convertible Preferred Stock would be cash settled as we have the choice of settling in cash or shares, and we have demonstrated past practice and intent of cash settlement; therefore these shares are excluded from the calculation. For purposes of the calculation of diluted net income per share, stock options and unvested restricted stock are considered to be potential common stock and are only included in the calculations when their effect is dilutive.
The Company’s Redeemable Common Stock is included in the weighted-average number of common shares outstanding for calculating basic and diluted net income per share.
F-37
Table of Contents
The following table presents information necessary to calculate net income per share for the fiscal years ended March 31, 2011, 2012, and 2013, as well as potentially dilutive securities excluded from the weighted average number of diluted common shares outstanding because their inclusion would have been anti-dilutive:
| (Amounts in thousands, except per share data) | 2011 | 2012 | 2013 | |||||||||
| NET INCOME PER SHARE — BASIC: |
||||||||||||
| Net income attributable to ADS |
$ | 5,996 | $ | 43,260 | $ | 28,159 | ||||||
| Adjustment for: |
||||||||||||
| Change in fair value of Redeemable Convertible Preferred Stock |
(3,541 | ) | (10,257 | ) | (5,869 | ) | ||||||
| Dividends paid to Redeemable Convertible Preferred Stockholders |
(844 | ) | (668 | ) | (736 | ) | ||||||
| Dividends paid to unvested restricted stockholders |
(104 | ) | (34 | ) | (52 | ) | ||||||
|
|
|
|
|
|
|
|||||||
| Net income available to common stockholders and participating securities |
1,507 | 32,301 | 21,502 | |||||||||
| Undistributed income allocated to participating securities |
— | (3,241 | ) | (2,042 | ) | |||||||
|
|
|
|
|
|
|
|||||||
| Net income available to common stockholders — Basic |
1,507 | 29,060 | 19,460 | |||||||||
| Weighted average number of common shares outstanding — Basic |
10,127 | 9,835 | 9,921 | |||||||||
|
|
|
|
|
|
|
|||||||
| Net income per common share — Basic |
$ | 0.15 | $ | 2.95 | $ | 1.96 | ||||||
|
|
|
|
|
|
|
|||||||
| NET INCOME PER SHARE — DILUTED: |
||||||||||||
| Net income available to common stockholders — Basic |
$ | 1,507 | $ | 29,060 | $ | 19,460 | ||||||
|
|
|
|
|
|
|
|||||||
| Weighted average number of common shares outstanding — Basic |
10,127 | 9,835 | 9,921 | |||||||||
| Assumed exercise of stock options |
219 | 161 | 117 | |||||||||
|
|
|
|
|
|
|
|||||||
| Weighted average number of common shares outstanding — Diluted |
10,346 | 9,996 | 10,038 | |||||||||
|
|
|
|
|
|
|
|||||||
| Net income per common share — Diluted |
$ | 0.15 | $ | 2.91 | $ | 1.94 | ||||||
|
|
|
|
|
|
|
|||||||
| Potentially dilutive securities excluded as anti-dilutive |
3 | 4 | 17 | |||||||||
| 21. | BUSINESS SEGMENTS INFORMATION |
We operate our business in two distinct operating and reportable segments based on the markets we serve: “Domestic” and “International”. The Chief Operating Decision Maker (“CODM”) evaluates segment reporting based on net sales and Segment EBITDA and Segment Adjusted EBITDA. We calculate Segment EBITDA as net income or loss before interest, income taxes, depreciation and amortization. We calculate Segment Adjusted EBITDA as Segment EBITDA before non-cash stock-based compensation expense, non-cash charges and certain other expenses.
Domestic — Our Domestic segment manufactures and markets products throughout the United States. We maintain and serve these markets through strong product distribution relationships with many of the largest national and independent waterworks distributors, major national retailers as well as an extensive network of hundreds of small to medium-sized distributors across the U.S. We also sell through a broad variety of buying groups and co-ops in the United States. Products include Singlewall pipe, N-12 HDPE pipe sold into the Storm sewer and Infrastructure markets, N-12 High Performance PP pipe sold into the Storm sewer and sanitary sewer markets, and our broad line of Allied Products including Stormtech, Nyloplast, Arc Septic Chambers, Inserta Tee, Baysaver filters and water quality structures, Fittings, and FleXstorm. Our Domestic segment sales are diversified across all regions of the country.
International — Our international segment manufactures and markets products in regions outside of the United States, with a growth strategy focused on our owned facilities in Canada and through our joint-ventures, with best-in-class local partners in Mexico, Central America and South America. Our joint venture strategy provides us with local and regional access to new markets such as Brazil, Chile, Argentina, Peru and Colombia. We have been serving the Canadian market through Hancor of Canada since 2003. Our Mexican joint venture through ADS Mexicana primarily serves the Mexican markets, while our Brazilian
F-38
Table of Contents
joint venture through Tigre ADS is our primary channel to serve the South American markets. Our product line includes Singlewall pipe, N-12 HDPE pipe, and N-12 High Performance PP pipe. The Canadian market also sells our broad line of Allied Products, while sales in Latin America are currently concentrated in fittings and Nyloplast.
The following table sets forth reportable segment information with respect to the amount of net sales contributed by each class of similar products of our consolidated gross profit in each of the fiscal years ending March 31:
| (Amounts in thousands) | 2011 | 2012 | 2013 | |||||||||
| Domestic |
||||||||||||
| Pipe |
$ | 562,854 | $ | 678,934 | $ | 654,068 | ||||||
| Allied Products |
175,529 | 209,736 | 223,676 | |||||||||
|
|
|
|
|
|
|
|||||||
| Total Domestic |
738,383 | 888,670 | 877,744 | |||||||||
|
|
|
|
|
|
|
|||||||
| International |
||||||||||||
| Pipe |
104,971 | 104,107 | 114,349 | |||||||||
| Allied Products |
19,784 | 20,979 | 24,948 | |||||||||
|
|
|
|
|
|
|
|||||||
| Total International |
124,755 | 125,086 | 139,297 | |||||||||
|
|
|
|
|
|
|
|||||||
| Total net sales |
$ | 863,138 | $ | 1,013,756 | $ | 1,017,041 | ||||||
|
|
|
|
|
|
|
|||||||
The following sets forth certain additional financial information attributable to our reportable segments for the fiscal years ended March 31:
| (Amounts in thousands) | 2011 | 2012 | 2013 | |||||||||
| Net sales |
||||||||||||
| Domestic |
$ | 738,383 | $ | 888,670 | $ | 877,744 | ||||||
| International |
124,755 | 125,086 | 139,297 | |||||||||
|
|
|
|
|
|
|
|||||||
| Total |
$ | 863,138 | $ | 1,013,756 | $ | 1,017,041 | ||||||
|
|
|
|
|
|
|
|||||||
| Gross profit |
||||||||||||
| Domestic |
$ | 143,042 | $ | 170,518 | $ | 177,717 | ||||||
| International |
27,932 | 24,840 | 31,594 | |||||||||
|
|
|
|
|
|
|
|||||||
| Total |
$ | 170,974 | $ | 195,358 | $ | 209,311 | ||||||
|
|
|
|
|
|
|
|||||||
| Segment Adjusted EBITDA |
||||||||||||
| Domestic |
$ | 85,030 | $ | 102,241 | $ | 109,726 | ||||||
| International |
15,750 | 14,632 | 20,033 | |||||||||
|
|
|
|
|
|
|
|||||||
| Total |
$ | 100,780 | $ | 116,873 | $ | 129,759 | ||||||
|
|
|
|
|
|
|
|||||||
| Interest expense, net |
||||||||||||
| Domestic |
$ | 26,870 | $ | 21,597 | $ | 16,045 | ||||||
| International |
251 | 240 | 50 | |||||||||
|
|
|
|
|
|
|
|||||||
| Total |
$ | 27,121 | $ | 21,837 | $ | 16,095 | ||||||
|
|
|
|
|
|
|
|||||||
| Depreciation and amortization |
||||||||||||
| Domestic |
$ | 51,237 | $ | 49,631 | $ | 50,691 | ||||||
| International |
4,538 | 5,540 | 4,914 | |||||||||
|
|
|
|
|
|
|
|||||||
| Total |
$ | 55,775 | $ | 55,171 | $ | 55,605 | ||||||
|
|
|
|
|
|
|
|||||||
| Equity in net income of unconsolidated affiliates |
||||||||||||
| Domestic |
$ | — | $ | — | $ | — | ||||||
| International |
736 | 704 | 387 | |||||||||
|
|
|
|
|
|
|
|||||||
| Total |
$ | 736 | $ | 704 | $ | 387 | ||||||
|
|
|
|
|
|
|
|||||||
| Capital expenditures |
||||||||||||
| Domestic |
$ | 21,863 | $ | 22,281 | $ | 37,800 | ||||||
| International |
8,178 | 4,186 | 2,204 | |||||||||
|
|
|
|
|
|
|
|||||||
| Total |
$ | 30,041 | $ | 26,467 | $ | 40,004 | ||||||
|
|
|
|
|
|
|
|||||||
F-39
Table of Contents
The following sets forth certain additional financial information attributable to our reporting segments as of March 31:
| 2011 | 2012 | 2013 | ||||||||||
| Investment in unconsolidated affiliates |
||||||||||||
| Domestic |
$ | — | $ | — | $ | — | ||||||
| International |
16,950 | 20,758 | 22,012 | |||||||||
|
|
|
|
|
|
|
|||||||
| Total |
$ | 16,950 | $ | 20,758 | $ | 22,012 | ||||||
|
|
|
|
|
|
|
|||||||
| Total identifiable assets |
||||||||||||
| Domestic |
$ | 763,143 | $ | 797,297 | $ | 795,646 | ||||||
| International |
109,410 | 110,142 | 114,060 | |||||||||
| Eliminations |
(5,740 | ) | (2,411 | ) | (1,967 | ) | ||||||
|
|
|
|
|
|
|
|||||||
| Total |
$ | 866,813 | $ | 905,028 | $ | 907,739 | ||||||
|
|
|
|
|
|
|
|||||||
Reconciliation of Segment EBITDA and Segment Adjusted EBITDA to Consolidated Net Income
| Fiscal Year Ended March 31, | ||||||||||||||||||||||||
| (Amounts in thousands) | 2011 | 2012 | 2013 | |||||||||||||||||||||
| Domestic | International | Domestic | International | Domestic | International | |||||||||||||||||||
| Net income |
$ | (1,492 | ) | $ | 7,488 | $ | 37,894 | $ | 5,366 | $ | 18,332 | $ | 9,827 | |||||||||||
| Depreciation and amortization (a) |
51,237 | 5,090 | 52,832 | 6,524 | 50,691 | 6,235 | ||||||||||||||||||
| Interest expense, net |
26,870 | 251 | 21,597 | 240 | 16,045 | 50 | ||||||||||||||||||
| Income tax expense |
2,088 | 1,965 | 25,855 | 1,209 | 14,787 | 2,107 | ||||||||||||||||||
|
|
|
|
|
|
|
|
|
|
|
|
|
|||||||||||||
| Segment EBITDA |
78,703 | 14,794 | 138,178 | 13,339 | 99,855 | 18,219 | ||||||||||||||||||
| Derivative fair value adjustments |
(1,365 | ) | — | 2,315 | — | (4 | ) | — | ||||||||||||||||
| Foreign currency transaction losses |
— | 332 | — | 378 | — | 1,085 | ||||||||||||||||||
| Gain on sale of Septic Chamber business |
— | — | (44,634 | ) | — | — | — | |||||||||||||||||
| Unconsolidated affiliates interest and tax |
— | 624 | — | 915 | — | 729 | ||||||||||||||||||
| Share based compensation |
2,725 | — | 1,425 | — | 2,592 | — | ||||||||||||||||||
| ESOP deferred compensation |
4,564 | — | 4,957 | — | 7,283 | — | ||||||||||||||||||
| Transaction costs (b) |
403 | — | — | — | — | — | ||||||||||||||||||
|
|
|
|
|
|
|
|
|
|
|
|
|
|||||||||||||
| Segment Adjusted EBITDA |
$ | 85,030 | $ | 15,750 | $ | 102,241 | $ | 14,632 | $ | 109,726 | $ | 20,033 | ||||||||||||
|
|
|
|
|
|
|
|
|
|
|
|
|
|||||||||||||
| (a) | Includes our proportionate share of depreciation and amortization expense of $552, $985, and $1,321 related to our Tigre ADS joint venture, which is included in Net income of unconsolidated affiliates in our Consolidated Statements of Income for the fiscal years ended March 31, 2011, 2012, and 2013, respectively. Depreciation and amortization for the fiscal year ended March 31, 2012 also includes a charge of $3,200 related to the impairment of our Hancor trademark. |
| (b) | Represents expenses recorded related to legal, accounting and other professional fees incurred in connection with our recent debt refinancing. |
F-40
Table of Contents
Geographic Sales and Assets Information
Net sales are attributed to the geographic location based on the location of the customer. The table below represents the sales and long-lived asset information by geographic location for each of the fiscal years ended March 31:
| (Amounts in thousands) | 2011 | 2012 | 2013 | |||||||||
| Net sales |
||||||||||||
| North America |
$ | 844,484 | $ | 996,136 | $ | 998,617 | ||||||
| Other |
18,654 | 17,620 | 18,424 | |||||||||
|
|
|
|
|
|
|
|||||||
| Total |
$ | 863,138 | $ | 1,013,756 | $ | 1,017,041 | ||||||
|
|
|
|
|
|
|
|||||||
| (Amounts in thousands) | 2012 | 2013 | ||||||||||
| Long-Lived Assets |
||||||||||||
| North America |
$ | 504,398 | $ | 495,767 | ||||||||
| Other |
23,942 | 24,551 | ||||||||||
|
|
|
|
|
|||||||||
| Total |
$ | 528,340 | $ | 520,318 | ||||||||
|
|
|
|
|
|||||||||
| 22. | SUPPLEMENTAL DISCLOSURES OF CASH FLOW INFORMATION |
The increase and (decrease) in cash due to the changes in working capital accounts for the fiscal years ended March 31, were as follows:
| (Amounts in thousands) | 2011 | 2012 | 2013 | |||||||||
| Changes in working capital: |
||||||||||||
| Receivables |
$ | (11,615 | ) | $ | (29,657 | ) | $ | 22,501 | ||||
| Inventories |
(55,016 | ) | 13,721 | (34,846 | ) | |||||||
| Prepaid expenses and other current assets |
730 | (1,241 | ) | (639 | ) | |||||||
| Other assets |
(1,830 | ) | (2,656 | ) | (2,576 | ) | ||||||
| Accounts payable, accrued expenses, and other liabilities |
37,164 | 13,013 | (7,652 | ) | ||||||||
|
|
|
|
|
|
|
|||||||
| Total changes in working capital: |
$ | (30,567 | ) | $ | (6,820 | ) | $ | (23,212 | ) | |||
|
|
|
|
|
|
|
|||||||
Supplemental disclosures of cash flow information for the fiscal years ended March 31 were as follows:
| (Amounts in thousands) | 2011 | 2012 | 2013 | |||||||||
| Supplemental disclosures of cash flow information — cash paid during years: |
||||||||||||
| Interest |
$ | 23,859 | $ | 20,994 | $ | 15,872 | ||||||
| Income taxes |
8,720 | 16,932 | 23,893 | |||||||||
| (Amounts in thousands) | 2011 | 2012 | 2013 | |||||||||
| Supplemental schedule of noncash investing and financing activities: |
||||||||||||
| Redeemable Convertible Preferred Stock dividend (Note 14) |
$ | 100 | $ | 104 | $ | 110 | ||||||
| Redemption of common stock to exercise stock options |
869 | 1,278 | 805 | |||||||||
| Receivable recorded to exercise stock options |
96 | 36 | 142 | |||||||||
| Purchases of plant, property, and equipment included in accounts payable |
212 | 127 | 3,884 | |||||||||
| Receivable for committed insurance proceeds |
3,346 | — | — | |||||||||
| 23. | SUBSEQUENT EVENTS |
We evaluated subsequent events through April 2, 2014, the date these consolidated financial statements were available to be issued.
F-41
Table of Contents
In April 2013, ADS Worldwide acquired an additional 1% equity interest in its consolidated subsidiary ADS Mexicana stock for $520, increasing the Company’s ownership percentage to 51%.
In June 2013, we refinanced our bank credit facilities, which include all of the banks participating in the previous credit agreement. The principal terms involve an increase in the size of the facilities from $337,000 to $437,000, a reduction in interest spreads to reflect the current market conditions and our leverage profile, and certain modifications to debt covenants. The June 2013 agreement supersedes the agreement dated September 10, 2010, and has a new term of five years. As part of this new credit agreement, the previous mandatory prepayment of $10,400 for excess cash flow (as defined) calculated as of March 31, 2013 (to be applied against the term debt) and due on July 5, 2013, was eliminated entirely.
On July 15, 2013, ADS Ventures, Inc., a wholly-owned subsidiary of the Company, BaySaver Technologies, Inc. (“BTI”) and Mid Atlantic Storm Water Research Center, Inc. (“MASWRC”) entered into an agreement to form a new joint venture, BaySaver Technologies, LLC (“BaySaver”). The joint venture was established to design, engineer, manufacture, market and sell water quality filters and separators used in the removal of sediment and pollution from storm water anywhere in the world except New Zealand, Australia and South Africa. The Company contributed $3,500 in cash, $1,285 in inventory, and other intangible assets with no carrying value, in exchange for a 55% equity interest and a 50% voting interest in BaySaver. The Company will account for its investment in BaySaver under the equity method of accounting.
On August 6, 2013, the Company established the 2013 Stock Option Plan (the “2013 Plan”) for the purpose of issuing non-qualified stock options in common stock to our officers and other key employees. The maximum aggregate number of shares available to be issued under the 2013 Plan is 500, subject to adjustment in the event of changes in our capitalization. In September 2013, options to purchase 416 shares of our common stock were granted.
On January 6, 2014, the Board of Directors declared a special dividend of $7.50 per share (“Special Dividend”), for a total amount of approximately $108,101, on all outstanding shares of our common stock and Redeemable Convertible Preferred Stock. We paid the Special Dividend on January 15, 2014 to all stockholders of record on January 2, 2014. On December 20, 2013, we amended the private shelf agreement primarily to permit the payment of the Special Dividend. The Special Dividend related to the ESOP’s allocated shares was paid in cash (i.e., passed through) to participants, and the Special Dividend on the ESOP’s unallocated shares was retained by the ESOP and allocated among the participants’ ESOP cash accounts. The allocation of cash among the participants’ ESOP trust cash accounts related to dividends paid on unallocated shares resulted in additional compensation expense of $22,624. The payment of the Special Dividend was financed through the Company’s Revolving Credit Facility.
* * * * * *
F-42
Table of Contents
ADVANCED DRAINAGE SYSTEMS, INC. AND SUBSIDIARIES
CONDENSED CONSOLIDATED BALANCE SHEETS
(unaudited)
| As of | ||||||||||||
| (Amounts in thousands, except par value) | March 31, 2013 |
December 31, 2013 |
December 31, 2013 |
|||||||||
| (Pro Forma) | ||||||||||||
| ASSETS |
||||||||||||
| Current assets: |
||||||||||||
| Cash |
$ | 1,361 | $ | 5,335 | $ | 5,335 | ||||||
| Receivables (less allowance for doubtful accounts of $4,689 and $5,430, respectively) |
146,478 | 150,584 | 150,584 | |||||||||
| Inventories |
232,409 | 202,848 | 202,848 | |||||||||
| Deferred income taxes and other current assets |
7,173 | 10,146 | 10,146 | |||||||||
| Assets held for sale (see Note 2) |
— | 1,543 | 1,543 | |||||||||
|
|
|
|
|
|
|
|||||||
| Total current assets |
387,421 | 370,456 | 370,456 | |||||||||
| Property, plant and equipment, net |
294,901 | 290,498 | 290,498 | |||||||||
| Other assets: |
||||||||||||
| Goodwill |
86,259 | 86,228 | 86,228 | |||||||||
| Intangible assets, net |
78,717 | 69,249 | 69,249 | |||||||||
| Other assets |
60,441 | 66,967 | 66,967 | |||||||||
| Assets held for sale (see Note 2) |
— | 2,550 | 2,550 | |||||||||
|
|
|
|
|
|
|
|||||||
| Total assets |
$ | 907,739 | $ | 885,948 | $ | 885,948 | ||||||
|
|
|
|
|
|
|
|||||||
| LIABILITIES, MEZZANINE EQUITY AND STOCKHOLDERS’ EQUITY |
||||||||||||
| Current liabilities: |
||||||||||||
| Current maturities of debt obligations |
$ | 11,942 | $ | 8,240 | $ | 8,240 | ||||||
| Accounts payable |
110,251 | 86,368 | 86,368 | |||||||||
| Other accrued liabilities |
35,441 | 37,017 | 37,017 | |||||||||
| Accrued income taxes |
9,511 | 30,651 | 30,651 | |||||||||
| Dividend payable (see Note 17) |
— | — | 108,101 | |||||||||
| Liabilities held for sale (see Note 2) |
— | 83 | 83 | |||||||||
|
|
|
|
|
|
|
|||||||
| Total current liabilities |
167,145 | 162,359 | 270,460 | |||||||||
| Long-term debt obligation |
338,048 | 298,025 | 298,025 | |||||||||
| Deferred tax liabilities |
74,114 | 70,503 | 70,503 | |||||||||
| Other liabilities |
5,808 | 14,745 | 14,745 | |||||||||
|
|
|
|
|
|
|
|||||||
| Total liabilities |
585,115 | 545,632 | 653,733 | |||||||||
| Commitments and contingencies (see Note 12) |
||||||||||||
| Mezzanine equity: |
||||||||||||
| Redeemable Common Stock; $0.01 par value: 8,135 and 8,141 issued and outstanding, respectively |
522,276 | 578,020 | 578,020 | |||||||||
| Redeemable Convertible Preferred Stock; $0.01 par value: 10,000 authorized; 9,384 issued and 5,640 and 5,562 outstanding, respectively |
282,547 | 307,581 | 307,581 | |||||||||
| Deferred compensation — unearned ESOP shares |
(196,477 | ) | (207,426 | ) | (207,426 | ) | ||||||
|
|
|
|
|
|
|
|||||||
| Total mezzanine equity |
608,346 | 678,175 | 678,175 | |||||||||
| Stockholders’ equity: |
||||||||||||
| Common stock; $0.01 par value: 23,365 and 23,359 authorized and issued; 1,867 and 1,875 outstanding, respectively |
11,957 | 11,957 | 234 | |||||||||
| Paid-in capital |
41,152 | 40,991 | — | |||||||||
| Common stock in treasury, at cost |
(448,571 | ) | (448,963 | ) | (448,963 | ) | ||||||
| Accumulated other comprehensive loss |
(856 | ) | (6,122 | ) | (6,122 | ) | ||||||
| Retained earnings (deficit) |
87,331 | 42,159 | (13,228 | ) | ||||||||
|
|
|
|
|
|
|
|||||||
| Total ADS stockholders’ equity |
(308,987 | ) | (359,978 | ) | (468,079 | ) | ||||||
| Noncontrolling interest in subsidiaries |
23,265 | 22,119 | 22,119 | |||||||||
|
|
|
|
|
|
|
|||||||
| Total stockholders’ equity |
(285,722 | ) | (337,859 | ) | (445,960 | ) | ||||||
|
|
|
|
|
|
|
|||||||
| Total liabilities, mezzanine equity and stockholders’ equity |
$ | 907,739 | $ | 885,948 | $ | 885,948 | ||||||
|
|
|
|
|
|
|
|||||||
See accompanying notes to condensed consolidated financial statements.
F-43
Table of Contents
ADVANCED DRAINAGE SYSTEMS, INC. AND SUBSIDIARIES
CONDENSED CONSOLIDATED STATEMENTS OF INCOME
(unaudited)
| Nine Months Ended December 31, | ||||||||
| (Amounts in thousands, except per share data) | 2012 | 2013 | ||||||
| Net sales |
$ | 832,565 | $ | 887,777 | ||||
| Cost of goods sold |
659,283 | 698,791 | ||||||
|
|
|
|
|
|||||
| Gross profit |
173,282 | 188,986 | ||||||
| Operating expenses: |
||||||||
| Selling |
52,847 | 52,433 | ||||||
| General and administrative |
48,913 | 54,354 | ||||||
| Gain on sale of assets/business |
(2,210 | ) | (4,848 | ) | ||||
| Intangible amortization |
8,119 | 8,576 | ||||||
|
|
|
|
|
|||||
| Income from operations |
65,613 | 78,471 | ||||||
| Other expense: |
||||||||
| Interest expense |
12,465 | 11,860 | ||||||
| Other miscellaneous expense, net |
176 | 398 | ||||||
|
|
|
|
|
|||||
| Income before income taxes |
52,972 | 66,213 | ||||||
| Income tax expense |
20,112 | 40,845 | ||||||
| Equity in net (income) loss of unconsolidated affiliates |
(402 | ) | 714 | |||||
|
|
|
|
|
|||||
| Net income |
33,262 | 24,654 | ||||||
| Less net income attributable to noncontrolling interest |
1,654 | 1,360 | ||||||
|
|
|
|
|
|||||
| Net income attributable to ADS |
31,608 | 23,294 | ||||||
|
|
|
|
|
|||||
| Change in fair value of Redeemable Convertible Preferred Stock |
(3,682 | ) | (8,492 | ) | ||||
| Dividends paid to Redeemable Convertible Preferred Stockholders |
(554 | ) | (640 | ) | ||||
| Dividends paid to unvested restricted stockholders |
(39 | ) | (47 | ) | ||||
|
|
|
|
|
|||||
| Net income available to common stockholders and participating securities |
27,333 | 14,115 | ||||||
| Undistributed income allocated to participating securities |
(2,703 | ) | (1,184 | ) | ||||
|
|
|
|
|
|||||
| Net income available to common stockholders |
$ | 24,630 | $ | 12,931 | ||||
|
|
|
|
|
|||||
| Weighted average common shares outstanding: |
||||||||
| Basic |
9,917 | 9,980 | ||||||
| Diluted |
10,033 | 10,087 | ||||||
| Net income per share: |
||||||||
| Basic |
$ | 2.48 | $ | 1.30 | ||||
| Diluted |
$ | 2.45 | $ | 1.28 | ||||
| Cash dividends declared per share |
$ | 0.33 | $ | 0.36 | ||||
| Supplemental pro forma net income per share (unaudited) |
||||||||
| Basic |
||||||||
| Diluted |
||||||||
| Weighted average common shares outstanding used to calculate supplemental pro forma net income per share |
||||||||
See accompanying notes to condensed consolidated financial statements.
F-44
Table of Contents
ADVANCED DRAINAGE SYSTEMS, INC. AND SUBSIDIARIES
CONDENSED CONSOLIDATED STATEMENTS OF COMPREHENSIVE INCOME
(unaudited)
| Nine Months Ended December 31, | ||||||||
| (Amounts in thousands) | 2012 | 2013 | ||||||
| Net income |
$ | 33,262 | $ | 24,654 | ||||
| Other comprehensive income (loss): |
||||||||
| Currency translation, before tax |
2,083 | (8,202 | ) | |||||
| Other, before tax |
51 | 6 | ||||||
|
|
|
|
|
|||||
| Total other comprehensive income (loss), before tax |
2,134 | (8,196 | ) | |||||
|
|
|
|
|
|||||
| Tax attributes of items in other comprehensive income (loss): |
||||||||
| Currency translation |
(201 | ) | 1,605 | |||||
| Other |
(21 | ) | (2 | ) | ||||
|
|
|
|
|
|||||
| Total tax expense (benefit) |
(222 | ) | 1,603 | |||||
|
|
|
|
|
|||||
| Comprehensive income |
35,174 | 18,061 | ||||||
| Less other comprehensive income (loss) attributable to noncontrolling interest, net of tax |
1,161 | (1,327 | ) | |||||
| Less net income attributable to noncontrolling interest |
1,654 | 1,360 | ||||||
|
|
|
|
|
|||||
| Total comprehensive income attributable to ADS |
$ | 32,359 | $ | 18,028 | ||||
|
|
|
|
|
|||||
See accompanying notes to condensed consolidated financial statements.
F-45
Table of Contents
ADVANCED DRAINAGE SYSTEMS, INC. AND SUBSIDIARIES
CONDENSED CONSOLIDATED STATEMENTS OF CASH FLOWS
(unaudited)
| Nine Months Ended December 31, | ||||||||
| (Amounts in thousands) | 2012 | 2013 | ||||||
| Cash Flows from Operating Activities |
$ | 60,176 | $ | 88,104 | ||||
|
|
|
|
|
|||||
| Cash Flows from Investing Activities |
||||||||
| Capital expenditures |
(35,421 | ) | (27,097 | ) | ||||
| Proceeds from sale of assets/business |
600 | 5,877 | ||||||
| Cash paid for acquisitions |
(4,839 | ) | — | |||||
| Investment in unconsolidated affiliate |
— | (6,285 | ) | |||||
| Other investing activities |
(2,419 | ) | (2,611 | ) | ||||
|
|
|
|
|
|||||
| Net cash used in investing activities |
(42,079 | ) | (30,116 | ) | ||||
|
|
|
|
|
|||||
| Cash Flows from Financing Activities |
||||||||
| Redemption of Redeemable Convertible Preferred Stock |
(2,484 | ) | (3,889 | ) | ||||
| Cash dividends paid |
(4,222 | ) | (4,615 | ) | ||||
| Loan on CSV life insurance policies |
7,693 | — | ||||||
| Proceeds from Senior Notes |
— | 25,000 | ||||||
| Proceeds from term loan |
— | 100,000 | ||||||
| Payments on term loan |
(7,500 | ) | (78,750 | ) | ||||
| Payments of notes, mortgages, and other debt |
(1,240 | ) | (1,275 | ) | ||||
| Proceeds from Revolving Credit Facility |
258,200 | 301,300 | ||||||
| Payments on Revolving Credit Facility |
(266,700 | ) | (390,000 | ) | ||||
| Other financing activities |
266 | (1,785 | ) | |||||
|
|
|
|
|
|||||
| Net cash used in financing activities |
(15,987 | ) | (54,014 | ) | ||||
|
|
|
|
|
|||||
| Net change in cash and equivalents |
2,110 | 3,974 | ||||||
| Cash and equivalents at beginning of year |
2,082 | 1,361 | ||||||
|
|
|
|
|
|||||
| Cash and equivalents at end of year |
$ | 4,192 | $ | 5,335 | ||||
|
|
|
|
|
|||||
See accompanying notes to condensed consolidated financial statements.
F-46
Table of Contents
ADVANCED DRAINAGE SYSTEMS, INC. AND SUBSIDIARIES
CONDENSED CONSOLIDATED STATEMENTS OF STOCKHOLDERS’ EQUITY AND MEZZANINE EQUITY (unaudited)
| Common Stock | Paid- In Capital |
Common Stock in Treasury |
Accumulated Other Comprehensive Loss |
Retained Earnings |
Total ADS Stock- holders’ Equity |
Non- controlling Interest in Subsidiaries |
Total Stockholders’ Equity |
Redeemable Common Stock |
Redeemable Convertible Preferred Stock |
Deferred Compensation – Unearned ESOP Shares |
Total Mezzanine Equity |
|||||||||||||||||||||||||||||||||||||||||||||||||||||||||||
| (Amounts in thousands) | Shares | Amount | Shares | Amount | Shares | Amount | Shares | Amount | Shares | Amount | ||||||||||||||||||||||||||||||||||||||||||||||||||||||||||||
| Balance at April 1, 2012 |
23,365 | 11,957 | 39,661 | 21,579 | (449,583 | ) | (1,375 | ) | 110,863 | (288,477 | ) | 20,628 | (267,849 | ) | 8,135 | 482,006 | 5,705 | 264,429 | 4,075 | (188,872 | ) | 557,563 | ||||||||||||||||||||||||||||||||||||||||||||||||
|
|
|
|
|
|
|
|
|
|
|
|
|
|
|
|
|
|
|
|
|
|
|
|
|
|
|
|
|
|
|
|
|
|
|
|||||||||||||||||||||||||||||||||||||
| Net income |
— | — | — | — | — | — | 31,608 | 31,608 | 1,654 | 33,262 | — | — | — | — | — | — | — | |||||||||||||||||||||||||||||||||||||||||||||||||||||
| Other comprehensive income (loss) |
— | — | — | — | — | 751 | — | 751 | 1,161 | 1,912 | — | — | — | — | — | — | — | |||||||||||||||||||||||||||||||||||||||||||||||||||||
| Redeemable Convertible Preferred Stock dividend |
— | — | — | — | — | — | (446 | ) | (446 | ) | — | (446 | ) | — | — | — | — | — | — | — | ||||||||||||||||||||||||||||||||||||||||||||||||||
| Common stock dividend ($0.33 per share) |
— | — | — | — | — | — | (3,776 | ) | (3,776 | ) | — | (3,776 | ) | — | — | — | — | — | — | — | ||||||||||||||||||||||||||||||||||||||||||||||||||
| Dividend paid to noncontrolling interest holder |
— | — | — | — | — | — | — | — | (500 | ) | (500 | ) | — | — | — | — | — | — | — | |||||||||||||||||||||||||||||||||||||||||||||||||||
| Allocation of ESOP shares to participants for compensation |
— | — | (1,566 | ) | — | — | — | — | (1,566 | ) | — | (1,566 | ) | — | — | — | — | (171 | ) | 8,350 | 8,350 | |||||||||||||||||||||||||||||||||||||||||||||||||
| Exercise of common stock options |
— | — | (98 | ) | (41 | ) | 865 | — | — | 767 | — | 767 | — | — | — | — | — | — | — | |||||||||||||||||||||||||||||||||||||||||||||||||||
| Redemption of common shares to exercise stock options |
— | — | 520 | 9 | (520 | ) | — | — | — | — | — | — | — | — | — | — | — | — | ||||||||||||||||||||||||||||||||||||||||||||||||||||
| Stock based compensation |
— | — | 367 | — | — | — | — | 367 | — | 367 | — | — | — | — | — | — | — | |||||||||||||||||||||||||||||||||||||||||||||||||||||
| Restricted stock awards |
— | — | 212 | (30 | ) | 628 | — | — | 840 | — | 840 | — | — | — | — | — | — | — | ||||||||||||||||||||||||||||||||||||||||||||||||||||
| Redemption of Redeemable Convertible Preferred Stock |
— | — | — | — | — | — | — | — | — | — | — | — | (53 | ) | (2,484 | ) | — | — | (2,484 | ) | ||||||||||||||||||||||||||||||||||||||||||||||||||
| Purchase of common stock |
— | — | — | 4 | (249 | ) | — | — | (249 | ) | — | (249 | ) | — | — | — | — | — | — | — | ||||||||||||||||||||||||||||||||||||||||||||||||||
| Adjustments to Redeemable Convertible Preferred Stock fair value measurement |
— | — | — | — | — | — | (3,682 | ) | (3,682 | ) | — | (3,682 | ) | — | — | — | 13,281 | — | (9,599 | ) | 3,682 | |||||||||||||||||||||||||||||||||||||||||||||||||
| Adjustments to Redeemable Common Stock fair value measurement |
— | — | — | — | — | — | (24,406 | ) | (24,406 | ) | — | (24,406 | ) | — | 24,406 | — | — | — | — | 24,406 | ||||||||||||||||||||||||||||||||||||||||||||||||||
|
|
|
|
|
|
|
|
|
|
|
|
|
|
|
|
|
|
|
|
|
|
|
|
|
|
|
|
|
|
|
|
|
|
|
|||||||||||||||||||||||||||||||||||||
| Balance at December 31, 2012 |
23,365 | 11,957 | 39,096 | 21,521 | (448,859 | ) | (624 | ) | 110,161 | (288,269 | ) | 22,943 | (265,326 | ) | 8,135 | 506,412 | 5,652 | 275,226 | 3,904 | (190,121 | ) | 591,517 | ||||||||||||||||||||||||||||||||||||||||||||||||
|
|
|
|
|
|
|
|
|
|
|
|
|
|
|
|
|
|
|
|
|
|
|
|
|
|
|
|
|
|
|
|
|
|
|
|||||||||||||||||||||||||||||||||||||
| Balance at April 1, 2013 |
23,365 | 11,957 | 41,152 | 21,498 | (448,571 | ) | (856 | ) | 87,331 | (308,987 | ) | 23,265 | (285,722 | ) | 8,135 | 522,276 | 5,640 | 282,547 | 3,922 | (196,477 | ) | 608,346 | ||||||||||||||||||||||||||||||||||||||||||||||||
|
|
|
|
|
|
|
|
|
|
|
|
|
|
|
|
|
|
|
|
|
|
|
|
|
|
|
|
|
|
|
|
|
|
|
|||||||||||||||||||||||||||||||||||||
| Net income |
— | — | — | — | — | — | 23,294 | 23,294 | 1,360 | 24,654 | — | — | — | — | — | — | — | |||||||||||||||||||||||||||||||||||||||||||||||||||||
| Other comprehensive income (loss) |
— | — | — | — | — | (5,266 | ) | — | (5,266 | ) | (1,327 | ) | (6,593 | ) | — | — | — | — | — | — | — | |||||||||||||||||||||||||||||||||||||||||||||||||
| Redeemable Convertible Preferred Stock dividend |
— | — | — | — | — | — | (526 | ) | (526 | ) | — | (526 | ) | — | — | — | — | — | — | — | ||||||||||||||||||||||||||||||||||||||||||||||||||
| Common stock dividend ($0.36 per share) |
— | — | — | — | — | — | (4,089 | ) | (4,089 | ) | — | (4,089 | ) | — | — | — | — | — | — | — | ||||||||||||||||||||||||||||||||||||||||||||||||||
| Dividend paid to noncontrolling interest holder |
— | — | — | — | — | — | — | — | (1,179 | ) | (1,179 | ) | — | — | — | — | — | — | — | |||||||||||||||||||||||||||||||||||||||||||||||||||
| Allocation of ESOP shares to participants for compensation |
— | — | (2,139 | ) | — | — | — | — | (2,139 | ) | — | (2,139 | ) | — | — | — | — | (171 | ) | 9,482 | 9,482 | |||||||||||||||||||||||||||||||||||||||||||||||||
| Exercise of common stock options |
— | — | (203 | ) | (30 | ) | 629 | — | — | 426 | — | 426 | — | — | — | — | — | — | — | |||||||||||||||||||||||||||||||||||||||||||||||||||
| Redemption of common shares to exercise stock options |
— | — | 299 | 5 | (299 | ) | — | — | — | — | — | — | — | — | — | — | — | — | ||||||||||||||||||||||||||||||||||||||||||||||||||||
| Stock based compensation |
— | — | 1,254 | — | — | — | — | 1,254 | — | 1,254 | — | — | — | — | — | — | — | |||||||||||||||||||||||||||||||||||||||||||||||||||||
| Restricted stock awards |
— | — | 1,013 | (6 | ) | 125 | — | — | 1,138 | — | 1,138 | — | — | — | — | — | — | — | ||||||||||||||||||||||||||||||||||||||||||||||||||||
| Redemption of Redeemable Convertible Preferred Stock |
— | — | — | — | — | — | — | — | — | — | — | — | (78 | ) | (3,889 | ) | — | — | (3,889 | ) | ||||||||||||||||||||||||||||||||||||||||||||||||||
| Purchase of common stock |
— | — | — | 17 | (847 | ) | — | — | (847 | ) | — | (847 | ) | — | — | — | — | — | — | — | ||||||||||||||||||||||||||||||||||||||||||||||||||
| Reclassification of common stock to Redeemable Common Stock |
(6 | ) | — | (385 | ) | — | — | — | — | (385 | ) | — | (385 | ) | 6 | 385 | — | — | — | — | 385 | |||||||||||||||||||||||||||||||||||||||||||||||||
| Adjustments to Redeemable Convertible Preferred Stock fair value measurement |
— | — | — | — | — | — | (8,492 | ) | (8,492 | ) | — | (8,492 | ) | — | — | — | 28,923 | — | (20,431 | ) | 8,492 | |||||||||||||||||||||||||||||||||||||||||||||||||
| Adjustments to Redeemable Common Stock fair value measurement |
— | — | — | — | — | — | (55,359 | ) | (55,359 | ) | — | (55,359 | ) | — | 55,359 | — | — | — | — | 55,359 | ||||||||||||||||||||||||||||||||||||||||||||||||||
|
|
|
|
|
|
|
|
|
|
|
|
|
|
|
|
|
|
|
|
|
|
|
|
|
|
|
|
|
|
|
|
|
|
|
|||||||||||||||||||||||||||||||||||||
| Balance at December 31, 2013 |
23,359 | 11,957 | 40,991 | 21,484 | (448,963 | ) | (6,122 | ) | 42,159 | (359,978 | ) | 22,119 | (337,859 | ) | 8,141 | 578,020 | 5,562 | 307,581 | 3,751 | (207,426 | ) | 678,175 | ||||||||||||||||||||||||||||||||||||||||||||||||
|
|
|
|
|
|
|
|
|
|
|
|
|
|
|
|
|
|
|
|
|
|
|
|
|
|
|
|
|
|
|
|
|
|
|
|||||||||||||||||||||||||||||||||||||
See accompanying notes to condensed consolidated financial statements.
F-47
Table of Contents
ADVANCED DRAINAGE SYSTEMS, INC. AND SUBSIDIARIES
NOTES TO CONDENSED CONSOLIDATED FINANCIAL STATEMENTS
(Amounts in thousands, except per share data)
(unaudited)
| 1. | BACKGROUND AND SUMMARY OF SIGNIFICANT ACCOUNTING POLICIES |
Organization
Advanced Drainage Systems, Inc. and subsidiaries (collectively referred to as “ADS”, the “Company”, “we”, “us” and “our”), incorporated in Delaware, designs, manufactures and markets high performance thermoplastic corrugated pipe and related water management products, primarily in North and South America and Europe.
The Company is managed based primarily on the geographies in which it operates and reports results of operations in two reportable segments. The reportable segments are Domestic and International.
Basis of Presentation
The Company prepares its condensed consolidated financial statements in accordance with accounting principles generally accepted in the United States of America (“U.S. GAAP”). The Condensed Consolidated Balance Sheet as of March 31, 2013 was derived from audited financial statements. In our opinion, the accompanying unaudited condensed consolidated financial statements contain all adjustments, of a normal recurring nature, necessary to present fairly its financial position as of December 31, 2013 and the results of operations for nine months ended December 31, 2012 and 2013 and cash flows for the nine months ended December 31, 2012 and 2013. The interim condensed consolidated financial statements should be read in conjunction with the audited consolidated financial statements, including the notes thereto.
Principles of Consolidation
Our condensed consolidated financial statements include the Company, our wholly owned subsidiaries, our majority owned subsidiaries and variable interest entities (“VIEs”) of which we are the primary beneficiary. We use the equity method of accounting for equity investments where we exercise significant influence but do not hold a controlling financial interest. Such investments are recorded in Other assets in our Condensed Consolidated Balance Sheets and the related equity earnings from these investments is included in Equity in net income of unconsolidated affiliates in our Condensed Consolidated Statements of Income. All intercompany balances and transactions have been eliminated in consolidation.
Estimates
The preparation of our condensed consolidated financial statements in conformity with accounting principles generally accepted in the United States of America requires management to make estimates and assumptions that affect the reported amounts of assets and liabilities, the disclosure of contingent assets and liabilities at the date of the condensed consolidated financial statements and the reported amounts of revenues and expenses during the reporting period. Significant estimates include, but are not limited to, our allowance for doubtful accounts, useful lives of our property, plant and equipment and amortizing intangible assets, valuation allowance on deferred tax assets, reserves for uncertain tax positions, evaluation of goodwill, intangible assets and other long-lived assets for impairment, accounting for stock based compensation and our ESOP, reserves for general liability, workers’ compensation, and medical insurance, cash discounts and customer rebates and valuation of our Redeemable Common Stock and Redeemable Convertible Preferred Stock. Management’s estimates and assumptions are evaluated on an ongoing basis and are based on historical experience, current conditions and available information. Management believes
F-48
Table of Contents
the accounting estimates are appropriate and reasonably determined; however, due to the inherent uncertainties in making these estimates, actual results could differ from those estimates.
Unaudited Supplemental Pro Forma Information
In January 2014, the Board of Directors declared a Special Dividend of $108,101, which was financed through our Revolving Credit Facility. Additionally, we anticipate using a portion of the net proceeds from the offering to repay a portion of the amount borrowed under the Revolving Credit Facility used to fund the Special Dividend. In accordance with the SEC Staff Accounting Bulletin (“SAB”) 1.B.3 and SAB 3.A, we are presented with two required calculations to present unaudited supplemental pro forma net income per share amounts, calculated in accordance with Article 11 of Regulation S-X, which will be included in the Consolidated Statement of Income for the Fiscal Year Ended March 31, 2014. These calculations include a methodology outlined in SAB 1.B.3 as a result of the Special Dividend which was declared in contemplation of the offering, which may be in excess of current period earnings, and the methodology outlined in SAB 3.A, as of the result of the anticipation of a portion of the net proceeds from the offering being used to repay our Revolving Credit Facility. These calculations may yield differing amounts. For the fiscal year ending March 31, 2014, we anticipate presenting the most dilutive of the two methods to calculate unaudited supplemental pro forma net income per share. See Note 17 for further details regarding the Special Dividend.
In addition to the requirements for presenting unaudited supplemental pro forma net income per share, as the Special Dividend was declared subsequent to the December 31, 2013 balance sheet, in accordance with SAB 1.B.3, we are required to present unaudited supplemental balance sheet data along with our Consolidated Balance Sheets adjusted to reflect the impact to our December 31, 2013 balance sheet as if the Special Dividend was declared on December 31, 2013.
| 2. | ASSET AND LIABILITIES CLASSIFIED AS HELD FOR SALE AND SALE OF ASSETS/BUSINESSES |
Assets and liabilities classified as held for sale
As of December 31, 2013, we held assets and liabilities classified as held for sale related to a property and asset sale that were closed subsequent to the balance sheet date. On December 12, 2013, Hancor, Inc., a wholly-owned subsidiary of ADS Inc., entered into an agreement for purchase and sale of real property to sell its Mebane, North Carolina property, including all improvements and fixtures currently located on the property, to RJR Properties, LLC for $1,200. The transaction closed in February 2014. On January 15, 2014, ADS Inc. entered into an asset purchase agreement to sell the assets of our Greencastle, Pennsylvania precast concrete operation to Concrete Pipe and Precast, LLC.
Assets and liabilities classified as held for sale at December 31, 2013 are as follows:
| (Amounts in thousands) | 2013 | |||
| Assets |
||||
| Inventory |
$ | 1,446 | ||
| Other assets |
97 | |||
|
|
|
|||
| Assets held for sale, current |
$ | 1,543 | ||
|
|
|
|||
| Property, plant, and equipment |
$ | 2,550 | ||
|
|
|
|||
| Assets held for sale, non-current |
$ | 2,550 | ||
|
|
|
|||
| Liabilities |
||||
| Other current liabilities |
$ | 83 | ||
|
|
|
|||
| Liabilities held for sale, current |
$ | 83 | ||
|
|
|
|||
F-49
Table of Contents
Sale of Assets/Businesses
On December 21, 2012, we entered into an asset purchase agreement (the “Basalite Agreement”) to sell substantially all of the assets used in connection with our plastic edging product line to Basalite Concrete Products, LLC (“Basalite”) in exchange for cash and a note receivable. The Basalite Agreement defined the purchase price to consist of a cash payment of $600, plus other consideration in the form of an executed promissory note for $1,800. Under terms of the note, Basalite will pay ADS $600 cash on each of the first three one-year anniversaries of the closing date. The net book value for the related assets, consisting of inventory and property and equipment, was $190 bringing the net gain recognized to $2,210. The sale transaction closed on December 28, 2012.
On June 28, 2013, we entered into an Asset Purchase Agreement (the “NDS Agreement”) to sell substantially all of the assets used in connection with our DrainTech product line to National Diversified Sales, Inc. (“NDS”) in exchange for cash. The NDS Agreement defined the purchase price to consist of a cash payment of $5,877. The net book value for the related assets, consisting of inventory and property and equipment, was $1,029 bringing the net gain recognized to $4,848. The sale transaction closed on June 28, 2013.
| 3. | ACQUISITIONS |
The purchase price for business combinations is allocated to the estimated fair values of acquired tangible and intangible assets and assumed liabilities, including goodwill, where applicable. Additionally, we recognize customer relationships, trademarks and non-competition agreements as identifiable intangible assets. The assets are recorded at fair value as of the transaction date. The fair value of these intangibles is determined primarily using the income approach which involves significant unobservable inputs (Level 3 inputs). These inputs include projected sales, margin, required rate of return and tax rate.
For the nine months ended December 31, 2012
During the nine months ended December 31, 2012, we completed the acquisition of two businesses that individually and in the aggregate were not significant. The aggregate purchase price of these acquisitions was $5,239, which included a note payable of $400, plus additional contingent consideration with an initial estimated fair value of $1,271. The condensed consolidated financial statements include the results of operations from these business combinations from the date of each acquisition.
For the nine months ended December 31, 2013
During the nine months ended December 31, 2013, we entered into an agreement to form a new joint venture, BaySaver Technologies LLC (“BaySaver”). As further discussed within Note 9, we will account for our investment in BaySaver under the equity method of accounting.
For the nine months ended December 31, 2012 and 2013, transaction costs were immaterial. These costs are included in General and administrative expenses in our Condensed Consolidated Statements of Income.
F-50
Table of Contents
| 4. | PROPERTY, PLANT AND EQUIPMENT — NET |
Property, plant and equipment — net as of March 31, 2013 and December 31, 2013 consisted of the following:
| (Amounts in thousands) | March 31, 2013 |
December 31, 2013 |
||||||
| Land, buildings and improvements |
$ | 149,974 | $ | 150,186 | ||||
| Machinery and equipment |
504,853 | 522,816 | ||||||
|
|
|
|
|
|||||
| Total cost |
654,827 | 673,002 | ||||||
| Less accumulated depreciation |
(359,926 | ) | (382,504 | ) | ||||
|
|
|
|
|
|||||
| Property, plant and equipment — net |
$ | 294,901 | $ | 290,498 | ||||
|
|
|
|
|
|||||
The following table sets forth depreciation expense in each of the nine months ending December 31:
| (Amounts in thousands) | 2012 | 2013 | ||||||
| Depreciation expense |
$ | 27,613 | $ | 27,989 | ||||
| 5. | INVENTORIES |
Inventories as of March 31, 2013 and December 31, 2013 consisted of the following:
| (Amounts in thousands) | March 31, 2013 |
December 31, 2013 |
||||||
| Raw materials |
$ | 45,455 | $ | 48,580 | ||||
| Finished goods |
186,954 | 154,268 | ||||||
|
|
|
|
|
|||||
| Total inventory |
$ | 232,409 | $ | 202,848 | ||||
|
|
|
|
|
|||||
We had no work-in-process inventories as of March 31, 2013 and December 31, 2013.
| 6. | GOODWILL AND INTANGIBLE ASSETS |
Goodwill
The carrying amount of goodwill by reportable segment is as follows:
| (Amounts in thousands) | Domestic | International | Total | |||||||||
| Balance at April 1, 2013 |
$ | 85,702 | $ | 557 | $ | 86,259 | ||||||
| Currency translation |
— | (31 | ) | (31 | ) | |||||||
|
|
|
|
|
|
|
|||||||
| Balance at December 31, 2013 |
$ | 85,702 | $ | 526 | $ | 86,228 | ||||||
|
|
|
|
|
|
|
|||||||
F-51
Table of Contents
Intangible Assets
Intangible assets as of March 31, 2013 and December 31, 2013 consisted of the following:
| (Amounts in thousands) | March 31, 2013 | December 31, 2013 | ||||||||||||||||||||||
| Gross Intangible |
Accumulated Amortization |
Net Intangible |
Gross Intangible |
Accumulated Amortization |
Net Intangible |
|||||||||||||||||||
| Definite-lived intangible assets |
||||||||||||||||||||||||
| Developed technology |
$ | 40,579 | $ | (18,773 | ) | $ | 21,806 | $ | 40,579 | $ | (21,635 | ) | $ | 18,944 | ||||||||||
| Customer lists |
39,252 | (17,178 | ) | 22,074 | 39,252 | (20,855 | ) | 18,397 | ||||||||||||||||
| Patents |
5,669 | (2,293 | ) | 3,376 | 5,973 | (2,761 | ) | 3,212 | ||||||||||||||||
| Contract agreements |
11,493 | (2,320 | ) | 9,173 | 11,493 | (3,790 | ) | 7,703 | ||||||||||||||||
| Trademarks |
12,857 | (2,585 | ) | 10,272 | 12,857 | (3,867 | ) | 8,990 | ||||||||||||||||
|
|
|
|
|
|
|
|
|
|
|
|
|
|||||||||||||
| Total definite-lived intangible assets |
109,850 | (43,149 | ) | 66,701 | 110,154 | (52,908 | ) | 57,246 | ||||||||||||||||
| Indefinite-lived intangible assets |
||||||||||||||||||||||||
| Trademarks |
12,016 | 12,016 | 12,003 | 12,003 | ||||||||||||||||||||
|
|
|
|
|
|
|
|
|
|
|
|
|
|||||||||||||
| Total intangible assets |
$ | 121,866 | $ | (43,149 | ) | $ | 78,717 | $ | 122,157 | $ | (52,908 | ) | $ | 69,249 | ||||||||||
|
|
|
|
|
|
|
|
|
|
|
|
|
|||||||||||||
The following table sets forth amortization expense for the nine months ended December 31, 2012 and 2013:
| (Amounts in thousands) | 2012 | 2013 | ||||||
| Amortization expense |
$ | 13,598 | $ | 14,056 | ||||
| 7. | FAIR VALUE MEASUREMENT |
When applying fair value principles in the valuation of assets and liabilities, we are required to maximize the use of quoted market prices and minimize the use of unobservable inputs. The Company has not changed its valuation techniques used in measuring the fair value of any financial assets or liabilities during the periods presented. Our fair value estimates take into consideration the credit risk of both the Company and our counterparties.
When active market quotes are not available for financial assets and liabilities, we use industry standard valuation models. Where applicable, these models project future cash flows and discount the future amounts to a present value using market-based observable inputs including credit risk, interest rate curves, foreign currency rates and forward and spot prices for currencies. In circumstances where market-based observable inputs are not available, management judgment is used to develop assumptions to estimate fair value. Generally, the fair value of our Level 3 instruments is estimated as the net present value of expected future cash flows based on internal and external inputs.
F-52
Table of Contents
Recurring Fair Value Measurements
The assets and liabilities carried at fair value as of March 31, 2013 and December 31, 2013 were as follows:
| March 31, 2013 | ||||||||||||||||
| (Amounts in thousands) | Total | Level 1 | Level 2 | Level 3 | ||||||||||||
| Assets: |
||||||||||||||||
| Derivative assets — diesel fuel contracts |
$ | 55 | $ | — | $ | 55 | $ | — | ||||||||
|
|
|
|
|
|
|
|
|
|||||||||
| Total assets at fair value on a recurring basis |
$ | 55 | $ | — | $ | 55 | $ | — | ||||||||
|
|
|
|
|
|
|
|
|
|||||||||
| Liabilities & Mezzanine Equity: |
||||||||||||||||
| Derivative liability — interest rate swaps |
$ | 1,082 | $ | — | $ | 1,082 | $ | — | ||||||||
| Derivative liability — currency forwards |
3 | — | 3 | — | ||||||||||||
| Contingent consideration for acquisitions |
2,535 | — | — | 2,535 | ||||||||||||
| Redeemable Common Stock |
522,276 | — | — | 522,276 | ||||||||||||
| Redeemable Convertible Preferred Stock |
282,547 | — | — | 282,547 | ||||||||||||
| Deferred compensation — unearned ESOP shares |
(196,477 | ) | — | — | (196,477 | ) | ||||||||||
|
|
|
|
|
|
|
|
|
|||||||||
| Total liabilities & mezzanine equity at fair value on a recurring basis |
$ | 611,966 | $ | — | $ | 1,085 | $ | 610,881 | ||||||||
|
|
|
|
|
|
|
|
|
|||||||||
| December 31, 2013 | ||||||||||||||||
| (Amounts in thousands) | Total | Level 1 | Level 2 | Level 3 | ||||||||||||
| Assets: |
||||||||||||||||
| Derivative assets — diesel fuel contracts |
$ | 50 | $ | — | $ | 50 | $ | — | ||||||||
|
|
|
|
|
|
|
|
|
|||||||||
| Total Assets at fair value on a recurring basis |
$ | 50 | $ | — | $ | 50 | $ | — | ||||||||
|
|
|
|
|
|
|
|
|
|||||||||
| Liabilities & Mezzanine Equity: |
||||||||||||||||
| Derivative liability — interest rate swaps |
$ | 1,134 | $ | — | $ | 1,134 | $ | — | ||||||||
| Contingent consideration for acquisitions |
2,090 | — | — | 2,090 | ||||||||||||
| Redeemable Common Stock |
578,020 | — | — | 578,020 | ||||||||||||
| Redeemable Convertible Preferred Stock |
307,581 | — | — | 307,581 | ||||||||||||
| Deferred compensation — unearned ESOP shares |
(207,426 | ) | — | — | (207,426 | ) | ||||||||||
|
|
|
|
|
|
|
|
|
|||||||||
| Total liabilities & mezzanine equity at fair value on a recurring basis |
$ | 681,399 | $ | — | $ | 1,134 | $ | 680,265 | ||||||||
|
|
|
|
|
|
|
|
|
|||||||||
Changes in the fair value of recurring fair value measurements using significant unobservable inputs (Level 3) for the nine months ended December 31, 2013 were as follows (amounts in thousands):
| Balance as of March 31, 2013 |
$ | 610,881 | ||
| Change in estimate of contingent consideration |
(445 | ) | ||
| Allocation of ESOP shares to participants |
9,482 | |||
| Redemption of Redeemable Convertible Preferred Stock |
(3,889 | ) | ||
| Reclassification of common stock to Redeemable Common Stock |
385 | |||
| Change in fair value related to items recorded in mezzanine equity |
63,851 | |||
|
|
|
|||
| Balance as of December 31, 2013 |
$ | 680,265 | ||
|
|
|
For the fiscal year ended March 31, 2013 and the nine months ended December 31, 2013 there were no transfers in or out of Levels 1, 2, and 3.
F-53
Table of Contents
Valuation of our Contingent Consideration for Acquisitions
The fair values of the contingent consideration payables were calculated with reference to the estimated future value of the Inserta Tee and FleXstorm businesses, which are based on a discounted cash flow model. The undiscounted value is discounted at the present value using a market discount rate. The categorization of the framework used to price this liability is considered a Level 3, due to the subjective nature of the unobservable inputs used to determine the fair value.
Valuation of our Redeemable Common Stock
The Company has certain shares of common stock outstanding whereby the holder may put its shares to us for cash. This Redeemable Common Stock is recorded at its fair value in the mezzanine equity section of our Condensed Consolidated Balance Sheets and changes in fair value are recorded in Retained earnings. Historically, the fair value of a share of common stock was determined by Management by applying industry-appropriate multiples to EBITDA and performing a discounted cash flow analysis. Under the industry-appropriate multiples approach, to arrive at concluded multiples, we considered differences between the risk and return characteristics of ADS and the guideline companies. Under the discounted cash flow analysis, the cash flows expected to be generated by the Company are discounted to their present value equivalent using a rate of return that reflects the relative risk of an investment in ADS, as well as the time value of money. This return is an overall rate based upon the individual rates of return for invested capital (equity and interest-bearing debt). The return, known as the weighted average cost of capital (“WACC”), is calculated by weighting the required returns on interest-bearing debt and common stock in proportion to their estimated percentages in an expected capital structure. The WACC used was 12.5% and 13% as of March 31, 2013 and December 31, 2013, respectively. An increase in the WACC would decrease the fair value of the Redeemable Common Stock. The categorization of the framework used to price this temporary equity is considered a Level 3, due to the subjective nature of the unobservable inputs used to determine the fair value.
Valuation of our Redeemable Convertible Preferred Stock
The Trustee of the Company’s ESOP has the ability to put the shares of our Redeemable Convertible Preferred Stock to the Company. Our Redeemable Convertible Preferred Stock is recorded at its fair value in the mezzanine equity section of our Condensed Consolidated Balance Sheets and changes in fair value are recorded in Retained earnings. Accordingly, we estimated the fair value of the Redeemable Convertible Preferred Stock through estimating the fair value of the Company’s common stock and applying certain adjustments including for the fair value of the total dividends to be received and assuming conversion of the preferred stock to common stock at the stated conversion ratio per our Articles of Incorporation. The categorization of the framework used to price this temporary equity is considered a Level 3, due to the subjective nature of the unobservable inputs used to determine the fair value.
Nonrecurring Fair Value Measurements
Goodwill and indefinite lived intangible assets are tested for impairment annually as of March 31 or whenever events or changes in circumstances indicate the carrying value may be greater than fair value.
| 8. | VARIABLE INTEREST ENTITIES |
The accounting model for VIEs described in ASC 810-10 considers if a company has a controlling financial interest in a VIE. A controlling financial interest will have both (a) the power to direct the activities of a VIE that most significantly impact the VIE’s economic performance and (b) the obligation to absorb losses of a VIE that could potentially be significant to the VIE or the right to receive benefits from the VIE that could be potentially significant to the VIE. Entities are required to consolidate a VIE when it is determined that they have a controlling financial interest in a VIE and therefore, are the primary beneficiary of that VIE.
F-54
Table of Contents
In determining whether we are the primary beneficiary of a VIE, we consider factors such as voting rights including kick-out rights, whether we have the power to direct the VIE’s significant activities, variable interests held by related parties and other factors. We believe that significant assumptions and judgments were applied consistently.
We participate in joint ventures from time to time for the purpose of expanding upon our growth of manufacturing and selling HDPE corrugated pipe in emerging markets. Our investments in these joint ventures may create a variable interest in a VIE, depending upon the contractual terms of the arrangement. One of our joint ventures, ADS Mexicana, in which we own 50% controlling interest, was determined to be a VIE. We invest in this VIE for the purpose of expanding upon our growth of manufacturing and selling ADS licensed HDPE corrugated pipe and related products in the Mexican and Central American markets via the joint venture partner’s local presence and expertise throughout the region. We have executed a Technology, Patents and Trademarks Sub-License Agreement and a Distribution Agreement with ADS Mexicana that provides ADS Mexicana with the rights to manufacture and sell ADS licensed products in Mexico and Central America. We are the guarantor of 100% of ADS Mexicana’s credit facility and our maximum potential payment under this guarantee totals $12,000. We have concluded that we hold a variable interest in and are the primary beneficiary of ADS Mexicana based on our power to direct the most significant activities of ADS Mexicana and our obligation to absorb losses and our right to receive benefits that could be significant to ADS Mexicana. As the primary beneficiary, we are required to consolidate the assets and liabilities of ADS Mexicana. The equity owned by our joint venture partner is shown as Noncontrolling interest in subsidiaries in our Condensed Consolidated Balance Sheets and our joint venture partner’s portion of net income is shown as Net income attributable to noncontrolling interest in our Condensed Consolidated Statements of Income
The table below includes the assets and liabilities of ADS Mexicana that are consolidated as of March 31, 2013 and December 31, 2013. The balances exclude intercompany transactions that are eliminated upon consolidation.
| (Amounts in thousands) | ||||||||
| March 31, 2013 |
December 31, 2013 |
|||||||
| Assets |
||||||||
| Current assets |
$ | 33,252 | $ | 33,157 | ||||
| Property, plant and equipment, net |
23,655 | 21,137 | ||||||
| Other noncurrent assets |
3,144 | 2,603 | ||||||
|
|
|
|
|
|||||
| Total assets |
$ | 60,051 | $ | 56,897 | ||||
|
|
|
|
|
|||||
| March 31, 2013 |
December 31, 2013 |
|||||||
| Liabilities |
||||||||
| Current liabilities |
$ | 9,777 | $ | 7,510 | ||||
| Noncurrent liabilities |
2,283 | 1,501 | ||||||
|
|
|
|
|
|||||
| Total liabilities |
$ | 12,060 | $ | 9,011 | ||||
|
|
|
|
|
|||||
| 9. | INVESTMENT IN UNCONSOLIDATED AFFILIATES |
We participate in two unconsolidated joint ventures, Tuberias Tigre — ADS Limitada (“Tigre ADS”), which is 50%-owned by our wholly-owned subsidiary ADS Chile, and BaySaver Technologies, LLC (“BaySaver”), which is 55% owned by our wholly-owned subsidiary ADS Ventures, Inc.
F-55
Table of Contents
Tigre ADS
Our investment in this unconsolidated joint venture was formed for the purpose of expanding upon our growth of manufacturing and selling high performance thermoplastic corrugated pipe in the South American market via the joint venture partner’s local presence and expertise throughout the region. We are the guarantor for 50% of Tigre ADS’ credit facility, and the debt guarantee is shared equally with the joint venture partner. Our maximum potential payment under this guarantee totals $7,000. We are not required to consolidate Tigre ADS under ASC 810-10 as we are not the primary beneficiary, although we do hold a significant variable interest in Tigre ADS through our equity investment and debt guarantee. The results of Tigre ADS are accounted for in the condensed consolidated financial statements using the equity method of accounting. Our share of the income of this joint venture is reported in the Condensed Consolidated Statements of Income under Equity in net income of unconsolidated affiliates. Our investment in this joint venture is included in other assets in the Condensed Consolidated Balance Sheets.
Summarized financial data as of March 31, 2013 and December 31, 2013, for the Tigre ADS joint venture is as follows:
| (Amounts in thousands) | March 31, 2013 | December 31, 2013 | ||||||||||||||
| As reported on Balance Sheet |
Maximum Exposure |
As reported on Balance Sheet |
Maximum Exposure |
|||||||||||||
| Investment in Tigre ADS |
$ | 22,012 | $ | 22,012 | $ | 22,004 | $ | 22,004 | ||||||||
| Receivable from Tigre ADS |
8,113 | 8,113 | 7,422 | 7,422 | ||||||||||||
| ADS’ Guarantee of Tigre ADS Debt |
— | 7,000 | — | 7,000 | ||||||||||||
BaySaver
On July 15, 2013, ADS Ventures, Inc., a wholly-owned subsidiary of the Company, BaySaver Technologies, Inc. (“BTI”) and Mid Atlantic Storm Water Research Center, Inc. (“MASWRC”) entered into an LLC agreement to form a new joint venture, BaySaver. The joint venture was established to design, engineer, manufacture, market and sell water quality filters and separators used in the removal of sediment and pollution from storm water anywhere in the world except New Zealand, Australia and South Africa. The Company contributed $3,500 in cash, $1,285 in inventory, and other intangible assets with no carrying value, in exchange for a 55% equity interest and a 50% voting interest in BaySaver. We are not required to consolidate BaySaver under ASC 810-10 as we are not the primary beneficiary, although we do hold a significant variable interest in BaySaver through our equity investment. The Company accounts for its investment in BaySaver under the equity method of accounting. Our share of the income of this joint venture is reported in the Condensed Consolidated Statements of Income under Equity in net income of unconsolidated affiliates. Our investment in this joint venture is included in Other assets in the Condensed Consolidated Balance Sheets.
Summarized financial data as of the nine months ended December 31, 2013 for the BaySaver joint venture is as follows:
| (Amounts in thousands) | As reported on Balance Sheet |
Maximum Exposure |
||||||
| Investment in BaySaver |
$ | 5,011 | $ | 5,011 | ||||
| Receivable from BaySaver |
187 | 187 | ||||||
Our share of the income of this joint venture is decreased by amortization expense relating to the basis difference between our cost basis in the investment and the basis reflected at the joint venture level. This basis difference is being recorded over the lives of the underlying assets which gave rise to the basis difference, which is 10 years. The unrecorded basis difference as of December 31, 2013 is $1,886.
F-56
Table of Contents
| 10. | DEBT |
Long-term debt as of March 31, 2013 and December 31, 2013 consisted of the following:
| March 31, 2013 |
December 31, 2013 |
|||||||
| a. Bank term loans: |
||||||||
| Revolving Credit Facility — ADS |
$ | 186,100 | $ | 98,400 | ||||
| Revolving Credit Facility — ADS Mexicana |
1,000 | — | ||||||
| Term note |
77,500 | 98,750 | ||||||
| b. Senior Notes payable |
75,000 | 100,000 | ||||||
| c. Mortgage notes payable |
4,200 | 3,850 | ||||||
| d. Industrial revenue bonds |
6,190 | 5,265 | ||||||
|
|
|
|
|
|||||
| Total |
349,990 | 306,265 | ||||||
| Current maturities |
(11,942 | ) | (8,240 | ) | ||||
|
|
|
|
|
|||||
| Long-term debt obligation |
$ | 338,048 | $ | 298,025 | ||||
|
|
|
|
|
|||||
| a. | Revolving Credit Facility: |
The current ADS Revolving Credit Agreement (the “Revolving Credit Facility”) has been in place with several banks and was recently refinanced on June 12, 2013. The new bank credit facility expires in June 2018.
The new Revolving Credit Facility agreement increased the upper limit of the Revolving Credit Facility to $325,000 for ADS, Inc. and $12,000 for ADS Mexicana. The company also entered into a five-year, $100,000 term note. Both the Revolving Credit Facility and the term note share the same interest rate structure.
The Revolving Credit Facility interest rate is variable and depends upon the Company’s “pricing ratio” as defined in the agreement. The interest rate is derived from the London InterBank Offered Rate (LIBOR) or alternate base rate (Prime Rate) based upon the Company’s option. The average rate at December 31, 2013, was 2.307%. Any letters of credit outstanding reduce the availability on the revolver. The Company had outstanding letters of credit at December 31, 2013, in the amount of $8,505. The amount available for borrowing for ADS, Inc. was $218,095, plus $12,000 in indebtedness outstanding under a separate revolving credit facility with our subsidiary, ADS Mexicana, at December 31, 2013.
Per terms of the new Revolving Credit Facility, ADS is not required to hedge its interest exposure using interest rate swaps; however, it is currently the objective of ADS, Inc. to manage its exposure to variable rate debt. On October 7, 2010, ADS executed two Spot Interest Rate Swaps on the 90-Day LIBOR interest rate. One hedge is related to the $100,000 Term Debt which was part of the previous credit agreement. This fixed rate swap exchanges a fixed rate of 1.105% for a period of four years, expiring on September 1, 2014. The second hedge on the Credit Facility executed on October 7, 2010 was for $50,000 for a period of three years at a fixed rate of 0.890% and expired on September 1, 2013.
On July 18, 2013, ADS executed two Forward Interest Rate Swaps on the 30-Day LIBOR interest rate. One swap was for $50,000 on the Revolving Credit Facility starting on September 3, 2013 at a fixed rate of 0.86% for a period of three years, expiring on September 1, 2016. The second swap executed on July 18, 2013 was for $50,000 on the Revolving Credit Facility starting on September 2, 2014 at a fixed rate of 1.08% for a period of two years, expiring on September 1, 2016.
| b. | Senior Notes payable: |
In December 2009, ADS signed an agreement with Prudential Investment Management, Inc., for the issuance of senior promissory notes (“Senior Notes”), for an aggregate amount of up to
F-57
Table of Contents
$100,000. As part of the recapitalization in 2010, ADS drew $75,000. Interest is payable quarterly and is fixed at 5.6%. The rate is subject to an additional 200 basis point excess leverage fee if calculated leverage exceeds 3 to 1. A principal payment of $25,000 is due in September in each of fiscal years 2017, 2018, and 2019.
In July 2013, ADS issued an additional $25,000 of senior promissory notes (“Senior Notes”) with Prudential Investment Management, Inc. Interest is payable quarterly and is fixed at 4.05%. The rate is subject to an additional 200 basis point excess leverage fee if calculated leverage exceeds 3 to 1. A principal payment of $25,000 is due in September of the fiscal year 2020.
| c. | Mortgage notes payable: |
Two mortgage notes payable require monthly installments through fiscal year 2015. One note has a variable interest rate of 3.419% at December 31, 2013 (New Miami, Ohio), and one note has a fixed rate of 5.1% (Hilliard, Ohio). Land and buildings with a net book value of approximately $8,894 at December 31, 2013, collateralize the two mortgage notes.
| d. | Industrial revenue bonds: |
ADS issued industrial revenue bonds for the construction of four production facilities. The original bond values of $27,300 million require periodic principal and interest payments through fiscal year 2019. During fiscal year 2011, two of the four bonds were retired, leaving a remaining combined principal of $5,265 at December 31, 2013. The interest rates on the two remaining bonds are variable and are computed on a weekly basis. These bonds are not considered auction rate securities. The average rate on these bonds at December 31, 2013, was 3.38%, including a letter of credit fee of 3.25%. Land and buildings with a net book value of approximately $14,907 at December 31, 2013, collateralize the bonds.
The Revolving Credit Facility and the Senior Notes require, among other provisions, that we (1) maintain a minimum fixed charge ratio; (2) maintain a minimum leverage ratio; and (3) establish certain limits on permitted transactions, principally for Indebtedness, capital distributions, loans and investments, and acquisitions and dispositions of assets. Capital distributions are limited to $50 million in any fiscal year if the pro-forma leverage ratio exceeds 3.0 to 1.
| 11. | DERIVATIVE TRANSACTIONS |
The Company uses interest rate swaps, commodity options in the form of collars, and foreign currency forward contracts to manage its various exposures to interest rate, commodity price, and exchange rate fluctuations. For interest rate swaps, the difference between the spot rate and applicable base rate is recorded in interest expense. For collars and forward contracts, contract settlement gains and losses are recorded in the Condensed Consolidated Statements of Income in Cost of goods sold. Gains and (losses) related to the mark-to-market adjustments for changes in fair value of the derivative contracts are recorded in the Condensed Consolidated Statements of Income as Other miscellaneous expense, net. The Company recognized gains and losses on mark-to-market adjustments for changes in fair value on derivative contracts of $(220) and $(54) for the nine months ended December 31, 2012 and 2013, respectively.
A summary of the fair values for the various derivatives at March 31, 2013 and December 31, 2013 is presented below:
| (Amounts in thousands) | March 31, 2013 | December 31, 2013 | ||||||||||||||
| Asset | (Liability) | Asset | (Liability) | |||||||||||||
| Interest rate swaps |
$ | — | $ | (1,082 | ) | $ | — | $ | (1,134 | ) | ||||||
| Diesel fuel option collars |
55 | — | 50 | — | ||||||||||||
| Foreign exchange forward contracts |
— | (3 | ) | — | — | |||||||||||
F-58
Table of Contents
| 12. | COMMITMENTS AND CONTINGENCIES |
Leases
We lease real estate, transportation, and office equipment under various noncancelable operating lease agreements that expire at various dates through fiscal year 2020. Total rent expense was $15,271and $17,274 for the nine months ended December 31, 2012 and 2013, respectively.
Purchase Commitments
At December 31, 2013, commitments for the purchase of major property, plant, and equipment totaled approximately $15,774.
We will, from time to time, secure supplies of resin raw material by agreeing to purchase quantities during a future given period at a fixed price. These purchase contracts are short term in nature and occur in the ordinary course of business. Under such purchase contracts, we have agreed to purchase 108,000 pounds of resin over the period January 2014 through December 2014 at a committed purchase cost of $71,790.
Litigation
We have been named as a defendant in various litigation matters. Management intends to vigorously defend these outstanding claims. We believe we have adequate accrued loss contingencies and that current or threatened litigation matters will not have a material adverse impact on our results of operations or financial condition. Management estimates the maximum loss contingency is $448 and $431 at March 31, 2013 and December 31, 2013, respectively.
| 13. | STOCK COMPENSATION |
Deferred Compensation — Unearned ESOP Shares
The fair value of Redeemable Convertible Preferred Stock held by the ESOP trust, but not yet earned by the ESOP participants or used for dividends, is reported as Deferred compensation — unearned ESOP shares within the mezzanine equity section of our Condensed Consolidated Balance Sheets.
Compensation expense and related dividends paid with ESOP shares are recognized based upon the average fair value of the shares allocated. The shares allocated are for services rendered throughout the period and, therefore, a simple average is used to calculate average fair value. Deferred compensation — unearned ESOP shares are relieved at the fair value, with any difference between the average fair value and the fair value of shares when committed to be released being added to Additional paid in capital. The fair value of the shares committed to be released was $48.70 and $55.30 per share of Redeemable Convertible Preferred Stock at December 31, 2012 and 2013, respectively, resulting in an average fair value per share of $47.53 and $52.70 for the nine months ended December 31, 2012 and 2013, respectively. During the nine months ended December 31, 2012 and 2013, we recognized compensation expense of $6,784 and $7,343, respectively.
Stock Options
Our 2000 stock option plan (“2000 Plan”) provides for the issuance of nonstatutory common stock options to management based upon the discretion of the Board of Directors. The plan generally provides for grants with the exercise price equal to fair value on the date of grant, which vest in three equal annual amounts beginning in year five and expire after 10 years from issuance. On an annual basis, management determines the fair value of the options with the assistance of an independent appraisal.
In August 2013, a new stock option plan (“2013 Plan”) was approved by the Board of Directors and provides for the issuance of up to 500 nonstatutory common stock options to management subject to the Board’s discretion. The plan generally provides for grants with the exercise price equal to fair value on the
F-59
Table of Contents
date of grant. The grants vest in five equal annual amounts beginning in year one and expire after 10 years from issuance. Options issued to the Chief Executive Officer vest equally over four years and expire after 10 years from issuance.
We estimate the fair value of stock options granted after April 1, 2006, using a Black-Scholes option-pricing model, with assumptions as follows:
| 2012 | 2013 | |||||||
| Expected stock price volatility |
48 | % | 44 | % | ||||
| Risk-free interest rate |
1.2 | 2.3 | ||||||
| Weighted-average expected option life (years) |
8 | 8 | ||||||
| Dividend yield |
0.81 | 0.84 | ||||||
For both stock option plans, management determines the fair value of the options based on the Black-Scholes option pricing model. This methodology requires significant inputs including the fair value of our common stock, which is determined via an independent appraisal performed by a reputable valuation firm (See Note 7 for further details of the determination of the fair value of our common stock and Redeemable Common Stock). During the nine months ended December 31, 2012 and 2013, we recognized total stock-based compensation expense under both plans of $367 and $1,502, respectively, which was included with General and administrative expenses in our Condensed Consolidated Statements of Income. As of December 31, 2013 there was a total of $8,103 of unrecognized compensation expense related to all unvested stock option awards that will be recognized as an expense as the awards vest over the remaining service periods. Of this amount, $2,802 relates to liability classified awards and $5,301 relates to equity classified awards. We had approximately 250 and 94 shares available for granting under the 2000 and 2013 plans, respectively, as of December 31, 2013.
2000 Plan
The stock option transactions as of the nine months ended December 31 for the 2000 Plan are summarized as follows:
| 2012 | 2013 | |||||||||||||||||||||||
| Number of Shares |
Weighted Average Exercise Price |
Weighted Average Remaining Contractual Term |
Number of Shares |
Weighted Average Exercise Price |
Weighted Average Remaining Contractual Term |
|||||||||||||||||||
| Outstanding at beginning of period |
321 | $ | 32.76 | 3.9 | 281 | $ | 38.15 | 4.0 | ||||||||||||||||
| Issued |
28 | 59.25 | 3 | 64.20 | ||||||||||||||||||||
| Exercised |
(41 | ) | 22.89 | (30 | ) | 32.08 | ||||||||||||||||||
| Forfeited |
— | — | (1 | ) | 50.70 | |||||||||||||||||||
|
|
|
|
|
|||||||||||||||||||||
| Outstanding at end of period |
308 | 36.83 | 4.0 | 253 | 39.08 | 3.5 | ||||||||||||||||||
|
|
|
|
|
|||||||||||||||||||||
| Exercisable and vested at end of period |
166 | 26.42 | 2.3 | 168 | 32.21 | 1.9 | ||||||||||||||||||
|
|
|
|
|
|||||||||||||||||||||
| Unvested at end of period |
142 | 48.83 | 6.0 | 85 | 52.52 | 6.7 | ||||||||||||||||||
|
|
|
|
|
|||||||||||||||||||||
| Vested and expected to vest at end of period |
283 | 35.80 | 4.6 | 229 | 38.03 | 4.5 | ||||||||||||||||||
|
|
|
|
|
|||||||||||||||||||||
| Fair value of options granted during the period |
28.30 | 30.02 | ||||||||||||||||||||||
F-60
Table of Contents
The following table summarizes information about the nonvested stock option grants as of the nine months ended December 31:
| 2013 | ||||||||
| Number of Shares |
Weighted Average Grant Date Fair Value |
|||||||
| Unvested at beginning of period |
144 | $ | 21.42 | |||||
| Granted |
3 | 30.02 | ||||||
| Vested |
(62 | ) | 25.84 | |||||
| Forfeited |
— | — | ||||||
|
|
|
|||||||
| Unvested at end of period |
85 | $ | 27.24 | |||||
|
|
|
|||||||
2013 Plan
The stock option transactions as of the nine months ended December 31 for the 2013 Stock Option Plan are summarized as follows:
| 2013 | ||||||||||||
| Number of Shares |
Weighted Average Exercise Price |
Weighted Average Remaining Contractual Term |
||||||||||
| Outstanding at beginning of period |
— | $ | — | — | ||||||||
| Issued — equity classified |
306 | 64.20 | — | |||||||||
| Issued — liability classified |
110 | 64.20 | — | |||||||||
| Exercised |
— | — | — | |||||||||
| Forfeited — equity classified |
(10 | ) | 64.20 | — | ||||||||
|
|
|
|||||||||||
| Outstanding at end of period |
406 | 64.20 | 9.67 | |||||||||
|
|
|
|||||||||||
| Exercisable and vested at end of period |
— | — | — | |||||||||
|
|
|
|||||||||||
| Unvested at end of period |
406 | 64.20 | 9.67 | |||||||||
|
|
|
|||||||||||
| Vested and expected to vest at end of period |
362 | 64.20 | 9.67 | |||||||||
|
|
|
|||||||||||
| Fair value of options granted during the period |
$ | 29.29 | ||||||||||
The following table summarizes information about the nonvested stock option grants as of the nine months ended December 31, 2013:
| Number of Shares |
Weighted Average Grant Date Fair Value |
|||||||
| Unvested at beginning of period |
— | $ | — | |||||
| Granted |
416 | 29.29 | ||||||
| Forfeited |
(10 | ) | — | |||||
|
|
|
|||||||
| Unvested at end of period |
406 | $ | 29.29 | |||||
|
|
|
|||||||
Restricted Stock
On September 16, 2008, the Board of Directors adopted the restricted stock plan for which restricted stock awards may be granted to certain key employees. The restricted stock will vest ratably over a five-year period from the original restricted stock grant date with the risk of forfeiture being stipulated only by the employees’ continuous employment by ADS. A portion of the grants vested immediately. Under the
F-61
Table of Contents
restricted stock plan, the vested shares granted are considered issued and outstanding. Employees with restricted stock have the right to dividends on the shares awarded (vested and unvested) in addition to voting rights on nonforfeited shares. The Company recognized compensation expense of $840 and $1,138 in the nine months ended December 31, 2012 and 2013, respectively, relating to the issuance of these shares; of this amount, $533 and $385 relates to the restricted shares that vested immediately during the nine months ended December 31, 2012 and 2013, respectively. We had approximately 69 shares available for granting under this plan as of December 31, 2013.
The following table summarizes information about the unvested restricted stock grants as of December 31, 2013:
| Number of Shares |
Weighted Average Grant Date Fair Value |
|||||||
| Unvested at beginning of period |
58 | $ | 54.75 | |||||
| Granted |
33 | 64.20 | ||||||
| Vested |
(22 | ) | 52.02 | |||||
| Forfeited |
(3 | ) | 57.06 | |||||
|
|
|
|
|
|||||
| Unvested at end of period |
66 | $ | 58.74 | |||||
We expect most, if not all, restricted stock grants to vest.
At December 31, 2013, there was approximately $3,214 of unrecognized compensation expense related to the restricted stock that will be recognized over the remaining service period.
| 14. | INCOME TAXES |
The Company’s effective tax rate will vary based on a variety of factors, including overall profitability, the geographical mix of income before taxes and the related tax rates in the jurisdictions where it operates and other one-time charges, as well as discrete events, such as provision to return adjustments. The increase in our effective tax rate for the nine months ended December 31, 2013 was primarily driven by the expected Special Dividend payment to participants in the ESOP Plan which increased our effective tax rate by 19%. Please refer to Note 17 for additional information on the Special Dividend.
Accounting for uncertain tax positions
Effective April 1, 2009, we adopted the amendments to ASC 740-Income Taxes, related to uncertain tax positions, which provides a consistent recognition threshold and a method for measuring the financial statement impact of a tax position taken, or expected to be taken, in a tax return. The liability is recorded in Other liabilities in the Condensed Consolidated Balance Sheet and was $1,615 and $6,190 as of March 31, 2013 and December 31, 2013, respectively.
| 15. | NET INCOME PER SHARE |
Basic net income per share is calculated by dividing the Net income attributable to common stockholders by the weighted-average number of common shares outstanding during the period, without consideration for common stock equivalents. Diluted net income per share is computed by dividing the Net income attributable to common stockholders by the weighted-average number of common share equivalents outstanding for the period.
Holders of unvested restricted stock have nonforfeitable rights to dividends when declared on common stock, and holders Redeemable Convertible Preferred Stock participate in dividends on an as-converted basis when declared on common stock. As a result, unvested restricted stock and Redeemable Convertible Preferred Stock meet the definition of participating securities, which requires us to apply the two-class
F-62
Table of Contents
method to compute both basic and diluted net income per share. The two-class method is an earnings allocation formula that treats participating securities as having rights to earnings that would otherwise have been available to common stockholders.
The dilutive effect of stock options and unvested restricted stock is based on the more dilutive of the treasury stock method or the diluted two-class method. Diluted earnings per share assumes the Redeemable Convertible Preferred Stock would be cash settled as we have the choice of settling in cash or shares, and we have demonstrated past practice and intent of cash settlement; therefore these shares are excluded from the calculation. For purposes of the calculation of diluted net income per share, stock options and unvested restricted stock are considered to be potential common stock and are only included in the calculations when their effect is dilutive.
The Company’s Redeemable Common Stock is included in the weighted-average number of common shares outstanding for calculating basic and diluted net income per share.
The following table presents information necessary to calculate net income per share for the nine months ended December 31, 2012 and 2013, as well as potentially dilutive securities excluded from the weighted average number of diluted common shares outstanding because their inclusion would have been anti-dilutive:
| Nine Months Ended December 31, | ||||||||
| (Amounts in thousands, except per share data) | 2012 | 2013 | ||||||
| NET INCOME PER SHARE — BASIC: |
||||||||
| Net income attributable to ADS |
$ | 31,608 | $ | 23,294 | ||||
| Adjustment for: |
||||||||
| Change in fair value of Redeemable Convertible Preferred Stock |
(3,682 | ) | (8,492 | ) | ||||
| Dividends paid to Redeemable Convertible Preferred Stockholders |
(554 | ) | (640 | ) | ||||
| Dividends paid to unvested restricted stockholders |
(39 | ) | (47 | ) | ||||
|
|
|
|
|
|||||
| Net income available to common stockholders and participating securities |
27,333 | 14,115 | ||||||
| Undistributed income allocated to participating securities |
(2,703 | ) | (1,184 | ) | ||||
|
|
|
|
|
|||||
| Net income available to common stockholders — Basic |
24,630 | 12,931 | ||||||
| Weighted average number of common shares outstanding — Basic |
9,917 | 9,980 | ||||||
|
|
|
|
|
|||||
| Net income per common share — Basic |
$ | 2.48 | $ | 1.30 | ||||
|
|
|
|
|
|||||
| NET INCOME PER SHARE — DILUTED: |
||||||||
| Net income available to common stockholders — Basic |
24,630 | 12,931 | ||||||
| Weighted average number of common shares outstanding — Basic |
9,917 | 9,980 | ||||||
| Assumed exercise of stock options |
116 | 107 | ||||||
|
|
|
|
|
|||||
| Weighted average number of common shares outstanding — Diluted |
10,033 | 10,087 | ||||||
|
|
|
|
|
|||||
| Net income per common share — Diluted |
$ | 2.45 | $ | 1.28 | ||||
|
|
|
|
|
|||||
| Potentially dilutive securities excluded as anti-dilutive |
14 | 20 | ||||||
| 16. | BUSINESS SEGMENTS INFORMATION |
We operate our business in two distinct operating and reportable segments based on the markets we serve: “Domestic” and “International”. The Chief Operating Decision Maker (“CODM”) evaluates segment reporting based on net sales and Segment EBITDA and Segment Adjusted EBITDA. We calculate Segment EBITDA as net income or loss before interest, income taxes, depreciation and amortization. We calculate Segment Adjusted EBITDA as Segment EBITDA before non-cash stock-based compensation expense, non-cash charges and certain other expenses.
Domestic — Our Domestic segment manufactures and markets products throughout the United States. We maintain and serve these markets through strong product distribution relationships with many of the
F-63
Table of Contents
largest national and independent waterworks distributors, major national retailers as well as an extensive network of hundreds of small to medium-sized distributors across the U.S. We also sell through a broad variety of buying groups and co-ops in the United States. Products include Singlewall pipe, N-12 HDPE pipe sold into the Storm sewer and Infrastructure markets, N-12 High Performance PP pipe sold into the Storm sewer and sanitary sewer markets, and our broad line of Allied Products including Stormtech, Nyloplast, Arc Septic Chambers, Inserta Tee, Baysaver filters and water quality structures, Fittings, and FleXstorm. Our Domestic segment sales are diversified across all regions of the country.
International — Our international segment manufactures and markets products in regions outside of the United States, with a growth strategy focused on our owned facilities in Canada and through our joint-ventures, with best-in-class local partners in Mexico, Central America and South America. Our joint venture strategy provides us with local and regional access to new markets such as Brazil, Chile, Argentina, Peru and Colombia. We have been serving the Canadian market through Hancor of Canada since 2003. Our Mexican joint venture through ADS Mexicana primarily serves the Mexican markets, while our Brazilian joint venture through Tigre ADS is our primary channel to serve the South American markets. Our product line includes Singlewall pipe, N-12 HDPE pipe, and N-12 High Performance PP pipe. The Canadian market also sells our broad line of Allied Products, while sales in Latin America are currently concentrated in fittings and Nyloplast.
The following table sets forth reportable segment information with respect to the amount of net sales contributed by each class of similar products of our consolidated gross profit in the nine months ended December 31, 2012 and 2013:
| Nine Months Ended December 31, | ||||||||
| (Amounts in thousands) |
2012 | 2013 | ||||||
| Domestic |
||||||||
| Pipe |
$ | 539,043 | $ | 584,567 | ||||
| Allied Products |
179,890 | 193,763 | ||||||
|
|
|
|
|
|||||
| Total Domestic |
718,933 | 778,330 | ||||||
|
|
|
|
|
|||||
| International |
||||||||
| Pipe |
92,185 | 88,126 | ||||||
| Allied Products |
21,447 | 21,321 | ||||||
|
|
|
|
|
|||||
| Total International |
113,632 | 109,447 | ||||||
|
|
|
|
|
|||||
| Total net sales |
$ | 832,565 | $ | 887,777 | ||||
|
|
|
|
|
|||||
F-64
Table of Contents
The following sets forth certain additional financial information attributable to our reportable segments for the nine months ended December 31, 2012 and 2013, respectively:
| Nine months ended December 31, | ||||||||
| (Amounts in thousands) | 2012 | 2013 | ||||||
| Net sales |
||||||||
| Domestic |
$ | 718,933 | $ | 778,330 | ||||
| International |
113,632 | 109,447 | ||||||
|
|
|
|
|
|||||
| Total |
$ | 832,565 | $ | 887,777 | ||||
|
|
|
|
|
|||||
| Gross profit |
||||||||
| Domestic |
$ | 147,562 | $ | 165,418 | ||||
| International |
25,720 | 23,568 | ||||||
|
|
|
|
|
|||||
| Total |
$ | 173,282 | $ | 188,986 | ||||
|
|
|
|
|
|||||
| Segment Adjusted EBITDA |
||||||||
| Domestic |
$ | 98,633 | $ | 118,242 | ||||
| International |
17,098 | 12,325 | ||||||
|
|
|
|
|
|||||
| Total |
$ | 115,731 | $ | 130,567 | ||||
|
|
|
|
|
|||||
| Interest expense, net |
||||||||
| Domestic |
$ | 12,430 | $ | 11,815 | ||||
| International |
35 | 45 | ||||||
|
|
|
|
|
|||||
| Total |
$ | 12,465 | $ | 11,860 | ||||
|
|
|
|
|
|||||
| Capital expenditures |
||||||||
| Domestic |
$ | 33,666 | $ | 24,087 | ||||
| International |
1,755 | 3,010 | ||||||
|
|
|
|
|
|||||
| Total |
$ | 35,421 | $ | 27,097 | ||||
|
|
|
|
|
|||||
| Depreciation and amortization |
||||||||
| Domestic |
$ | 37,653 | $ | 38,439 | ||||
| International |
3,558 | 3,606 | ||||||
|
|
|
|
|
|||||
| Total |
$ | 41,211 | $ | 42,045 | ||||
|
|
|
|
|
|||||
| Equity in net income (loss) of unconsolidated affiliates |
||||||||
| Domestic |
$ | — | $ | 226 | ||||
| International |
402 | (940 | ) | |||||
|
|
|
|
|
|||||
| Total |
$ | 402 | $ | (714 | ) | |||
|
|
|
|
|
|||||
The following sets forth certain additional financial information attributable to our reporting segments as of March 31, 2013 and December 31, 2013, respectively:
| March 31, 2013 |
December 31, 2013 |
|||||||
| Investment in unconsolidated affiliates |
||||||||
| Domestic |
$ | — | $ | 5,011 | ||||
| International |
22,012 | 22,004 | ||||||
|
|
|
|
|
|||||
| Total |
$ | 22,012 | $ | 27,015 | ||||
|
|
|
|
|
|||||
| Total assets |
||||||||
| Domestic |
$ | 795,646 | $ | 774,147 | ||||
| International |
114,060 | 114,589 | ||||||
| Eliminations |
(1,967 | ) | (2,788 | ) | ||||
|
|
|
|
|
|||||
| Total |
$ | 907,739 | $ | 885,948 | ||||
|
|
|
|
|
|||||
F-65
Table of Contents
Reconciliation of Segment EBITDA and Segment Adjusted EBITDA to Net Income
| Nine Months Ended December 31, | ||||||||||||||||
| (Amounts in thousands) | 2012 | 2013 | ||||||||||||||
| Domestic | International | Domestic | International | |||||||||||||
| Reconciliation of Segment EBITDA and Segment Adjusted EBITDA: |
||||||||||||||||
| Net income |
$ | 22,700 | $ | 8,908 | $ | 18,835 | $ | 4,459 | ||||||||
| Depreciation and amortization (a) |
37,653 | 4,535 | 38,439 | 4,637 | ||||||||||||
| Interest expense, net |
12,430 | 35 | 11,815 | 45 | ||||||||||||
| Income tax expense |
17,639 | 2,473 | 38,998 | 1,847 | ||||||||||||
|
|
|
|
|
|
|
|
|
|||||||||
| Segment EBITDA |
90,422 | 15,951 | 108,087 | 10,988 | ||||||||||||
| Derivative fair value adjustments |
220 | — | 54 | — | ||||||||||||
| Foreign currency transaction losses |
— | 659 | — | 251 | ||||||||||||
| Unconsolidated affiliates interest and tax |
— | 488 | — | 347 | ||||||||||||
| Management fee to minority interest holder JV |
— | — | — | 739 | ||||||||||||
| Share-based compensation |
1,207 | — | 2,640 | — | ||||||||||||
| ESOP deferred compensation |
6,784 | — | 7,343 | — | ||||||||||||
| Transaction costs (b) |
— | — | 118 | — | ||||||||||||
|
|
|
|
|
|
|
|
|
|||||||||
| Segment Adjusted EBITDA |
$ | 98,633 | $ | 17,098 | $ | 118,242 | $ | 12,325 | ||||||||
|
|
|
|
|
|
|
|
|
|||||||||
| (a) | Includes our proportionate share of depreciation and amortization expense of $977 and $1,031 related to our Tigre ADS joint venture and BaySaver joint venture, which is included in Net income of unconsolidated affiliates in our Condensed Consolidated Statements of Income for the nine months ended December 31, 2012 and 2013, respectively. |
| (b) | Represents expenses recorded related to legal, accounting and other professional fees incurred in connection with our recent debt refinancing and in connection with this offering. |
| 17. | SUBSEQUENT EVENTS |
We evaluated subsequent events through April 2, 2014, the date these condensed consolidated financial statements were available to be issued.
On January 6, 2014, the Board of Directors declared a special dividend of $7.50 per share (“Special Dividend”), for a total amount of approximately $108,101, on all outstanding shares of our common stock and Redeemable Convertible Preferred Stock. We paid the Special Dividend on January 15, 2014 to all stockholders of record on January 2, 2014. On December 20, 2013, we amended the private shelf agreement primarily to make certain amendments in order to permit the payment of the Special Dividend. The January 15, 2014 Special Dividend on the ESOP’s allocated shares was paid in cash (i.e., passed through) to participants, and the Special Dividend on the ESOP’s unallocated shares was retained by the ESOP and allocated among the participants’ ESOP cash accounts. The allocation of cash among the participants’ ESOP cash accounts related to dividends paid on unallocated shares resulted in additional compensation expense of $22,624. The payment of the Special Dividend was financed through the Company’s Revolving Credit Facility. For additional details on the Revolving Credit Facility, please refer to Note 10, Debt. As the Special Dividend was declared subsequent to December 31, 2013, the impact of the Special Dividend is shown in the Pro Forma column of the Condensed Consolidated Balance Sheets.
* * * * * *
F-66
Table of Contents
ADVANCED DRAINAGE SYSTEMS, INC. AND SUBSIDIARIES
Consolidated Valuation and Qualifying Accounts
For the Fiscal Years Ended March 31, 2011, 2012 and 2013 (in thousands):
| Accumulated Provision for Uncollectible Accounts: |
Balance at Beginning of Period |
Charged to Costs and Expenses |
Charged to Other Accounts |
Deductions | Balance at End of Period |
|||||||||||||||
| Year ended March 31, 2011 |
4,109 | 1,241 | 20 | (1,450 | ) | 3,920 | ||||||||||||||
| Year ended March 31, 2012 |
3,920 | 1,154 | 28 | (933 | ) | 4,169 | ||||||||||||||
| Year ended March 31, 2013 |
4,169 | 1,421 | (2 | ) | (899 | ) | 4,689 | |||||||||||||
F-67
Table of Contents
Shares
Advanced Drainage Systems, Inc.
Common Stock
Prospectus
, 2014
Barclays
Deutsche Bank Securities
Citigroup
RBC Capital Markets
Table of Contents
PART II
INFORMATION NOT REQUIRED IN THE PROSPECTUS
ITEM 13. OTHER EXPENSES OF ISSUANCE AND DISTRIBUTION.
The following table sets forth the estimated expenses payable by us in connection with the sale and distribution of the securities registered hereby, other than underwriting discounts or commissions. All amounts are estimates except for the SEC registration fee and the Financial Industry Regulatory Authority filing fee.
| SEC Registration Fee |
$ | 12,880 | ||
| FINRA Filing Fee |
$ | 15,500 | ||
| Stock Exchange Listing Fee |
$ | * | ||
| Printing Fees and Expenses |
$ | * | ||
| Accounting Fees and Expenses |
$ | * | ||
| Legal Fees and Expenses |
$ | * | ||
| Transfer Agent Fees and Expenses |
$ | * | ||
| Miscellaneous |
$ | * | ||
|
|
|
|||
| Total |
$ | * | ||
|
|
|
| * | To be filed by amendment. |
ITEM 14. INDEMNIFICATION OF DIRECTORS AND OFFICERS.
Delaware General Corporation Law
Advanced Drainage Systems, Inc. is incorporated under the laws of the State of Delaware.
Section 145(a) of the General Corporation Law of the State of Delaware, or the “DGCL,” provides that a corporation may indemnify any person who was or is a party or is threatened to be made a party to any threatened, pending or completed action, suit or proceeding, whether civil, criminal, administrative or investigative (other than an action by or in the right of the corporation) by reason of the fact that the person is or was a director, officer, employee or agent of the corporation, or is or was serving at the request of the corporation as a director, officer, employee or agent of another corporation, partnership, joint venture, trust or other enterprise, against expenses (including attorneys’ fees), judgments, fines and amounts paid in settlement actually and reasonably incurred by the person in connection with such action, suit or proceeding if the person acted in good faith and in a manner the person reasonably believed to be in or not opposed to the best interests of the corporation, and, with respect to any criminal action or proceeding, had no reasonable cause to believe the person’s conduct was unlawful.
Section 145(b) of the DGCL provides that a corporation may indemnify any person who was or is a party or is threatened to be made a party to any threatened, pending or completed action or suit by or in the right of the corporation to procure a judgment in its favor by reason of the fact that the person is or was a director, officer, employee or agent of the corporation, or is or was serving at the request of the corporation as a director, officer, employee or agent of another corporation, partnership, joint venture, trust or other enterprise, against expenses (including attorneys’ fees) actually and reasonably incurred by the person in connection with the defense or settlement of such action or suit if the person acted in good faith and in a manner the person reasonably believed to be in or not opposed to the best interests of the corporation and except that no indemnification shall be made in respect of any claim, issue or matter as to which such person shall have been adjudged to be liable to the corporation unless and only to the extent that the Delaware Court of Chancery or the court in which such action or suit was brought shall determine upon application that, despite the adjudication of liability but in view of all of the circumstances of the case, such person is fairly and reasonably entitled to indemnity for such expenses which the Delaware Court of Chancery or such other court shall deem proper.
II-1
Table of Contents
Section 145(c) of the DGCL provides that to the extent that a present or former director or officer of a corporation has been successful on the merits or otherwise in defense of any action, suit or proceeding referred to in subsections (a) and (b) of Section 145 of the DGCL, or in defense of any claim, issue or matter therein, such person shall be indemnified against expenses (including attorneys’ fees) actually and reasonably incurred by such person in connection therewith.
Section 145(e) of the DGCL provides that expenses, including attorneys’ fees, incurred by an officer or director of the corporation in defending any civil, criminal, administrative or investigative action, suit or proceeding may be paid by the corporation in advance of the final disposition of such action, suit or proceeding upon receipt of an undertaking by or on behalf of such director or officer to repay such amount if it shall ultimately be determined that such person is not entitled to be indemnified by the corporation as authorized in Section 145 of the DGCL. Such expenses, including attorneys’ fees, incurred by former directors and officers or other persons serving at the request of the corporation as directors, officers, employees or agents of another corporation, partnership, joint venture, trust or other enterprise may be so paid upon such terms and conditions, if any, as the corporation deems appropriate.
Section 145(g) of the DGCL specifically allows a Delaware corporation to purchase liability insurance on behalf of its directors and officers and to insure against potential liability of such directors and officers regardless of whether the corporation would have the power to indemnify such directors and officers under Section 145 of the DGCL.
Our Amended and Restated Certificate of Incorporation will contain provisions permitted under the DGCL relating to the liability of directors. These provisions will eliminate a director’s personal liability to the fullest extent permitted by the DGCL for monetary damages resulting from a breach of fiduciary duty, except in circumstances involving:
| • | any breach of the director’s duty of loyalty; |
| • | acts or omissions not in good faith or which involve intentional misconduct or a knowing violation of the law; |
| • | under Section 174 of the DGCL (unlawful dividends); or |
| • | any transaction from which the director derives an improper personal benefit. |
Our Amended and Restated Certificate of Incorporation and our Second Amended and Restated Bylaws will require us to indemnify and advance expenses to our directors and officers to the fullest extent not prohibited by the DGCL and other applicable law, except in the case of a proceeding instituted by the director without the approval of our board of directors. Our Amended and Restated Certificate of Incorporation and our Second Amended and Restated Bylaws will provide that we are required to indemnify our directors and officers, to the fullest extent permitted by law, for all judgments, fines, settlements, legal fees and other expenses incurred in connection with pending or threatened legal proceedings because of the director’s or officer’s positions with us or another entity that the director or officer serves at our request, subject to various conditions, and to advance funds to our directors and officers to enable them to defend against such proceedings. To receive indemnification, the director or officer must have been successful in the legal proceeding or have acted in good faith and in what was reasonably believed to be a lawful manner in our best interest and, with respect to any criminal proceeding, had no reasonable cause to believe his or her conduct was unlawful.
Section 102(b)(7) of the DGCL permits a Delaware corporation to include a provision in its certificate of incorporation eliminating or limiting the personal liability of directors to the corporation or its stockholders for monetary damages for breach of fiduciary duty as a director. This provision, however, may not eliminate or limit a director’s liability (1) for breach of the director’s duty of loyalty to the corporation or its stockholders, (2) for acts or omissions not in good faith or involving intentional misconduct or a knowing violation of law, (3) under Section 174 of the DGCL, or (4) for any transaction from which the director derived an improper personal benefit. Our Amended and Restated Certificate of Incorporation will contain such a provision.
II-2
Table of Contents
Indemnification Agreements
We have entered into indemnification agreements with our directors and certain of our officers. The indemnification agreements will provide the directors and officers with contractual rights to the indemnification and expense advancement rights provided under our amended and restated bylaws, as well as contractual rights to additional indemnification as provided in the indemnification agreements.
Directors’ and Officers’ Liability Insurance
We have obtained directors’ and officers’ liability insurance which insures against certain liabilities that our directors and officers and our subsidiaries’ directors and officers may, in such capacities, incur.
ITEM 15. RECENT SALES OF UNREGISTERED SECURITIES
Since three years before the date of the initial filing of this Registration Statement, we have sold securities without registration under the Securities Act of 1933, as amended, as described below:
Issuance of Common Stock
In May 2011, we issued an aggregate of 1,272 shares of common stock to four directors who elected to receive the equivalent of their compensation in common stock at $50.35 per share.
In May 2012, we issued an aggregate of 1,080 shares of common stock to four directors who elected to receive the equivalent of their compensation in common stock at $59.25 per share.
In February 2013, we issued an aggregate of 2,609 shares of common stock to four directors who elected to receive the equivalent of their compensation in common stock at $64.20 per share.
Restricted Stock Grants
On May 3, 2011, we issued an aggregate of 19,400 shares of restricted common stock to 53 employees pursuant to the 2008 Plan in consideration of services provided or to be provided.
On November 3, 2011, we issued 500 shares of restricted common stock to one employee pursuant to the 2008 Plan in consideration of services provided or to be provided.
On May 1, 2012, we issued an aggregate of 32,400 shares of restricted common stock to 66 employees pursuant to the 2008 Plan in consideration of services provided or to be provided.
On May 1, 2013, we issued an aggregate of 33,400 shares of restricted common stock to 63 employees pursuant to the 2008 Plan in consideration of services provided or to be provided.
On August 6, 2013, we issued an aggregate of 320 shares of restricted common stock to one employee pursuant to the 2008 Plan in consideration of services provided or to be provided.
Options Grants and Common Stock Issued upon Exercise of Options
Since April 1, 2011, we have issued to directors, officers and employees options to purchase an aggregate of 453,704.383 shares of common stock with exercise prices ranging from $50.35 to $64.20 per share pursuant to the 2000 Plan and 2013 Plan.
Since April 1, 2011, upon the exercise of stock options, we have issued 252,590 shares of common stock to certain officers, directors and employees in exchange for an aggregate of $5,543,790.
II-3
Table of Contents
These transactions did not involve any underwriters or any public offerings. These transactions were exempt from registration under the Securities Act, pursuant to Section 4(a)(2) of the Securities Act or Regulation D or Rule 701 promulgated thereunder, as transactions by an issuer not involving a public offering. No general solicitation was made either by us or any person acting on our behalf; the recipients of our common stock agreed that the securities would be subject to the standard restrictions applicable to a private placement of securities under applicable state and federal securities laws; and appropriate legends were affixed to the certificates issued.
ITEM 16. EXHIBITS AND FINANCIAL STATEMENT SCHEDULES
| (a) | Exhibits. |
The following exhibits are included as exhibits to this Registration Statement.
Exhibit List
| Exhibit |
Exhibit Description | |
| 1.1 | Form of Underwriting Agreement.* | |
| 3.1 | Form of Amended and Restated Certificate of Incorporation of Advanced Drainage Systems, Inc.* | |
| 3.2 | Form of Second Amended and Restated Bylaws of Advanced Drainage Systems, Inc.* | |
| 4.1 | Form of Preferred Stock Certificate.* | |
| 4.2 | Form of Common Stock Certificate.* | |
| 4.3 | Form of Termination of Amended and Restated Stockholders’ Agreement.* | |
| 4.4 | Form of Registration Rights Agreement, by and among Advanced Drainage Systems, Inc. and the stockholders from time to time party thereto.* | |
| 4.5 | Form of 5.60% Senior Series A Secured Notes due September 24, 2018.* | |
| 4.6 | Form of 4.05% Senior Series B Secured Notes due September 24, 2019.* | |
| 5.1 | Opinion of Squire Sanders (US) LLP.* | |
| 10.1 | Amended and Restated Credit Agreement, dated as of June 12, 2013, by and among Advanced Drainage Systems, Inc., as borrower, the guarantors from time to time party thereto, the lenders from time to time party thereto, PNC Bank, National Association, as administrative agent for the lenders party thereto, and the other parties thereto.* | |
| 10.1A | First Amendment to Amended and Restated Credit Agreement, dated as of December 20, 2013 * | |
| 10.2 | Second Amended and Restated Credit Agreement, dated as of June 12, 2013, by and among ADS Mexicana, S.A. de C.V., as borrower, the lenders party thereto, PNC Bank, National Association, as administrative agent for the lenders party thereto, and the other parties thereto.* | |
| 10.3 | Amended and Restated Private Shelf Agreement, dated as of September 24, 2010, by and among Advanced Drainage Systems, Inc., as seller, the guarantors from time to time party thereto, Prudential Investment Management, Inc., as a purchaser, and the other purchasers from time to time party thereto.* | |
| 10.3A | Amendment No. 1 to Amended and Restated Private Shelf Agreement, dated as of December 12, 2011.* | |
| 10.3B | Amendment No. 2 to Amended and Restated Private Shelf Agreement, dated as of March 9, 2012.* | |
| 10.3C | Amendment No. 3 to Amended and Restated Private Shelf Agreement, dated as of March 30, 2012.* | |
II-4
Table of Contents
| Exhibit |
Exhibit Description | |
| 10.3D | Amendment No. 4 to Amended and Restated Private Shelf Agreement, dated as of April 26, 2013.* | |
| 10.3E | Amendment No. 5 to Amended and Restated Private Shelf Agreement, dated as of June 16, 2013.* | |
| 10.3F | Supplement to Amendment No. 5 to Amended and Restated Private Shelf Agreement, dated as of June 24, 2013.* | |
| 10.3G | Amendment No. 6 to Amended and Restated Private Shelf Agreement, dated as of September 23, 2013.* | |
| 10.3H | Amendment No. 7 to Amended and Restated Private Shelf Agreement, dated as of December 31, 2013.* | |
| 10.4 | Amended and Restated Security Agreement, dated as of June 12, 2013, by and among Advanced Drainage Systems, Inc., as borrower, the guarantors from time to time party thereto, and PNC Bank, National Association, as collateral agent for certain secured parties.* | |
| 10.5 | Amended and Restated Pledge Agreement, dated as of June 12, 2013, by Advanced Drainage Systems, Inc. and certain other parties thereto, as pledgors, in favor of PNC Bank, National Association, as collateral agent for certain secured parties.* | |
| 10.6 | Amended and Restated Intercompany Subordination Agreement, dated as of June 12, 2013, by and among Advanced Drainage Systems, Inc., the guarantors from time to time party thereto, and PNC Bank, National Association, as administrative agent for certain lenders.* | |
| 10.7 | Amended and Restated Intercreditor and Collateral Agency Agreement, dated as of June 12, 2013, by and among PNC Bank, National Association, as collateral agent for certain secured parties, PNC Bank, National Association, as administrative agent for certain lenders, and certain noteholders.* | |
| 10.8 | Advanced Drainage Systems, Inc. Non-Employee Director Incentive Plan.* | |
| 10.9 | Advanced Drainage Systems, Inc. Amended 2000 Incentive Stock Option Plan.* | |
| 10.10 | Advanced Drainage Systems, Inc. 2008 Restricted Stock Plan * | |
| 10.11 | Advanced Drainage Systems, Inc. 2013 Stock Option Plan.* | |
| 10.12 | Executive Employment Agreement, dated as of January 29, 2009, by and between Advanced Drainage Systems, Inc. and Joseph A. Chlapaty, as amended on January 27, 2010.* | |
| 10.13 | Executive Employment Agreement, dated as of January 29, 2009, by and between Advanced Drainage Systems, Inc. and Mark B. Sturgeon, as amended on January 27, 2010.* | |
| 10.14 | Executive Employment Agreement, dated as of January 29, 2009, by and between Advanced Drainage Systems, Inc. and Thomas M. Fussner, as amended on January 27, 2010.* | |
| 10.15 | Executive Employment Agreement, dated as of July 5, 2012, by and between Advanced Drainage Systems, Inc. and Ronald R. Vitarelli.* | |
| 10.16 | Executive Employment Agreement, dated as of January 29, 2009, by and between Advanced Drainage Systems, Inc. and Robert M. Klein, as amended on January 27, 2010.* | |
| 10.17 | Form of Indemnification Agreement.* | |
| 10.18 | Form of Incentive Stock Option Agreement pursuant to 2000 Incentive Stock Option Plan.* | |
| 10.19 | Form of Non-Qualified Stock Option Agreement (other than for Joseph A. Chlapaty) pursuant to 2013 Stock Option Plan.* | |
| 10.19A | Form of Non-Qualified Stock Option Agreement (for Joseph A. Chlapaty) pursuant to 2013 Stock Option Plan.* | |
II-5
Table of Contents
| Exhibit |
Exhibit Description | |
| 10.20 | Form of Restricted Stock Agreement (other than for Joseph A. Chlapaty) pursuant to 2008 Restricted Stock Plan.* | |
| 10.20A | Form of Restricted Stock Agreement (for Joseph A. Chlapaty) pursuant to 2008 Restricted Stock Plan.* | |
| 10.21 | Form of Director Stock Agreement.* | |
| 10.22 | Participation Agreement, dated as of July 17, 2000, by and between ADS Worldwide, Inc., Grupo Altima S.A. de C.V., and ADS Mexicana, S.A. de C.V. (formerly known as Sistemas Ecologicos de Drenaje, S.A. de C.V.), as amended on April 19, 2010, May 19, 2011, May 24, 2011, April 26, 2013 and January 31, 2014.* | |
| 10.23 | Interestholders Agreement, dated as of June 5, 2009, by and among Tubos y Plasticos ADS Chile Limitada, Tigre Chile S.A., and Tuberias T-A Limitada, joined by Advanced Drainage Systems, Inc. and Tigre S.A. — Tubos e Conexoes, as amended on July 31, 2009, October 2009, December 15, 2009, May 18, 2010, August 10, 2010, April 1, 2011 and January 25, 2012.* | |
| 10.23A | First Addendum to Interestholders Agreement, dated as of June 27, 2011.* | |
| 10.24 | Limited Liability Company Agreement, dated July 15, 2013, by and among ADS Ventures, Inc., BaySaver Technologies, Inc. and Mid-Atlantic Storm Water Research Center, Inc.* | |
| 21.1 | List of Subsidiaries.* | |
| 23.1 | Consent of Deloitte & Touche LLP.† | |
| 23.2 | Consent of Squire Sanders (US) LLP (included in Exhibit 5.1 hereto).* | |
| 23.3 | Consent of Freedonia Custom Research, Inc.† | |
| 24.1 | Power of Attorney (contained on signature pages hereto).† | |
| * | To be filed by amendment. |
| † | Filed herewith. |
ITEM 17. UNDERTAKINGS
(a) The undersigned registrant hereby undertakes to provide to the underwriters at the closing specified in the underwriting agreements certificates in such denominations and registered in such names as required by the underwriters to permit prompt delivery to each purchaser.
(b) Insofar as indemnification for liabilities arising under the Securities Act of 1933 may be permitted to directors, officers and controlling persons of the registrant pursuant to the foregoing provisions, or otherwise, the registrant has been advised that in the opinion of the Securities and Exchange Commission such indemnification is against public policy as expressed in the Act and is, therefore, unenforceable. In the event that a claim for indemnification against such liabilities (other than the payment by the registrant of expenses incurred or paid by a director, officer or controlling person of the registrant in the successful defense of any action, suit or proceeding) is asserted by such director, officer or controlling person in connection with the securities being registered, the registrant will, unless in the opinion of its counsel the matter has been settled by controlling precedent, submit to a court of appropriate jurisdiction the question whether such indemnification by it is against public policy as expressed in the Act and will be governed by the final adjudication of such issue.
(c) The undersigned registrant hereby undertakes that:
| (1) | For purposes of determining any liability under the Securities Act of 1933, the information omitted from the form of prospectus filed as part of this registration statement in reliance upon Rule 430A and |
II-6
Table of Contents
| contained in a form of prospectus filed by the registrant pursuant to Rule 424(b)(1) or (4) or 497(h) under the Securities Act shall be deemed to be part of this registration statement as of the time it was declared effective. |
| (2) | For the purpose of determining any liability under the Securities Act of 1933, each post-effective amendment that contains a form of prospectus shall be deemed to be a new registration statement relating to the securities offered therein, and the offering of such securities at that time shall be deemed to be the initial bona fide offering thereof. |
(d) For the purpose of determining liability under the Securities Act of 1933 to any purchaser, if the registrant is subject to Rule 430C, each prospectus filed pursuant to Rule 424(b) as part of a registration statement relating to an offering, other than registration statements relying on Rule 430B or other than prospectuses filed in reliance on Rule 430A, shall be deemed to be part of and included in the registration statement as of the date it is first used after effectiveness. Provided, however, that no statement made in a registration statement or prospectus that is part of the registration statement or made in a document incorporated or deemed incorporated by reference into the registration statement or prospectus that is part of the registration statement will, as to a purchaser with a time of contract of sale prior to such first use, supersede or modify any statement that was made in the registration statement or prospectus that was part of the registration statement or made in any such document immediately prior to such date of first use.
(e) For the purpose of determining liability of the registrant under the Securities Act of 1933 to any purchaser in the initial distribution of the securities, the undersigned registrant undertakes that in a primary offering of securities of the undersigned registrant pursuant to this registration statement, regardless of the underwriting method used to sell the securities to the purchaser, if the securities are offered or sold to such purchaser by means of any of the following communications, the undersigned registrant will be a seller to the purchaser and will be considered to offer or sell such securities to such purchaser:
| (1) | Any preliminary prospectus or prospectus of the undersigned registrant relating to the offering required to be filed pursuant to Rule 424; |
| (2) | Any free writing prospectus relating to the offering prepared by or on behalf of the undersigned registrant or used or referred to by the undersigned registrant; |
| (3) | The portion of any other free writing prospectus relating to the offering containing material information about the undersigned registrant or its securities provided by or on behalf of the undersigned registrant; and |
| (4) | Any other communication that is an offer in the offering made by the undersigned registrant to the purchaser. |
II-7
Table of Contents
SIGNATURES
Pursuant to the requirements of the Securities Act of 1933, as amended, Advanced Drainage Systems, Inc. has duly caused this registration statement to be signed on its behalf by the undersigned, thereunto duly authorized, in the City of Hilliard, State of Ohio, on April 2, 2014.
| ADVANCED DRAINAGE SYSTEMS, INC. | ||||
| By: | /s/ Joseph A. Chlapaty | |||
| Name: Title: |
Joseph A. Chlapaty President and Chief Executive Officer | |||
POWER OF ATTORNEY
KNOW ALL MEN BY THESE PRESENTS, that each person whose signature appears below constitutes and appoints Joseph A. Chlapaty and Mark B. Sturgeon, and each of them, his true and lawful attorneys-in-fact and agents, with full power to act separately and full power of substitution and resubstitution, for him and in his name, place and stead, in any and all capacities, to sign any and all amendments (including post-effective amendments) to this registration statement and all additional registration statements pursuant to Rule 462(b) of the Securities Act of 1933, as amended, and all post-effective amendments thereto, and to file the same, with all exhibits thereto, and all other documents in connection therewith, with the Securities and Exchange Commission, granting unto said attorney-in-facts and agents, and each of them, full power and authority to do and perform each and every act and thing requisite and necessary to be done in and about the premises, as fully to all intents and purposes as they or he might or could do in person, hereby ratifying and confirming all that said attorneys-in-fact and agents or either of them or his or their substitute or substitutes may lawfully do or cause to be done by virtue hereof.
Pursuant to the requirements of the Securities Act of 1933, this registration statement has been signed on April 2, 2014 by the following persons in the capacities indicated.
| Signature |
Title | |
| /s/ Joseph A. Chlapaty | Chairman of the Board of Directors, Director, President and Chief Executive Officer (Principal Executive Officer) | |
|
Joseph A. Chlapaty |
||
| /s/ Mark B. Sturgeon | Executive Vice President, Chief Financial Officer, Secretary and Treasurer (Principal Financial Officer and Principal Accounting Officer) | |
|
Mark B. Sturgeon |
||
| /s/ Robert M. Eversole | Director | |
|
Robert M. Eversole |
||
| /s/ Alexander R. Fischer | Director | |
|
Alexander R. Fischer |
||
| /s/ Tanya Fratto | Director | |
|
Tanya Fratto |
||
II-8
Table of Contents
| Signature |
Title | |
| /s/ M.A. (Mark) Haney | Director | |
|
M.A. (Mark) Haney |
||
| /s/ David L. Horing | Director | |
|
David L. Horing |
||
| /s/ C. Robert Kidder | Director | |
|
C. Robert Kidder |
||
| /s/ Mark A. Lovett | Director | |
|
Mark A. Lovett |
||
| /s/ Richard A. Rosenthal | Director | |
|
Richard A. Rosenthal |
||
| /s/ Abigail S. Wexner | Director | |
|
Abigail S. Wexner |
||
| /s/ Scott M. Wolff | Director | |
|
Scott M. Wolff |
||
II-9
Table of Contents
EXHIBIT INDEX
Exhibit List
| Exhibit |
Exhibit Description | |
| 1.1 | Form of Underwriting Agreement.* | |
| 3.1 | Form of Amended and Restated Certificate of Incorporation of Advanced Drainage Systems, Inc.* | |
| 3.2 | Form of Second Amended and Restated Bylaws of Advanced Drainage Systems, Inc.* | |
| 4.1 | Form of Preferred Stock Certificate.* | |
| 4.2 | Form of Common Stock Certificate.* | |
| 4.3 | Form of Termination of Amended and Restated Stockholders’ Agreement.* | |
| 4.4 | Form of Registration Rights Agreement, by and among Advanced Drainage Systems, Inc. and the stockholders from time to time party thereto.* | |
| 4.5 | Form of 5.60% Senior Series A Secured Notes due September 24, 2018.* | |
| 4.6 | Form of 4.05% Senior Series B Secured Notes due September 24, 2019.* | |
| 5.1 | Opinion of Squire Sanders (US) LLP.* | |
| 10.1 | Amended and Restated Credit Agreement, dated as of June 12, 2013, by and among Advanced Drainage Systems, Inc., as borrower, the guarantors from time to time party thereto, the lenders from time to time party thereto, PNC Bank, National Association, as administrative agent for the lenders party thereto, and the other parties thereto.* | |
| 10.1A | First Amendment to Amended and Restated Credit Agreement, dated as of December 20, 2013 * | |
| 10.2 | Second Amended and Restated Credit Agreement, dated as of June 12, 2013, by and among ADS Mexicana, S.A. de C.V., as borrower, the lenders party thereto, PNC Bank, National Association, as administrative agent for the lenders party thereto, and the other parties thereto.* | |
| 10.3 | Amended and Restated Private Shelf Agreement, dated as of September 24, 2010, by and among Advanced Drainage Systems, Inc., as seller, the guarantors from time to time party thereto, Prudential Investment Management, Inc., as a purchaser, and the other purchasers from time to time party thereto.* | |
| 10.3A | Amendment No. 1 to Amended and Restated Private Shelf Agreement, dated as of December 12, 2011.* | |
| 10.3B | Amendment No. 2 to Amended and Restated Private Shelf Agreement, dated as of March 9, 2012.* | |
| 10.3C | Amendment No. 3 to Amended and Restated Private Shelf Agreement, dated as of March 30, 2012.* | |
| 10.3D | Amendment No. 4 to Amended and Restated Private Shelf Agreement, dated as of April 26, 2013.* | |
| 10.3E | Amendment No. 5 to Amended and Restated Private Shelf Agreement, dated as of June 16, 2013.* | |
| 10.3F | Supplement to Amendment No. 5 to Amended and Restated Private Shelf Agreement, dated as of June 24, 2013.* | |
| 10.3G | Amendment No. 6 to Amended and Restated Private Shelf Agreement, dated as of September 23, 2013.* | |
| 10.3H | Amendment No. 7 to Amended and Restated Private Shelf Agreement, dated as of December 31, 2013.* | |
II-10
Table of Contents
| Exhibit |
Exhibit Description | |
| 10.4 | Amended and Restated Security Agreement, dated as of June 12, 2013, by and among Advanced Drainage Systems, Inc., as borrower, the guarantors from time to time party thereto, and PNC Bank, National Association, as collateral agent for certain secured parties.* | |
| 10.5 | Amended and Restated Pledge Agreement, dated as of June 12, 2013, by Advanced Drainage Systems, Inc. and certain other parties thereto, as pledgors, in favor of PNC Bank, National Association, as collateral agent for certain secured parties.* | |
| 10.6 | Amended and Restated Intercompany Subordination Agreement, dated as of June 12, 2013, by and among Advanced Drainage Systems, Inc., the guarantors from time to time party thereto, and PNC Bank, National Association, as administrative agent for certain lenders.* | |
| 10.7 | Amended and Restated Intercreditor and Collateral Agency Agreement, dated as of June 12, 2013, by and among PNC Bank, National Association, as collateral agent for certain secured parties, PNC Bank, National Association, as administrative agent for certain lenders, and certain noteholders.* | |
| 10.8 | Advanced Drainage Systems, Inc. Non-Employee Director Incentive Plan.* | |
| 10.9 | Advanced Drainage Systems, Inc. Amended 2000 Incentive Stock Option Plan.* | |
| 10.10 | Advanced Drainage Systems, Inc. 2008 Restricted Stock Plan * | |
| 10.11 | Advanced Drainage Systems, Inc. 2013 Stock Option Plan.* | |
| 10.12 | Executive Employment Agreement, dated as of January 29, 2009, by and between Advanced Drainage Systems, Inc. and Joseph A. Chlapaty, as amended on January 27, 2010.* | |
| 10.13 | Executive Employment Agreement, dated as of January 29, 2009, by and between Advanced Drainage Systems, Inc. and Mark B. Sturgeon, as amended on January 27, 2010.* | |
| 10.14 | Executive Employment Agreement, dated as of January 29, 2009, by and between Advanced Drainage Systems, Inc. and Thomas M. Fussner, as amended on January 27, 2010.* | |
| 10.15 | Executive Employment Agreement, dated as of July 5, 2012, by and between Advanced Drainage Systems, Inc. and Ronald R. Vitarelli.* | |
| 10.16 | Executive Employment Agreement, dated as of January 29, 2009, by and between Advanced Drainage Systems, Inc. and Robert M. Klein, as amended on January 27, 2010.* | |
| 10.17 | Form of Indemnification Agreement.* | |
| 10.18 | Form of Incentive Stock Option Agreement pursuant to 2000 Incentive Stock Option Plan.* | |
| 10.19 | Form of Non-Qualified Stock Option Agreement (other than for Joseph A. Chlapaty) pursuant to 2013 Stock Option Plan.* | |
| 10.19A | Form of Non-Qualified Stock Option Agreement (for Joseph A. Chlapaty) pursuant to 2013 Stock Option Plan.* | |
| 10.20 | Form of Restricted Stock Agreement (other than for Joseph A. Chlapaty) pursuant to 2008 Restricted Stock Plan.* | |
| 10.20A | Form of Restricted Stock Agreement (for Joseph A. Chlapaty) pursuant to 2008 Restricted Stock Plan.* | |
| 10.21 | Form of Director Stock Agreement.* | |
| 10.22 | Participation Agreement, dated as of July 17, 2000, by and between ADS Worldwide, Inc., Grupo Altima S.A. de C.V., and ADS Mexicana, S.A. de C.V. (formerly known as Sistemas Ecologicos de Drenaje, S.A. de C.V.), as amended on April 19, 2010, May 19, 2011, May 24, 2011, April 26, 2013 and January 31, 2014.* | |
II-11
Table of Contents
| Exhibit |
Exhibit Description | |
| 10.23 | Interestholders Agreement, dated as of June 5, 2009, by and among Tubos y Plasticos ADS Chile Limitada, Tigre Chile S.A., and Tuberias T-A Limitada, joined by Advanced Drainage Systems, Inc. and Tigre S.A. — Tubos e Conexoes, as amended on July 31, 2009, October 2009, December 15, 2009, May 18, 2010, August 10, 2010, April 1, 2011 and January 25, 2012.* | |
| 10.23A | First Addendum to Interestholders Agreement, dated as of June 27, 2011.* | |
| 10.24 | Limited Liability Company Agreement, dated July 15, 2013, by and among ADS Ventures, Inc., BaySaver Technologies, Inc. and Mid-Atlantic Storm Water Research Center, Inc.* | |
| 21.1 | List of Subsidiaries.* | |
| 23.1 | Consent of Deloitte & Touche LLP.† | |
| 23.2 | Consent of Squire Sanders (US) LLP (included in Exhibit 5.1 hereto).* | |
| 23.3 | Consent of Freedonia Custom Research, Inc.† | |
| 24.1 | Power of Attorney (contained on signature pages hereto).† | |
| * | To be filed by amendment. |
| † | Filed herewith. |
II-12