Attached files
| file | filename |
|---|---|
| EX-31.1 - EXHIBIT 31.1 - Synacor, Inc. | sync-ex311.htm |
| EX-32.1 - EXHIBIT 32.1 - Synacor, Inc. | sync-ex321.htm |
| EX-31.2 - EXHIBIT 31.2 - Synacor, Inc. | sync-ex312.htm |
UNITED STATES
SECURITIES AND EXCHANGE COMMISSION
Washington, D.C. 20549
_______________________________________________
FORM 10-K/A
(Amendment No. 1)
(Mark One)
x | ANNUAL REPORT PURSUANT TO SECTION 13 OR 15(d) OF THE SECURITIES EXCHANGE ACT OF 1934 |
For the fiscal year ended December 31, 2013 | |
OR
o | TRANSITION REPORT PURSUANT TO SECTION 13 OR 15(d) OF THE SECURITIES EXCHANGE ACT OF 1934 |
For the transition period from to | |
Commission File Number 001-33843
_______________________________________________
Synacor, Inc.
(Exact name of registrant as specified in its charter)
Delaware | 16-1542712 | |
(State or other jurisdiction of incorporation or organization) | (I.R.S. Employer Identification No.) | |
40 La Riviere Drive, Suite 300 Buffalo, New York | 14202 | |
(Address of principal executive offices) | (Zip Code) | |
(716) 853-1362
(Registrant’s telephone number, including area code)
Securities registered pursuant to Section 12(b) of the Act:
(Title of each class) | (Name of each exchange on which registered) | |
Common Stock, $0.01 par value | The NASDAQ Global Market | |
Securities registered pursuant to Section 12(g) of the Act:
None.
(Title of Class)
_______________________________________________
Indicate by check mark if the registrant is a well-known seasoned issuer, as defined in Rule 405 of the Securities Act. Yes o No x
Indicate by check mark if the registrant is not required to file reports pursuant to Section 13 or Section 15(d) of the Act. Yes o No x
Indicate by check mark whether the registrant: (1) has filed all reports required to be filed by Section 13 or 15(d) of the Securities Exchange Act of 1934 during the preceding 12 months (or for such shorter period that the registrant was required to file such reports), and (2) has been subject to such filing requirements for the past 90 days. Yes x No o
Indicate by check mark whether the registrant has submitted electronically and posted on its corporate Web site, if any, every Interactive Data File required to be submitted and posted pursuant to Rule 405 of Regulation S-T (§232.405 of this chapter) during the preceding 12 months (or for such shorter period that the registrant was required to submit and post such files). Yes x No o
Indicate by check mark if disclosure of delinquent filers pursuant to Item 405 of Regulation S-K (§229.405 of this chapter) is not contained herein, and will not be contained, to the best of registrant’s knowledge, in definitive proxy or information statements incorporated by reference in Part III of this Form 10-K or any amendment to this Form 10-K. x
Indicate by check mark whether the registrant is a large accelerated filer, an accelerated filer, a non-accelerated filer, or a smaller reporting company. See the definitions of “large accelerated filer,” “accelerated filer” and “smaller reporting company” in Rule 12b-2 of the Exchange Act. (Check one):
Large accelerated filer | o | Accelerated filer | o | |
Non-accelerated filer | x (Do not check if a smaller reporting company) | Smaller reporting company | o | |
Indicate by check mark whether the registrant is a shell company (as defined in Rule 12b-2 of the Exchange Act). Yes o No x
The aggregate market value of shares of common stock held by non-affiliates as of June 28, 2013, the last business day of the registrant's most recently completed second fiscal quarter, computed by reference to the closing sale price of $3.10 per share on The NASDAQ Global Market on June 28, 2013, was approximately $67,388,104. For purposes of this disclosure, shares of common stock held by persons who held more than 10% of the outstanding shares of common stock at such time and shares held by executive officers and directors of the registrant have been excluded because such persons may be deemed to be affiliates. This determination of executive officer or affiliate status is not necessarily a conclusive determination for other purposes.
As of March 25, 2014, there were 27,468,539 shares of the registrant's common stock issued and outstanding. All share and per share amounts in this Annual Report on Form 10-K reflect the 1-for-2 reverse stock split of the registrant's common stock which took effect immediately prior to the effectiveness of the registration statement for the registrant's initial public offering.
_______________________________________________
DOCUMENTS INCORPORATED BY REFERENCE
Certain portions of the definitive Proxy Statement to be used in connection with the registrant’s 2014 Annual Meeting of Stockholders are incorporated by reference into Part III of this Form 10-K to the extent stated. That Proxy Statement will be filed within 120 days of registrant’s fiscal year ended December 31, 2013.
EXPLANATORY NOTE
This Amendment No. 1 on Form 10-K/A (this “Amendment”) amends and restates the Annual Report on Form 10-K for the fiscal year ended December 31, 2013, as filed with the Securities and Exchange Commission on March 26, 2014 (the “Original Filing”). Synacor, Inc. (the “Company”) is filing this Amendment solely to (i) amend Part II, Item 5 of the Original Filing because the Stock Performance Graph, due to technical difficulties, did not render correctly in the Original Filing, and (ii) correct a typographical error that appeared in Exhibit 32.1 to the Original Filing. We have also updated the signature page and the certifications in Exhibits 31.1, 31.2 and 32.1.
Other than as described above, this Amendment does not amend, modify or otherwise update any other information in the Original Filing; this Amendment restates in its entirety the Original Filing for the convenience of the reader. This Amendment does not reflect events occurring after the filing of the Original Filing and continues to speak as of the original filing date of the Original Filing.
Pursuant to Rule 12b-15 of the Securities Exchange Act of 1934, as amended, currently dated certifications from our Chief Executive Officer and Chief Financial Officer as required by Sections 302 and 906 of the Sarbanes-Oxley Act of 2002 are filed or furnished herewith, as applicable.
TABLE OF CONTENTS
Item 1. | ||
Item 1A. | ||
Item 1B. | ||
Item 2. | ||
Item 3. | ||
Item 4. | ||
Item 5. | ||
Item 6. | ||
Item 7. | ||
Item 7A. | ||
Item 8. | ||
Item 9. | ||
Item 9A. | ||
Item 9B. | ||
Item 10. | ||
Item 11. | ||
Item 12. | ||
Item 13. | ||
Item 14. | ||
Item 15. | ||
i
SPECIAL NOTE REGARDING FORWARD-LOOKING STATEMENTS
This Annual Report on Form 10-K includes forward-looking statements that reflect our current views with respect to future events or our future financial performance, are based on information currently available to us, and involve known and unknown risks, uncertainties and other factors that may cause our actual results, levels of activity, performance or achievements to differ materially from any future results, levels of activity, performance or achievements expressed or implied by these forward-looking statements. All statements, other than statements of historical fact, are statements that could be deemed forward-looking statements, including statements containing the words “believes,” “can,” “expects,” “anticipates,” “estimates,” “intends,” “objective,” “plans,” “possibly,” “potential,” “predicts,” “targets,” “likely,” “may,” “might,” “would,” “should,” “could,” and similar expressions or phrases (including the negative of such expressions or phrases). We intend all such forward-looking statements to be covered by the safe harbor provisions for forward-looking statements contained in Section 21E of the Securities Exchange Act of 1934, as amended, or the Exchange Act, and the Private Securities Litigation Reform Act of 1995. Forward-looking statements include, but are not limited to, statements in the sections of this Annual Report on Form 10-K titled "Trends Affecting Our Business" and "Key Initiatives" as well as statements about:
• | our expected future financial performance; |
• | our expectations regarding our operating expenses; |
• | our strategies and business plan; |
• | our ability to maintain or broaden relationships with existing customers and develop relationships with new customers; |
• | our success in anticipating market needs or developing new or enhanced services and products to meet those needs; |
• | our expectations regarding market acceptance of our services and products; |
• | our ability to recruit and retain qualified technical and other key personnel, including a new Chief Executive Officer; |
• | our competitive position in our industry, as well as innovations by our competitors; |
• | our success in managing growth; |
• | our plans to expand into international markets, including our joint venture in the People's Republic of China; |
• | our success in identifying and managing potential acquisitions and integrating acquired companies; |
• | our capacity to protect our confidential information and intellectual property rights; |
• | our need to obtain additional funding and our ability to obtain funding in the future on acceptable terms; and |
• | anticipated trends and challenges in our business and the markets in which we operate. |
Any forward-looking statements contained in this Annual Report on Form 10-K are based upon our historical performance and our current plans, estimates and expectations. The inclusion of this forward-looking information should not be regarded as a representation by us or any other person that the future plans, estimates or expectations contemplated by us will be achieved. All forward-looking statements involve risks, assumptions and uncertainties. Given these risks, assumptions and uncertainties, you should not place undue reliance on any forward-looking statements. The occurrence of the events described, and the achievement of the expected results, depend on many factors, some or all of which are not predictable or within our control.
Actual results may differ materially from expected results. See “Risk Factors” and elsewhere in this Annual Report on Form 10-K for a more complete discussion of these risks, assumptions and uncertainties and for other risks, assumptions and uncertainties. These risks, assumptions and uncertainties are not necessarily all of the important factors that could cause actual results to differ materially from those expressed in any of our forward-looking statements.
Other unknown or unpredictable factors also could harm our results. In light of these risks, uncertainties and assumptions, the forward-looking events discussed in this Annual Report on Form 10-K might not occur, and we therefore qualify all of our forward-looking statements by these cautionary statements. Any forward-looking statement made by us in this Annual Report on Form 10-K speaks only as of the date on which it is made. Except as required by law, we undertake no obligation to update publicly or revise any forward-looking statements, whether as a result of new information, future events or otherwise.
1
PART I
ITEM 1. | BUSINESS |
Our Business
Synacor, Inc. (“we,” “Synacor” or the “Company”) is a leading provider of start experiences (startpages and homescreens), TV Everywhere, Identity Management (IDM), and various cloud-based services across multiple devices for cable, satellite, telecom and consumer electronics companies. For these customers, we are also a leading provider of authentication and aggregation solutions enabling the delivery of personalized, online content. Our technology allows our customers to package a wide array of personalized, online content and cloud-based services with their high-speed Internet, communications, television and other offerings. Our customers offer our services under their own brands on Internet-enabled devices such as PCs, tablets, smartphones and connected TVs.
Our technology provides single sign-on capability, enabling consumers to seamlessly sign in and consume packaged online content and services from numerous programmers and content providers. These services include, but are not limited to, e-mail, security, online games, music, and authentication of TV Everywhere, a technology enabling consumers with applicable rights to access on-demand television online via multiple devices including PCs, tablets, smartphones and connected TVs. We offer consumers access to these services on demand through a user-friendly, customer-branded online solution and, increasingly, across multiple devices. We enable our customers to sell a menu of content and services to their consumers either on a pay-per-view basis or as a new service tier added to their existing subscription relationship.
Our technology offers our customers a comprehensive solution by providing consumers access to a broad range of online products and services. Following initial integration with our technology, our customers gain access to a wide range of programmers and content and service providers with whom we have licensing and distribution agreements. In addition, we may integrate into our technology content and services that form part of our customers’ existing offerings. Our flexible architecture integrates with our customers’ billing and subscriber management systems, as well as with third-party content and services.
Our customers direct consumers to their branded websites or homescreens, referred to as our start experiences, which comprise the consumer-facing components of our technology, where consumers have access to the online content and services available to them at their respective subscription levels. This enhanced Internet experience helps connect us and our customers to their large and engaged consumer base. We monetize the online traffic generated by these consumers through search and display advertising. We also charge fees for value added services delivered through our start experiences. Search queries, advertising impressions and use of our services have historically grown as we have added new customers and as our existing customers continue to further adopt our service offerings. Our business model creates deep customer relationships; as we monetize our customers’ online traffic, we share a portion of this revenue with our customers, resulting in a mutually beneficial partnership.
Recent Developments
On March 5, 2014, we announced that we are beginning a process to identify a successor to our President and Chief Executive Officer, Ronald Frankel. During our search for a successor, Mr. Frankel will remain in his current role, and he will resign as President and Chief Executive Officer when his successor is selected by our board of directors.
Additionally, on March 5, 2014, we announced that our Board has authorized a $5.0 million stock repurchase program.
Our Strategy
We intend to:
• | add new customers, and expand on our offerings with current customers, to increase our consumer reach; |
• | continue to expand our offerings of, and invest in, mobile technology and cloud-based services such as e-mail, value added services and TV Everywhere and increase the number of customers using our TV Everywhere authentication technology; |
• | enhance our direct advertising sales effort to increase the CPMs derived from advertising; |
• | extend the availability of our existing and new products and services to additional devices including tablets and smartphones; |
• | expand our presence into international markets; and |
2
• | invest in and acquire new technologies and products. |
Services and Products
We provide a proprietary technology solution that enables our customers to drive consumer engagement and generate new revenue streams through an array of online content and services such as search, advertising, TV Everywhere and value added services. Our customers use our technology to develop personalized start experiences that serve as their consumers’ respective online destinations for communication services, entertainment offerings and support services.
Our start experiences enable our customers to combine entertainment, such as television shows, multi-player games and streaming music based on a subscriber’s access rights and preferences, with communications offerings such as e-mail, voicemail, and third party messaging services like Yahoo Mail, Google Gmail, MSN Hotmail, Facebook, and Twitter. Our technology further allows our customers to deliver appropriate account tools, support, and bill pay services and to sell promotions to their consumers, all without leaving the applicable customer’s start experience.
We generate revenue from consumer traffic on our start experiences through search and display advertising revenue, which we collect from our search partner, Google Inc., or Google, our advertising network providers and directly from advertisers. We typically share a portion of this search and display advertising revenue with our customers. We also generate recurring revenues in the form of subscriber-based fees for the use of our technology, value added services and paid content, which we collect from our customers.
Start Experiences: Startpages and Homescreens
The key features of our start experiences include the following:
• | Design and Development. Using our technology, we create, design and develop branded start experiences for our customers. Our start experiences are designed to be the initial online destination for our customers’ consumers and typically aggregate a broad array of resources, including free-to-subscriber content and service offerings, value added services, applications, or apps, online content and search, all in one location. |
• | Cloud ID/Authentication. Our technology gives subscribers access to all of the value added services and paid content, including subscription television programming they have the right to consume, using a single user ID and password, which are typically the same credentials that they use for e-mail. Single sign-on for subscribers is accomplished by integrating with both our customers and our content and value added service partners. Because our single sign-on technology was built to accommodate many authentication mechanisms, we are able to integrate with a wide range of partners. We also allow subscribers to authenticate utilizing credentials from social media services such as Facebook, Twitter and Google+. |
• | Billing Integration. Our technology allows our customers to integrate billing for value added services and paid content purchases with other services and products provided to their subscribers, including television and telephony service. A customer may collect transaction fees via credit card or on the subscriber’s service provider bill, and it may bill transactions each time they occur or on a monthly basis using monthly summary totals. Our technology also enables online bill review, providing subscribers with access to a detailed transaction account. |
• | Personalization. Our technology enables the consumer to personalize his or her online experience through customization and localization. Consumers may add, delete, move, and otherwise customize the content displayed on our start experiences, such as by setting preferred television stations in our TV-at-a-glance module. Localization allows consumers to set a “favorite” zip code to gain access to radio stations, weather, movies, and events, all in the local area. Among other things, our technology allows consumers to comment on online articles and to create shortcuts to their favorite content using an online “personal assistant.” Consumers are able to manage access to services and products available to each member of the household, define a budget limit for purchases for each member of the household and set the payment method (service provider bill vs. credit card) for access to paid offerings. |
• | Video Delivery Capability. Our video delivery capability includes two primary components: a video player and a video discovery and delivery system. The video player contains video controls such as play, pause, fast forward and rewind and full-screen viewing and can be configured to play within or on top of a page. Our video discovery and delivery system is database-driven, supports multiple video hosting methods and enables transcoding from a number of video formats to formats that are playable on a variety of devices. The system contains a number of access control mechanisms, including the ability to restrict access based on IP address, |
3
location, consumer type or household management settings. The system also permits consumers to search videos and browse by channel, genre or content type.
• | Content Management System. Our proprietary content management system enables our customers and us to create dynamic, customizable online experiences containing content from various sources. Content is distributed via web services in an architecture that is easily portable to multiple devices and platforms. Our system is comprised of administrative interfaces, a scalable content storage system and a system to distribute content to our start experiences. The interface is easy to use and displays a preview of page or component designs prior to approval and publishing. Our system can also automatically publish content from outside sources or assign publishing rights, by site section, to outside vendors. |
• | Household Management. Our household management system puts parents in control of the content their children are allowed to purchase or consume through our start experiences. Among other things, this system allows the head of household to specify the range of products their “child accounts” may access and utilize and to establish preset spending limits for content purchases such as music. |
• | Toolbar. We offer our customers the ability to create branded toolbars that can be personalized by their consumers. The toolbar can be updated automatically as new features become available and may be configured with search, weather, television and movie listings as well as value added services and paid content packages, enabling consumers to access their favorite features of our technology even when they leave our start experiences. The toolbars can also integrate internal services such as instant messaging, customer support and e-mail. |
• | Television Listings. Our technology provides television listings and corresponding television channels, which enables consumers to search and browse local television programming. |
Search and Display Advertising
We use search and display advertising to generate revenue from consumer online traffic generated on our start experiences.
Search Advertising. We have a revenue-sharing relationship with Google, pursuant to which we include a Google-branded search tool on our start experiences. When a consumer makes a search query using this tool, we deliver it to Google, and Google returns search results that include advertiser-sponsored links to us, which we pass on to the consumer. If the consumer clicks on a sponsored link, Google receives payment from the sponsor of that link and shares a portion of that payment with us, which we in turn share with the applicable customer. We receive a monthly payment from Google within 30 days following the end of the month in which the revenue from the Google search advertising was earned; in turn we make revenue-share payments to our customers, subject to varying payment terms requiring payment from 30 days to 45 days following either the end of the month or quarter in which the revenue share was generated.
Display Advertising. We generate advertising revenue when consumers view or click on a text, graphic or video advertisement that is delivered on a Synacor-operated start experience. We sell some of our advertising inventory directly to advertisers using our team of direct advertising sales employees and independent advertising sales representatives. Our advertisers pay us a fee when a subscriber views or clicks the advertisement we place on their behalf on our start experiences. We sell the rest of our advertising inventory through arrangements we have entered into with several advertising networks, including DoubleClick (a division of Google) and advertising.com (a division of AOL), among others. Advertisers pay these networks a fee to place their advertisements on various websites. When the networks place an advertisement on one of our start experiences, the network will pay us a portion of that fee. We typically share a portion of the payments from advertisers or advertising networks with the applicable customer. We have varying payment terms from advertisers and advertising networks ranging from 30 days to 65 days following the end of the month in which the revenue from the advertiser was earned; in turn we make revenue-share payments to our customers, subject to varying payment terms requiring payment from 30 days to 45 days following either the end of the month or quarter in which the revenue share was generated.
As we hire additional advertising salespeople and retain additional independent advertising sales representatives, we will target more advertisers directly as opposed to through advertising networks to fill our advertising inventory, which we expect will result in higher cost-per-thousand impressions (referred to as cost per mille, or CPMs) and, consequently, higher revenue.
4
Subscriber-Based Services
Using our proprietary technology, we provide our customers a flexible solution, enabling them to deliver a wide range of online content and value added services from multiple sources in a single, customizable online location. Our customers use our technology to provide their subscribers with access to free-to-subscriber content and service offerings, including television programming, news, sports, entertainment and weather, as well as paid content and other value added services, all from one location and with a single sign-on. Our technology employs a scalable and flexible architecture that allows us, and our customers, to add or change features and applications regularly, enabling subscribers to access them across a wide range of Internet-enabled devices, such as PCs, tablets, smartphones and connected TVs.
We offer both free-to-subscriber content and service offerings and paid content and value added services, which are paid for by our customers or their subscribers, individually or in bundled packages. The packages are accessed via our single sign-on capability according to access rules established by our customers and the content or service providers. These are available on our start experiences as well as the websites of the content and service providers. The following are illustrative examples of some of these packages, which we allow our customers to modify if they desire:
• | E-mail and Calendar. We provide e-mail and calendar solutions to our customers using a suite of messaging products provided by a third party. We integrate these products into our technology to deliver e-mail and family calendars to subscribers via their start experiences. The system enables us to highlight customer-related and community events on subscribers’ calendars and insert advertising into e-mail interfaces. Additionally, we have developed voicemail and VOIP functionality for e-mail that allows subscribers to access voicemail from their e-mail. |
• | Security. Our security offering typically includes anti-virus, firewall and intrusion detection, pop-up blocker, parental controls and automatic updates all powered by security suites, such as F-Secure. |
• | TV Everywhere. Our technology enables subscribers to watch free television online or utilize our authentication functionality to authorize them to watch premium television online, on-demand using an approved Internet-connected device. We have developed a combined television/video solution with an information architecture that improves usability and serves as a destination point for all platforms, including linear, video on demand, or VOD, and other online content. |
• | Variety Package. Our variety package combines content from several Internet subscription and entertainment products into a single package. These packages may include any combination of games (such as Shockwave Unlimited), greeting card services (such as American Greetings), weather services (such as weather.com), educational elements (such as iKnowThat or Clever Island) and sports elements (such as MLB.com, NASCAR.com RaceView, NHL Premium Videos, PlaySportsTV, or Fox Sports Video). |
• | Sports Plus Package. The sports plus package combines access to multiple sports-related content providers that could otherwise require separate subscriptions into a single package. The package includes access to MLB.com, NASCAR.com Raceview, NHL.com, PlaySportsTV, and Fox Sports. |
• | Portable and Non-Portable Music. Our music offering includes download-to-own, download-to-rent, and streaming music from our content providers’ libraries. Non-portable subscriptions allow subscribers to play music on their PCs, while portable subscriptions allow the subscribers to listen to music on a mobile device. Our music services are provided through contractual relationships with MediaNet and Rdio, Inc. |
• | Games and GamesSomnia™. Our GamesSomnia package includes subscriptions to popular online gaming services and gaming-related news sources, which may include offerings from Atari Classic Games, LEGO PC Games, Yummy Arcade, and Shockwave Unlimited. |
• | Learning Edge™. Our Learning Edge package combines a number of educational products that appeal to families with young children, which may include offerings from Award Funways, Boston Test Prep, Clever Island, Hoopah, and iKnowThat. |
We invoice our customers on a monthly basis with varying payment terms ranging from 30 days to 45 days following the end of the month in which the revenue was earned. Our content provider payment terms range from prepayment to 30 days or 45 days following the end of the month in which the content was provided.
5
Technology and Operations
Technology Architecture
Our technology has been designed and built to support reliability and scalability. To route traffic through our network in the most efficient manner, we use load-balancing products, which spread work among multiple servers, and link controllers, which monitor availability and performance of multiple connections. Our technology is fault tolerant and scalable through the addition of more servers as usage grows.
Data Center Facilities
We currently operate and maintain six data centers in regionally diverse locations and have a network operations center which is staffed 24 hours a day, seven days a week. Our five primary data centers are located in shared facilities in Atlanta, Georgia; Dallas, Texas; Lewis Center, Ohio; Denver, Colorado; and Amsterdam, The Netherlands. We also maintain a secondary data center in a shared facility in Buffalo, New York. All systems are fully monitored for reporting continuity and fault isolation. The Atlanta, Dallas, Lewis Center, Buffalo, Denver and Amsterdam data centers are each in a physically secure facility using monitoring, environmental alarms, closed circuit television and redundant power sources. Our network operations center is located in a secure facility.
Customers
Our customers principally consist of high-speed Internet service providers, such as Charter Communications Inc., or Charter, and CenturyLink, Inc., or CenturyLink, as well as consumer electronics manufacturers, such as Toshiba America Information Systems, Inc., or Toshiba. Our customer contracts typically have an initial term of two to three years from the deployment of our start experiences and frequently provide for one or more automatic renewal terms of one to two years each. Our customer contracts typically contain service level agreements which call for specific system “up times” and 24 hours per day, seven days per week support. As of December 31, 2013, we had agreements with over 50 customers.
Content and Service Providers
We license the content which we provide to our customers, including free and paid content offerings and value added services, from numerous third-party content and service providers. Our content and service partners provide a variety of content, including news and information, entertainment, sports, music, video, games, shopping, travel, autos, careers and finance. To obtain this content, we enter into a variety of licensing arrangements with our content providers. These arrangements are typically one to three years in duration with payment terms that may be based on traffic, advertising revenue share, number of subscribers, flat fee payments over time, or some combination thereof. We use licensed content to populate our start experiences, as well as to provide value added services and paid content that subscribers may purchase for additional fees. As of December 31, 2013, we had arrangements with over 50 content providers such as MLB Advanced Media, L.P., or MLB Advanced Media, CNN, The Associated Press, FOX News Network, LLC, NASCAR, Tribune Media Services, Inc., Rdio, Outbrain, and Bankrate.
Sales and Marketing
Our sales and marketing efforts focus on five primary areas: customer acquisitions, client services, account management, marketing and advertising sales. Our customer acquisition team consists of direct sales personnel who call upon prospective customers, typically large and mid-sized high-speed Internet service providers and consumer electronics manufacturers. A significant amount of time and effort is devoted to researching and analyzing the requirements and objectives of each prospective customer. Each bid is specifically customized for the prospective customer, and often requires many months of interaction and negotiation before an agreement is reached.
Once an agreement is reached, our client services team, working closely with the customer acquisitions team, assumes responsibility for managing the customer relationship during the time of the initial deployment and integration period, which is usually three to six months. During this period, the customer’s technology is assessed and, if required, modifications are proposed to make it compatible with our technology. The client services team is responsible for the quality of the client deployment, customer relationship management during the time of deployment, and integration and project management associated with upgrades and enhancements.
After deployment, our account management team takes over management of the customer relationship, analyzing the ways in which a customer could further benefit from increased use of our products and services. The account management team is responsible for ongoing customer relationship management, upgrades and enhancements to the available products and services, as well as tracking the financial elements and performance of the customer relationship.
6
Our marketing team works closely with our account management team to deliver marketing programs that support our customers’ sales efforts as well as their consumers’ interaction with these products and services. We assist our customers in developing marketing materials, advertising and cross-channel commercials that can be accessed by consumers through different media outlets, including the Internet, print, television, and radio. We also assist our customers in training their customer service representatives to introduce and sell value added services and our paid content offerings to new and existing customers.
Our advertising sales team sells display advertising inventory directly to advertisers, frequently through the advertising agencies representing those advertisers. These advertisers may be small companies with the advertising locally or regionally focused on the start experiences of one customer, or large companies with nationwide advertising on the start experiences of many customers. We have a team of direct advertising sales employees and independent advertising sales representatives focused on this effort and will continue to develop this team and attempt to grow the amount of display advertising revenue generated with our customers. As of December 31, 2013, we had arrangements with over 50 advertising partners such as DoubleClick, NCC Media, Criteo, Razorfish, and Comcast Spotlight.
Government Regulation
We generally are not regulated other than under international, federal, state and local laws applicable to the Internet or e-commerce or to businesses in general. Some regulatory authorities have enacted or proposed specific laws and regulations governing the Internet and online entertainment. These laws and regulations cover issues such as taxation, pricing, content, distribution, quality and delivery of services and products, electronic contracts, intellectual property rights, user privacy and information security.
Federal laws regarding the Internet that could have an impact on our business include the following: the Digital Millennium Copyright Act of 1998, which is intended to reduce the liability of online service providers of third-party content, including content that may infringe copyrights or rights of others; the Children’s Online Privacy Protection Act, which imposes additional restrictions on the ability of online services to collect user information from minors; and the Protection of Children from Sexual Predators Act, which requires online service providers to report evidence of violations of federal child pornography laws under certain circumstances.
Laws and regulations regarding user privacy and information security impact our business because we collect and use personal information through our technology. We use this information to deliver more relevant content and services and provide consumers with a personalized online experience. We share this information on an aggregate basis with our customers and content providers and, subject to confidentiality agreements, to prospective customers and content providers. Laws such as the CAN-SPAM Act of 2003 or other user privacy or security laws could restrict our and our customers’ ability to market products to their consumers, create uncertainty in Internet usage and reduce the demand for our services and products or require us to redesign our start experiences.
Intellectual Property
We believe that the protection of our intellectual property is critical to our success. We rely on copyright and service mark enforcement, contractual restrictions and trade secret laws to protect our proprietary rights. We have entered into confidentiality and invention assignment agreements with our employees and contractors, and nondisclosure agreements with certain parties with whom we conduct business in order to limit access to and disclosure of our proprietary information. Additionally, we have applied for patents to protect certain of our intellectual property. Our registered service mark in the United States is Synacor®.
We endeavor to protect our internally developed systems and maintain our trademarks and service marks. We generally control access to and use of our proprietary software and other confidential information through the use of internal and external controls, including contractual protections with employees, contractors, customers and partners, and our software is protected by United States and international copyright laws.
In addition to legal protections, we believe that factors such as the technological and creative skills of our personnel, new product developments, frequent product enhancements and reliable product support and services are essential to establishing and maintaining a technology leadership position.
Competition
The market for Internet-based services and products in which we operate is highly competitive and involves rapidly-changing technologies and customer and consumer requirements, as well as evolving industry standards and frequent product
7
introductions. While we believe that our technology offers considerable value and flexibility to our customers by helping them to extend their consumer relationships to a wide variety of Internet-based services, we face competition at three levels:
• | When one of our prospective or existing customers considers another supplier, including one of our partners, for elements of the services or products which we provide. |
• | When consumers choose to rely on other vendors for similar products and services. |
• | When content and service providers prefer to establish direct relationships with one or more of our customers. |
Our technology competes primarily with high-speed Internet service providers that have internal information technology staff capable of developing similar solutions in-house. In addition, we compete with companies such as Facebook, Inc., Yahoo! Inc., or Yahoo!, Google, AOL LLC, or AOL, Hulu, Netflix, Amazon, and MSN, a division of Microsoft Corporation, or Microsoft, which have destination websites of their own or are capable of delivering content and service offerings similar to ours.
We also compete with providers of paid content and services over the Internet, especially companies with the capability of bundling paid content and value added services in much the same manner that we do. These companies include ESPN3, F-Secure Corporation or F-Secure, Exent Technologies Ltd. or Exent, Zynga Inc., MLB Advanced Media, Symantec Corporation, McAfee, Inc., Activision Blizzard, Inc. and Electronic Arts Inc. In some cases we have performed software integrations with these companies on behalf of our customers or, as in the case of F-Secure, we have partnered with them in order to offer their services more broadly to all our customers.
We believe the principal competitive factors in our markets include a company’s ability to:
• | reinforce the brands of our cable, satellite, telecom and consumer electronics customers; |
• | produce products that are flexible and easy to use; |
• | offer competitive fees for start experience development and operation; |
• | generate additional revenue for our customers; |
• | enable our customers to be involved in designing the “look and feel” of their online presence; |
• | offer services and products that meet the changing needs of our customers and their consumers, including emerging technologies and standards; |
• | provide high-quality product support to assist the customer’s service representatives; and |
• | aggregate content to deliver more compelling bundled packages of paid content. |
We believe that we distinguish ourselves from potential competitors in three principal ways. First, we provide a white-label solution that, unlike the co-branded approach of most of our competitors, creates a consumer experience that reinforces our customers’ and partners’ brands. Second, we give customers control over the sign-on process and billing function for a wide range of Internet services and content by integrating with their internal systems (where applicable) thereby allowing our customers to “own the consumer.” Finally, our solution is flexible, meaning that we allow each customer to fashion start experiences that are specifically tailored to their desired “look and feel.”
Employees
As of December 31, 2013, we had 343 employees in the United States, 29 in Canada and 1 employee in the United Kingdom. None of our employees is represented by a labor union, and we consider current employee relations to be good.
Corporate Information
Synacor's predecessor company was originally formed as a New York corporation, and in November 2002, Synacor re-incorporated under the laws of the State of Delaware. Our headquarters are located at 40 La Riviere Drive, Buffalo, New York 14202, and our telephone number is (716) 853-1362.
We have determined that we have a single reporting segment. A summary of our financial information by geographic location is found in Note 6, “Information About Segment and Geographic Areas,” in the Notes to Consolidated Financial
8
Statements. Our international operations and sales subject us to a variety of risks; see Item 1A, “Risk Factors,” for further discussion.
Available Information
Our Internet website address is http://www.synacor.com. We provide free access to various reports that we file with or furnish to the Securities and Exchange Commission, or SEC, through our website, as soon as reasonably practicable after they have been filed or furnished. These reports include, but are not limited to, our annual reports on Form 10-K, quarterly reports on Form 10-Q, current reports on Form 8-K, and any amendments to those reports. Our SEC reports can be accessed through the investor relations section of our website, or through http://www.sec.gov. Information on our website does not constitute part of this Annual Report on Form 10-K or any other report we file or furnish with the SEC. Stockholders may request copies of these documents from:
Synacor, Inc.
Investor Relations Department
40 La Riviere Dr.
Suite 300
Buffalo, New York 14202
ITEM 1A. | RISK FACTORS |
Our business and financial results are subject to numerous risks and uncertainties, including those described below, which could adversely and materially affect our business, financial condition or results of operations. You should carefully consider these risks and uncertainties, including the following risk factors and all other information contained in this Annual Report on Form 10-K, together with any other documents we file with the SEC.
Risks Related to Our Business
Our search advertising partner, Google, accounts for a significant portion of our revenue, and any loss of, or diminution in, our business relationship with Google would materially and adversely affect our financial performance.
We rely on traffic on our start experiences to generate search and display advertising revenue, a substantial portion of which is derived from text-based links to advertisers’ websites as a result of Internet searches. We have a revenue-sharing relationship with Google under which we include a Google-branded search tool on our start experiences. When a consumer makes a search request using this tool, we deliver it to Google, and Google returns search results to us that include advertiser-sponsored links. If the consumer clicks on a sponsored link, Google receives payment from the sponsor of that link and shares a portion of that payment with us. We then typically share a portion of that payment with the applicable customer. Our Google-related search advertising revenue attributable to our customers, which consists of the portion of the payment from the sponsor that Google shares with us, accounted for approximately 57%, 56%, and 51% of our revenue in 2011, 2012, and 2013, or $51.5 million, $68.5 million, and $57.5 million, respectively. Our agreement with Google was renewed in March 2014 for a three-year term and expires in February 2017 unless we and Google mutually elect to renew it. Additionally, Google may terminate our agreement if we experience a change in control, if we enter into an agreement providing for a change in control, if we do not maintain certain search and display advertising revenue levels or if we fail to conform to Google's search policies and advertising policies. Google may from time to time change its existing, or establish new, methodologies and metrics for valuing the quality of Internet traffic. Any changes in these methodologies, metrics and advertising technology platforms could decrease the advertising rates that we receive and/or the amount of revenue that we generate from display advertisements. If advertisers were to discontinue their advertising via Internet searches, if Google’s revenue from search-based advertising were to decrease, if Google’s share of the search revenue were to be increased or if our agreement with Google were to be terminated for any reason or renewed on less favorable terms, our business, financial condition and results of operations would be materially and adversely affected. Moreover, consumers’ increased use of search tools other than the Google-branded search tool we provide would have similar effects.
A loss of any significant customer could negatively affect our financial performance.
We derive a substantial portion of our revenue from a small number of customers. Revenue attributable to these customers includes the subscriber-based revenue earned directly from them, as well as the search and display advertising revenue earned through our relationships with our advertising partners, such as Google, based on traffic generated from our start experiences. For example, revenue attributable to Charter, CenturyLink (including our revenue attributable to Qwest Communications International, Inc., or Qwest, which merged with CenturyLink in April 2011) and Toshiba together accounted
9
for approximately 62% of our revenue for the year ended December 31, 2011, or $56.9 million, with revenue attributable to one of these customers accounting for 20% or more in such period and revenue attributable to each of the other two customers accounting for more than 10% in such period. Revenue attributable to Charter, CenturyLink (including revenue attributable to Qwest), Toshiba and Verizon Corporate Services Group, Inc., or Verizon, together accounted for approximately 73% of our revenue for the year ended December 31, 2012, or $88.4 million, with revenue attributable to one of these customers accounting for 20% or more in such period and revenue attributable to each of the other three customers accounting for more than 10% in such period. Revenue attributable to Charter, CenturyLink (including revenue attributable to Qwest), Toshiba and Verizon together accounted for approximately 68% of our revenue for the year ended December 31, 2013, or $75.6 million, with revenue attributable to one of these customers accounting for 20% or more in such period and revenue attributable to each of the other three customers accounting for more than 10% in such period.
Our contracts with our customers generally have an initial term of approximately two to three years from the launch of their start experiences and frequently provide for one or more automatic renewal terms of one to two years each. If any one of these key contracts is not renewed or is otherwise terminated, or if revenue from these significant customers declines because of competitive or other reasons, our revenue would decline and our ability to achieve or sustain profitability would be impaired. In addition to the loss of subscriber-based revenue, including start experience and paid content sales, we would also lose significant revenue from the related search and display advertising services that we provide. In addition to the decline of revenue, we may have to impair our long-lived assets, to the extent that such assets are used exclusively to support these customers, which would adversely impact our results of operations and financial position.
We have a history of significant net losses and may not be profitable in future periods.
We have incurred significant losses in each year of operation other than 2009, 2011, and 2012, including a net loss of $3.6 million in 2010 and a net loss of $1.4 million in 2013. Our net income in 2009, 2011, and 2012 was $0.3 million, $9.9 million, and $3.8 million, respectively. Our expenses may increase in future periods as we implement initiatives designed to grow our business including, among other things, the development and marketing of new services and products, licensing of content, expansion of our infrastructure, and international expansion. If our revenue does not sufficiently increase to offset these expected increases in operating expenses, we may incur significant losses and may not be profitable. Our revenue in 2013 declined as compared to 2012. Accordingly, we may not be able to maintain profitability in the future. Any failure to maintain profitability may materially and adversely affect our business, financial condition and results of operations.
Many individuals are using devices other than personal computers and software applications other than Internet browsers to access the Internet. If users of these devices and software applications do not widely adopt the applications and other solutions we develop for them, our business could be adversely affected.
The number of people who access the Internet through devices other than PCs, including tablets, smartphones and connected TVs, has increased dramatically in the past few years and is projected to continue to increase. Similarly, individuals are increasingly accessing the Internet through apps other than Internet browsers, such as those available for download through Apple Inc.’s App Store and the Android Market. If consumers increasingly access the Internet on devices other than PCs, and if we are unable to successfully implement monetization strategies for such devices, our financial results could be negatively affected. While we are developing solutions to these alternative means of accessing the Internet, including through our acquisition of mobile device software and technology from Carbyn Inc., or Carbyn, in January 2012 and Teknision Inc., or Teknision, in November 2013, we do not currently offer our customers and their subscribers a wide variety of apps and other non-browser solutions. Additionally, as new devices and new apps are continually being released, it is difficult to predict the problems we may encounter in developing new versions of our apps and other solutions for use on these alternative devices and apps, and we may need to devote significant resources to the creation, support and maintenance of such apps and solutions. If users of these devices and apps do not widely adopt the apps and other solutions we develop, our business, financial condition and results of operations could be adversely affected.
Consumer tastes continually change and are unpredictable, and our sales may decline if we fail to enhance our service and content offerings to achieve continued subscriber acceptance.
Our business depends on aggregating and providing services and content that our customers will place on our start experiences, including television programming, news, entertainment, sports and other content that their subscribers find engaging, and value added services and paid content that their subscribers will buy. Accordingly, we must continue to invest significant resources in licensing efforts, research and development and marketing to enhance our service and content offerings, and we must make decisions about these matters well in advance of product releases to implement them in a timely manner. Our success depends, in part, on unpredictable and volatile factors beyond our control, including consumer preferences, competing content providers and websites and the availability of other news, entertainment, sports and other services and content. While we work with our customers to have their consumers' homepages and homescreens set to our start experiences
10
upon the installation of our customer's services or the sale of our customer's product, a consumer may easily change that setting, which would likely decrease the use of our start experiences. Similarly, consumers that change their device's operating system or Internet browser may no longer have our start experiences set as their default homepage or homescreen, and unless they change it back to our start experience, their usage of our start experiences would likely decline and our results of operations could be negatively impacted. Consumers that acquire new consumer electronics devices will no longer have our start experience initially set as their default homepage, and unless they change the default to our start experience, their usage of our start experiences would likely decline and our results of operations could be negatively impacted.
If our services are not responsive to the requirements of our customers or the preferences of their consumers, or the services are not brought to market in a timely and effective manner, our business, financial condition and results of operations would be harmed. Even if our services and content are successfully introduced and initially adopted, a subsequent shift in the preferences of our customers or their consumers could cause a decline in the popularity of our services and content that could materially reduce our revenue and harm our business, financial condition and results of operations.
Our sales growth will be adversely affected if we are unable to expand the breadth of our services and products or to introduce new services and products on a timely basis.
To retain our existing customers, attract new customers and increase revenue, we must continue to develop and introduce new services and products on a timely basis and continue to develop additional features to our existing product base. If our existing and prospective customers do not perceive that we will deliver our services and products on schedule, and if they do not perceive our services and products to be of sufficient value and quality, we may lose the confidence of our existing customers and fail to increase sales to these existing customers, and we may not be able to attract new customers, each of which would adversely affect our operating results.
Our sales cycles and the contracting process with new customers are long and unpredictable and may require us to incur expenses before executing a customer agreement, which makes it difficult to project when, if at all, we will obtain new customers and when we will generate additional revenue and cash flows from those customers.
We market our services and products directly to high-speed Internet service providers and consumer electronics manufacturers. New customer relationships typically take time to obtain and finalize because of the burdensome cost of migrating from an existing solution to our platform. Due to operating procedures in many organizations, a significant time period may pass between selection of our services and products by key decision-makers and the signing of a contract. The length of time between the initial customer sales call and the realization of significant sales is difficult to predict and can range from several months to several years. As a result, it is difficult to predict when we will obtain new customers and when we will begin to generate revenue and cash flows from these potential new customers.
As part of our sales cycle, we may incur significant expenses in the form of compensation and related expenses and equipment acquisition before executing a definitive agreement with a prospective customer so that we may be ready to launch shortly following execution of a definitive agreement. If conditions in the marketplace generally or with a specific prospective customer change negatively, it is possible that no definitive agreement will be executed, and we will be unable to recover any expenses incurred before a definitive agreement is executed, which would in turn have an adverse effect on our business, financial condition and results of operations.
Most of our customers are high-speed Internet service providers, and consolidation within the cable and telecommunications industries could adversely affect our business, financial condition and results of operations.
Our revenue from high-speed Internet service providers, including our search and display advertising revenue generated by online consumer traffic on our start experiences, accounted for 86% of our revenue in 2011, 80% in 2012, and 83% in 2013. The cable and telecommunications industries have experienced consolidation over the past several years, and we expect that this trend will continue. As a result of consolidation, some of our customers may be acquired by companies with which we do not have existing relationships and which may have relationships with one of our competitors or may have the in-house capacity to perform the services we provide. As a result, such acquisitions could cause us to lose customers and the associated subscriber-based and search and display advertising revenue. Under our agreements with some of our customers, including Charter, Verizon and CenturyLink, they have the right to terminate the agreement if we are acquired by one of their competitors.
Consolidation may also require us to renegotiate our agreements with our customers as a result of enhanced customer leverage. We may not be able to offset the effects of any such renegotiations, and we may not be able to attract new customers to counter any revenue declines resulting from the loss of customers or their subscribers.
11
As technology continues to evolve, the use of our products by our current and prospective consumer electronics manufacturer customers may decrease and our business could be adversely affected.
The consumer electronics industry is subject to rapid change, and our contract with Toshiba is not exclusive. As consumer electronics manufacturers continue to develop new technologies and introduce new models and devices, there can be no assurance that we will be able to develop solutions that will persuade consumer electronics manufacturers that are our customers at such time to utilize our technology for those new devices. If our current and prospective consumer electronics manufacturer customers elect not to integrate our solutions into their new products, our business, financial condition and results of operations could be adversely affected.
Moreover, updates to Internet browser technology may adversely affect our business. For example, for our consumer electronics manufacturer customers that have the Windows 8 operating system pre-installed on some of their devices, the Windows 8 operating system places our start experience on a second tab when the Internet browser is launched, leading to decreased search and display advertising revenue.
We invest in features and functionality designed to increase consumer engagement with our start experiences; however, these investments may not lead to increased revenue.
Our future growth and profitability will depend in large part on the effectiveness and efficiency of our efforts to provide a compelling consumer experience that increases consumer engagement with our start experiences. We have made and will continue to make substantial investments in features and functionality for our technology that are designed to drive consumer engagement. Not all of these activities directly generate revenue, and we cannot assure you that we will reap sufficient rewards from these investments to make them worthwhile. If the expenses that we incur in connection with these activities do not result in increased consumer engagement that in turn results in revenue increases that exceed these expenses, our business, financial condition and results of operations will be adversely affected.
Our services and products may become less competitive or even obsolete if we fail to respond to technological developments.
Our future success will depend, in part, on our ability to modify or enhance our services and products to meet customer and consumer needs, to add functionality and to address technological advancements that would improve their performance. For example, if our smartphone and tablet products fail to capture the increased search activity on such devices or if our services and products do not adapt to the increasing video usage on the Internet or take into account evolving developments in social networking, then they could begin to appear obsolete. Similarly, if we fail to develop new ways to deliver content and services through apps other than traditional Internet browsers, consumers could seek alternative means of accessing content and services.
To remain competitive, we will need to develop new services and products and adapt our existing ones to address these and other evolving technologies and standards. However, we may be unsuccessful in identifying new opportunities or in developing or marketing new services and products in a timely or cost-effective manner. In addition, our product innovations may not achieve the market penetration or price levels necessary for profitability. If we are unable to develop enhancements to, and new features for, our existing services and products or if we are unable to develop new services and products that keep pace with rapid technological developments or changing industry standards, our services and products may become obsolete, less marketable and less competitive, and our business will be harmed.
We depend on third parties for content that is critical to our business, and our business could suffer if we do not continue to obtain high-quality content at a reasonable cost.
We license the content that we aggregate on our start experiences from numerous third-party content providers, and our future success is highly dependent upon our ability to maintain and enter into new relationships with these and other content providers. In the future, some of our content providers may not give us access to high-quality content, may fail to adapt to changes in consumer tastes or may increase the royalties, fees or percentages that they charge us for their content, any of which could have a material negative effect on our operating results. Our rights to the content that we offer to our customers and their consumers are not exclusive, and the content providers could license their content to our competitors. Our content providers could even grant our competitors exclusive licenses. In addition, our customers are not prohibited from entering into content deals directly with our content providers. Any failure to enter into or maintain satisfactory arrangements with content providers would adversely affect our ability to provide a variety of attractive services and products to our customers. Our reputation and operating results could suffer as a result, and it may be more difficult for us to develop new relationships with potential customers. Our costs as a percentage of revenue may also increase due to price competition.
12
Our revenue and operating results may fluctuate, which makes our results difficult to predict and could cause our results to fall short of expectations.
As a result of the rapidly changing nature of the markets in which we compete, our quarterly and annual revenue and operating results are likely to fluctuate from period to period. These fluctuations may be caused by a number of factors, many of which are beyond our control, including but not limited to the various factors set forth in this "Risk Factors" section, as well as:
• | any failure to maintain strong relationships and favorable revenue-sharing arrangements with our search and display advertising partners, in particular Google, including a reduction in the quantity or pricing of sponsored links that consumers click on or a reduction in the pricing of display advertisements by advertisers; |
• | any failure of significant customers to renew their agreements with us; |
• | our ability to attract new customers; |
• | our ability to increase sales of value added services and paid content to existing subscribers; |
• | the timing and success of new service and product introductions by us, our customers or our competitors; |
• | variations in the demand for our services and products and the implementation cycles of our services and products by our customers; |
• | changes to Internet browser technology that renders our start experiences less competitive; |
• | changes in our pricing policies or those of our competitors; |
• | changes in the prices our customers charge for value added services and paid content; |
• | service outages, other technical difficulties or security breaches; |
• | limitations relating to the capacity of our networks, systems and processes; |
• | our failure to accurately estimate or control costs, including costs related to the initial launch of new customers; |
• | maintaining appropriate staffing levels and capabilities relative to projected growth; |
• | the timing of costs related to the development or acquisition of technologies, services or businesses to support our existing customers and potential growth opportunities; and |
• | general economic, industry and market conditions and those conditions specific to Internet usage and online businesses. |
For these reasons and because the market for our services and products is relatively new and rapidly changing, it is difficult to predict our future financial results.
Expansion into international markets, which is an important part of our strategy, but where we have limited experience, will subject us to risks associated with international operations.
We plan to expand our product offerings internationally, particularly in Asia, Latin America and Europe. For example, in March 2013 we announced that we entered into a joint venture with Maxit Technology Incorporated, or Maxit, to supply authentication and aggregation solutions for the delivery of online content and services to customers in the People's Republic of China, or the PRC. We have limited experience in marketing and operating our services and products in international markets, and we may not be able to successfully develop our business in these markets. Our success in these markets will be directly linked to the success of relationships with potential customers, content partners and other third parties.
As the international markets in which we plan to operate continue to grow, we expect that competition in these markets will intensify. Local companies may have a substantial competitive advantage because of their greater understanding of, and focus on, the local markets. Some of our domestic competitors who have substantially greater resources than we do may be able to more quickly and comprehensively develop and grow in international markets. International expansion may also require significant financial investment including, among other things, the expense of developing localized products, the costs of acquiring foreign companies and the integration of such companies with our operations, expenditure of resources in developing customer and content relationships and the increased costs of supporting remote operations.
13
Other risks of doing business in international markets include the increased risks and burdens of complying with different legal and regulatory standards, difficulties in managing and staffing foreign operations, recruiting and retaining talented direct sales personnel, limitations on the repatriation of funds and fluctuations of foreign exchange rates, varying levels of Internet technology adoption and infrastructure, and our ability to enforce contracts and our intellectual property rights in foreign jurisdictions. In addition, our success in international expansion could be limited by barriers to international expansion such as tariffs, adverse tax consequences and technology export controls. If we cannot manage these risks effectively, the costs of doing business in some international markets may be prohibitive or our costs may increase disproportionately to our revenue. Some of our business partners also have international operations and are subject to the risks described above. Even if we are able to successfully manage the risks of international operations, our business may be adversely affected if our business partners are not able to successfully manage these risks.
Our agreements with some of our customers and content providers require fixed payments, which could adversely affect our financial performance.
Certain of our agreements with customers and content providers require us to make fixed payments to them. The aggregate amount of such fixed payments for the years ending December 31, 2014, 2015, 2016, and the two years thereafter are approximately $4.6 million, $1.6 million, $1.0 million, and $0.4 million respectively. We are required to make these fixed payments regardless of the achievement of any revenue objectives or subscriber or usage levels. If we do not achieve our financial objectives, these contractual commitments would constitute a greater percentage of our revenue than originally anticipated and would adversely affect our profitability.
Our agreements with some of our customers and content providers contain penalties for non-performance, which could adversely affect our financial performance.
We have entered into service level agreements with most of our customers. These agreements generally call for specific system “up times” and 24 hours per day, seven days per week support and include penalties for non-performance. We may be unable to fulfill these commitments due to circumstances beyond our control, which could subject us to substantial penalties under those agreements, harm our reputation and result in a reduction of revenue or the loss of customers, which would in turn have an adverse effect on our business, financial condition and results of operations. To date, we have never incurred any material penalties.
System failures or capacity constraints could harm our business and financial performance.
The provision of our services and products depends on the continuing operation of our information technology and communications systems. Any damage to or failure of our systems could result in interruptions in our service. Such interruptions could harm our business, financial condition and results of operations, and our reputation could be damaged if people believe our systems are unreliable. Our systems are vulnerable to damage or interruption from snow storms, terrorist attacks, floods, fires, power loss, telecommunications failures, security breaches, computer malware, computer hacking attacks, computer viruses, computer denial of service attacks or other attempts to, or events that, harm our systems. Our data centers are also subject to break-ins, sabotage and intentional acts of vandalism and to potential disruptions if the operators of the facilities have financial difficulties. Although we maintain insurance to cover a variety of risks, the scope and amount of our insurance coverage may not be sufficient to cover our losses resulting from system failures or other disruptions to our online operations. For example, the limit on our business interruption insurance is approximately $27.6 million. Any system failure or disruption and any resulting losses that are not recoverable under our insurance policies may materially harm our business, financial condition and results of operations. To date, we have never experienced any material losses.
Although we regularly back-up our systems and store the system back-ups in Atlanta, Georgia, Dallas, Texas, Lewis Center, Ohio, Denver, Colorado, Amsterdam, the Netherlands, and Buffalo, New York, we do not have full second-site redundancy. If we were forced to relocate to an alternate site and to rely on our system back-ups to restore the systems, we would experience significant delays in restoring the functionality of our platform and could experience loss of data, which could materially harm our business and our operating results.
Security breaches, computer viruses and computer hacking attacks could harm our business, financial condition and results of operations.
Security breaches, computer malware and computer hacking attacks are prevalent in the technology industry. Any security breach caused by hacking, which involves efforts to gain unauthorized access to information or systems, or to cause intentional malfunctions or loss or corruption of data, software, hardware or other computer equipment, and the inadvertent transmission of computer viruses could harm our business, financial condition and results of operations. We have previously experienced hacking attacks on our systems, and may in the future experience hacking attacks. Though it is difficult to
14
determine what harm may directly result from any specific interruption or breach, any failure to maintain performance, reliability, security and availability of our technology infrastructure to the satisfaction of our customers and their consumers may harm our reputation and our ability to retain existing customers and attract new customers.
We may not maintain acceptable website performance for our customers, which may negatively impact our relationships with our customers and harm our business, financial condition and results of operations.
A key element to our continued growth is the ability of our customers’ consumers in all geographies to access our start experiences within acceptable load times. We refer to this as website performance. We may in the future experience platform disruptions, outages and other performance problems due to a variety of factors, including infrastructure changes, human or software errors, capacity constraints due to an overwhelming number of users accessing our technology simultaneously, and denial of service or fraud or security attacks. In some instances, we may not be able to identify the cause or causes of these website performance problems within an acceptable period of time. It may become increasingly difficult to maintain and improve website performance, especially during peak usage times, and as our solutions become more complex and our user traffic increases. If our start experiences are unavailable when consumers attempt to access them or do not load as quickly as they expect, consumers may seek other alternatives to obtain the information for which they are looking, and may not return to our start experiences as often in the future, or at all. This would negatively impact our relationships with our customers. We expect to continue to make significant investments to maintain and improve website performance. To the extent that we do not effectively address capacity constraints, upgrade our systems as needed and continually develop our technology and network architecture to accommodate actual and anticipated changes in technology, our business and operating results may be harmed.
We rely on our management team and need additional personnel to expand our business, and the loss of key officers or an inability to attract and retain qualified personnel could harm our business, financial condition and results of operations.
We depend on the continued contributions of our senior management and other key personnel, especially Ronald N. Frankel, our Chief Executive Officer, George G. Chamoun, our Executive Vice President of Sales and Marketing, Scott A. Bailey, our Chief Operating Officer, and William J. Stuart, our Chief Financial Officer. The loss of the services of any of our executive officers (such as Mr. Frankel, our President and Chief Executive Officer, whose planned departure we recently announced) or other key employees could harm our business and our prospects. All of our executive officers and key employees are at-will employees, which means they may terminate their employment relationship with us at any time.
Our future success also depends on our ability to identify, attract and retain highly skilled technical, managerial, finance, marketing and creative personnel. For example, we will need to recruit a new President and Chief Executive Officer to replace our current one, Ronald N. Frankel, whose planned departure we recently announced. Further, we will need to hire personnel outside the United States to pursue an international expansion strategy, and we will need to hire additional advertising salespeople to sell more advertisements directly. We face intense competition for qualified individuals from numerous technology, marketing and media companies, and we may incur significant costs to attract them. We may be unable to attract and retain suitably qualified individuals, or we may be required to pay increased compensation in order to do so. If we were to be unable to attract and retain the qualified personnel we need to succeed, our business could suffer.
Volatility or lack of performance in the trading price of our common stock may also affect our ability to attract and retain qualified personnel. Many of our senior management personnel and other key employees have become, or will become, vested in a substantial amount of stock or stock options. Employees may be more likely to leave us if the shares they own or the shares underlying their options have significantly appreciated in value relative to the original purchase prices of the shares or the exercise prices of the options or if the exercise prices of the options that they hold are significantly above the trading price of our common stock. If we are unable to retain our employees, our business, financial condition and results of operations would be harmed.
If we fail to manage our growth effectively, our business, financial condition and results of operations may suffer.
Following the merger of our predecessor companies, Chek, Inc., or Chek, and MyPersonal.com, Inc., or MyPersonal, to form Synacor, we have expanded our business primarily through organic growth. However, we did not grow organically in 2013. We may choose to grow through strategic acquisitions in the future. This growth has placed, and may continue to place, significant demands on our management and our operational and financial infrastructure. Our ability to manage our growth effectively and to integrate new technologies and acquisitions into our existing business will require us to continue to expand our operational, financial and management information systems and to continue to retain, attract, train, motivate and manage key employees. Continued growth could strain our ability to:
• | develop and improve our operational, financial and management controls; |
15
• | enhance our reporting systems and procedures; |
• | recruit, train and retain highly skilled personnel; |
• | maintain our quality standards; and |
• | maintain customer and content owner satisfaction. |
Managing our growth will require significant expenditures and allocation of valuable management resources. If we fail to achieve the necessary level of efficiency in our organization as it grows, our business, financial condition and results of operations would be harmed.
We may expand our business through acquisitions of, or investments in, other companies or new technologies, or joint ventures or other strategic alliances with other companies, which may divert our management’s attention or prove not to be successful.
In January 2012, we completed an acquisition of certain mobile device software and technology from Carbyn; in November 2013, we completed an acquisition of certain mobile device software and technology from Teknision; and in March 2013, we entered into a Joint Venture Agreement with Maxit to form Synacor China, Ltd., a company incorporated under the laws of the Cayman Islands, or the JV Company, a joint venture in China. We may decide to pursue other acquisitions of, investments in, or joint ventures involving other technologies and businesses in the future. Such transactions could divert our management’s time and focus from operating our business.
Our ability as an organization to integrate acquisitions is relatively unproven. Integrating an acquired company, business or technology is risky and may result in unforeseen operating difficulties and expenditures, including, among other things, with respect to:
• | incorporating new technologies into our existing business infrastructure; |
• | consolidating corporate and administrative functions; |
• | coordinating our sales and marketing functions to incorporate the new business or technology; |
• | maintaining morale, retaining and integrating key employees to support the new business or technology and managing our expansion in capacity; and |
• | maintaining standards, controls, procedures and policies (including effective internal controls over financial reporting and disclosure controls and procedures). |
In addition, a significant portion of the purchase price of companies we may acquire may be allocated to acquired goodwill and other intangible assets, which must be assessed for impairment at least annually. In the future, if our acquisitions do not yield expected returns, we may be required to take charges to our earnings based on this impairment assessment process, which could harm our operating results.
Future acquisitions could result in potentially dilutive issuances of our equity securities, including our common stock, or the incurrence of debt, contingent liabilities, amortization expenses or acquired in-process research and development expenses, any of which could harm our business, financial condition and results of operations. Future acquisitions may also require us to obtain additional financing, which may not be available on favorable terms or at all.
We face many risks in connection with our joint venture, including, among other things, with respect to:
• | Increasing competition in the industry and the JV Company's ability to compete in the Chinese market through its wholly foreign-owned subsidiary, or WFOE; |
• | The impact of regulatory changes in the industry; |
• | Potential difficulties associated with operating the joint venture and the WFOE; |
• | The joint venture's ability to obtain additional financing; |
• | The WFOE's ability to offer competitive services in the Chinese market at a favorable margin; |
16
• | General business and economic conditions, including seasonality of the industry and growth trends in the industry; |
• | Our ability to successfully enter the Chinese market and operate internationally; |
• | Potential delays, including obtaining permits, licenses and other governmental approvals; |
• | Trade barriers and potential duties; and |
• | Our and the joint venture's ability to protect intellectual property. |
If we and the JV Company are not able to successfully manage these and other risks related to the joint venture, it could harm our business, financial condition and results of operations.
Finally, our skill at investing our funds in illiquid securities issued by other companies, such as our investment in a privately held Delaware corporation called Blazer and Flip Flops, Inc., or B&FF (doing business as The Experience Engine), is untested. Although we review the results and prospects of such investments carefully, it is possible that our investments could result in a total loss. Additionally, we will typically have little or no control in the companies in which we invest, and we will be forced to rely on the management of companies in which we invest to make reasonable and sound business decisions. If the companies in which we invest are not successfully able to manage the risks facing them, such companies could suffer, and our own business, financial condition and results of operations could be harmed.
We may require additional capital to grow our business, and this capital may not be available on acceptable terms or at all.
The operation of our business and our growth strategy may require significant additional capital, especially if we were to accelerate our expansion and acquisition plans. If the cash generated from operations and otherwise available to us are not sufficient to meet our capital requirements, we will need to seek additional capital, potentially through debt or equity financings, to fund our growth. We may not be able to raise needed capital on terms acceptable to us or at all. Financings, if available, may be on terms that are dilutive or potentially dilutive to our stockholders, and the prices at which new investors would be willing to purchase our securities may cause our existing stockholders to suffer substantial dilution. The holders of new securities may also receive rights, preferences or privileges that are senior to those of existing holders of our common stock. Any debt financing obtained by us in the future could contain restrictive covenants that may potentially restrict our operations, and if we do not effectively manage our business to comply with those covenants, our business, financial condition and results of operations could be adversely affected. If new sources of financing are required but are insufficient or unavailable, we could be required to delay, abandon or otherwise modify our growth and operating plans to the extent of available funding, which would harm our ability to grow our business.
Our business depends, in part, on our ability to protect and enforce our intellectual property rights.
The protection of our intellectual property is critical to our success. We rely on copyright and service mark enforcement, contractual restrictions and trade secret laws to protect our proprietary rights. We have entered into confidentiality and invention assignment agreements with our employees and contractors, and nondisclosure agreements with certain parties with whom we conduct business to limit access to and disclosure of our proprietary information. Additionally, we have applied for patents to protect certain of our intellectual property. However, if we are unable to adequately protect our intellectual property, our business may suffer from the piracy of our technology and the associated loss in revenue.
Protecting against the unauthorized use of our intellectual property and other proprietary rights is expensive, difficult and, in some cases, impossible. Litigation may be necessary in the future to enforce or defend our intellectual property rights, to protect our trade secrets or to determine the validity and scope of the proprietary rights of others. Such litigation could be costly and divert management resources, either of which could harm our business. Furthermore, many of our current and potential competitors have the ability to dedicate substantially greater resources to enforce their intellectual property rights than we do. Accordingly, despite our efforts, we may not be able to prevent third parties from infringing upon or misappropriating our intellectual property.
We are not currently involved in any legal proceedings with respect to protecting our intellectual property; however, we may from time to time become a party to various legal proceedings with respect to protecting our intellectual property arising in the ordinary course of our business.
17
Any claims from a third party that we are infringing upon its intellectual property, whether valid or not, could subject us to costly and time-consuming litigation or expensive licenses or force us to curtail some services or products.
Companies in the Internet and technology industries tend to own large numbers of patents, copyrights, trademarks and trade secrets, and frequently enter into litigation based on allegations of infringement or other violations of intellectual property rights. We have been subject to claims that the presentation of certain licensed content on our start experiences infringes certain patents of a third party, none of which have resulted in direct settlement or payments by us or any determination of infringement by us, and as we face increasing competition, the possibility of further intellectual property rights claims against us grows. Our technologies may not be able to withstand any third party claims or rights against their use. Any intellectual property claims, with or without merit, could be time-consuming, expensive to litigate or settle and could divert management resources and attention. An adverse determination also could prevent us from offering our services and products to others and may require that we procure substitute products or services for our customers.
In the case of any intellectual property rights claim, we may have to pay damages or stop using technology found to be in violation of a third party’s rights. We may have to seek a license for the technology, which may not be available to us on reasonable terms and may significantly increase our operating expenses. The technology also may not be available for license to us at all. As a result, we may also be required to develop alternative non-infringing technology, which could require significant effort and expense. If we cannot license or develop technology for the infringing aspects of our business, we may be forced to limit our service and product offerings and may be unable to compete effectively. Any of these consequences could harm our operating results.
In addition, we typically have contractual obligations to our customers to indemnify and defend them with respect to third-party intellectual property infringement claims that arise from our customers’ use of our products or services. Such claims, whether valid or not, could harm our relationships with our customers, have resulted and could result in the future in us or our customers having to enter into licenses with the claimants and have caused and could cause us in the future to incur additional costs or suffer reduced revenues. To date, neither the increase in our costs nor any reductions in our revenue resulting from such claims have been material. Such claims could also subject us to costly and time-consuming litigation as well as diverting management attention and resources. Satisfying our contractual indemnification obligations could also give rise to significant liability, and thus harm our business and our operating results.
We are not currently subject to any material legal proceedings with respect to third party claims that we or our customers’ use of our products and services are infringing upon their intellectual property; however, we may from time to time become a party to various legal proceedings with respect to such claims arising in the ordinary course of our business.
Any unauthorized disclosure or theft of personal information we gather could harm our reputation and subject us to claims or litigation.
We collect, and have access to, personal information of subscribers, including names, addresses, account numbers, credit card numbers and e-mail addresses. Unauthorized disclosure of personal information regarding website visitors, whether through breach of our systems by an unauthorized party, employee theft or misuse, or otherwise, could harm our business. If there were an inadvertent disclosure of personal information, or if a third party were to gain unauthorized access to the personal information we possess, our operations could be seriously disrupted and we could be subject to claims or litigation arising from damages suffered by subscribers or our customers. In addition, we could incur significant costs in complying with the multitude of state, federal and foreign laws regarding the unauthorized disclosure of personal information. Finally, any perceived or actual unauthorized disclosure of the information we collect could harm our reputation, substantially impair our ability to attract and retain customers and have an adverse impact on our business.
We collect and may access personal information and other data, which subjects us to governmental regulation and other legal obligations related to privacy, and our actual or perceived failure to comply with such obligations could harm our business.
We collect, and have access to, personal information of subscribers, including names, addresses, account numbers, credit card numbers and e-mail addresses. There are numerous federal, state and local laws around the world regarding privacy and the storing, sharing, use, processing, disclosure and protection of personal information and other subscriber data, the scope of which are changing, subject to differing interpretations, and may be inconsistent between countries or conflict with other rules. We generally comply with industry standards and are subject to the terms of our privacy policies and privacy-related obligations to third parties (including voluntary third-party certification bodies such as TRUSTe). We strive to comply with all applicable laws, policies, legal obligations and industry codes of conduct relating to privacy and data protection to the extent possible. However, it is possible that these obligations may be interpreted and applied in a manner that is inconsistent from one jurisdiction to another and may conflict with other rules or our practices. Any failure or perceived failure by us to comply with
18
our privacy policies, our privacy-related obligations to users or other third parties, or our privacy-related legal obligations, or any compromise of security that results in the unauthorized release or transfer of personal information or other subscriber data, may result in governmental enforcement actions, litigation or public statements against us by consumer advocacy groups or others and could cause our customers to lose trust in us, which could have an adverse effect on our business. Additionally, if third parties we work with, such as customers, vendors or developers, violate applicable laws or our policies, such violations may also put subscriber information at risk and could in turn have an adverse effect on our business.
Any failure to convince advertisers of the benefits of advertising with us would harm our business, financial condition and results of operations.
We have derived and expect to continue to derive a substantial portion of our revenue from display advertising on our start experiences. Such advertising accounted for approximately 23%, 27%, and 29% of our revenue for the years ended December 31, 2011, 2012, and 2013, respectively. Our ability to attract and retain advertisers and, ultimately, to generate advertising revenue depends on a number of factors, including:
• | increasing the numbers of consumers using our start experiences; |
• | maintaining consumer engagement on those start experiences; |
• | competing effectively for advertising spending with other online and offline advertising providers; and |
• | continuing to grow our direct advertising sales force and develop and diversify our advertising capabilities. |
If we are unable to provide high-quality advertising opportunities and convince advertisers and agencies of our value proposition, we may not be able to retain existing advertisers or attract new ones, which would harm our business, financial condition and results of operations.
Migration of high-speed Internet service providers’ subscribers from one high-speed Internet service provider to another could adversely affect our business, financial condition and results of operations.
Our high-speed Internet service provider customers’ subscribers may become dissatisfied with their current high-speed Internet service provider and may switch to another provider. In the event that there is substantial subscriber migration from our existing customers to service providers with which we do not have relationships, the fees that we receive on a per-subscriber basis, and the related search and display advertising revenue, could decline.
Our business and the trading price of our common stock may be adversely affected if our internal controls over financial reporting are found by management or by our independent registered public accounting firm not to be adequate.
Effective internal controls are necessary for us to provide reliable financial reports and prevent fraud. In addition, Section 404 of the Sarbanes-Oxley Act of 2002, or the Sarbanes-Oxley Act, requires our management to evaluate and report on our internal control over financial reporting. This report contains, among other matters, an assessment of the effectiveness of our internal control over financial reporting as of the end of our fiscal year, including a statement as to whether or not our internal control over financial reporting is effective. This assessment must include disclosure of any material weaknesses in our internal control over financial reporting identified by management. In addition, our independent registered public accounting firm will be required to formally attest to the effectiveness of our internal control over financial reporting beginning with the Annual Report on Form 10-K for the year in which we are no longer an “emerging growth company.” At such time, our independent registered public accounting firm may issue a report that is adverse in the event it is not satisfied with the level at which our controls are documented, designed or operating.
While we have determined that our internal control over financial reporting was effective as of December 31, 2013, as indicated in our Management Report on Internal Control over Financial Reporting included in this Annual Report on Form 10‑K, we must continue to monitor and assess our internal control over financial reporting. If our management identifies one or more material weaknesses in our internal control over financial reporting and such weakness remains uncorrected at fiscal year-end, we will be unable to assert such internal control is effective at fiscal year-end. If we are unable to assert that our internal control over financial reporting is effective at fiscal year-end, or if our independent registered public accounting firm, when required, is unable to express an opinion on the effectiveness of our internal controls or concludes that we have a material weakness in our internal controls, we could lose investor confidence in the accuracy and completeness of our financial reports, which would likely have an adverse effect on our business and stock price.
19
Even if we conclude our internal control over financial reporting provides reasonable assurance regarding the reliability of financial reporting and the preparation of financial statements for external purposes in accordance with Generally Accepted Accounting Principles, or GAAP, because of its inherent limitations, internal control over financial reporting may not prevent or detect fraud or misstatements. Failure to implement required new or improved controls, or difficulties encountered in their implementation, could harm our operating results or cause us to fail to meet our reporting obligations.
In addition, a delay in compliance with the auditor attestation provisions of Section 404, when applicable to us, could subject us to a variety of administrative sanctions, including ineligibility for short-form resale registration, action by the SEC, the suspension or delisting of our common stock and the inability of registered broker-dealers to make a market in our common stock, which would further reduce the trading price of our common stock and could harm our business.
We are an “emerging growth company” and we cannot be certain if the reduced disclosure requirements applicable to emerging growth companies will make our common stock less attractive to investors.
We are an "emerging growth company," as defined in the JOBS Act, and we intend to take advantage of certain exemptions from various reporting requirements that are applicable to other public companies that are not "emerging growth companies" including, but not limited to, not being required to comply with the auditor attestation requirements of Section 404 of the Sarbanes-Oxley Act of 2002, reduced disclosure obligations regarding executive compensation in our periodic reports and proxy statements, and exemptions from the requirements of holding a nonbinding advisory vote on executive compensation and stockholder approval of any golden parachute payments not previously approved. We cannot predict if investors will find our common stock less attractive because we will rely on these exemptions. If some investors find our common stock less attractive as a result, there may be a less active trading market for our common stock and our stock price may be more volatile.
Our ability to use our net operating loss carryforwards and certain other tax attributes may be limited as a result of future transactions in our stock which may be outside our control.
As of December 31, 2013, we had substantial federal and state net operating loss carryforwards. Under Sections 382 and 383 of the Internal Revenue Code of 1986, as amended, or the Code, if a corporation undergoes an “ownership change,” the corporation’s ability to use its pre-change net operating loss carryforwards to offset its post-change income and taxes may be limited. In general, an “ownership change” generally occurs if there is a cumulative change in our ownership by “five-percent stockholders” that exceeds 50 percentage points over a rolling three-year period. For these purposes, a five-percent stockholder is generally any person or group of persons that at any time during the applicable testing period has owned 5% or more of our outstanding stock. In addition, persons who own less than 5% of the outstanding stock are grouped together as one or more “public groups,” which are also treated as five-percent stockholders. Similar rules may apply under state tax laws. We may experience ownership changes in the future as a result of future transactions in our stock, some of which may be outside our control. As a result, our ability to use our pre-change net operating loss carryforwards to offset United States federal and state taxable income and taxes may be subject to limitations.
Our joint venture's business prospects in China are dependent on government telecommunications infrastructure and budgetary policies, particularly the allocation of funds to sustain the growth of the telecommunications industry in China.
Our joint venture's business prospects in China include telecommunication service operators, and telecommunication service operators in China are directly or indirectly owned or controlled by the government of China. Accordingly, our joint venture's business prospects in China will also be heavily dependent on these government policies. Insufficient future funding allocated to China's telecommunications industry by the government could directly reduce the market for our joint venture's software and services in China. Chinese government initiatives directed at the market could also significantly affect the market conditions for our joint venture's Chinese customers and influence their level of spending on the services we offer. While some of these initiatives may increase market competition and generate more demand for our services, the anticipated increase in demand may not materialize. Our joint venture's prospective customers may not adapt well to the market conditions under the evolving regulatory environment and their demand for our joint venture's software and services may decrease as a result. The telecommunications industry in China may also become less competitive over time, either as a result of market driven consolidations or as a result of government efforts to curtail competition. A less competitive market may create fewer incentives for spending on technology innovations and upgrades, which may directly affect our joint venture's business prospects in China.
Our proprietary rights may be inadequately protected and there is a risk of poor enforcement of intellectual property rights in China.
Our success and ability to compete depend substantially upon our intellectual property, which we protect through a combination of confidentiality arrangements and trademark registrations. Additionally, we have applied for patents to protect
20
certain of our intellectual property. We have registered several marks and filed many other trademark applications in the U.S. We have not applied for copyright protection in any jurisdiction, including in the U.S. We enter into confidentiality agreements with most of our employees and consultants, and control access to, and distribution of, our documentation and other licensed information, including information licensed to the JV Company. Despite these precautions, it may be possible for a third party to copy or otherwise obtain and use our technology without authorization, or to develop similar technology independently. Since the Chinese legal system in general and the intellectual property regime in particular, are relatively weak, it is often difficult to enforce intellectual property rights in China.
Policing unauthorized use of our licensed technology is difficult and the steps we take may not prevent misappropriation or infringement of our proprietary rights. In addition, litigation may be necessary to enforce our intellectual property rights, to protect our trade secrets or to determine the validity and scope of the proprietary rights of others, which could result in substantial costs and diversion of our resources.
Failure to comply with the United States Foreign Corrupt Practices Act could subject us to penalties and other adverse consequences.
We are subject to the United States Foreign Corrupt Practices Act, which generally prohibits U.S. companies from engaging in bribery or other prohibited payments to foreign officials for the purpose of obtaining or retaining business. Corruption, extortion, bribery, pay-offs, theft and other fraudulent practices may occur with respect to our expansion into international markets. Our employees or other agents may engage in such conduct for which we might be held responsible. If our employees or other agents are found to have engaged in such practices, we could suffer severe penalties and other consequences, including adverse publicity and damage to our reputation that may have a material adverse effect on our business, financial condition and results of operations.
Risks Related to Our Industry
The growth of the market for our services and products depends on the continued growth of the Internet as a medium for content, advertising, commerce and communications.
Expansion in the sales of our services and products depends on the continued acceptance of the Internet as a platform for content, advertising, commerce and communications. The acceptance of the Internet as a medium for such uses could be adversely impacted by delays in the development or adoption of new standards and protocols to handle increased demands of Internet activity, security, privacy protection, reliability, cost, ease of use, accessibility and quality of service. The performance of the Internet and its acceptance as such a medium has been harmed by viruses, worms, and similar malicious programs, and the Internet has experienced a variety of outages and other delays as a result of damage to portions of its infrastructure. If for any reason the Internet does not remain a medium for widespread content, advertising, commerce and communications, the demand for our services and products would be significantly reduced, which would harm our business.
The growth of the market for our services and products depends on the development and maintenance of the Internet infrastructure.
Our business strategy depends on continued Internet and high-speed Internet access growth. Any downturn in the use or growth rate of the Internet or high-speed Internet access would be detrimental to our business. If the Internet continues to experience significant growth in number of users, frequency of use and amount of data transmitted, the Internet infrastructure might not be able to support the demands placed on it and the performance or reliability of the Internet may be adversely affected. The success of our business therefore depends on the development and maintenance of a sound Internet infrastructure. This includes maintenance of a reliable network backbone with the necessary speed, data capacity and security, as well as timely development of complementary products, such as routers, for providing reliable Internet access and services. Consequently, as Internet usage increases, the growth of the market for our products depends upon improvements made to the Internet as well as to individual customers’ networking infrastructures to alleviate overloading and congestion. In addition, any delays in the adoption of new standards and protocols required to govern increased levels of Internet activity or increased governmental regulation may have a detrimental effect on the Internet infrastructure.
A substantial majority of our revenue is derived from search and display advertising; our revenue would decline if advertisers do not continue their usage of the Internet as an advertising medium.
We have derived and expect to continue to derive a substantial majority of our revenue from search and display advertising on our start experiences. Such search and display advertising revenue accounted for approximately 79%, 83%, and 81% of our revenue for the years ended December 31, 2011, 2012, and 2013, or $72.1 million, $101.6 million, and $90.4 million, respectively. However, the prospects for continued demand and market acceptance for Internet advertising are
21
uncertain. If advertisers do not continue to increase their usage of the Internet as an advertising medium, our revenue would decline. Advertisers that have traditionally relied on other advertising media may not advertise on the Internet. Most advertising agencies and potential advertisers, particularly local advertisers, have only limited experience advertising on the Internet and devote only a small portion of their advertising expenditures to online advertising. As the Internet evolves, advertisers may find online advertising to be a less attractive or less effective means of promoting their services and products than traditional methods of advertising and may not continue to allocate funds for Internet advertising. Many historical predictions by industry analysts and others concerning the growth of the Internet as a commercial medium have overstated the growth of the Internet and you should not rely upon them. This growth may not occur or may occur more slowly than estimated.
Most of our search revenue is based on the number of paid “clicks” on sponsored links that are included in search results generated from our start experiences. Generally, each time a consumer clicks on a sponsored link, the search provider that provided the commercial search result receives a fee from the advertiser who paid for such sponsored link and the search provider pays us a portion of that fee. We, in turn, typically share a portion of the fee we receive with our customer. If an advertiser receives what it perceives to be a large number of clicks for which it needs to pay, but that do not result in a desired activity or an increase in sales, the advertiser may reduce or eliminate its advertisements through the search provider that provided the commercial search result to us. This reaction would lead to a loss of revenue to our search providers and consequently to lesser fees paid to us, which would have a material negative effect on our financial results.
Market prices for online advertising may decrease due to competitive or other factors. In addition, if a large number of Internet users use filtering software programs that limit or remove advertising from the users’ view, advertisers may perceive that Internet advertising is not effective and may choose not to advertise on the Internet.
The market for Internet-based services and products in which we operate is highly competitive, and if we cannot compete effectively, our sales may decline and our business may be harmed.
Competition in the market for Internet-based services and products in which we operate is intense and involves rapidly changing technologies and customer and subscriber requirements, as well as evolving industry standards and frequent product introductions. Our competitors may develop solutions that are similar or superior to our technology. Our primary competitors include high-speed Internet service providers with internal information technology staff capable of developing solutions similar to our technology. Other competitors include Yahoo!, Google, AOL and MSN, a division of Microsoft. Advantages some of our existing and potential competitors hold over us include the following:
• | significantly greater revenue and financial resources; |
• | stronger brand and consumer recognition; |
• | the capacity to leverage their marketing expenditures across a broader portfolio of services and products; |
• | more extensive proprietary intellectual property from which they can develop or aggregate content without having to pay fees or paying significantly lower fees than we do; |
• | pre-existing relationships with content providers that afford them access to content while blocking the access of competitors to that same content; |
• | pre-existing relationships with high-speed Internet service providers that afford them the opportunity to convert such providers to competing services and products; |
• | lower labor and development costs; and |
• | broader global distribution and presence. |
If we are unable to compete effectively or we are not as successful as our competitors in our target markets, our sales could decline, our margins could decline and we could lose market share, any of which would materially harm our business, financial condition and results of operations.
Government regulation of the Internet continues to evolve, and new laws and regulations could significantly harm our financial performance.
Today, there are relatively few laws specifically directed towards conducting business over the Internet. We expect more stringent laws and regulations relating to the Internet to be enacted. The adoption or modification of laws related to the Internet could harm our business, financial condition and results of operations by, among other things, increasing our costs and
22
administrative burdens. Due to the increasing popularity and use of the Internet, many laws and regulations relating to the Internet are being debated at the international, federal and state levels, which are likely to address a variety of issues such as:
• | user privacy and expression; |
• | ability to collect and/or share necessary information that allows us to conduct business on the Internet; |
• | export compliance; |
• | pricing and taxation; |
• | fraud; |
• | advertising; |
• | intellectual property rights; |
• | consumer protection; |
• | protection of minors; |
• | content regulation; |
• | information security; and |
• | quality of services and products. |
Several federal laws that could have an impact on our business have been adopted. The Digital Millennium Copyright Act of 1998 reduces the liability of online service providers of third-party content, including content that may infringe copyrights or rights of others. The Children’s Online Privacy Protection Act imposes additional restrictions on the ability of online services to collect user information from minors. In addition, the Protection of Children from Sexual Predators Act requires online service providers to report evidence of violations of federal child pornography laws under certain circumstances.
It could be costly for us to comply with existing and potential laws and regulations, and they could harm our marketing efforts and our attractiveness to advertisers by, among other things, restricting our ability to collect demographic and personal information from consumers or to use or disclose that information in certain ways. If we were to violate these laws or regulations, or if it were alleged that we had, we could face private lawsuits, fines, penalties and injunctions and our business could be harmed.
Finally, the applicability to the Internet and other online services of existing laws in various jurisdictions governing issues such as property ownership, sales and other taxes, libel and personal privacy is uncertain. Any new legislation or regulation, the application of laws and regulations from jurisdictions whose laws do not currently apply to our business, or the application of existing laws and regulations to the Internet and other online services could also increase our costs of doing business, discourage Internet communications, reduce demand for our services and expose us to substantial liability.
Public scrutiny of Internet privacy issues may result in increased regulation and different industry standards, which could deter or prevent us from providing our current products and solutions to our customers, thereby harming our business.
The regulatory framework for privacy issues worldwide is currently in flux and is likely to remain so for the foreseeable future. Practices regarding the collection, use, storage, transmission and security of personal information by companies operating over the Internet have recently come under increased public scrutiny. The United States government, including the Federal Trade Commission and the Department of Commerce, has announced that it is reviewing the need for greater regulation for the collection of information concerning consumer behavior on the Internet, including regulation aimed at restricting certain targeted advertising practices. In addition, the European Union is in the process of proposing reforms to its existing data protection legal framework, which may result in a greater compliance burden for companies with users in Europe. Various government and consumer agencies have also called for new regulation and changes in industry practices.
Our business, including our ability to operate and expand internationally, could be adversely affected if legislation or regulations are adopted, interpreted or implemented in a manner that is inconsistent with our current business practices and that require changes to these practices, our services or our privacy policies.
23
Risks Related to Ownership of Our Common Stock
Concentration of ownership among our directors, officers, large stockholders and their respective affiliates could limit our other stockholders’ ability to influence the outcome of key corporate decisions, such as an acquisition of our company.
Our directors, executive officers and holders of more than 5% of our common stock, together with their affiliates, beneficially own or control, directly or indirectly, as of December 31, 2013 over 30% of our outstanding common stock. As a result, these stockholders, if they act together, would have the ability to influence significantly the outcome of matters submitted to our stockholders for approval, including the election of directors and any merger, consolidation or sale of all or substantially all of our assets. In addition, these stockholders, if they act together, would have the ability to influence significantly the management and affairs of our company. Accordingly, this concentration of ownership might harm the trading price of our common stock by:
• | delaying, deferring or preventing a change in our control; |
• | impeding a merger, consolidation, takeover or other business combination involving us; or |
• | discouraging a potential acquirer from making a tender offer or otherwise attempting to obtain control of us. |
Future sales of our common stock may cause the trading price of our common stock to decline.
As of February 15, 2012, the closing date of our initial public offering, stockholders holding some 17,666,204 shares of our common stock had demand and piggyback rights to require us to register such shares with the SEC. If we register any of these shares of common stock, the stockholders would be able to sell those shares freely in the public market.
In addition, the shares that are either subject to outstanding options or that may be granted in the future under our 2012 Equity Incentive Plan will become eligible for sale in the public market to the extent permitted by the provisions of various vesting agreements.
As of February 22, 2012, we registered the shares of our common stock that we may issue under our equity plans. These shares can be freely sold in the public market upon issuance, subject to any vesting.
If a substantial number of any of these additional shares described are sold, or if it is perceived that a substantial number of such shares will be sold, in the public market, the trading price of our common stock could decline.
Some provisions of our certificate of incorporation, bylaws and Delaware law may discourage, delay or prevent a merger or acquisition or prevent the removal of our current board of directors and management.
Our amended and restated certificate of incorporation and amended and restated bylaws contain provisions that may discourage, delay or prevent a merger or acquisition or prevent the removal of our current board of directors and management. We have a number of anti-takeover devices in place that will hinder takeover attempts, including:
• | our board of directors is classified into three classes of directors with staggered three-year terms; |
• | our directors may only be removed for cause, and only with the affirmative vote of a majority of the voting interest of stockholders entitled to vote; |
• | only our board of directors and not our stockholders will be able to fill vacancies on our board of directors; |
• | only our chairman of the board, our chief executive officer or a majority of our board of directors, and not our stockholders, are authorized to call a special meeting of stockholders; |
• | our stockholders will be able to take action only at a meeting of stockholders and not by written consent; |
• | our amended and restated certificate of incorporation authorizes undesignated preferred stock, the terms of which may be established and shares of which may be issued without stockholder approval; and |
• | advance notice procedures apply for stockholders to nominate candidates for election as directors or to bring matters before an annual meeting of stockholders. |
These provisions and other provisions in our charter documents could discourage, delay or prevent a transaction involving a change in our control. Any delay or prevention of a change in control transaction could cause stockholders to lose a
24
substantial premium over the then-current trading price of their shares. These provisions could also discourage proxy contests and could make it more difficult for our stockholders to elect directors of their choosing or to cause us to take other corporate actions such stockholders desire.
In addition, we are subject to Section 203 of the Delaware General Corporation Law, which, subject to some exceptions, prohibits “business combinations” between a Delaware corporation and an “interested stockholder,” which is generally defined as a stockholder who becomes a beneficial owner of 15% or more of a Delaware corporation’s voting stock, for a three-year period following the date that the stockholder became an interested stockholder. Section 203 could have the effect of delaying, deferring or preventing a change in control that our stockholders might consider to be in their best interests.
We have not paid cash dividends on our capital stock, and we do not expect to do so in the foreseeable future.
We have not historically paid cash dividends on our capital stock, and we have agreed not to pay any dividends or make any other distributions in our Loan and Security Agreement with Silicon Valley Bank. We anticipate that we will retain all future earnings and cash resources for the future operation and development of our business, and as a result, we do not anticipate paying any cash dividends to holders of our capital stock for the foreseeable future. Any future determination regarding the payment of any dividends will be made at the discretion of our board of directors and will depend on our financial condition, results of operations, capital requirements, general business conditions, bank covenants and other factors that our board may deem relevant. Consequently, investors must rely on sales of their common stock after price appreciation, which may never occur, as the only way to realize any future gains on their investment.
The trading price and volume of our common stock has been and will likely continue to be volatile, and the value of an investment in our common stock may decline.
The trading price of our common stock has been, and is likely to continue to be, volatile and could decline substantially within a short period of time. For example, since shares of our common stock were sold in our initial public offering in February 2012 at a price of $5.00 per share through the close of business on March 1, 2014, our trading price has ranged from $2.13 to $18.00. The trading price of our common stock may be subject to wide fluctuations in response to various factors, some of which are beyond our control, including but not limited to the various factors set forth in this "Risk Factors" section, as well as:
• | variations in our financial performance; |
• | announcements of technological innovations, new services and products, strategic alliances, asset acquisitions, or significant agreements by us or by our competitors; |
• | recruitment or departure of key personnel, such as Mr. Frankel, our President and Chief Executive Officer; |
• | changes in the estimates of our operating results or changes in recommendations or withdrawal of research coverage by securities analysts; |
• | market conditions in our industry, the industries of our customers and the economy as a whole; and |
• | adoption or modification of laws, regulations, policies, procedures or programs applicable to our business or announcements relating to these matters. |
In addition, if the market for technology stocks or the stock market in general experiences loss of investor confidence, the trading price of our common stock could decline for reasons unrelated to our business, financial condition or results of operations. The trading price of our common stock might also decline in reaction to events that affect other companies in our industry even if these events do not directly affect us. Some companies that have had volatile market prices for their securities have had securities class actions filed against them. Such a suit filed against us, regardless of its merits or outcome, could cause us to incur substantial costs and could divert management’s attention.
If securities or industry analysts do not publish research or reports about our company, our stock price and trading volume could decline.
The trading market for our common stock depends in part on the research and reports that securities or industry analysts publish about us or our business. If one or more of the analysts who cover us downgrade our stock or publish inaccurate or unfavorable research about our business, our stock price would likely decline. If one or more of these analysts cease coverage of our company or fail to publish reports on us regularly, demand for our stock could decrease, which might cause our stock price and trading volume to decline.
25
The requirements of being a public company, including increased costs and demands upon management as a result of complying with federal securities laws and regulations applicable to public companies, may adversely affect our financial performance and our ability to attract and retain directors.
As a public company, we are subject to the reporting requirements of the Securities Exchange Act of 1934, as amended, or the Exchange Act, the Sarbanes-Oxley Act, the Dodd-Frank Wall Street Reform and Consumer Protection Act, or the Dodd-Frank Act, and the rules and regulations of The NASDAQ Global Market. The Sarbanes-Oxley Act, as well as rules subsequently implemented by the SEC and NASDAQ, impose additional requirements on public companies, including enhanced corporate governance practices. For example, the NASDAQ listing requirements require that listed companies satisfy certain corporate governance requirements relating to independent directors, audit committees, distribution of annual and interim reports, stockholder meetings, stockholder approvals, solicitation of proxies, conflicts of interest, stockholder voting rights and codes of business conduct. Our management team has limited experience managing a publicly-traded company or complying with the increasingly complex laws pertaining to public companies. In addition, most of our current directors have limited experience serving on the boards of public companies.
The requirements of these rules and regulations have increased and will continue to increase our legal, accounting and financial compliance costs, make some activities more difficult, time-consuming and costly and may also place undue strain on our personnel, systems and resources. Our management and other personnel must devote a substantial amount of time to these requirements. These rules and regulations will also make it more difficult and more expensive for us to maintain directors’ and officers’ liability insurance, and we may be required to accept reduced coverage or incur substantially higher costs to maintain coverage. If we are unable to maintain adequate directors’ and officers’ insurance, our ability to recruit and retain qualified directors, especially those directors who may be considered independent for purposes of NASDAQ rules, and officers may be significantly curtailed.
ITEM 1B. | UNRESOLVED STAFF COMMENTS |
None.
ITEM 2. | PROPERTIES |
Our corporate headquarters are located at 40 La Riviere Drive, Buffalo, New York 14202. We lease approximately 45,000 square feet of office space at this address pursuant to a sublease agreement that expires in March 2016. The sublease agreement grants us a right of first offer over approximately 33,000 additional square feet in the same building.
We also maintain administrative and product development offices in New York, New York; Los Angeles, California; Toronto and Ottawa, Ontario, Canada; and Westford, Massachusetts. We also have data centers in Atlanta, Georgia; Dallas, Texas; Lewis Center, Ohio; Buffalo, New York; Denver, Colorado; and Amsterdam, The Netherlands.
We believe that our facilities are adequate to meet our current needs and that suitable additional or substitute space will be available as needed.
ITEM 3. | LEGAL PROCEEDINGS |
From time to time, we may become involved in legal proceedings arising in the ordinary course of our business. We are not presently involved in any legal proceedings, the outcome of which, if determined adversely to us, would have a material adverse effect on our business, results of operations or financial condition.
ITEM 4. | MINE SAFETY DISCLOSURES |
Not applicable.
26
PART II
ITEM 5. | MARKET FOR REGISTRANT’S COMMON EQUITY, RELATED STOCKHOLDER MATTERS AND ISSUER PURCHASES OF EQUITY SECURITIES |
Market Information
Our common stock has been listed on The NASDAQ Global Market, or Nasdaq, under the symbol “SYNC” since February 10, 2012.
The following table sets forth, for the indicated periods, the high and low sales prices per share by quarter for our common stock as reported by NASDAQ.
Fiscal Year 2013 Quarters Ended: | High | Low | |||||
March 31, 2013 | $ | 6.24 | $ | 2.72 | |||
June 30, 2013 | 4.17 | 2.58 | |||||
September 30, 2013 | 3.59 | 2.53 | |||||
December 31, 2013 | 2.88 | 2.25 | |||||
Fiscal Year 2012 Quarters Ended: (1) | |||||||
March 31, 2012 | 8.10 | 4.75 | |||||
June 30, 2012 | 15.00 | 6.36 | |||||
September 30, 2012 | 18.00 | 7.35 | |||||
December 31, 2012 | 7.98 | 4.44 | |||||
Notes:
(1) | There was no public market for our common stock prior to February 10, 2012. |
Holders of Record
As of March 25, 2014, there were 92 holders of record of our common stock. The number of holders of record of our common stock does not reflect the number of beneficial holders whose shares are held by depositors, brokers or other nominees.
Dividend Policy
We have never declared or paid cash dividends on our common stock. It is our policy to retain earnings to finance the growth and development of our business and, therefore, we do not anticipate paying any dividends in the foreseeable future. Any future determination as to the declaration and payment of dividends, if any, will be at the discretion of our board of directors and will depend on the existing conditions, including our financial condition, operating results, applicable Delaware law, contractual restrictions, capital requirements, business prospects and other factors our board of directors may deem relevant. In addition, our loan and security agreement with Silicon Valley Bank restricts our ability to pay any dividends. See “Management’s Discussion and Analysis of Financial Condition and Results of Operations—Liquidity and Capital Resources.”
Securities Authorized for Issuance Under Equity Compensation Plans
The information required to be disclosed by Item 201(d) of Regulation S-K regarding our equity securities authorized for issuance under our equity incentive plans is incorporated herein by reference to the section entitled “Securities Authorized for Issuance Under Equity Compensation Plans” in our definitive Proxy Statement for our Annual Meeting of Stockholders to be filed with the Commission within 120 days after the end of fiscal year 2013 pursuant to Regulation 14A.
Stock Performance Graph
Notwithstanding any statement to the contrary in any of our previous or future filings with the SEC, the following information relating to the price performance of our common stock shall not be deemed to be “filed” with the SEC or to be “soliciting material” under the Exchange Act, and it shall not be deemed to be incorporated by reference into any of our filings under the Securities Act or the Exchange Act, except to the extent we specifically incorporate it by reference into such filing.
27
The graph below compares the cumulative total stockholder return of our common stock with that of the NASDAQ Composite Index and the NASDAQ Computer Index from January 2, 2013 (the first trading day in 2013) through December 31, 2013. The graph assumes that $100 was invested in shares of our common stock, the NASDAQ Composite Index and the NASDAQ Computer Index at the close of market on January 2, 2013, and that dividends, if any, were reinvested. The comparisons in this graph are based on historical data and are not intended to forecast or be indicative of future performance of our common stock.
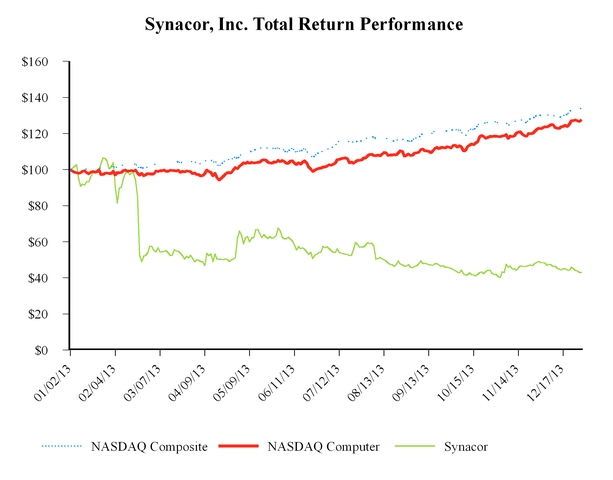
Recent Sales of Unregistered Securities
None.
Use of Proceeds
In February 2012, we completed the initial public offering of shares of our common stock, in which we issued and sold 5,454,545 shares of common stock at a price to the public of $5.00 per share, for aggregate gross proceeds to the Company of $27.3 million, in each case excluding shares of common stock sold by selling stockholders in the offering. The offer and sale of all of the shares in the IPO were registered under the Securities Act pursuant to a registration statement on Form S-1 (File No. 333-178049), which was declared effective by the SEC on February 9, 2012.
There has been no material change in the planned use of proceeds from our initial public offering as described in our final prospectus filed with the SEC on February 10, 2012 pursuant to Rule 424(b).
Issuer Purchases of Equity Securities
No shares of our common stock were repurchased during the year ended December 31, 2013.
28
ITEM 6. | SELECTED FINANCIAL DATA |
You should read the following selected consolidated historical financial data below in conjunction with “Management’s Discussion and Analysis of Financial Condition and Results of Operations” and the financial statements, related notes and other financial information included in this Annual Report on Form 10-K. The selected consolidated financial data in this section is not intended to replace the financial statements and is qualified in its entirety by the financial statements and related notes included in this Annual Report on Form 10-K.
We derived the selected consolidated financial data for the years ended December 31, 2011, 2012 and 2013 and as of December 31, 2012 and 2013 from our audited consolidated financial statements and related notes, which are included in this Annual Report on Form 10-K. We derived the selected consolidated financial data for the years ended December 31, 2009 and 2010 and as of December 31, 2009, 2010 and 2011 from our audited consolidated financial statements and related notes, which are not included in this Annual Report on Form 10-K. Our historical results are not necessarily indicative of the results to be expected in the future.
Year Ended December 31, | |||||||||||||||||||
2009 | 2010 | 2011 | 2012 | 2013 | |||||||||||||||
(in thousands except share and per share data) | |||||||||||||||||||
Consolidated Statements of Operations Data: | |||||||||||||||||||
Revenue | $ | 60,798 | $ | 66,232 | $ | 91,060 | $ | 121,981 | $ | 111,807 | |||||||||
Costs and operating expenses: | |||||||||||||||||||
Cost of revenue (1) | 34,074 | 36,703 | 48,661 | 66,620 | 59,622 | ||||||||||||||
Research and development (1)(2) | 13,627 | 18,494 | 20,228 | 25,603 | 28,458 | ||||||||||||||
Sales and marketing (2) | 5,591 | 6,211 | 8,582 | 9,120 | 8,124 | ||||||||||||||
General and administrative (1)(2) | 4,966 | 5,656 | 6,879 | 11,011 | 11,663 | ||||||||||||||
Depreciation | 2,005 | 2,506 | 2,667 | 3,779 | 4,650 | ||||||||||||||
Total costs and operating expenses | 60,263 | 69,570 | 87,017 | 116,133 | 112,517 | ||||||||||||||
Income (loss) from operations | 535 | (3,338 | ) | 4,043 | 5,848 | (710 | ) | ||||||||||||
Other income (expense) | 69 | (2 | ) | (17 | ) | 1 | (37 | ) | |||||||||||
Interest expense | (285 | ) | (240 | ) | (109 | ) | (270 | ) | (193 | ) | |||||||||
Income (loss) before income taxes | 319 | (3,580 | ) | 3,917 | 5,579 | (940 | ) | ||||||||||||
Provision (benefit) for income taxes | 15 | 11 | (6,015 | ) | 1,764 | (134 | ) | ||||||||||||
Loss in equity interest | — | — | — | — | (561 | ) | |||||||||||||
Net income (loss) | 304 | (3,591 | ) | 9,932 | 3,815 | (1,367 | ) | ||||||||||||
Undistributed earnings allocated to preferred stockholders | 279 | — | 8,583 | — | — | ||||||||||||||
Net income (loss) attributable to common stockholders | $ | 25 | $ | (3,591 | ) | $ | 1,349 | $ | 3,815 | $ | (1,367 | ) | |||||||
Net income (loss) per share attributable to common stockholders: | |||||||||||||||||||
Basic | $ | 0.01 | $ | (1.93 | ) | $ | 0.59 | $ | 0.16 | $ | (0.05 | ) | |||||||
Diluted | $ | 0.01 | $ | (1.93 | ) | $ | 0.45 | $ | 0.14 | $ | (0.05 | ) | |||||||
Weighted average shares used to compute net income (loss) per share attributable to common stockholders: | |||||||||||||||||||
Basic | 1,814,029 | 1,865,294 | 2,303,443 | 24,411,194 | 27,306,882 | ||||||||||||||
Diluted | 22,293,068 | 1,865,294 | 21,974,403 | 28,097,313 | 27,306,882 | ||||||||||||||
Other Financial Data: | |||||||||||||||||||
Adjusted EBITDA (3) | $ | 3,441 | $ | 36 | $ | 7,630 | $ | 11,626 | $ | 6,501 | |||||||||
Notes:
29
(1) | Exclusive of depreciation shown separately. |
(2) | Includes stock-based compensation as follows: |
Year Ended December 31, | |||||||||||||||||||
2009 | 2010 | 2011 | 2012 | 2013 | |||||||||||||||
(in thousands) | |||||||||||||||||||
Research and development | $ | 252 | $ | 398 | $ | 295 | $ | 523 | $ | 1,184 | |||||||||
Sales and marketing | 189 | 202 | 203 | 404 | 348 | ||||||||||||||
General and administrative | 460 | 268 | 422 | 1,072 | 1,029 | ||||||||||||||
$ | 901 | $ | 868 | $ | 920 | $ | 1,999 | $ | 2,561 | ||||||||||
(3) | We define adjusted EBITDA as net income (loss) plus: provision (benefit) for income taxes, interest expense, other (income) expense, depreciation, loss in equity interest, and stock-based compensation. Please see “Adjusted EBITDA” below for more information and for a reconciliation of adjusted EBITDA to net (loss) income, the most directly comparable financial measure calculated and presented in accordance with GAAP. |
As of December 31, | |||||||||||||||||||
2009 | 2010 | 2011 | 2012 | 2013 | |||||||||||||||
(in thousands) | |||||||||||||||||||
Consolidated Balance Sheet Data: | |||||||||||||||||||
Cash and cash equivalents | $ | 10,462 | $ | 5,412 | $ | 10,925 | $ | 41,944 | $ | 36,397 | |||||||||
Trade receivables, net | 7,773 | 9,654 | 14,336 | 15,624 | 14,569 | ||||||||||||||
Property and equipment, net | 6,631 | 7,110 | 8,301 | 11,043 | 14,085 | ||||||||||||||
Total assets | 26,004 | 24,327 | 43,382 | 76,330 | 74,789 | ||||||||||||||
Long-term bank financing and capital lease obligations | 1,247 | 1,203 | 2,098 | 1,712 | 885 | ||||||||||||||
Total stockholders’ equity | 13,053 | 10,156 | 21,380 | 50,811 | 52,231 | ||||||||||||||
Adjusted EBITDA
To provide investors with additional information regarding our financial results, we have disclosed within this Annual Report on Form 10-K adjusted EBITDA, a non-GAAP financial measure. We have provided a reconciliation below of adjusted EBITDA to net income (loss), the most directly comparable GAAP financial measure.
We have included adjusted EBITDA in this Annual Report on Form 10-K because it is a key measure used by our management and board of directors to understand and evaluate our core operating performance and trends, to prepare and approve our annual budget and to develop short- and long-term operational plans. In particular, the exclusion of certain expenses in calculating adjusted EBITDA can provide a useful measure for period-to-period comparisons of our core business. Additionally, adjusted EBITDA is a key financial measure used by the compensation committee of our board of directors in connection with the payment of bonuses to our executive officers. Accordingly, we believe that adjusted EBITDA provides useful information to investors and others in understanding and evaluating our operating results in the same manner as our management and board of directors.
Our use of adjusted EBITDA has limitations as an analytical tool, and you should not consider it in isolation or as a substitute for analysis of our results as reported under GAAP. Some of these limitations are:
• | although depreciation is a non-cash charge, the assets being depreciated may have to be replaced in the future, and adjusted EBITDA does not reflect capital expenditure requirements for such replacements or for new capital expenditure requirements; |
• | adjusted EBITDA does not reflect changes in, or cash requirements for, our working capital needs; |
• | adjusted EBITDA does not consider the potentially dilutive impact of equity-based compensation; |
• | adjusted EBITDA does not reflect tax payments that may represent a reduction in cash available to us; and |
• | other companies, including companies in our industry, may calculate adjusted EBITDA differently, which reduces its usefulness as a comparative measure. |
30
Because of these limitations, you should consider adjusted EBITDA alongside other financial performance measures, including various cash flow metrics, net (loss) income and our other GAAP results. The following table presents a reconciliation of adjusted EBITDA to net (loss) income for each of the periods indicated:
Year Ended December 31, | |||||||||||||||||||
2009 | 2010 | 2011 | 2012 | 2013 | |||||||||||||||
(in thousands) | |||||||||||||||||||
Reconciliation of Adjusted EBITDA: | |||||||||||||||||||
Net income (loss) | $ | 304 | $ | (3,591 | ) | $ | 9,932 | $ | 3,815 | $ | (1,367 | ) | |||||||
Provision (benefit) for income taxes | 15 | 11 | (6,015 | ) | 1,764 | (134 | ) | ||||||||||||
Interest expense | 285 | 240 | 109 | 270 | 193 | ||||||||||||||
Other (income) expense (1) | (69 | ) | 2 | 17 | (1 | ) | 37 | ||||||||||||
Depreciation | 2,005 | 2,506 | 2,667 | 3,779 | 4,650 | ||||||||||||||
Loss in equity interest | — | — | — | — | 561 | ||||||||||||||
Stock-based compensation | 901 | 868 | 920 | 1,999 | 2,561 | ||||||||||||||
Adjusted EBITDA | $ | 3,441 | $ | 36 | $ | 7,630 | $ | 11,626 | $ | 6,501 | |||||||||
Note:
(1) | Other (income) expense consists primarily of interest income earned and foreign exchange gains and losses. |
31
ITEM 7. | MANAGEMENT’S DISCUSSION AND ANALYSIS OF FINANCIAL CONDITION AND RESULTS OF OPERATIONS |
The following discussion of our results of operations and financial condition should be read in conjunction with the information set forth in “Selected Financial Data” and our financial statements and the notes thereto included in this Annual Report on Form 10-K. This discussion contains forward-looking statements based upon our current expectations, estimates and projections that involve risks and uncertainties. Actual results could differ materially from those anticipated in these forward-looking statements due to, among other considerations, the matters discussed under “Risk Factors” and “Special Note Regarding Forward-Looking Statements.”
Overview
We are a leading provider of start experiences (startpages and homescreens), TV Everywhere, Identity Management (IDM), and various cloud-based services across multiple devices for cable, satellite, telecom and consumer electronics companies. For these customers, we are also a leading provider of authentication and aggregation solutions enabling the delivery of personalized, online content. Our technology allows our customers to package a wide array of personalized, online content and cloud-based services with their high-speed Internet, communications, television and other offerings. Our customers offer our services under their own brands on Internet-enabled devices such as PCs, tablets, smartphones and connected TVs.
We generate revenue from search and display advertising and by charging subscriber-based fees for services and products delivered through our start experiences. Our results are driven primarily by our customer mix, the product and service mix preferences of those customers and the pricing of those products and services. We generate the majority of our revenue from search and display advertising on our start experiences, which comprise consumer-facing components of our technology. Adding new customers with large consumer bases and expansion of our relationships with existing customers have historically resulted in an increasing shift in our revenue mix towards search and display advertising revenue. Growth in our business (through growth in search and display advertising revenue) is dependent on new customers adopting our solutions and their respective consumers’ use of our start experiences ramping up as described below. Increases in search and display advertising revenue are largely driven by our model of sharing a portion of this search and advertising revenue with our customers. As we expand our cloud-based and value added services offerings, we expect to generate increased subscriber-based revenue from our customers.
During the year ended December 31, 2013, search and display advertising revenue was $90.4 million, a decrease of 11% over $101.6 million for the year ended December 31, 2012. Over the same period, our unique visitors decreased by 3%, our search queries decreased by 26% and our advertising impressions decreased by 3%. Search revenue decreased by $10.9 million for the year ended December 31, 2013 compared to the year ended December 31, 2012. We believe a material portion of the decrease was due to the placement of our start experiences on the second tab of the default Windows 8 Internet browser by our consumer electronics customers. In addition, and to a lesser extent, we believe the decrease was due to lower search activity associated with the increased usage of other devices such as tablets and smartphones generally across the consumer base. We anticipate that search activity will increase on smartphones and tablets in the future and, although our search queries are down, we believe that our continuing investment in mobile products, such as our acquisitions of Carbyn and Teknision, will allow us to compete more effectively for search activity on smartphones and tablets. Display advertising revenue decreased slightly by $0.2 million for the year ended December 31, 2013 compared to the year ended December 31, 2012. We anticipate video advertising may become an increasing percentage of our advertising revenue which may also serve to increase our advertising CPMs. We also anticipate that the signing, and launching, of new customers and our mobile product initiatives may help add new search and display advertising revenue in future years.
Our subscriber-based revenue consists of fees charged for the use of our proprietary technology and for the use of, or access to, services, such as e-mail, security, TV Everywhere, online games, music and other value added services and paid content. During the year ended December 31, 2013, subscriber-based revenue was $21.4 million, an increase of 5% from $20.4 million during the year ended December 31, 2012. This increase is primarily driven by growth in our e-mail and TV Everywhere services to our customers. We believe there are opportunities to generate new sources of subscriber-based revenue, such as the introduction of new value added services, including those delivered on smartphones and tablets. We believe that the variety of value added services and the introduction of new value added services will also drive increased search and display advertising revenue.
As we obtain new customers and those new customers introduce our start experiences to their consumers, we expect that usage of our solutions and our revenue from our start experiences to increase over time. There are a variety of reasons for this ramp-up process. For example, a new customer may migrate its consumers from its existing technology to our technology
32
over a period of time. Moreover, a new customer may initially launch a selection of our services and products, rather than our entire suite of offerings, and subsequently broaden their service and product offerings over time. When a customer launches a new service or product, marketing and promotional activities may be required to generate awareness and interest among consumers. Search and display advertising revenue typically grows significantly during the first one to three years after a customer launch, although there can be notable variances from customer to customer. Thereafter, changes in revenue tend to mirror changes in the consumer base of the applicable customer.
For the year ended December 31, 2013, we derived revenue from over 50 customers, with revenue attributable to four customers, CenturyLink (including revenue attributable to Qwest), Charter, Verizon and Toshiba, together accounting for approximately 68% of our revenue for the year ended December 31, 2013, or $75.6 million. One of these customers accounted for 20% or more of revenue in such period, and revenue attributable to each of the other three customers accounted for more than 10% in such period.
Revenue attributable to our customers includes the subscriber-based revenue earned directly from them, as well as the search and display advertising revenue generated through our relationships with our search and display advertising partners (such as Google for search advertising and advertising networks, advertising agencies and advertisers for display advertising). This revenue is attributable to our customers because it is produced from the traffic on our start experiences. These partners provide us with advertisements that we then deliver with search results and other content on our start experiences. Since our search advertising partner, Google, and our advertising network partners generate their revenue by selling those advertisements, we create a revenue stream for these partners. In the year ended December 31, 2013, search advertising through our relationship with Google generated approximately 51% of our revenue, or $57.5 million (all of which was attributable to our customers).
The initiatives described below under “Key Initiatives” are expected to contribute to our ability to maintain and grow revenue and return to profitability via increases in advertising revenue, increases in customers and our consumer reach, and increases in availability of products across more devices. We expect the period in which we experience a return on future investments in each of these initiatives to differ. For example, more direct advertising at higher CPMs would be expected to have an immediate and direct impact on profitability while expansion into international markets may require an investment that involves a longer term return. We intend to utilize some of the net proceeds of our initial public offering to improve our ability to achieve consistent profitability in the future by enhancing our technology and our systems capabilities to more efficiently support our customers, develop new products and features and report upon, analyze and manage the financial performance of the business.
Trends Affecting Our Business
Our customers, who are predominantly high-speed Internet service providers that also offer television services, are facing increasing competition from companies that deliver video content over the Internet, more commonly referred to as “over-the-top,” or OTT. These new competitors include a number of large and growing companies, such as Google, Netflix, Inc., or Netflix, Hulu, LLC, or Hulu, and Amazon.com Inc., or Amazon. With the increased availability of high-speed Internet access and over-the-top programming, consumers’ video content consumption preferences may shift away from current viewing habits. As a result, many of our customers and potential customers are compelled to find new ways to deliver services and content to their consumers via the Internet. We expect this pressure to become even greater as more video content becomes available online. We expect to continue to benefit from this trend as customers adopt our solutions to package and deliver video programming and other related authentication services on our start experiences.
Another trend affecting our customers and our business is the proliferation of Internet-connected devices, especially mobile devices. Smartphones, tablets and connected TVs have made it more convenient for consumers to access services and content online, including television programming. To remain competitive, our customers and potential customers must have the capability to deliver their services and products to consumers on these new devices. Our technology enables them to extend their presence beyond traditional personal computers, and we expect that some portion of our revenue growth will come from traffic on these devices.
Our business is also affected by growth in advertising on the Internet, for which the proliferation of high-speed Internet access and Internet-connected devices will be the principal drivers. We expect our results of operations will benefit from the growth in the number of mobile Internet users as our customers adopt our mobile and tablet offerings.
The launch of the Microsoft Windows 8 operating system in October 2012 has had an impact on our business. As it relates to our business with consumer electronics customers that have the Windows 8 operating system pre-installed on their laptop or desktop computers, our start experiences are now placed on a second tab when the Internet browser is launched. This has caused us to reduce our revenue expectations from our consumer electronics customers.
33
Key Initiatives
We are focused on several key initiatives to drive our business:
• | add new, and expand our existing offerings with current, cable, telecom, satellite and consumer electronics customers to increase our consumer reach; |
• | continue to expand our offerings of, and invest in, mobile technology and cloud-based services such as e-mail and TV Everywhere and increase the number of customers using our TV Everywhere technology; |
• | extend the availability of our existing and new products and services to additional devices including tablets and smartphones; |
• | enhance our direct advertising sales effort to increase the CPMs derived from advertising; |
• | expand our presence into international markets; and |
• | invest in and acquire new technologies and products. |
Key Business Metrics
In addition to the line items in our financial statements, we regularly review a number of business metrics related to Internet traffic and search and display advertising to evaluate our business, determine the allocation of resources and make decisions regarding business strategies. We believe disclosing these metrics is useful for investors and analysts to understand the underlying trends in our business. The following table summarizes our key business metrics, which are unaudited, for the years ended December 31, 2011, 2012 and 2013:
Year Ended December 31, | ||||||||
2011 | 2012 | 2013 | ||||||
Key Business Metrics: | ||||||||
Unique Visitors (1) | 14,619,254 | 20,440,169 | 19,818,670 | |||||
Search Queries (2) | 748,576,869 | 968,233,560 | 711,992,036 | |||||
Advertising Impressions (3) | 27,749,105,979 | 42,170,186,571 | 40,982,588,804 | |||||
Notes:
(1) | Reflects the number of unique visitors to our start experiences computed on an average monthly basis during the applicable period. |
(2) | Reflects the total number of search queries during the applicable period. |
(3) | Reflects the total number of advertising impressions during the applicable period. |
Unique Visitors
We define unique visitors as consumers who have visited one of our start experiences at least once during a particular time period. We rely on comScore to provide this data. comScore estimates this data based on the U.S. portion of the Internet activity of its worldwide panel of consumers and its proprietary data collection method.
Search Queries
We define search queries as the number of instances in which a consumer entered a query into a search bar on our start experiences during a particular time period. We rely on reports from our search partner, Google, to measure the number of such instances.
Advertising Impressions
We define advertising impressions as graphical, textual or video paid advertisements displayed to consumers on our start experiences during a particular time period. We rely on reports from technology and advertising partners, including DoubleClick (a division of Google), to measure the number of advertising impressions delivered on our platform.
Components of our Results of Operations
Revenue
34
We derive our revenue from two categories: revenue generated from search and display advertising activities and subscriber-based revenue, each of which is described below. We record our search and display advertising revenue on a gross basis, which includes the net amount received from Google under our agreement with them. The following table shows the revenue in each category, both in amount and as a percentage of revenue, for 2011, 2012, and 2013.
Year Ended December 31, | |||||||||||
2011 | 2012 | 2013 | |||||||||
(in thousands) | |||||||||||
Revenue: | |||||||||||
Search and display advertising | $ | 72,084 | $ | 101,559 | $ | 90,447 | |||||
Subscriber-based | 18,976 | 20,422 | 21,360 | ||||||||
Total revenue | $ | 91,060 | $ | 121,981 | $ | 111,807 | |||||
Percentage of revenue: | |||||||||||
Search and display advertising | 79 | % | 83 | % | 81 | % | |||||
Subscriber-based | 21 | 17 | 19 | ||||||||
Total revenue | 100 | % | 100 | % | 100 | % | |||||
Search and Display Advertising Revenue
We use Internet search and display advertising to generate revenue from the traffic on our start experiences.
• | In the case of search advertising, we have a revenue-sharing relationship with Google, pursuant to which we include a Google-branded search tool on our start experiences. When a consumer makes a search query using this tool, we deliver the query to Google and they return search results to consumers that include advertiser-sponsored links. If the consumer clicks on a sponsored link, Google receives payment from the sponsor of that link and shares a portion of that payment with us, which we in turn share with the applicable customer. The net payment we receive from Google is recognized as revenue. |
• | We generate display advertising revenue when consumers view or click on a text, graphic or video advertisement that was delivered on a Synacor-operated start experience. We fill our advertising inventory with advertisements sourced by our direct salesforce, independent advertising sales representatives and advertising network partners. Revenue may be calculated differently depending on our agreements with our advertisers or the agreements between our advertising network partners and their advertisers. It may be calculated on a cost per impression basis, which means the advertiser pays based on the number of times its advertisements appear, or a cost per action basis, which means that an advertiser pays when a consumer performs an action after engaging one of its advertisements, or on a fixed fee basis. Historically only a small percentage of our display advertising revenue has been calculated on a cost per action basis or fixed fee basis. |
Subscriber-Based Revenue
We define subscriber-based revenue as subscription fees and other fees that we receive from our customers for the use of our proprietary technology and the use of, or access to, e-mail, TV Everywhere, security, games and other services, including value added services and paid content. Monthly subscriber levels typically form the basis for calculating and generating subscriber-based revenue. They are generally determined by multiplying a per-subscriber per-month fee by the number of subscribers using the particular services being offered or consumed. In other cases, the fee is fixed. We recognize revenue from our customers as the service is delivered.
Costs and Expenses
Cost of Revenue
Cost of revenue consists of revenue sharing, content acquisition costs and co-location facility costs. Revenue sharing consists of amounts accrued and paid to our customers for the traffic on the start experiences we operate for them that results in the generation of search and display advertising revenue. The revenue-sharing agreements with our customers are primarily variable payments based on a percentage of the search and display advertising revenue. Content acquisition agreements may be based on a fixed payment schedule, on the number of subscribers per month, or a combination of both. Fixed-payment
35
agreements are expensed over the term defined in the agreement. Agreements based on the number of subscribers are expensed on a monthly basis. Co-location facility costs consist of rent and operating costs for our data center facilities.
Research and Development
Research and development expenses consist primarily of compensation-related expenses incurred for the development of, enhancements to, and maintenance and operation of our technology and related infrastructure.
Sales and Marketing
Sales and marketing expenses consist primarily of compensation-related expenses to our direct sales and marketing personnel, as well as costs related to advertising, industry conferences, promotional materials, and other sales and marketing programs. Advertising cost is expensed as incurred.
General and Administrative
General and administrative expenses consist primarily of compensation related expenses for executive management, finance, accounting, human resources and other administrative functions.
Depreciation
Depreciation includes depreciation of our computer hardware and software, furniture and fixtures, leasehold improvements, and other property, and depreciation on capital leased assets.
Other Income (Expense)
Other income (expense) consists primarily of interest income earned and foreign exchange gains and losses.
Interest Expense
Interest expense primarily consists of expenses associated with our capital leases.
Provision (benefit) for Income Taxes
Income tax expense (benefit) consists of federal and state income taxes in the United States and taxes in certain foreign jurisdictions.
Loss in Equity Interest
Loss in equity interest represents our percentage share of losses in investments in entities in which we can exercise significant influence, but do not own a majority equity interest or otherwise control.
Critical Accounting Policies
The preparation of financial statements in conformity with GAAP requires estimates and assumptions that affect the reported amounts and classifications of assets and liabilities, revenue and expenses, and the related disclosures of contingent liabilities in the financial statements and accompanying notes. The SEC has defined a company’s critical accounting policies as the ones that are most important to the portrayal of the company’s financial condition and results of operations, and which require the company to make its most difficult and subjective judgments, often as a result of the need to make estimates of matters that are inherently uncertain. Based on this definition, we have identified the following critical accounting policies and estimates addressed below. We also have other key accounting policies, which involve the use of estimates, judgments, and assumptions that are significant to understanding our results. See Note 1, The Company and Summary of Significant Accounting Policies, of Notes to the Financial Statements. Although we believe that our estimates, assumptions, and judgments are reasonable, they are based upon information available at the time. Actual results may differ significantly from these estimates under different assumptions, judgments, or conditions.
Revenue Recognition
We recognize revenue when the following criteria are met: persuasive evidence of an arrangement exists; delivery has occurred; the selling price is fixed or determinable; and collectability is reasonably assured.
The terms of our arrangements with our customers, Google and our advertising network partners are specified in written agreements. These written agreements constitute the persuasive evidence of the arrangements with our customers that
36
are a pre-condition to the recognition of revenue. The evidence used to document that delivery or performance has occurred generally consists of communication of either numbers of subscribers or the revenue generated in a reporting period from customers, advertising partners, vendors and our own internally-generated reports. Occasionally, a customer will notify us of subsequent adjustments to previously reported subscriber data. These adjustments, once accepted by us, will result in adjustments to revenue and cost of revenue. The historical occurrences of such adjustments, and the amounts involved, have not been significant.
Although prices used in our revenue recognition formulas are generally fixed pursuant to the written arrangements with our customers, Google and our advertising network partners, the number of subscribers or the amount of search and display advertising revenue that are subject to our pricing arrangements are not known until the reporting period has ended. Although this data is, in most cases, available prior to the completion of our periodic financial statements, this data may need to be estimated. When made, these estimates are based upon our historical experience with the relevant party. Adjustments to these estimates have historically not been significant. The receipt of this volume data also serves to verify that we have appropriately satisfied our obligation to our customers for that reporting period. Adjustments are recorded in the period in which the data is received.
Pursuant to the terms of our customer contracts, we recognize revenue in each period for our services once the contract has been signed, its terms reviewed and understood, the service, content or both have been made available to the customer and reliable active subscriber information is made available to us.
We undertake an evaluation of the creditworthiness of both new and, on a periodic basis, existing customers. Based on these reviews we determine whether collection of our prospective revenue is probable.
Revenue Sharing
We pay our customers a portion of the revenue generated from search and display advertising. The portion paid to our customers depends on, among other things, the consumer base of the customer and their expected ability to drive consumer traffic to our start experiences. This revenue consists of the consideration we receive from Google and our display advertising partners in connection with traffic supplied by the applicable customer.
Gross Versus Net Presentation of Revenue for Revenue Sharing
We evaluate our relationship between our search and display advertising partners and our customers in accordance with Financial Accounting Standards Board, or FASB, Accounting Standards Codification, or ASC, 605-45, Principal Agent Considerations. We have determined that the revenue derived from traffic supplied by our customers is reported on a gross basis because we are the primary obligor (we are responsible to our customers for fulfilling search and display advertising services and value added and other services), are involved in the service specifications, perform part of the service, have discretion in supplier selection, have latitude in establishing price and bear credit risk.
Stock-Based Compensation
We account for stock-based compensation in accordance with the authoritative guidance on stock compensation. Under the fair value recognition provisions of this guidance, stock-based compensation is measured at the grant date based on the fair value of the award and is recognized as expense, net of estimated forfeitures, over the requisite service period, which is generally the vesting period of the respective award. As a result, we are required to estimate the amount of stock-based compensation we expect to be forfeited based on our historical experience. If actual forfeitures differ significantly from our estimates, stock-based compensation expense and our results of operations could be materially impacted.
Determining the fair value of stock-based awards at the grant date requires judgment. We use the Black-Scholes option-pricing model to determine the fair value of stock options. The determination of the grant date fair value of options using an option-pricing model is affected by our estimated common stock fair value as well as assumptions regarding a number of other complex and subjective variables. These variables include the fair value of our common stock, our expected stock price volatility over the expected term of the options, stock option exercise and cancellation behaviors, risk-free interest rates, and expected dividends, which are estimated as follows:
Fair Value of Our Common Stock. Because our stock was not publicly traded prior to our initial public offering, the fair value of our common stock underlying our stock options was determined by our board of directors based on valuations prepared by an independent valuation specialist. The board of directors intended all options granted to be exercisable at a price per share not less than the per share fair value of our common stock underlying those options on
37
the date of grant. Following the completion of our initial public offering in February 2012, our common stock has been valued by reference to its publicly traded price.
Expected Term. The expected term was estimated using the simplified method allowed under SEC guidance. As we develop more experience, our estimate of the life of awards may change.
Volatility. As we do not have a significant trading history for our common stock, the expected stock price volatility for our common stock was estimated by taking the average historic price volatility for industry peers based on daily price observations over a period equivalent to the expected term of the stock option grants. Industry peers consist of several public companies in the technology industry similar in size, stage of life cycle and financial leverage. We did not rely on implied volatilities of traded options in our industry peers' common stock because the volume of activity was relatively low. We intend to continue to consistently apply this process using the same or similar public companies until a sufficient amount of historical information regarding the volatility of our own common stock share price becomes available, or unless circumstances change such that the identified companies are no longer similar to us, in which case, more suitable companies whose share prices are publicly available would be utilized in the calculation.
Risk-free Rate. The risk-free interest rate is based on the yields of U.S. Treasury securities with maturities similar to the expected term of the options for each option group.
Dividend Yield. We have never declared or paid any cash dividends and do not presently plan to pay cash dividends in the foreseeable future. Accordingly, we used an expected dividend yield of zero.
Income Taxes
We record income taxes using the asset and liability method, which requires the recognition of deferred tax assets and liabilities for the expected future tax consequences of events that have been recognized in our financial statements or tax returns. In estimating future tax consequences, generally all expected future events other than enactments or changes in the tax law or rates are considered. Valuation allowances are provided when necessary to reduce deferred tax assets to the amount expected to be realized.
We also provide reserves as necessary for uncertain tax positions taken on our tax filings. First, we determine if a tax position is more likely than not to be sustained upon audit solely based on technical merits, including resolution of related appeals or litigation processes, if any. Second, based on the largest amount of benefit, which is more likely than not to be realized on ultimate settlement we recognize any such differences as a liability. In the event that any unrecognized tax benefits are recognized, the effective tax rate will be affected. Although we believe our estimates are reasonable, no assurance can be given that the final tax outcome of these matters will be the same as these estimates. These estimates are updated quarterly based on factors such as changes in facts or circumstances, changes in tax law, new audit activity, and effectively settled issues.
We follow specific and detailed guidelines in each tax jurisdiction regarding the recoverability of any tax assets recorded on the balance sheet and provide necessary valuation allowances as required. Future realization of deferred tax assets ultimately depends on the existence of sufficient taxable income of the appropriate character (for example, ordinary income or capital gain) within the carryback or carryforward periods available under the tax law. We regularly review our deferred tax assets for recoverability based on historical taxable income, projected future taxable income, the expected timing of the reversals of existing temporary differences and tax planning strategies. Our judgments regarding future profitability may change due to many factors, including future market conditions and our ability to successfully execute our business plans and/or tax planning strategies. Should there be a change in our ability to recover our deferred tax assets, our tax provision would increase or decrease in the period in which the assessment is changed.
Results of Operations
38
The following tables set forth our results of operations for the periods presented in amount and as a percentage of revenue for those periods. The period to period comparison of financial results is not necessarily indicative of future results.
Year Ended December 31, | |||||||||||
2011 | 2012 | 2013 | |||||||||
(in thousands) | |||||||||||
Revenue | $ | 91,060 | $ | 121,981 | $ | 111,807 | |||||
Costs and operating expenses: | |||||||||||
Cost of revenue (1) | 48,661 | 66,620 | 59,622 | ||||||||
Research and development (1)(2) | 20,228 | 25,603 | 28,458 | ||||||||
Sales and marketing (2) | 8,582 | 9,120 | 8,124 | ||||||||
General and administrative (1)(2) | 6,879 | 11,011 | 11,663 | ||||||||
Depreciation | 2,667 | 3,779 | 4,650 | ||||||||
Total costs and operating expenses | 87,017 | 116,133 | 112,517 | ||||||||
Income (loss) from operations | 4,043 | 5,848 | (710 | ) | |||||||
Other (expense) income | (17 | ) | 1 | (37 | ) | ||||||
Interest expense | (109 | ) | (270 | ) | (193 | ) | |||||
Income (loss) before income taxes | 3,917 | 5,579 | (940 | ) | |||||||
(Benefit) provision for income taxes | (6,015 | ) | 1,764 | (134 | ) | ||||||
Loss in equity interest | — | — | (561 | ) | |||||||
Net income (loss) | $ | 9,932 | $ | 3,815 | $ | (1,367 | ) | ||||
Notes:
(1) | Exclusive of depreciation shown separately. |
(2) | Includes stock-based compensation as follows: |
Year Ended December 31, | |||||||||||
2011 | 2012 | 2013 | |||||||||
(in thousands) | |||||||||||
Research and development | $ | 295 | $ | 523 | $ | 1,184 | |||||
Sales and marketing | 203 | 404 | 348 | ||||||||
General and administrative | 422 | 1,072 | 1,029 | ||||||||
$ | 920 | $ | 1,999 | $ | 2,561 | ||||||
Year Ended December 31, | ||||||||
2011 | 2012 | 2013 | ||||||
Revenue | 100 | % | 100 | % | 100 | % | ||
Costs and operating expenses: | ||||||||
Cost of revenue (1) | 53 | 55 | 53 | |||||
Research and development (1) | 22 | 21 | 25 | |||||
Sales and marketing | 9 | 7 | 7 | |||||
General and administrative (1) | 8 | 9 | 10 | |||||
Depreciation | 3 | 3 | 4 | |||||
Total costs and operating expenses | 96 | 95 | 101 | |||||
Income (loss) from operations | 4 | 5 | (1 | ) | ||||
Other income (expense) | — | — | — | |||||
Interest expense | — | — | — | |||||
Income (loss) before income taxes | 4 | 5 | (1 | ) | ||||
(Benefit) provision for income taxes | (7 | ) | 1 | — | ||||
Loss in equity interest | — | — | — | |||||
Net income (loss) | 11 | % | 3 | % | (1 | )% | ||
39
Note:
(1) | Exclusive of depreciation shown separately. |
Comparison of Years Ended December 31, 2011, 2012, and 2013
Revenue
Year Ended December 31, | 2011 to 2012% Change | 2012 to 2013% Change | |||||||||||||||
2011 | 2012 | 2013 | |||||||||||||||
(in thousands) | |||||||||||||||||
Revenue: | |||||||||||||||||
Search and display advertising | $ | 72,084 | $ | 101,559 | $ | 90,447 | 41 | % | (11 | )% | |||||||
Subscriber-based | 18,976 | 20,422 | 21,360 | 8 | % | 5 | % | ||||||||||
Total revenue | $ | 91,060 | $ | 121,981 | $ | 111,807 | 34 | % | (8 | )% | |||||||
Percentage of revenue: | |||||||||||||||||
Search and display advertising | 79 | % | 83 | % | 81 | % | |||||||||||
Subscriber-based | 21 | 17 | 19 | ||||||||||||||
Total revenue | 100 | % | 100 | % | 100 | % | |||||||||||
In 2013 our revenue decreased by $10.2 million, or 8%, compared to 2012. Search revenue decreased by 10.9 million, or 16%. We believe a material portion of the decrease was due to the placement of our start experiences on the second tab of the default Windows 8 Internet browser by our consumer electronics customers. In addition, and to a lesser extent, we believe the decrease was due to lower search activity associated with the increased usage of other devices such as tablets and smartphones generally across the consumer base and due to a change in the way we monetize searches through our start experiences. Display advertising revenue decreased slightly by $0.2 million. Subscriber-based revenue increased $0.9 million, or 5% primarily due to increases in our email and TV Everywhere services to our customers.
In 2012 our revenue increased by $30.9 million, or 34%, compared to 2011. Search and display advertising revenue increased by $29.5 million, or 41% as a result of increased search queries and advertising impressions on our start experiences, driven in part by the launch and subsequent ramping of significant new customers in September 2010 and July 2011. The total number of search queries increased by 29% in 2012, and the total number of advertising impressions increased by 52% in 2012 as compared with 2011. The increase in search queries accounted for approximately 58% of the increase in search and display advertising revenue in 2012, while the increase in advertising impressions accounted for approximately 42%. Subscriber-based revenue increased $1.4 million, or 8% due to increases in TV Everywhere and e-mail revenue, partially offset by a decrease in value added services revenue. The increases in TV Everywhere and email revenue were driven by adding new customers and increased consumer usage. The decrease in value-added services revenue is a result of decreased demand of our value-added service offerings by consumers.
Cost of Revenue
Year Ended December 31, | 2011 to 2012% Change | 2012 to 2013% Change | |||||||||||||||
2011 | 2012 | 2013 | |||||||||||||||
(in thousands) | |||||||||||||||||
Cost of revenue | $ | 48,661 | $ | 66,620 | $ | 59,622 | 37 | % | (11 | )% | |||||||
Percentage of revenue | 53 | % | 55 | % | 53 | % | |||||||||||
Our cost of revenue decreased by $7.0 million, or 11%, in 2013 compared to 2012. The decrease in our cost of revenue was driven by a decrease in revenue-sharing costs due to decreased search and display advertising. Cost of revenue as a percentage of revenue decreased to 53% of revenue in 2013 from 55% of revenue in 2012 because of changes in display advertising revenue attributable to the mix of customers and related revenue-sharing arrangements.
Our cost of revenue increased by $18.0 million, or 37%, in 2012 compared to 2011. The increase in our cost of revenue was mainly driven by additional revenue-sharing costs from increased search and display advertising. Cost of revenue
40
as a percentage of revenue increased to 55% of revenue in 2012 from 53% of revenue in 2011 because of changes in search and display advertising revenue attributable to the mix of customers and related revenue-sharing arrangements.
Research and Development Expenses
Year Ended December 31, | 2011 to 2012% Change | 2012 to 2013% Change | |||||||||||||||
2011 | 2012 | 2013 | |||||||||||||||
(in thousands) | |||||||||||||||||
Research and development | $ | 20,228 | $ | 25,603 | $ | 28,458 | 27 | % | 11 | % | |||||||
Percentage of revenue | 22 | % | 21 | % | 25 | % | |||||||||||
Research and development expenses increased by $2.9 million, or 11%, in 2013 compared to 2012. The increase was primarily due to a $2.5 million increase in employee-related costs as a result of the increase in headcount to support new product initiatives and customer deployments.
Research and development expenses increased by $5.4 million, or 27%, in 2012 compared to 2011. The increase was primarily due to a $4.1 million increase in employee-related costs as a result of the increase in headcount to support new product initiatives and customer deployments. The remaining increase includes a $0.5 million increase for reporting tools and a $0.3 million increase for contractors.
Sales and Marketing Expenses
Year Ended December 31, | 2011 to 2012% Change | 2012 to 2013% Change | |||||||||||||||
2011 | 2012 | 2013 | |||||||||||||||
(in thousands) | |||||||||||||||||
Sales and marketing | $ | 8,582 | $ | 9,120 | $ | 8,124 | 6 | % | (11 | )% | |||||||
Percentage of revenue | 9 | % | 7 | % | 7 | % | |||||||||||
Sales and marketing expenses decreased by $1.0 million, or 11%, in 2013 compared to 2012. The decrease was primarily due to a $1.0 million decrease in compensation-related expenses.
Sales and marketing expenses increased by $0.5 million, or 6%, in 2012 compared to 2011. The increase was primarily due to a $0.9 million increase in employee-related costs as a result of the increase in headcount as we hired salespeople in our advertising department. The offsetting decrease of $0.4 million includes decreases for legal fees and reporting services.
General and Administrative Expenses
Year Ended December 31, | 2011 to 2012% Change | 2012 to 2013% Change | |||||||||||||||
2011 | 2012 | 2013 | |||||||||||||||
(in thousands) | |||||||||||||||||
General and administrative | $ | 6,879 | $ | 11,011 | $ | 11,663 | 60 | % | 6 | % | |||||||
Percentage of revenue | 8 | % | 9 | % | 10 | % | |||||||||||
General and administrative expenses increased by $0.7 million, or 6%, in 2013 compared to 2012. The increase was primarily due to a $0.3 million increase in legal fees in connection with the formation of the JV Company and $0.2 million increase in rent.
General and administrative expenses increased by $4.1 million, or 60%, in 2012 compared to 2011. The increase was primarily due to a $2.0 million increase in spending on administrative expenses associated with being a public company and a $0.5 million increase in employee-related costs as a result of hiring in our finance department. The remainder of the increase includes $0.6 million for stock-based compensation partially driven by the accelerated vesting of stock options upon retirement of service of our former board members upon our initial public offering and $0.4 million increase in rent and other facility-related costs.
Depreciation
41
Year Ended December 31, | 2011 to 2012% Change | 2012 to 2013% Change | |||||||||||||||
2011 | 2012 | 2013 | |||||||||||||||
(in thousands) | |||||||||||||||||
Depreciation | $ | 2,667 | $ | 3,779 | $ | 4,650 | 42 | % | 23 | % | |||||||
Percentage of revenue | 3 | % | 3 | % | 4 | % | |||||||||||
Depreciation increased by $0.9 million or 23% in 2013 compared to 2012. This increase was primarily driven by the purchase of assets such as computer equipment to support our investment in new projects.
Depreciation increased by $1.1 million, or 42%, in 2012 compared to 2011. This increase was primarily driven by the purchase of assets to support the addition of new customers.
Other (Expense) Income
Year Ended December 31, | |||||||||||
2011 | 2012 | 2013 | |||||||||
(in thousands) | |||||||||||
Other (expense) income | $ | (17 | ) | $ | 1 | $ | (37 | ) | |||
For each of 2011, 2012 and 2013, other (expense) income consisted primarily of interest income coupled with foreign currency transaction losses related to our operations in the United Kingdom.
Interest Expense
Year Ended December 31, | |||||||||||
2011 | 2012 | 2013 | |||||||||
(in thousands) | |||||||||||
Interest expense | $ | 109 | $ | 270 | $ | 193 | |||||
Interest expense decreased in 2013 compared to 2012 as a result of lower average capital lease balances. The interest rates applied to those balances remained substantially the same.
Interest expense increased in 2012 compared to 2011 as a result of higher average capital lease balances. The interest rates applied to those balances remained substantially the same.
(Benefit) provision for Income Taxes
Year Ended December 31, | |||||||||||
2011 | 2012 | 2013 | |||||||||
(in thousands) | |||||||||||
(Benefit) provision for income taxes | $ | (6,015 | ) | $ | 1,764 | $ | (134 | ) | |||
In the fourth quarter of 2011, as a result of weighing the positive and negative evidence we determined that we would more likely than not be able to generate sufficient taxable income in the future and would be able to utilize our net operating loss ("NOL") carryforwards. As a result, we recognized an $8.5 million income tax benefit related to the reduction of our deferred tax asset valuation allowance.
In 2012 our income tax provision included $2.9 million of deferred income tax expense, partially offset by a tax benefit of $1.1 million relating to a research and development credit.
In 2013 our income tax provision included a $0.2 million deferred benefit for income taxes which resulted in a $0.1 million tax benefit for income taxes.
42
Loss in Equity Interest
Year Ended December 31, | |||||||||||
2011 | 2012 | 2013 | |||||||||
(in thousands) | |||||||||||
Loss in equity interest | $ | — | $ | — | $ | (561 | ) | ||||
In 2013 we entered into a Joint Venture Agreement, pursuant to which we own 50% of the outstanding common stock and 100% of the preferred shares of the JV Company. For year ended December 31, 2013, we recorded our share of the losses of the JV Company of $0.6 million. The investment in the JV Company is being accounted for using the equity method and is classified as an investment in equity interest. The Company provided nearly all of the capital to form the JV Company; accordingly, the Company has recorded 100% of the losses incurred by the JV Company in 2013.
Unaudited Quarterly Results of Operations and Other Data
The following tables present our unaudited quarterly results of operations and other data for the eight quarters ended December 31, 2013. This unaudited quarterly information has been prepared on the same basis as our audited consolidated financial statements and, in the opinion of management, the statement of operations data includes all adjustments, consisting of normal recurring adjustments, necessary for the fair presentation of the results of operations for these periods. You should read this table in conjunction with our financial statements and related notes located elsewhere in this Annual Report on Form 10-K. The results of operations for any quarter are not necessarily indicative of the results of operations for any future periods.
For the Three Months Ended | |||||||||||||||||||||||||||||||
March 31, 2012 | June 30, 2012 | September 30, 2012 | December 31, 2012 | March 31, 2013 | June 30, 2013 | September 30, 2013 | December 31, 2013 | ||||||||||||||||||||||||
(in thousands, except per-share data) | |||||||||||||||||||||||||||||||
Statements of Operations Data: | |||||||||||||||||||||||||||||||
Revenue | $ | 30,670 | $ | 30,807 | $ | 28,326 | $ | 32,178 | $ | 29,143 | $ | 26,708 | $ | 26,551 | $ | 29,406 | |||||||||||||||
Costs and operating expenses: | |||||||||||||||||||||||||||||||
Cost of revenue (1) | 16,764 | 16,876 | 15,792 | 17,188 | 15,764 | 14,017 | 14,083 | 15,757 | |||||||||||||||||||||||
Research and development (1) | 6,288 | 6,123 | 6,218 | 6,974 | 6,865 | 7,336 | 7,404 | 6,911 | |||||||||||||||||||||||
Sales and marketing | 2,377 | 2,399 | 2,000 | 2,344 | 2,130 | 2,147 | 2,058 | 1,792 | |||||||||||||||||||||||
General and administrative (1) | 2,840 | 2,868 | 2,676 | 2,627 | 3,144 | 2,957 | 2,805 | 2,891 | |||||||||||||||||||||||
Depreciation | 781 | 934 | 981 | 1,083 | 1,130 | 1,138 | 1,119 | 1,262 | |||||||||||||||||||||||
Total costs and operating expenses | 29,050 | 29,200 | 27,667 | 30,216 | 29,033 | 27,595 | 27,469 | 28,613 | |||||||||||||||||||||||
Income (loss) from operations | 1,620 | 1,607 | 659 | 1,962 | 110 | (887 | ) | (918 | ) | 793 | |||||||||||||||||||||
Net income (loss) | 1,174 | 1,199 | 652 | 790 | 27 | (637 | ) | (832 | ) | 173 | |||||||||||||||||||||
Net income (loss) per share attributable to common stockholders: | |||||||||||||||||||||||||||||||
Basic | $ | 0.07 | $ | 0.04 | $ | 0.02 | $ | 0.03 | $0.00 | $ | 0.02 | $ | 0.03 | $ | 0.01 | ||||||||||||||||
Diluted | $ | 0.04 | $ | 0.04 | $ | 0.02 | $ | 0.03 | $0.00 | $ | 0.02 | $ | 0.03 | $ | 0.01 | ||||||||||||||||
Note:
(1) | Exclusive of depreciation shown separately |
Liquidity and Capital Resources
Our primary liquidity and capital resource requirements are for financing working capital, investing in capital expenditures such as computer hardware and software, supporting research and development efforts, introducing new technology, enhancing existing technology, and marketing our services and products to new and existing customers. To the extent that existing cash and cash equivalents, cash from operations, cash from short-term borrowings and the net proceeds from our initial public offering are insufficient to fund our future activities, we may need to raise additional funds through public or private equity offerings or debt financings.
43
In connection with our initial public offering in February 2012, we received aggregate gross proceeds of $27.3 million. The net proceeds to Synacor from the offering were approximately $22.4 million after deducting underwriting discounts of $1.9 million and offering costs of $3.0 million.
In September 2013, we entered into a new Loan and Security Agreement, or Loan Agreement, with Silicon Valley Bank, or Lender. The Loan Agreement provides for a $10.0 million secured revolving line of credit with a stated maturity of September 27, 2015. The credit facility is available for cash borrowings, subject to a formula based upon eligible accounts receivable. As of December 31, 2013, due to the operation of the borrowing formula, $7.5 million was available under the revolving credit line, with no outstanding borrowings.
Borrowings under the Loan Agreement bear interest, at our election, at an annual rate of either 0.50% above the “prime rate” as published in The Wall Street Journal or LIBOR for the relevant period plus 3.00%. For LIBOR advances, interest is payable (i) on the last day of a LIBOR interest period or (ii) on the last day of each calendar quarter. For prime rate advances, interest is payable (a) on the first day of each month and (b) on each date a prime rate advance is converted into a LIBOR advance.
We paid a commitment fee of $50,000 upon the closing of the facility, and must pay quarterly, in arrears, an unused facility fee of 0.50% per annum of the average unused portion of the facility (as determined by the Lender). Additionally, if we terminate the facility prior to the first anniversary of the closing date, we must pay the Lender a termination fee of $100,000 unless the facility is replaced with a new facility from the Lender.
Our obligations to the Lender are secured by a first priority security interest in all our assets, including our intellectual property. The Loan Agreement contains customary events of default, including non-payment of principal or interest, violations of covenants, material adverse changes, cross-default, bankruptcy and material judgments. Upon the occurrence of an event of default, the Lender may accelerate repayment of any outstanding balance. The Loan Agreement also contains certain financial covenants and other agreements that are customary in loan agreements of this type, including restrictions on paying dividends and making distributions to our stockholders. As of December 31, 2013, we were in compliance with the covenants and anticipate continuing to be so.
Under the terms of the joint venture agreement with the JV Company, we have agreed, upon the satisfaction of certain conditions, to provide up to an additional $1.1 million in additional funding to the JV Company over two years through the purchase of non-voting, non-convertible Series A preferred shares of the JV Company.
As of December 31, 2013, we had approximately $36.4 million of cash and cash equivalents and money market funds. We did not have any short-term or long-term investments. We believe that our existing cash and cash equivalents, along with cash flows from operations and availability under our revolving credit line, will be sufficient to meet our anticipated working capital, capital lease payment obligations, JV Company funding obligations, and capital expenditure requirements for at least the next 12 months.
Cash Flows
Year Ended December 31, | |||||||||||
2011 | 2012 | 2013 | |||||||||
(in thousands) | |||||||||||
Statements of Cash Flows Data: | |||||||||||
Cash flows provided by operating activities | $ | 8,678 | $ | 14,657 | $ | 5,228 | |||||
Cash flows used in investing activities | (1,848 | ) | (4,869 | ) | (8,857 | ) | |||||
Cash flows (used in) provided by financing activities | (1,317 | ) | 21,237 | (1,926 | ) | ||||||
Cash Provided by Operating Activities
Operating activities provided $5.2 million of cash in 2013. The positive cash flow from operating activities primarily resulted from our net loss, adjusted for non-cash items, and changes in our operating assets and liabilities. We had a net loss of $1.4 million, which included a non-cash benefit from deferred income taxes of $0.2 million, non-cash depreciation of $4.7 million, non-cash stock-based compensation of $2.6 million, and $0.6 million loss in equity interest. Changes in our operating assets and liabilities used $1.0 million of cash, primarily due to a decrease in our accounts receivable of $1.1 million and a decrease in our accrued expenses and other current liabilities of $2.2 million. The decrease in our accounts receivable was
44
primarily attributable to the decrease in revenue. The decrease in our accrued expenses and other liabilities of $2.2 million was primarily driven by a $1.7 million decrease in our bonus accrual.
Operating activities provided $14.7 million of cash in 2012. The cash flow from operating activities primarily resulted from our net income, adjusted for non-cash items, and changes in our operating assets and liabilities. We had net income of $3.8 million, which included a non-cash benefit from deferred income taxes of $1.6 million, non-cash depreciation of $3.8 million and non-cash stock-based compensation of $2.0 million. Changes in our operating assets and liabilities provided $3.5 million of cash, primarily due to an increase in our accounts payable of $2.3 million and an increase in our accrued expenses and other current liabilities of $1.7 million, partially offset by increases in our accounts receivable of $1.3 million. The increase in our accounts payable was attributable to a $1.4 million increase due to the timing of, and a change in payment terms with, a customer for their revenue share payment. The remaining increase of $0.9 million was primarily driven by increased spending due to the growth of our revenue-share payments associated with our revenue growth. The increase in our accrued expenses and other liabilities of $1.7 million was primarily driven by a $1.0 million increase for operating related expenses and components of our cost of revenue and a $0.5 million increase in our bonus accrual. The increase in our accounts receivable was primarily due to our revenue growth in 2012.
Operating activities provided $8.7 million of cash in 2011. The cash flow from operating activities primarily resulted from our net income, adjusted for non-cash items, and changes in our operating assets and liabilities. We had net income in 2011 of $9.9 million, which included a non-cash benefit from deferred income taxes of $6.1 million, non-cash depreciation of $2.7 million and non-cash stock-based compensation of $0.9 million. Changes in our operating assets and liabilities provided $1.2 million of cash in 2011, primarily due to an increase of $4.1 million in our accounts payable and an increase of $1.7 million of other accrued expenses partially offset by increases in our accounts receivable of $4.7 million. The increase in accounts payable was the result of increased spending due to the growth of our revenue-share payments associated with our revenue growth and the timing of payments to customers for revenue-sharing agreements and to content providers. The increase in other accrued expenses was mainly due to an increase in our bonus accrual. The increase in our accounts receivable was primarily due to our revenue growth in 2011.
Cash Used in Investing Activities
Our primary investing activities have consisted of purchases of property and equipment, payments for the acquisitions of Carbyn and Teknision and for investments made in the JV Company. Purchases of property and equipment may vary from period to period due to the timing of the expansion of our operations and internal-use software development. We expect to continue to invest in property and equipment and development of software for the remainder of 2014 and thereafter.
Cash used in investing activities in 2013 was $8.9 million consisting of $5.9 million of purchases of property, equipment and software (specifically related to the build out of our data centers and internal-use software development and including $0.5 million used for payment for the acquisition of Carbyn), $0.9 million contributed to an equity method investment, $1.0 million paid for the acquisition of Teknision, Inc. (an Ontario-based company), and a $1.0 million purchase of a promissory note having to do with our investment in B&FF.
Included within purchases of property, equipment, and software are external and internal costs of $3.0 million incurred during the application development stage. We expect much of the development effort to transition into the operation stage during 2014.
Cash used in investing activities in 2012 was $4.9 million consisting of $4.3 million of purchases of property, equipment and software to build out our data centers and $0.6 million paid for the acquisition of Carbyn.
Cash used in investing activities in 2011 was $1.8 million consisting principally of purchases of property, equipment and software to build out our data centers.
Cash (Used in) Provided by Financing Activities
For the year ended December 31, 2013, net cash used by financing activities was $2.0 million, consisting of $2.1 million of repayments for our capital lease obligations, offset by $0.2 million of proceeds from the exercise of common stock options.
For the year ended December 31, 2012, net cash provided by financing activities was $21.2 million, consisting of $25.4 million of proceeds from issuance of common stock in our public offering, partially offset by cash paid for issuance costs of $2.8 million, and $1.2 million of proceeds from the exercise of common stock options, partially offset by $2.6 million for repayments on our capital lease obligations and bank financing.
45
For the year ended December 31, 2011, net cash used in financing activities was approximately $1.3 million primarily for repayments of $2.2 million on our capital lease obligations and bank financing partially offset by $0.8 million of proceeds from a sale/leaseback transaction relating to computer equipment.
Off-Balance Sheet Arrangements
At December 31, 2013, we did not have any off-balance sheet arrangements, as defined in Item 303(a)(4)(ii) of Regulation S-K promulgated by the SEC, that have or are reasonably likely to have a current or future effect on our financial condition, changes in our financial condition, revenues, or expenses, results of operations, liquidity, capital expenditures, or capital resources that is material to investors.
Contractual Obligations
We lease office space and data center space under operating lease agreements and certain equipment under capital lease agreements. We are also obligated to make payments under various contracts with vendors and customers, principally for revenue-sharing and content arrangements.
The following table sets forth our future contractual obligations as of December 31, 2013:
Payments due by period | |||||||||||||||||||||||
Total | 2014 | 2015 | 2016 | 2017 | 2018 and thereafter | ||||||||||||||||||
Capital lease obligations | $ | 2,959 | $ | 2,038 | $ | 531 | $ | 390 | $ | — | $ | — | |||||||||||
Operating lease obligations | 3,323 | 1,478 | 988 | 348 | 191 | 318 | |||||||||||||||||
Contract commitments | 7,680 | 4,610 | 1,630 | 1,080 | 360 | — | |||||||||||||||||
Total | $ | 13,962 | $ | 8,126 | $ | 3,149 | $ | 1,818 | $ | 551 | $ | 318 | |||||||||||
The contract commitments shown in the foregoing table represent fixed payment obligations to some of our customers and content providers. Agreements with certain customers and certain content providers require us to make fixed payments to them.
ITEM 7A. | QUANTITATIVE AND QUALITATIVE DISCLOSURES ABOUT MARKET RISK |
We have operations both within the United States and internationally, and we are exposed to market risks in the ordinary course of our business. These primarily include interest rate and inflation risk.
Interest Rate Risk
Our cash and cash equivalents primarily consist of cash and money market funds. Other than our $1.0 million investment in B&FF and the $0.4 million investment in equity interest in the JV Company, we currently have no investments of any type. Our exposure to market risk for changes in interest rates is limited because nearly all of our cash and cash equivalents have a short-term maturity and are used primarily for working capital purposes.
Inflation Risk
We do not believe that inflation has had a material effect on our business, financial condition or results of operations. If our costs were to become subject to significant inflationary pressures, we may not be able to fully offset such higher costs through price increases. Our inability or failure to do so could harm our business, financial condition and results of operations.
ITEM 8. | FINANCIAL STATEMENTS AND SUPPLEMENTARY DATA |
Our financial statements are submitted on pages F-1 through F-22 of this Annual Report on Form 10-K.
ITEM 9. | CHANGES IN AND DISAGREEMENTS WITH ACCOUNTANTS ON ACCOUNTING AND FINANCIAL DISCLOSURE |
46
None.
ITEM 9A. | CONTROLS AND PROCEDURES |
Evaluation of Disclosure and Control Procedures
Our management, with the participation of our Chief Executive Officer and Chief Financial Officer, evaluated the effectiveness of our disclosure controls and procedures as of December 31, 2013. The term “disclosure controls and procedures,” as defined in Rules 13a-15(e) and 15d-15(e) under the Securities Exchange Act of 1934, as amended, or the Exchange Act, means controls and other procedures of a company that are designed to ensure that information required to be disclosed by a company in the reports that it files or submits under the Exchange Act is recorded, processed, summarized and reported within the time periods specified in the SEC’s rules and forms. Disclosure controls and procedures include, without limitation, controls and procedures designed to ensure that information required to be disclosed by a company in the reports that it files or submits under the Exchange Act is accumulated and communicated to the company’s management, including its principal executive and principal financial officers, as appropriate to allow timely decisions regarding required disclosure. Based upon the evaluation as of December 31, 2013, our Chief Executive Officer and Chief Financial Officer have concluded that, as of such date, our disclosure controls and procedures were effective at the reasonable assurance level. Management recognizes that any controls and procedures, no matter how well designed and operated, can provide only reasonable assurance of achieving their objectives and management necessarily applies its judgment in evaluating the cost-benefit relationship of possible controls and procedures.
Management’s Annual Report on Internal Control Over Financial Reporting
Our management is responsible for establishing and maintaining adequate internal control over financial reporting, as such term is defined in Rule 13a-15(f) of the Exchange Act. Under the supervision and with the participation of our Chief Executive Officer and Chief Financial Officer, our management conducted an evaluation of the effectiveness of our internal control over financial reporting based upon the framework in “Internal Control - Integrated Framework” issued by the Committee of Sponsoring Organizations of the Treadway Commission. Based on that evaluation, management concluded that our internal control over financial reporting was effective as of December 31, 2013. This Annual Report on Form 10-K does not include an attestation report of the Company's registered public accounting firm due to a transition period established by the Jumpstart Our Business Startups Act, or JOBS Act, for emerging growth companies.
Changes in Internal Control over Financial Reporting
There were no changes in our internal control over financial reporting identified in management’s evaluation pursuant to Rules 13a-15(d) or 15d-15(d) of the Exchange Act during the quarter ended December 31, 2013 that materially affected, or are reasonably likely to materially affect, our internal control over financial reporting.
ITEM 9B. | OTHER INFORMATION |
None.
47
PART III
ITEM 10. | DIRECTORS, EXECUTIVE OFFICERS AND CORPORATE GOVERNANCE |
The information required by this item is incorporated by reference to the information in our proxy statement for our 2014 Annual Meeting of Stockholders to be filed with the SEC within 120 days after the end of our fiscal year ended December 31, 2013.
Our board of directors has adopted a Code of Business Conduct and a Code of Ethics applicable to all officers, directors and employees, which is available on our website (http://www.synacor.com) under “Investors—Corporate Governance.” We will provide a copy of these documents to any person, without charge, upon request, by writing to us at Synacor, Inc., Investor Relations Department, 40 La Riviere Dr., Suite 300, Buffalo, New York 14202. We intend to satisfy the disclosure requirement under Item 5.05 of Form 8-K regarding an amendment to, or waiver from, a provision of our Code of Business Conduct or Code of Ethics by posting such information on our website at the address and the location specified above.
ITEM 11. | EXECUTIVE COMPENSATION |
The information required by this item is incorporated by reference to the information in our proxy statement for our 2014 Annual Meeting of Stockholders to be filed with the SEC within 120 days after the end of our fiscal year ended December 31, 2013.
ITEM 12. | SECURITY OWNERSHIP OF CERTAIN BENEFICIAL OWNERS AND MANAGEMENT AND RELATED STOCKHOLDER MATTERS |
The information required by this item is incorporated by reference to the information in our proxy statement for our 2014 Annual Meeting of Stockholders to be filed with the SEC within 120 days after the end of our fiscal year ended December 31, 2013.
ITEM 13. | CERTAIN RELATIONSHIPS AND RELATED TRANSACTIONS, AND DIRECTOR INDEPENDENCE |
The information required by this item is incorporated by reference to the information in our proxy statement for our 2014 Annual Meeting of Stockholders to be filed with the SEC within 120 days after the end of our fiscal year ended December 31, 2013.
ITEM 14. | PRINCIPAL ACCOUNTING FEES AND SERVICES |
The information required by this item is incorporated by reference to the information in our proxy statement for our 2014 Annual Meeting of Stockholders to be filed with the SEC within 120 days after the end of our fiscal year ended December 31, 2013.
48
PART IV
ITEM 15. | EXHIBITS, FINANCIAL STATEMENT SCHEDULES |
(a) | Financial Statements: See Financial Statements and Supplementary Data, Part II, Item 8. |
(b) | Financial Statement Schedules: Financial Statement Schedules have been omitted either because they are not required or because the information required is included in the notes to the financial statements. |
(c) | Exhibits: See the Exhibit Index immediately following the signature page of this Annual Report on Form 10-K. |
49
SIGNATURES
Pursuant to the requirements of Section 13 or 15(d) of the Securities Exchange Act of 1934, the registrant has duly caused this Amendment to be signed on its behalf by the undersigned, thereunto duly authorized.
SYNACOR, INC. | ||
Date: March 31, 2014 | /s/ Ronald N. Frankel | |
Ronald N. Frankel | ||
President and Chief Executive Officer | ||
(Principal Executive Officer) | ||
Pursuant to the requirements of the Securities Exchange Act of 1934, this Amendment has been signed by the following persons on behalf of the registrant and in the capacities and on the dates indicated:
Signature | Title | Date | |
/S/ RONALD N. FRANKEL | President, Chief Executive Officer and Director (Principal Executive Officer) | March 31, 2014 | |
Ronald N. Frankel | |||
/S/ WILLIAM J. STUART | Chief Financial Officer (Principal Financial and Accounting Officer) | March 31, 2014 | |
William J. Stuart | |||
* | Director | March 31, 2014 | |
Marwan Fawaz | |||
* | Director | March 31, 2014 | |
Gary L. Ginsberg | |||
* | Director | March 31, 2014 | |
Andrew Kau | |||
* | Director | March 31, 2014 | |
Jordan Levy | |||
* | Director | March 31, 2014 | |
Michael J. Montgomery | |||
*By | /s/ Ronald N. Frankel |
Ronald N. Frankel | |
Attorney-in-Fact | |
50
EXHIBITS
The following exhibits are incorporated by reference herein or filed here within:
Exhibit No. | Description | Incorporated by Reference | Filed Herewith | |||||||||
Form | File No. | Date of Filing | Exhibit Number | |||||||||
3.1 | Fifth Amended and Restated Certificate of Incorporation | S-1/A | 333-178049 | 1/30/2012 | 3.2 | |||||||
3.2 | Amended and Restated Bylaws | S-1/A | 333-178049 | 1/30/2012 | 3.4 | |||||||
10.1 | Form of Indemnification Agreement between the Registrant and each of its directors and executive officers and certain key employees | S-1 | 333-178049 | 11/18/2011 | 10.1 | |||||||
10.2.1* | 2000 Stock Plan | S-1 | 333-178049 | 11/18/2011 | 10.2.1 | |||||||
10.2.2* | Amendment to 2000 Stock Plan, adopted September 30, 2004 | S-1 | 333-178049 | 11/18/2011 | 10.2.2 | |||||||
10.2.3* | Amendment to 2000 Stock Plan, adopted June 9, 2006 | S-1 | 333-178049 | 11/18/2011 | 10.2.3 | |||||||
10.2.4* | Amendment to 2000 Stock Plan, adopted October 19, 2006 | S-1 | 333-178049 | 11/18/2011 | 10.2.4 | |||||||
10.2.5* | Amendment to 2000 Stock Plan, adopted July 31, 2008 | S-1 | 333-178049 | 11/18/2011 | 10.2.5 | |||||||
10.2.6* | Form of Stock Option Agreement under 2000 Stock Plan | S-1/A | 333-178049 | 1/30/2012 | 10.2.6 | |||||||
10.2.7* | Stock Option Agreement under 2000 Stock Plan with Ronald N. Frankel | S-1/A | 333-178049 | 1/30/2012 | 10.2.7 | |||||||
10.3.1* | 2006 Stock Plan | S-1 | 333-178049 | 11/18/2011 | 10.3.1 | |||||||
10.3.2* | Amendment No. 1 to 2006 Stock Plan | S-1 | 333-178049 | 11/18/2011 | 10.3.2 | |||||||
10.3.3* | Amendment No. 2 to 2006 Stock Plan | S-1 | 333-178049 | 11/18/2011 | 10.3.3 | |||||||
10.3.4* | Amendment No. 3 to 2006 Stock Plan | S-1 | 333-178049 | 11/18/2011 | 10.3.4 | |||||||
10.3.5* | Amendment No. 4 to 2006 Stock Plan | S-1 | 333-178049 | 11/18/2011 | 10.3.5 | |||||||
10.3.6* | Amendment No. 5 to 2006 Stock Plan | S-1 | 333-178049 | 11/18/2011 | 10.3.6 | |||||||
10.3.7* | Amendment No. 6 to 2006 Stock Plan | S-1 | 333-178049 | 11/18/2011 | 10.3.7 | |||||||
10.3.8* | Amendment No. 7 to 2006 Stock Plan | S-1/A | 333-178049 | 1/18/2012 | 10.3.8 | |||||||
10.3.9* | Form of Stock Option Agreement under 2006 Stock Plan with Jordan Levy | S-1/A | 333-178049 | 1/30/2012 | 10.3.9 | |||||||
Exhibit No. | Description | Incorporated by Reference | Filed Herewith | |||||||||
Form | File No. | Date of Filing | Exhibit Number | |||||||||
10.3.10* | Stock Option Agreement under 2006 Stock Plan with Ronald N. Frankel | S-1/A | 333-178049 | 1/30/2012 | 10.3.10 | |||||||
10.3.11* | Form of Stock Option Agreement with Ronald N. Frankel under 2006 Stock Plan | S-1/A | 333-178049 | 1/30/2012 | 10.3.11 | |||||||
10.3.12* | Form of Stock Option Agreement with George G. Chamoun under 2006 Stock Plan | S-1/A | 333-178049 | 1/30/2012 | 10.3.12 | |||||||
10.3.13* | Form of Stock Option Agreement with Scott A. Bailey under 2006 Stock Plan | S-1/A | 333-178049 | 1/30/2012 | 10.3.13 | |||||||
10.3.14* | Form of Director Stock Option Agreement under 2006 Stock Plan | S-1/A | 333-178049 | 1/30/2012 | 10.3.14 | |||||||
10.3.15* | Form of Director Stock Option Agreement under 2006 Stock Plan | S-1/A | 333-178049 | 1/30/2012 | 10.3.15 | |||||||
10.4.1* | 2012 Equity Incentive Plan | S-1/A | 333-178049 | 1/18/2012 | 10.4 | |||||||
51
10.4.2* | Form of Stock Option Agreement under 2012 Equity Incentive Plan | S-1/A | 333-178049 | 1/30/2012 | 10.4.2 | |||||||
10.4.3* | Form of Stock Unit Agreement under 2012 Equity Incentive Plan | S-1/A | 333-178049 | 1/30/2012 | 10.4.3 | |||||||
10.4.4* | Form of Stock Option Agreement with Ronald N. Frankel under 2012 Equity Incentive Plan | 10-K | 001-33843 | 3/26/2013 | 10.4.4 | |||||||
10.4.5* | Form of Early Exercise Stock Option Agreement under 2012 Equity Incentive Plan | 10-K | 001-33843 | 3/26/2013 | 10.4.5 | |||||||
10.4.6* | Form of Option Agreement with Scott A. Bailey and George G. Chamoun under 2012 Equity Incentive Plan | 10-K | 001-33843 | 3/26/2013 | 10.4.6 | |||||||
10.4.7* | Form of Option Agreement with William J. Stuart under 2012 Equity Incentive Plan | 10-K | 001-33843 | 3/26/2013 | 10.4.7 | |||||||
10.5.1* | Letter Agreement dated July 31, 2007 with Ronald N. Frankel | S-1 | 333-178049 | 11/18/2011 | 10.5.1 | |||||||
10.5.2* | Severance Agreement with Ronald N. Frankel | S-1/A | 333-178049 | 12/23/2011 | 10.5.2 | |||||||
10.5.3* | Letter Agreement dated September 10, 2013 with Ronald N. Frankel | X^ | ||||||||||
10.5.4* | Amendment to Severance Agreement dated September 10, 2013 with Ronald N. Frankel | X^ | ||||||||||
10.6.1* | Letter Agreement dated October 15, 2010 with Scott A. Bailey | S-1 | 333-178049 | 11/18/2011 | 10.6 | |||||||
10.6.2* | Letter agreement between Scott A. Bailey and Synacor, Inc. dated as of June 25, 2013 | 10-Q | 001-33843 | 8/13/2013 | 10.6 | |||||||
10.6.3* | Severance Agreement with Scott A. Bailey | X^ | ||||||||||
10.6.4* | Letter Agreement dated July 24, 2013 with Scott A. Bailey | X^ | ||||||||||
10.7.1* | Employment and Noncompetition Agreement dated December 22, 2000 between George G. Chamoun and CKMP, Inc. | S-1 | 333-178049 | 11/18/2011 | 10.7.1 | |||||||
10.7.2* | Severance Agreement with George G. Chamoun | S-1/A | 333-178049 | 12/23/2011 | 10.7.2 | |||||||
10.7.3* | Letter Agreement dated March 26, 2014 with George G. Chamoun | X^ | ||||||||||
10.7.4* | Amendment to Severance Agreement dated March 26, 2014 with George G. Chamoun | X^ | ||||||||||
10.8.1* | Letter Agreement dated August 3, 2011 with William J. Stuart | S-1 | 333-178049 | 11/18/2011 | 10.8 | |||||||
10.8.2* | Severance Agreement with William J. Stuart | X^ | ||||||||||
10.8.3* | Letter Agreement dated August 26, 2013 with William J. Stuart | X^ | ||||||||||
10.9.1† | Amended and Restated Master Services Agreement between Charter Communications Operating, LLC and Synacor, Inc. dated as of April 1, 2010 | S-1/A | 333-178049 | 2/1/2012 | 10.9.1 | |||||||
10.9.2† | Amendment #1 to Amended and Restated Master Services Agreement between Charter Communications Operating, LLC and Synacor, Inc. dated as of October 1, 2010 | S-1/A | 333-178049 | 1/13/2012 | 10.9.2 | |||||||
10.9.3† | Amendment #2 to Amended and Restated Master Services Agreement between Charter Communications Operating, LLC and Synacor, Inc. dated as of May 25, 2011 | S-1/A | 333-178049 | 1/13/2012 | 10.9.3 | |||||||
Exhibit No. | Description | Incorporated by Reference | Filed Herewith | |||||||||
52
Form | File No. | Date of Filing | Exhibit Number | |||||||||
10.9.4† | Amendment #3 to Amended and Restated Master Services Agreement between Charter Communications Operating, LLC and Synacor, Inc. dated as of December 9, 2011 | S-1/A | 333-178049 | 1/13/2012 | 10.9.4 | |||||||
10.9.5 | Letter agreement between Charter Communications Operating, LLC and Synacor, Inc. dated as of March 28, 2013 | 10-Q | 001-33843 | 5/14/2013 | 10.1 | |||||||
10.9.6† | Amendment #4 to Amended and Restated Master Services Agreement between Charter Communications Operating, LLC and Synacor, Inc. dated April 1, 2013 | 10-Q | 001-33843 | 8/13/2013 | 10.2 | |||||||
10.10.1† | Amended and Restated Master Services Agreement between Qwest Corporation and Synacor, Inc. dated as of January 1, 2012 | 10-Q | 001-33843 | 11/14/2012 | 10.1.1 | |||||||
10.10.2† | Amendment #1 to Amended and Restated Master Services Agreement between Qwest Corporation and Synacor, Inc. dated as of July 1, 2012 | 10-Q | 001-33843 | 11/14/2012 | 10.1.2 | |||||||
10.10.3† | Amendment #2 to Master Services Agreement between Qwest Corporation and Synacor, Inc. dated as of August 23, 2012 | 10-Q | 001-33843 | 11/14/2012 | 10.1.3 | |||||||
10.11* | 2007 Management Cash Incentive Plan | 10-Q | 001-33843 | 5/15/2012 | 10.1 | |||||||
10.12.1† | Master Services and Linking Agreement between Toshiba America Information Systems, Inc. and Synacor, Inc. dated as of July 1, 2010 | S-1/A | 333-178049 | 2/1/2012 | 10.12 | |||||||
10.12.2† | Amendment #1 to Master Services and Linking Agreement between Toshiba America Information Systems, Inc. and Synacor, Inc. dated December 1, 2011 | 10-Q | 001-33843 | 11/14/2013 | 10.2.1 | |||||||
10.12.3† | Amendment #2 to Master Services and Linking Agreement between Toshiba America Information Systems, Inc. and Synacor, Inc. dated September 4, 2013 | 10-Q | 001-33843 | 11/14/2013 | 10.2.2 | |||||||
10.12.4† | Amendment #3 to Master Services and Liking Agreement between Toshiba America Information Systems, Inc and Synacor, Inc. dated September 4, 2013 | 10-Q | 001-33843 | 11/14/2013 | 10.2.3 | |||||||
10.12.5 | Amendment #4 to Master Services and Linking Agreement between Toshiba America Information Systems, Inc. and Synacor, Inc. dated September 4, 2013 | 10-Q | 001-33843 | 11/14/2013 | 10.2.4 | |||||||
10.12.6† | Statement of Work #1 governed by Master Services and Linking Agreement between Toshiba America Information Systems, Inc. and Synacor, Inc. dated September 24, 2013 | 10-Q | 001-33843 | 11/14/2013 | 10.2.5 | |||||||
10.13.1† | Google Services Agreement between Google Inc. and Synacor, Inc. dated as of March 1, 2011 | S-1/A | 333-178049 | 2/1/2012 | 10.13.1 | |||||||
10.13.2† | Amendment Number One to Google Services Agreement between Google Inc. and Synacor, Inc. dated as of July 1, 2011 | S-1/A | 333-178049 | 12/29/2011 | 10.13.2 | |||||||
10.13.3† | Amendment Number Two to Google Services Agreement between Google Inc. and Synacor, Inc. dated as of May 1, 2012 | 10-Q | 001-33843 | 8/13/2013 | 10.1.1 | |||||||
53
10.13.4† | Amendment Number Three to Google Services Agreement between Google Inc. and Synacor, Inc. dated May 1, 2013 | 10-Q | 001-33843 | 8/13/2013 | 10.1.2 | |||||||
10.14.1 | Sublease dated March 3, 2006 between Ludlow Technical Products Corporation and Synacor, Inc. | S-1 | 333-178049 | 11/18/2011 | 10.14.1 | |||||||
10.14.2 | First Amendment to Sublease dated as of September 25, 2006 | S-1 | 333-178049 | 11/18/2011 | 10.14.2 | |||||||
10.14.3 | Second Amendment to Sublease dated as of February 27, 2007 | S-1 | 333-178049 | 11/18/2011 | 10.14.3 | |||||||
10.15.1* | Letter Agreement dated March 1, 2008 with Jordan Levy | S-1/A | 333-178049 | 1/30/2012 | 10.15.1 | |||||||
10.15.2* | Letter Agreement dated June 23, 2009 with Jordan Levy | S-1/A | 333-178049 | 1/30/2012 | 10.15.2 | |||||||
10.15.3* | Letter Agreement dated March 1, 2008 with Ronald N. Frankel | S-1/A | 333-178049 | 1/30/2012 | 10.15.3 | |||||||
10.15.4* | Letter Agreement dated June 23, 2009 with Ronald N. Frankel | S-1/A | 333-178049 | 1/30/2012 | 10.15.4 | |||||||
10.15.5* | Letter Agreement dated March 1, 2008 with George G. Chamoun | S-1/A | 333-178049 | 1/30/2012 | 10.15.5 | |||||||
Exhibit No. | Description | Incorporated by Reference | Filed Herewith | |||||||||
Form | File No. | Date of Filing | Exhibit Number | |||||||||
10.15.6* | Letter Agreement dated June 23, 2009 with George G. Chamoun | S-1/A | 333-178049 | 1/30/2012 | 10.15.6 | |||||||
10.16* | Form of Common Stock Repurchase Agreement | S-1/A | 333-178049 | 1/30/2012 | 10.16 | |||||||
10.17.1† | Master Services Agreement between Verizon Corporate Services Group Inc. and Synacor, Inc. dated as of July 25, 2011 | 10-K | 001-33843 | 3/26/2013 | 10.17.1 | |||||||
10.17.2† | Amendment #1 to Master Services Agreement between Verizon Corporate Services Group Inc. and Synacor, Inc. dated as of December 20, 2012 | 10-K | 001-33843 | 3/26/2013 | 10.17.2 | |||||||
10.17.3† | Amendment #2 to Master Services Agreement between Verizon Corporate Services Group, Inc. and Synacor, Inc. dated as of April 1, 2013 | 10-Q | 001-33843 | 8/13/2013 | 10.3 | |||||||
10.18.1† | Joint Venture Agreement between Maxit Technology Incorporate, Synacor China, Ltd. and Synacor, Inc. dated as of March 11, 2013 | 10-Q | 001-33843 | 5/14/2013 | 10.2.1 | |||||||
10.18.2† | Shareholders Agreement between Maxit Technology Incorporated, Synacor China, Ltd. and Synacor, Inc. dated as of March 11, 2013 | 10-Q | 001-33843 | 5/14/2013 | 10.2.2 | |||||||
10.18.3# | Amendment to the Joint Venture Agreement dated as of December 6, 2013 | X^ | ||||||||||
10.19.1* | Special Purpose Recruitment Plan | Schedule 14A | 001-33843 | 4/5/2013 | App. A | |||||||
54
10.19.2* | Form of Stock Option Agreement (Early Exercise) under Special Purpose Recruitment Plan | 10-Q | 001-33843 | 8/13/2013 | 10.5 | |||||||
10.20 | Loan and Security Agreement between Silicon Valley Bank and Synacor, Inc. dated September 27, 2013 | 10-Q | 001-33843 | 11/14/2013 | 10.1 | |||||||
21.1 | List of subsidiaries | X^ | ||||||||||
23 | Consent of Deloitte & Touche LLP | X^ | ||||||||||
24.1 | Power of Attorney (contained in the signature page of this Annual Report on Form 10-K) | X^ | ||||||||||
31.1 | Certification of the Chief Executive Officer pursuant to Section 302 of the Sarbanes-Oxley Act of 2002 | X | ||||||||||
31.2 | Certification of the Chief Financial Officer pursuant to Section 302 of the Sarbanes-Oxley Act of 2002 | X | ||||||||||
32.1‡ | Certifications of the Chief Executive Officer and Chief Financial Officer pursuant to 18 U.S.C. Section 1350, as adopted pursuant to Section 906 of the Sarbanes-Oxley Act of 2002 | X | ||||||||||
101.INS†† | XBRL Instance Document | + | ||||||||||
101.SCH†† | XBRL Taxonomy Extension Schema | + | ||||||||||
101.CAL†† | XBRL Taxonomy Extension Calculation Linkbase | + | ||||||||||
101.LAB†† | XBRL Taxonomy Extension Label Linkbase | + | ||||||||||
101.PRE†† | XBRL Taxonomy Extension Presentation Linkbase | + | ||||||||||
101.DEF†† | XBRL Taxonomy Extension Definition Linkbase | + | ||||||||||
Notes:
† | Confidential treatment has been granted for portions of this document. The omitted portions have been filed with the Securities and Exchange Commission. | |
‡ | This certification is not deemed “filed” for purposes of Section 18 of the Securities Exchange Act, or otherwise subject to the liability of that section. Such certification will not be deemed to be incorporated by reference into any filing under the Securities Act of 1933 or the Securities Exchange Act of 1934, except to the extent that Synacor, Inc. specifically incorporates it by reference. | |
†† | XBRL (Extensible Business Reporting Language) information is "furnished" and not "filed" or a part of a registration statement or prospectus for purposes of Sections 11 or 12 of the Securities Act of 1933, as amended, is deemed not "filed" for purposes of Section 18 of the Securities Exchange Act of 1934, as amended, and is not otherwise subject to liability under these Sections. | |
* | Indicates management contract or compensatory plan or arrangement. | |
# | Confidential treatment requested for portions of this document. The omitted portions have been filed with the Securities and Exchange Commission. | |
^ | Filed as an exhibit to the Original Filing. | |
+ | Furnished as an exhibit to the Original Filing. | |
55
INDEX TO THE FINANCIAL STATEMENTS
Page | |
Financial Statements | |
F- 1
REPORT OF INDEPENDENT REGISTERED PUBLIC ACCOUNTING FIRM
To the Board of Directors and Stockholders of
Synacor, Inc.
Buffalo, New York
We have audited the accompanying consolidated balance sheets of Synacor, Inc. and subsidiary (the "Company") as of December 31, 2012 and 2013, and the related consolidated statements of operations, comprehensive income (loss), stockholders' equity, and cash flows for each of the three years in the period ended December 31, 2013. These financial statements are the responsibility of the Company's management. Our responsibility is to express an opinion on these financial statements based on our audits.
We conducted our audits in accordance with the standards of the Public Company Accounting Oversight Board (United States). Those standards require that we plan and perform the audit to obtain reasonable assurance about whether the financial statements are free of material misstatement. The Company is not required to have, nor were we engaged to perform, an audit of its internal control over financial reporting. Our audits included consideration of internal control over financial reporting as a basis for designing audit procedures that are appropriate in the circumstances, but not for the purpose of expressing an opinion on the effectiveness of the Company's internal control over financial reporting. Accordingly, we express no such opinion. An audit also includes examining, on a test basis, evidence supporting the amounts and disclosures in the financial statements, assessing the accounting principles used and significant estimates made by management, as well as evaluating the overall financial statement presentation. We believe that our audits provide a reasonable basis for our opinion.
In our opinion, such consolidated financial statements present fairly, in all material respects, the financial position of Synacor, Inc. and subsidiary as of December 31, 2012 and 2013, and the results of their operations and their cash flows for each of the three years in the period ended December 31, 2013, in conformity with accounting principles generally accepted in the United States of America.
/s/ Deloitte & Touche LLP
Williamsville, New York
March 26, 2014
F- 2
SYNACOR, INC.
CONSOLIDATED BALANCE SHEETS
AS OF DECEMBER 31, 2012 AND 2013
(In thousands except for share and per share data)
2012 | 2013 | ||||||
ASSETS | |||||||
CURRENT ASSETS: | |||||||
Cash and cash equivalents | $ | 41,944 | $ | 36,397 | |||
Accounts receivable—net of allowance of $25 and $76 | 15,624 | 14,569 | |||||
Deferred income taxes | 1,999 | 314 | |||||
Prepaid expenses and other current assets | 1,831 | 1,691 | |||||
Total current assets | 61,398 | 52,971 | |||||
PROPERTY AND EQUIPMENT—Net | 11,043 | 14,085 | |||||
DEFERRED INCOME TAXES, NON-CURRENT | 2,527 | 4,455 | |||||
OTHER LONG-TERM ASSETS | 543 | 348 | |||||
GOODWILL | 819 | 1,565 | |||||
CONVERTIBLE PROMISSORY NOTE | — | 1,000 | |||||
INVESTMENT IN EQUITY INTEREST | — | 365 | |||||
TOTAL ASSETS | $ | 76,330 | $ | 74,789 | |||
LIABILITIES AND STOCKHOLDERS’ EQUITY | |||||||
CURRENT LIABILITIES: | |||||||
Accounts payable | $ | 14,204 | $ | 13,573 | |||
Accrued expenses and other current liabilities | 7,328 | 5,177 | |||||
Current portion of capital lease obligations | 2,127 | 1,946 | |||||
Total current liabilities | 23,659 | 20,696 | |||||
LONG-TERM PORTION OF CAPITAL LEASE OBLIGATIONS | 1,712 | 885 | |||||
OTHER LONG-TERM LIABILITIES | 148 | 977 | |||||
Total liabilities | 25,519 | 22,558 | |||||
COMMITMENTS AND CONTINGENCIES (Note 7) | |||||||
STOCKHOLDERS’ EQUITY: | |||||||
Common stock, $0.01 par value—100,000,000 authorized, 27,517,665 issued and 27,198,165 shares outstanding at December 31, 2012 and 27,684,598 issued and 27,365,098 shares outstanding at December 31, 2013 | 275 | 277 | |||||
Preferred stock, $0.01 par value—10,000,000 shares authorized, no shares issued and outstanding at December 31, 2012 and 2013 | — | — | |||||
Treasury stock—at cost, 319,500 shares at December 31, 2012 and 2013 | (569 | ) | (569 | ) | |||
Additional paid-in capital | 99,449 | 102,226 | |||||
Accumulated deficit | (48,338 | ) | (49,705 | ) | |||
Accumulated other comprehensive income (loss) | (6 | ) | 2 | ||||
Total stockholders’ equity | 50,811 | 52,231 | |||||
TOTAL LIABILITIES AND STOCKHOLDERS’ EQUITY | $ | 76,330 | $ | 74,789 | |||
The accompanying notes are an integral part of these consolidated financial statements.
F- 3
SYNACOR, INC.
CONSOLIDATED STATEMENTS OF OPERATIONS
FOR THE YEARS ENDED DECEMBER 31, 2011, 2012, AND 2013
(In thousands except for share and per share data)
2011 | 2012 | 2013 | |||||||||
REVENUE | $ | 91,060 | $ | 121,981 | $ | 111,807 | |||||
COSTS AND OPERATING EXPENSES: | |||||||||||
Cost of revenue (exclusive of depreciation shown separately below) | 48,661 | 66,620 | 59,622 | ||||||||
Research and development (exclusive of depreciation shown separately below) | 20,228 | 25,603 | 28,458 | ||||||||
Sales and marketing | 8,582 | 9,120 | 8,124 | ||||||||
General and administrative (exclusive of depreciation shown separately below) | 6,879 | 11,011 | 11,663 | ||||||||
Depreciation | 2,667 | 3,779 | 4,650 | ||||||||
Total costs and operating expenses | 87,017 | 116,133 | 112,517 | ||||||||
INCOME (LOSS) FROM OPERATIONS | 4,043 | 5,848 | (710 | ) | |||||||
OTHER (EXPENSE) INCOME | (17 | ) | 1 | (37 | ) | ||||||
INTEREST EXPENSE | (109 | ) | (270 | ) | (193 | ) | |||||
INCOME (LOSS) BEFORE INCOME TAXES | 3,917 | 5,579 | (940 | ) | |||||||
(BENEFIT) PROVISION FOR INCOME TAXES | (6,015 | ) | 1,764 | (134 | ) | ||||||
LOSS IN EQUITY INTEREST | — | — | (561 | ) | |||||||
NET INCOME (LOSS) | 9,932 | 3,815 | (1,367 | ) | |||||||
UNDISTRIBUTED EARNINGS ALLOCATED TO PREFERRED STOCKHOLDERS | 8,583 | — | — | ||||||||
NET INCOME (LOSS) ATTRIBUTABLE TO COMMON STOCKHOLDERS | $ | 1,349 | $ | 3,815 | $ | (1,367 | ) | ||||
NET INCOME (LOSS) PER SHARE ATTRIBUTABLE TO COMMON STOCKHOLDERS: | |||||||||||
Basic | $ | 0.59 | $ | 0.16 | $ | (0.05 | ) | ||||
Diluted | $ | 0.45 | $ | 0.14 | $ | (0.05 | ) | ||||
WEIGHTED AVERAGE SHARES USED TO COMPUTE NET INCOME (LOSS) PER SHARE ATTRIBUTABLE TO COMMON STOCKHOLDERS: | |||||||||||
Basic | 2,303,443 | 24,411,194 | 27,306,882 | ||||||||
Diluted | 21,974,403 | 28,097,313 | 27,306,882 | ||||||||
The accompanying notes are an integral part of these consolidated financial statements.
F- 4
SYNACOR, INC.
CONSOLIDATED STATEMENTS OF COMPREHENSIVE INCOME (LOSS)
FOR THE YEARS ENDED DECEMBER 31, 2011, 2012, AND 2013
(In thousands)
2011 | 2012 | 2013 | |||||||||
Net income (loss) | $ | 9,932 | $ | 3,815 | $ | (1,367 | ) | ||||
Other comprehensive income: | |||||||||||
Change in foreign currency translation adjustment | — | (6 | ) | 8 | |||||||
Comprehensive income (loss) | $ | 9,932 | $ | 3,809 | $ | (1,359 | ) | ||||
The accompanying notes are an integral part of these consolidated financial statements.
F- 5
SYNACOR, INC.
CONSOLIDATED STATEMENTS OF STOCKHOLDERS’ EQUITY
FOR THE YEARS ENDED DECEMBER 31, 2011, 2012, AND 2013
(In thousands except for share data)
Common Stock | Treasury Stock (Common) | Series A Preferred Stock | Series A-1 Preferred Stock | Series B Preferred Stock | Series C Preferred Stock | Additional Paid-In Capital | Accumulated Deficit | Accumulated Other Comprehensive Income | |||||||||||||||||||||||||||||||||||||||||||||||||
Shares | Amount | Shares | Amount | Shares | Amount | Shares | Amount | Shares | Amount | Shares | Amount | Total | |||||||||||||||||||||||||||||||||||||||||||||
BALANCE - January 1, 2011 | 1,904,153 | $ | 19 | (319,500 | ) | $ | (569 | ) | 5,548,508 | $ | 5,077 | 570,344 | $ | 730 | 2,737,500 | $ | 5,401 | 2,740,407 | $ | 17,224 | $ | 44,359 | $ | (62,085 | ) | $ | — | $ | 10,156 | ||||||||||||||||||||||||||||
Exercise of stock options | 1,148,703 | 12 | 360 | 372 | |||||||||||||||||||||||||||||||||||||||||||||||||||||
Stock-based compensation expense | 920 | 920 | |||||||||||||||||||||||||||||||||||||||||||||||||||||||
Net income | 9,932 | 9,932 | |||||||||||||||||||||||||||||||||||||||||||||||||||||||
BALANCE - December 31, 2011 | 3,052,856 | 31 | (319,500 | ) | (569 | ) | 5,548,508 | 5,077 | 570,344 | 730 | 2,737,500 | 5,401 | 2,740,407 | 17,224 | 45,639 | (52,153 | ) | — | 21,380 | ||||||||||||||||||||||||||||||||||||||
Issuance of common stock upon initial public offering, net of offering costs | 5,454,545 | 54 | 22,293 | 22,347 | |||||||||||||||||||||||||||||||||||||||||||||||||||||
Conversion of preferred stock to common stock upon initial public offering | 17,395,136 | 174 | (5,548,508 | ) | (5,077 | ) | (570,344 | ) | (730 | ) | (2,737,500 | ) | (5,401 | ) | (2,740,407 | ) | (17,224 | ) | 28,258 | — | |||||||||||||||||||||||||||||||||||||
Exercise of common stock options | 1,615,128 | 16 | 1,196 | 1,212 | |||||||||||||||||||||||||||||||||||||||||||||||||||||
Stock-based compensation expense | 2,063 | 2,063 | |||||||||||||||||||||||||||||||||||||||||||||||||||||||
Net income | 3,815 | 3,815 | |||||||||||||||||||||||||||||||||||||||||||||||||||||||
Other comprehensive income | (6 | ) | (6 | ) | |||||||||||||||||||||||||||||||||||||||||||||||||||||
BALANCE - December 31, 2012 | 27,517,665 | 275 | (319,500 | ) | (569 | ) | — | — | — | — | — | — | — | — | 99,449 | (48,338 | ) | (6 | ) | 50,811 | |||||||||||||||||||||||||||||||||||||
Exercise of common stock options | 166,933 | 2 | 193 | 195 | |||||||||||||||||||||||||||||||||||||||||||||||||||||
Stock-based compensation expense | 2,584 | 2,584 | |||||||||||||||||||||||||||||||||||||||||||||||||||||||
Net loss | (1,367 | ) | (1,367 | ) | |||||||||||||||||||||||||||||||||||||||||||||||||||||
Other comprehensive income | 8 | 8 | |||||||||||||||||||||||||||||||||||||||||||||||||||||||
BALANCE - December 31, 2013 | 27,684,598 | $ | 277 | (319,500 | ) | $ | (569 | ) | — | $ | — | — | $ | — | — | $ | — | — | $ | — | $ | 102,226 | $ | (49,705 | ) | $ | 2 | $ | 52,231 | ||||||||||||||||||||||||||||
The accompanying notes are an integral part of these consolidated financial statements.
F- 6
SYNACOR, INC.
CONSOLIDATED STATEMENTS OF CASH FLOWS
FOR THE YEARS ENDED DECEMBER 31, 2011, 2012, AND 2013
(In thousands)
2011 | 2012 | 2013 | |||||||||
CASH FLOWS FROM OPERATING ACTIVITIES: | |||||||||||
Net income (loss) | $ | 9,932 | $ | 3,815 | $ | (1,367 | ) | ||||
Adjustments to reconcile net income (loss) to net cash provided by operating activities: | |||||||||||
Depreciation | 2,667 | 3,779 | 4,650 | ||||||||
Stock-based compensation expense | 920 | 1,999 | 2,561 | ||||||||
Loss on disposal of property and equipment | 11 | 35 | — | ||||||||
Deferred income taxes | (6,083 | ) | 1,557 | (243 | ) | ||||||
Loss in equity interest | — | — | 561 | ||||||||
Change in assets and liabilities: | |||||||||||
Accounts receivable, net | (4,682 | ) | (1,288 | ) | 1,055 | ||||||
Prepaid expenses and other current assets | (45 | ) | 253 | 189 | |||||||
Other long-term assets | 164 | 380 | 220 | ||||||||
Accounts payable | 4,120 | 2,335 | (527 | ) | |||||||
Accrued expenses and other current liabilities | 1,709 | 1,715 | (2,205 | ) | |||||||
Other long-term liabilities | (35 | ) | 77 | 334 | |||||||
Net cash provided by operating activities | 8,678 | 14,657 | 5,228 | ||||||||
CASH FLOWS FROM INVESTING ACTIVITIES: | |||||||||||
Purchases of property and equipment | (1,848 | ) | (4,269 | ) | (5,920 | ) | |||||
Investment in equity interest | — | — | (926 | ) | |||||||
Cash paid for business acquisition | — | (600 | ) | (1,011 | ) | ||||||
Purchase of convertible promissory note | — | — | (1,000 | ) | |||||||
Net cash used in investing activities | (1,848 | ) | (4,869 | ) | (8,857 | ) | |||||
CASH FLOWS FROM FINANCING ACTIVITIES: | |||||||||||
Proceeds from sale/leaseback | 794 | — | — | ||||||||
Repayment on bank financing | (500 | ) | (250 | ) | — | ||||||
Repayments on capital lease obligations | (1,719 | ) | (2,336 | ) | (2,121 | ) | |||||
Proceeds from exercise of common stock options | 372 | 1,212 | 195 | ||||||||
Proceeds from initial public offering | — | 25,364 | — | ||||||||
Initial public offering costs | (264 | ) | (2,753 | ) | — | ||||||
Net cash (used in) provided by financing activities | (1,317 | ) | 21,237 | (1,926 | ) | ||||||
Effect of exchange rate changes on cash and cash equivalents | — | (6 | ) | 8 | |||||||
NET INCREASE (DECREASE) IN CASH AND CASH EQUIVALENTS | 5,513 | 31,019 | (5,547 | ) | |||||||
CASH AND CASH EQUIVALENTS—Beginning of year | 5,412 | 10,925 | 41,944 | ||||||||
CASH AND CASH EQUIVALENTS—End of year | $ | 10,925 | $ | 41,944 | $ | 36,397 | |||||
SUPPLEMENTAL DISCLOSURES OF CASH FLOW INFORMATION: | |||||||||||
Cash paid for interest | $ | 110 | $ | 259 | $ | 165 | |||||
Cash paid for income taxes | 82 | 134 | 140 | ||||||||
SUPPLEMENTAL DISCLOSURES OF NON-CASH INVESTING AND FINANCING TRANSACTIONS: | |||||||||||
Property and equipment acquired under capital lease obligations and bank financing | $ | 2,185 | $ | 2,484 | $ | 1,039 | |||||
Accrual for business acquisition | — | 500 | 495 | ||||||||
Accrued property and equipment expenditures | 235 | 269 | 719 | ||||||||
Accrued initial public offering costs | 1,042 | — | — | ||||||||
The accompanying notes are an integral part of these consolidated financial statements.
F- 7
SYNACOR, INC.
NOTES TO THE CONSOLIDATED FINANCIAL STATEMENTS
AS OF DECEMBER 31, 2012 AND 2013, AND
FOR THE YEARS ENDED DECEMBER 31, 2011, 2012, AND 2013
(In thousands except for share and per share data)
1. THE COMPANY AND SUMMARY OF SIGNIFICANT ACCOUNTING POLICIES
Synacor, Inc., together with its consolidated subsidiary (collectively, the “Company”), is a leading provider of start experiences (startpages and homescreens), TV Everywhere, Identity Management and various cloud-based services across multiple devices for cable, satellite, telecom and consumer electronics companies. The Company is also a leading provider of authentication and aggregation solutions enabling the delivery of personalized, online content. The Company's technology allows its customers to package a wide array of personalized, online content and cloud-based services with their high-speed Internet, communications, television and other digital offerings. The Company's customers offer the Company's services under their own brands on Internet-enabled devices such as PCs, tablets, smartphones and connected TVs.
Initial Public Offering— In February 2012, the Company completed its initial public offering whereby 6,818,170 shares of common stock were sold to the public at a price of $5.00 per share. The Company sold 5,454,545 common shares and selling stockholders sold 1,363,625 common shares. The Company received aggregate proceeds of $25,364 from the initial public offering, net of underwriters’ discounts and commissions but before deducting offering expenses of approximately $3,016.
In connection with the initial public offering in February 2012, the Board of Directors of the Company approved a 1-for-2 reverse stock split of the Company’s common stock. All common shares, stock options, and per share information presented in these financial statements reflect the reverse stock split on a retroactive basis for all periods presented. There was no change in the par value of the Company’s common stock. The ratio by which shares of preferred stock were convertible into shares of common stock was adjusted to reflect the effects of the reverse stock split. In addition, in accordance with their rights and consistent with the conversion rates discussed in Note 8, Equity, all shares of the Company’s outstanding preferred stock were converted into common stock upon the closing of the initial public offering.
Basis of Presentation—The consolidated financial statements and accompanying notes have been prepared in accordance with United States generally accepted accounting principles (“GAAP”) and include the accounts of the Company and its wholly-owned subsidiary, Synacor Canada, Inc. All intercompany balances and transactions have been eliminated in consolidation.
Accounts Receivable—The Company records accounts receivable at the invoiced amount and does not charge interest on past due invoices. An allowance for doubtful accounts is maintained to reserve for potentially uncollectible accounts receivable. The Company reviews its accounts receivable from customers which are past due to identify specific accounts with known disputes or collectability issues. In determining the amount of the reserve, the Company makes judgments about the creditworthiness of customers based on ongoing credit evaluations.
Property and Equipment—Property and equipment are stated at cost, less accumulated depreciation. Depreciation is computed using the straight-line method over the estimated useful lives of the assets as follows:
Leasehold improvements | 3–10 years |
Computer hardware | 5 years |
Computer software | 3 years |
Furniture and fixtures | 7 years |
Other | 3–5 years |
Leasehold improvements are amortized over the shorter of the lease term or the estimated useful life of the assets.
Long-Lived Assets—The Company reviews the carrying value of its long-lived assets for impairment whenever events or changes in circumstances indicate that the carrying value of these assets may not be recoverable. For purposes of evaluating and measuring impairment, the Company groups a long-lived asset or assets with other assets and liabilities at the lowest level for which identifiable cash flows are largely independent of the cash flows of other assets and liabilities. Recoverability of assets to be held and used is measured by a comparison of the carrying amount of the assets to future undiscounted net cash flows expected to be generated by the assets. If such assets are considered to be impaired, the impairment
F- 8
to be recognized is measured as the amount by which the carrying amount of the assets exceeds the fair value of the assets. There has been no material adjustments to long-lived assets in any of the years presented.
Revenue Recognition—The Company derives revenue from two categories: revenue generated from search and display advertising activities and subscriber-based revenue, each of which is described below. Search and display advertising is recorded on a gross basis, which includes the net amount received from Google under the Company’s agreement with Google. The following table shows the revenue in each category for the years ended December 31, 2011, 2012 and 2013 (in thousands):
Year Ended December 31, | |||||||||||
2011 | 2012 | 2013 | |||||||||
Search and display advertising | $ | 72,084 | $ | 101,559 | $ | 90,447 | |||||
Subscriber-based | 18,976 | 20,422 | 21,360 | ||||||||
Total revenue | $ | 91,060 | $ | 121,981 | $ | 111,807 | |||||
The Company uses Internet search and display advertising to generate revenue from the traffic on its start experiences.
• | In the case of search advertising, the Company has a revenue-sharing relationship with Google, pursuant to which it includes a Google-branded search tool on its start experiences. When a consumer makes a search query using this tool, the Company delivers the query to Google and they return search results to consumers that include advertiser-sponsored links. If the consumer clicks on a sponsored link, Google receives payment from the sponsor of that link and shares a portion of that payment with the Company, which in turn is shared with the applicable customer. The net payment received from Google is recognized as revenue. |
• | Display advertising revenue is generated when consumers view or click on a text, graphic, or video advertisement that was delivered on one of the Company's start experiences. Advertising inventory is filled with advertisements sourced by the Company’s direct sales force, independent advertising sales representatives, and also advertising network partners. Display advertising revenue is calculated on a cost per impression basis, which means the advertiser pays based on the number of times its advertisements appear, or a cost per action basis, which means that an advertiser pays when a consumer performs an action after engaging one of its advertisements, or on a fixed fee basis. Historically, only a small percentage of display advertising has been calculated on a cost per action basis or fixed fee basis. |
Subscriber-based revenue represents subscription fees and other fees that the Company receives from customers for the use of its proprietary technology, including the use of, or access to, e-mail, TV Everywhere, security, games and other value added services and paid content. Monthly subscriber levels typically form the basis for calculating and generating subscriber-based revenue. They are generally determined by multiplying a per-subscriber per-month fee by the number of subscribers using the particular services being offered or consumed. In other cases, the fee is fixed. Revenue is recognized from customers as the service is delivered.
Search and display advertising and subscriber-based revenue are recognized when the following criteria are met: persuasive evidence of an arrangement exists; delivery has occurred; the selling price is fixed or determinable; and collectability is reasonably assured.
The Company evaluates its relationship between search and display advertising partners and customers in accordance with Financial Accounting Standards Board (“FASB”) Accounting Standards Codification (“ASC”) 605-45, Principal Agent Considerations. The Company has determined that the revenue derived from traffic supplied by its customers is reported on a gross basis because Synacor is the primary obligor (the Company is responsible to its customers for fulfilling search and display advertising services and value added and other services), is involved in the service specifications, performs part of the service, has discretion in supplier selection, has latitude in establishing price and bears credit risk.
Cost of Revenue—Cost of revenue consists of revenue sharing, content acquisition costs and co-location facility costs. Revenue sharing consists of amounts accrued and paid to customers for the traffic on their start experience resulting in the generation of search and display advertising revenue. The revenue-sharing agreements with customers are primarily variable payments based on a percentage of the search and display advertising revenue. Content-acquisition agreements may be based on a fixed payment schedule, on the number of subscribers per month, or a combination of both. Fixed-payment agreements are expensed on a straight-line basis over the term defined in the agreement. Agreements based on the number of subscribers are expensed on a monthly basis. Co-location facility costs consist of rent and operating costs for the Company’s data center facilities.
F- 9
Concentrations of Risk—As of December 31, 2012 and 2013, and for the years ended December 31, 2011, 2012, and 2013 the Company had concentrations equal to or exceeding 10% of the Company’s accounts receivable and revenue as follows:
Accounts Receivable | Revenue | |||||||||||||
2012 | 2013 | 2011 | 2012 | 2013 | ||||||||||
Google | 40 | % | 47 | % | 57 | % | 56 | % | 51 | % | ||||
Display Advertising Partner (1) | N/A | 11 | N/A | N/A | N/A | |||||||||
Note:
(1) | As of December 31, 2012, the accounts receivable of the Display Advertising Partner was less than 10%. For the years ended December 31, 2011, 2012, and 2013 the revenue earned directly from the Display Advertising Partner was less than 10% . |
For the years ended December 31, 2011, 2012, and 2013, the following customers received revenue-share payments equal to or exceeding 10% of the Company’s cost of revenue. The costs represent revenue share paid to customers for their supply of Internet traffic on the Company's start experiences.
Cost of Revenue | ||||||||
2011 | 2012 | 2013 | ||||||
Customer A | 14 | % | 20 | % | 22 | % | ||
Customer B | 18 | 13 | 13 | |||||
Customer C | 11 | 17 | 12 | |||||
Customer D (1) | N/A | 12 | 11 | |||||
Note:
(1) | For the year ended December 31, 2011, the revenue share payments received by Customer D were less than 10%. |
Financial instruments that potentially subject the Company to significant concentrations of credit risk consist principally of cash and cash equivalents. The Company places its cash primarily in checking and money market accounts with high credit quality financial institutions, which, at times, have exceeded federally insured limits of $250. Although the Company maintains balances that exceed the federally insured limit, it has not experienced any losses related to these balances and believes credit risk to be minimal.
Research and Development—Research and development expenses consist primarily of compensation related expenses incurred for the development of, enhancements to, and maintenance and operation of the Company’s technology and related infrastructures.
Internal Software Development Costs—Costs incurred during the preliminary project stage for software programs are expensed as incurred. External and internal costs incurred during the application development stage of new software development as well as for upgrades and enhancements for software programs that result in additional functionality are capitalized. In 2011 the Company did not incur significant external or internal costs related to the application development stage. In 2012 and 2013, the Company incurred $778 and $2,987 of combined internal and external costs related to the application development stage. Internal and external training and maintenance costs are expensed as incurred.
Sales and Marketing—Sales and marketing expenses consist primarily of compensation related expenses to the Company’s direct sales and marketing personnel, as well as costs related to advertising, industry conferences, promotional materials, and other sales and marketing programs. Advertising cost is expensed as incurred.
General and Administrative—General and administrative expenses consist primarily of compensation related expenses for executive management, finance, accounting, human resources, and other administrative functions.
Earnings (Loss) Per Share—Basic earnings (loss) per share, or EPS, is calculated in accordance with FASB ASC Topic 260, Earnings per Share, and is calculated using the weighted average number of common shares outstanding during
F- 10
each period. Contingently issuable or repurchasable shares are not used in the calculation of basic earnings (loss) per share until the contingency is resolved.
Diluted EPS assumes the conversion, exercise or issuance of all potential common stock equivalents unless the effect is to reduce a loss or increase the income per share. For purposes of this calculation, convertible preferred stock and options are considered to be potential common shares and are only included in the calculation of diluted earnings (loss) per share when their effect is dilutive.
The shares used to compute basic and diluted net income (loss) per share represent the weighted-average common shares outstanding. The Company's preferred stockholders had the right to participate with common stockholders in dividends and unallocated income. Net losses were not allocated to the preferred stockholders. Therefore, when applicable. basic and diluted EPS were computed using the two-class method, under which the Company's undistributed earnings are allocated amongst the common and preferred stockholders.
Stock-Based Compensation—The Company records compensation costs related to stock-based awards in accordance with FASB ASC 718, Compensation—Stock Compensation. Under the fair value recognition provisions of ASC 718, the Company measures stock-based compensation cost at the grant date based on the estimated fair value of the award. Compensation cost is recognized ratably over the requisite service period of the award. The Company utilizes the Black-Scholes option-pricing model to estimate the fair value of stock options granted. The amount of stock-based compensation expense recognized during a period is based on the portion of the awards that are ultimately expected to vest. The Company estimates prevesting forfeitures at the time of grant by analyzing historical data and revises those estimates in subsequent periods if actual forfeitures differ from those estimates. The total expense recognized over the vesting period will only be for those awards that ultimately vest. See Note 10, Stock-based Compensation, for additional information on stock-based compensation.
Income Taxes—Deferred income tax assets and liabilities are determined based on temporary differences between the financial statement and income tax bases of assets and liabilities and net operating loss ("NOL") and credit carryforwards using enacted income tax rates in effect for the year in which the differences are expected to reverse. A valuation allowance is established to the extent necessary to reduce deferred income tax assets to amounts that more likely than not will be realized.
The Company accounts for uncertain tax positions using a more-likely-than-not recognition threshold based on the technical merits of the tax position taken. Tax benefits that meet the more-likely-than-not recognition threshold should be measured as the largest amount of tax benefits, determined on a cumulative probability basis, which is more likely than not to be realized upon ultimate settlement in the financial statements. It is the Company’s policy to recognize interest and penalties related to income tax matters in income tax expense. As of December 31, 2013, there was no accrued interest or penalties related to uncertain tax positions.
Accounting Estimates—The preparation of financial statements in conformity with GAAP in the U.S. requires management to make estimates, judgments and assumptions that affect the amounts reported and disclosed in the financial statements and the accompanying notes. The Company bases its estimates on historical experience and on various other assumptions that are believed to be reasonable, the results of which form the basis for making judgments about the carrying values of assets and liabilities. Such estimates primarily relate to unsettled transactions and events as of the date of the financial statements. Accordingly, actual results may differ from estimated amounts.
Fair Value of Financial Instruments—The carrying amounts of the Company’s capital leases and bank financing approximate fair value of these obligations based upon management’s best estimates of interest rates that would be available for similar debt obligations at December 31, 2012 and 2013.
Investments and Fair Value Measurements—In July 2013, the Company made a $1,000 investment (in the form of a convertible promissory note) in a privately held Delaware corporation called Blazer and Flip Flops, Inc., or B&FF (doing business as The Experience Engine). B&FF is a professional services company whose principals have experience integrating its customers’ systems with their customers’ devices, including smartphones and tablets.
The investment in B&FF is considered an available-for-sale security and is reported on the Company’s consolidated balance sheet as a convertible promissory note.
The provisions of ASC 820, Fair Value Measurements and Disclosures, establishes a framework for measuring the fair value in accounting principles generally accepted in the U.S. and establishes a hierarchy that categorizes and prioritizes the sources to be used to estimate fair value as follows:
Level 1—Level 1 inputs are defined as observable inputs such as quoted prices in active markets.
F- 11
Level 2—Level 2 inputs include quoted prices for similar assets and liabilities in active markets, quoted prices for identical or similar assets or liabilities in markets that are not active, inputs other than quoted prices that are observable for the asset or liability (interest rates, yield curves, etc.), and inputs that are derived principally from or corroborated by observable market data by correlation or other means (market corroborated inputs).
Level 3—Level 3 inputs are unobservable inputs that reflect the Company’s determination of assumptions that market participants would use in pricing the asset or liability. These inputs are developed based on the best information available, including the Company’s own data.
The Company classifies its investment in B&FF within Level 3 because it is valued using unobservable inputs and at December 31, 2013 the estimated fair value is equal to the purchase price of $1,000.
Acquisitions—In January 2012, the Company acquired the assets of Carbyn, Inc., or Carbyn, an Ontario, Canada-based company. The assets acquired are principally comprised of mobile device software and technology and other intellectual property, which the Company expects to enhance its efforts in the development of next generation web applications for mobile devices. The aggregate purchase price was $1,100 for the acquired assets, of which $600 was paid upon consummation of the acquisition and the remaining $500 was paid in April 2013. In addition, the Company hired seven employees from Carbyn who accepted employment with Synacor Canada, Inc., a wholly-owned subsidiary of the Company. The acquisition and its impact on the balance sheet and results of operations are not material. The purchase price was allocated to the assets acquired based on their respective fair values as of the acquisition date, with the amount exceeding the fair value recorded as goodwill of $819, which is expected to be deductible for tax purposes.
In November 2013, the Company acquired the assets of Teknision, Inc., or Teknision, an Ontario, Canada-based company. Teknision has created a development framework that accelerates the production of home screen and other Android applications. The Company expects to leverage the framework to enable a range of customer applications for Android devices. The Company also expects to enhance its presence in mobile and provide a platform for custom Android launchers and intelligent home screens for wireless carriers and consumer electronics companies. The aggregate purchase price is up to $1,005 for the acquired assets, of which $510 was paid upon consummation of the acquisition and the remaining $495 is due in May 2015 unless such amount is offset in satisfaction of certain indemnification obligations of Teknision. In addition, the Company hired eleven employees from Teknision who accepted employment with Synacor Canada, Inc. The acquisition and its impact on the consolidated financial statements are not material. The purchase price was allocated to the assets acquired based on their respective fair values as of the acquisition date, with the amount exceeding the fair value recorded as goodwill of $746, which is expected to be deductible for tax purposes.
Subsequent Events—The Company reviewed and evaluated subsequent events through the issuance of the date of the Company's consolidated financial statements.
F- 12
2. PROPERTY AND EQUIPMENT—NET
As of December 31, property and equipment, net consisted of the following (in thousands):
2012 | 2013 | ||||||
Computer equipment (1) | $ | 17,630 | $ | 19,361 | |||
Computer software | 3,715 | 4,625 | |||||
Furniture and fixtures | 1,050 | 1,634 | |||||
Leasehold improvements | 732 | 1,044 | |||||
Work in process (primarily software development costs) | 226 | 3,893 | |||||
Other | 173 | 173 | |||||
23,526 | 30,730 | ||||||
Less accumulated depreciation (2) | (12,483 | ) | (16,645 | ) | |||
Total property and equipment—net | $ | 11,043 | $ | 14,085 | |||
Notes:
(1) | Includes equipment under capital lease obligations of approximately $5,882 and $5,289 as of December 31, 2012 and 2013, respectively. |
(2) | Includes $1,834 and $2,053 of accumulated depreciation of equipment under capital leases as of December 31, 2012 and 2013, respectively. |
3. ACCRUED EXPENSES AND OTHER CURRENT LIABILITIES
As of December 31, accrued expenses and other current liabilities consisted of the following (in thousands):
2012 | 2013 | ||||||
Accrued compensation | $ | 4,265 | $ | 2,787 | |||
Accrued content fees | 555 | 580 | |||||
Accrued business acquisition consideration | 500 | — | |||||
Unearned revenue on contracts | 297 | 247 | |||||
Other | 1,711 | 1,563 | |||||
Total | $ | 7,328 | $ | 5,177 | |||
4. BANK FINANCING
In September 2013, the Company entered into a new Loan and Security Agreement, or Loan Agreement, with Silicon Valley Bank, or Lender. The Loan Agreement provides for a $10.0 million secured revolving line of credit with a stated maturity of September 27, 2015. The credit facility is available for cash borrowings, subject to a formula based upon eligible accounts receivable. As of December 31, 2013, due to the operation of the borrowing formula, $7.5 million was available under the revolving credit line, with no outstanding borrowings.
Borrowings under the Loan Agreement bear interest, at the Company’s election, at an annual rate of either 0.50% above the “prime rate” as published in The Wall Street Journal or LIBOR for the relevant period plus 3.00%. For LIBOR advances, interest is payable (i) on the last day of a LIBOR interest period or (ii) on the last day of each calendar quarter. For prime rate advances, interest is payable (a) on the first day of each month and (b) on each date a prime rate advance is converted into a LIBOR advance.
The Company paid a commitment fee of $50 upon the closing of the facility, and must pay quarterly, in arrears, an unused facility fee of 0.50% per annum of the average unused portion of the facility (as determined by the Lender). Additionally, if the Company terminates the facility prior to the first anniversary of the closing date, the Company must pay the Lender a termination fee of $100 unless the facility is replaced with a new facility from the Lender.
The Company’s obligations to the Lender are secured by a first priority security interest in all our assets, including our intellectual property. The Loan Agreement contains customary events of default, including non-payment of principal or interest, violations of covenants, material adverse changes, cross-default, bankruptcy and material judgments. Upon the occurrence of an event of default, the Lender may accelerate repayment of any outstanding balance. The Loan Agreement also
F- 13
contains certain financial covenants and other agreements that are customary in loan agreements of this type, including restrictions on paying dividends and making distributions to our stockholders. As of December 31, 2013, the Company was in compliance with the covenants.
5. INCOME TAXES
Income (loss) from continuing operations before income taxes included income from domestic operations of $3,917, $5,494, and $(1,120) for the years ended December 31, 2011, 2012, and 2013, and income from foreign operations of $0, $85, and $180 for the years ended December 31, 2011, 2012, and 2013.
The (benefit) provision for income taxes for the years ended December 31, 2011, 2012, and 2013, comprised the following (in thousands):
2011 | 2012 | 2013 | |||||||||
Current: | |||||||||||
United States Federal | $ | 47 | $ | 151 | $ | 16 | |||||
State | 7 | 20 | 22 | ||||||||
Foreign | 14 | 36 | 71 | ||||||||
Total current provision for income taxes | 68 | 207 | 109 | ||||||||
Deferred: | |||||||||||
United States Federal | 1,954 | 1,022 | (119 | ) | |||||||
State | 373 | 535 | (97 | ) | |||||||
Foreign | 40 | — | (27 | ) | |||||||
Total deferred provision (benefit) for income taxes | 2,367 | 1,557 | (243 | ) | |||||||
Less decrease in valuation allowance | (8,450 | ) | — | — | |||||||
Net deferred (benefit) provision for income taxes | (6,083 | ) | 1,557 | (243 | ) | ||||||
Total (benefit) provision for income taxes | $ | (6,015 | ) | $ | 1,764 | $ | (134 | ) | |||
F- 14
The income tax effects of significant temporary differences and carryforwards that give rise to deferred income tax assets and liabilities as of December 31, 2012 and 2013 are as follows (in thousands):
2012 | 2013 | ||||||
Deferred income tax assets: | |||||||
Stock and other compensation expense | $ | 835 | $ | 1,516 | |||
Net operating losses | 2,763 | 2,255 | |||||
Research and development credits | 1,676 | 1,676 | |||||
Other federal and state carryforwards | 375 | 414 | |||||
Other | 71 | 15 | |||||
Gross deferred tax assets | 5,720 | 5,876 | |||||
Deferred income tax liabilities: | |||||||
Fixed assets | (566 | ) | (469 | ) | |||
Other | (1 | ) | (11 | ) | |||
Gross deferred tax liabilities | (567 | ) | (480 | ) | |||
Subtotal | 5,153 | 5,396 | |||||
Less unrecognized tax benefit liability related to deferred items | (627 | ) | (627 | ) | |||
Net deferred tax assets | $ | 4,526 | $ | 4,769 | |||
Recorded as: | |||||||
Current deferred tax assets | $ | 1,999 | $ | 314 | |||
Non-current deferred tax assets | 2,527 | 4,455 | |||||
Net deferred tax assets | $ | 4,526 | $ | 4,769 | |||
A reconciliation of the beginning and ending amount of unrecognized tax benefits is as follows (in thousands):
2011 | 2012 | 2013 | |||||||||
Balance—beginning of year | $ | 244 | $ | 26 | $ | 627 | |||||
Additions for tax positions of prior years | — | 601 | — | ||||||||
Reductions for tax positions of prior years | (218 | ) | — | — | |||||||
Balance—end of year | $ | 26 | $ | 627 | $ | 627 | |||||
The tax position at the end of 2011 was primarily related to changes in tax depreciation methods related to fixed assets placed in service in prior years. The tax positions at the end of 2012 and 2013 were primarily related to research and development carryforwards.
If the $627 of unrecognized tax benefits as of December 31, 2013 were recognized, approximately $614 would decrease the effective tax rate in the period in which each of the benefits is recognized. The remaining amount would be offset by the reversal of related deferred tax assets on which an unrecognized tax benefit liability is placed. The Company does not expect any material changes to its unrecognized tax benefits within the next twelve months.
The Company recognizes interest and penalties related to uncertain tax positions in income tax expense. As of December 31, 2012 and 2013, penalties and interest were immaterial.
The Company files income tax returns in the U.S. federal jurisdiction as well as many U.S. states and foreign jurisdictions. The tax years 2003 to 2012 remain open to examination by the major jurisdictions in which the Company is subject to tax. Fiscal years outside the normal statute of limitation remain open to audit by tax authorities due to tax attributes generated in those early years which have been carried forward and may be audited in subsequent years when utilized. The Company is currently not under examination in any major taxing jurisdictions.
F- 15
The Company does not provide for federal income taxes on the undistributed earnings of its foreign subsidiaries, as such earnings are to be reinvested offshore indefinitely. The income tax liability would be insignificant if these earnings were to be repatriated.
Income tax (benefit) expense for the years ended December 2011, 2012, and 2013, differs from the expected income tax (benefit) expense calculated using the statutory U.S. Federal income tax rate as follows (dollars in thousands):
2011 | 2012 | 2013 | ||||||||||||||||||
Federal income tax (benefit) expense at statutory rate | $ | 1,332 | 34 | % | $ | 1,895 | 34 | % | $ | (320 | ) | (34 | )% | |||||||
State and local taxes—net of federal benefit | 251 | 6 | 310 | 6 | (75 | ) | (8 | ) | ||||||||||||
Foreign taxes | 54 | 1 | 14 | — | (3 | ) | — | |||||||||||||
Expiration of or changes to federal and state NOLs | (42 | ) | (1 | ) | 446 | 8 | — | — | ||||||||||||
Federal research and development credit | — | — | (1,676 | ) | (30 | ) | — | — | ||||||||||||
Valuation allowance | (7,959 | ) | (203 | ) | — | — | — | — | ||||||||||||
Permanent differences | 349 | 9 | 291 | 5 | 264 | 28 | ||||||||||||||
Uncertain tax position current activity | — | — | 586 | 11 | — | — | ||||||||||||||
Other | — | — | (102 | ) | (2 | ) | — | — | ||||||||||||
Total | $ | (6,015 | ) | (154 | )% | $ | 1,764 | 32 | % | $ | (134 | ) | (14 | )% | ||||||
The Company had federal and state NOL carryforwards of approximately $5,800 and $5,200, respectively, at December 31, 2013. In addition, the Company has approximately $1,900 of NOL carryforwards created by windfall tax benefits relating to stock compensation for which no deferred tax assets have been recorded in accordance with the rules under FASB Statement 123(R). The NOLs will begin to expire in 2027. The Company has weighed the positive and negative evidence and determined that it will more likely than not be able to generate sufficient taxable income in the future to be able to utilize the entire NOL in future periods, and therefore, a valuation allowance is not recorded against the net deferred tax assets as of December 31, 2013.
On September 13, 2013, the US Treasury and IRS issued final Tangible Property Regulations (“TPR”) under IRC Section 162 and IRC Section 263(a). The regulations are not effective until tax years beginning on or after January 1, 2014; however, certain portions may require an accounting method change on a retroactive basis, thus requiring a IRC Section 481(a) adjustment related to fixed and real asset deferred taxes. The accounting rules under ASC 740 treat the release of the regulations as a change in tax law as of the date of issuance and require the Company to determine whether there will be an impact on its financial statements for the year ended December 31, 2013. Any such impact of the final tangible property regulations would affect temporary deferred taxes only and result in a balance sheet reclassification between current and deferred taxes. The Company will continue to monitor the impact of any future changes to the TPR on the Company prospectively.
6. INFORMATION ABOUT SEGMENT AND GEOGRAPHIC AREAS
Operating segments are components of the Company in which separate financial information is available that is evaluated regularly by the Company’s chief operating decision maker in deciding how to allocate resources and in assessing performance. The chief operating decision maker for the Company is the Chief Executive Officer. The Chief Executive Officer reviews financial information presented on a total Company basis, accompanied by information about revenue by major service line for purposes of allocating resources and evaluating financial performance. Profitability measures by service line are not routinely prepared or used. The Company has one business activity and there are no segment managers who are held accountable for operations, operating results or plans for levels or components below the Company level. Accordingly, the Company has determined that it has a single reporting segment and operating unit structure.
The following table sets forth revenue and long-lived tangible assets by geographic area (in thousands):
F- 16
Years Ended December 31, | |||||||||||
2011 | 2012 | 2013 | |||||||||
Revenue: | |||||||||||
United States | $ | 90,062 | $ | 121,306 | $ | 111,122 | |||||
United Kingdom | 998 | 675 | 685 | ||||||||
Total revenue | $ | 91,060 | $ | 121,981 | $ | 111,807 | |||||
Years Ended December 31, | |||||||
2012 | 2013 | ||||||
Long-lived tangible assets: | |||||||
United States | $ | 10,638 | $ | 13,825 | |||
Netherlands | 405 | 260 | |||||
Total long-lived tangible assets | $ | 11,043 | $ | 14,085 | |||
7. COMMITMENTS AND CONTINGENCIES
Lease Commitments—The Company leases office space and data center space under operating lease agreements and certain equipment under capital lease agreements with interest rates ranging from 3% to 7%.
Rent expense for operating leases was approximately $1,099, $1,529, and $1,692 for 2011, 2012, and 2013, respectively.
Lease commitments as of December 31, 2013 can be summarized as follows (in thousands):
Years Ending December 31 | Operating Lease Commitments | ||
2014 | $ | 1,478 | |
2015 | 988 | ||
2016 | 348 | ||
2017 | 191 | ||
2018 and thereafter | 318 | ||
Total lease commitments | $ | 3,323 | |
Years Ending December 31 | Capital Lease Commitments | ||
2014 | $ | 2,038 | |
2015 | 531 | ||
2016 and thereafter | 390 | ||
Gross lease commitment | 2,959 | ||
Less interest | (128 | ) | |
Net lease commitments | $ | 2,831 | |
Contract Commitments—The Company is obligated to make payments under various contracts with vendors and other business partners, principally for revenue-share and content arrangements. Contract commitments as of December 31, 2013 can be summarized as follows (in thousands):
F- 17
Years Ending December 31 | Contract Commitments | ||
2014 | $ | 4,610 | |
2015 | 1,630 | ||
2016 | 1,080 | ||
2017 | 360 | ||
2018 and thereafter | — | ||
Total contract commitments | $ | 7,680 | |
Litigation—From time to time, the Company is a party to legal actions. In the opinion of management, the outcome of these matters will not have a material impact on the financial statements of the Company.
F- 18
8. EQUITY
Common Stock—Effective on February 15, 2012, the Company's board of directors and stockholders approved the Fifth Amended and Restated Certificate of Incorporation. The total number of common shares that the Company is authorized to issue is 100,000,000 with a par value of $0.01 per share.
Preferred Stock— Effective on February 15, 2012, the Company's board of directors and stockholders approved the Fifth Amended and Restated Certificate of Incorporation. The total number of preferred shares that the Company is authorized to issue is 10,000,000 with a par value of $0.01 per share. None have been issued to date.
Conversion— Prior to the Company's initial public offering, each share of Series A, A-1, B, and C preferred stock was convertible at the option of the holder at any time into common stock. The conversion rate was the quotient obtained by dividing the original issue price of the Series A, A-1, B, or C by the conversion price. Subsequent to the Second Certificate of Amendment to the Fourth Amended and Restated Certificate of Incorporation, the conversion price was adjusted to effect a conversion of one preferred share into one and one-half common shares, as explained in Note 1, The Company and Summary of Significant Accounting Policies. The conversion price was subject to adjustment as set forth in the restated certificate of incorporation for certain dilutive issuances, splits, and combinations, as therein defined. Conversion was automatic upon either the consent of the holders of 66% of the outstanding shares of preferred stock or the effective date of a firm commitment underwritten public offering of the Company's common stock in which the post-offering valuation on a fully diluted basis was at least $150 million and the proceeds were not less than $25 million. All shares of the Company's outstanding preferred stock were converted into common stock in February 2012 in connection with the Company's initial public offering.
9. INVESTMENT IN EQUITY INTEREST
In March 2013, the Company entered into a Joint Venture Agreement, pursuant to which it owns 50% of the outstanding common stock and 100% of the preferred shares of Synacor China, Ltd., or the JV Company. In July 2013 the Company provided $400 in initial funding and $526 in additional funding in December 2013. The Company has agreed to provide up to $1.1 million in additional funding to the JV Company over the following two years. The JV Company will, through its wholly foreign-owned subsidiary in the People's Republic of China (the “PRC”), supply authentication and aggregation solutions for the delivery of online content and services to customers in the PRC.
The investment in the JV Company is being accounted for using the equity method and is classified as an investment in equity interest on the Company’s 2013 consolidated balance sheet. The Company records its share of the results of the JV Company within earnings in equity interest. Because the Company provided nearly all of the capital to form the JV Company, the Company has recorded 100% of the losses incurred by the JV Company within earnings in equity interest in its 2013 consolidated statement of operations. Since acquiring its interest in the JV Company during 2013, the Company has recorded, in retained earnings, cumulative losses in equity interest of $561.
The following tables present summarized financial information for the JV Company:
Year Ended December 31, | |||
2013 | |||
Revenue | $ | — | |
Loss from operations | (561 | ) | |
Net loss | $ | (561 | ) |
As of December 31, | |||
2013 | |||
Total assets | $ | 442 | |
Total liabilities | $ | 77 | |
F- 19
10. STOCK-BASED COMPENSATION
The Company recorded $920, $1,999 and $2,561 of stock-based compensation expense for the years ended December 31, 2011, 2012, and 2013, respectively. No income tax deduction is allowed for incentive stock options ("ISOs"). Accordingly, no deferred income tax asset is recorded for the potential tax deduction related to these options. Expense related to stock option grants of non-qualified stock options ("NSOs") result in a temporary difference, which gives rise to a deferred tax asset.
Total stock-based compensation expense included in the accompanying consolidated statements of operations and comprehensive income for the years ended December 31, 2011, 2012, and 2013, is as follows (in thousands):
2011 | 2012 | 2013 | |||||||||
Research and development | $ | 295 | $ | 523 | $ | 1,184 | |||||
Sales and marketing | 203 | 404 | 348 | ||||||||
General and administrative | 422 | 1,072 | 1,029 | ||||||||
Total stock-based compensation expense | $ | 920 | $ | 1,999 | $ | 2,561 | |||||
Equity Incentive Plans— The Company has four stock option plans (the 2000 Stock Plan, the 2006 Stock Plan, the 2012 Equity Incentive Plan, and the Special Purpose Recruitment Plan), which authorize the Company to grant up to 8,170,359 stock options (ISOs and NSOs), stock appreciation rights, restricted stock, restricted stock units (“RSUs”), and performance cash awards. The ISOs and NSOs will be granted at a price per share not less than the fair value of the Company's common stock at the date of grant. Options granted to date generally vest over a four-year period with 25% vesting at the end of one year and the remaining 75% vesting monthly thereafter. Options granted generally are exercisable up to 10 years. The Company began granting RSUs in December 2012, which generally vest over a four year period with 25% vesting at the end of one year and the remaining 75% vesting quarterly thereafter.
Special Purpose Recruitment Plan — During 2013 our shareholders approved the Special Purpose Recruitment Plan from which equity compensation awards are granted to newly-hired employees. One million shares of common stock are reserved for issuance under this plan.
Stock Option Activity—A summary of stock option activity for the year ended December 31, 2013 is as follows:
Number of Stock Options | Weighted Average Exercise Price | Aggregate Intrinsic Value (in thousands) | Weighted Average Remaining Contractual Term (in years) | |||||||||
Outstanding—January 1, 2013 | 4,510,807 | $ | 4.06 | |||||||||
Granted | 1,622,750 | 3.31 | ||||||||||
Exercised | (166,933 | ) | 1.23 | |||||||||
Forfeited | (196,456 | ) | 6.28 | |||||||||
Outstanding—December 31, 2013 | 5,770,168 | 3.85 | $ | 986 | 7.36 | |||||||
Expected to vest—December 31, 2013 | 5,314,102 | 3.77 | $ | 985 | 7.24 | |||||||
Vested and exercisable—December 31, 2013 | 2,729,728 | 3.24 | $ | 980 | 5.76 | |||||||
Aggregate intrinsic value represents the difference between the Company's closing stock price of its common stock and the exercise price of outstanding, in-the-money options. The Company's closing stock price as reported on the NASDAQ as of December 31, 2013 was $2.45. The total intrinsic value of options exercised was approximately $6,461, $7,622 and $194 for the years ended December 31, 2011, 2012, and 2013, respectively. The weighted-average grant date fair value of options granted was $1.89, $3.97 and $1.86 and for the years ended December 31, 2011, 2012, and 2013, respectively.
As of December 31, 2013, total unrecognized compensation cost, adjusted for estimated forfeitures, related to nonvested stock options was approximately $6,123 which is expected to be recognized over a weighted-average period of 2.71 years.
F- 20
The following table summarizes information about outstanding and vested stock options as of December 31, 2013:
Exercise Price | Weighted Average Remaining Contractual Term (in years) | Number of Options Outstanding | Number of Options Vested and Exercisable | |||||||
$ | 0.04 | 0.40 | 30,000 | 30,000 | ||||||
0.20 | 1.14 | 189,780 | 189,780 | |||||||
0.93 | 3.29 | 57,387 | 57,387 | |||||||
0.93 | 3.12 | 257,162 | 257,162 | |||||||
2.40 | 9.05 | 143,311 | 27,631 | |||||||
2.47 | 9.85 | 210,000 | — | |||||||
2.52 | 3.89 | 556,505 | 556,505 | |||||||
2.53 | 9.96 | 57,500 | — | |||||||
2.58 | 5.00 | 48,069 | 48,069 | |||||||
2.68 | 6.57 | 124,782 | 92,575 | |||||||
2.69 | 9.72 | 101,500 | — | |||||||
2.88 | 7.16 | 502,314 | 326,776 | |||||||
3.12 | 9.20 | 45,000 | — | |||||||
3.23 | 9.47 | 43,000 | — | |||||||
3.25 | 9.57 | 47,500 | — | |||||||
3.32 | 7.63 | 997,791 | 583,084 | |||||||
3.68 | 9.38 | 926,750 | 8,437 | |||||||
3.70 | 7.85 | 83,802 | 46,579 | |||||||
5.55 | 9.13 | 27,500 | — | |||||||
5.82 | 8.97 | 136,500 | 31,213 | |||||||
5.96 | 8.00 | 418,500 | 203,143 | |||||||
6.71 | 8.80 | 17,500 | 4,933 | |||||||
7.10 | 8.29 | 434,728 | 161,337 | |||||||
7.61 | 8.75 | 206,750 | 63,842 | |||||||
11.14 | 8.40 | 56,187 | 22,975 | |||||||
15.00 | 8.55 | 12,250 | 4,082 | |||||||
15.45 | 8.55 | 38,100 | 14,218 | |||||||
5,770,168 | 2,729,728 | |||||||||
RSU Activity—A summary of RSU activity for the year ended December 31, 2013 is as follows:
Number of Shares | Weighted-Average Grant Date Fair Value | |||||
Unvested—January 1, 2013 | 50,000 | 5.82 | ||||
Granted | 7,500 | $ | 3.68 | |||
Released | (12,500 | ) | 5.82 | |||
Forfeited | — | — | ||||
Unvested—December 31, 2013 | 45,000 | $ | 5.46 | |||
Expected to vest —December 31, 2013 | 38,250 | $ | 5.46 | |||
F- 21
As of December 31, 2013, total unrecognized compensation cost, adjusted for estimated forfeitures, related to RSUs was approximately $211, which is expected to be recognized over the next 2.97 years.
Stock-Based Compensation Expense—The fair value of options granted to employees is estimated on the grant date using the Black-Scholes option valuation model. This valuation model for stock-based compensation expense requires the Company to make assumptions and judgments about the variables used in the calculation, including the fair value of the Company's common stock, the expected term (the period of time that the options granted are expected to be outstanding), the volatility of the Company's common stock, a risk-free interest rate, and expected dividends. The Company also estimates forfeitures of unvested stock options. To the extent actual forfeitures differ from the estimates, the difference will be recorded as a cumulative adjustment in the period estimates are revised. No compensation cost is recorded for options that do not vest. The Company uses the simplified calculation of expected life described in the SEC's Staff Accounting Bulletin No. 107, Share-Based Payment, and volatility is based on an average of the historical volatilities of the common stock of several entities with characteristics similar to those of the Company. The risk-free rate is based on the U.S. Treasury yield curve in effect at the time of grant for periods corresponding with the expected life of the option. The Company uses an expected dividend yield of zero, as it does not anticipate paying any dividends in the foreseeable future. Expected forfeitures are based on the
Company's historical experience.
The following table presents the weighted-average assumptions used to estimate the fair value of options granted during the periods presented:
2011 | 2012 | 2013 | ||||||
Volatility | 51 | % | 58 | % | 59 | % | ||
Expected dividend yield | — | — | — | |||||
Risk-free rate | 1.6 | % | 1.4 | % | 1.4 | % | ||
Expected term (in years) | 6.25 | 6.25 | 6.25 | |||||
11. NET INCOME (LOSS) PER COMMON SHARE DATA
Basic net income (loss) per share is computed using the weighted-average number of common shares outstanding during the period. Diluted net income (loss) per share is computed using the weighted-average number of common shares and, if dilutive, potential common shares outstanding during the period. The Company’s potential common shares consist of the incremental common shares issuable upon the exercise of stock options, and to a lesser extent, shares issuable upon the release of RSUs. In addition, for the year ended December 31, 2012, the potential common shares included the conversion of preferred stock on an as if converted basis prior to the Company's initial public offering in February 2012. The dilutive effect of these potential common shares is reflected in diluted earnings per share by application of the treasury stock method. The Company considered its preferred stock to be participating securities and, in accordance with the two-class method, earnings allocated to preferred stock and the related number of outstanding shares of preferred stock were excluded from the computation of basic and diluted net income (loss) per common share.
F- 22
The following table presents the calculation of basic and diluted net income (loss) per share for the years ended December 31, 2011, 2012, and 2013 (in thousands, except share and per share amounts):
Year Ended December 31, | |||||||||||
2011 | 2012 | 2013 | |||||||||
Net income (loss) | $ | 9,932 | $ | 3,815 | $ | (1,367 | ) | ||||
Less: Undistributed earnings allocated to preferred stockholders | (8,583 | ) | — | — | |||||||
Net income (loss) attributable to common stockholders | $ | 1,349 | $ | 3,815 | $ | (1,367 | ) | ||||
Weighted-average common shares used to compute net income (loss) per share attributable to common stockholders | 2,303,443 | 24,411,194 | 27,306,882 | ||||||||
Basic net income (loss) per share | $ | 0.59 | $ | 0.16 | $ | (0.05 | ) | ||||
Diluted net income (loss) per share: | |||||||||||
Net income (loss) | $ | 1,349 | $ | 3,815 | $ | (1,367 | ) | ||||
Add: Undistributed earnings allocated to preferred stockholders | 8,583 | — | — | ||||||||
Net income (loss) attributable to common stockholders | $ | 9,932 | $ | 3,815 | $ | (1,367 | ) | ||||
Number of shares used in basic calculation | 2,303,443 | 24,411,194 | 27,306,882 | ||||||||
Weighted-average effect of dilutive securities: | |||||||||||
Add: | |||||||||||
Conversion of preferred stock (as if converted basis) | 17,395,136 | 1,948,635 | — | ||||||||
Stock options and RSUs (1) | 2,275,824 | 1,737,484 | — | ||||||||
Number of shares used in diluted calculation (1) | 21,974,403 | 28,097,313 | 27,306,882 | ||||||||
Diluted net (loss) income per share attributable to common stockholders | $ | 0.45 | $ | 0.14 | $ | (0.05 | ) | ||||
Note:
(1) | Stock options and RSUs are not included in the calculation of diluted net loss per share for the year ended December 31, 2013 because the Company had a net loss for that year. Accordingly, the inclusion of these equity awards would have had an antidilutive effect on the calculation of diluted loss per share. |
The following equivalent shares were excluded from the calculation of diluted net income (loss) per share because their effect would have been antidilutive for the periods presented:
Year Ended December 31, | ||||||||
2011 | 2012 | 2013 | ||||||
Antidilutive Equity Awards: | ||||||||
Stock options | 367,250 | 137,850 | 3,356,358 | |||||
Total | 367,250 | 137,850 | 3,356,358 | |||||
12. EMPLOYEE BENEFIT PLAN
The Company sponsors a 401(k) profit sharing plan that covers substantially all employees. Under the plan, eligible employees are permitted to contribute a portion of gross compensation not to exceed standard limitations provided by the Internal Revenue Service. The Company maintains the right to match employee contributions; however, no matching contributions were made during the years ended December 31, 2011, 2012, or 2013.
******
F- 23