Attached files
| file | filename |
|---|---|
| EX-1.1 - EX-1.1 - Paycom Software, Inc. | d609623dex11.htm |
| EX-5.1 - EX-5.1 - Paycom Software, Inc. | d609623dex51.htm |
| EX-3.2 - EX-3.2 - Paycom Software, Inc. | d609623dex32.htm |
| EX-3.1 - EX-3.1 - Paycom Software, Inc. | d609623dex31.htm |
| EX-4.1 - EX-4.1 - Paycom Software, Inc. | d609623dex41.htm |
| EX-23.2 - EX-23.2 - Paycom Software, Inc. | d609623dex232.htm |
| EX-23.1 - EX-23.1 - Paycom Software, Inc. | d609623dex231.htm |
| EX-10.6 - EX-10.6 - Paycom Software, Inc. | d609623dex106.htm |
| EX-10.4 - EX-10.4 - Paycom Software, Inc. | d609623dex104.htm |
| EX-10.5 - EX-10.5 - Paycom Software, Inc. | d609623dex105.htm |
Table of Contents
As filed with the Securities and Exchange Commission on March 31, 2014.
Registration No. 333-194462
UNITED STATES
SECURITIES AND EXCHANGE COMMISSION
Washington, D.C. 20549
AMENDMENT NO. 1
TO
FORM S-1
REGISTRATION STATEMENT
UNDER
THE SECURITIES ACT OF 1933
Paycom Software, Inc.
(Exact name of registrant as specified in its charter)
| Delaware | 7372 | 80-0957485 | ||
| (State or other jurisdiction of incorporation or organization) |
(Primary Standard Industrial Classification Code Number) |
(I.R.S. Employer Identification Number) |
7501 W. Memorial Road
Oklahoma City, Oklahoma 73142
(405) 722-6900
(Address, including zip code, and telephone number, including area code, of registrant’s principal executive offices)
Craig E. Boelte
Chief Financial Officer
Paycom Software, Inc.
7501 W. Memorial Road
Oklahoma City, Oklahoma 73142
(405) 722-6900
(Name, address, including zip code, and telephone number, including area code, of agent for service)
Copies to:
| Greg R. Samuel, Esq. Ryan R. Cox, Esq. Haynes & Boone, LLP 2323 Victory Avenue, Suite 700 Dallas, TX 75219 (214) 651-5000 Fax: (214) 200-0577 |
Christian O. Nagler, Esq. Kirkland & Ellis LLP 601 Lexington Avenue New York, NY 10022 (212) 446-4800 Fax: (212) 446-4900 |
Barbara L. Becker, Esq. Gibson, Dunn & Crutcher LLP 200 Park Avenue New York, NY 10166 (212) 351-4000 Fax: (212) 351-6202 |
Approximate date of commencement of proposed sale to the public: As soon as practicable after this registration statement is declared effective.
If any of the securities being registered on this Form are to be offered on a delayed or continuous basis pursuant to Rule 415 under the Securities Act, check the following box: ¨
If this Form is filed to register additional securities for an offering pursuant to Rule 462(b) under the Securities Act, please check the following box and list the Securities Act registration statement number of the earlier effective registration statement for the same offering. ¨
If this Form is a post-effective amendment filed pursuant to Rule 462(c) under the Securities Act, check the following box and list the Securities Act registration statement number of the earlier effective registration statement for the same offering. ¨
If this Form is a post-effective amendment filed pursuant to Rule 462(d) under the Securities Act, check the following box and list the Securities Act registration statement number of the earlier effective registration statement for the same offering. ¨
Indicate by check mark whether the registrant is a large accelerated filer, an accelerated filer, a non-accelerated filer, or a smaller reporting company. See the definitions of “large accelerated filer,” “accelerated filer” and “smaller reporting company” in Rule 12b-2 of the Exchange Act. (Check one):
| Large accelerated filer | ¨ | Accelerated filer | ¨ | |||
| Non-accelerated filer | x (Do not check if a smaller reporting company) | Smaller reporting company | ¨ | |||
CALCULATION OF REGISTRATION FEE
|
| ||||||||
| Title of each class of securities to be registered |
Amount to
be |
Proposed Maximum Offering Price Per Share |
Proposed Maximum Aggregate Offering Price(1)(2) |
Amount of Registration Fee(3) | ||||
| Common Stock, $0.01 par value per share |
7,641,750 |
$20.00 |
$152,835,000 | $19,686 | ||||
|
| ||||||||
|
| ||||||||
| (1) | Estimated pursuant to Rule 457(a) of the Securities Act of 1933, as amended. |
| (2) | Includes additional shares subject to the underwriters’ option. |
| (3) | The registrant previously paid $12,880 of the registration fee in connection with a prior filing of this registration statement. |
The registrant hereby amends this registration statement on such date or dates as may be necessary to delay its effective date until the registrant shall file a further amendment which specifically states that this registration statement shall thereafter become effective in accordance with Section 8(a) of the Securities Act of 1933, as amended, or until the registration statement shall become effective on such date as the Securities and Exchange Commission, acting pursuant to said Section 8(a), may determine.
Table of Contents
The information in this preliminary prospectus is not complete and may be changed. Neither we nor the selling stockholders may sell these securities until the registration statement filed with the Securities and Exchange Commission is effective. This preliminary prospectus is not an offer to sell these securities and it is not soliciting an offer to buy these securities in any jurisdiction where the offer or sale is not permitted.
Subject to Completion, dated March 31, 2014
Preliminary Prospectus
6,645,000 Shares

Paycom Software, Inc.
Common Stock
This is the initial public offering of Paycom Software, Inc. We are offering 4,606,882 shares of our common stock and the selling stockholders are offering 2,038,118 shares of our common stock. We will not receive any proceeds from the sale of shares by the selling stockholders. Currently, no public market exists for the shares. The estimated initial public offering price is between $18.00 and $20.00 per share.
Our common stock has been approved for listing on the New York Stock Exchange, or the NYSE, under the symbol “PAYC.”
We are an “emerging growth company” as defined under the federal securities laws and, as such, may elect to comply with certain reduced public company reporting requirements in future reports after the completion of this offering.
Investing in our common stock involves risks. See “Risk Factors” beginning on page 12.
| Per share | Total | |||||||
| Initial public offering price |
$ | $ | ||||||
| Underwriting discounts and commissions |
$ | $ | ||||||
| Proceeds, before expenses, to us |
$ | $ | ||||||
| Proceeds, before expenses, to the selling stockholders |
$ | $ | ||||||
To the extent that the underwriters sell more than 6,645,000 shares of common stock, the underwriters have the option to purchase up to an additional 996,750 shares of common stock from the selling stockholders at the initial public offering price less underwriting discounts and commissions.
Neither the Securities and Exchange Commission nor any state securities commission has approved or disapproved of these securities or passed upon the accuracy or adequacy of this prospectus. Any representation to the contrary is a criminal offense.
The underwriters expect to deliver the shares on or about , 2014.
| Barclays | J.P. Morgan |
| Pacific Crest Securities | Stifel | Canaccord Genuity | ||
Prospectus dated , 2014
Table of Contents
Table of Contents
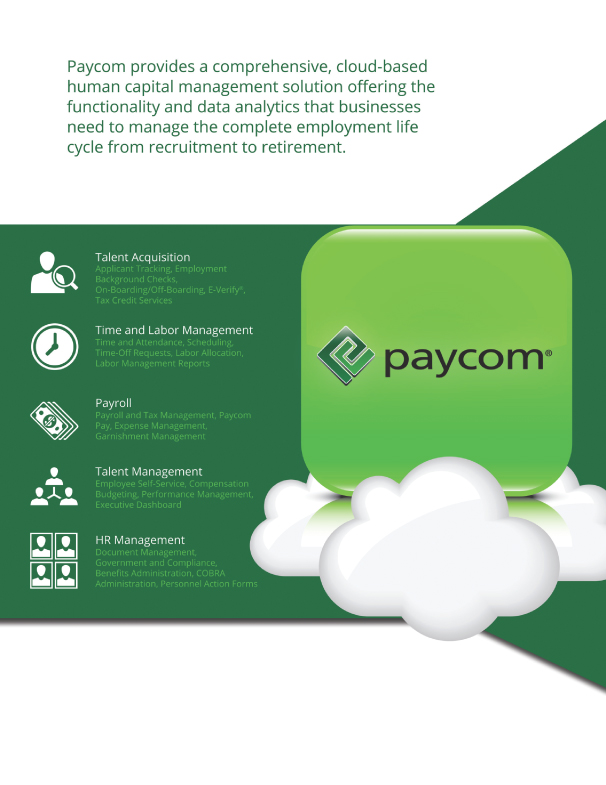
Table of Contents

Table of Contents
| 1 | ||||
| 12 | ||||
| 29 | ||||
| 30 | ||||
| 31 | ||||
| 32 | ||||
| 33 | ||||
| 34 | ||||
| 35 | ||||
| 37 | ||||
| UNAUDITED PRO FORMA CONDENSED CONSOLIDATED FINANCIAL INFORMATION |
39 | |||
| MANAGEMENT’S DISCUSSION AND ANALYSIS OF FINANCIAL CONDITION AND RESULTS OF OPERATIONS |
47 | |||
| 66 | ||||
| 80 | ||||
| 86 | ||||
| 100 | ||||
| 105 | ||||
| 107 | ||||
| 112 | ||||
| MATERIAL U.S. FEDERAL INCOME AND ESTATE TAX CONSIDERATIONS FOR NON-U.S. HOLDERS |
114 | |||
| 117 | ||||
| 124 | ||||
| 124 | ||||
| 124 | ||||
| F-1 |
You should rely only on the information contained in this prospectus or in any free writing prospectus we have prepared. We, the selling stockholders and the underwriters (and any of our or their affiliates) have not authorized anyone to provide any information or to make any representations other than those contained in this prospectus or in any free writing prospectus we have prepared. We, the selling stockholders and the underwriters (and any of our or their affiliates), take no responsibility for and can provide no assurance as to the reliability of any other information that others may give you. We are offering to sell and seeking offers to buy shares of our common stock only in jurisdictions where offers and sales are permitted. The information in this prospectus is accurate only as of the date of this prospectus, regardless of the time of delivery of this prospectus or any sale of shares of our common stock. Our business, financial condition, results of operations and prospects may have changed since that date.
Until , 2014 (25 days after the date of this prospectus), all dealers that buy, sell or trade shares of our common stock, whether or not participating in our initial public offering, may be required to deliver a prospectus. This delivery requirement is in addition to the obligation of dealers to deliver a prospectus when acting as underwriters and with respect to their unsold allotments or subscriptions.
For investors outside the United States: We, the selling stockholders and the underwriters (and any of our or their affiliates), have not done anything that would permit this offering or possession or distribution of this prospectus in any jurisdiction where action for that purpose is required, other than in the United States. Persons outside the United States who come into possession of this prospectus must inform themselves about and observe any restrictions relating to the offering of the shares of our common stock and the distribution of this prospectus outside of the United States.
i
Table of Contents
This summary highlights selected information contained elsewhere in this prospectus, but it does not contain all of the information that you should consider before deciding to invest in our common stock. You should read the entire prospectus carefully before making an investment in our common stock, including “Risk Factors,” “Management’s Discussion and Analysis of Financial Condition and Results of Operations” and our consolidated financial statements and the related notes thereto, which are included elsewhere in this prospectus. Some of the statements in this prospectus constitute forward-looking statements. For more information, see “Special Note Regarding Forward-Looking Statements.”
Unless we state otherwise or the context otherwise requires, the terms “Paycom,” “we,” “us,” “our” and the “Company” refer, prior to the Reorganization discussed in the section entitled “The Reorganization,” to Paycom Payroll Holdings, LLC, or Holdings, and its consolidated subsidiaries and, after the Reorganization, to Paycom Software, Inc., or Software, a recently formed Delaware corporation, and its consolidated subsidiaries, including Holdings. Software is a recently formed company that did not engage in any business or other activities prior to the Reorganization, except in connection with its formation. Accordingly, all financial and other information herein relating to periods prior to the Reorganization is that of, or derived from, Holdings. See “The Reorganization.”
Overview
We are a leading provider of a comprehensive, cloud-based human capital management, or HCM, software solution delivered as Software-as-a-Service, or SaaS. We provide functionality and data analytics that businesses need to manage the complete employment life cycle from recruitment to retirement. Our solution requires virtually no customization and is based on a core system of record maintained in a single database for all HCM functions, including talent acquisition, time and labor management, payroll, talent management and human resources, or HR, management applications. Our user-friendly software allows for easy adoption of our solution by employees, enabling self-management of their HCM activities in the cloud, which reduces the administrative burden on employers and increases employee productivity.
Organizations need sophisticated, flexible and intuitive applications that can quickly adapt to their evolving HCM requirements, streamline their HR processes and systems and enable them to control costs. We believe that the HCM needs of most organizations are currently served either by legacy providers offering outdated on-premise products or multiple providers that partner together in an attempt to replicate a comprehensive product. These approaches often result in large up-front capital requirements, extended delivery times, high costs, low scalability and challenges with system integration. According to the International Data Corporation, or IDC, the U.S. markets for payroll services and HCM applications will collectively total approximately $22.5 billion in 2014, and we believe there is a substantial opportunity for our solution to address these HCM needs.
Because our solution was developed in-house and is based on a single platform, there is no need to integrate, update or access multiple databases, which are common issues with competitor offerings that use multiple third-party systems in order to link together their HCM offerings. Additionally, our solution maintains data integrity for accurate, actionable and real-time analytics and business intelligence and helps clients minimize the risk of compliance errors due to inaccurate or missing information. We deliver feature-rich applications while maintaining excellence in information security and quality management standards as evidenced by our International Organization for Standardization, or ISO, certifications. As a part of our client retention effort, a specialist within a dedicated team is assigned to each client to provide industry-leading, personalized service.
The key benefits of our differentiated solution as compared to competing products are:
| • | Comprehensive HCM solution; |
1
Table of Contents
| • | Core system of record enabling data analytics maintained on a single database; |
| • | Personalized support provided by trained personnel; |
| • | Software-as-a-Service delivery model; |
| • | Cloud-based architecture; and |
| • | Scalability to grow with our clients. |
We sell our solution directly through our internally trained, client-focused and highly skilled sales force based in offices across the United States. We have over 10,000 clients, none of which constituted more than one-half of one percent of our revenues for the year ended December 31, 2013. We believe that as a result of our focus on client retention, we enjoy high client satisfaction as evidenced by an average annual revenue retention rate of 91% from existing clients for the three years ended December 31, 2013. We believe our revenue retention rate understates our client loyalty because this rate also includes former clients that were acquired or otherwise ceased operations.
Since our founding in Oklahoma City in 1998, we have focused on providing an innovative SaaS HCM solution. As of December 31, 2013, we had 840 employees across the United States. For the years ended December 31, 2013, 2012 and 2011, our revenues were $107.6 million, $76.8 million, and $57.2 million, respectively, representing year-over-year growth in revenues of 40% and 34%, respectively. We currently derive most of our revenues from our payroll and tax management applications, which we refer to as payroll processing. We realized net income of $7.7 million, $4.2 million and $1.4 million for the years ended December 31, 2013, 2012 and 2011, respectively.
Industry Background
Large Market Opportunity for HCM Technologies
According to IDC, the U.S. market for HCM applications is comprised of software that automates business processes covering the entire span of an employee’s relationship with his or her employer. IDC estimates that this market, excluding payroll services, will total $5.8 billion in 2014. According to IDC, the U.S. market for payroll services will be an estimated $16.2 billion in 2014. IDC estimates that the international market for HCM applications (excluding the United States) will be $4.1 billion in 2014.
Economic and Technological Trends Are Driving Demand for HCM Solutions
Organizations operating in today’s global economy are continually under pressure to reduce operating costs in order to maintain or improve their competitive positions. As a result, businesses are increasingly making the strategic decision to leverage HCM technologies in order to improve the effectiveness and efficiency of their internal HR and accounting functions and capture opportunities for cost savings. According to IBISWorld, companies often outsource administrative services, such as time and labor management, after initially outsourcing payroll. We believe that businesses increasingly view data concerning their human capital as a critical strategic resource that can result in more informed decision-making.
Organizations are also managing internal costs and administrative burdens by transitioning technological assets from on-premise to the cloud. The rise of cloud computing has supported the SaaS delivery model. According to IDC, the global SaaS market is projected to grow from $23 billion in 2011 to $67 billion in 2016, at a compounded annual growth rate, or CAGR, of 24%.
Incumbent HCM Products Struggle To Meet the Needs of Businesses
We believe that a majority of businesses and organizations in the United States are using multiple HCM systems from more than one vendor, thereby impeding their ability to share data across these systems. Several
2
Table of Contents
incumbent payroll and HCM vendors offer product sets that are comprised of separate systems that require integration. In certain cases, this disparate product offering across several vendors is the result of several acquisitions which often leads to a loosely coupled product set that is marked by significant architectural differences and weak data integration. We believe that this type of offering increases the risk of user or system error and reduces overall effectiveness. Finally, we believe that vendors who pursue market segmentation strategies based on organization size or industry create difficulties for clients who grow, either in size or industry scope, beyond the confines of those vendors’ offerings. A scalable HCM solution based on a core system of record allows for an organization to grow in size and scope without transitioning to a new user interface or back-end database.
The Paycom Solution
We offer an end-to-end SaaS HCM solution that provides our clients and their employees with immediate access to accurate and secure information and analytics 24 hours a day, seven days a week from any location. We believe that our solution delivers the following benefits:
| • | Comprehensive HCM Solution. Our solution offers functionality that manages the entire employment life cycle for employers and employees, from recruitment to retirement. Our user-friendly applications streamline client processes and provide clients and their employees with the ability to directly access and manage administrative processes, including applications that identify candidates, onboard employees, manage time and labor, administer payroll deductions and benefits, manage performance, offboard employees and administer post-termination health benefits such as COBRA. |
| • | Core System of Record. Our solution is based on a core system of record that contains payroll and HR information in one convenient database, thereby reducing costs and eliminating the need for multiple software products and vendors and the maintenance of employee data in numerous databases. In addition, our core system of record helps clients minimize the risk of compliance errors due to inaccurate or missing information that results from maintaining multiple databases. |
| • | Data Analytics. Our solution allows clients to analyze accurate employee information to make business decisions based upon actionable, real-time, point-and-click analytics provided through our client dashboard. This functionality helps our clients operate with a more complete and accurate picture of their organization as our solution’s embedded analytics capture the content and context of everyday business events, facilitating fast and informed decision-making from any location. |
| • | Personalized Support Provided by Trained Personnel. Our applications are supported by one-on-one personal assistance from trained specialists. We strive to provide our clients with high levels of service and support to ensure their continued use of our solution for all of their HCM needs. We have maintained high client satisfaction, as evidenced by an average annual revenue retention rate of 91% from existing clients for the three years ended December 31, 2013. |
| • | Software-as-a-Service Delivery Model. Our SaaS delivery model allows clients with a geographically dispersed and mobile workforce to operate more efficiently, and allows these clients to implement, access and use our client-oriented Internet solution on demand and remotely through standard web browsers, smart phones, tablets and other web-enabled devices. |
| • | Secure Cloud-Based Architecture. Our cloud-based architecture allows our solution to be implemented remotely with minimal client interaction, allowing our clients to make a smaller investment in hardware, personnel, implementation time and consulting. |
| • | Scalability to Grow with our Clients. Our solution is highly scalable. We have served a diversified client base ranging in size from one to more than 8,000 employees. Our clients are able to use the same solution while their businesses grow by deploying applications as-needed in real-time. |
3
Table of Contents
Our Strategy for Growth
Our strategy is to continue to establish our solution as the HCM industry standard. To accomplish this, we intend to:
| • | Increase Our Presence in Existing Markets. Although we have clients in all 50 states, we believe a significant opportunity exists to expand our presence within markets where we currently have a sales office. We have a sales office in 24 of the 50 largest Metropolitan Statistical Areas, or MSAs, in the United States based on 2010 U.S. census data, only one of which is served by multiple sales teams. We believe that the 50 largest MSAs in the United States could collectively support at least 100 additional sales teams. Each sales office is typically staffed with one sales team, with each team comprised of approximately seven to nine sales professionals. We plan to increase our presence in our existing markets by adding sales offices and increasing the number of our sales teams to further penetrate and effectively capture these markets. |
| • | Expand Into Additional Markets. We plan to continue expanding our sales capability by opening sales offices in certain metropolitan areas where we currently have no sales teams. We have identified 50 untapped metropolitan areas where we can potentially open a new sales office staffed with at least one sales team. Since September 2012, we have opened sales offices in Baltimore, Detroit, Indianapolis, Minneapolis, New York, Philadelphia, San Francisco, Seattle and Silicon Valley. We intend to open six to eight additional offices over the next two years, as well as potentially expand over the longer term into international markets. |
| • | Enlarge our Existing Client Relationships. We believe a significant growth opportunity exists in selling additional applications to our current clients. During the year ended December 31, 2013, all of our clients, including our new clients, on average utilized 5.2 of our 18 then available applications. During that same period, however, new clients on average utilized 6.2 applications. We believe that there is a significant opportunity to sell additional applications to our existing clients. As we extend and strengthen the functionality of our solution, we will continue to invest in initiatives to increase the adoption of our solution and maintain our high levels of client satisfaction. |
| • | Target Larger Clients. We believe larger employers represent a substantial opportunity to increase the number of clients and to increase our revenue per client, with limited incremental cost to us. To further capitalize on this opportunity, we intend to target larger businesses opportunistically. |
| • | Maintain Our Leadership in Innovation by Strengthening and Extending our Solution. We intend to continue to use our in-house development efforts, which are heavily based upon proactive research and client input, to extend the functionality and range of our solution in the future. |
Selected Risks Associated with Our Business
Our business is subject to a number of risks and uncertainties, including those highlighted in the section “Risk Factors” immediately following this prospectus summary. Some of these risks include:
| • | Our business depends substantially on our clients’ continued use of our applications, their purchases of additional applications from us and our ability to add new clients. |
| • | The market in which we participate is highly competitive, and if we do not compete effectively, our business, operating results or financial condition could be adversely affected. |
| • | We have historically derived a majority of our revenue from payroll processing and our efforts to increase the use of our other HCM applications may not be successful and may reduce our revenue growth rate. |
4
Table of Contents
| • | If our security measures are breached or unauthorized access to data of our clients or their employees is otherwise obtained, our solution may not be perceived as being secure, clients may reduce, limit or stop using our solution and we may incur significant liabilities. |
| • | If the SaaS market develops more slowly than we expect or declines, our growth may slow or stall, and our business could be adversely affected. |
| • | If we are not able to develop enhancements or new applications, keep pace with technological developments or respond to future disruptive technologies, our business could be adversely affected. |
| • | Our business and operations are experiencing rapid growth and organizational change and if we fail to manage our growth effectively, we may be unable to execute our business plan, maintain high levels of satisfaction or adequately address competitive challenges. |
| • | Our financial results may fluctuate due to many factors, some of which may be beyond our control. |
Our Principal Stockholders
Following the completion of this offering, Welsh, Carson, Anderson & Stowe X, L.P., or WCAS X, WCAS Capital Partners IV, L.P., or WCAS Capital IV, and WCAS Management Corporation, together with WCAS X and WCAS Capital IV, the WCAS Funds, which are affiliates of Welsh, Carson, Anderson & Stowe, L.P., or Welsh, Carson, Anderson & Stowe, will own approximately 57.8% of our outstanding common stock, or 55.8% if the underwriters exercise in full their option to purchase additional shares. In addition, following the completion of this offering, the WCAS Funds and the other parties to the Amended and Restated Stockholders Agreement, or the Stockholders Agreement, will own approximately 81.7% of our outstanding shares of common stock, or 79.7% of our outstanding shares of common stock if the underwriters exercise in full their option to purchase additional shares. As a result of this ownership and the provisions of the Stockholders Agreement, the WCAS Funds will have control over votes on fundamental and significant corporate matters and transactions.
So long as the parties to the Stockholders Agreement own a majority of our outstanding shares of common stock, we will be a “controlled company” under the NYSE Listed Company Manual. Under these standards, a company of which more than 50% of the voting power for the election of directors is held by another company or group is a “controlled company” that is not required to comply with certain corporate governance requirements. We intend to rely on certain exemptions following the offering, and may rely on any of these exemptions for so long as we are a “controlled company.” See “Risk Factors—Risks Related to This Offering and Ownership of Our Common Stock” and “Certain Relationships and Related Party Transactions—Stockholders Agreement.”
Welsh, Carson, Anderson & Stowe is a leading U.S. private equity investor focused on information/business services and healthcare. Welsh, Carson, Anderson & Stowe has raised and managed $20 billion in capital and has a current portfolio of over 30 companies.
Corporate Information
We were founded in 1998. Software is a Delaware corporation that was formed in October 2013 to undertake this offering. Our principal executive offices are located at 7501 W. Memorial Road, Oklahoma City, Oklahoma 73142 and our telephone number is (405) 722-6900. Our website is www.paycom.com. Information contained on our website or that can be accessed through our website is not incorporated by reference in this prospectus.
“Paycom,” the Paycom logo and other trademarks or service marks of Paycom appearing in this prospectus are the property of Paycom. Trade names, trademarks and service marks of other companies appearing in this prospectus are the property of their respective holders.
5
Table of Contents
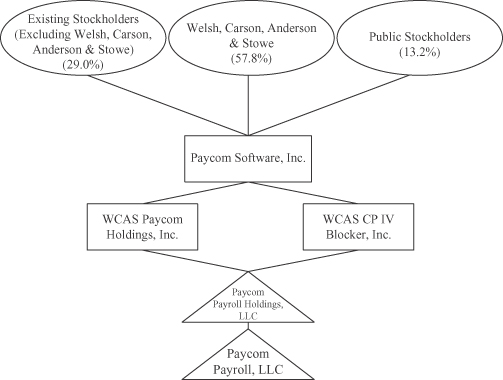
The Reorganization
Software is a newly formed Delaware corporation. In anticipation of this offering, we consummated the Reorganization (as defined herein), effective as of January 1, 2014. For additional information concerning the Reorganization, see “The Reorganization.”
The following diagram depicts our corporate structure immediately after the completion of this offering. We will directly or indirectly hold 100% of the ownership interests in each of our subsidiaries:
6
Table of Contents
THE OFFERING
| Common stock offered by us |
4,606,882 shares |
| Common stock offered by the selling stockholders |
2,038,118 shares |
| Option to purchase additional shares of common stock |
The selling stockholders have granted the underwriters an option, exercisable for 30 days after the date of this prospectus, to purchase up to an additional 996,750 shares of common stock. |
| Shares outstanding after the offering |
50,333,739 shares |
| Use of proceeds |
We estimate that our net proceeds from the sale of the common stock that we are offering will be approximately $78.0 million, assuming an initial public offering price of $19.00 per share, which is the midpoint of the price range on the cover page of this prospectus, and after deducting estimated underwriting discounts and commissions and estimated offering expenses payable by us. We intend to use the net proceeds from this offering for (i) the repayment of a 10% Senior Note due 2022 issued by us to an affiliate of Welsh, Carson, Anderson & Stowe in the amount of approximately $18.8 million, (ii) the repayment of a 14% Note due 2017 issued by WCAS Paycom Holdings, Inc., or WCAS Holdings, that we assumed in connection with the Reorganization in the amount of approximately $46.2 million (including certain payments made pursuant to a contribution agreement) and (iii) general corporate purposes, including additions to working capital and capital expenditures. See “Use of Proceeds.” |
| We will not receive any proceeds from the sale of shares offered by the selling stockholders, who include a director and entities affiliated with members of our board of directors. |
| Dividend policy |
We do not currently plan to pay a regular dividend on our common stock following this offering. See “Dividend Policy.” |
| Risk factors |
See “Risk Factors” beginning on page 12 and the other information included elsewhere in this prospectus for a discussion of factors you should carefully consider before deciding to invest in our common stock. |
| Directed Share Program |
At our request, the underwriters have reserved for sale at the initial public offering price up to 5% of the shares offered hereby for our officers, directors, employees, clients, suppliers, vendors and friends and relatives of our employees. The number of shares available for sale to the general public will be reduced to the extent such persons purchase such reserved shares. Chad Richison, our president, chief executive officer and director, Craig E. Boelte, our chief financial officer, William X. Kerber III, our chief information officer, and |
7
Table of Contents
| Frederick C. Peters II, our director, on behalf of themselves and certain of their affiliates, have indicated an interest in purchasing an aggregate of up to approximately $1.3 million in shares of our common stock in this offering pursuant to the Directed Share Program. Any reserved shares not so purchased will be offered by the underwriters to the general public on the same basis as the others offered hereby. Any participants will be prohibited from selling, pledging or assigning any shares sold to them pursuant to this program for a period of 180 days after the date of this prospectus. The Directed Share Program will be arranged through our lead underwriter, Barclays Capital Inc. |
| NYSE trading symbol |
“PAYC” |
In this prospectus, unless otherwise indicated, the number of shares of common stock outstanding and the other information based thereon:
| • | exclude 8,081,447 shares of restricted common stock that are subject to time-based or performance-based vesting conditions, including 217,378 shares of restricted stock that vest upon the sale of our common stock in the initial public offering; |
| • | exclude 3,269,434 shares of our common stock reserved for future issuance under the Paycom Software, Inc. 2014 Long-Term Incentive Plan, or the 2014 Plan, that we adopted in connection with the Reorganization; and |
| • | do not reflect any exercise by the underwriters of their option to purchase 996,750 additional shares of our common stock from the selling stockholders. |
8
Table of Contents
SUMMARY CONSOLIDATED FINANCIAL DATA
The following table summarizes our consolidated financial data as of the dates and for the periods indicated. We have derived the summary consolidated statements of income data for the years ended December 31, 2013, 2012 and 2011 and the summary consolidated balance sheet data as of December 31, 2013 and 2012 from our audited consolidated financial statements included elsewhere in this prospectus. Historical results are not necessarily indicative of results for any future period. We have derived the summary unaudited pro forma condensed consolidated financial data for the years ended December 31, 2013, 2012 and 2011 from the unaudited pro forma condensed consolidated financial statements set forth under “Unaudited Pro Forma Condensed Consolidated Financial Information.”
The summary consolidated financial data set forth below should be read together with “Capitalization,” “Selected Consolidated Financial Data,” “Management’s Discussion and Analysis of Financial Condition and Results of Operations,” “Unaudited Pro Forma Condensed Consolidated Financial Information” and our consolidated financial statements and the related notes thereto, which are included elsewhere in this prospectus. The following tables summarize our consolidated and pro forma results:
| Pro forma(4) | ||||||||||||||||||||||||
| Year Ended December 31, |
Year Ended December 31, |
|||||||||||||||||||||||
| 2013 | 2012 | 2011 | 2013 | 2012 | 2011 | |||||||||||||||||||
| (in thousands, except per unit and share data) | ||||||||||||||||||||||||
| Consolidated statement of income data: |
||||||||||||||||||||||||
| Revenues |
$ | 107,601 | $ | 76,810 | $ | 57,206 | $ | 107,601 | $ | 76,810 | $ | 57,206 | ||||||||||||
| Expenses(1) |
||||||||||||||||||||||||
| Cost of revenues: |
||||||||||||||||||||||||
| Operating expenses |
19,070 | 14,895 | 12,287 | 19,070 | 14,895 | 12,287 | ||||||||||||||||||
| Depreciation |
1,821 | 1,431 | 987 | 1,821 | 1,431 | 987 | ||||||||||||||||||
|
|
|
|
|
|
|
|
|
|
|
|
|
|||||||||||||
| Total cost of revenues |
20,891 | 16,326 | 13,274 | 20,891 | 16,326 | 13,274 | ||||||||||||||||||
| Administrative expenses: |
||||||||||||||||||||||||
| Sales and marketing |
42,681 | 29,255 | 22,244 | 42,681 | 29,255 | 22,244 | ||||||||||||||||||
| Research and development |
2,146 | 1,632 | 1,225 | 2,146 | 1,632 | 1,225 | ||||||||||||||||||
| General and administrative |
28,884 | 19,450 | 14,707 | 29,191 | 19,452 | 14,714 | ||||||||||||||||||
| Depreciation and amortization |
3,682 | 4,092 | 4,300 | 3,682 | 4,092 | 4,300 | ||||||||||||||||||
|
|
|
|
|
|
|
|
|
|
|
|
|
|||||||||||||
| Total administrative expenses |
77,393 | 54,429 | 42,476 | 77,700 | 54,431 | 42,483 | ||||||||||||||||||
|
|
|
|
|
|
|
|
|
|
|
|
|
|||||||||||||
| Operating income |
9,317 | 6,055 | 1,456 | 9,010 | 6,053 | 1,449 | ||||||||||||||||||
| Interest expense |
(2,805 | ) | (2,171 | ) | (134 | ) | (683 | ) | (774 | ) | (134 | ) | ||||||||||||
| Other income, net |
1,199 | 354 | 108 | 553 | 36 | 108 | ||||||||||||||||||
|
|
|
|
|
|
|
|
|
|
|
|
|
|||||||||||||
| Income before income taxes |
7,711 | 4,238 | 1,430 | 8,880 | 5,315 | 1,423 | ||||||||||||||||||
| Provision for income taxes |
— | — | — | 3,462 | 2,068 | 573 | ||||||||||||||||||
|
|
|
|
|
|
|
|
|
|
|
|
|
|||||||||||||
| Net income |
7,711 | $ | 4,238 | $ | 1,430 | 5,418 | $ | 3,247 | $ | 850 | ||||||||||||||
|
|
|
|
|
|
|
|
|
|
|
|
|
|||||||||||||
| Less: Distribution to Series C Preferred Unitholder |
|
(6,467 |
) |
(4,806 | ) | — | ||||||||||||||||||
|
|
|
|
|
|
|
|||||||||||||||||||
| Net income (loss) available to Series A Preferred Unitholders and common unit holders |
1,244 | $ | (568 | ) | $ | 1,430 | ||||||||||||||||||
|
|
|
|
|
|
|
|||||||||||||||||||
| Net income (loss) per Series A Preferred Unit and common unit/share(2) |
||||||||||||||||||||||||
| Basic |
$ | 1.30 | $ | (0.60 | ) | $ | 1.53 | $ | 0.11 | $ | 0.06 | $ | 0.02 | |||||||||||
|
|
|
|
|
|
|
|
|
|
|
|
|
|||||||||||||
| Diluted |
$ | 1.22 | $ | (0.57 | ) | $ | 1.49 | $ | 0.10 | $ | 0.06 | $ | 0.02 | |||||||||||
|
|
|
|
|
|
|
|
|
|
|
|
|
|||||||||||||
| Weighted average units/shares outstanding(2) |
||||||||||||||||||||||||
| Basic |
955,983 | 948,181 | 935,750 | 51,107,379 | 51,107,379 | 51,107,379 | ||||||||||||||||||
|
|
|
|
|
|
|
|
|
|
|
|
|
|||||||||||||
| Diluted |
1,018,305 | 1,004,436 | 960,611 | 51,792,542 | 51,792,542 | 51,792,542 | ||||||||||||||||||
|
|
|
|
|
|
|
|
|
|
|
|
|
|||||||||||||
| Other financial data: |
||||||||||||||||||||||||
| EBITDA(3) |
$ | 16,019 | $ | 11,932 | $ | 6,851 | $ | 15,066 | $ | 11,612 | $ | 6,844 | ||||||||||||
|
|
|
|
|
|
|
|
|
|
|
|
|
|||||||||||||
| Adjusted EBITDA(3) |
$ | 19,700 | $ | 12,751 | $ | 7,016 | $ | 18,747 | $ | 12,431 | $ | 7,009 | ||||||||||||
|
|
|
|
|
|
|
|
|
|
|
|
|
|||||||||||||
9
Table of Contents
| As of December 31, | ||||||||
| 2013 | 2012 | |||||||
| (in thousands) |
||||||||
| Consolidated balance sheet data: |
||||||||
| Cash and cash equivalents |
$ | 13,273 | $ | 13,435 | ||||
| Restricted cash |
369 | 368 | ||||||
| Working capital (deficit)(5) |
(7,933 | ) | 5,096 | |||||
| Property, plant and equipment, net |
38,671 | 25,139 | ||||||
| Deferred revenue |
12,572 | 8,393 | ||||||
| Long-term debt, including current portion |
21,090 | 14,110 | ||||||
| Long-term debt due to related party |
14,682 | 14,440 | ||||||
| Member’s capital |
63,645 | 63,542 | ||||||
| Common stock |
— | — | ||||||
| Accumulated deficit |
(13,385 | ) | (8,871 | ) | ||||
| Total members’ equity |
50,260 | 54,671 | ||||||
| (1) | Incentive-based compensation expense included in the consolidated statements of income data above was as follows: |
| Year Ended December 31, |
||||||||||||
| 2013 | 2012 | 2011 | ||||||||||
| (in thousands) | ||||||||||||
| Cost of revenues (operating expenses) |
$ | 222 | $ | 87 | $ | 36 | ||||||
| Sales and marketing |
114 | 83 | 57 | |||||||||
| Research and development |
345 | 100 | 25 | |||||||||
| General and administrative |
253 | 233 | 47 | |||||||||
|
|
|
|
|
|
|
|||||||
| $ | 934 | $ | 503 | $ | 165 | |||||||
|
|
|
|
|
|
|
|||||||
| (2) | Net income (loss) per Series A Preferred Unit and common unit and weighted average units outstanding represent the earnings per unit reported in the consolidated statements of income for the years ended December 31, 2013, 2012 and 2011 that are included elsewhere in this prospectus. Pro forma net income per share of common stock and the weighted average shares of common stock outstanding reflect the estimated number of shares of common stock we expect to have outstanding upon the completion of this offering as discussed in Note (4) below. |
| (3) | We use earnings before interest, tax, depreciation and amortization, or EBITDA, and Adjusted EBITDA as supplemental measures to review and assess our performance. We define EBITDA as net income, plus interest expense and depreciation and amortization and Adjusted EBITDA as net income, plus interest expense, depreciation and amortization, incentive-based compensation expense and certain transaction expenses that are not core to the Company’s operations. EBITDA and Adjusted EBITDA are metrics that we believe are useful to investors in evaluating our operating performance and facilitating comparison with other peer companies, many of which use similar non-GAAP financial measures to supplement results under accounting principles generally accepted in the United States of America, or U.S. GAAP. |
EBITDA and Adjusted EBITDA are not measures of financial performance under U.S. GAAP, and should not be considered a substitute for net income, which we consider to be the most directly comparable U.S. GAAP measure. EBITDA and Adjusted EBITDA have limitations as analytical tools, and when assessing our operating performance, you should not consider EBITDA or Adjusted EBITDA in isolation, or as a substitute for net income or other consolidated statements of income data prepared in accordance with U.S. GAAP. EBITDA and Adjusted EBITDA may not be comparable to similar titled measures of other companies and other companies may not calculate such measures in the same manner as we do.
The following table reconciles net income to EBITDA and Adjusted EBITDA and pro forma net income to pro forma EBITDA and pro forma Adjusted EBITDA:
| Pro forma(4) | ||||||||||||||||||||||||
| Year Ended December 31, |
Year Ended December 31, |
|||||||||||||||||||||||
| 2013 | 2012 | 2011 | 2013 | 2012 | 2011 | |||||||||||||||||||
| Consolidated statements of income data: |
(in thousands) | |||||||||||||||||||||||
| Net income |
$ | 7,711 | $ | 4,238 | $ | 1,430 | $ | 5,418 | $ | 3,247 | $ | 850 | ||||||||||||
| Interest expense |
2,805 | 2,171 | 134 | 683 | 774 | 134 | ||||||||||||||||||
| Taxes |
— | — | — | 3,462 | 2,068 | 573 | ||||||||||||||||||
| Depreciation and amortization |
5,503 | 5,523 | 5,287 | 5,503 | 5,523 | 5,287 | ||||||||||||||||||
|
|
|
|
|
|
|
|
|
|
|
|
|
|||||||||||||
| EBITDA |
16,019 | 11,932 | 6,851 | 15,066 | 11,612 | 6,844 | ||||||||||||||||||
| Incentive-based compensation expense(a) |
934 | 503 | 165 | 934 | 503 | 165 | ||||||||||||||||||
| Transaction expenses(b) |
2,747 | 316 | — | 2,747 | 316 | — | ||||||||||||||||||
|
|
|
|
|
|
|
|
|
|
|
|
|
|||||||||||||
| Adjusted EBITDA |
$ | 19,700 | $ | 12,751 | $ | 7,016 | $ | 18,747 | $ | 12,431 | $ | 7,009 | ||||||||||||
|
|
|
|
|
|
|
|
|
|
|
|
|
|||||||||||||
10
Table of Contents
| (a) | Represents incentive-based compensation expense reflected in Note (1) above. Pro forma incentive-based compensation expense is the same as that reported under the historical periods as there are no pro forma adjustments to incentive-based compensation expense recorded in our consolidated statements of income for the years ended December 31, 2013, 2012 and 2011. |
| (b) | Represents one-time transaction expenses associated with the April 2012 Corporate Reorganization (as defined herein) and indirect incremental legal and accounting costs and expenses included in general and administrative expenses in the anticipation of and planning for this offering. |
| (4) | The pro forma data reflects: (i) the Reorganization, and (ii) the effect of a portion of the net offering proceeds which will be used to repay the 10% Senior Note due 2022 issued by us to an affiliate of Welsh, Carson, Anderson & Stowe in the amount of approximately $18.8 million and the 14% Note due 2017 issued by WCAS Holdings that we assumed in connection with the Reorganization in the amount of approximately $46.2 million (including certain payments made pursuant to a contribution agreement). Any additional net offering proceeds have been excluded for the purposes of the pro forma financial information. |
| (5) | Working capital (deficit) is defined as current assets, excluding restricted cash, less current liabilities, excluding current portion of deferred revenue. |
11
Table of Contents
Investing in our common stock involves a high degree of risk. You should carefully consider the risks and uncertainties described below before making a decision to invest in our common stock. Our business, operating results or financial condition could be adversely affected by any of these risks, as well as other risks not currently known to us or that we currently consider immaterial. The trading price of our common stock could decline due to any of these risks, and, as a result, you may lose all or part of your investment. Before deciding whether to invest in our common stock, you should also refer to the other information contained in this prospectus, including our consolidated financial statements and the related notes.
Risks Related to Our Business and Industry
Our business depends substantially on our clients’ continued use of our applications, their purchases of additional applications from us and our ability to add new clients. Any decline in our clients’ continued use of our applications or purchases of additional applications could adversely affect our business, operating results or financial condition.
In order for us to maintain or improve our operating results, it is important that our current clients continue to use our applications and purchase additional applications from us, and that we add additional clients. Our clients have no obligation to continue to use our applications, and may choose not to continue to use our applications at the same or higher level of service, if at all. In the past, some of our clients have elected not to continue to use our applications. Moreover, our clients generally have the right to cancel their agreements with us for any or no reason by providing 30 days prior written notice.
Our client retention rates may fluctuate as a result of a number of factors, including the level of client satisfaction with our applications, pricing, the prices of competing products or services, mergers and acquisitions affecting our client base, reduced hiring by our clients or reductions in our clients’ spending levels. If our clients do not continue to use our applications, renew on less favorable terms, fail to purchase additional applications, or if we fail to add new clients, our revenue may decline, and our business, operating results or financial condition could be adversely affected.
The market in which we participate is highly competitive, and if we do not compete effectively, our business, operating results or financial condition could be adversely affected.
The market for HCM software is highly competitive, rapidly evolving and fragmented. We expect competition to intensify in the future with the introduction of new technologies and market entrants. Many of our current and potential competitors are larger and have greater brand name recognition, longer operating histories, more established relationships in the industry and significantly greater financial, technical and marketing resources than we do. As a result, some of these competitors may be able to:
| • | adapt more rapidly to new or emerging technologies and changes in client requirements; |
| • | develop superior products or services, gain greater market acceptance and expand their product and service offerings more efficiently or rapidly; |
| • | bundle products and services that we may not offer or in a manner that provides our competitors with a price advantage; |
| • | take advantage of acquisition and other opportunities for expansion more readily; |
| • | maintain a lower cost basis; |
| • | adopt more aggressive pricing policies and devote greater resources to the promotion, marketing and sales of their products and services; and |
| • | devote greater resources to the research and development of their products and services. |
12
Table of Contents
Some of our principal competitors offer their products or services at a lower price, which has resulted in pricing pressures. Similarly, some competitors offer different billing terms, which has resulted in pressures on our billing terms. If we are unable to maintain our pricing levels and our billing terms, our operating results would be negatively impacted. In addition, pricing pressures and increased competition generally could result in reduced sales, reduced margins, losses or the failure of our solution to achieve or maintain widespread market acceptance, any of which could adversely affect our business, operating results or financial condition.
We compete with firms that provide HCM solutions by various means. Many providers continue to deliver legacy enterprise software, but as demand for greater flexibility and access to information grows, we believe there will be increased competition in the delivery of HCM cloud-based solutions by other SaaS providers. Our competitors offer HCM solutions that overlap with one, several or all categories of applications offered by our solution. Our talent acquisition and talent management applications compete primarily with Cornerstone OnDemand, Inc., Oracle Corporation, SAP AG and Workday, Inc. Our payroll applications, including payroll processing, compete primarily with Automatic Data Processing, Inc., or ADP, Ceridian Corporation, Concur Technologies, Inc., Intuit, Inc., Paychex, Inc. and The Ultimate Software Group, Inc. Our HR management applications compete primarily with ADP, Ceridian Corporation, Oracle Corporation, Paychex, Inc., SAP AG, and Workday, Inc. Our time and labor management applications compete primarily with ADP, Ceridian Corporation and The Ultimate Software Group, Inc. All of our larger competitors compete with us across multiple application categories. In addition, our HCM solution continues to face competition from in-house payroll and HR systems and departments as well as HR systems and software sold by third-party vendors.
Competition in the HCM solutions market is primarily based on service responsiveness, product quality and reputation, breadth of service and product offering and price. Many of our competitors are able to devote greater resources to the development, promotion and sale of their products and services. In addition, many of our competitors have established marketing relationships, access to larger client bases and major distribution agreements with consultants, software vendors and distributors. In addition, some competitors may offer software that addresses one or a limited number of HCM functions at a lower price point or with greater depth than our solution. As a result, our competitors may be able to respond more quickly and effectively than we can to new or changing opportunities, technologies, standards or client requirements. Further, some potential clients, particularly large enterprises, may elect to develop their own internal solutions. If we are unable to compete effectively, our business, operating results or financial condition could be adversely affected.
We have historically derived a majority of our revenue from payroll processing and our efforts to increase the use of our other HCM applications may not be successful and may reduce our revenue growth rate.
To date we have derived a majority of our revenue from payroll processing. For the years ended December 31, 2013, 2012 and 2011, payroll processing represented approximately 58%, 60% and 68% of our total revenues, respectively. Compared to payroll processing, our participation in other HCM applications markets is relatively new, and it is uncertain whether our revenue from other HCM applications will continue to grow. The relatively limited extent to which our other HCM applications have been adopted by our clients, and the uncertainty regarding the adoption of any new applications beyond our existing applications, may make it difficult to evaluate our business because the potential market for such applications remains uncertain. Our HCM solution may not achieve and sustain the high level of market acceptance that is critical for the success of our business. The failure to increase the use of our HCM applications and any new applications developed by us may reduce our revenue growth rate, which could adversely affect our business, operating results or financial condition.
If our security measures are breached, or unauthorized access to data of our clients or their employees is otherwise obtained, our solution may not be perceived as being secure, clients may reduce the use of or stop using our solution and we may incur significant liabilities.
Our solution involves the collection, storage and transmission of clients’ and their employees’ confidential and proprietary information, including personal or identifying information, as well as financial and payroll data. Unauthorized access or security breaches could result in the loss of information, litigation, indemnity obligations
13
Table of Contents
and other liability. While we have security measures in place to protect client and employee information and prevent data loss and other security breaches, if these measures are breached as a result of third-party action, employee error, malfeasance or otherwise, and someone obtains unauthorized access to our clients’ data, our reputation could be damaged, our business may suffer and we could incur significant liability. Because the techniques used to obtain unauthorized access or to sabotage systems change frequently, we may not be able to anticipate these techniques and implement adequate preventative measures. Cyber liability insurance may be inadequate or may not be available in the future on acceptable terms, or at all. In addition, our cyber liability insurance policy may not cover all claims made against us, and defending a suit, regardless of its merit, could be costly and divert management’s attention.
Any actual or perceived breach of our security could damage our reputation, cause existing clients to discontinue the use of our solution, prevent us from attracting new clients, or subject us to third-party lawsuits, regulatory fines or other action or liability, which could adversely affect our business, operating results or financial condition.
If the SaaS market develops more slowly than we expect or declines, our growth may slow or stall, and our business could be adversely affected.
The SaaS market is not as mature as the market for on-premise enterprise software, and it is uncertain whether SaaS will achieve and sustain high levels of demand and market acceptance. Our success will depend not only on strong demand for HCM services in general, but also to a substantial extent on the widespread adoption of SaaS. Many companies have invested substantial personnel and financial resources to integrate traditional enterprise software into their businesses, and therefore may be reluctant or unwilling to migrate to SaaS. It is difficult to predict client adoption rates and demand for our solution, the future growth rate and size of the SaaS market or the entry of competitive products. The expansion of the SaaS market depends on a number of factors, including the cost, performance and perceived value associated with SaaS, as well as the ability of SaaS providers to address security and privacy concerns. If other SaaS providers experience security incidents, loss of client data, disruptions in delivery or other problems, the market for SaaS applications as a whole, including our solution, may be negatively affected. If SaaS does not achieve widespread adoption, or there is a reduction in demand for SaaS caused by a lack of client acceptance, technological challenges, weakening economic conditions, security or privacy concerns, competing technologies and products, decreases in corporate spending or otherwise, our growth may slow or stall, and our business could be adversely affected.
Any interruption or failure of our data centers could impair our ability to effectively provide our solution and adversely affect our business.
We serve all of our clients from our two data centers located in Oklahoma and Texas. These locations are vulnerable to damage or interruption from severe weather, tornados, terrorist attacks, earthquakes, floods, fires, power loss, telecommunications failures, computer viruses or cyber-attacks. They are also subject to break-ins, sabotage, intentional acts of vandalism and other misconduct. Our solution depends on the continuing operation of our data centers and any damage to or failure of our data centers could result in interruptions in our services. Any interruption in our service could damage our reputation, cause our clients to terminate their use of our solution and prevent us from gaining new or additional business from current clients, which could have an adverse effect on our business, operating results or financial condition.
Any significant disruption in our SaaS network infrastructure could harm our reputation and expose us to significant costs.
Our SaaS network infrastructure is a critical part of our business operations. Our clients access our solution through standard web browsers, smart phones, tablets and other web-enabled devises, and depend on us for fast and reliable access to our solution. In the future, we may experience disruptions in our computing and communications infrastructure. Factors that may cause such disruptions include:
| • | human error; |
14
Table of Contents
| • | security breaches; |
| • | telecommunications failures or outages from third-party providers; |
| • | computer viruses or cyber-attacks; |
| • | acts of terrorism, sabotage or other intentional acts of vandalism; |
| • | unforeseen interruption or damages experienced in moving hardware to a new location; |
| • | tornados, fires, earthquakes, floods and other natural disasters; and |
| • | power loss. |
If our SaaS network infrastructure or our clients’ ability to access to our solution is interrupted, client and employee data from recent transactions may be permanently lost and we could be exposed to significant claims by clients, particularly if the access interruption is associated with problems in the timely delivery of funds due to employees. Any significant instances of system downtime could negatively affect our reputation and ability to retain clients and sell our solution, which would adversely impact our revenue.
We have also experienced significant growth in the number of clients, transactions and client and employee data that our network infrastructure supports. We seek to maintain sufficient excess capacity in our network infrastructure to meet the needs of all of our clients and their employees and to facilitate the rapid provision of new client deployments and the expansion of existing client deployments. Any changes in the service levels at our data centers or any errors, defects, disruptions or other performance problems with our network infrastructure could adversely affect our reputation and may result in lengthy interruptions in the availability of our solution. Any interruptions in the availability of our solution might reduce our revenues, cause us to issue refunds to clients or adversely affect our retention of existing clients.
If our solution fails to perform properly, our reputation could be adversely affected and our market share could decline.
Our solution is inherently complex and may in the future contain, or develop, undetected defects or errors. Any defects in our applications could adversely affect our reputation, impair our ability to sell our applications in the future and result in significant costs to us. The costs incurred in correcting any application defects may be substantial and could adversely affect our business, operating results or financial condition. Any defects in functionality or that cause interruptions in the availability of our applications could result in:
| • | loss or delayed market acceptance and sales of our applications; |
| • | termination of service agreements or loss of clients; |
| • | credits or refunds to clients; |
| • | breach of contract, breach of warranty or indemnification claims against us, which may result in litigation; |
| • | diversion of development and service resources; and |
| • | injury to our reputation. |
Because of the large amount of data that we collect and manage, it is possible that hardware failures or errors in our systems could result in data loss or corruption, or cause the information that we collect to be incomplete or contain inaccuracies that our clients regard as significant. Furthermore, the availability or performance of our solution could be adversely affected by a number of factors, including the failure of our network system or solution or security breaches. We may be liable to our clients for damages they may incur resulting from certain of these events. In addition to potential liability, if we experience interruptions in the availability of our solution, our reputation could be adversely affected and we could lose clients.
15
Table of Contents
Our clients might assert claims against us in the future alleging that they suffered damages due to a defect, error, or other failure of our solution. Our errors and omissions insurance may be inadequate or may not be available in the future on acceptable terms, or at all. In addition, our policy may not cover all claims made against us, and defending a suit, regardless of its merit, could be costly and divert management’s attention.
If we do not effectively expand and train our sales force and our support teams, we may be unable to add new clients and retain existing clients.
We need to continue to expand our sales force and support team members in order to grow our client base and increase our revenues. Identifying and recruiting qualified personnel and training them in the use of our solution requires significant time, expense and attention and it can take a substantial amount of time before our sales representatives and support team members are fully-trained and productive. We may be unable to hire or retain sufficient numbers of qualified individuals in the markets where we currently, or intend in the future to do business, and our recent hires and planned hires may not achieve desired productivity levels in a reasonable period of time or become as productive as we expect. If these expansion efforts are unsuccessful or do not generate a corresponding increase in revenues, our business, operating results or financial condition could be adversely affected.
If we are not able to develop enhancements and new applications, keep pace with technological developments or respond to future disruptive technologies, we might not remain competitive and our business could be adversely affected.
Our future success will depend on our ability to adapt and innovate. To attract new clients and increase revenue from existing clients, we need to enhance, add new features and improve our existing applications and introduce new applications. The success of any enhancements or new features and applications depends on several factors, including timely completion, introduction and market acceptance. We may expend significant time and resources developing and pursuing sales of a particular application that may not result in revenues in the anticipated time frame or at all, or may not result in revenue growth sufficient to offset increased expenses. If we are unable to successfully develop enhancements, new features or new applications to meet client needs, our business and operating results could be adversely affected.
In addition, because our applications are designed to operate on a variety of network, hardware and software platforms using Internet tools and protocols, we will need to continuously modify and enhance our applications to keep pace with changes in Internet-related hardware, software, communication, browser and database technologies. If we are unable to respond in a timely and cost-effective manner to these rapid technological developments, our current and future applications may become less marketable and less competitive or even obsolete.
Our success is subject to the risk of future disruptive technologies. If new technologies emerge that are able to deliver HCM solutions at lower prices, more efficiently or more conveniently, such technologies could adversely impact our ability to compete.
The market for our solution among large companies may be limited if these companies demand customized features and functions that we do not offer.
Prospective clients, especially larger companies, may require customized features and functions unique to their business processes that we do not offer. In order to ensure we meet these requirements, we may devote a significant amount of support and services resources to larger prospective clients, increasing the cost and time required to complete sales with no guarantee that these clients will continue to use our solution. We may not be successful in implementing any customized features or functions. If prospective clients require customized features or functions that we do not offer, or that would be difficult for them to deploy themselves, then the market for our solution will be more limited and our business could be adversely affected.
16
Table of Contents
Our business and operations are experiencing rapid growth and organizational change. If we fail to manage such growth and change effectively, we may be unable to execute our business plan, maintain high levels of service or adequately address competitive challenges.
We have experienced, and may continue to experience, rapid growth in our headcount and operations, which has placed, and may continue to place, significant demands on our management, operational and financial resources. For example, our headcount has grown from 523 employees as of December 31, 2011 to 840 employees as of December 31, 2013 and we have expanded from 18 offices as of December 31, 2011 to 24 offices as of December 31, 2013. We have also experienced significant growth in the number of clients, transactions and client and employee data that our infrastructure supports. Finally, our organizational structure and recording systems and procedures are becoming more complex as we improve our operational, financial and management controls. Our success will depend in part on our ability to manage this growth and organizational change effectively. To manage the expected growth of our headcount and operations, we will need to continue to improve our operational, financial and management controls and our reporting systems and procedures. Our ability to add additional offices may be constrained by the willingness and availability of qualified personnel to help staff and manage any new offices. The failure to effectively manage growth could result in difficulties or delays in obtaining clients, selling additional applications to our clients, declines in quality or client satisfaction of our applications, increases in costs, and difficulties in introducing new applications or other operational difficulties, any of which could adversely affect our ability to retain and attract clients or sell additional applications to our existing clients.
Our business, operating results or financial condition could be adversely affected if our clients are not satisfied with our deployment or technical support services.
Our business depends on our ability to satisfy our clients, both with respect to our applications and the technical support provided to help clients use the applications that address the needs of their businesses. We use our in-house deployment personnel to implement and configure our solution and provide support to our clients. If a client is not satisfied with the quality of our solution or the applications delivered or the support provided, we could be required to incur additional costs to address the situation, the profitability of our solution might be negatively affected, and the client’s dissatisfaction with our deployment service could damage our ability to sell additional applications to that client. In addition, our sales process is highly dependent on the reputation of our solution and applications and on positive recommendations from our existing clients. Any failure to maintain high-quality technical support, or a market perception that we do not maintain high-quality support, could adversely affect our reputation, our ability to sell our applications to existing and prospective clients, and our business, operating results or financial condition.
If we fail to retain key employees and recruit qualified technical and sales personnel, our business could be adversely affected.
We believe that our success depends on the continued services of our senior management and other key employees, including Chad Richison, Craig E. Boelte, Jeffrey D. York and William X. Kerber III. In addition, because our future success is dependent on our ability to continue to enhance and introduce new applications, we are heavily dependent on our ability to attract and retain qualified software developers and IT personnel with the requisite education, background and industry experience. To continue to execute our growth strategy, we must also attract and retain qualified sales, marketing and operational personnel capable of supporting a larger and more diverse client base. The loss of the services of a significant number of our developers or sales professionals could be disruptive to our development efforts or business relationships. In addition, if any of our key employees joins a competitor or decides to otherwise compete with us, we may experience a material disruption of our operations and development plans, which may cause us to lose clients or increase operating expenses or divert management’s attention to recruit replacements for the departed key employees.
17
Table of Contents
Our financial results may fluctuate due to many factors, some of which may be beyond our control.
Our results of operations, including the levels of our revenues, costs of revenues, administrative expenses, operating income, cash flow and deferred revenue, may vary significantly in the future and the results of any one period should not be relied upon as an indication of future performance. Our financial results may fluctuate as a result of a variety of factors, many of which are outside of our control, and as a result, may not fully reflect the underlying performance of our business. Fluctuation in our financial results may negatively impact the value of our common stock. Factors that may cause our financial results to fluctuate from period to period include, without limitation:
| • | our ability to attract new clients or sell additional applications to our existing clients; |
| • | the number of new clients and their employees, as compared to the number of existing clients and their employees in a particular period; |
| • | the mix of clients between small, mid-sized and large organizations; |
| • | the extent to which we retain existing clients and the expansion or contraction of our relationship with them; |
| • | the mix of applications sold during a period; |
| • | changes in our pricing policies or those of our competitors; |
| • | seasonal factors affecting payroll processing, demand for our applications or potential clients’ purchasing decisions; |
| • | the amount and timing of operating expenses, including those related to the maintenance and expansion of our business, operations and infrastructure; |
| • | the timing and success of new applications introduced by us and the timing of expenses related to the development of new applications and technologies; |
| • | the timing and success of current and new competitive products and services by our competitors; |
| • | economic conditions affecting our clients, including their ability to outsource HCM solutions and hire employees; |
| • | other changes in the competitive dynamics of our industry, including consolidation among competitors or clients; |
| • | our ability to manage our existing business and future growth, including expenses related to our data centers and the expansion of such data centers and the addition of new offices; |
| • | the effects and expenses of acquisition of third-party technologies or businesses and any potential future charges for impairment of goodwill resulting from those acquisitions; |
| • | network outages or security breaches; and |
| • | general economic, industry and market conditions. |
Certain of our operating results and financial metrics are difficult to predict as a result of seasonality.
We have historically experienced seasonality in our revenues because a significant portion of our recurring revenues relate to the annual processing of payroll forms such as Form W-2 and Form 1099. Because these forms are typically processed in the first quarter of the year, first quarter revenues are generally higher than subsequent quarters. We expect this seasonality to continue in the future, which may cause fluctuations in certain of our operating results and financial metrics, and thus make such results and metrics difficult to predict.
18
Table of Contents
If we fail to adequately protect our proprietary rights, our competitive advantage could be impaired and we may lose valuable assets, generate reduced revenue or incur costly litigation to protect our rights.
Our success is dependent in part upon our intellectual property. We rely on a combination of copyrights, trademarks, service marks, trade secret laws and contractual restrictions to establish and to protect our intellectual property rights. However, the steps we take to protect our intellectual property may be inadequate. We will not be able to protect our intellectual property if we are unable to enforce our rights or if we do not detect unauthorized use of our intellectual property. Despite our precautions, it may be possible for unauthorized third parties to copy our applications and use information that we regard as proprietary to create products or services that compete with ours.
In order to protect our intellectual property rights, we may be required to spend significant resources to monitor and protect these rights. Litigation may be necessary in the future to protect and enforce our intellectual property rights and to protect our trade secrets and such litigation could be costly, time-consuming and distracting to management and could result in the impairment or loss of portions of our intellectual property. Furthermore, our efforts to enforce our intellectual property rights may be met with defenses, counterclaims and countersuits attacking the validity and enforceability of our intellectual property rights. We may not be able to secure, protect and enforce our intellectual property rights or control access to, and the distribution of, our solution and proprietary information.
We may be sued by third parties for alleged infringement of their proprietary rights.
There is considerable intellectual property development activity in our industry, and we expect that software developers will increasingly be subject to infringement claims as the number of applications and competitors grows and the functionality of applications in different industry segments overlaps. Our competitors, as well as a number of other entities and individuals, may own or claim to own intellectual property in technology areas relating to our solution or applications. From time to time, third parties have asserted and may in the future assert that we are infringing on their intellectual property rights, and we may be found to be infringing upon such rights. A claim of infringement may also be made relating to technology that we acquire or license from third parties. However, we may be unaware of the intellectual property rights of others that may cover, or may be alleged to cover, some or all of our solution or applications.
For example, on July 29, 2013, Dr. Lakshmi Arunachalam filed a complaint against us in the U.S. District Court for the District of Delaware alleging that Paycom Payroll, LLC, or Payroll, infringes on at least one claim of U.S. Patent No. 8,244,833 assigned to her. In her complaint, Dr. Arunachalam seeks a permanent injunction, damages and attorneys’ fees.
The outcome of the foregoing litigation matter is inherently unpredictable, and therefore as a result of this litigation matter or any future claim of infringement, a claim could (i) cause us to enter into an unfavorable royalty or license agreement, pay ongoing royalties or require that we comply with other unfavorable terms, (ii) require us to discontinue the sale of our solution or applications, (iii) require us to indemnify our clients or third-party service providers or (iv) require us to expend additional development resources to redesign our solution or applications. Any of these outcomes could harm our business. Even if we were to prevail, any litigation regarding our intellectual property could be costly and time consuming and divert the attention of our management and key personnel from our business and operations.
We employ third-party licensed software for use in our applications, and the inability to maintain these licenses or errors in the software we license could result in increased costs or reduced service levels, which could adversely affect our business.
Our applications incorporate certain third-party software obtained under licenses from other companies. We anticipate that we will continue to rely on such third-party software and development tools from third parties in
19
Table of Contents
the future. Although we believe that there are commercially reasonable alternatives to the third-party software we currently license, this may not always be the case, or it may be difficult or costly to replace. In addition, integration of the software used in our applications with new third-party software may require significant work and substantial investment of our time and resources. Also, to the extent that our applications depend upon the successful operation of third-party software in conjunction with our software, any undetected errors or defects in this third-party software could prevent the deployment or impair the functionality of our applications, delay new application introductions, result in a failure of our applications and harm our reputation.
The use of open source software in our applications may expose us to additional risks and harm our intellectual property rights.
Some of our applications use software covered by open source licenses. From time to time, there have been claims challenging the ownership of open source software against companies that incorporate such software into their products or applications. As a result, we could be subject to suits by parties claiming ownership of what we believe to be open source software. Litigation could be costly for us to defend, have a negative effect on our operating results and financial condition or require us to devote additional development resources to change our applications. In addition, if we were to combine our applications with open source software in a certain manner, we could, under certain of the open source licenses, be required to release the source code of our applications. If we inappropriately use open source software, we may be required to redesign our applications, discontinue the sale of our applications or take other remedial actions.
The failure to develop our brand cost-effectively could have an adverse effect on our business.
We believe that developing and maintaining widespread awareness of our brand in a cost-effective manner is critical to achieving the widespread acceptance of our solution and is an important element in attracting new clients and retaining existing clients. Successful promotion of our brand will depend largely on the effectiveness of our marketing efforts and on our ability to provide reliable and useful applications at competitive prices. Brand promotion activities may not yield increased revenue, and even if they do, any increased revenue may not offset the expenses incurred in building our brand. If we fail to successfully promote and maintain our brand, or incur substantial expenses in an unsuccessful attempt to promote and maintain our brand, we may fail to attract enough new clients or retain our existing clients to the extent necessary to realize a sufficient return on our brand-building efforts, which could have an adverse effect on our business.
We might require additional capital to support business growth, and this capital might not be available on acceptable terms, if at all.
We have funded our operations since inception through equity financings and cash generated by operations. In the future, we may require additional capital to support our growth and respond to operational challenges, including the need to develop new features and applications or enhance our existing applications, improve our infrastructure or acquire complementary businesses and technologies. Accordingly, we may need to engage in equity or debt financings to secure additional funds. If we raise additional funds through further issuances of equity or convertible debt securities, our existing stockholders could suffer significant dilution, and any new equity securities we issue could have rights, preferences and privileges superior to those of holders of our common stock. Any debt financing secured by us in the future could involve restrictive covenants relating to our capital raising activities and other financial and operational matters, which may make it more difficult for us to obtain additional capital and to pursue business opportunities, including potential acquisitions. In addition, we may not be able to obtain additional financing on terms favorable to us, if at all. If we are unable to obtain adequate financing or financing on terms satisfactory to us, when we require it, our ability to continue to support our growth and respond to challenges could be significantly limited.
20
Table of Contents
We may acquire other businesses, applications or technologies, which could divert our management’s attention, result in additional dilution to our stockholders and otherwise disrupt our operations and harm our operating results.
In the future, we may seek to acquire or invest in businesses, applications or technologies that we believe complement or expand our applications, enhance our technical capabilities or otherwise offer growth opportunities. The pursuit of potential acquisitions may divert the attention of management and cause us to incur expenses in identifying, investigating and pursuing suitable acquisitions, whether or not they are ultimately consummated.
We do not have any experience in acquiring other businesses. If we acquire additional businesses, we may not be able to integrate the acquired personnel, operations and technologies successfully or to effectively manage the combined business following the acquisition. We also may not achieve the anticipated benefits from the acquired business due to a number of factors, including:
| • | the inability to integrate or benefit from acquired applications or services in a profitable manner; |
| • | unanticipated costs or liabilities associated with the acquisition; |
| • | the incurrence of acquisition-related costs; |
| • | difficulty integrating the accounting systems, operations and personnel of the acquired business; |
| • | difficulty and additional expenses associated with supporting legacy products and hosting infrastructure of the acquired business; |
| • | difficulty converting the clients of the acquired business onto our solution, including disparities in the revenues, licensing, support or services of the acquired company; |
| • | diversion of management’s attention from other business concerns; |
| • | harm to our existing relationships with clients as a result of the acquisition; |
| • | the potential loss of key employees; |
| • | the use of resources that are needed in other parts of our business; and |
| • | the use of substantial portions of our available cash to consummate the acquisition. |
In addition, a significant portion of the purchase price of any companies we acquire may be allocated to acquired goodwill and other intangible assets, which must be assessed for impairment at least annually. In the future, if our acquisitions do not yield expected returns, we may be required to take charges to our operating results based on this impairment assessment process, which could harm our results of operations. Acquisitions could also result in issuances of equity securities or the incurrence of debt, which would result in dilution to our stockholders.
Our growth depends in part on the success of our relationships with third parties.
We rely on third-party financial and accounting processing systems, as well as various financial institutions, to perform financial services in connection with our applications, such as providing automated clearing house, or ACH, and wire transfers as part of our payroll and expense reimbursement services and to provide technology and content support, manufacture time clocks and process background checks. We anticipate that we will continue to depend on various third-party relationships in order to grow our business, provide technology and content support, manufacture time clocks and process background checks. Identifying, negotiating and documenting relationships with these third parties and integrating third-party content and technology requires significant time and resources. Our agreements with third parties are typically non-exclusive and do not prohibit them from working with our competitors. In addition, these third parties may not perform as expected under our agreements, and we may have disagreements or disputes with such third parties, which could negatively affect
21
Table of Contents
our brand and reputation. A global economic slowdown could also adversely affect the businesses of our third party providers, particularly those financial institutions that process transactions through the ACH network, and it is possible that they may not be able to devote the resources we expect to our relationship.
If we are unsuccessful in establishing or maintaining our relationships with these third parties, our ability to compete in the marketplace or to grow our revenue could be impaired and our business, operating results or financial condition could be adversely affected. Even if we are successful, these relationships may not result in improved operating results.
Adverse economic conditions could adversely affect our business, operating results or financial condition.
Our business depends on the overall demand for HCM applications and on the economic health of our current and prospective clients. If economic conditions in the United States remain uncertain or deteriorate, clients may cease their operations or delay or reduce their HCM spending or the number of their employees. This could result in reductions in sales of our applications, longer sales cycles, slower adoption of new technologies and increased price competition. In addition, there has been reduced government spending in the United States during 2013. This might reduce demand for our applications from organizations that receive funding from the U.S. government and could negatively affect the U.S. economy, which could further reduce demand for our applications. Any of these events could adversely affect our business, operating results or financial condition. In addition, HCM spending levels may not increase following any recovery.
If our goodwill or other intangible assets become impaired, we may be required to record a significant charge to earnings.
We are required to test goodwill for impairment at least annually or earlier if events or changes in circumstances indicate the carrying value may not be recoverable. As of December 31, 2013, we had recorded a total of $51.9 million of goodwill and $6.7 million of other intangible assets. An adverse change in market conditions, particularly if such change has the effect of changing one of our critical assumptions or estimates made in connection with the impairment testing of goodwill or intangible assets, could result in a change to the estimation of fair value that could result in an impairment charge to our goodwill or other intangible assets. Any such material charges may have a negatively impact our operating results.
Because our long term success depends, in part, on our ability to expand the sales of our solution to customers located outside of the United States, our business will be subject to risks associated with international operations.
An element of our growth strategy is to expand our operations and client base. To date, we have not engaged in any operations outside of the United States. If we decide to expand our operations into international markets, it will require significant resources and management attention and will subject us to regulatory, economic and political risks that are different from those in the United States. Because of our lack of experience with international operations, we cannot assure you that our international expansion efforts will be successful.
Risks Related to Legislation or Regulation
Privacy concerns and laws or other domestic regulations may reduce the effectiveness of our applications.
Our applications require the storage and transmission of the proprietary and confidential information of our clients and their employees, including personal or identifying information, as well as their financial and payroll data. Personal privacy has become a significant issue in the United States. The regulatory framework for privacy issues is rapidly evolving and is likely to remain uncertain for the foreseeable future. Many federal, state and foreign government bodies and agencies have adopted or are considering adopting laws and regulations regarding the collection, use and disclosure of personal information. In the United States, these include rules and regulations promulgated under the authority of the Federal Trade Commission, the Health Insurance Portability and Accountability Act of 1996, the Family Medical Leave Act of 1993, the Patient Protection and Affordable Care Act and state breach notification laws.
22
Table of Contents
In addition to government regulation, privacy advocates and industry groups may propose new and different self-regulatory standards. Because the interpretation and application of privacy and data protection laws are still uncertain, it is possible that these laws may be interpreted and applied in a manner that is inconsistent with our existing data management practices or the features of our solution. As such, in addition to the possibility of fines, lawsuits and other claims, we could be required to fundamentally change our business activities and practices or modify our solution, which could have an adverse effect on our business, operating results or financial condition. Any inability to adequately address privacy concerns, even if unfounded, or comply with applicable privacy or data protection laws, regulations and policies, could result in additional cost and liability to us, damage our reputation, inhibit sales and adversely affect our business, operating results or financial condition.
Furthermore, privacy concerns may cause our clients’ employees to resist providing the personal data necessary to allow our clients or their employees to use our applications effectively. Even the perception of privacy concerns, whether or not valid, may inhibit market adoption of our applications in certain industries. All of these legislative and regulatory initiatives may adversely affect the ability of our clients to process, handle, store, use and transmit demographic and personal information from their employees, which could reduce demand for our applications.
Changes in laws and regulations related to the Internet or changes in the Internet infrastructure itself may diminish the demand for our applications, and could have a negative impact on our business.
The future success of our business depends upon the continued use of the Internet as a primary medium for commerce, communication and business. Federal, state and foreign government bodies or agencies have in the past adopted, and may in the future adopt, laws or regulations affecting the use of the Internet as a commercial medium. Changes in these laws or regulations could require us to modify our applications in order to comply with these changes. In addition, government agencies or private organizations may impose taxes, fees or other charges for accessing the Internet or commerce conducted via the Internet. These laws or charges could limit the growth of Internet-related commerce or communications generally, or result in reductions in the demand for Internet-based applications such as ours.
In addition, the use of the Internet as a means of conducting business could be adversely affected due to delays in the development or adoption of new standards and protocols to handle increased demands of Internet activity, security, reliability, cost, ease of use, accessibility, and quality of service. The performance of the Internet has been adversely affected by “viruses,” “worms” and similar malicious programs and the Internet has experienced a variety of outages and other delays as a result of damage to portions of its infrastructure. If the use of the Internet is adversely affected by these issues, demand for our applications could suffer.
If we are unable to implement and maintain effective internal control over financial reporting in the future, investors may lose confidence in the accuracy and completeness of our financial reports and the market price of our common stock may be negatively affected.
We will be required, pursuant to Section 404 of the Sarbanes-Oxley Act of 2002, as amended, or the Sarbanes-Oxley Act, to furnish a report by management on, among other things, the effectiveness of our internal control over financial reporting for the first fiscal year beginning after the effective date of this offering and in each year thereafter. Our auditors will also need to attest to the effectiveness of our internal control over financial reporting in the future to the extent we are no longer an emerging growth company, as defined by the Jumpstart Our Business Startups Act, or the JOBS Act, and are not a smaller reporting company.
If we have a material weakness in our internal control over financial reporting, we may not detect errors on a timely basis and our financial statements may be materially misstated. We are in the process of designing and implementing the internal control over financial reporting to comply with this obligation, which process will be time consuming, costly and complicated. If we identify material weaknesses in our internal control over financial reporting, if we are unable to comply with the requirements of Section 404 in a timely manner, if we are unable to assert that our internal control over financial reporting is effective, or if our independent registered public
23
Table of Contents
accounting firm is unable to express an opinion as to the effectiveness of our internal control over financial reporting, investors may lose confidence in the accuracy and completeness of our financial reports we could become subject to investigations by the NYSE, the Securities and Exchange Commission, or the SEC, or other regulatory authorities and the market price of our common stock could be negatively affected.
We will incur increased costs and demands upon management as a result of complying with the laws and regulations affecting public companies, which could adversely affect our operating results.
As a public company, we will incur significant legal, accounting and other expenses that we did not incur as a private company, including costs associated with public company reporting and corporate governance requirements. For example, we will be subject to the reporting requirements of the Securities Exchange Act of 1934, as amended, or the Exchange Act, and will be required to comply with the applicable requirements of the Sarbanes-Oxley Act, as well as rules and regulations subsequently implemented by the SEC and the NYSE, including the establishment and maintenance of effective disclosure controls and procedures and internal control over financial reporting and changes in corporate governance practices.
We expect that complying with these rules and regulations will substantially increase our legal and financial compliance costs and make some activities more time-consuming and costly. In addition, our management team will have to adapt to the requirements of being a public company. In particular, we expect to incur significant expenses and devote substantial management effort toward ensuring compliance with the requirements of Section 404 of the Sarbanes-Oxley Act, which will increase to the extent we are no longer an emerging growth company, as defined by the JOBS Act, and are not a smaller reporting company. We cannot predict or estimate the amount of additional costs we may incur as a result of becoming a public company or the timing of such costs, which could adversely affect our operating results.
The increased costs associated with operating as a public company may decrease our net income or result in a net loss and may require us to reduce costs in other areas of our business or increase the prices of our solution. Additionally, if these requirements divert management’s attention from other business concerns, they could have an adverse effect on our business, operating results or financial condition.
As a public company, we also expect that it may be more difficult or more expensive for us to obtain director and officer liability insurance, and we may be required to accept reduced policy limits and coverage or incur substantially higher costs to obtain the same or similar coverage. As a result, it may be more difficult for us to attract and retain qualified individuals to serve on our board of directors or as our executive officers.
We are an emerging growth company and the reduced disclosure requirements applicable to emerging growth companies may make our common stock less attractive to investors.
We are an emerging growth company. Under the JOBS Act, emerging growth companies can delay adopting new or revised accounting standards until such time as those standards apply to private companies. We have irrevocably elected not to avail ourselves of this exemption from new or revised accounting standards and, therefore, we will be subject to the same new or revised accounting standards as other public companies that are not emerging growth companies. Pursuant to Section 102 of the JOBS Act, we have reduced executive compensation disclosure and have omitted a Compensation Discussion and Analysis from this prospectus.
For as long as we continue to be an emerging growth company, we intend to take advantage of certain other exemptions from various reporting requirements that are applicable to other public companies including reduced disclosure obligations regarding executive compensation in our periodic reports and proxy statements, exemptions from the requirements of holding a nonbinding advisory vote on executive compensation, the frequency of the nonbinding advisory vote on executive compensation and stockholder approval of any golden parachute payments not previously approved and the auditor attestation requirements of Section 404 of the
24
Table of Contents
Sarbanes-Oxley Act. Investors may find our common stock less attractive because we will rely on these exemptions. If some investors find our common stock less attractive as a result, there may be a less active trading market for our common stock and our stock price may be more volatile.
We will remain an emerging growth company until the earliest of (i) the end of the fiscal year in which the market value of our common stock that is held by non-affiliates exceeds $700 million as of June 30th, (ii) the end of the fiscal year in which we have total annual gross revenues of $1 billion or more during such fiscal year, (iii) the date on which we issue more than $1 billion in non-convertible debt in a three-year period and (iv) the end of the fiscal year following the five year anniversary of the date of this prospectus.
Adverse tax laws or regulations could be enacted or existing laws could be applied to us or our clients, which could increase the costs of our solution and applications and could adversely affect our business, operating results or financial condition.
The application of federal, state and local tax laws to services provided electronically is evolving. New income, sales, use or other tax laws, statutes, rules, regulations or ordinances could be enacted at any time (possibly with retroactive effect), and could be applied solely or disproportionately to services and applications provided over the Internet. These enactments could adversely affect our sales activity, due to the inherent cost increase the taxes would represent and ultimately could adversely affect our business, operating results or financial condition.
In addition, existing tax laws, statutes, rules, regulations or ordinances could be interpreted, changed, modified or applied adversely to us (possibly with retroactive effect), which could require us or our clients to pay additional tax amounts, as well as require us or our clients to pay fines or penalties and interest for past amounts. If we are unsuccessful in collecting such taxes from our clients, we could be held liable for such costs, thereby adversely affecting our business, operating results or financial condition.
Risks Related to this Offering and Ownership of our Common Stock
There has been no prior public market for our common stock, the price of our common stock may be volatile or may decline regardless of our operating performance, and you may not be able to resell your shares at or above the initial public offering price.
There has been no public market for our common stock prior to this initial public offering. The initial public offering price for our common stock was determined through negotiations between the underwriters and us and may vary from the market price of our common stock following our initial public offering. If you purchase shares of our common stock in our initial public offering, you may not be able to resell those shares at or above the initial public offering price. An active or liquid market in our common stock may not develop upon closing of our initial public offering or, if it does develop, it may not be sustainable. The market price of our common stock may fluctuate significantly in response to numerous factors, many of which are beyond our control, including:
| • | our operating performance and the performance of other similar companies; |
| • | the overall performance of the equity markets; |
| • | announcements by us or our competitors of new applications or enhancements, acquisitions, applications, services, strategic alliances, commercial relationships, joint ventures or capital commitments; |
| • | disruptions in our services due to hardware, software or network problems; |
| • | recruitment or departure of key personnel; |
| • | publication of unfavorable research reports about us or our industry or withdrawal of research coverage by securities analysts; |
25
Table of Contents
| • | trading activity by a limited number of stockholders who together beneficially own a majority of our outstanding common stock; |
| • | the size of our public float; |
| • | the economy as a whole, market conditions in our industry and the industries of our clients; and |
| • | economic, legal and regulatory factors unrelated to our performance. |
In addition, the stock markets have experienced extreme price and volume fluctuations that have affected and continue to affect the market prices of equity securities of many technology companies. Stock prices of many technology companies have fluctuated in a manner unrelated or disproportionate to the operating performance of those companies. In the past, stockholders have filed securities class actions following periods of market volatility. If we were to become involved in securities litigation, it could subject us to substantial costs, divert resources and the attention of management from our business, and adversely affect our business, operating results or financial condition.
Substantial blocks of our total outstanding shares may be sold into the market when the “lock-up” period ends. If there are substantial sales of shares of our common stock, the price of our common stock could decline.
The price of our common stock could decline if there are substantial sales of our common stock, particularly sales by our directors, executive officers and significant stockholders, or if there is a large number of shares of our common stock available for sale. Upon the completion of this offering, we expect to have 50,333,739 shares of our common stock outstanding. All of the shares of common stock sold in this offering will be eligible for sale in the public market, unless they are held by our affiliates. Shares held by directors, executive officers and other affiliates will be subject to volume limitations under Rule 144 under the Securities Act of 1933, as amended, or the Securities Act, and various restricted stock award agreements.
After our initial public offering, certain of our stockholders will be subject to lock-up agreements with the underwriters or us that restrict their ability to sell shares of common stock until 181 days after the date of this prospectus. After the lock-up agreements expire, an additional 43,611,701 shares of common stock will be eligible for sale in the public market, subject in many cases to the limitations of either Rule 144 or Rule 701 under the Securities Act. Upon completion of this offering, stockholders owning an aggregate of up to 38,728,664 shares of common stock will be entitled, under a registration rights agreement, to require us to register shares of our common stock owned by them for public sale in the United States. We also intend to register shares of common stock that we have issued and may issue under our employee equity incentive plans. Once we register these shares, they will be able to be sold freely in the public market upon issuance, subject to existing lock-up agreements.
Barclays Capital Inc. and J.P. Morgan Securities LLC, on behalf of the underwriters, may in their discretion permit our stockholders to sell shares prior to the expiration of the restrictive provisions contained in those lock-up agreements. The market price of the shares of our common stock could decline as a result of the sale of a substantial number of our shares of common stock in the public market, the availability of shares for sale or the perception in the market that the holders of a large number of shares intend to sell their shares. In addition, the sale of these shares by stockholders could impair our ability to raise capital through the sale of additional stock.
If securities or industry analysts do not publish research or publish misleading or unfavorable research about our business, our stock price and trading volume could decline.
The trading market for our common stock depends in part on the research and reports that securities or industry analysts publish about us or our business. If no or few securities or industry analysts cover our company, the trading price for our common stock would be negatively impacted. If one or more of the analysts who covers
26
Table of Contents
us downgrades our stock or publishes incorrect or unfavorable research about our business, our common stock price would likely decline. If one or more of these analysts ceases coverage of our company or fails to publish reports on us regularly, demand for our common stock could decrease, which could cause our common stock price or trading volume to decline.
Our principal stockholders will hold a controlling interest after this offering and may make business decisions with which you disagree and which may adversely affect the value of your investment.
After this offering, the parties to the Stockholders Agreement, which includes Chad Richison, Shannon Rowe, William X. Kerber, III, Jeffrey D. York, Robert J. Levenson and the Estate of Richard Aiello and certain of their affiliates or related entities, and the WCAS Funds, or collectively, the Stockholders Agreement Parties, will beneficially own or control, directly or indirectly, 41,111,514 shares of our common stock in the aggregate, or approximately 81.7% of our outstanding shares, or, if the underwriters’ option to purchase additional shares is exercised in full, 40,114,764 shares of common stock in the aggregate equal to approximately 79.7% of our outstanding shares. As a result of this ownership and the provisions of the Stockholders Agreement, the WCAS Funds will have the ability to control matters submitted to our stockholders for approval, including the election and removal of directors, amendments to our certificate of incorporation and bylaws and the approval of any business combination. These actions may be taken even if they are opposed by other stockholders. This concentration of ownership may also have the effect of delaying or preventing a change of control of our company or discouraging others from making tender offers for our shares, which could prevent our stockholders from receiving a premium for their shares.
Some of these persons or entities may have interests different than yours. For example, because many of these stockholders purchased their shares at prices substantially below the price at which shares are being sold in this offering and have held their shares for a longer period, they may be more interested in selling our company to an acquiror than other investors or may want us to pursue strategies that deviate from the interests of other stockholders.
We will be deemed a “controlled company” and, as a result, will qualify for, and intend to rely on, exemptions from certain corporate governance requirements.
After this offering, the Stockholders Agreement Parties will continue to own common stock representing a majority of our outstanding shares of common stock. So long as such persons collectively own a majority of our outstanding shares of common stock, we will be a “controlled company” within the meaning of corporate governance standards of the NYSE. Under those standards, a company of which more than 50% of the voting power for the election of directors is held by another company or group is a “controlled company” and need not comply with certain requirements, including (1) the requirement that a majority of the board of directors consist of independent directors, (2) the requirement that there be a nominating and corporate governance committee composed entirely of independent directors with a written charter addressing the committee’s purpose and responsibilities, (3) the requirement that there be a compensation committee composed entirely of independent directors with a written charter addressing the committee’s purpose and responsibilities and (4) the requirement of an annual performance evaluation of the nominating/corporate governance and compensation committees. We intend to rely on certain of these exemptions following the offering, and may rely on any of these exemptions for so long as we are a “controlled company.” As a result, we will not have a majority of independent directors on our board of directors, and our compensation committee will not consist entirely of independent directors. If we are no longer eligible to rely on the controlled company exception, we intend to comply with all applicable corporate governance requirements, but we will be able to rely on phase-in periods for certain of these requirements in accordance with the NYSE’s rules. Accordingly, our stockholders may not have the same protections afforded to stockholders of companies that are subject to all NYSE corporate governance requirements.
27
Table of Contents
As a new investor, you will incur immediate and substantial dilution as a result of this offering.
The initial public offering price will be substantially higher than the pro forma net tangible book value per share of our outstanding common stock. As a result, investors purchasing common stock in this offering will incur immediate dilution of $18.57 per share, based on an assumed initial public offering price of $19.00 per share, which is the midpoint of the price range set forth on the cover page of the prospectus, and new investors from our sale of shares of our common stock in this offering will own approximately 9.2% of our outstanding common stock. This dilution is due in large part to earlier investors having generally paid substantially less than the initial public offering price when they purchased their shares. In addition, the vesting of restricted stock will, and future equity issuances may, result in further dilution to investors.
The issuance of additional stock in connection with acquisitions, our stock incentive plans, warrants or otherwise will dilute all other stockholdings.
After this offering, our certificate of incorporation will authorize us to issue up to one hundred million shares of common stock and up to ten million shares of preferred stock with such rights and preferences as may be determined by our board of directors. Subject to compliance with applicable rules and regulations, we may issue all of these shares that are not already outstanding without any action or approval by our stockholders. We intend to continue to evaluate strategic acquisitions in the future. We may pay for such acquisitions, partly or in full, through the issuance of additional equity securities.
Any issuance of shares in connection with our acquisitions, the exercise of stock options or warrants, the award of shares of restricted stock or otherwise would dilute the percentage ownership held by the investors who purchase our shares in this offering.
We have broad discretion in the use of a portion of the net proceeds from our initial public offering and may not use them effectively.
We cannot specify with any certainty the particular uses of a portion of the net proceeds that we will receive from our initial public offering. We will have broad discretion in the application of these proceeds, including working capital, possible acquisitions and other general corporate purposes, and we may spend or invest these proceeds in a way with which our stockholders disagree. The failure by our management to apply these proceeds effectively could adversely affect our business, operating results or financial condition. Pending their use, we may invest these proceeds in a manner that does not produce income or that loses value. These investments may not yield a favorable return to our investors.
We do not intend to pay dividends for the foreseeable future.
We currently intend to retain any future earnings to finance the operation and expansion of our business, and we do not expect to declare or pay any dividends in the foreseeable future. Consequently, stockholders must rely on sales of their common stock after price appreciation, which may never occur, as the only way to realize any future gains on their investment.
Anti-takeover provisions in our charter documents and Delaware law may delay or prevent an acquisition of our company.
Our certificate of incorporation, bylaws and Delaware law contain provisions that may have the effect of delaying or preventing a change in control of us or changes in our management. These provisions, alone or together, could delay or prevent hostile takeovers and changes in control or changes in our management. For information regarding these and other provisions, see “Description of Capital Stock.”
Any provision of our certificate of incorporation, bylaws or Delaware law that has the effect of delaying or deterring a change in control could limit the opportunity for our stockholders to receive a premium for their shares of our common stock, and could affect the price that some investors are willing to pay for our common stock.
28
Table of Contents
SPECIAL NOTE REGARDING FORWARD-LOOKING STATEMENTS
This prospectus contains forward-looking statements and information relating to us that are based on the beliefs of our management as well as assumptions made by, and information currently available to, us. These statements include, but are not limited to, statements about our strategies, plans, objectives, expectations, intentions, expenditures, assumptions and other statements contained in this prospectus that are not historical facts. When used in this document, words such as “anticipate,” “believe,” “estimate,” “expect,” “intend,” “may,” “plan” and “project” and similar expressions as they relate to us are intended to identify forward-looking statements. These statements reflect our current views with respect to future events, are not guarantees of future performance and involve risks and uncertainties that are difficult to predict. Further, certain forward-looking statements are based upon assumptions as to future events that may not prove to be accurate.
These forward-looking statements include, but are not limited to, statements concerning our business and strategy, possible or assumed future results of operations, cash flows, capital resources and liquidity, trends, opportunities and risks affecting our business, industry and financial results, future expansion or growth plans and potential for future growth, technology, market opportunities and acceptance by new clients of our solution, and the amount, nature and timing of capital expenditures.
These forward-looking statements involve known and unknown risks, inherent uncertainties and other factors, which may cause our actual results, performance, time frames or achievements to be materially different from any future results, performance, time frames or achievements expressed or implied by the forward-looking statements. Any statements contained herein that are not statements of historical facts may be deemed to be forward-looking statements. Actual results and the timing of certain events may differ materially from those contained in these forward-looking statements.
All forward-looking statements speak only at the date of this prospectus. You should not place undue reliance on these forward-looking statements. Although we believe that our plans, intentions and expectations reflected in or suggested by the forward-looking statements we make in this prospectus are reasonable, we can give no assurance that these plans, intentions or expectations will be achieved. We disclose important factors that could cause our actual results to differ materially from our expectations under “Risk Factors” and “Management’s Discussion and Analysis of Financial Condition and Results of Operations” and elsewhere in this prospectus. These cautionary statements qualify all forward-looking statements attributable to us or persons acting on our behalf. We do not undertake any obligation to update or revise any forward-looking statements except as required by law, including the securities laws of the United States and the rules and regulations of the SEC.
29
Table of Contents
MARKET, INDUSTRY AND OTHER DATA
This prospectus includes industry data and forecasts that we have prepared based, in part, upon data and forecasts obtained from industry publications, surveys and forecasts and internal studies. Third-party industry publications, surveys and forecasts generally state that the information contained therein has been obtained from sources believed to be reliable.
Although certain of the companies that compete in our markets are publicly held as of the date of this prospectus, others are not. Accordingly, only limited public information is available with respect to our relative market strength or competitive position. Unless we state otherwise, our statements about our relative market strength and competitive position in this prospectus are based on our management’s beliefs, internal studies and our management’s knowledge of industry trends. Although we believe that such information is reliable, we have not had this information verified by any independent sources.
30
Table of Contents
Software is a newly formed Delaware corporation that was an indirect wholly-owned subsidiary of Holdings prior to the Reorganization. In anticipation of this offering, Software consummated the Reorganization, as of January 1, 2014, pursuant to which (i) the owners of WCAS Holdings and WCAS CP IV Blocker, Inc., or CP IV Blocker, which are affiliates of Welsh, Carson, Anderson & Stowe, contributed WCAS Holdings and CP IV Blocker, which collectively own all of the Series A Preferred Units of Holdings, to Software in exchange for shares of common stock of Software and (ii) the owners of outstanding Series B Preferred Units of Holdings contributed their Series B Preferred Units for shares of common stock of Software.
Immediately after these contributions, a wholly-owned subsidiary of Software merged with and into Holdings with Holdings surviving the merger. Upon consummation of the merger, the remaining holders of outstanding common and incentive units of Holdings received shares of common stock of Software for their common and incentive units by operation of Delaware law and Holdings’ ownership interest in Software was cancelled. Outstanding common units, Series B Preferred Units and WCAS Holdings and CP IV Blocker were contributed to Software in exchange for, or converted into, 45,708,573 shares of common stock and 8,121,101 restricted shares of common stock of Software.
Following these transactions, all outstanding Series C Preferred Units were eliminated in an intercompany transaction between Holdings and WCAS Holdings, and we assumed the 14% Note due 2017 issued by WCAS Holdings, or the 2017 Note. Following the Reorganization, Software became a holding company with its principal asset being the units of Holdings. We refer to these transactions collectively as the Reorganization. Unless otherwise indicated, or the context otherwise requires, all information in this prospectus is presented giving effect to the Reorganization. For additional information concerning the conversion rates in the Reorganization, see “Unaudited Pro Forma Condensed Consolidated Financial Information, Note 1. Basis of Presentation,” which description is incorporated by reference herein.
The following diagram depicts our corporate structure immediately after the completion of this offering. We will directly or indirectly hold 100% of the ownership interests in each of our subsidiaries:
31
Table of Contents
We estimate that our net proceeds from the sale of the common stock that we are offering will be approximately $78.0 million, assuming an initial public offering price of $19.00 per share, which is the midpoint of the price range on the cover page of this prospectus, and after deducting estimated underwriting discounts and commissions and estimated offering expenses payable by us. A $1.00 increase or decrease in the assumed initial public offering price of $19.00 per share would increase or decrease, as applicable, the net proceeds to us from our initial public offering by $4.3 million, assuming the number of shares offered by us, as set forth on the cover page of this prospectus, remains the same, after deducting estimated underwriting discounts and commissions and estimated offering expenses payable by us.
We intend to use the net proceeds we receive from this offering for (i) the repayment of a 10% Senior Note due 2022, or the 2022 Note, issued by us to an affiliate of Welsh, Carson, Anderson & Stowe, (ii) the repayment of the 2017 Note, assumed in the Reorganization and (iii) general corporate purposes, including additions to working capital and capital expenditures. We intend to use the following amounts of the net proceeds for the above uses:
| Amount (in millions) |
||||
| Use of Net Proceeds |
||||
| Contribution agreement payments(1) |
$ | 0.1 | ||
| Repayment of the 2022 Note(2) |
18.8 | |||
| Repayment of the 2017 Note(3) |
46.1 | |||
| General corporate purposes |
13.0 | |||
|
|
|
|||
| Total net proceeds |
$ | 78.0 | ||
|
|
|
|||
| (1) | We are required to direct a portion of any repayment of the 2017 Note to the Estate of Richard Aiello and Mr. Levenson and certain of their affiliated or related entities pursuant to the terms of a Contribution Agreement entered into in connection with the Reorganization. See “Certain Relationships and Related Party Transactions— Contribution Agreement.” |
| (2) | As of December 31, 2013, we had $18.8 million outstanding under the 2022 Note. The 2022 Note accrues interest at 10% per annum and matures on April 3, 2022. |
| (3) | As of December 31, 2013, we had Series C Preferred Units outstanding. In connection with the Reorganization, we eliminated the Series C Preferred Units as an intercompany transaction, and assumed the 2017 Note. The 2017 Note accrues interest at 14% per annum and matures on April 3, 2017. Any amounts paid to the Estate of Richard Aiello and Mr. Levenson and certain of their affiliated or related entities as described in Note (1) above will be deemed to have been paid to WCAS X and WCAS Management Corporation, and will reduce the amounts required to be paid under the 2017 Note. |
Pending other uses, we intend to invest the proceeds in interest-bearing, investment-grade instruments, certificates of deposit or direct or guaranteed obligations of the U.S. government, or we may hold the proceeds as cash. We cannot predict whether the proceeds invested will yield a favorable return. Our management will have broad discretion in the application of the net proceeds we receive from our initial public offering, and investors will be relying on the judgment of our management regarding the application of the net proceeds.
We will not receive any proceeds from the sale of shares offered by the selling stockholders, who include a director and certain entities affiliated with members of our board of directors.
32
Table of Contents
We do not currently plan to pay a regular dividend on our common stock following this offering. The declaration, amount and payment of any future dividends on shares of common stock will be at the sole discretion of our board of directors and we may reduce or discontinue entirely the payment of such dividends at any time. Our board of directors may take into account general and economic conditions, our financial condition and operating results, our available cash and current and anticipated cash needs, capital requirements, contractual, legal, tax and regulatory restrictions and implications of the payment of dividends by us to our stockholders or by our subsidiaries to us, and such other factors as our board of directors may deem relevant. Our Consolidated, Amended and Restated Loan Agreement, or the 2011 Consolidated Loan, and Loan Agreement, or the 2013 Consolidated Loan, with Kirkpatrick Bank each prohibit the payment of dividends while an event of default exists under the Consolidated Loan or the Construction Loan, respectively, and any future debt agreements that we may enter into the future may prohibit the payment of dividends.
We are a holding company that has no material assets other than our indirect ownership of all of the outstanding units of Holdings. In the event that we decide to pay dividends in the future, we intend to cause Holdings to make distributions to us in an amount sufficient to cover cash dividends, if any, declared by us. Any financing arrangements that we enter into in the future may include restrictive covenants that limit our or our subsidiaries’ ability to pay dividends.
In April 2011 and September 2011, we paid cash distributions of $432,000 and $1,300, respectively, to our common unit holders for the payment of taxes. In April 2012 and October 2012, we paid cash distributions of $120,000 and $2,000, respectively, to our common unit holders for the payment of taxes. We also paid a cash distribution of $18,807,000 to our common unit holders in April 2012 as part of the April 2012 Corporate Reorganization (as defined herein). In April 2013 and December 2013, we paid cash distributions of $1,766,000 and $4,000,000, respectively, to our common unit holders and Series A Preferred unit holders for the payment of taxes.
33
Table of Contents
The following table sets forth our cash and cash equivalents and capitalization as of December 31, 2013 as follows:
| • | on an actual basis; |
| • | on a pro forma basis, giving effect to the Reorganization; and |
| • | on a pro forma as further adjusted basis, giving effect to (i) the issuance and sale by us of shares of common stock in this offering, assuming an initial public offering price of $19.00 per share, which is the midpoint of the price range on the cover page of this prospectus and (ii) the application of the net proceeds as described in “Use of Proceeds.” |
You should read this table in conjunction with the sections entitled “The Reorganization,” “Selected Consolidated Financial Data,” “Management’s Discussion and Analysis of Financial Condition and Results of Operations,” “Description of Capital Stock” and our consolidated financial statements and related notes as of December 31, 2013, 2012 and 2011 included elsewhere in this prospectus.
| As of December 31, 2013 |
||||||||||||
| Actual | Pro forma as adjusted for the Reorganization |
Pro forma as further adjusted(1) |
||||||||||
| (in thousands, except share and per share data) | ||||||||||||
| Cash and cash equivalents |
$ | 13,273 | $ | 13,364 | $ | 26,336 | ||||||
|
|
|
|
|
|
|
|||||||
| Current portion of long-term debt |
9,545 | 9,545 | 9,545 | |||||||||
| Long-term debt, less current portion |
11,545 | 11,545 | 11,545 | |||||||||
| Long-term debt to related party |
14,682 | 60,875 | — | |||||||||
| Members’ equity / stockholders’ equity |
||||||||||||
| Common stock, $0.01 par value, no shares authorized, no shares issued and outstanding, actual; 100,000,000 shares authorized, 45,708,573 shares issued and outstanding, pro forma as adjusted for the Reorganization; 100,000,000 shares authorized, 50,315,455 shares issued and outstanding, pro forma as further adjusted |
— | 17,452 | 17,498 | |||||||||
| Additional paid in capital |
— | (12,340 | ) | 75,145 | ||||||||
| Members’ capital |
63,645 | — | — | |||||||||
| Accumulated deficit |
(13,385 | ) | (37 | ) | (3,055 | ) | ||||||
|
|
|
|
|
|
|
|||||||
| Total members’ equity / stockholders’ equity |
50,260 | 5,075 | 89,588 | |||||||||
|
|
|
|
|
|
|
|||||||
| Total capitalization |
$ | 86,032 | $ | 87,040 | $ | 110,678 | ||||||
|
|
|
|
|
|
|
|||||||
| (1) | A $1.00 increase or decrease in the assumed initial public offering price of $19.00 per share, which is the midpoint of the price range set forth on the cover page of this prospectus, would increase or decrease, as applicable, our as adjusted cash and cash equivalents, additional paid-in capital, total stockholders’ equity and total capitalization by approximately $4.3 million, assuming that the number of shares offered by us, as set forth on the cover page of this prospectus, remains the same, after deducting underwriting discounts and commissions and estimated offering expense payable by us. |
34
Table of Contents
If you invest in our common stock, you will experience immediate and substantial dilution in the pro forma as adjusted net tangible book value of your shares. Dilution in pro forma as adjusted net tangible book value represents the difference between the public offering price per share of our common stock in this offering and the pro forma as adjusted net tangible book value per share of our common stock immediately after the offering.
Our pro forma net tangible book value as of December 31, 2013 was $(53.5) million, or $(1.17) per share of common stock. Our pro forma net tangible book value per share represents the amount of our total tangible assets reduced by the amount of our total liabilities and divided by the total number of shares of our common stock outstanding as of December 31, 2013, after giving effect to the Reorganization.
After giving effect to our sale in our initial public offering of 4,606,882 shares of common stock at an assumed initial public offering price of $19.00 per share, which is the midpoint of the price range on the cover page of this prospectus, and after deducting estimated underwriting discounts and commissions and estimated offering expenses payable by us, our pro forma as adjusted net tangible book value as of December 31, 2013 would have been approximately $21.5 million, or $0.43 per share of common stock. This represents an immediate increase in pro forma as adjusted net tangible book value of $1.60 per share to our existing stockholders and an immediate dilution of $18.57 per share to investors purchasing shares in our initial public offering.
The following table illustrates this per share dilution:
| Assumed initial offering price per share |
$ | 19.00 | ||||||
| Pro forma net tangible book value per share as of December 31, 2013 |
$ | (1.17 | ) | |||||
| Increase in pro forma net tangible book value per share attributable to investors purchasing shares in our initial public offering |
$ | 1.60 | ||||||
|
|
|
|||||||
| Pro forma as adjusted net tangible book value per share after our initial public offering |
$ | 0.43 | ||||||
|
|
|
|||||||
| Dilution in pro forma as adjusted net tangible book value per share to investors in this offering |
$ | 18.57 | ||||||
|
|
|
A $1.00 increase or decrease in the assumed initial public offering price of $19.00 per share, which is the midpoint of the price range set forth on the cover page of this prospectus, would increase or decrease, as applicable, our pro forma net tangible book value per share after our initial public offering by $0.08, assuming that the number of shares offered by us, as set forth on the cover page of this prospectus, remains the same, after deducting the estimated underwriting discounts and commissions and estimated offering expenses payable by us.
The following table summarizes on a pro forma as adjusted basis as of December 31, 2013, after giving effect to the Reorganization, the differences between the number of shares of our common stock purchased from us, the total cash consideration paid and the average price per share paid by our existing stockholders and by our new investors purchasing shares in our initial public offering at the assumed initial public offering price of the common stock of $19.00 per share, which is the midpoint of the price range on the cover page of this prospectus, before deducting estimated underwriting discounts and commissions and estimated offering expenses payable by us:
| Shares Purchased | Total Consideration | Average Price Per Share |
||||||||||||||||||
| Number | Percent | Amount | Percent | |||||||||||||||||
| Existing stockholders |
45,708,573 | 90.8 | % | 5,112,000 | 5.5 | % | $ | 0.11 | ||||||||||||
| New investors |
4,606,882 | 9.2 | % | 87,530,758 | 94.5 | % | $ | 19.00 | ||||||||||||
| Total |
50,315,455 | 100.0 | % | 92,642,758 | 100 | % | ||||||||||||||
35
Table of Contents
A $1.00 increase or decrease in the assumed initial public offering price of $19.00 per share, which is the midpoint of the price range set forth on the cover page of this prospectus, would increase or decrease, as applicable, the total consideration paid by new investors by $4.3 million, assuming that the number of shares offered by us, as set forth on the cover page of this prospectus, remains the same, and before deducting the estimated underwriting discounts and commissions and estimated offering expenses payable by us.
If the underwriters exercise their over-allotment option in full, our existing stockholders would own 90.8% and our new investors would own 9.2% of the total number of shares of our common stock outstanding after our initial public offering.
The number of common shares shown above to be outstanding after this offering is based on 50,315,455 shares of our common stock outstanding as of December 31, 2013 after giving effect to the Reorganization and excludes the following:
| • | 8,121,101 shares of restricted common stock that are subject to time-based or performance-based vesting conditions, which includes 217,378 shares of restricted stock that vest upon the sale of our common stock in the initial public offering; |
| • | 3,229,780 shares of our common stock reserved for future issuance under the 2014 Plan that we adopted in connection with the Reorganization; and |
| • | any exercise by the underwriters of their option to purchase 996,750 additional shares of our common stock from the selling stockholders. |
36
Table of Contents
SELECTED CONSOLIDATED FINANCIAL DATA
We have derived the consolidated statements of income data for the years ended December 31, 2013, 2012 and 2011 and the consolidated balance sheet data as of December 31, 2013 and 2012 from our audited consolidated financial statements included elsewhere in this prospectus. We have derived the consolidated statements of income data for the years ended December 31, 2010 and 2009 and the audited consolidated balance sheet data as of December 31, 2011, 2010 and 2009 from our audited consolidated financial statements not included in this prospectus. Historical results are not necessarily indicative of results for any future period.
Our selected consolidated financial data set forth below should be read together with “Capitalization,” “Management’s Discussion and Analysis of Financial Condition and Results of Operations” and our consolidated financial statements and the related notes thereto, which are included elsewhere in this prospectus.
| Year Ended December 31, |
||||||||||||||||||||
| 2013 | 2012 | 2011 | 2010 | 2009 | ||||||||||||||||
| (in thousands, except per unit amounts) | ||||||||||||||||||||
| Revenues: |
||||||||||||||||||||
| Recurring |
$ | 105,560 | $ | 75,420 | $ | 56,382 | $ | 40,585 | $ | 29,260 | ||||||||||
| Implementation and other |
2,041 | 1,390 | 824 | 716 | 618 | |||||||||||||||
|
|
|
|
|
|
|
|
|
|
|
|||||||||||
| Total revenues |
107,601 | 76,810 | 57,206 | 41,301 | 29,878 | |||||||||||||||
| Expenses: |
||||||||||||||||||||
| Cost of revenues: |
||||||||||||||||||||
| Operating expenses |
19,070 | 14,895 | 12,287 | 8,927 | 5,880 | |||||||||||||||
| Depreciation |
1,821 | 1,431 | 987 | 675 | 457 | |||||||||||||||
|
|
|
|
|
|
|
|
|
|
|
|||||||||||
| Total cost of revenues |
20,891 | 16,326 | 13,274 | 9,602 | 6,337 | |||||||||||||||
| Administrative expenses: |
||||||||||||||||||||
| Sales and marketing |
42,681 | 29,255 | 22,244 | 15,743 | 11,212 | |||||||||||||||
| Research and development |
2,146 | 1,632 | 1,225 | 977 | 665 | |||||||||||||||
| General and administrative |
28,884 | 19,450 | 14,707 | 11,040 | 8,327 | |||||||||||||||
| Depreciation and amortization |
3,682 | 4,092 | 4,300 | 4,091 | 4,074 | |||||||||||||||
|
|
|
|
|
|
|
|
|
|
|
|||||||||||
| Total administrative expenses |
77,393 | 54,429 | 42,476 | 31,851 | 24,278 | |||||||||||||||
|
|
|
|
|
|
|
|
|
|
|
|||||||||||
| Operating income (loss) |
9,317 | 6,055 | 1,456 | (152 | ) | (737 | ) | |||||||||||||
| Interest expense |
(2,805 | ) | (2,171 | ) | (134 | ) | — | (5 | ) | |||||||||||
| Other income, net |
1,199 | 354 | 108 | 129 | 281 | |||||||||||||||
|
|
|
|
|
|
|
|
|
|
|
|||||||||||
| Net income (loss) |
$ | 7,711 | $ | 4,238 | $ | 1,430 | $ | (23 | ) | $ | (461 | ) | ||||||||
|
|
|
|
|
|
|
|
|
|
|
|||||||||||
| Less: Distribution to Series C Preferred Unitholder |
(6,467 | ) | (4,806 | ) | — | — | — | |||||||||||||
|
|
|
|
|
|
|
|
|
|
|
|||||||||||
| Net income (loss) available to Series A Preferred Unitholders and common unitholders |
$ | 1,244 | $ | (568 | ) | $ | 1,430 | $ | (23 | ) | $ | (461 | ) | |||||||
|
|
|
|
|
|
|
|
|
|
|
|||||||||||
| Net income (loss) per Series A Preferred Unit and common unit |
||||||||||||||||||||
| Basic |
$ | 1.30 | $ | (0.60 | ) | $ | 1.53 | $ | (0.02 | ) | $ | (0.49 | ) | |||||||
|
|
|
|
|
|
|
|
|
|
|
|||||||||||
| Diluted(1) |
$ | 1.22 | $ | (0.57 | ) | $ | 1.49 | $ | (0.02 | ) | $ | (0.49 | ) | |||||||
|
|
|
|
|
|
|
|
|
|
|
|||||||||||
| Weighted average units outstanding |
||||||||||||||||||||
| Basic |
955,983 | 948,181 | 935,750 | 950,000 | 950,000 | |||||||||||||||
|
|
|
|
|
|
|
|
|
|
|
|||||||||||
| Diluted(1) |
1,018,305 | 1,004,436 | 960,611 | 950,000 | 950,000 | |||||||||||||||
|
|
|
|
|
|
|
|
|
|
|
|||||||||||
37
Table of Contents
| As of December 31, | ||||||||||||||||||||
| 2013 | 2012 | 2011 | 2010 | 2009 | ||||||||||||||||
| (in thousands) |
||||||||||||||||||||
| Consolidated balance sheet data: |
||||||||||||||||||||
| Cash and cash equivalents |
$ | 13,273 | $ | 13,435 | $ | 7,252 | $ | 6,106 | $ | 5,609 | ||||||||||
| Restricted cash |
369 | 368 | 251 | — | — | |||||||||||||||
| Working capital (deficit)(2) |
(7,933 | ) | 5,096 | 3,647 | 3,126 | 3,343 | ||||||||||||||
| Property, plant and equipment, net |
38,671 | 25,139 | 22,305 | 9,492 | 2,445 | |||||||||||||||
| Total assets |
571,567 | 425,857 | 347,575 | 249,153 | 226,449 | |||||||||||||||
| Deferred revenue |
12,572 | 8,393 | 5,614 | 3,430 | 2,203 | |||||||||||||||
| Long-term debt |
21,090 | 14,110 | 12,761 | 3,149 | — | |||||||||||||||
| Long-term debt to related party |
14,682 | 14,440 | — | — | — | |||||||||||||||
| Members’ capital |
63,645 | 63,542 | 79,373 | 80,208 | 80,075 | |||||||||||||||
| Accumulated deficit |
(13,385 | ) | (8,871 | ) | (8,143 | ) | (8,130 | ) | (7,137 | ) | ||||||||||
| Total members’ equity |
50,260 | 54,671 | 71,230 | 72,078 | 72,938 | |||||||||||||||
| (1) | Diluted impact of incentive units have not been included to determine the diluted net loss per Series A Preferred Unit and common unit for the years ended December 31, 2010 and 2009 as we reported a net loss for those reporting periods. |
| (2) | Working capital (deficit) is defined as current assets, excluding restricted cash, less current liabilities, excluding current portion of deferred revenue. |
38
Table of Contents
UNAUDITED PRO FORMA CONDENSED CONSOLIDATED FINANCIAL INFORMATION
The following unaudited pro forma condensed consolidated financial information presents our unaudited pro forma condensed consolidated balance sheet and unaudited pro forma condensed consolidated statements of income based upon our historical financial statements, after giving effect to the Reorganization and the initial public offering described in the accompanying notes. The following unaudited pro forma condensed consolidated financial information was prepared using the assumptions set forth in the notes to the unaudited pro forma condensed consolidated financial information and on a basis consistent with that used in preparing our audited consolidated financial statements and includes all adjustments, consisting of normal and recurring items, that we consider necessary for a fair presentation of our financial position and results of operations for the unaudited periods. The unaudited pro forma condensed consolidated financial information was prepared in accordance with Article 11 of Regulation S-X.
The unaudited pro forma condensed consolidated balance sheet as of December 31, 2013 reflects the Reorganization and the initial public offering as if they occurred on December 31, 2013. The unaudited pro forma condensed consolidated statements of income for the years ended December 31, 2013, 2012 and 2011 reflect the Reorganization and the initial public offering as if they occurred January 1, 2011, the beginning of the earliest period presented.
The unaudited pro forma condensed consolidated financial information assumes that the shares of common stock to be sold in this offering are sold at $19.00 per share of common stock, which is the midpoint of the price range indicated on the front cover of this prospectus.
The unaudited pro forma condensed consolidated financial information is provided for informational purposes only and is not necessarily indicative of the operating results or financial position that would have occurred if the Reorganization and initial public offering had been completed as of the dates set forth above, nor is it indicative of our future results or financial position of our company. The unaudited pro forma condensed consolidated financial information should be read in conjunction with the sections of this prospectus entitled “Use of Proceeds,” “Management’s Discussion and Analysis of Financial Condition and Results of Operations,” and our historical consolidated financial statements and related notes thereto included elsewhere in this prospectus.
39
Table of Contents
UNAUDITED PRO FORMA CONDENSED CONSOLIDATED BALANCE SHEET
AS OF DECEMBER 31, 2013
(IN THOUSANDS, EXCEPT PER UNIT AND SHARE AMOUNTS)
| Historical | Pro forma adjustments for the Reorganization |
Pro forma as adjusted for the Reorganization |
Pro forma adjustments for the initial public offering |
Pro forma as adjusted for the Reorganization and initial public offering |
||||||||||||||||||||||||
| Assets |
||||||||||||||||||||||||||||
| Current assets |
||||||||||||||||||||||||||||
| Cash and cash equivalents |
$ | 13,273 | $ | 90 | (2c | ) | $ | 13,364 | $ | — | $ | 13,364 | ||||||||||||||||
| 1 | (2d | ) | ||||||||||||||||||||||||||
| Deferred tax asset |
— | 3,622 | (2c | ) | 3,622 | — | 3,622 | |||||||||||||||||||||
| Other current assets before funds held for clients |
4,785 | — | 4,785 | — | 4,785 | |||||||||||||||||||||||
| Funds held for clients |
455,779 | — | 455,779 | — | 455,779 | |||||||||||||||||||||||
|
|
|
|
|
|
|
|
|
|
|
|||||||||||||||||||
| Total current assets |
473,837 | 3,713 | 477,550 | — | 477,550 | |||||||||||||||||||||||
| Deferred tax asset |
— | 45 | (2a | ) | 70 | — | 70 | |||||||||||||||||||||
| 25 | (2d | ) | ||||||||||||||||||||||||||
| Goodwill |
51,889 | — | 51,889 | — | 51,889 | |||||||||||||||||||||||
| Other long-term assets |
45,841 | — | 45,841 | — | 45,841 | |||||||||||||||||||||||
|
|
|
|
|
|
|
|
|
|
|
|||||||||||||||||||
| Total assets |
$ | 571,567 | $ | 3,783 | $ | 575,350 | $ | — | $ | 575,350 | ||||||||||||||||||
|
|
|
|
|
|
|
|
|
|
|
|||||||||||||||||||
| Liabilities and Member’s Equity / Stockholders’ Equity |
||||||||||||||||||||||||||||
| Income tax payable |
$ | — | $ | 20 | (2d | ) | $ | 20 | $ | — | $ | 20 | ||||||||||||||||
| Other current liabilities before client funds obligations |
27,204 | — | 27,204 | — | 27,204 | |||||||||||||||||||||||
| Client fund obligation |
455,779 | — | 455,779 | — | 455,779 | |||||||||||||||||||||||
|
|
|
|
|
|
|
|
|
|
|
|||||||||||||||||||
| Total current liabilities |
482,983 | 20 | 483,003 | — | 483,003 | |||||||||||||||||||||||
| Deferred tax liabilities |
— | 2,755 | (2c | ) | 2,755 | — | 2,755 | |||||||||||||||||||||
| Long-term debt to related party |
14,682 | 46,193 | (2e | ) | 60,875 | (60,875 | ) | (2f | ) | — | ||||||||||||||||||
| Derivative liability |
1,107 | — | 1,107 | (1,107 | ) | (2f | ) | — | ||||||||||||||||||||
| Other long-term liabilities |
22,535 | — | 22,535 | — | 22,535 | |||||||||||||||||||||||
|
|
|
|
|
|
|
|
|
|
|
|||||||||||||||||||
| Total long-term liabilities |
38,324 | 48,948 | 87,272 | (61,982 | ) | 25,290 | ||||||||||||||||||||||
|
|
|
|
|
|
|
|
|
|
|
|||||||||||||||||||
| Members’ equity / Stockholders’ equity |
||||||||||||||||||||||||||||
| Members’ capital |
63,645 | (17,452 | ) | (2b | ) | — | — | — | ||||||||||||||||||||
| (46,193 | ) | (2e | ) | |||||||||||||||||||||||||
| Preferred stock, no shares authorized, no shares issued and outstanding, actual; 10,000,000 authorized, no shares issued and outstanding on a pro forma basis |
— | — | — | — | — | |||||||||||||||||||||||
| Common stock, no shares authorized, no shares issued and outstanding, actual; 100,000,000 shares authorized, 50,315,455 shares issued and outstanding on a pro forma basis |
— | 17,452 | (2b | ) | 17,452 | 33 | (2f | ) | 17,485 | |||||||||||||||||||
| Additional paid in capital |
— | 1,039 | (2c | ) | (12,340 | ) | 64,967 | (2f | ) | 52,627 | ||||||||||||||||||
| 6 | (2d | ) | ||||||||||||||||||||||||||
| (13,385 | ) | (2g | ) | |||||||||||||||||||||||||
| Accumulated deficit |
(13,385 | ) | 46 | (2a | ) | (37 | ) | (3,018 | ) | (2f | ) | (3,055 | ) | |||||||||||||||
| (83 | ) | (2c | ) | |||||||||||||||||||||||||
| 13,385 | (2g | ) | ||||||||||||||||||||||||||
|
|
|
|
|
|
|
|
|
|
|
|||||||||||||||||||
| Total members’ equity / stockholders’ equity |
50,260 | (45,185 | ) | 5,075 | 61,982 | 67,057 | ||||||||||||||||||||||
|
|
|
|
|
|
|
|
|
|
|
|||||||||||||||||||
| Total liabilities and members’ equity / stockholders’ equity |
$ | 571,567 | $ | 3,783 | $ | 575,350 | $ | — | $ | 575,350 | ||||||||||||||||||
|
|
|
|
|
|
|
|
|
|
|
|||||||||||||||||||
40
Table of Contents
UNAUDITED PRO FORMA CONDENSED CONSOLIDATED STATEMENT OF INCOME
FOR THE YEAR ENDED DECEMBER 31, 2013
(IN THOUSANDS, EXCEPT PER UNIT AND SHARE AMOUNTS)
| Historical | Pro forma adjustments for the Reorganization |
Pro Forma as adjusted for the Reorganization |
Pro forma adjustments for the initial public offering |
Pro forma as adjusted for the Reorganization and initial public offering |
||||||||||||||||||||||
| Revenues |
||||||||||||||||||||||||||
| Recurring |
$ | 105,560 | $ | — | 105,560 | $ | — | $ | 105,560 | |||||||||||||||||
| Implementation and other |
2,041 | — | 2,041 | — | 2,041 | |||||||||||||||||||||
|
|
|
|
|
|
|
|
|
|
|
|||||||||||||||||
| Total revenues |
107,601 | — | 107,601 | — | 107,601 | |||||||||||||||||||||
| Cost of revenues |
||||||||||||||||||||||||||
| Operating expenses |
19,070 | — | 19,070 | — | 19,070 | |||||||||||||||||||||
| Depreciation |
1,821 | — | 1,821 | — | 1,821 | |||||||||||||||||||||
|
|
|
|
|
|
|
|
|
|
|
|||||||||||||||||
| Total cost of revenues |
20,891 | — | 20,891 | — | 20,891 | |||||||||||||||||||||
| Administrative expenses |
||||||||||||||||||||||||||
| Sales and marketing |
42,681 | — | 42,681 | — | 42,681 | |||||||||||||||||||||
| Research and development |
2,146 | — | 2,146 | — | 2,146 | |||||||||||||||||||||
| General and administrative |
28,884 | 307 | (3a | ) | 29,191 | — | 29,191 | |||||||||||||||||||
| Depreciation and amortization |
3,682 | — | 3,682 | — | 3,682 | |||||||||||||||||||||
|
|
|
|
|
|
|
|
|
|
|
|||||||||||||||||
| Total administrative expenses |
77,393 | 307 | 77,700 | — | 77,700 | |||||||||||||||||||||
| Total operating expenses |
98,284 | 307 | 98,591 | — | 98,591 | |||||||||||||||||||||
| Operating income (loss) |
9,317 | (307 | ) | 9,010 | — | 9,010 | ||||||||||||||||||||
| Interest expense |
(2,805 | ) | (6,467 | ) | (3c | ) | (9,272 | ) | 2,122 | (3d) | (683 | ) | ||||||||||||||
| 6,467 | (3c) | |||||||||||||||||||||||||
| Other income (expense), net |
1,199 | 14 | (3a | ) | 1,213 | (660 | ) | (3e) | 553 | |||||||||||||||||
|
|
|
|
|
|
|
|
|
|
|
|||||||||||||||||
| Income before income taxes |
7,711 | (6,760 | ) | 951 | 7,929 | 8,880 | ||||||||||||||||||||
| Provision for income taxes |
— | 3,007 | (3b | ) | 370 | 3,092 | (3f) | 3,462 | ||||||||||||||||||
| (2,637 | ) | (3f | ) | |||||||||||||||||||||||
|
|
|
|
|
|
|
|
|
|
|
|||||||||||||||||
| Net income (loss) |
$ | 7,711 | $ | (7,130 | ) | $ | 581 | $ | 4,837 | $ | 5,418 | |||||||||||||||
|
|
|
|
|
|
|
|
|
|
|
|||||||||||||||||
| Less: Distribution to Series C Preferred Unitholder |
(6,467 | ) | ||||||||||||||||||||||||
|
|
|
|||||||||||||||||||||||||
| Net income available to Series A Preferred Unitholders and common unitholders |
$ | 1,244 | ||||||||||||||||||||||||
|
|
|
|||||||||||||||||||||||||
| Net income per Series A Preferred Units and common unit |
||||||||||||||||||||||||||
| Basic |
$ | 1.30 | ||||||||||||||||||||||||
| Diluted |
$ | 1.22 | ||||||||||||||||||||||||
| Weighted average units outstanding |
||||||||||||||||||||||||||
| Basic |
955,983 | |||||||||||||||||||||||||
| Diluted |
1,018,305 | |||||||||||||||||||||||||
| Pro forma net income per share |
||||||||||||||||||||||||||
| Basic |
(3g | ) | $ | 0.01 | (3h) |
$ | 0.11 | |||||||||||||||||||
|
|
|
|
|
|||||||||||||||||||||||
| Diluted |
(3g | ) | $ | 0.01 | (3h) |
$ | 0.10 | |||||||||||||||||||
|
|
|
|
|
|||||||||||||||||||||||
| Pro forma weighted average shares outstanding |
||||||||||||||||||||||||||
| Basic |
(3g | ) | 47,686,326 | (3h) |
51,107,379 | |||||||||||||||||||||
|
|
|
|
|
|||||||||||||||||||||||
| Diluted |
(3g | ) | 48,371,489 | (3h) |
51,792,542 | |||||||||||||||||||||
|
|
|
|
|
|||||||||||||||||||||||
41
Table of Contents
UNAUDITED PRO FORMA CONDENSED CONSOLIDATED STATEMENT OF INCOME
FOR THE YEAR ENDED DECEMBER 31, 2012
(IN THOUSANDS, EXCEPT PER UNIT AND SHARE AMOUNTS)
| Historical | Pro forma adjustments for the Reorganization |
Pro Forma as adjusted for the Reorganization |
Pro forma adjustments for the initial public offering |
Pro forma as adjusted for the Reorganization and initial public offering |
||||||||||||||||||||||||
| Revenues |
||||||||||||||||||||||||||||
| Recurring |
$ | 75,420 | $ | — | 75,420 | $ | — | $ | 75,420 | |||||||||||||||||||
| Implementation and other |
1,390 | — | 1,390 | — | 1,390 | |||||||||||||||||||||||
|
|
|
|
|
|
|
|
|
|
|
|||||||||||||||||||
| Total revenues |
76,810 | — | 76,810 | — | 76,810 | |||||||||||||||||||||||
| Cost of revenues |
— | |||||||||||||||||||||||||||
| Operating expenses |
14,895 | — | 14,895 | — | 14,895 | |||||||||||||||||||||||
| Depreciation |
1,431 | — | 1,431 | — | 1,431 | |||||||||||||||||||||||
|
|
|
|
|
|
|
|
|
|
|
|||||||||||||||||||
| Total cost of revenues |
16,326 | — | 16,326 | — | 16,326 | |||||||||||||||||||||||
| Administrative expenses |
— | |||||||||||||||||||||||||||
| Sales and marketing |
29,255 | — | 29,255 | — | 29,255 | |||||||||||||||||||||||
| Research and development |
1,632 | — | 1,632 | — | 1,632 | |||||||||||||||||||||||
| General and administrative |
19,450 | 2 | (3a | ) | 19,452 | — | 19,452 | |||||||||||||||||||||
| Depreciation and amortization |
4,092 | — | 4,092 | — | 4,092 | |||||||||||||||||||||||
|
|
|
|
|
|
|
|
|
|
|
|||||||||||||||||||
| Total administrative expenses |
54,429 | 2 | 54,431 | — | 54,431 | |||||||||||||||||||||||
| Total operating expenses |
70,755 | 2 | 70,757 | — | 70,757 | |||||||||||||||||||||||
| Operating income (loss) |
6,055 | (2 | ) | 6,053 | — | 6,053 | ||||||||||||||||||||||
| Interest expense |
(2,171 | ) | (6,467 | ) | (3c | ) | (8,638 | ) | 1,397 | (3d | ) | (774 | ) | |||||||||||||||
| 6,467 | (3c | ) | ||||||||||||||||||||||||||
| Other income (expense), net |
354 | 15 | (3a | ) | 369 | (333 | ) | (3e | ) | 36 | ||||||||||||||||||
|
|
|
|
|
|
|
|
|
|
|
|||||||||||||||||||
| Income before income taxes |
4,238 | (6,454 | ) | (2,216 | ) | 7,531 | 5,315 | |||||||||||||||||||||
| Provision for income taxes |
— | 1,653 | (3b | ) | (869 | ) | 2,937 | (3f | ) | 2,068 | ||||||||||||||||||
| (2,522 | ) | (3f | ) | |||||||||||||||||||||||||
|
|
|
|
|
|
|
|
|
|
|
|||||||||||||||||||
| Net income (loss) |
$ | 4,238 | $ | (5,585 | ) | $ | (1,347 | ) | $ | 4,594 | $ | 3,247 | ||||||||||||||||
|
|
|
|
|
|
|
|
|
|
|
|||||||||||||||||||
| Less: Distribution to Series C Preferred unitholders |
(4,806 | ) | ||||||||||||||||||||||||||
|
|
|
|||||||||||||||||||||||||||
| Net loss available to Series A Preferred unitholders and common unitholders |
$ | (568 | ) | |||||||||||||||||||||||||
|
|
|
|||||||||||||||||||||||||||
| Net loss per Series A Preferred Unit and common unit |
||||||||||||||||||||||||||||
| Basic |
$ | (0.60 | ) | |||||||||||||||||||||||||
|
|
|
|||||||||||||||||||||||||||
| Diluted |
$ | (0.57 | ) | |||||||||||||||||||||||||
|
|
|
|||||||||||||||||||||||||||
| Weighted average units outstanding |
||||||||||||||||||||||||||||
| Basic |
948,181 | |||||||||||||||||||||||||||
|
|
|
|||||||||||||||||||||||||||
| Diluted |
1,004,436 | |||||||||||||||||||||||||||
|
|
|
|||||||||||||||||||||||||||
| Pro forma net loss per share |
||||||||||||||||||||||||||||
| Basic |
(3g | ) | $ | (0.03 | ) | (3h | ) | $ | 0.06 | |||||||||||||||||||
|
|
|
|
|
|||||||||||||||||||||||||
| Diluted |
(3g | ) | $ | (0.03 | ) | (3h | ) | $ | 0.06 | |||||||||||||||||||
|
|
|
|
|
|||||||||||||||||||||||||
| Pro forma weighted average shares outstanding |
||||||||||||||||||||||||||||
| Basic |
(3g | ) | 47,686,326 | (3h | ) | 51,107,379 | ||||||||||||||||||||||
|
|
|
|
|
|||||||||||||||||||||||||
| Diluted |
(3g | ) | 47,686,326 | (3h | ) | 51,792,542 | ||||||||||||||||||||||
|
|
|
|
|
|||||||||||||||||||||||||
42
Table of Contents
UNAUDITED PRO FORMA CONDENSED CONSOLIDATED STATEMENT OF INCOME
FOR THE YEAR ENDED DECEMBER 31, 2011
(IN THOUSANDS, EXCEPT PER UNIT AND SHARE AMOUNTS)
| Historical | Pro forma adjustments for the Reorganization |
Pro Forma as adjusted for the Reorganization |
Pro forma adjustments for the initial public offering |
Pro forma as adjusted for the Reorganization and initial public offering |
||||||||||||||||||||||||
| Revenues |
||||||||||||||||||||||||||||
| Recurring |
$ | 56,382 | $ | — | 56,382 | $ | — | $ | 56,382 | |||||||||||||||||||
| Implementation and other |
824 | — | 824 | — | 824 | |||||||||||||||||||||||
|
|
|
|
|
|
|
|
|
|
|
|||||||||||||||||||
| Total revenues |
57,206 | — | 57,206 | — | 57,206 | |||||||||||||||||||||||
| Cost of revenues |
— | |||||||||||||||||||||||||||
| Operating expenses |
12,287 | — | 12,287 | — | 12,287 | |||||||||||||||||||||||
| Depreciation |
987 | — | 987 | — | 987 | |||||||||||||||||||||||
|
|
|
|
|
|
|
|
|
|
|
|||||||||||||||||||
| Total cost of revenues |
13,274 | — | 13,274 | — | 13,274 | |||||||||||||||||||||||
| Administrative expenses |
||||||||||||||||||||||||||||
| Sales and marketing |
22,244 | — | 22,244 | — | 22,244 | |||||||||||||||||||||||
| Research and development |
1,225 | — | 1,225 | — | 1,225 | |||||||||||||||||||||||
| General and administrative |
14,707 | 7 | (3a | ) | 14,714 | — | 14,714 | |||||||||||||||||||||
| Depreciation and amortization |
4,300 | — | 4,300 | — | 4,300 | |||||||||||||||||||||||
|
|
|
|
|
|
|
|
|
|
|
|||||||||||||||||||
| Total administrative expenses |
42,476 | 7 | 42,483 | — | 42,483 | |||||||||||||||||||||||
| Total operating expenses |
55,750 | 7 | 55,757 | — | 55,757 | |||||||||||||||||||||||
| Operating income (loss) |
1,456 | (7 | ) | 1,449 | — | 1,449 | ||||||||||||||||||||||
| Interest expense |
(134 | ) | (6,467 | ) | (3c | ) | (6,601 | ) | 6,467 | (3c | ) | (134 | ) | |||||||||||||||
| Other income (expense), net |
108 | — | 108 | — | 108 | |||||||||||||||||||||||
|
|
|
|
|
|
|
|
|
|
|
|||||||||||||||||||
| Income before income taxes |
1,430 | (6,474 | ) | (5,044 | ) | 6,467 | 1,423 | |||||||||||||||||||||
| Provision for income taxes |
— | 558 | (3b | ) | (1,949 | ) | 2,522 | (3f | ) | 573 | ||||||||||||||||||
| (2,522 | ) | (3f | ) | |||||||||||||||||||||||||
| 15 | (3a | ) | ||||||||||||||||||||||||||
|
|
|
|
|
|
|
|
|
|
|
|||||||||||||||||||
| Net income (loss) |
$ | 1,430 | $ | (4,525 | ) | $ | (3,095 | ) | $ | 3,945 | $ | 850 | ||||||||||||||||
|
|
|
|
|
|
|
|
|
|
|
|||||||||||||||||||
| Net income per Series A Preferred Unit and common unit |
||||||||||||||||||||||||||||
| Basic |
$ | 1.53 | ||||||||||||||||||||||||||
|
|
|
|||||||||||||||||||||||||||
| Diluted |
$ | 1.49 | ||||||||||||||||||||||||||
|
|
|
|||||||||||||||||||||||||||
| Weighted average units outstanding |
||||||||||||||||||||||||||||
| Basic |
935,750 | |||||||||||||||||||||||||||
|
|
|
|||||||||||||||||||||||||||
| Diluted |
960,611 | |||||||||||||||||||||||||||
|
|
|
|||||||||||||||||||||||||||
| Pro forma net loss per share |
||||||||||||||||||||||||||||
| Basic |
(3g | ) | $ | (0.06 | ) | (3h | ) | $ | 0.02 | |||||||||||||||||||
|
|
|
|
|
|||||||||||||||||||||||||
| Diluted |
(3g | ) | $ | (0.06 | ) | (3h | ) | $ | 0.02 | |||||||||||||||||||
|
|
|
|
|
|||||||||||||||||||||||||
| Pro forma weighted average shares outstanding |
||||||||||||||||||||||||||||
| Basic |
(3g | ) | 47,686,326 | (3h | ) | 51,107,379 | ||||||||||||||||||||||
|
|
|
|
|
|||||||||||||||||||||||||
| Diluted |
(3g | ) | 47,686,326 | (3h | ) | 51,792,542 | ||||||||||||||||||||||
|
|
|
|
|
|||||||||||||||||||||||||
43
Table of Contents
UNAUDITED PRO FORMA CONDENSED CONSOLIDATED FINANCIAL INFORMATION
| 1. | Basis of Presentation |
The historical financial information has been adjusted to give pro forma effect to events that are (i) directly attributable to the Reorganization and this offering, (ii) factually supportable, and (iii) with respect to the statements of income, expected to have a continuing impact on the future results.
Our historical results are derived from our audited consolidated statements of income of Holdings for the years ended December 31, 2013, 2012 and 2011 and audited consolidated balance sheet of Holdings as of December 31, 2013 under U.S. GAAP.
Description of the Transaction
In anticipation of this offering, Software consummated the Reorganization as of January 1, 2014, pursuant to which (i) the owners of WCAS Holdings and CP IV Blocker, which are affiliates of Welsh, Carson, Anderson & Stowe, contributed WCAS Holdings and CP IV Blocker, which collectively own all of the Series A Preferred Units of Holdings, to Software in exchange for shares of common stock of Software and (ii) the owners of outstanding Series B Preferred Units of Holdings contributed their Series B Preferred Units for shares of common stock of Software. Immediately after these contributions, a wholly-owned subsidiary of Software merged with and into Holdings with Holdings surviving the merger. Upon consummation of the merger, the remaining holders of outstanding common and incentive units of Holdings received shares of common stock of Software for their common and incentive units by operation of Delaware law and Holdings’ ownership in Software was cancelled. This resulted in Software controlling, directly or indirectly, Holdings, including Payroll, WCAS Holdings and CP IV Blocker. Outstanding common units, Series B Preferred Units, and incentive units of Holdings were converted into 45,708,573 shares of common stock and 8,121,101 shares of restricted stock of Software at the following conversion rates:
| • | Outstanding common units, Series B Preferred Units, WCAS Holdings and CP IV Blocker were contributed to Software in exchange for, or converted into, the number of shares of common stock determined by a ratio of common units, Series B Preferred Units and Series A Preferred Units to shares of common stock of approximately 1:47, resulting in issuance of 44,560,053 shares of common stock. |
| • | Vested incentive units were converted to shares of common stock and restricted stock at various conversion ratios, which ranged from approximately 1:0.2 to 1:24. Unvested incentive units were converted to shares of restricted stock at various conversion ratios, which ranged from 1:24 to 1:47. The conversion to shares of common stock versus restricted stock was determined based on the underlying conditions of the pre-conversion incentive units, reflecting any pre-existing vesting conditions. This resulted in the issuance of 1,148,520 and 8,121,101 shares of common stock and restricted stock, respectively. |
The restricted stock was issued subject to various vesting conditions. A portion of the restricted stock is subject to a time-based vesting condition while the remaining portion is subject to performance-based vesting conditions. The performance-based vesting is based on the Company’s total enterprise value exceeding certain specified thresholds. For additional information concerning the vesting conditions of the restricted stock, see “Executive Compensation—Narrative Discussion Regarding Summary Compensation Table—Equity Incentive Units and Restricted Stock Awards.”
Following these transactions, Series C Preferred Units of Holdings were eliminated as an intercompany transaction between Holdings and WCAS Holdings, and the 2017 Note, which was a 14% related party note issued by WCAS Holdings to its parent, WCAS Fund X L.P., was recorded upon the inclusion of WCAS Holdings. Following the Reorganization, Software became a holding company with its principal asset being the units in Holdings. Software was formed for purposes of this offering and has to date, engaged only in activities in contemplation of this offering. See “The Reorganization.”
44
Table of Contents
WCAS Holdings and CP IV Blocker do not have any independent operations or any significant assets or liabilities and do not comprise a business. The acquisition of WCAS Holdings is deemed to be a reorganization under common control and therefore its underlying assets and liabilities are not required to be re-measured at fair value on the acquisition date. The acquisition of CP IV Blocker is not deemed to be a reorganization under common control and therefore the underlying assets and liabilities are recorded at fair value on their acquisition date.
| 2. | Notes to unaudited pro forma condensed consolidated balance sheet |
| (a) | Reflects adjustments to deferred income tax assets and liabilities as a result of recognizing related deferred tax assets and liabilities assuming that the Reorganization occurred on December 31, 2013. |
| (b) | Represents the conversion of common units and Series A Preferred Units to common stock. The amount was estimated given that the Members’ Capital balance ceased to exist upon the Reorganization. |
| (c) | Reflects the inclusion of WCAS Holdings’ assets and liabilities accounted for as a transaction under common control. |
| (d) | Reflects the inclusion of CP IV Blockers’ assets and liabilities recorded at fair value as a result of the acquisition. |
| (e) | Reflects the assumption of the 2017 Note which replaced the Series C Preferred Units in connection with the Reorganization. |
| (f) | Reflects the effect of the net offering proceeds which will be used to repay the 2022 Note issued by us to an affiliate of Welsh, Carson, Anderson & Stowe in the amount of approximately $18.8 million and the 2017 Note issued by between WCAS Holdings in the amount of approximately $46.2 million (including certain payments made pursuant to a contribution agreement). Any additional net offering proceeds have been excluded for purposes of the pro forma financial information. |
The 2022 Note was issued at a discount of $2.4 million and also contained a prepayment feature which was valued at $2.0 million. The prepayment feature was recorded as a derivative liability at inception and is recorded at fair value at December 31, 2013. Upon the settlement of the 2022 Note, the derivative liability would cease to exist and therefore a gain is recognized upon the settlement of the liability.
| (g) | Reflects reclassification of historic accumulated deficit to additional paid in capital due to the Reorganization. |
| 3. | Notes to unaudited pro forma condensed consolidated statements of income |
| (a) | Reflects the inclusion of the results of operations from WCAS Holdings assuming that the Reorganization took effect on January 1, 2011 and assuming the acquisition of CP IV Blocker occurred on January 1, 2011 and therefore gave rise to Software controlling these entities. |
| (b) | Represents adjustments to income tax expense in connection with the deferred income tax assets and liabilities recognized given the Reorganization, which assumed that Holdings was operating as a C-corporation effective January 1, 2011. The amount was determined using an estimated statutory rate of 39%. |
| (c) | Reflects the recording of interest expense upon assuming the 2017 Note which accrues interest at 14% per annum. The 2017 Note replaced the Series C Preferred Units in the Reorganization. The interest expense is removed in the initial public offering adjustment, assuming a portion of the net proceeds from this offering were used to repay the 2017 Note on January 1, 2011. |
| (d) | Reflects the removal of the amortization from the 2022 Note issued at discount and the related interest expense as a result of using a portion of the net proceeds from this offering to repay the 2022 Note. |
45
Table of Contents
| (e) | Reflects the removal of the unrealized gains recognized for the derivative liability relating to the 2022 Note as a result of using a portion of the net proceeds from this offering to repay the 2022 Note. |
| (f) | Represents adjustments to income tax expense for the years ended December 31, 2013, 2012 and 2011 as a result of the tax impact on the pro forma adjustments relating to the Reorganization and this offering. The amount was determined using an estimated statutory tax rate of 39%. |
| (g) | Pro forma as adjusted for the Reorganization net income per weighted average basic and diluted shares outstanding reflects the conversion of all our common units, Preferred Units and incentive units into 45,708,573 and 8,121,101 of common shares and restricted shares, respectively, assuming those shares were issued January 1, 2011. |
| (h) | Pro forma net income as adjusted for the Reorganization and initial public offering per weighted average basic and diluted shares outstanding gives effect to the issuance of 3,421,053 common shares relating to the net offering proceeds (excluding the remaining 1,185,829 common shares issued in that offering, which were deemed for general corporate purposes, including additions to working capital and capital expenditures) which will be used to repay the 2022 Note and 2017 Note, assuming an initial public offering price of $19.00 per share, which is the midpoint of the price range and the conversion of all our common units, Preferred Units and incentive units into 45,708,573 and 8,121,101 of common shares and restricted shares, respectively, assuming all shares were issued January 1, 2011. |
46
Table of Contents
MANAGEMENT’S DISCUSSION AND ANALYSIS OF FINANCIAL
CONDITION AND RESULTS OF OPERATIONS
You should read the following discussion and analysis of our financial condition and results of operations in conjunction with the audited and unaudited consolidated financial statements and related notes included elsewhere in this prospectus. The following discussion contains forward-looking statements that are subject to risks and uncertainties. See “Special Note Regarding Forward-Looking Statements” for a discussion of the uncertainties, risks, and assumptions associated with those statements. Actual results could differ materially from those discussed in or implied by forward-looking statements as a result of various factors, including those discussed below and elsewhere in this prospectus, particularly in the section entitled “Risk Factors.”
Overview
We are a leading provider of a comprehensive, cloud-based HCM software solution delivered as SaaS. We provide functionality and data analytics that businesses need to manage the complete employment life cycle from recruitment to retirement. Our solution requires virtually no customization and is based on a core system of record maintained in a single database for all HCM functions, including talent acquisition, time and labor management, payroll, talent management and HR management applications. Our user-friendly software allows for easy adoption of our solution by employees, enabling self-management of their HCM activities in the cloud, which reduces the administrative burden on employers and increases employee productivity.
We serve a diverse client base in terms of size and industry. We have over 10,000 clients, none of which constituted more than one-half of one percent of our revenues for the year ended December 31, 2013. We stored data for more than 1,000,000 persons employed by our clients during the year ended December 31, 2013.
Our revenues are primarily generated through our sales force that solicits new clients and our client relations representatives, or CRRs, who sell new applications to existing clients. We have 30 sales teams located in 20 states and plan to open additional sales offices to further expand our presence in the U.S. market. In recent years, we have opened three to four new sales offices in new cities per year and believe that we can increase this annual number to four to six new sales offices in the future.
Our continued growth depends on attracting new clients through geographic expansion, further penetration of our existing markets and the introduction of new applications to our existing client base. We also expect a portion of our growth to generally mirror improvements in the labor market. Our principal marketing programs include telemarketing and email campaigns, search engine marketing methods and national radio advertising.
During the last three years, we have developed several new applications. Our ability to continue to develop new applications and to improve existing applications will enable us to increase revenues in the future, and the number of our new applications adopted by our clients has been a significant factor in our revenue growth over the last three years.
The Reorganization
In anticipation of this offering, we consummated the Reorganization, as of January 1, 2014. Following the Reorganization, Software became a holding company, the principal asset of which is the units in Holdings. The following discussion and analysis of our financial condition and results of operations covers periods prior to the Reorganization and reflects the operations of Holdings and its consolidated subsidiary.
Trends, Opportunities and Challenges
While we currently derive most of our revenues from payroll processing, we expect an increasing percentage of our recurring revenues to come from our additional HCM applications over time. For example, approximately 58%, 60% and 68% of our revenues for the years ended December 31, 2013, 2012 and 2011,
47
Table of Contents
respectively, were derived from payroll processing. Our payroll application is the foundation of our solution and all of our clients are required to utilize this application in order to access our other applications. As a result of our evolving revenue mix, coupled with the unique client benefits that our solution provides (e.g., enabling our clients to scale the number of HCM applications that they use on an as-needed basis), we are presented with a variety of opportunities, challenges and risks.
We generate revenues from (i) fixed amounts charged per billing period or (ii) fixed amounts charged per billing period plus a fee per employee or transaction processed. We do not require clients to enter into long-term contractual commitments with us. Our billing period varies by client based on when they pay their employees, which is either weekly, bi-weekly, semi-monthly or monthly.
We do not have a traditional subscription-based revenue model and do not enter into long-term contractual commitments with our clients. We believe that the traditional subscription model hinders the buying decision by requiring clients to make significant commitments at inception, as well as at the end of each subscription term. By allowing clients to discontinue the use of our solution with 30 days’ notice, our team of trained specialists must focus on providing the best client service. In contrast, a long-term contract often forces a client to continue using a product that may not entirely fit its needs or, in some cases, incur expensive termination fees. Because of our sales model and personalized service, we have maintained high client satisfaction, as evidenced by an average annual revenue retention rate of 91% from existing clients for the three years ended December 31, 2013.
For the year ended December 31, 2013, our gross margin was approximately 81%. We expect changes in our revenue mix to continue to improve gross margins as our current gross margin for our HCM applications is higher than our gross margin for payroll processing. We expect that our total gross margin will gradually improve over time as (i) we add additional clients, (ii) our existing clients deploy additional HCM applications and (iii) we reduce our costs of revenues and administrative expenses as a percentage of total revenues.
Growing our business has also resulted in, and will continue to result in, substantial investment in sales professionals, operating expenses, systems development and programming costs and general and administrative expenses, which has and will continue to increase our expenses. We intend to obtain new clients by (i) continuing to expand our presence in metropolitan areas where we currently have an existing sales office through adding sales teams or offices and increasing the number of our sales professionals and (ii) opening sales offices in new metropolitan areas. Our ability to increase revenues and improve operating results depend on our ability to add new clients.
As we have organically grown our operations and increased the number of our applications, the average size of our clients has also grown significantly. Based on our total revenues, we have grown at an approximately 38% CAGR since 2009. Because we charge our clients on a per employee basis for certain services we provide, any increase or decrease in the number of employees that our clients have will have a positive or negative impact on our results of operations. Our solution requires no adjustment to serve larger clients. We believe larger employers represent a substantial opportunity to increase the number of potential clients and to increase our revenue per client, with limited incremental cost to us. From January 1, 2011 through December 31, 2013, we increased our annualized recurring revenue per average client by 52.7% in part by targeting larger clients and enlarging our existing client relationships.
Throughout our history, we have built strong relationships with our clients. As the HCM needs of our clients evolve, we believe that we are well-positioned to gain additional share of their HCM spending of our clients, and we believe this opportunity is significant. To be successful, we must continue to demonstrate the operational and economic benefits of our solution, as well as effectively hire, train, motivate and retain qualified personnel and executive officers.
48
Table of Contents
Key Metrics
In addition to the U.S. GAAP metrics that we regularly monitor, we also monitor the following metrics to evaluate our business, measure our performance and identify trends affecting our business:
| Year Ended December 31, | ||||||||||||
| 2013 | 2012 | 2011 | ||||||||||
| (dollars in thousands) | ||||||||||||
| Key performance indicators: |
||||||||||||
| Clients |
10,792 | 9,233 | 7,955 | |||||||||
| Clients (based on parent company grouping) |
6,788 | 5,904 | 5,130 | |||||||||
| Sales teams |
26 | 23 | 20 | |||||||||
| Annualized New Recurring Revenue |
$ | 38,236 | $ | 27,686 | $ | 23,011 | ||||||
| Revenue retention rate |
91 | % | 91 | % | 92 | % | ||||||
| • | Clients. When we calculate the number of clients, we treat client accounts with separate taxpayer identification numbers as separate clients, which often separates client accounts that are affiliated with the same parent organization. We track the number of our clients as it provides an accurate gauge of the size of our business. Unless we state otherwise or the context otherwise requires, references to clients throughout this prospectus refer to this metric. |
| • | Clients (based on parent company grouping). When we calculate the number of clients based on parent company grouping, we combine client accounts that have identified the same person(s) as their decision-maker regardless of whether the client accounts have separate taxpayer identification numbers, which often combines client accounts that are affiliated with the same parent organization. We track the number of our clients based on parent company grouping as it provides an alternate measure of the size of our business and clients. |
| • | Sales Teams. We monitor our sales professionals by the number of sales teams and each team is comprised of approximately seven to nine sales professionals. Certain larger metropolitan areas can support more than one sales team. We believe that the number of sales teams is an indicator of revenue for future periods. |
| • | Annualized New Recurring Revenue. While we do not enter into long-term contractual commitments with our clients, we monitor annualized new recurring revenue as we believe it is an indicator of revenue for future periods. Annualized new recurring revenue is an estimate based on the annualized amount of the first full month of revenue attributable to new clients that were added or existing clients that purchased additional applications during the period presented. Annualized new recurring revenue only includes revenues from these clients who have used our solution for at least one month during the period. Since annualized new recurring revenue is only recorded after a client uses our solution for one month, it includes revenue that has been recognized in historical periods. |
| • | Revenue Retention Rate. Our average annual revenue retention rate tracks the percentage of revenue that we retain from our existing clients. We monitor this metric because it is an indicator of client satisfaction and revenue for future periods. |
Components of Results of Operations
Sources of Revenues
Revenues are comprised of recurring revenues, and implementation and other revenues. Recurring revenues are recognized in the period services are rendered. Implementation and other revenues includes implementation revenues that are recorded as deferred revenues and recognized over the life of the client which is estimated to be ten years and other revenues which are recognized upon shipment of time clocks. Implementation and other revenue comprised approximately 1.9% of our total revenues for the year ended December 31, 2013. We expect
49
Table of Contents
our revenues to increase as we introduce new applications, expand our client base and renew and expand relationships with existing clients. As a percentage of total revenues, we expect our mix of recurring revenues, and implementation and other revenues to remain relatively constant.
Recurring. Recurring revenues include fees for our talent acquisition, time and labor management, payroll, talent management and HR management applications as well as fees charged for delivery of client payroll checks and reports. These revenues are derived from: (i) fixed amounts charged per processing period or (ii) fixed amounts charged per processing period plus a fee per employee or transaction processed. Because recurring revenues are based in part on fees for use of our applications and the delivery of checks and reports that are levied on a per-employee basis, our recurring revenues increase as our clients hire more employees.
Implementation and Other. Implementation and other revenues are comprised of implementation fees for the deployment of our solution and other revenue from sales of time clocks as part of our time and attendance services. Non-refundable implementation fees which are charged to new clients are generated at inception for a new client and upon the addition of certain incremental applications for existing clients. These fees range from 10% to 30% of the annualized value of the transaction.
Expenses
Cost of Revenues. Cost of revenues consists of expenses related to hosting and supporting our applications, hardware costs, systems support and technology and depreciation of certain owned computer equipment. These costs include employee-related expenses for client support personnel, bank charges for processing ACH transactions, along with delivery charges and paper costs. They also include our cost for clocks held for sale and ongoing technology and support costs related to our systems. Depreciation of owned computer equipment is allocated based upon an estimate of assets used to host and support our applications. We expect our cost of revenues to increase as we continue to invest in new applications and expand our client base, although we expect our overall cost of revenues to gradually decrease as a percentage of total revenues over time.
Administrative Expenses. Administrative expenses consist of sales and marketing, research and development, general and administrative and depreciation and amortization. Sales and marketing expenses consist primarily of employee-related expenses for our direct sales and marketing staff, commissions, bonuses, marketing expenses and other related costs. Research and development expenses consist primarily of employee-related expenses for our development staff, net of capitalized software costs for internally developed software. We expect to grow our research and development efforts as we continue to broaden our payroll and HR solution offerings and extend our technological solutions by investing in the development of new solutions and introducing them to new and existing clients. General and administrative expenses include employee-related expenses for finance and accounting, legal, human resources and management information systems personnel, legal costs, professional fees and other corporate expenses. Depreciation and amortization expenses include depreciation of owned computer equipment allocated based upon an estimate of assets used to support the selling, general and administrative functions, as well as amortization of intangible assets. We expect our administrative expenses to increase in absolute dollars due to additional costs associated with accounting, compliance, investor relations, and other costs associated with being a public company, although our administrative expenses may fluctuate as a percentage of total revenue.
Interest Expense
Interest expense includes interest on the debt incurred for the construction of our corporate headquarters and related party debt. The increase in interest expense for the year ended December 31, 2013 is primarily due to recognizing a full year of interest expense related to the related party debt entered into in connection with the April 2012 Corporate Reorganization in 2013 as opposed to a partial year expense in 2012. We expect our interest expense to remain consistent until the completion of this offering. We intend to use a portion of the net proceeds received from this offering for the repayment of the 2022 Note, at which point we expect our interest expense to decrease.
50
Table of Contents
Other Income, net
Other income, net includes the gain or loss on the sale of fixed assets, interest on funds held for clients that are earned primarily on funds that are collected in advance of either the applicable due date for payroll tax submissions or the applicable disbursement date for employee payment services and change in fair value of the derivative liability relating to the related party debt. We typically invest funds held for clients in money market accounts and certificates of deposit until they are paid to the applicable tax or regulatory agencies or to client employees. These collections from clients are typically disbursed from one to 30 days after receipt, with some funds being held for up to 120 days. We expect that interest on funds held for clients in other income will increase as we grow our cash and increase our funds held from clients as we introduce new applications, expand our client base and renew and expand relationships with existing clients.
Results of Operations
The following tables set forth selected consolidated statement of income data and such data as a percentage of total revenues for each of the periods indicated:
| Year Ended December 31, | ||||||||||||
| 2013 | 2012 | 2011 | ||||||||||
| (in thousands) | ||||||||||||
| Consolidated statement of income data: |
|
|||||||||||
| Revenues: |
||||||||||||
| Recurring |
$ | 105,560 | $ | 75,420 | $ | 56,382 | ||||||
| Implementation and other |
2,041 | 1,390 | 824 | |||||||||
|
|
|
|
|
|
|
|||||||
| Total revenues |
107,601 | 76,810 | 57,206 | |||||||||
| Expenses: |
||||||||||||
| Cost of revenues: |
||||||||||||
| Operating expenses |
19,070 | 14,895 | 12,287 | |||||||||
| Depreciation |
1,821 | 1,431 | 987 | |||||||||
|
|
|
|
|
|
|
|||||||
| Total cost of revenues |
20,891 | 16,326 | 13,274 | |||||||||
| Administrative expenses: |
||||||||||||
| Sales and marketing |
42,681 | 29,255 | 22,244 | |||||||||
| Research and development |
2,146 | 1,632 | 1,225 | |||||||||
| General and administrative |
28,884 | 19,450 | 14,707 | |||||||||
| Depreciation and amortization |
3,682 | 4,092 | 4,300 | |||||||||
|
|
|
|
|
|
|
|||||||
| Total administrative expenses |
77,393 | 54,429 | 42,476 | |||||||||
|
|
|
|
|
|
|
|||||||
| Operating income |
9,317 | 6,055 | 1,456 | |||||||||
| Interest expense |
(2,805 | ) | (2,171 | ) | (134 | ) | ||||||
| Other income, net |
1,199 | 354 | 108 | |||||||||
|
|
|
|
|
|
|
|||||||
| Net income |
$ | 7,711 | $ | 4,238 | $ | 1,430 | ||||||
|
|
|
|
|
|
|
|||||||
51
Table of Contents
Consolidated Statement of Income Data as a Percentage of Revenues
| Year Ended December 31, | ||||||||||||
| 2013 | 2012 | 2011 | ||||||||||
| Consolidated statement of income data: |
||||||||||||
| Revenues: |
||||||||||||
| Recurring |
98.1 | % | 98.2 | % | 98.6 | % | ||||||
| Implementation and other |
1.9 | 1.8 | 1.4 | |||||||||
|
|
|
|
|
|
|
|||||||
| Total revenues |
100.0 | 100.0 | 100.0 | |||||||||
| Expenses: |
||||||||||||
| Cost of revenues: |
||||||||||||
| Operating expenses |
17.7 | 19.4 | 21.5 | |||||||||
| Depreciation |
1.7 | 1.9 | 1.7 | |||||||||
|
|
|
|
|
|
|
|||||||
| Total cost of revenues |
19.4 | 21.3 | 23.2 | |||||||||
| Administrative expenses: |
||||||||||||
| Sales and marketing |
39.7 | 38.1 | 38.9 | |||||||||
| Research and development |
2.0 | 2.1 | 2.1 | |||||||||
| General and administrative |
26.8 | 25.3 | 25.7 | |||||||||
| Depreciation and amortization |
3.4 | 5.3 | 7.5 | |||||||||
|
|
|
|
|
|
|
|||||||
| Total administrative expenses |
71.9 | 70.9 | 74.3 | |||||||||
|
|
|
|
|
|
|
|||||||
| Operating income |
8.7 | 7.9 | 2.5 | |||||||||
| Interest expense |
(2.6 | ) | (2.8 | ) | (0.2 | ) | ||||||
| Other income, net |
1.1 | 0.5 | 0.2 | |||||||||
|
|
|
|
|
|
|
|||||||
| Net income |
7.2 | % | 5.5 | % | 2.5 | % | ||||||
|
|
|
|
|
|
|
|||||||
Year Ended December 31, 2013 Compared to Year Ended December 31, 2012 and Year Ended December 31, 2012 compared to Year Ended December 31, 2011
Revenues
| Year Ended December 31, | % Change | |||||||||||||||||||
| 2013 | 2012 | 2011 | 2013 v 2012 | 2012 v 2011 | ||||||||||||||||
| (in thousands) | ||||||||||||||||||||
| Recurring |
$ | 105,560 | $ | 75,420 | $ | 56,382 | 40.0 | % | 33.8 | % | ||||||||||
| Implementation and other |
2,041 | 1,390 | 824 | 46.8 | 68.7 | |||||||||||||||
|
|
|
|
|
|
|
|||||||||||||||
| Total revenues |
$ | 107,601 | $ | 76,810 | $ | 57,206 | 40.1 | % | 34.3 | % | ||||||||||
|
|
|
|
|
|
|
|||||||||||||||
Total revenues were $107.6 million for the year ended December 31, 2013, compared to $76.8 million for the year ended December 31, 2012, an increase of $30.8 million, or 40.1%. For the year ended December 31, 2013, our client count increased 16.9% and recurring revenue per average client (based on the average number of clients outstanding during the period) increased 17.7%, as compared to the year ended December 31, 2012. The increase in revenues was due to a combination of factors, including (i) the addition of clients in mature sales offices (those offices that have been open for at least 24 months), (ii) the addition of new clients in more recently opened sales offices, (iii) the introduction and sale of additional applications to our existing clients and (iv) the growth in the number of employees of our clients.
Total revenues were $76.8 million for the year ended December 31, 2012, compared to $57.2 million for the year ended December 31, 2011, an increase of $19.6 million, or 34.3%. For the year ended December 31, 2012, our client count increased 16.1% and recurring revenue per average client (based on the average number of
52
Table of Contents
clients outstanding during the period) increased 14.9%, as compared to the year ended December 31, 2011. The increase in revenues was due to a combination of factors, including (i) the addition of clients in mature sales offices, (ii) the addition of new clients in more recently opened sales offices, (iii) the introduction and sale of additional applications to our existing clients and (iv) the growth in the number of employees of our clients.
Expenses
Cost of Revenues
| Year Ended December 31, | % Change | |||||||||||||||||||
| 2013 | 2012 | 2011 | 2013 v 2012 | 2012 v 2011 | ||||||||||||||||
| (in thousands) | ||||||||||||||||||||
| Operating expenses |
$ | 19,070 | $ | 14,895 | $ | 12,287 | 28.0 | % | 21.2 | % | ||||||||||
| Depreciation |
1,821 | 1,431 | 987 | 27.3 | 45.0 | |||||||||||||||
|
|
|
|
|
|
|
|||||||||||||||
| Total cost of revenues |
$ | 20,891 | $ | 16,326 | $ | 13,274 | 28.0 | % | 23.0 | % | ||||||||||
|
|
|
|
|
|
|
|||||||||||||||
Cost of revenues was $20.9 million for the year ended December 31, 2013, compared to $16.3 million for the year ended December 31, 2012, an increase of $4.6 million, or 28.0%. The increase in cost of revenues was due primarily to increases of $2.1 million in employee costs related to additional operating personnel, $565,000 in bank fees related to increased sales, $521,000 in shipping and paper costs, $487,000 in technology expense and $249,000 related to our background check service and clock costs of $157,000, related to increased sales of time clocks. Depreciation expense increased $390,000, primarily due to additional assets purchased.
Cost of revenues was $16.3 million for the year ended December 31, 2012, compared to $13.3 million for the year ended December 31, 2011, an increase of $3.1 million, or 23.0%. The increase in cost of revenues was due primarily to increases of $1.9 million in employee costs related to additional operating personnel, $117,000 in paper costs, $258,000 in bank fees related to increased sales, $179,000 related to our background check service and $125,000 in clock costs, relating to increased sales of time clocks versus leased clocks. Depreciation expense increased $444,000, primarily due to entire year of depreciation on data center assets purchased in connection with the construction of our data center in Oklahoma, which was completed in July 2011.
Administrative Expenses
| Year Ended December 31, | % Change | |||||||||||||||||||
| 2013 | 2012 | 2011 | 2013 v 2012 | 2012 v 2011 | ||||||||||||||||
| (in thousands) | ||||||||||||||||||||
| Sales and marketing |
$ | 42,681 | $ | 29,255 | $ | 22,244 | 45.9 | % | 31.5 | % | ||||||||||
| Research and development |
2,146 | 1,632 | 1,225 | 31.5 | 33.2 | |||||||||||||||
| General and administrative |
28,884 | 19,450 | 14,707 | 48.5 | 32.2 | |||||||||||||||
| Depreciation and amortization |
3,682 | 4,092 | 4,300 | (10.0 | ) | (4.8 | ) | |||||||||||||
|
|
|
|
|
|
|
|||||||||||||||
| Total administrative expenses |
$ | 77,393 | $ | 54,429 | $ | 42,476 | 42.2 | % | 28.1 | % | ||||||||||
|
|
|
|
|
|
|
|||||||||||||||
Total administrative expenses were $77.4 million for the year ended December 31, 2013, compared to $54.4 million for the year ended December 31, 2012, an increase of $23.0 million, or 42.2%. Sales and marketing expenses increased primarily due to a $5.5 million increase in employee-related expenses, resulting from a 28.6% increase in the number of personnel, a $4.6 million increase in commission and bonuses, resulting from increased sales and an increase in marketing expense of $1.1 million primarily due to increased radio and print advertising. Research and development expenses increased primarily due to an increase of 55.0% in the number of development personnel, along with bonus expense. General and administrative expenses increased primarily due to a $4.1 million increase in employee-related expenses, resulting from a 52.5% increase in the number of personnel, along with $2.7 million of expenses related to the initial public offering.
53
Table of Contents
Total administrative expenses were $54.4 million for the year ended December 31, 2012, compared to $42.5 million for the year ended December 31, 2011, an increase of $12.0 million, or 28.1%. Sales and marketing expenses increased primarily due to a $3.3 million increase in employee-related expenses, resulting from a 8.9% increase in the number of personnel, a $1.6 million increase in commission and bonuses, resulting from increased sales and an increase in marketing expense of $635,000 primarily due to increased radio and print advertising. Research and development expenses increased primarily due to an increase of 29.0% in the number of development personnel, along with bonus expense. General and administrative expenses increased primarily due to a $3.6 million increase in employee-related expenses, resulting from a 19.1% increase in the number of personnel, along with increases in administrative expenses related to travel, communication and transportation.
Expenditures for software developed or obtained for internal use are capitalized and amortized over a three-year period on a straight-line basis. The timing of the capitalized expenditures may affect the amount of development costs expensed in any given period. The table below sets forth the amounts of capitalized and expensed research and development expenses for the years ended December 31, 2013, 2012 and 2011.
| Year Ended December 31, | % Change | |||||||||||||||||||
| 2013 | 2012 | 2011 | 2013 v 2012 | 2012 v 2011 | ||||||||||||||||
| (in thousands) | ||||||||||||||||||||
| Capitalized portion of research and development |
$ | 1,238 | $ | 613 | $ | 497 | 102.0 | % | 23.3 | % | ||||||||||
| Expensed portion of research and development |
2,146 | 1,632 | 1,225 | 31.5 | 33.2 | |||||||||||||||
|
|
|
|
|
|
|
|||||||||||||||
| Total research and development |
$ | 3,384 | $ | 2,245 | $ | 1,722 | 50.7 | % | 30.4 | % | ||||||||||
|
|
|
|
|
|
|
|||||||||||||||
54
Table of Contents
Quarterly Results of Operations
The following tables set forth selected unaudited quarterly condensed consolidated statements of income data for each of the 12 quarters for the three years ended December 31, 2013. The information for each of these quarters has been prepared on the same basis as the audited annual consolidated financial statements included elsewhere in this prospectus and, in the opinion of management, includes all adjustments, which includes only normal recurring adjustments, necessary for the fair presentation of the results of operations for these periods in accordance with U.S. GAAP. This data should be read in conjunction with our audited consolidated financial statements and related notes included elsewhere in this prospectus. These quarterly operating results are not necessarily indicative of our operating results for a full year or any future period.
| Three Months Ended | ||||||||||||||||||||||||||||||||||||||||||||||||
| Dec 31, 2013 |
Sep 30, 2013 |
Jun 30, 2013 |
Mar 31, 2013 |
Dec 31, 2012 |
Sep 30, 2012 |
Jun 30, 2012 |
Mar 30, 2012 |
Dec 31, 2011 |
Sep 30, 2011 |
Jun 30, 2011 |
Mar 30, 2011 |
|||||||||||||||||||||||||||||||||||||
| (in thousands) | ||||||||||||||||||||||||||||||||||||||||||||||||
| Consolidated statement of income data: |
||||||||||||||||||||||||||||||||||||||||||||||||
| Revenues |
||||||||||||||||||||||||||||||||||||||||||||||||
| Recurring |
$ | 29,752 | $ | 25,211 | $ | 23,393 | $ | 27,204 | $ | 20,835 | $ | 18,246 | $ | 16,817 | $ | 19,522 | $ | 15,377 | $ | 13,721 | $ | 12,553 | $ | 14,731 | ||||||||||||||||||||||||
| Implementation and other |
528 | 620 | 520 | 373 | 472 | 321 | 275 | 322 | 261 | 233 | 157 | 173 | ||||||||||||||||||||||||||||||||||||
|
|
|
|
|
|
|
|
|
|
|
|
|
|
|
|
|
|
|
|
|
|
|
|
|
|||||||||||||||||||||||||
| Total revenues |
30,280 | 25,831 | 23,913 | 27,577 | 21,307 | 18,567 | 17,092 | 19,844 | 15,638 | 13,954 | 12,710 | 14,904 | ||||||||||||||||||||||||||||||||||||
| Expenses |
||||||||||||||||||||||||||||||||||||||||||||||||
| Cost of revenues |
||||||||||||||||||||||||||||||||||||||||||||||||
| Operating expenses |
5,437 | 4,846 | 4,353 | 4,434 | 3,965 | 3,747 | 3,366 | 3,817 | 3,412 | 3,089 | 2,856 | 2,930 | ||||||||||||||||||||||||||||||||||||
| Depreciation |
501 | 494 | 415 | 411 | 390 | 368 | 341 | 332 | 313 | 261 | 219 | 194 | ||||||||||||||||||||||||||||||||||||
|
|
|
|
|
|
|
|
|
|
|
|
|
|
|
|
|
|
|
|
|
|
|
|
|
|||||||||||||||||||||||||
| Total cost of revenues |
5,938 | 5,340 | 4,768 | 4,845 | 4,355 | 4,115 | 3,707 | 4,149 | 3,725 | 3,350 | 3,075 | 3,124 | ||||||||||||||||||||||||||||||||||||
| Administrative expenses |
||||||||||||||||||||||||||||||||||||||||||||||||
| Sales and marketing |
13,768 | 10,339 | 8,716 | 9,858 | 8,480 | 6,860 | 6,649 | 7,266 | 6,719 | 5,653 | 4,641 | 5,231 | ||||||||||||||||||||||||||||||||||||
| Research and development |
829 | 538 | 324 | 455 | 349 | 361 | 542 | 380 | 293 | 390 | 285 | 257 | ||||||||||||||||||||||||||||||||||||
| General and administrative |
10,033 | 6,815 | 6,040 | 5,996 | 5,534 | 4,778 | 4,803 | 4,335 | 4,141 | 3,758 | 3,447 | 3,361 | ||||||||||||||||||||||||||||||||||||
| Depreciation and amortization |
966 | 959 | 873 | 884 | 841 | 837 | 1,212 | 1,202 | 1,174 | 1,087 | 1,041 | 998 | ||||||||||||||||||||||||||||||||||||
|
|
|
|
|
|
|
|
|
|
|
|
|
|
|
|
|
|
|
|
|
|
|
|
|
|||||||||||||||||||||||||
| Total administrative expenses |
25,596 | 18,651 | 15,953 | 17,193 | 15,204 | 12,836 | 13,206 | 13,183 | 12,327 | 10,888 | 9,414 | 9,847 | ||||||||||||||||||||||||||||||||||||
|
|
|
|
|
|
|
|
|
|
|
|
|
|
|
|
|
|
|
|
|
|
|
|
|
|||||||||||||||||||||||||
| Operating income (loss) |
(1,254 | ) | 1,840 | 3,192 | 5,539 | 1,748 | 1,616 | 179 | 2,512 | (414 | ) | (284 | ) | 221 | 1,933 | |||||||||||||||||||||||||||||||||
| Interest expense |
(713 | ) | (699 | ) | (713 | ) | (680 | ) | (702 | ) | (683 | ) | (650 | ) | (136 | ) | (134 | ) | — | — | — | |||||||||||||||||||||||||||
| Other (expense) income, net |
1,059 | (133 | ) | (338 | ) | 611 | 19 | 256 | 66 | 13 | 10 | 13 | 57 | 28 | ||||||||||||||||||||||||||||||||||
|
|
|
|
|
|
|
|
|
|
|
|
|
|
|
|
|
|
|
|
|
|
|
|
|
|||||||||||||||||||||||||
| Net (loss) income |
$ | (908 | ) | $ | 1,008 | $ | 2,141 | $ | 5,470 | $ | 1,065 | $ | 1,189 | $ | (405 | ) | $ | 2,389 | $ | (538 | ) | $ | (271 | ) | $ | 278 | $ | 1,961 | ||||||||||||||||||||
|
|
|
|
|
|
|
|
|
|
|
|
|
|
|
|
|
|
|
|
|
|
|
|
|
|||||||||||||||||||||||||
Quarterly Revenues Trends
Excluding changes in quarterly revenues due to seasonal factors, our quarterly revenues generally increased sequentially for the periods presented due to a combination of factors, including (i) the addition of clients in mature sales offices, (ii) the addition of new clients in more recently opened sales offices, (iii) the introduction and sale of additional applications to our existing clients and (iv) the growth in the number of employees of our clients. In addition, the annual processing of payroll forms were subject to a one-time price increase in conjunction with increased access and review functionality associated with these forms in 2012, which resulted in an increase of less than 1% of recurring revenues for the years ended December 31, 2013 and 2012.
There are also seasonal factors that affect our revenues. Recurring revenues include revenues relating to the annual processing of payroll forms such as Form W-2 and Form 1099, or Payroll Form Revenues. Because these forms are typically processed in the first quarter of the year, first quarter revenue and margins are generally higher than subsequent quarters. For example, Payroll Form Revenues accounted for 20.2% of total revenues for the three months ended March 31, 2013 and 5.5% of total revenues for the year ended December 31, 2013.
55
Table of Contents
Quarterly Expenses Trends
Selling, general and administrative expenses are generally higher in the fourth and first quarters, due to overtime hours related to preparing client rollovers to the new year, and the preparation of annual client filings.
Liquidity and Capital Resources
As of December 31, 2013, our principal sources of liquidity were cash and cash equivalents totaling $13.3 million. Our cash and cash equivalents are comprised primarily of deposit accounts and money market funds.
We have primarily financed our operations from cash flows generated from operations and through the sale of equity securities. Since inception, we have raised $56.0 million of equity capital. We have also incurred debt to finance the expansion of our corporate headquarters that is currently under construction, as well as other previously constructed facilities, and incurred a related party debt as part of our April 2012 Corporate Reorganization. As of December 31, 2013, the outstanding principal amount of our debt was $35.8 million, which consisted of the 2011 Consolidated Loan, the 2013 Consolidated Loan and the 2022 Note, each of which are discussed in more detail below. In connection with the Reorganization, we also assumed the 2017 Note, which is discussed below.
2011 Consolidated Loan. As of December 31, 2013, we had the 2011 Consolidated Loan with an outstanding principal amount of $12.0 million from Kirkpatrick Bank, due December 15, 2018. At March 31, 2014, the outstanding principal amount under the 2011 Consolidated Loan was approximately $11.9 million. Under the 2011 Consolidated Loan, principal and interest are payable monthly based on a 20-year amortization at an annual rate of 5.0%. The 2011 Consolidated Loan is collateralized by a first mortgage covering our corporate headquarters and is secured by a first lien security interest in certain personal property relating to our corporate headquarters.
We are required to comply with certain financial and non-financial covenants under the Consolidated Loan, including maintaining a debt coverage ratio of EBITDA to indebtedness (defined as current maturities of long- term debt, interest expense and distributions) of not less than 1.5 to 1.0. As of December 31, 2013, the debt coverage ratio was 0.66 and we were not in compliance with the covenant. This was due to the short-term land loan outstanding as of December 31, 2012 and the 2013 Consolidated Loan being included in the calculation of the debt service ratio. The short-term land loan was paid in full from an advance from the 2013 Consolidated Loan during the year ended December 31, 2013. We obtained a letter of waiver from the lender that excluded these items from the calculation of the debt service ratio as of December 31, 2013, which remains in effect through January 15, 2015.
Pursuant to the terms of the 2011 Consolidated Loan, we may not, subject to certain exceptions, until amounts under the 2011 Consolidated Loan are repaid: (i) create any mortgages or liens, (ii) make any loans, advances or extensions of credit with any affiliate or enter into any other transaction with any affiliate, (iii) lease any mortgaged property, (iv) make any distributions to members as long as an event of default exists, (v) make any material change its methods of accounting, (vi) enter into any sale and leaseback arrangement, (vii) amend, modify, restate, cancel or terminate our organizational documents, (viii) sell, transfer or convey any mortgaged property or (ix) incur funded outside debt.
An event of default under the 2011 Consolidated Loan includes, among other events, (i) failure to pay principal or interest when due, (ii) breaches of certain covenants, (iii) the failure to meet the required financial covenants and (iv) the institution of a bankruptcy, reorganization, liquidation or receivership.
2013 Consolidated Loan. As of December 31, 2013, we also had the 2013 Consolidated Loan with an outstanding principal amount of $9.1 million and which allows for a maximum principal amount of $14.6 million under the modification agreement for future expansion from Kirkpatrick Bank, due May 1, 2015. At March 31, 2014, the outstanding principal amount under the 2013 Consolidated Loan was approximately $13.5 million.
56
Table of Contents
Under the 2013 Consolidated Loan, interest accrues monthly at the Wall Street Journal U.S. Prime rate plus 0.5%, adjusted monthly, subject to a minimum interest rate of 4.0% per annum. Outstanding amounts under the 2013 Consolidated Loan are secured by a first mortgage covering all of the second headquarters building and a first lien security interest in certain personal property relating to our second headquarters building.
We are required to comply with certain financial and non-financial covenants under the 2013 Consolidated Loan, including maintaining a debt coverage ratio of EBITDA to indebtedness (defined as current maturities of long- term debt, interest expense and distributions) of not less than 1.5 to 1.0. As of December 31, 2013, the debt coverage ratio was 0.66 and we were not in compliance with the covenant. This was due to the short-term land loan and the 2013 Consolidated Loan being included in the calculation of the debt service ratio. The short-term land loan was paid in full from an advance from the 2013 Consolidated Loan during the year ended December 31, 2013. We obtained a letter of waiver from the lender that excluded these items from the calculation of the debt service ratio as of December 31, 2013, which remains in effect through January 15, 2015.
Pursuant to the terms of the 2013 Consolidated Loan, we may not, subject to certain exceptions, until amounts under the 2013 Consolidated Loan are repaid: (i) create any mortgages or liens, (ii) make any loans, advances or extensions of credit with any affiliate or enter into any other transaction with any affiliate, (iii) lease any mortgaged property, (iv) make any distributions to members as long as an event of default exists, (v) make any material change its methods of accounting, (vi) enter into any sale and leaseback arrangement, (vii) amend, modify, restate, cancel or terminate our organizational documents, (viii) sell, transfer or convey any mortgaged property or (ix) incur funded outside debt.
An event of default under the 2013 Consolidated Loan includes, among other events, (i) failure to pay principal or interest when due, (ii) breaches of certain covenants, (iii) the failure to meet the required financial covenants and (iv) the institution of a bankruptcy, reorganization, liquidation or receivership.
2022 Note. In connection with the April 2012 Corporate Reorganization, we entered into the 2022 Note with WCAS Capital IV, a related party. As of December 31, 2013, the outstanding principal amount of the 2022 Note was $14.7 million (which included an unamortized discount of $4.1 million). At March 31, 2014, the outstanding principal amount under the 2022 Note was approximately $14.7 million (which included an unamortized discount of $4.1 million). The 2022 Note is due on April 3, 2022 and interest is payable at an annual rate of 10%, payable semiannually in arrears on June 30 and December 31 of each year. We may, at our option, choose to defer all or a portion of the accrued interest on the note that is due and payable on any payment date, provided that such amount of accrued interest shall be multiplied by 1.3 and added to the principal amount of the note on such interest payment date (with the result that such interest shall have accrued at an effective rate of 13.0% instead of 10.0% through such payment date). As of December 31, 2013, such option has not been elected and all interest has been paid in cash.
2017 Note. In connection with the Reorganization, we assumed the 2017 Note that was issued by WCAS Holdings payable to WCAS X. As of March 31, 2014, the outstanding principal amount of the 2017 Note was $46.2 million (which excluded accrued interest of $1.6 million). The 2017 Note is due on April 3, 2017 and interest is payable at an annual rate of 14.0%, payable semiannually in arrears on June 30 and December 31 of each year. We may, at our option, choose to defer all or a portion of the accrued interest on the note that is due and payable on any payment date, provided that such amount of accrued interest shall be added to the principal amount of the note on such interest payment date (with the accrued but unpaid interest bearing interest at an annual rate of 14.0%). As of March 31, 2014, such option had not been elected and all interest had been paid in cash.
Our cash flows from operating activities have historically been significantly impacted by profitability, implementation revenue received but deferred, and our investment in sales and marketing to drive growth. Our ability to meet future liquidity needs will be driven by our operating performance and the extent of continued investment in our operations. We believe our existing cash and cash equivalents and cash provided by this offering will be sufficient to meet our working capital and capital expenditure needs over at least the next
57
Table of Contents
12 months. Failure to generate sufficient revenue and related cash flows or to raise additional capital could have a material adverse effect on our ability to meet our liquidity needs and achieve our business objectives.
As part of our payroll and payroll tax filing services, we collect funds for federal, state and local employment taxes from our clients which we remit to the appropriate tax agencies. We invest these funds in short-term certificates of deposit and money market funds from which we earn interest income during the period between their receipt and disbursement. As our business grows, we expect our capital expenditures and our investment activity to continue to increase.
Depending on certain growth opportunities, we may choose to accelerate investments in sales and marketing, acquisitions, technology and services, which may require the use of proceeds from this offering for such additional expansion and expenditures. Actual future capital requirements will depend on many factors, including our future revenues, cash from operating activities and the level of expenditures in all areas of our business.
Cash Flows
The following table summarizes the consolidated statement of cash flows for the years ended December 31, 2013, 2012 and 2011:
| Year Ended December 31, | % Change | |||||||||||||||||||
| 2013 | 2012 | 2011 | 2013 v 2012 | 2012 v 2011 | ||||||||||||||||
| (in thousands) | ||||||||||||||||||||
| Net cash provided by (used in): |
||||||||||||||||||||
| Operating activities |
$ | 23,721 | $ | 15,782 | $ | 9,085 | 50.3 | % | 73.7 | % | ||||||||||
| Investing activities |
(148,442 | ) | (76,983 | ) | (102,299 | ) | (92.8 | ) | 24.7 | |||||||||||
| Financing activities |
124,559 | 67,384 | 94,360 | 84.8 | (28.6 | ) | ||||||||||||||
|
|
|
|
|
|
|
|||||||||||||||
| Change in cash and cash equivalents |
$ | (162 | ) | $ | 6,183 | $ | 1,146 | (102.6 | )% | 439.5 | % | |||||||||
|
|
|
|
|
|
|
|||||||||||||||
Operating Activities
For the year ended December 31, 2013, cash flows provided by operating activities was $23.7 million. The cash flows provided by operating activities resulted primarily from net income of $7.7 million related to a 40.0% increase in recurring revenues over the comparable period in 2012, as well as depreciation and amortization of $5.5 million and an increase in deferred revenue of $4.2 million related to increased implementation fees.
For the year ended December 31, 2012, cash flows provided by operating activities was $15.8 million. The cash flows provided by operating activities resulted primarily from net income of $4.2 million related to an increase in recurring revenue, as well as depreciation and amortization of $5.5 million and an increase in deferred revenue of $2.8 million related to increased implementation fees.
Investing Activities
For the year ended December 31, 2013, cash used in investing activities was $148.4 million. The cash flows used in investing activities resulted primarily from an increase in funds from clients of $131.5 million related to collection of client taxes and capital expenditures related to investments in real property, software and development and facilities and equipment of $17.2 million.
For the year ended December 31, 2012, cash used in investing activities was $77.0 million. The cash flows used in investing activities resulted primarily from an increase in funds from clients of $71.0 million related to the collection of client taxes and capital expenditures related to investments in real property, software and development and facilities and equipment of $6.0 million.
58
Table of Contents
Financing Activities
For the year ended December 31, 2013, cash flows provided by financing activities was $124.6 million. The cash flows provided by financing activities resulted primarily from an increase in client funds obligations of $131.5 million related to the collection of client taxes and advances received from the 2013 Consolidated Loan of $7.0 million, which were partially offset by distributions to members of $12.2 million.
For the year ended December 31, 2012, cash flows provided by financing activities was $67.4 million. The cash flows provided by financing activities resulted primarily from an increase in client funds obligations of $71.0 million related to the collection of client taxes and proceeds from the 2022 Note of $16.4 million, which were partially offset by distributions to members of $23.8 million.
Contractual Obligations
Our principal commitments primarily consist of long-term debt to a related party and other creditors and leases for office space. We disclose our long-term debt to a related party in Note 5 and our commitments and contingencies in Note 11 to our audited consolidated financial statements included elsewhere in this prospectus.
As of December 31, 2013, the future non-cancelable minimum payments under these commitments were as follows:
| Payments Due by Period | ||||||||||||||||||||
| Total | Less than 1 Year |
1-3 Years |
3-5 Years |
More than 5 Years |
||||||||||||||||
| (in thousands) | ||||||||||||||||||||
| Long-term debt obligations(1) |
$ | 21,090 | $ | 9,545 | $ | 901 | $ | 10,644 | $ | — | ||||||||||
| 2022 Note |
18,807 | — | — | — | 18,807 | |||||||||||||||
| Interest on 2022 Note |
15,515 | 1,881 | 3,761 | 3,761 | 6,112 | |||||||||||||||
| Interest on the 2011 Consolidated Loan |
6,304 | 597 | 1,129 | 1,031 | 3,547 | |||||||||||||||
| Interest on the 2013 Consolidated Loan(2) |
30 | 30 | ||||||||||||||||||
| Operating lease obligations: |
||||||||||||||||||||
| Facilities space |
8,304 | 2,222 | 3,859 | 2,170 | 53 | |||||||||||||||
|
|
|
|
|
|
|
|
|
|
|
|||||||||||
| Total |
$ | 70,050 | $ | 14,275 | $ | 9,650 | $ | 17,606 | $ | 28,519 | ||||||||||
|
|
|
|
|
|
|
|
|
|
|
|||||||||||
| (1) | The amount represents principal amounts of 2011 Consolidated Loan and the 2013 Consolidated Loan at maturity. |
| (2) | As we have the option to repay for the principal amount of the 2013 Consolidated Loan prior to the maturity date, the amount represents unpaid interest due on the 2013 Consolidated Loan based on the drawn down amount of $9,127 as of December 31, 2013. Interest is accrued monthly at the Wall Street Journal U.S. Prime Rate plus 0.5%, subject to a minimum interest rate of 4% floor and will be paid first day of each month. The interest amount determined assumed the floor of 4% based on the 2013 interest rate and does not consider for potential future prepayments, draw downs and/or additional interest. |
We have and we may continue to lease additional office space during the year ending December 31, 2014 to support our growth. In addition, many of our existing lease agreements provide us with the option to renew. Our future operating lease obligations include payments due during any renewal period provided for in the lease where the lease imposes a penalty for failure to renew.
Subsequent to December 31, 2013, we signed seven new leases for our sales offices and entered into one amendment to our existing leases thereby resulting in an additional $5.8 million in future commitments of noncancellable operating leases with initial or remaining terms of one year or more.
The 2022 Note as noted above will be paid in full from the net proceeds from this offering. Refer to “Use of Proceeds” for further details.
59
Table of Contents
The contractual commitment amounts in the table above are associated with agreements that are enforceable and legally binding and that specify all significant terms, including fixed or minimum services to be used, fixed minimum or variable price provisions, and the approximate timing of the transaction. Obligations under contracts that we can cancel without a significant penalty are not included in the table above.
Off-Balance Sheet Arrangements
Through December 31, 2013, we did not have any relationships with unconsolidated organizations or financial partnerships, such as structured finance or special purpose entities that would have been established for the purpose of facilitating off-balance sheet arrangements or other contractually narrow or limited purposes.
Quantitative and Qualitative Disclosures about Market Risk
Interest rate sensitivity
We had cash and cash equivalents totaling $13.3 million as of December 31, 2013. We consider all highly liquid debt instruments purchased with a maturity of three months or less and money market mutual funds to be cash equivalents. This amount was invested primarily in deposit accounts and money market funds. The cash and cash equivalents are held for working capital purposes. Our investments are made for capital preservation purposes. We do not enter into investments for trading or speculative purposes.
Our cash equivalents are subject to market risk due to changes in interest rates. Fixed rate securities may have their market value adversely affected due to a rise in interest rates, while floating rate securities may produce less income than expected if interest rates fall. Due in part to these factors, our future investment income may fall short of expectation due to changes in interest rates, or we may suffer losses in principal if we are forced to sell securities that decline in market value due to changes in interest rates.
We do not believe that an increase or decrease in interest rates of 100-basis points would have a material effect on our operating results or financial condition with respect to our cash equivalents.
We are also exposed to changes in interest rates relating to our derivative liability. As of December 31, 2013 and December 31, 2012, we had recorded $1.1 million and $1.8 million, respectively, as derivative liability relating to our long-term debt to related party. Changes in interest rate can lead to fluctuations in the fair value of the instrument.
To perform the sensitivity analysis on the derivative liability, we assessed the risk of a change in fair value from the effect of an interest rate change of 100-basis points as of December 31, 2013, which is shown as follows:
| Fair Value | +100 basis Point Shift |
-100 basis Point Shift |
||||||||||
| (in thousands) | ||||||||||||
| Derivative liability |
$ | 1,107 | $ | 1,885 | $ | 270 | ||||||
Critical Accounting Policies and Estimates
Our consolidated financial statements and accompanying notes have been prepared in accordance with U.S. GAAP. The preparation of these consolidated financial statements requires us to make estimates, judgments and assumptions that affect the reported amounts of assets, liabilities, revenues, costs and expenses, and related disclosures. On an ongoing basis, we continually evaluate our estimates and assumptions believed to be reasonable under current facts and circumstances. Actual amounts and results may differ from these estimates made by management under different assumptions and conditions.
Certain accounting policies that require significant management estimates, and are deemed critical to our results of operations or financial position, are described below. Accordingly, these are the policies we believe are
60
Table of Contents
the most critical to aid in fully understanding and evaluating our consolidated financial condition and results of operations.
Revenue Recognition
Our total revenues are comprised of recurring revenues, and implementation and other revenues. We recognize revenue in accordance with accounting standards for software and service companies when all of the following criteria have been met:
| • | There is persuasive evidence of an arrangement; |
| • | The service has been or is being provided to the customer; |
| • | Collection of the fees is reasonably assured; and |
| • | The amount of fees to be paid by the customer is fixed or determinable. |
Recurring revenues are derived primarily from our talent acquisition, time and labor management, payroll, talent management and HR management applications. These services are rendered during each client’s payroll period with the agreed-upon fee being charged and collected as part of the client’s payroll. Revenues are recognized at time of billing of each client’s payroll period. Collectability is reasonably assured as the fees are collected through an Automated Clearing House, or ACH, as part of the client’s payroll cycle or through direct wire transfer, which minimizes the default risk. Our implementation and other revenues represent non- refundable conversion fees which are charged to new clients to offset the expense of new client set-up and revenues from sale of time clocks as part of our employee time and attendance services. Because these conversion fees and sale of time clocks relate to our recurring revenue, we have evaluated such arrangements under the accounting guidance that governs multiple element arrangements.
For arrangements with multiple elements, we evaluate whether each element represents a separate unit of accounting. In order to treat deliverables in a multiple element arrangement as separate units of accounting, the deliverables must have standalone value upon delivery. If the deliverables have standalone value upon delivery, we account for each deliverable separately and revenue is recognized for the respective deliverables as they are delivered. If one or more of the deliverables does not have standalone value upon delivery, the deliverables that do not have standalone value are generally combined with the final deliverable within the arrangement and treated as a single unit of accounting.
For the years ended December 31, 2013, 2012 and 2011, we have determined that there is no standalone value associated with the upfront conversion fees as they do not have value to our clients on a standalone basis nor are they offered as an individual service; therefore, the conversion fees are deferred and recognized ratable over the estimated life of our clients, based on our historical client attrition rate, which we have estimated to be ten years. Revenues from the sale of time clocks are recognized when they are delivered.
Goodwill and Other Intangible Assets
Goodwill is not amortized, but we are required to test the carrying value of goodwill for impairment at least annually, or earlier if, at the reporting unit level, an indicator of impairment arises. The estimates and assumptions about future results of operations and cash flows made in connection with the impairment testing could differ from future actual results of operations and cash flows. If impairment exists, a write-down to fair value (normally measured by discounting estimated future cash flows) is recorded. Our business is largely homogeneous and, as a result, goodwill is associated with one reporting unit. We have selected June 30 as our annual goodwill impairment testing date and determined there was no impairment as of June 30, 2013. For the years ended December 31, 2013, 2012 and 2011, there were no indicators of impairment. Intangible assets with finite lives are amortized on a straight-line basis over their estimated useful lives.
61
Table of Contents
Impairment of Long-Lived Assets
Long-lived assets, including intangible assets with finite lives, are reviewed for impairment when events or changes in circumstances indicate that the carrying amount of an asset may not be recoverable. Recoverability of assets to be held and used is measured by a comparison of the carrying amount of an asset to estimated undiscounted future cash flows expected to be generated by the asset. If the carrying amount of an asset exceeds its estimated future cash flows, an impairment charge is recognized for the amount by which the carrying amount of the asset exceeds the estimated fair value of the asset. We have determined that there is no impairment of long-lived assets for the years ended December 31, 2013, 2012 and 2011.
Incentive Units
Given the absence of a public trading market for our common units and in accordance with the American Institute of Certified Public Accountants, or AICPA, Audit and Accounting Practice Aid Series: Valuation of Privately Held Company Equity Securities Issued as Compensation, or the AICPA Practice Guide, our board of directors exercised reasonable judgment and considered numerous factors to determine the best estimate of the fair value of our incentive units, including:
| • | Valuation analyses performed by unrelated third party specialist (including the application of appropriate valuation techniques and inputs); |
| • | Characteristics and specific terms of the units as noted in the equity grant agreements; |
| • | Value of the units as determined by the absence of a liquidation value on the date of grant, the ability to participate in our future profits, growth and appreciation and the lack of an exercise price for the units; |
| • | Lack of marketability of our common units; |
| • | Our actual operating and financial performance; |
| • | Our state of development; |
| • | Revenue and expense projection; |
| • | Likelihood of achieving a liquidating event; |
| • | Market performance of comparable publicly traded companies; and |
| • | Overall U.S. and global economic and capital market conditions. |
The valuations that we used to determine the fair market value of grants issued during and prior to 2013 were based on information available at the time of, or prior to, the grant as the case may be, and were performed by an unrelated valuation specialist, as defined by the AICPA Practice Guide. All grants issued prior to 2013 were valued during June 2013. All grants that were issued during the year ended December 31, 2013 were valued during the fourth quarter of 2013.
Our simulation model requires various subjective assumptions as inputs, including expected life, volatility, risk-free interest rates, and the expected dividend yield. The assumptions used in the simulation model represent our best estimates, which involve inherent uncertainties and the application of our judgment as follows:
| • | Risk-free interest rate—We base the risk-free interest rate used in the Monte Carlo simulation model on the implied yield available on 5 year U.S. Treasury securities with a remaining term equivalent to that of the respective units as of the valuation date. |
| • | Volatility—We determine the volatility factor based on the historical volatilities of comparable guideline companies. To determine the comparable guideline companies, we consider cloud-based application providers and select those that are similar to us in nature of services provided. We intend to continue to consistently apply this process using the same or similar public companies until information regarding the volatility of our own pricing becomes available, or unless circumstances |
62
Table of Contents
| change such that the identified companies are no longer similar to us, in which case, more suitable companies whose share prices are publicly available would be utilized in the calculation. |
| • | Expected term—The expected term represents the period that our incentive units are expected to be outstanding. We determined the expected term assumption based on the vesting terms and contractual terms of the units. |
| • | Expected dividend yield—We have not paid and do not expect to pay dividends in the future and therefore an expected dividend yield of 0% was applied. The directors of the Company will determine if and when dividends will be declared and paid in the future based on the Company’s financial position at the relevant time. |
The following table presents a summary of the grant-date fair values of incentive units granted based on the Monte Carlo simulation model and the related assumptions for the years ended December 31, 2013, 2012 and 2011:
| Year Ended December 31, | ||||||
| 2013 | 2012 | 2011 | ||||
| Grant-date fair value |
||||||
| 2009 Plan |
— | $71.78 | $51.16 | |||
| 2012 Management Incentive Units |
$4.67 - $37.39 | $8.03 - $14.29 | — | |||
| 2012 CEO Incentive Units |
— | $6.78 - $9.35 | — | |||
| Risk-free interest rate |
0.71% - 1.41% | 0.72% | 1.74% | |||
| Volatility factor |
50.0% | 60.0% | 60.0% | |||
| Expected life (in years) |
5.0 | 5.0 | 5.0 | |||
In addition to assumptions used in the simulation model, we are required to estimate forfeitures and only record compensation costs for those awards that are expected to vest. Our forfeiture estimate is based on an analysis of our actual forfeitures. We will continue to evaluate the appropriateness of the forfeiture rate based on actual forfeiture experience, analysis of employee turnover, and other factors.
We granted the following Management Incentive Units, or the Management Incentive Units, between October 1, 2012 and the date of this prospectus (in thousands, except per unit amounts):
| Grant Date |
Number of incentive units granted |
Fair value per unit (1)(2) |
||||||
| November 19, 2012 |
200 | $ | 11.16 | |||||
| January 7, 2013 |
610 | $ | 7.92 | |||||
| January 17, 2013 |
3,000 | $ | 8.08 | |||||
| March 28, 2013 |
700 | $ | 14.04 | |||||
| April 17, 2013 |
3,000 | $ | 14.13 | |||||
| October 14, 2013 |
18,493 | $ | 16.46 | |||||
| December 3, 2013 |
150 | $ | 17.08 | |||||
| (1) | Because our Management Incentive Units do not have an exercise price, the intrinsic value of the unit equals the fair value. |
| (2) | Represents the weighted average fair value per unit, incorporating both time-based and market-based vesting conditions. |
There were no other equity instruments granted during the period from October 1, 2012 to the date of this prospectus. During 2012, Management Incentive Units were issued with a strike price that was based on a $400.0 million company enterprise value. During 2013, Management Incentive Units were issued with a strike price that was based on a $400.0 million and $550.0 million company enterprise value. We also issued incentive units to our chief executive officer, or the CEO Incentive Units, with a strike price that was based on a $550.0 million company enterprise value during 2012. These strike prices are a vesting condition, by which the underlying incentive units did not vest unless the value of our company met or exceeded the specified level. Our incentive units did not have an exercise price.
63
Table of Contents
We believe that there is no single event that caused the change in the fair value of our incentive units between the grant dates, but rather a combination of factors described below for the significant difference noted in between certain grants as follow:
| • | Increase in value between the value at the grant date and the value at the initial public offering is a result of improved operating results; and |
| • | Increase in the probability assumption of an initial public offering scenario as we approach the estimated initial date. |
We believe that it is reasonable to expect that the completion of an initial public offering will increase the value of our shares of common stock (subsequent to the Reorganization) because they will have increased liquidity and marketability and believe that the estimates and factors noted above are a reasonable description of the value that market participants would place on the underlying common stock as of each valuation date.
In connection with the Reorganization, the incentive units we issued as part of the 2009 Incentive Units Plan, or the 2009 Incentive Units, were converted into shares of restricted stock. Upon the sale of common stock in the initial public offering, approximately 217,378 shares of restricted common stock that were granted to replace the 2009 Incentive Units will automatically vest. Total unrecognized compensation cost relating to 2009 Incentive Units was approximately $30,585 as of December 31, 2013.
In connection with the Reorganization, our incentive units were converted into shares of common stock and/or restricted stock of Software. Vested incentive units were converted to shares of common stock and restricted stock at various conversion ratios, which ranged from approximately 1:0.2 to 1:24. Unvested incentive units were converted to shares of restricted stock at various conversion ratios, which ranged from 1:24 to 1:47. The conversion to shares of common stock versus restricted stock was determined based on the underlying conditions of the pre-conversion incentive units, reflecting any pre-existing vesting conditions. This resulted in issuance of 1,148,520 and 8,121,101 shares of common stock and restricted stock, respectively. The shares of restricted stock were subject to either time-based or performance-based vesting conditions. Although there were modifications to the terms and conditions of the existing incentive units plans upon conversion, no additional compensation cost was recorded as the incremental value associated with the modifications was deemed insignificant.
Shares of restricted stock that were issued in connection with the Reorganization that were subject to time-based vesting conditions retained substantially the same time-based vesting conditions as the respective tranche of incentive units from which they were converted. For additional information concerning these vesting conditions, see “Executive Compensation—Narrative Discussion Regarding Summary Compensation Table—Equity Incentive Units and Restricted Stock Awards.” The following table shows the vesting periods for the outstanding shares of restricted stock subject to time-based vesting conditions that were issued in connection with the Reorganization:
| Year Ending December 31, |
Number of Shares of Restricted Stock to Vest |
|||
| 2014 |
707,168 | (1) | ||
| 2015 |
653,964 | |||
| 2016 |
581,131 | |||
| 2017 |
580,987 | |||
| 2018 |
102,963 | |||
| 2019 |
81 | |||
| Total |
2,626,294 | |||
| (1) | Includes 477,320 shares of restricted stock that are scheduled to vest on April 3, 2014. |
Shares of restricted stock that were issued in connection with the Reorganization that were subject to performance-based vesting conditions will vest one-half upon the Company reaching a total enterprise value of $1.4 billion and one-half upon the Company reaching a total enterprise value of $1.8 billion, provided that the
64
Table of Contents
person is employed by us on that date. For additional information concerning these vesting conditions, see “Executive Compensation—Narrative Discussion Regarding Summary Compensation Table—Equity Incentive Units and Restricted Stock Awards.” The following table shows the outstanding shares of restricted stock subject to the applicable performance-based vesting conditions that were issued in connection with the Reorganization:
| Total Enterprise Value |
Number of Shares of Restricted Stock to Vest |
|||
| $1,400,000,000 |
2,727,642 | |||
| $1,800,000,000 |
2,727,511 | |||
Derivative Instruments
In April 2012, we entered into the 2022 Note with WCAS Capital IV, a related party. The note contains certain prepayment features related to mandatory redemption upon a liquidation event. As of December 31, 2012, we have identified the prepayment feature of the note as a derivative instrument which is required to be bifurcated and separately accounted for at fair value with changes in fair value recorded in earnings. Refer to Note 7 of our audited consolidated financial statements as of and for the years ended December 31, 2013 and 2012 for further discussion. The following are the significant inputs used to value the derivative instrument as of December 31, 2013 and 2012:
| 2013 | 2012 | |||
| Probability of exit |
90% | 90% | ||
| Remaining term |
0.8 year - 8.3 years | 3.3 years - 9.3 years | ||
| Yield Volatility |
21.4% - 31.1% | 20.4% - 28.5% | ||
| Credit Spread |
8.90% | 11.94% | ||
| Risk-free rate |
0.13% - 2.45% | 0.36% - 1.78% |
There were no derivative instruments outstanding as of December 31, 2011.
Recent Accounting Pronouncements
In February 2013, the Financial Accounting Standards Board, or FASB, issued authoritative guidance which adds new disclosure requirements for items reclassified out of Accumulated Other Comprehensive Income, or AOCI. The update requires that an entity present either in a single note or parenthetically on the face of the financial statements, the effect of significant amounts reclassified from each component of AOCI based on its source and the income statement line items affected by the reclassification. The amendment is effective for fiscal years and interim periods beginning on after December 15, 2012. We adopted this new guidance for the year ended December 31, 2013, which did not have a material impact on our disclosure in the consolidated financial statements.
In February 2013, the FASB issued authoritative guidance, which added new disclosure requirements to measure obligations resulting from joint and several liability arrangement for which the total amount of the obligation within the scope of this guidance is fixed at the reporting date and disclose the arrangements and the total outstanding amount of obligation for all joint parties. These disclosures are in addition to existing related party disclosure requirements. The amendment is effective for fiscal years and interim periods beginning after December 15, 2013 and we do not expect the adoption of such guidance to affect our consolidated financial statements.
65
Table of Contents
Overview
We are a leading provider of a comprehensive, cloud-based HCM software solution delivered as Software-as-a-Service. We provide functionality and data analytics that businesses need to manage the complete employment life cycle from recruitment to retirement. Our solution requires virtually no customization and is based on a core system of record maintained in a single database for all HCM functions, including talent acquisition, time and labor management, payroll, talent management and HR management applications. Our user-friendly software allows for easy adoption of our solution by employees, enabling self-management of their HCM activities in the cloud, which reduces the administrative burden on employers and increases employee productivity.
Organizations need sophisticated, flexible and intuitive applications that can quickly adapt to their evolving HCM requirements, streamline their HR processes and systems and enable them to control costs. We believe that the HCM needs of most organizations are currently served either by legacy providers offering outdated on-premise products or multiple providers that partner together in an attempt to replicate a comprehensive product. These approaches often result in large up-front capital requirements, extended delivery times, high costs, low scalability and challenges with system integration.
Because our solution was developed in-house and is based on a single platform, there is no need to integrate, update or access multiple databases, which are common issues with competitor offerings that use multiple third-party systems in order to link together their HCM offerings. Additionally, our solution maintains data integrity for accurate, actionable and real-time analytics and business intelligence and helps clients minimize the risk of compliance errors due to inaccurate or missing information. We deliver feature-rich applications while maintaining excellence in information security and quality management standards as evidenced by our ISO certifications. As part of our client retention effort, a specialist within a dedicated team is assigned to each client to provide industry-leading personalized service.
The key benefits of our differentiated solution as compared to competing products:
| • | Comprehensive HCM solution. Our solution offers functionality that manages the entire employment life cycle for employers and employees, from recruitment to retirement. Our user-friendly applications help clients identify candidates, onboard employees, manage time and labor, administer payroll deductions and benefits, manage performance, offboard employees and administer post-termination health benefits such as COBRA. Our solution also has the advantage of being built in-house by our highly trained and skilled team of software developers; |
| • | Core system of record enabling data analytics maintained on a single database. Our solution is based on a core system of record that contains payroll and HR information in one convenient database, thereby reducing costs by eliminating the need for multiple software products and vendors and the maintenance of employee data in numerous databases that have to be merged or synchronized. This core system of record allows our clients the ability to access and analyze accurate employee information to make business decisions based upon actionable, real-time, point-and-click analytics provided on our client dashboard; |
| • | Personalized support provided by trained personnel. Our solution is supported by one-on-one personal assistance from trained specialists. Services specialists are assigned to specific clients and are trained across all of our applications, ensuring they provide comprehensive, expert-level service; |
| • | Software-as-a-Service delivery model. Our SaaS delivery model allows clients with a geographically dispersed workforce to operate more efficiently and allows these clients to access and use our client-oriented Internet solution on demand and remotely through a standard web browser, smart phones, tablets and other web-enabled devices, which lowers the total cost of ownership as compared to on-premise products; |
66
Table of Contents
| • | Cloud-based architecture. Our cloud-based architecture allows our solution to be implemented remotely and software enhancements and newly developed applications to be deployed without client disruption and involvement, which requires smaller investments in hardware, personnel, implementation time and consulting; and |
| • | Scalability to grow with our clients. Our solution offers improved scalability as our clients are able to use the same solution as their businesses grow by deploying applications as-needed in real-time, which allows clients to align HCM spending with evolving HCM needs as compared to traditional HCM products that require clients to migrate to new software as they grow, but retain fixed costs even if the client shrinks in size. |
We sell our solution directly through our internally trained, client-focused and highly skilled sales force based in offices across the United States. As a part of our client retention effort, a specialist within a dedicated team is assigned to each client to provide industry-leading, personalized service. We have over 10,000 clients, or over 6,000 clients based on parent company grouping, none of which constituted more than one-half of one percent of our revenues for the year ended December 31, 2013. We believe that as a result of our focus on client retention, we enjoy high client satisfaction as evidenced by an average annual revenue retention rate of 91% from existing clients for the three years ended December 31, 2013. We believe our revenue retention rate understates our client loyalty because this rate also includes former clients that were acquired or otherwise ceased operations.
We were founded in 1998. Software is a Delaware corporation that was formed in October 2013 to undertake this offering. Since our founding, we have focused on providing an innovative SaaS HCM solution. As of December 31, 2013, we had 840 employees across the United States. For the years ended December 31, 2013, 2012 and 2011, our revenues were $107.6 million $76.8 million and $57.2 million, respectively, representing year-over-year growth in revenues of 40% and 34%, respectively. We currently derive most of our revenues from payroll processing. We are able to determine revenues from payroll processing because all of our clients are required to utilize our payroll application in order to access our other applications. We do not separately track our revenues across our other applications because we often sell applications in various groupings and configurations for a single price. We realized net income of $7.7 million, $4.2 million and $1.4 million for the years ended December 31, 2013, 2012 and 2011, respectively.
Industry Background
Large Market Opportunity for HCM Technologies
According to IDC, the U.S. market for HCM applications is comprised of software that automates business processes covering the entire span of an employee’s relationship with his or her employer. IDC estimates that this market, excluding payroll services, will total $5.8 billion in 2014. These applications include maintenance of HR records, recruiting applications, performance management, time and labor management tracking, compliance, compensation management and other HR functions. According to IDC, the U.S. market for payroll services will be an estimated $16.2 billion in 2014. The payroll services market includes transactional activities associated with paying employees, maintaining accounting records and administrating payroll taxes while payroll accounting applications offer the functionality to effectively track these various payments and transfers.
IDC estimates that the international market for HCM applications (excluding the United States) will be $4.1 billion in 2014.
Economic and Technological Trends Are Driving Demand for HCM Solutions
Organizations operating in today’s global economy are continually under pressure to reduce operating costs in order to maintain or improve their competitive positions. One tactic used by organizations is to utilize information technology, or IT, provided by external resources in order to automate internal processes, reduce internal administrative burdens and more effectively manage capital expenditures and labor costs. As a result, businesses are increasingly making the strategic decision to leverage HCM technologies in order to improve the
67
Table of Contents
effectiveness and efficiency of their internal HR and accounting functions and capture opportunities for cost savings. According to IBISWorld, companies often outsource administrative services, such as time and labor management, after initially outsourcing payroll.
Organizations are also managing internal costs and administrative burdens by transitioning technological assets from on-premise to the cloud. By shifting HR systems to the cloud, businesses seek to avoid the difficulties associated with maintaining software and security updates, and storage needs as well as other maintenance issues. The rise of cloud computing has supported the SaaS delivery model. According to IDC, the global SaaS market is projected to grow from $23 billion in 2011 to $67 billion in 2016, at a CAGR of 24%.
We believe that businesses increasingly view data concerning their human capital as a critical strategic resource that can result in more informed decision-making concerning employee recruitment, retention and compensation. This revolution in data analytics and its extension to HR functions has increased the number of employees within an organization that can benefit from, and who regularly interface with, information technologies. As a result, organizations seek intuitive technologies that do not require extensive training or advanced technological credentials to be effectively utilized. The user experience of business applications is changing to emulate the consumer experience as HR buyers increasingly seek applications that are intuitive and available anywhere on any web-enabled device.
Incumbent HCM Products Struggle To Meet the Needs of Businesses
We believe that a majority of businesses and organizations in the United States are using multiple HCM systems from more than one vendor, thereby impeding their ability to share data across these systems. Several incumbent payroll and HCM vendors offer product sets that are comprised of separate systems that require integration. In certain cases, this disparate product offering across several vendors is the result of several acquisitions which often leads to a loosely coupled product set that is marked by significant architectural differences and weak data integration. We believe that this type of offering increases the risk of user or system error and reduces overall effectiveness.
A comprehensive HCM solution leverages the same data, process and workflow management, security model, reporting and analytics tools, and user portals to provide a uniform user experience. We believe that significant analytical power remains trapped within the data that organizations are accessing across multiple applications and databases but are unable to analyze in a unified context.
We believe that vendors who pursue market segmentation strategies based on organization size or industry create difficulties for clients who grow, either in size or industry scope, beyond the confines of those vendors’ offerings. A scalable HCM solution based on a core system of record allows for an organization to grow in size and scope without transitioning to a new user interface or back-end database.
The Paycom Solution
We offer an end-to-end SaaS HCM solution that provides our clients and their employees with immediate access to accurate and secure information and analytics 24 hours a day, seven days a week from any location. We believe that our solution delivers the following benefits:
Comprehensive HCM Solution
Our solution offers functionality that manages the entire employment life cycle for employers and employees, from recruitment to retirement. Our user-friendly applications streamline client processes and provide clients and their employees with the ability to directly access and manage administrative processes, including applications that identify candidates, onboard employees, manage time and labor, administer payroll deductions and benefits, manage performance, offboard employees and administer post-termination health benefits such as COBRA. The widespread employee usage of our applications helps further integrate our solution into the
68
Table of Contents
administrative processes of our clients. Our solution also has the advantage of being built in-house by our highly trained and skilled team of software developers, thereby minimizing data integrity issues across applications.
Core System of Record
Our solution is based on a core system of record that contains payroll and HR information in one convenient database, thereby reducing costs and eliminating the need for multiple software products and vendors and the maintenance of employee data in numerous databases. This core system of record enables our clients to input employee data one time and enjoy seamless functionality across our applications. When a revision is made to the file of an employee, all appropriate personnel have access to the change in real time. In addition, our core system of record helps clients minimize the risk of compliance errors due to inaccurate or missing information that results from maintaining multiple databases. Through accurate tracking and management of employee payroll and other HR data, such information can be compiled for comprehensive and consistent reporting for our clients.
Data Analytics
Our solution allows clients to analyze accurate employee information to make business decisions based upon actionable, real-time, point-and-click analytics provided through our client dashboard. This functionality helps our clients operate with a more complete and accurate picture of their organization as our solution’s embedded analytics capture the content and context of everyday business events, facilitating fast and informed decision-making from any location. The employees of our clients also benefit from our analytics platform as they are able to model in real-time the impact of their HCM decisions on their compensation, benefits and rewards.
Personalized Support Provided by Trained Personnel
Our applications are supported by one-on-one personal assistance from trained specialists. Services specialists are assigned to specific clients and are trained across all of our applications, ensuring they provide comprehensive, expert-level service. Our client service is ISO 9001:2008 certified on the basis of its quality and consistency. We strive to provide our clients with high levels of service and support to ensure their continued use of our solution for all of their HCM needs. We have maintained high client satisfaction, as evidenced by an average annual revenue retention rate of 91% from existing clients for the three years ended December 31, 2013.
Software-as-a-Service Delivery Model
Our SaaS delivery model allows clients with a geographically dispersed and mobile workforce to operate more efficiently, and allows these clients to implement, access and use our client-oriented Internet solution on demand and remotely through standard web browsers, smart phones, tablets and other web-enabled devices. Our SaaS solution reduces the time, risk, headcount and costs associated with installing and maintaining applications for on-premise products within the information technology infrastructure of our clients.
Secure Cloud-Based Architecture
Our cloud-based architecture allows our solution to be implemented remotely with minimal client interaction. Updates such as software enhancements and newly developed applications can be deployed without client interaction, disruption or involvement, allowing our clients to make a smaller investment in hardware, personnel, implementation time and consulting. Additionally, we own and maintain all of the infrastructure technology to host our solutions and to maximize system availability for clients. Our focus and investment in technology and data security has been recognized with ISO/IEC 27001:2005 certified security standards that provide our clients with a “best-in-class” level of data security.
Scalability to Grow with our Clients
Our solution is highly scalable. We have served a diversified client base ranging in size from one to more than 8,000 employees. We calculate the number of employees using clients based on parent company grouping.
69
Table of Contents
Our clients are able to use the same solution while their businesses grow by deploying applications as-needed in real-time. Pricing is determined by employee headcount and the number of applications utilized, enabling our clients to align HCM spending with their evolving HCM needs as compared to traditional HCM products that require clients to migrate to new software as they grow but retain fixed costs even if the client shrinks in size.
Our Strategy for Growth
Our strategy is to continue to establish our solution as the HCM industry standard. To accomplish this, we intend to:
Increase Our Presence in Existing Markets
Although we have clients in all 50 states, we believe a significant opportunity exists to expand our presence within markets where we currently have a sales office. We have a sales office in 24 of the 50 largest MSAs in the United States based on 2010 U.S. census data, only one of which is served by multiple sales teams. We believe that the 50 largest MSAs in the United States could collectively support at least 100 additional sales teams. Each sales office is typically staffed with one sales team, with each team comprised of approximately seven to nine sales professionals. We plan to increase our presence in existing markets by adding sales offices and increasing the number of our sales teams to further penetrate and effectively capture these markets.
Expand Into Additional Markets
We plan to continue expanding our sales capability by opening sales offices in certain metropolitan areas where we currently have no sales teams. We have identified 50 untapped metropolitan areas where we could potentially open a new sales office staffed with at least one sales team. Since September 2012, we have opened sales offices in Baltimore, Detroit, Indianapolis, Minneapolis, New York, Philadelphia, San Francisco, Seattle and Silicon Valley. We intend to open six to eight additional offices over the next two years, as well as potentially expand over the longer term into international markets.
Enlarge our Existing Client Relationships
We dedicate our resources to helping our clients facilitate their goals, whether through helping them execute better hiring decisions, manage compensation more effectively or simply operate more efficiently. We believe a significant growth opportunity exists in selling additional applications to our current clients. Many clients have subsequently deployed additional applications as they recognize the benefits of our comprehensive solution. During the year ended December 31, 2013, all of our clients, including our new clients, on average utilized 5.2 of our 18 then available applications. During that same period, however, new clients on average utilized 6.2 applications. We believe that there is a significant opportunity to sell additional applications to our existing clients. As we extend and strengthen the functionality of our solution, we will continue to invest in initiatives to increase the adoption of our solution and maintain our high levels of client satisfaction.
Target Larger Clients
As we have organically grown our operations and increased the number of our applications, the average size of our clients has also grown significantly. Based on our total revenues, we have grown at an approximately 38% CAGR since 2009. Our solution requires no adjustment to serve larger clients. We believe larger employers represent a substantial opportunity to increase the number of clients and to increase our revenue per client, with limited incremental cost to us. From January 1, 2011 through December 31, 2013, we increased our annualized recurring revenue per average client by 52.7%, in part by targeting larger clients and enlarging our existing client relationships. To further capitalize on this opportunity, we intend to target larger businesses opportunistically where our current sales model is effective.
70
Table of Contents
Maintain Our Leadership in Innovation by Strengthening and Extending our Solution
Our ability to develop and deploy new applications and updates rapidly and cost-effectively has been integral to the results that we have achieved to date. We intend to continue extending the functionality and range of our solution in the future, and recently launched a new application. Our development efforts are performed exclusively in-house and are heavily based upon proactive research and client input. In the near-term, we intend to focus our investments on further developing applications within our higher margin HR and talent management applications. Over the long term, we intend to increase our investment in the development of new applications that are responsive to the needs of our clients, which are garnered through ongoing client interaction and collaboration.
Our Applications
Our HCM solution offers a full suite of applications that generally fall within the following categories: talent acquisition, time and labor management, payroll, talent management and HR management.
Talent Acquisition

|
Applicant Tracking. Our applicant tracking application simplifies the recruiting processes needed to hire the most qualified employees. By using our all-in-one system, our clients can move candidates from the application process through new employee on-boarding without re-keying data. | |

|
Employment Background Checks. Our employment background check application helps to ensure that prospective new hires are qualified candidates. We provide clients with the tools for authorizing background checks, creating pre-adverse and adverse action letters and securely storing results as required by the Fair Credit Reporting Act. | |

|
On-Boarding/Off-Boarding. Our on-boarding/off-boarding application streamlines the hiring and termination processes for employees of our clients by creating online checklists of tasks to be assigned to an employee or group of employees. | |

|
E-Verify®. Our E-Verify® application automates employment verification and reduces our clients’ exposure to audits and penalties that could result from I-9 violations. | |

|
Tax Credit Services. Our tax credit services application helps employers process and calculate the available federal tax credits associated with hiring employees who meet various qualifications. | |
Time and Labor Management

|
Time and Attendance. Our time and attendance application allows our clients to accurately and efficiently manage when, where and how employees report their hours worked. Clients can apply customized rules, use batch editing and use timecard management tools to manage complex time and attendance needs. Our web time clocks feature allows employees to clock in and out online, which automatically updates the payroll application when approved, eliminating the need to manually calculate timesheets and rekey information into payroll systems. We also offer several different types of hardware terminals that are ideal for single or multi-clock environments. | |

|
Scheduling. The scheduling application helps managers with employee scheduling. This application’s automated functionality provides for a seamless workflow with the payroll and time and attendance applications. Cloud-based convenience also provides employees and managers access to their schedules at any time. | |
71
Table of Contents

|
Time-Off Requests. Our time-off requests application automates and standardizes the time off request procedure and helps employers remain effectively staffed. Managers can view an online time-off calendar to easily monitor and approve or deny time-off requests. Our employee self-service tool allows employees to view the time-off they have available, submit requests and view blackout dates, the status of requests and any manager comments. | |

|
Labor Allocation. Our labor allocation application simplifies the process of setting up and tracking employee hours based on the job the employee is working. | |

|
Labor Management Reports. Our labor management report application helps clients get up-to-the-minute reports on the information they need to better manage their labor force, such as overtime and labor distribution. | |
Payroll

|
Payroll and Tax Management. Our payroll application is the foundation of our solution and all of our clients are required to utilize this application in order to access our other applications. Our payroll application is automatically updated with changes in employee information and offers other time saving functionality such as batch editing and effective dating. The application can be accessed at any time to make changes, run payroll and generate custom reports. We also help our clients by handling their payroll taxes and deposits, regulatory correspondence, amendments, and penalty and interest disputes. | |

|
Paycom Pay. Our Paycom Pay application eliminates the tedious job of check reconciliation by issuing checks to our clients’ employees that clear from a Paycom bank account, which helps clients eliminate potential liability and simplifies the reconciliation process. | |

|
Expense Management. This application eliminates the manual, paper-based processes associated with employee expense reimbursement and allows employers to control and monitor expenses by setting clearly-defined rules and parameters for reimbursement for employees. Employees can upload receipts when submitting their expenses and access an expense dashboard where they can view the status of their submitted expenses. | |

|
Garnishment Management. This application allows us to handle communications with garnishment payees and agencies and to calculate and track garnishment payments. | |
Talent Management

|
Employee Self-Service. Our employee self-service application improves employee engagement by empowering our clients’ employees to self-manage certain transactions, obtain quick answers to frequent payroll and HR questions, access their pay history and view performance goals and reviews and total compensation reports to review their compensation and benefits package. Benefits information and paid time off accruals also give employees the ability to make informed decisions regarding their benefit selections and time-off requests. | |

|
Compensation Budgeting. With compensation and performance information in one system, our compensation budgeting tool provides clients with valuable workforce insight to help manage and formulate salary budgets and help establish merit-based compensation increases. | |
72
Table of Contents

|
Performance Management. This application allows for standardized positions across a company with set pay grades and performance goals. It also helps streamline the performance review process with online facilitation of the review process. | |

|
Executive Dashboard. Our executive dashboard offers powerful workforce insight for executives to access information on demand in a variety of report formats. Because we offer an all-in-one solution in a single database, the comprehensive report data provides the workforce intelligence needed to drive human capital decisions at an executive level. | |
HR Management

|
Document Management. Our document management application manages employee files, including the ability to have employees digitally sign and view company documents. We securely store client records to meet retention requirements and protect documents from unauthorized access and other disasters that can threaten businesses. | |

|
Government and Compliance. Our government and compliance application helps clients reduce exposure to violations, audits and penalties with respect to the employment laws impacting their business, such as the Family Medical Leave Act, Equal Employment Opportunity Commission and other state and federal regulations. A single database keeps our clients’ employee data consistent and enhances reporting capabilities by providing better accuracy and real-time insight. | |

|
Benefits Administration. Our benefits administration application allows clients to customize benefit plan setup, deduction amounts, enrollment dates and new-hire waiting periods. Employers are provided census and reconciliation reports to ensure they do not overpay for benefits and can update deduction amounts for all employees or groups of employees at once. This application also provides employees with online enrollment and helps educate them and drive informed enrollment decisions for greater employee satisfaction. | |

|
COBRA Administration. Our COBRA administration application protects employers from COBRA violations and their associated fines and penalties by automatically initiating compliance measures with the entry of qualifying events into the application. This application also tracks important dates, collects and remits premiums and reports on all COBRA activity. | |

|
Personnel Action Forms. This application helps our clients reduce the amount of time and paperwork required with employee changes such as pay rate, position and title changes by allowing managers to complete and approve online personnel action forms. | |
Our Clients
We serve a diverse client base in terms of size and industry. We have over 10,000 clients, or over 6,000 clients based on parent company groupings, none of which constituted more than one-half of one percent of our revenues for the year ended December 31, 2013. We stored data for more than 1,000,000 persons employed by our clients during the year ended December 31, 2013.
Based on parent company grouping, companies with fewer than 50 employees comprised approximately 10% of total revenues for the year ended December 31, 2013. Revenues for clients based on parent company grouping, with 50-2,000 employees and more than 2,000 employees represented approximately 86% and 4%, respectively, of total revenues for the year ended December 31, 2013. Many of our clients that are small to mid-sized companies can typically make the decision to adopt our solution more quickly than larger companies,
73
Table of Contents
which we believe results in a shorter sales cycle, which more closely corresponds to our target sales cycle of 30 to 90 days. As a result of the nature and size of our clientele, we maintain a diversified client base and very low client concentration. We believe, however, larger employers represent a substantial opportunity to increase the number of clients and to increase our revenue per client with limited incremental cost.
Competition
The market for HCM solutions is rapidly evolving, highly competitive and subject to changing technology, shifting client needs and frequent introduction of new products and services. Our competitors range from small, regional firms to large, well-established international firms with multiple product offerings.
We compete with firms that provide HCM solutions by various means. Many providers continue to deliver legacy enterprise software, but as demand for greater flexibility and access to information grows, we believe there will be increased competition in the delivery of HCM cloud-based solutions by other SaaS providers. Our competitors offer HCM solutions that overlap with one, several or all categories of applications offered by our solution. Our talent acquisition and talent management applications compete primarily with Cornerstone OnDemand, Inc., Oracle Corporation, SAP AG and Workday, Inc. Our payroll applications, including payroll processing, compete primarily with ADP, Ceridian Corporation, Concur Technologies, Inc., Intuit, Inc., Paychex, Inc. and The Ultimate Software Group, Inc. Our HR management applications compete primarily with ADP, Ceridian Corporation, Oracle Corporation, Paychex, Inc., SAP AG, and Workday, Inc. Our time and labor management applications compete primarily with ADP, Ceridian Corporation and The Ultimate Software Group, Inc. Our larger competitors compete with us across multiple segments. In addition, our HCM solution continues to face competition from in-house payroll and HR systems and departments as well as HR systems and software sold by third-party vendors.
Competition in the HCM solutions market is primarily based on service responsiveness, product quality and reputation, breadth of service and product offering and price. The importance of these factors depends on the size of the business. Price tends to be the most important factor of competition for smaller businesses with fewer employees while the scope of features and customization is more important to larger businesses. We believe that our SaaS delivery model allows us to be most competitive in the HCM solutions market across this spectrum.
Sales and Marketing
We sell our solution exclusively through our sales force that included 218 sales professionals as of December 31, 2013, substantially all of whom have a four-year college degree. Our sales force is comprised of inside sales and field sales personnel who are organized geographically and CRRs, who sell additional applications to existing clients. We have 30 sales teams located in 20 states and plan to open additional sales offices to further expand our presence in the U.S. market. As of December 31, 2013, 23% of our sales force had achieved “executive sales representative” status by generating in excess of $300,000 of annualized new recurring revenue.
We provide our sales force with an intensive four-week training course that includes at least one week of training at our headquarters in Oklahoma City. Our unique training program includes instruction in accounting, business metrics, product features and tax matters relevant to our target market. Our training continues for our sales force through weekly in-office strategy sessions and leadership development training. Executive sales representatives are also required to attend in-person quarterly conferences to share best practices and receive legal and business updates.
When a new client processes with us for an entire month, our sales representative receives a commission based upon annualized new recurring revenue. This commission is only paid once per new customer. Executive sales representatives receive a higher commission rate and base salary based upon both current year and life-to-date realized sales, respectively.
74
Table of Contents
We generate client leads, accelerate sales opportunities and build brand awareness through our marketing programs that target finance and HR executives, technology professionals and senior business leaders of companies that perform HCM functions in-house or outsource these functions to one of our competitors. Our principal marketing programs include:
| • | Direct mail campaigns, email campaigns, personalized URLs, industry-specific print advertising and tradeshow exhibiting; |
| • | Search engine marketing methods that include site optimization and pay-per-click searches; and |
| • | National radio advertising on Sirius/XM Radio and specifically on the Fox News, Fox Talk, Bloomberg and MSNBC stations. |
Our 30 CRRs are focused on expanding the number of applications our clients purchase from us by introducing them to additional applications. Our CRRs call upon select clients periodically and are paid a non-recurring commission on any additional sales they generate.
Technology, Operations and Security
Technology
Our multi-tenant architecture enables us to deliver our solution across our client base with a single instance of our solution, while securely partitioning access to our clients’ respective application data. Because a single version of our solution is developed, supported and deployed across all of our clients, updates are delivered to all of our clients at the same time, making it easier to scale our solution as the number of our clients and their employees expands.
We maintain diverse load-balanced Internet lines serviced by multiple networks to provide our clients continuous access to our solution and their stored data. We back up our client data at regular intervals utilizing live replication, snapshots and cold archive methods of backup and manually monitor backup success and failure regularly. Our server cluster and database servers have redundant “hot swappable” disks to ensure continuous service in the event of a disk failure.
Operations
We physically host our solution for our clients in two secure data center facilities located in Oklahoma and Texas. All of our critical systems are fully redundant and backed-up in real-time to these facilities. Physical security includes ID-oriented access control, alarm systems and manned 24 hour a day camera monitoring by our security guards. Server facilities also have environmental monitoring and extensive environmental controls such as heat and fire protection, moisture, temperature, and humidity sensors, backup power supply and exterior reinforced concrete walls.
Security
We maintain a formal and comprehensive security program designed to ensure the confidentiality, integrity and availability of our clients’ data. During the regular course of business, we receive client data through our online system that we in turn process, record and store following ISO/IEC 270001:2005 certified controls and procedures. All communications with our servers that might contain sensitive information are encrypted before they leave the network and our servers are configured to only allow high-grade encryption algorithms.
We strictly regulate and limit all access to servers and networks at each of our facilities. Local network access is restricted by our authenticated server, using access control lists and remote network access is restricted by a firewall, which provides no accessible route from external networks to systems within our local network. We also employ network and host intrusion detection and prevention sensors throughout our infrastructure, systems that monitor and alert on insecure installations of third-party applications, a full system for managing
75
Table of Contents
and installing patches for those applications and highly restricted access to the Internet for anyone who has access to client data. We retain a third-party penetration testing company to conduct penetration tests and periodic audits to identify and remediate any issues.
Our applications are secured using multiple libraries and secure coding practices. We engage in regular penetration testing performed by both our information security department as well as by a third party testing company. Our network infrastructure is secured and monitored using a number of best practices and tools at multiple layers of the physical and logical network. This security is also continually monitored by our information security department.
Software Development
As of December 31, 2013, we had 30 employees dedicated to our application development process. This team works closely with our clients to improve and enhance our application offerings and develop new applications. Our application development process consists of a focused innovation and development timeframe in order to deliver well-developed applications and enhancements desired by our clients. A key element of our development process is the one-on-one personal interaction between clients and our client relations representatives, through which our clients suggest new applications and features.
We develop our solution from the “ground up” with our internal development and engineering teams. Our development and engineering teams and our employees conceive of new applications and enhancements, review requests, schedule development in order of priority and subsequently develop the applications or enhancements. Our new applications and enhancements are independently reviewed by the quality assurance team, in accordance with our software development process, before being fully implemented. Any enhancements to our applications are released on a monthly scheduled release date to coordinate the communication and release to our clients.
Capitalized development expenses, which include compensation for employees directly associated with development projects, were $1,221,000, $585,000 and $497,000 for the years ended December 31, 2013, 2012 and 2011, respectively.
Client Service
We are committed to providing industry-leading, client-centered service. For this reason, we assign each client a specialist within a dedicated team. This one-to-one service is a key part of our client service model and helps to ensure that we are delivering an industry-leading solution and maintaining high client satisfaction. The primary elements of our client service model include the following:
Streamlined Setup and Onboarding
After a client elects to deploy our solution, that client goes through our onboarding process with assistance from a team of new client setup specialists and the sales professional responsible for obtaining the client’s business. This team works closely with the client until the client is capable of managing our solution independently, in which case it is transferred to our dedicated services specialists.
Dedicated Service Specialists
After completing the onboarding process, each client is assigned to a specialist within a dedicated team that provides primary support for the remainder of the client’s time with the Company. Clients can then contact their dedicated services specialist or a team member if any issues or questions arise. These specialists provide personalized service with actual knowledge of the clients’ business needs. When appropriate, client questions can be elevated to the specialists with the appropriate application, regulatory or tax expertise. In addition, our CRRs proactively contact our clients to ensure satisfaction with our solution and introduce additional applications.
76
Table of Contents
Expert Level Service
Our client specialists are trained across all of our applications to ensure that they can provide comprehensive, expert-level service. Our client service is ISO 9001:2008 certified on the basis of its quality consistency and helps support a high client retention rate.
Regulatory and Certifications
We are subject to varying degrees of regulations in each of the jurisdictions in which we provide services. Local laws and regulations, and their interpretation and enforcement, differ significantly among those jurisdictions. These regulations and laws cover, among others, information disclosure.
Personal privacy has become a significant issue in the United States and in other countries. The regulatory framework for privacy issues worldwide is rapidly evolving and is likely to remain uncertain for the foreseeable future. Many federal, state and foreign government bodies and agencies have adopted or are considering adopting laws and regulations affecting or regarding the collection, use and disclosure of personal information. In the United States, these include, among others, rules and regulations promulgated under the authority of the Federal Trade Commission, the Health Insurance Portability and Accountability Act of 1996, the Family Medical Leave Act of 1993, the Patient Protection and Affordable Care Act and state breach notification laws.
We voluntarily obtain third party security examinations relating to security and data privacy in accordance with Statement on Standards for Attestation Engagements, or SSAE, No. 16, Reporting on Controls at a Service Organization. Our SSAE examination is conducted every six months by an independent third party auditor, and addresses, among other areas, our physical and environmental safeguards for production data centers, data availability and integrity procedures, change management procedures and logical security procedures.
In February 2011, we obtained a certification based on ISO/IEC 27001:2005 criteria, a security standard for Information Security Management Systems published by ISO covering our production, quality assurance and implementation environments. This independent assessment of our conformity to the ISO 27001 standard includes assessing security risks, designing and implementing comprehensive security controls and adopting an information security management process to meet security needs on an ongoing basis. The certification is valid for three years, with surveillance audits taking place annually.
In April 2011, we obtained a certification based on ISO/IEC 9001:2008 criteria, a standard for the implementation of quality management processes published by ISO, covering our activities required to create and deliver our solution. This independent assessment of our conformity to the ISO 9001 standard includes assessing the design and implementation of quality objectives to meet delivery standards on an ongoing basis. The certification is valid for three years, with surveillance audits taking place annually.
Intellectual Property
We rely on a combination of copyrights, trademarks, service marks, trade secret laws and contractual restrictions to establish and protect our intellectual property rights. We also have a number of registered and unregistered trademarks and will continue to evaluate the registration of additional trademarks as appropriate. We do not have any patents or patent applications pending.
Seasonality
Our revenues are seasonal in nature. Recurring revenues include revenues relating to the annual processing of payroll forms such as Form W-2 and Form 1099. Because these forms are typically processed in the first quarter of the year, first quarter revenue and margins are generally higher than in subsequent quarters. We believe this seasonality is driven by several factors, most notably the number of our clients that use our payroll application, as compared to the other applications that we offer. As our clients use additional applications in the future, we believe that the seasonality in revenues will diminish.
77
Table of Contents
Legal Proceedings
From time to time, we are involved in various legal proceedings arising from the normal course of business activities, including the legal proceeding described below. Defending such proceedings is costly and can impose a significant burden on management and employees; we may receive unfavorable preliminary or interim rulings in the course of litigation, and there can be no assurances that favorable final outcomes will be obtained.
On July 29, 2013, Dr. Lakshmi Arunachalam filed a complaint against us in the U.S. District Court for the District of Delaware alleging infringement of U.S. Patent No. 8,244,833, which is entitled “Real-Time Web Transaction Systems to Access On-Line Services Over the Web from Web Applications.” According to the patent, it provides a method and apparatus for providing real-time, two-way transactional capabilities on the Web. It is alleged that Payroll’s web services perform a series of steps that violate at least claim ten of the patent-in-suit. The steps purportedly include: (1) activate an OSI application layer on-line service network on the Web, wherein said on-line network is an on-line payroll processing service network on the Web; (2) display a Web application on a Web page, wherein the Web application is a payroll processing services Web application; (3) execute said Web application on a Web server comprising memory and a processor; (4) display a list of services accessible for performing real-time Web transactions from said payroll processing services Web application on the Web page; (5) perform real-time Web transactions from the Web application; (6) manage the connection between the Web application displayed on a multi-media device and a back office of a payroll processing service provider; (7) control the flow of one or more real-time Web transactions from the payroll processing Web application; and (8) complete a payroll processing Web transaction in real-time relating to a selected payroll processing service. At the early stage of this litigation, Dr. Arunachalam has not yet submitted infringement contentions so it cannot be determined why she believes her patent covers the products or services offered by us.
The complaint seeks a permanent injunction, damages, and attorneys’ fees should we be found to infringe. Dr. Arunachalam has asserted similar claims in Delaware for the alleged infringement of the same patent against other payroll processing companies. Dr. Arunachalam has also accused various other entities of infringing related U.S. patents. On October 4, 2013, we filed an answer, affirmative defenses and counterclaims to the complaint. We denied all claims made against us by Dr. Arunachalam in her complaint, asserted various defenses and counterclaims for non-infringement and challenged the validity and enforceability of U.S. Patent No. 8,244,833. Dr. Arunachalam filed a reply to our counterclaim on October 28, 2013 and denied non-infringement and invalidity. We believe that this litigation is without merit and intend to vigorously defend ourselves in this matter. Although we cannot predict the outcome of this litigation, legal matters are subject to inherent uncertainties and there exists the possibility that the ultimate resolution of this litigation could have a material adverse effect on our business, financial condition, results of operations or cash flows.
Employees
Our ability to recruit and retain qualified employees is critical to our continued success. We invest heavily in our training and leadership development programs to encourage the development and promotion of our employees. As of December 31, 2013, we employed approximately 840 people. None of our employees were covered by collective bargaining agreements. We consider our relationship with our employees to be good.
Facilities
Our corporate headquarters is located in Oklahoma City, Oklahoma and includes a 90,000 square foot processing center. We have begun construction on a second building to enlarge our corporate campus by an additional 80,000 square feet and we have a 2,271 square foot disaster recovery site located in Oklahoma City. We own over 30 acres in Oklahoma City upon which our facilities are located. We also own and operate a 1,500 square foot fully redundant data center located at our corporate headquarters in Oklahoma and lease a 300 square foot fully redundant data center in Texas.
78
Table of Contents
We also lease offices in Arizona, California, Colorado, District of Columbia, Florida, Georgia, Illinois, Indiana, Maryland, Massachusetts, Michigan, Minnesota, Missouri, New Jersey, New York, North Carolina, Oklahoma, Pennsylvania, Texas and Washington. We believe that these facilities are suitable for our current operations and upon the expiration of the terms of the leases we believe we could renew these leases or find suitable space elsewhere on acceptable terms.
79
Table of Contents
Executive Officers and Directors
The following table provides information regarding our executive officers and directors as of March 31, 2014:
| Name |
Age | Position(s) | ||||
| Chad Richison |
43 | President, Chief Executive Officer and Director | ||||
| Craig E. Boelte |
50 | Chief Financial Officer | ||||
| Jeffrey D. York |
46 | Chief Sales Officer | ||||
| William X. Kerber III |
38 | Chief Information Officer | ||||
| Robert J. Levenson(1) |
72 | Director | ||||
| Robert Minicucci(1)(2)(3) |
61 | Chairman of the Board | ||||
| Conner Mulvee |
31 | Director | ||||
| Frederick C. Peters II(1) |
64 | Director | ||||
| Sanjay Swani(2)(3) |
47 | Director | ||||
| (1) | Member of the Audit Committee. |
| (2) | Member of the Compensation Committee. |
| (3) | Member of the Nominating and Governance Committee. |
Chad Richison has served as President and Chief Executive Officer since he founded Paycom in 1998. Mr. Richison has also served as a Director since 1998. He began his career in sales with ADP, and then moved to Payroll 1 prior to founding Paycom. Mr. Richison received his B.A. in Mass Communications—Journalism from the University of Central Oklahoma. Mr. Richison was selected to serve on our board of directors because of the leadership skills, strategic guidance and experience he brings as our President and Chief Executive Officer and operational expertise from his prior experience in the industry.
Craig E. Boelte has served as our Chief Financial Officer since February 2006. Before joining Paycom, Mr. Boelte owned an accounting practice serving over 600 clients including Paycom. Prior to that, Mr. Boelte spent nine years at Deloitte & Touche where he served as Senior Tax Manager. Mr. Boelte has over 26 years of experience in the workforce management and HR industry. Mr. Boelte is a member of the Oklahoma Society of CPA’s and the American Institute of CPA’s. Mr. Boelte received his B.S. in Business Administration and Masters in Science in Accounting from Oklahoma State University.
Jeffrey D. York has served as our Chief Sales Officer since 2007. Mr. York opened our Dallas location in 2002 prior to joining our corporate executive team. Before joining Paycom, Mr. York was employed by ADP from 1990 to 2002 where he held a variety of sales management positions including Vice President of Sales for the Major Accounts Division. Mr. York earned his MBA from Baylor University and his Bachelors of Business Administration from Texas Tech University.
William X. Kerber III has served as our Chief Information Officer since July 2007. Mr. Kerber joined us in 1999 while completing his B.S. in computer science. Mr. Kerber is a founding team member has over 17 years of software development and network design experience. Prior to serving as Chief Information Officer, Mr. Kerber served as a lead software developer and network architect. He attended the Oklahoma School of Science and Math (OSSM) and graduated from the University of Oklahoma’s Engineering/Computer Science program where he is currently a member of its board of advisors.
Robert J. Levenson has served as a member of our board of directors since July 2007. Mr. Levenson is a founder and Managing Member of LENOX Capital Group, LLC, a private venture capital investment company formed in 2000 which focuses primarily on early stage software technology and service company investments. From 1981 through 1990, Mr. Levenson held executive management positions with ADP, including Group
80
Table of Contents
President—Employer Services, member of the Corporate Executive Committee and its Board of Directors. In late 1990, Mr. Levenson was named Chief Operating Officer, a member of Office of the President and was elected to the Board of Directors of Medco Containment Services, Inc., which was acquired by Merck & Co., Inc., or Merck, and later spun out to Merck shareholders. From 1992 until 2003, Mr. Levenson served on the Board of Directors of First Data Corporation, or FDC, and from 1993 until his retirement in 2000, he served as Executive Vice President of FDC. Thereafter, he served as a consultant to FDC and some of its joint venture affiliates until 2006. Mr. Levenson has served on boards of directors of public and private companies as well as civic and philanthropic organizations. These include: ADP, FDC, Medco, Central Data Systems, Inc., Comnet, Inc., Polyvision, Broadway & Seymour, Superior TeleCom Inc., Vestcom International, Emisphere Technologies, Inc., Ceridian Corp, and Elite Pharmaceuticals, Inc. He graduated from Kent State University with a B.S. in Business Administration. Mr. Levenson also serves or has served on boards of several private companies. Mr. Levenson was selected to serve on our board of directors because of his industry expertise and experience as a member of the board of directors of other companies.
Robert Minicucci has served as a member of our board of directors since July 2007. He was elected Chairman of the Board in December 2013. Mr. Minicucci joined Welsh, Carson, Anderson & Stowe in August 1993. He has served as a General Partner of Welsh, Carson, Anderson & Stowe and focused on the information/business services industry during his entire tenure with the firm. He continues to serve as a General Partner for certain funds affiliated with Welsh, Carson, Anderson & Stowe. Prior to joining Welsh, Carson, Anderson & Stowe, Mr. Minicucci served as Senior Vice President and Chief Financial Officer of First Data Corporation. Before joining First Data Corporation, he served as Senior Vice President and Treasurer of the American Express Company. He also spent 12 years at Lehman Brothers where he was a Managing Director. Mr. Minicucci currently serves on the board of directors of the following public companies, Alliance Data Systems, Inc. and Amdocs Limited, and previously served on the board of directors of Retalix, Ltd. Over the course of his career Mr. Minicucci has served on the board of directors for 15 publicly and privately held companies. Mr. Minicucci received a B.A. from Amherst College in 1975 and received an M.B.A. from Harvard Business School in 1979. Mr. Minicucci was selected to serve on our board of directors because of his financial and investment expertise and his industry experience with other software technology companies.
Conner Mulvee has served as a member of our board of directors since February 2014. Mr. Mulvee has served as a Vice President at Welsh, Carson, Anderson & Stowe since January 2011. Prior to that, Mr. Mulvee served as an Associate at Welsh, Carson, Anderson & Stowe from August 2008 until January 2011. He focuses on investments in the information/business services and healthcare industries. Prior to joining Welsh, Carson, Anderson & Stowe, he spent two years in the investment banking division of Lehman Brothers. He earned an undergraduate degree from Amherst College in 2005. Mr. Mulvee was selected to serve on our board of directors because of his financial and investment expertise.
Frederick C. Peters II has served as a member of our board of directors since February 2014. He currently serves as the Chairman, President and Chief Executive Officer of Bryn Mawr Bank Corporation, or BMTC, a publicly traded company, and its principal subsidiary, The Bryn Mawr Trust Company. BMTC has approximately $2.1 billion of banking assets and $7.3 billion of wealth assets under management and administration and is listed on the Nasdaq Stock Market. Prior to joining BMTC in 2001, Mr. Peters started two community banks: National Bank of the Main Line in 1985 and First Main Line Bank in 1995. Mr. Peters began his banking career at Philadelphia National Bank in 1976 and held lending and executive positions at Hamilton Bank and Industrial Valley Bank prior to starting his first community bank. Mr. Peters has served on numerous non-profit boards including Main Line Health where he served first as Chairman of the Audit Committee and later as Chairman of the Finance Committee. He currently serves on the board of directors of the National Association of Corporate Directors – Philadelphia Chapter and The Bryn Mawr Film Institute. In addition, Mr. Peters has been on the Board of Directors of the Federal Reserve Bank of Philadelphia since 2009 and is currently the Chairman of that bank’s Audit Committee. Mr. Peters graduated from Amherst College with a B.S. in Political Science. Mr. Peters was selected to serve on our board of directors because of his financial and investment expertise and his experience as a member of the board of directors of a public company.
81
Table of Contents
Sanjay Swani has served as a member of our board of directors since April 2013. Mr. Swani is a member of the management committee of Welsh, Carson, Anderson & Stowe, having joined Welsh, Carson, Anderson & Stowe in 1999. He focuses on investments in the information/business services industry. Prior to joining Welsh, Carson, Anderson & Stowe, he was a Director with Fox Paine & Company, a San Francisco-based private equity firm. Mr. Swani also spent four years in the Mergers, Acquisitions & Restructuring Department and two years in the Debt Capital Markets Department of Morgan Stanley Dean Witter & Co. He earned an undergraduate degree from Princeton University in 1987 and concurrent degrees from the Harvard Law School and the MIT Sloan School of Management in 1994. Mr. Swani was selected to serve on our board of directors because of his financial and investment expertise.
Board of Directors Composition and Risk Oversight
Our board of directors consists of six members, two of whom qualify as “independent” according to the NYSE Listed Company Manual. Our directors hold office until their successors have been elected and qualified or until the earlier of their resignation or removal.
Our certificate of incorporation and bylaws provide that our board of directors is divided into three classes whose members serve three-year terms expiring in successive years. The terms of office of members of our board of directors are divided into three classes:
| • | Class I directors, whose term will expire at the annual meeting of the stockholders to be held in 2014; |
| • | Class II directors, whose term will expire at the annual meeting of the stockholders to be held in 2015; and |
| • | Class III directors, whose term will expire at the annual meeting of the stockholders to be held in 2016. |
Our Class I directors are Messrs. Minicucci and Mulvee, our Class II directors are Messrs. Levenson and Peters and our Class III directors are Messrs. Richison and Swani. At each annual meeting of stockholders, the successors to the directors whose terms will then expire will be elected to serve from the time of election and qualification until the third annual meeting following such election. Any vacancies in our classified board of directors will be filled by the remaining directors and the elected person will serve the remainder of the term of the class to which he or she is appointed. Any additional directorships resulting from an increase in the number of directors will be distributed among the three classes so that, as nearly as possible, each class will consist of one-third of the directors.
In connection with the Reorganization, we and the Stockholders Agreement Parties entered into the Stockholders Agreement. Among other things, the Stockholders Agreement provides that upon the completion of this offering and for so long as the parties thereto continue to collectively hold 40% of our issued and outstanding shares of common stock, each party will vote and take all other necessary and desirable action within such party’s control to (i) cause the authorized number of directors of our board of directors to be established at seven and (ii) elect to our board of directors:
| • | three representatives designated by the holders of a majority of the shares of common stock held by WCAS X and any of its affiliates to which shares of common stock are transferred pursuant to the Stockholders Agreement; |
| • | one representative designated by the holders of a majority of the shares of common stock held by WCAS Capital IV and any of its affiliates to which shares of common stock are transferred pursuant to the Stockholders Agreement; and |
| • | subject to certain conditions, one representative designated by the holders of a majority of the shares of common stock held by Chad Richison, Shannon Rowe, William Kerber, Jeffrey York, Robert J. Levenson and the Estate of Richard Aiello and any of their affiliates, or the Minority Holders, who shall be Chad Richison for so long as he is employed by us. |
82
Table of Contents
As such, Welsh, Carson, Anderson & Stowe and its affiliates have effectively designated four representatives to our initial board of directors. Messrs. Levenson, Swani and Minicucci were designated by WCAS X. Mr. Mulvee was designated by WCAS Capital IV.
Our board of directors is responsible for, among other things, overseeing the conduct of our business; reviewing and, where appropriate, approving our long-term strategic, financial and organizational goals and plans; and reviewing the performance of our chief executive officer and other members of senior management. Our board of directors, as a whole and, following the completion of this offering, through its committees, has responsibility for the oversight of risk management. Our senior management is responsible for assessing and managing our risks on a day-to-day basis. Our audit committee will discuss with management our policies with respect to risk assessment and risk management and our significant financial risk exposures and the actions management has taken to limit, monitor or control such exposures, and our compensation committee will oversee risk related to compensation policies. Both our audit and compensation committees will report to the full board of directors with respect to these matters, among others.
Because the Stockholders Agreement Parties hold more than 50% of the voting power for the election of our directors, we have elected to be a “controlled company” under the NYSE Listed Company Manual. As a controlled company, exemptions under the NYSE Listed Company Manual exempt us from compliance with certain corporate governance requirements, including the requirements:
| • | that a majority of our board of directors consists of “independent directors,” as defined under the NYSE Listed Company Manual; |
| • | that any compensation committee or nominating and corporate governance committee be composed entirely of independent directors with a written charter addressing the committee’s purpose and responsibilities; and |
| • | that any compensation committee or nominating and corporate governance committee have an annual performance evaluation. |
These exemptions do not modify the independence requirements for our audit committee, and we intend to comply with the requirements of Rule 10A-3 of the Exchange Act and the NYSE Listed Company Manual within the applicable time frame.
Committees
Our board of directors will establish the following committees prior to the completion of this offering: an audit committee, a compensation committee and a nominating and corporate governance committee. Each committee will have the composition and primary responsibilities described below. Members serve on these committees until their resignation or until otherwise determined by our board of directors.
Audit Committee
Our audit committee oversees the accounting and financial reporting processes of the Company and the audit of the Company’s financial statements. In that regard, our audit committee assists board oversight of: (i) the integrity of the Company’s financial statements, (ii) the Company’s compliance with legal and regulatory requirements, (iii) the independent auditor’s qualifications and independence, and (iv) the performance of the Company’s internal audit function and independent auditors. Among other matters, the audit committee is responsible for the retention of our independent auditors; evaluating the qualifications, performance and independence of our independent auditors; reviewing the Company’s annual and interim financial statements and discussing press releases, financial information and earnings guidance provided to analysts and rating agencies; discussing policies with respect to risk assessment and risk management; overseeing the Company’s internal audit function; reviewing and ensuring the adequacy of the Company’s internal control systems; reviewing and approving related party transactions; and annually reviewing the audit committee charter and the committee’s performance.
83
Table of Contents
The current members of our audit committee are Messrs. Levenson, Minicucci and Peters with Mr. Peters serving as the chairman of the committee. All members of our audit committee meet the requirements for financial literacy under the NYSE Listed Company Manual and applicable SEC rules and regulations. Our board of directors has determined that Mr. Peters is an audit committee financial expert as defined under the applicable rules of the SEC, has the requisite financial management expertise as defined under the NYSE Listed Company Manual, Messrs. Levenson and Peters are also considered independent under applicable SEC rules and regulations and the NYSE Listed Company Manual. We expect to satisfy the independence requirements for the audit committee prior to the end of the transition period provided under applicable SEC rules and regulations and the NYSE Listed Company Manual for companies completing their initial public offering. The audit committee operates under a written charter that satisfies the applicable SEC rules and regulations and the NYSE Listed Company Manual.
Compensation Committee
Our compensation committee reviews and approves, or recommends that our board of directors approves, the compensation of our executive officers. Among other matters, the compensation committee reviews and approves corporate goals and objectives relevant to the compensation of our chief executive officer and other executive officers, evaluates the performance of these officers in light of those goals and objectives, and approves all stock option grants and other equity-related awards to our executive officers. The compensation committee also annually reviews the compensation committee charter and the committee’s performance.
The current members of our compensation committee are Messrs. Minicucci and Swani, with Mr. Minicucci serving as the chairman of the committee. None of the members of our compensation committee are independent under the applicable SEC rules and regulations and the NYSE Listed Company Manual and meet the definition of outside directors under Section 162(m) of the Internal Revenue Code of 1986, as amended, or the Code.
Nominating and Corporate Governance Committee
Our nominating and corporate governance committee is responsible for identifying and recommending candidates for membership on our board of directors, including nominees recommended by stockholders, reviewing and recommending the composition of our committees, overseeing our code of business conduct and ethics, corporate governance guidelines and reporting and making recommendations to our board of directors concerning governance matters. The nominating and corporate governance committee also annually reviews the nominating and corporate governance committee charter and the committee’s performance. The current members of the nominating and corporate governance committee are Messrs. Minicucci and Swani, with Mr. Swani serving as chairman of the committee. None of the members of our nominating and corporate governance committee are independent under the NYSE Listed Company Manual and applicable SEC rules and regulations.
Compensation Committee Interlocks and Insider Participation
None of the members of our compensation committee is or has at any time during the past year been an officer or employee of ours. None of our executive officers currently serves or in the past year has served as a member of the board of directors or compensation or similar committee of any entity that has one or more executive officers serving on our board of directors or compensation committee.
Code of Business Conduct and Ethics
We have adopted a code of business conduct and ethics that applies to all of our employees, officers and directors, including our chief executive officer, chief financial officer and other principal executive and senior officers responsible for financial reporting. The code of business conduct and ethics will be available on our website at www.investors.paycom.com. Our code of business conduct and ethics is a “code of ethics,” as defined in Item 406(b) of Regulation S-K. The information contained on, or accessible from, our website is not part of this prospectus by reference or otherwise. We will make any legally required disclosures regarding amendments to, or waivers of, provisions of our code of ethics on our website.
84
Table of Contents
Director Compensation
Upon completion of this offering, non-employee directors will receive annual fees for their service in the amount of $75,000 per year, payable two-thirds in shares of common stock and one-third in cash. The chairman of our board of directors receives an additional annual cash fee of $25,000. Audit committee members (other than the chairman) receive an additional annual cash fee $5,000 and the chairman of the audit committee receives an additional annual cash fee of $10,000. All directors are entitled to reimbursement for their reasonable out-of-pocket expenditures incurred in connection with their board or committee service.
Our directors received no compensation for their service as directors during the fiscal year ended December 31, 2013. The following table sets forth the number of equity incentive unit and option awards held by our non-employee directors that owned any such awards at December 31, 2013:
| Name | Units Outstanding Subject to Unit Awards (#) |
Shares Outstanding Subject to Option Awards (#) |
||||||
| Richard Aiello(1) |
70 | — | ||||||
| Robert J. Levenson |
200 | — | ||||||
| (1) | Mr. Aiello ceased to serve as a member of our board of directors on February 28, 2014. |
| (2) | In connection with the Reorganization, outstanding equity incentive units held by Messrs. Aiello and Levenson were converted into 220,060 and 628,745 shares of restricted stock, respectively. |
85
Table of Contents
Overview of Executive Compensation
Our compensation committee makes the compensation decisions regarding our executive officers, including (i) Chad Richison, our chief executive officer, (ii) Craig E. Boelte, our chief financial officer, (iii) Jeffrey D. York, our chief sales officer and (iv) William X. Kerber III, our chief information officer, or collectively, the named executive officers.
We evaluate each executive officer’s performance for the prior year on an annual basis. Our chief executive officer, Mr. Richison, with respect to each executive officer other than himself, prepares a written evaluation of the executive officers with input from others within our company. The written evaluation focuses on the achievement of stated corporate and individual and performance criteria and the amount of contributions made to management and the leadership of our company. This process leads to a recommendation from the chief executive officer to the compensation committee with respect to each executive officer’s salary level, cash bonus, and whether or not equity incentive awards should be granted. The compensation committee (other than the chief executive officer) determines the salary level, cash bonus, and whether or not equity incentive awards should be granted to our chief executive officer.
Summary Compensation Table For Fiscal Years Ended December 31, 2013 and 2012
The following table contains information regarding compensation that was paid to our named executive officers for the fiscal years ended December 31, 2013 and 2012.
| Name and Principal Position |
Year | Salary ($) |
Bonus ($) |
Unit Awards ($)(2) |
Non-Equity Incentive Plan Compensation ($)(3) |
All Other Compensation ($)(4) |
Total ($) |
|||||||||||||||||||||
| Chad Richison(1) |
2013 | 534,788 | — | 49,594 | 682,961 | 47,723 | (5) | 1,315,066 | ||||||||||||||||||||
| Director, President and Chief Executive Officer | 2012 | 495,051 | 17,000 | 1,040,179 | 516,921 | 47,592 | (5) | 2,116,743 | ||||||||||||||||||||
| Craig E. Boelte |
2013 | 280,954 | — | 49,380 | 358,798 | 12,575 | 701,707 | |||||||||||||||||||||
| Chief Financial Officer | 2012 | 260,020 | — | 89,972 | 203,623 | 12,575 | 566,190 | |||||||||||||||||||||
| Jeffrey D. York |
2013 | 343,363 | — | 42,390 | 315,710 | 12,925 | 714,388 | |||||||||||||||||||||
| Chief Sales Officer | 2012 | 330,028 | — | 89,972 | 258,268 | 10,601 | 688,869 | |||||||||||||||||||||
| William X. Kerber III |
2013 | 280,963 | — | 49,380 | 269,107 | 12,575 | 612,025 | |||||||||||||||||||||
| Chief Information Officer | 2012 | 260,028 | — | 89,972 | 203,623 | 12,575 | 566,198 | |||||||||||||||||||||
| (1) | All amounts shown reflect compensation paid to Mr. Richison for his service as president and chief executive officer. Mr. Richison has elected not to receive additional compensation for his service as a director. |
| (2) | Amounts shown do not reflect compensation actually received by the named executive officers. Rather, the amounts represent the aggregate grant date fair value of incentive units granted to each named executive officer in 2013 and 2012 computed in accordance with Accounting Standards Codification, or ASC, 718, Compensation—Stock Compensation, with the exception that the amount shown assumes no forfeitures. A discussion of the assumptions used in the calculation of these amounts are included in Note 9. “Members’ Equity and Incentive Compensation” in Holding’s annual consolidated financial statements included in this prospectus. |
| (3) | Amounts shown in this column represent the cash payment made to the named executive officer as performance-based cash bonuses. See “—Narrative Discussion Regarding Summary Compensation Table—Performance-Based Cash Bonuses” for more details. |
| (4) | Amounts shown consist of insurance premiums paid by the Company, a monthly retainer for a supplemental medical plan and Company contributions to a 401(k) profit sharing plan for the benefit of the named executive officer. The amounts shown in this column also reflect the aggregate incremental cost of personal use of |
86
Table of Contents
| corporate aircraft by the named executive officer. Spouses and invited guests of executives occasionally fly on the corporate aircraft as additional passengers on business flights. In those cases, the aggregate incremental cost to us is a de minimis amount, and as a result, no amount is reflected in the table. |
| (5) | In addition to the items listed in Note (4) above, the amounts shown also include country club dues and expenses and approximately $23,411 of lease payments for an automobile in each of 2013 and 2012. |
Narrative Discussion Regarding Summary Compensation Table
Executive Compensation Program Overview
The primary elements of our executive compensation program include:
| • | base salary; |
| • | cash bonuses; |
| • | equity incentive units; |
| • | performance-based cash bonuses; |
| • | retirement and other benefits; and |
| • | perquisites and personal benefits. |
Our compensation committee, after reviewing compensation information it considers relevant, has determined what it believes to be the appropriate level and mix of the various compensation components for our named executive officers. Ultimately, the objective in allocating between long-term and short-term compensation is to ensure adequate base compensation to attract and retain personnel, while providing incentives to maximize long-term value for our company and our stockholders.
Base Salary
We provide base salaries to our named executive officers to compensate them for services rendered during the fiscal year and to recognize their experience, skills, knowledge and responsibilities. Each of our named executive officers is currently party to an employment agreement. No formulaic base salary increases are provided to our named executive officers pursuant to the terms of their employment agreements. However, on an annual basis, our compensation committee reviews and evaluates, with input from our chief executive officer, the need for adjustment of the base salaries of our named executive officers. For additional information concerning the employment agreements, see “Compensation Arrangements Adopted in Connection with this Offering—Employment Agreements.”
For 2012, Mr. Richison received an annual base salary of $495,051, Mr. York received an annual base salary of $330,028 and Mr. Boelte and Mr. Kerber received an annual base salary of $260,020 and $260,028, respectively. For 2013, Mr. Richison received an annual base salary of $534,788, Mr. York received an annual base salary of $343,363, and Mr. Boelte and Mr. Kerber received an annual base salary of $280,954 and $280,963, respectively. For 2014, Mr. Richison receives an annual base salary of $555,197, Mr. York receives an annual base salary of $356,400, and Mr. Boelte and Mr. Kerber each receive an annual base salary of $291,600.
Cash Bonuses
We generally only award performance-based cash bonuses to our named executive officers. However, in 2012 we awarded cash bonuses on a discretionary basis to our executive officers, including our named executive officers. For the named executive officers other than the Company’s chief executive officer, the compensation committee, in consultation with the Company’s chief executive officer, recommended cash bonuses for the board’s approval. The compensation committee reviewed the performance of the Company’s chief executive officer and recommended the bonus for the Company’s chief executive officer to the board of directors. For 2012, the compensation committee awarded Mr. Richison a cash bonus in an amount equal to $17,000 or 3% of his base salary. None of the other named executive officers received a cash bonus for 2012. For 2013, the compensation committee did not award cash bonuses to any of our named executive officers.
87
Table of Contents
Equity Incentive Units and Restricted Stock Awards
Our award of equity incentive units is the primary vehicle for offering long-term incentives to our executive officers, including our named executive officers. While we do not have any equity ownership guidelines for our named executive officers, we believe that equity incentive unit grants and restricted stock awards provide our named executive officers with a strong link to our long-term performance, create an incentive to achieve long-range performance goals and objectives and help to align the interests of our named executive officers and our stockholders. In 2012 and 2013, we issued equity incentive units to each of our named executive officers.
Material Terms of Equity Incentive Unit Grants
We have historically granted awards of equity incentive units to our named executive officers with a portion of the units being subject to time-based vesting conditions and another portion being subject to performance-based vesting conditions. Prior to the vesting of equity incentive units, the holder has no rights as a stockholder with respect to the shares subject to such unit, including voting rights or the right to receive dividends, dividend equivalents or distributions.
The following table sets forth the number of equity incentive units granted to our named executive officers during the fiscal year ended December 31, 2012, each of which were granted on April 3, 2012:
| Name |
Number of Management Incentive Units |
Number of CEO Incentive Units |
||||||
| Chad Richison |
9,359 | 126,067 | ||||||
| Craig E. Boelte |
8,062 | — | ||||||
| Jeffrey D. York |
8,062 | — | ||||||
| William X. Kerber III |
8,062 | — | ||||||
The following table sets forth the number of equity incentive units granted to our named executive officers during the fiscal year ended December 31, 2013, each of which were granted on October 14, 2013 (except for the units granted to Mr. York, which were granted on April 17, 2013):
| Name |
Management Incentive Units |
CEO Incentive Units |
||||||
| Chad Richison |
3,013 | — | ||||||
| Craig E. Boelte |
3,000 | — | ||||||
| Jeffrey D. York |
3,000 | — | ||||||
| William X. Kerber III |
3,000 | — | ||||||
During 2012 and 2013, we granted management equity incentive units to each of our named executive officers and we granted CEO Incentive Units only to our chief executive officer only during 2012. 50% of the equity incentive units awarded to each of our named executive officers are subject to time-based vesting conditions and 50% of the units are subject to performance-based vesting conditions. The equity incentive units that are subject to time-based vesting conditions vest 20% on each of the first five anniversaries of the date of grant or upon the earlier sale of the Company. A sale of the Company includes (i) a transaction or series of transactions (including by way of merger, consolidation, or sale of equity) the result of which is that the holders of units of the Company immediately prior to such transaction, do not, after giving effect to such transaction, own, directly or indirectly, through one or more intermediaries, at least 50% of the units of the Company, or (ii) a sale, transfer, conveyance or other disposition, in one or a series of related transactions, of all or substantially all of the Company’s assets determined on a consolidated basis to a person that is not affiliated with WCAS Holdings.
88
Table of Contents
The equity incentive units that are subject to performance-based vesting conditions vest when the amount of cash, including cash dividends, distributions and proceeds, but excluding management fees, transaction-related fees and expense reimbursements with respect to, or in exchange for equity securities, or collectively, the Inflows, received by WCAS Holdings exceeds $280.4 million, as adjusted for payments made by WCAS Holdings with respect to or in exchange for securities after April 3, 2012 through the determination date, or the Outflows as follows. The equity incentive units vest 33% on the date for which the Inflows equal at least 2.0 times the Outflows and 100% on the date for which the Inflows equal at least 3.5 times the Outflows; provided the named executive officer is employed by us on such date. For any date on which the Inflows equal more than 2.0 times and less than 3.5 times the Outflows, the number of equity incentive units that are vested will be determined by straight-line interpolation.
25% of the CEO Incentive Units are subject to time-based vesting conditions and 75% of the units are subject to performance-based vesting conditions. The CEO Incentive Units that are subject to time-based vesting conditions vest 20% on each of the first five anniversaries of the date of grant or upon the earlier sale of the Company. The CEO Incentive Units that are subject to performance-based vesting conditions vest when the amount of the Inflows received by WCAS Holdings exceeds $386.3 million, as adjusted for payments made by WCAS Holdings with respect to or in exchange for securities after April 3, 2012 through the determination date, or the CEO Award Outflows. The CEO Incentive Units vest 33% on the date for which the Inflows equal at least 1.5 times the Outflows and 100% on the date on which either the Inflows equal at least (i) 2.0 times the CEO Award Outflows for a date on or prior to the second anniversary of the grant date or (ii) 2.5 times the CEO Award Outflows for a date following the second anniversary of the grant date; provided the chief executive officer continues to remain employed by us on such date. For any date on which the Inflows equal more than (i) 1.5 times and less than 2.0 times the CEO Award Outflows on or prior to the second anniversary of the grant date or (ii) 1.5 times and less than 2.5 times the CEO Award Outflows following the second anniversary of the grant date, the number of CEO Incentive Units that are vested will be determined by straight-line interpolation.
Material Terms of Restricted Stock Awards
Effective January 1, 2014, our outstanding equity incentive units were converted into shares of common and restricted stock as described in “The Reorganization.” The portion of the outstanding equity incentive units that had previously vested were converted into shares of common stock and the remaining portion of unvested outstanding equity incentive units were converted into shares of restricted stock. As a result, we granted shares of common stock and restricted stock to our named executive officers in connection with the Reorganization. A portion of the shares of restricted stock is subject to time-based vesting conditions and another portion is subject to performance-based vesting conditions. Prior to the vesting of restricted stock, the holder has certain rights as a stockholder with respect to the shares of restricted stock, including voting rights and the right to receive dividends, dividend equivalents or distributions; provided that the holder does not have the right to cash dividends and stock dividends are subject to the same restrictions as the restricted stock and shall vest as the restricted shares vest.
The following table sets forth the number of shares of our common and restricted stock that were granted to our named executive officers in connection with the Reorganization to replace the management incentive units and CEO Incentive Units which were granted to our named executive officers on April 3, 2012:
| Management Incentive Units |
CEO Incentive Units | |||||||||||||||
| Name |
Number of Shares of Common Stock |
Number of Shares of Restricted Stock |
Number of Shares of Common Stock |
Number of Shares of Restricted Stock |
||||||||||||
| Chad Richison |
39,701 | 357,309 | 254,987 | 4,844,765 | ||||||||||||
| Craig E. Boelte |
34,199 | 307,792 | — | — | ||||||||||||
| Jeffrey D. York |
34,199 | 307,792 | — | — | ||||||||||||
| William X. Kerber III |
34,199 | 307,792 | — | — | ||||||||||||
89
Table of Contents
The following table sets forth the number of shares of our common and restricted stock that were granted to our named executive officers in connection with the Reorganization to replace the management incentive units that were granted to our named executive officers on October 14, 2013 (except for the units granted to Mr. York, which were granted on April 17, 2013):
| Name |
Number of Shares of Common Stock |
Number of Shares of Restricted Stock |
||||||
| Chad Richison |
— | 121,833 | ||||||
| Craig E. Boelte |
— | 121,307 | ||||||
| Jeffrey D. York |
— | 127,192 | ||||||
| William X. Kerber III |
— | 121,307 | ||||||
With the exception of the shares of restricted stock granted to our chief executive officer, approximately 50% of the shares awarded to each of our named executive officers are subject to time-based vesting conditions and approximately 50% of the shares are subject to performance-based vesting conditions. The shares of restricted stock that are subject to time-based vesting conditions either vest: (i) 25% on each of the first four anniversaries of the date of grant of the management incentive units (for the shares of restricted stock granted to replace the equity incentive units awarded on April 3, 2012), provided that the person is employed by us on that date, (ii) 20% on each of the first five anniversaries of the date of grant of the management incentive units (for the shares of restricted stock granted to replace the equity incentive units awarded on October 14, 2013 or April 17, 2013), provided that the person is employed by us on that date, or (iii) upon a change in control. For purposes of our restricted stock award agreements, a “change in control” means: (i) a transaction or series of transactions in which any person becomes the beneficial owner of securities representing 30% or more of the combined voting power of our outstanding securities or 30% or more of our outstanding shares of our common stock, (ii) any merger or consolidation, or series of related transactions, which results in our voting securities outstanding immediately prior thereto failing to continue to represent at least 50% of the voting power of our voting securities, (iii) the sale or disposition of all or substantially all of our assets (or consummation of any transaction, or series of related transactions having a similar effect), (iv) during any consecutive twelve month period, the individuals who on the date of the award constitute the board of directors cease for any reason to constitute a majority of our board of directors, subject to certain exceptions, (v) our dissolution or liquidation or (vi) any transaction or series of related transactions having the substantial effect of any one or more of the foregoing. In the event of a change in control, all unvested shares of restricted stock not assumed by the surviving entity shall become fully vested immediately prior to the effective date of a change of control.
Shares of restricted stock subject to performance-based vesting conditions vest one-half upon the Company reaching a total enterprise value of $1.4 billion and one-half upon the Company reaching a total enterprise value of $1.8 billion, provided that the person is employed by us on that date. For purposes of our restricted stock award agreements, “total enterprise value” is defined as the sum of: (i) the product of (A) the volume weighted average price of a share of common stock not subject to vesting or other restrictions multiplied by (B) the number of outstanding shares of common stock, (ii) for each other class or series of equity securities of the Company, if any, the product of (A) the volume weighted average price per share for such class or series of such equity securities of the Company multiplied by (B) the number of shares of such class or series of such equity securities of the Company, and (iii) the principal amount of our outstanding funded indebtedness less the aggregate amount of cash and cash equivalents of the Company (exclusive of funds held on behalf of clients). The Company’s total enterprise value includes outstanding shares of restricted stock and calculates the value of such shares as if there were no vesting or other restrictions.
Upon completion of this offering, all unvested shares of restricted stock will become fully vested in the event of the named executive officer’s death while performing his duties and responsibilities for the Company. In the event of a termination of service of the named executive officer due to disability, by the named executive officer for good reason (as defined above), by the Company without cause (as defined in the employment agreement), or death (other than while performing his duties and responsibilities for the Company), the Board
90
Table of Contents
may, in its sole discretion, accelerate vesting of all or any portion of the unvested shares of restricted stock. Further, if the chief executive officer’s employment is terminated by the Company without cause (as defined in the employment agreement), all unvested shares of restricted stock subject to time-based vesting conditions will remain outstanding and eligible for vesting for one year following such termination of employment, and the board of directors may accelerate the vesting of the other remaining unvested shares of restricted stock, in its discretion. Other than as provided above, all unvested shares of restricted stock shall be forfeited upon the named executive officer’s termination of service or upon engaging in certain forfeiture activities involving violations of noncompetition, noninterference, non-solicitation provisions of his employment agreement.
Performance-Based Cash Bonuses
We award annual performance-based cash bonuses to certain members of our management, including our named executive officers, to emphasize pay-for-performance and to reward them for the achievement of specified corporate performance criteria. Each named executive officer is eligible to receive an annual performance-based cash bonus, which we refer to as an annual cash bonus, in an amount up to a fixed percentage of his base salary, or bonus percentage. Under the employment agreements, our named executive officers are eligible to receive a performance-based cash bonus equal to either 100% of their base salary (for Messrs. Richison and Boelte) or 75% of their base salary (for Messrs. York and Kerber).
Each of our compensation committee and our board of directors has authority, in its sole discretion, to adjust the bonus percentage and performance criteria each year in connection with its review of the executive’s performance and has authority to allow an executive to receive a bonus payment in excess of his or her annual cash bonus for exceptional performance. Further, our board of directors reviews the assessment of each executive’s performance conducted by the compensation committee with respect to the annual cash bonus and retains the authority, in its sole discretion, to modify the amount of the annual cash bonus above or below the amount recommended by the compensation committee.
Target Bonuses
For 2012, our chief executive officer was eligible for a bonus payout of up to 100% of his base salary, our chief financial officer, chief sales officer and chief information officer were each eligible for a bonus payout of up to 75% of their respective base salaries. For 2013, our chief executive officer and chief financial officer were each eligible for a bonus payout of up to 100% of their respective base salaries, our chief sales officer and chief information officer were each eligible for a bonus payout of up to 75% of their respective base salaries and other members of management were eligible for a bonus payout of between 25% and 50% of their respective base salaries, each as adjusted by the compensation committee based on achievement of our corporate performance criteria, in the event of exceptional individual or functional performance. The following table shows the 2012 and 2013 target bonus amounts as a percentage of base salary for each of our named executive officers.
| Name |
2012 Target Bonus Amount (as a percentage of base salary) |
2013 Target Bonus Amount (as a percentage of base salary) |
||||||
| Chad Richison |
100 | % | 100 | % | ||||
| Craig E. Boelte |
75 | % | 100 | % | ||||
| Jeffrey D. York |
75 | % | 75 | % | ||||
| William X. Kerber III |
75 | % | 75 | % | ||||
Corporate Performance Criteria
The corporate performance criteria that was used in determining the amount of performance bonuses for our named executive officers for 2012 and 2013 was GAAP revenue budget growth, with the exception of Mr. York,
91
Table of Contents
whose corporate performance criteria was booked sales budget. For 2012 and 2013, the performance target for GAAP revenue budget growth was 31.4% and 31.4%, respectively, and the performance target for booked sales budget was $28.7 million and $37.2 million, respectively.
Our named executive officers are not awarded performance-based cash bonuses if less than 80% of the performance target is achieved. Our named executive officers are awarded performance-based cash bonuses equal to the amount of the performance target achievement when 80% or more of the performance target is achieved. For example, if 110% of the performance target is achieved, the named executive officer receives 110% of the cash bonus target.
Actual Bonuses
For 2012, the compensation committee determined that the actual performance achieved for GAAP revenue budget growth was 34.1% and for booked sales budget was $30.0 million. Based on these results, the compensation committee determined that the amount of the performance target achievement for the GAAP revenue budget growth was 108.6% and for booked sales budget was 104.4%. The actual bonuses paid by the compensation committee for 2012 were as follows.
| Name |
Target 2012 Bonuses |
Actual 2012 Bonuses |
||||||
| Chad Richison |
$ | 475,992 | $ | 516,921 | ||||
| Craig E. Boelte |
$ | 187,500 | $ | 203,623 | ||||
| Jeffrey D. York |
$ | 247,500 | $ | 258,268 | ||||
| William X. Kerber III |
$ | 187,500 | $ | 203,623 | ||||
For 2013, the compensation committee determined that the actual performance achieved for GAAP revenue budget growth was 40.1% and for booked sales budget was $45.6 million. Based on these results, the compensation committee determined that the amount of the performance target achievement for the GAAP revenue budget growth was 127.7% and for booked sales budget was 122.6%. The actual bonuses paid by the compensation committee for 2013 were as follows.
| Name |
Target 2013 Bonuses |
Actual 2013 Bonuses |
||||||
| Chad Richison |
$ | 534,788 | $ | 682,961 | ||||
| Craig E. Boelte |
$ | 280,954 | $ | 358,798 | ||||
| Jeffrey D. York |
$ | 257,522 | $ | 315,710 | ||||
| William X. Kerber III |
$ | 210,722 | $ | 269,107 | ||||
Retirement and Other Benefits
We believe that establishing competitive benefit packages for our employees is an important factor in attracting and retaining highly qualified personnel. We maintain broad-based benefits that are provided to all employees, including medical, dental, group life insurance, accidental death and dismemberment insurance, long and short term disability insurance, and a 401(k) plan. Our named executive officers are eligible to participate in all of our employee benefit plans, in each case on the same basis as other employees. The compensation committee in its discretion may revise, amend or add to the named executive officer’s benefits and perquisites if it deems it advisable.
401(k) Plan
We maintain a 401(k) profit sharing plan for our employees. Our 401(k) plan is intended to qualify as a tax-qualified plan under Section 401 of the Code so that contributions to our 401(k) plan, and income earned on such contributions, are not taxable to participants until withdrawn or distributed from the 401(k) plan. Our 401(k) plan provides that each participant may contribute up to 100% of his or her pre-tax compensation, up to a statutory limit, which was $17,000 for 2012 and $17,500 for 2013. Participants who are at least 50 years old can also make
92
Table of Contents
“catch-up” contributions, which in 2012 and 2013 was limited to an additional $5,500 above the statutory limit. Under our 401(k) plan, each employee is fully vested in his or her deferred salary contributions. Employee contributions are held and invested by the plan’s trustee, subject to participants’ ability to give investment directions by following certain procedures. Our 401(k) plan also permits us to make discretionary contributions and matching contributions, subject to established limits and a vesting schedule.
We do not maintain any defined benefit pension plans or any nonqualified deferred compensation plans.
Perquisites and Other Personal Benefits
We provided our named executive officers with perquisites and other personal benefits in 2012 and 2013 that the compensation committee believed were reasonable and consistent with our overall compensation program. The perquisites and personal benefits that we provide to our named executive officers include matching 401(k) contributions, a supplemental medical plan that provides for visits and benefits with a private physician, key man insurance premium payments, country club dues and car lease payments. On limited occasions, we also allow named executive officers that are authorized to use chartered aircraft for business travel to, if space allows, bring family members or guests along on the trip. Because we reimburse for use of the aircraft only for business travel and we pay for the aircraft based on the flight hours regardless of the passenger load, the aggregate incremental cost to us for the additional passengers is a de minimis amount. The compensation committee periodically reviews the levels of perquisites and other personal benefits provided to our named executive officers.
Attributed costs, if any, of the personal benefits described above for the named executive officers for the years ended December 31, 2012 and 2013 are included in the summary compensation table under the heading “All Other Compensation.”
2013 Fiscal Year Outstanding Equity Awards At Fiscal Year-End Table
The following table lists all of the outstanding stock awards held on December 31, 2013 by each of the Company’s named executive officers. The table also includes the value of the stock awards based on the estimated fair market value of our equity incentive units as of December 31, 2013:
| Name |
Grant Date | Stock Awards | ||||||||||
| Number of Units of Stock That Have Not Vested(1)(2) |
Market Value of Units of Stock That Have Not Vested ($)(3) |
|||||||||||
| Chad Richison |
10/14/2013 | 3,013 | $ | 49,594 | ||||||||
| 4/30/2012 | 8,423 | $ | 231,879 | |||||||||
| 4/30/2012 | 119,764 | $ | 2,127,696 | |||||||||
| Craig E. Boelte |
10/14/2013 | 3,000 | $ | 49,380 | ||||||||
| 4/30/2012 | 7,256 | $ | 199,744 | |||||||||
| Jeffrey D. York |
4/17/2013 | 3,000 | $ | 42,390 | ||||||||
| 4/30/2012 | 7,256 | $ | 199,744 | |||||||||
| William X. Kerber III |
10/14/2013 | 3,000 | $ | 49,380 | ||||||||
| 4/30/2012 | 7,256 | $ | 199,744 | |||||||||
| (1) | Equity incentive units vested in accordance with the terms described above and were rounded to the nearest whole unit. See “—Narrative Discussion Regarding Summary Compensation Table—Equity Incentive Units—Material Terms of Equity Incentive Units and Restricted Stock Awards” for more details. |
93
Table of Contents
| (2) | In connection with the Reorganization, outstanding equity incentive units were converted into the corresponding number of shares of common stock or restricted stock set forth below for each of our named executive officers: |
| Name |
Grant Date | Number of Shares of Common Stock |
Number of Shares of Restricted Stock |
|||||||||
| Chad Richison |
10/14/2013 | — | 121,833 | |||||||||
| 4/30/2012 | 39,701 | 357,309 | ||||||||||
| 4/30/2012 | 254,987 | 4,844,675 | ||||||||||
| Craig E. Boelte |
10/14/2013 | — | 121,307 | |||||||||
| 4/30/2012 | 34,199 | 307,792 | ||||||||||
| Jeffrey D. York |
4/17/2013 | — | 127,192 | |||||||||
| 4/30/2012 | 34,199 | 307,792 | ||||||||||
| William X. Kerber III |
10/14/2013 | — | 121,307 | |||||||||
| 4/30/2012 | 34,199 | 307,792 | ||||||||||
See “Executive Compensation—Narrative Discussion Regarding Summary Compensation Table—Equity Incentive Units and Restricted Stock Awards” for more details.
| (3) | The market value of our equity incentive units that have not vested is based on the estimated fair market value of our equity incentive units as of December 31, 2013, which was as follows: |
| Management Time Vesting |
$ | 37.39 | ||
| Management Performance Vesting |
$ | 19.64 | ||
| CEO Time Vesting |
$ | 23.75 | ||
| CEO Performance Vesting |
$ | 16.17 |
Compensation Arrangements Adopted in Connection with this Offering
Long-Term Incentive Plan
We adopted the 2014 Plan, effective January 1, 2014, which permits us to grant an array of equity-based incentive awards to our named executive officers and other key employees, key contractors and outside directors of the Company. The following is a summary of the material terms of the 2014 Plan.
Purpose. The purpose of the 2014 Plan is to:
| • | increase the interests of recipients of awards under the 2014 Plan in the Company’s welfare; |
| • | advance the Company’s interests by attracting and retaining qualified employees, outside directors and other persons providing services to the Company and/or its related companies; and |
| • | provide a means through which the Company may attract able persons as employees, contractors and outside directors. |
Administration. The 2014 Plan generally will be administered by the compensation committee of the board of directors. The compensation committee shall determine the recipients of awards, the types of awards to be granted and the applicable terms, provisions, limitations and performance requirements of such awards. The compensation committee will also have the authority to conclusively interpret the 2014 Plan and any award agreements under the plan. The compensation committee may delegate certain duties to one or more officers of the Company as provided in the 2014 Plan.
Types of Awards. The 2014 Plan will provide for grants of incentive stock options, or ISOs, nonqualified stock options, or NQSOs, stock appreciation rights, or SARs, restricted stock, restricted stock units, or RSUs, performance awards, dividend equivalent rights, and other awards.
94
Table of Contents
| • | Stock Options. A stock option is a contractual right to purchase shares at a future date at a specified exercise price. The per share exercise price of a stock option will be determined by our compensation committee and many not be less than the fair market value of a share of our common stock on the grant date (or higher for certain employees receiving ISOs). The compensation committee will determine the date after which each stock option may be exercised and the expiration date of each option, which may not exceed ten years from the grant date. The compensation committee may grant either ISOs qualifying under Section 422 of the Code or NQSOs, provided that only employees of the Company and its subsidiaries (excluding subsidiaries that are not corporations) are eligible to receive ISOs. |
| • | SARs. SARs represent a contractual right to receive, in cash or shares, an amount equal to the appreciation of one share of our common stock from the grant date. The grant price of a SAR cannot be less than the fair market value of a share of our common stock on the grant date. The compensation committee will determine the date after which each SAR may be exercised and the expiration date of each SAR, which may not exceed ten years from the grant date. |
| • | Restricted Stock. Restricted stock is an award of shares of our common stock that are subject to restrictions on transfer and a substantial risk of forfeiture because of termination of service or failure to achieve certain performance conditions. Shares of restricted stock may be subject to restrictions which do not permit the holder to sell, transfer, pledge or assign his shares. The compensation committee will determine the vesting and forfeiture conditions for each grant of restricted stock. |
| • | RSUs. RSUs represent a contractual right to receive the value of a share of our common stock at a future date, subject to specified vesting and other restrictions determined by the compensation committee. The compensation committee will determine the vesting conditions, payment dates, and forfeiture conditions for each grant of RSUs. |
| • | Performance Awards. Performance awards, which may be denominated in cash or shares, will be earned on the satisfaction of performance conditions specified by our compensation committee at the end of a specified performance period. The compensation committee will determine the length of the performance period, the maximum payment value of an award, and the minimum performance goals required before payment will be made, so long as such provisions are not inconsistent with the terms of the 2014 Plan, and to the extent an award is subject to Section 409A of the Code, are in compliance with the applicable requirements of Section 409A of the Code and any applicable regulations or guidance. To the extent the Company determines that Section 162(m) of the Code shall apply to a performance award granted under the 2014 Plan, it is the intent of the Company that performance awards constitute “performance-based compensation” within the meaning of Section 162(m) of the Code and the regulations thereunder. Further, if complying with Section 162(m) of the Code, no participant may receive performance awards in any calendar year which have an aggregate value of more than $74,128,902, and if such awards involve the issuance of common stock, the aggregate value shall be based on the fair market value of such shares on the time of grant of such awards. In certain circumstances, the compensation committee may, in its discretion, determine that the amount payable with respect to certain performance awards will be reduced from the amount of any potential awards. However, the compensation committee may not, in any event, increase the amount of compensation payable to an individual upon the attainment of a performance goal intended to satisfy the requirements of Section 162(m) of the Code. With respect to a performance award that is not intended to satisfy the requirements of Section 162(m) of the Code, if the compensation committee determines in its sole discretion that the established performance measures or objectives are no longer suitable because of a change in the Company’s business, operations, corporate structure, or for other reasons that the compensation committee deems satisfactory, it may modify the performance measures or objectives and/or the performance period. |
| • | Dividend Equivalent Rights. Dividend equivalent rights represent the right of the participant to receive cash or stock equal in value to the dividends that would have been paid on the shares of common stock specified in the award if such shares were held by the participant. |
95
Table of Contents
| • | Other Awards. Our compensation committee is authorized to grant other forms of awards, based upon, payable in, or otherwise related to, in whole or in part, shares of common stock if the compensation committee determines that such other form of award is consistent with the purpose and restrictions of the 2014 Plan. |
Performance Measures. Awards of restricted stock, RSUs, performance awards and other awards under the 2014 Plan may be made subject to the attainment of performance goals relating to one or more business criteria used to measure the performance of the Company as a whole or any business unit of the Company, which, where applicable, shall be within the meaning of Section 162(m) of the Code and consist of one or more or any combination of the following criteria: cash flow; cost; revenues; sales; ratio of debt to debt plus equity; net borrowing, credit quality or debt ratings; profit before tax; economic profit; earnings before interest and taxes; earnings before interest, taxes, depreciation and amortization; gross margin; earnings per share (whether on a pre-tax, after-tax, operational or other basis); operating earnings; capital expenditures; expenses or expense levels; economic value added; ratio of operating earnings to capital spending or any other operating ratios; free cash flow; net profit; net sales; net asset value per share; the accomplishment of mergers, acquisitions, dispositions, public offerings or similar extraordinary business transactions; sales growth; price of the Company’s common stock; return on assets, equity or stockholders’ equity; market share; inventory levels, inventory turn or shrinkage; or total return to stockholders, or the Performance Criteria. Any Performance Criteria may be used to measure the performance of the Company as a whole or any business unit of the Company and may be measured relative to a peer group or index. Any Performance Criteria may include or exclude (i) extraordinary, unusual and/or non-recurring items of gain or loss, (ii) gains or losses on the disposition of a business, (iii) changes in tax or accounting regulations or laws, (iv) the effect of a merger or acquisition, as identified in the Company’s quarterly and annual earnings releases, or (v) other similar occurrences. In all other respects, Performance Criteria shall be calculated in accordance with the Company’s financial statements, under generally accepted accounting principles, or under a methodology established by the compensation committee prior to the issuance of an award which is consistently applied and identified in the audited financial statements, including footnotes, or the Compensation Discussion and Analysis section of the Company’s annual report. However, to the extent Section 162(m) of the Code is applicable, the compensation committee may not in any event increase the amount of compensation payable to an individual upon the attainment of a performance goal.
Authorized Shares. The Company has reserved 11,350,881 of our shares of common stock for issuance pursuant to the 2014 Plan, of which 100% may be delivered pursuant to ISOs. In addition, the maximum number of shares of common stock with respect to which stock options or SAR’s may be granted to an officer of the Company subject to Section 16 of the Exchange Act of 1934, as amended, or a “covered employee” as defined in Section 162(m)(3) of the Code during any calendar year is limited to 5,323,907 shares of common stock. To the extent any award under the 2014 Plan is forfeited, expired or cancelled, then the number of shares of common stock covered by the award or stock option so forfeited, expired or canceled will again be available for awards under the 2014 Plan.
Capital Adjustments. In the event that any extraordinary dividend or other extraordinary distribution, recapitalization, stock split, reverse stock split, rights offering, reorganization, merger, consolidation, split-up, spin-off, split-off, combination, subdivision, repurchase, or exchange of common stock or other securities of the Company, issuance of warrants or other rights to purchase common stock or other securities of the Company, or other similar corporate transaction or event affects the fair value of an award, the compensation committee shall adjust any or all of the following so that the fair value of the award immediate after the transaction or event is equal to the fair value of the award immediately prior to the transaction or event:
| • | the number of shares and type of common stock (or the securities or property) which thereafter may be made the subject of awards; |
| • | the number of shares and type of common stock (or other securities or property) subject to outstanding awards; |
96
Table of Contents
| • | the number of shares and type of Common Stock (or other securities or property) specified as the annual per-participant limitation specified in the 2014 Plan; |
| • | the option price of each outstanding award; |
| • | the amount, if any, the Company pays for forfeited shares of common stock; and |
| • | the number of or SAR price of shares of common stock then subject to outstanding SARs previously granted and unexercised under the plan, to the end that the same proportion of the Company’s issued and outstanding shares of common stock in each instance shall remain subject to exercise at the same aggregate SAR price, provided that, the number of shares of common stock (or other securities or property) subject to any award shall always be a whole number. |
Notwithstanding the foregoing, no adjustment shall be made or authorized to the extent that such adjustment would cause the 2014 Plan or any award to violate Section 422 of the Code or Section 409A of the Code. All such adjustments must be made in accordance with the rules of any securities exchange, stock market, or stock quotation system to which the Company is subject.
Eligibility. Any employees, contractors and outside directors whose judgment, initiative and efforts contributed or may be expected to contribute to the successful performance of the Company are eligible to receive awards under the 2014 Plan.
Vesting; Termination of Service. The compensation committee, in its sole discretion, may determine that an award will be immediately vested in whole or in part, or that all or any portion may not be vested until a date, or dates, subsequent to its grant date, or until the occurrence of one or more specified events, subject in any case to the terms of the 2014 Plan. If the compensation committee imposes conditions upon vesting, then, except as otherwise provided below, subsequent to the grant date the compensation committee may, in its sole discretion, accelerate the date on which all or any portion of the award may be vested. “Full Value Awards” (i.e., restricted stock or RSUs) that constitute performance awards must vest no earlier than one year after the date of grant, and Full Value Awards that are payable upon the completion of future services must vest no earlier than over the three year period commencing on the date of grant. Notwithstanding the foregoing, the compensation committee may, in its sole discretion, accelerate the vesting or waive any applicable restriction period for such Full Value Awards, provided that the shares of common stock subject to such awards shall be “Exempt Shares” (as defined in the 2014 Plan), unless such acceleration or waiver occurs by reason of the participant’s death, disability, retirement, or occurrence of a change in control. The number of Exempt Shares is limited to 10% of the number of shares available for issuance under the 2014 Plan, plus the total number of shares subject to awards that are received in exchange for incentive units in Paycom Payroll Holdings, LLC. The compensation committee may impose on any award, at the time of grant or thereafter, such additional terms and conditions as the compensation committee determines, including terms requiring forfeiture of awards in the event of a participant’s termination of service. The compensation committee will specify the circumstances under which performance awards may be forfeited in the event of a termination of service by a participant prior to the end of a performance period or settlement of awards. Except as otherwise determined by the compensation committee, restricted stock will be forfeited upon a participant’s termination of service during the applicable restriction period.
Change in Control. Upon the effective date of any change in control (as defined in the 2014 Plan), merger, consolidation or share exchange, or any issuance of bonds, debentures, preferred or preference stocks ranking prior to or otherwise affecting the common stock or the rights thereof (or any rights, options, or warrants to purchase same), or any proposed sale of all or substantially all of the assets of the Company, or of any dissolution or liquidation of the Company, all awards granted under the 2014 Plan may be cancelled by the Company upon (i) notice and a ten (10) day period during which the participant is permitted to purchase such shares of common stock subject to such awards or (ii) payment to the holder of an amount equal to a reasonable estimate of the difference between the fair market value of a share of stock underlying such award and the price per share of such award to be paid by the participant, multiplied by the number of shares subject to the award.
97
Table of Contents
Transferability. Awards under the plan generally may not be transferred, assigned, pledged, hypothecated or otherwise conveyed or encumbered other than by will or the laws of descent and distribution; provided, however, that the compensation committee may permit transfers to or for the benefit of the participant’s family.
Effective Date and Expiration; Termination and Amendment. The 2014 Plan became effective on January 1, 2014, subject to and conditioned upon stockholder approval, and will terminate on January 1, 2024, unless it is terminated earlier by our board of directors. No awards may be made under the 2014 Plan after its expiration date, but awards made prior thereto may extend beyond that date. Our board of directors may at any time and from time to time, without the consent of the participants, alter, amend, revise, suspend, or discontinue the 2014 Plan in whole or in part. Our board of directors does not need stockholder approval to amend our 2014 Plan unless required by any securities exchange or inter-dealer quotation system on which the common stock is listed or by applicable law. Unless required by law, no action by our board of directors regarding amendment or discontinuance of the 2014 Plan may adversely affect any rights of any participants or obligations of the Company to any participants with respect to any outstanding award under the 2014 Plan without the consent of the affected participant.
Employment Agreements
On December 30, 2013, we entered into employment agreements with each of our named executive officers, each of which were effective on, and not effective until, January 1, 2014. With the exception of the annual compensation (base salary and annual bonus potential), the material terms of the employment agreements of all four of our named executive officers are substantially the same. The summary of the employment agreements below does not contain complete descriptions of all provisions of the employment agreements of our named executive officers, copies of which will be included as exhibits to the registration statement of which this prospectus forms a part. See “Where You Can Find Additional Information.”
Under the employment agreements, Mr. Richison receives an annual base salary of $555,197, Mr. Boelte receives an annual base salary of $291,600, Mr. York receives an annual base salary of $356,400 and Mr. Kerber receives an annual base salary of $291,600. Each named executive officer is eligible to receive an annual bonus equal to 100% of his base salary (for Messrs. Richison and Boelte) or 75% of his base salary (for Messrs. York and Kerber), with the amount of such bonus to be determined by our compensation committee in accordance with the plans, policies and procedures adopted by the compensation committee from time to time.
The employment agreements also provide that each named executive officer is eligible to participate in, or receive benefits under, the Company’s executive benefit plan and any plan or arrangement made available to our employees, including any health, dental, vision, disability, life insurance, 401(k), or other retirement programs in accordance with the terms and conditions of such plans or arrangements. Each named executive officer is also entitled to vacation time, Company automobile and reimbursement of business expenses. In addition, we have agreed to provide Mr. Richison the use of a private aircraft, home security while he travels on Company business and a country club membership.
In connection with the employment agreements, each named executive officer agreed to confidentiality, noncompetition, noninterference and intellectual property protection provisions.
The employment agreements have initial terms of three (3) years following the consummation of this offering and automatically renew for successive one (1) year periods, unless earlier terminated by the Company or the named executive officer. Each named executive officer’s employment terminates upon death, disability, termination by the Company with or without “cause,” or termination by the named executive officer with or without “good reason.” In each case, the named executive officer is entitled to (i) payment of any earned but unpaid salary and accrued but unused vacation time and (ii) payment of any business expenses incurred but not reimbursed. In addition, if the named executive officer’s employment is terminated by the Company without cause or by the named executive officer with good reason, subject to the execution and return of a release of claims, the named executive officer is entitled to (i) continuation of his base salary for the length of the
98
Table of Contents
remaining “Restricted Period” following his termination, (ii) continuation of health insurance benefits for the length of the remaining Restricted Period, and (iii) a pro rata amount of the bonus the named executive officer would have earned as determined by the Compensation Committee for the year in which the termination occurred. For purposes of the employment agreements, after the offering, the “Restricted Period” will elapse upon the later of thirty-six (36) months following the consummation of the offering or twelve (12) months following the named executive officer’s date of termination of employment.
Each of the employment agreements define “cause” as (i) the repeated failure to perform such duties as are lawfully requested by the board of directors, (ii) the failure by named executive officer to observe material policies of the Company and its subsidiaries, (iii) gross negligence or willful misconduct in the performance of his duties, (iv) the material breach of employment or any non-competition, non-solicitation or similar restrictive agreement with the Company, (v) fraud, embezzlement, disloyalty or dishonesty with respect to the Company, (vi) use of illegal drugs or repetitive abuse of other drugs or alcohol which interferes with the performance of his duties, or (vii) the commission of any felony or of a misdemeanor involving dishonesty, disloyalty or moral turpitude. Each of the employment agreements define “good reason” as (i) any material reduction by the Company in the named executive officer’s base salary without prior consent, (ii) following a change in control, any change in the named executive officer’s status, reporting, duties or position that represents a demotion or diminution from such named executive officer’s prior status, or (iii) any material breach by the Company of the employment agreement between the Company and the named executive officer.
In connection with the employment agreements, we issued shares of restricted stock under our 2014 Plan to each of our named executive officers on January 1, 2014 to replace unvested management incentive units held by our named executive officers prior to the Reorganization. These grants are designed to provide our named executive officers with shares of restricted stock equivalent in value to the management incentive units they held prior to the Reorganization and are subject to the terms of the respective restricted stock award agreements with each officer. Our named executive officers were issued shares of restricted stock in the following amounts:
| Name |
Number of Shares of Restricted Stock Subject to Time Vesting Awards (1) |
Number of Shares of Restricted Stock Subject to Performance Vesting Awards (1) |
||||||
| Chad Richison |
1,239,670 | 4,084,237 | ||||||
| Craig E. Boelte |
197,451 | 231,648 | ||||||
| Jeffrey D. York |
200,396 | 234,588 | ||||||
| William X. Kerber III |
197,451 | 231,648 | ||||||
| (1) | For additional information concerning the vesting conditions of the restricted stock, see “Executive Compensation—Narrative Discussion Regarding Summary Compensation Table—Equity Incentive Units and Restricted Stock Awards.” |
99
Table of Contents
CERTAIN RELATIONSHIPS AND RELATED PARTY TRANSACTIONS
In addition to the executive officer and director compensation arrangements discussed above under “Executive Compensation,” we describe transactions since January 1, 2010 to which we have been a participant, in which the amount involved in the transaction exceeds or will exceed $120,000 and in which any of our directors, executive officers or holders of more than 5% of our capital stock, or any immediate family member of, or person sharing the household with, any of these individuals, had or will have a direct or indirect material interest below.
The Reorganization
In anticipation of this offering, we consummated the Reorganization as described under “The Reorganization,” which description is incorporated by reference herein.
2017 Note
In connection with the Reorganization, we assumed the 2017 Note that was issued by WCAS Holdings payable to WCAS X. As of March 31, 2014, the outstanding principal amount of the 2017 Note was $46.2 million (which excluded accrued interest of $1.6 million). The 2017 Note is due on April 3, 2017 and interest is payable at an annual rate of 14.0%, payable semiannually in arrears on June 30 and December 31 of each year. We may, at our option, choose to defer all or a portion of the accrued interest on the note that is due and payable on any payment date, provided that such amount of accrued interest shall be added to the principal amount of the note on such interest payment date (with the accrued but unpaid interest bearing interest at an annual rate of 14.0%). As of March 31, 2014, such option had not been elected and all interest had been paid in cash.
Stockholders Agreement
Election of Directors
In connection with the Reorganization, we and the Stockholders Agreement Parties entered into the Stockholders Agreement. Among other things, the Stockholders Agreement provides that upon the completion of this offering and for so long as the parties thereto continue to collectively hold 40% of our issued and outstanding shares of common stock, each party will vote and take all other necessary and desirable action within such party’s control to (i) cause the authorized number of directors of our board of directors to be established at seven and (ii) elect to our board of directors:
| • | three representatives designated by the holders of a majority of the shares of common stock held by WCAS X and any of its affiliates to which shares of common stock are transferred pursuant to the stockholders agreement; |
| • | one representative designated by the holders of a majority of the shares of common stock held by WCAS Capital IV and any of its affiliates to which shares of common stock are transferred pursuant to the stockholders agreement; and |
| • | subject to certain conditions, one representative designated by the holders of a majority of the shares of common stock held by the Minority Holders, who shall be Chad Richison for so long as he is employed by us. |
As such, Welsh, Carson, Anderson & Stowe and its affiliates have effectively designated four representatives to our initial board of directors. Messrs. Levenson, Swani and Minicucci were designated by WCAS X. Mr. Mulvee was designated by WCAS Capital IV.
100
Table of Contents
Termination
The Stockholders Agreement will terminate upon the latest of the date on which: (i) Chad Richison ceases to be our chief executive officer, (ii) the date on which Chad Richison ceases to be a director and (iii) the parties to the Stockholders Agreement collectively cease to own less than 40% of our issued and outstanding shares of common stock.
Registration Rights Agreement
In connection with the Reorganization, we and Payroll, the WCAS Funds, WCAS Holdings. the Estate of Richard Aiello, Robert J. Levenson, Sue Ann Jordan, Chad Richison, Jeffrey D. York and certain entities affiliated with these individuals became parties to a registration rights agreement, or the Registration Rights Agreement. After this offering, the parties to the Registration Rights Agreement will be entitled to certain rights with respect to registration of shares of our common stock under the Securities Act. These shares are referred to as registrable securities. The holders of these registrable securities will possess the registration rights contained in the Registration Rights Agreement that are described in additional detail below.
Demand Registration Rights
Under the Registration Rights Agreement, upon the written request of the holders of a majority of the registrable securities owned by WCAS Holdings and its affiliates to register all or part of their registrable securities on a registration statement under the Securities Act, we will be obligated to register the sale of all registrable securities that holders may request in writing to be registered within 20 days of the mailing of a notice by us to all holders of such registration. The demand registration rights may not be exercised until six months after the date of the execution of the underwriting agreement. We are required to effect no more than four registration statements on Form S-1, subject to certain exceptions, and an unlimited number of registration statements on Form S-3. We may postpone the filing of a registration statement for up to 120 days once in a 12-month period if in the good faith judgment of our board of directors such registration would be materially harmful to our economic prospects, and we are not required to effect the filing of a registration statement within six months following the effective date of, a previous registration of the registrable securities.
Piggyback Registration Rights
If we register any of our securities for public sale, we will have to register all registrable securities that the holders of such securities request in writing be registered within 20 days of mailing of notice by us to all holders of the proposed registration, subject to certain exceptions. However, this right does not apply to this offering, a registration statement on Form S-8 or S-4 or a demand registration. The managing underwriter of any underwritten offering will have the right to limit, due to marketing reasons, the number of shares registered by these holders.
Form S-3 Registration Rights
To the extent we are eligible to use a registration statement on Form S-3, the holders of a majority of the registrable securities owned by WCAS Holdings and its affiliates can request that we register all or a portion of their shares on a registration statement on Form S-3. We are required to use our best efforts to file one or more registration statements on Form S-3 upon the exercise of these rights, subject to certain exceptions.
Registration Expenses
We are required to pay all expenses incurred in connection with each of the registrations described above, except for underwriting discounts and commissions. We have also agreed to pay the expenses incurred by WCAS Holdings and its affiliates in connection with the registration of shares of common stock in this offering, which is currently approximately $656,000.
101
Table of Contents
Expiration of Registration Rights
The registration rights described above will survive our initial public offering and will terminate as to any stockholder as such time as the stockholder no longer holds shares of common stock.
April 2012 Corporate Reorganization
Corporate Reorganization
In April 2012, Holdings was created and acquired 100% of the equity interests in Payroll pursuant to a corporate reorganization, or the April 2012 Corporate Reorganization. The April 2012 Corporate Reorganization was accomplished through the following steps:
| • | Payroll formed a new wholly-owned limited liability company subsidiary, Holdings, and Holdings formed a new wholly-owned limited liability company subsidiary, Paycom Payroll Merger Sub, LLC, or Merger Sub; |
| • | Merger Sub merged with and into Payroll, with Payroll remaining as the surviving entity and a wholly-owned subsidiary of Holdings; |
| • | Holdings issued the 2022 Note, a $18.8 million note payable to WCAS Capital IV, an affiliate of Welsh, Carson, Anderson & Stowe, in exchange for cash of $16.4 million and a discount of approximately $2.4 million; |
| • | WCAS CP IV Blocker, Inc., a subsidiary of WCAS Capital IV, purchased 6,839 Series A Preferred Units of Holdings for $2,409,122; and |
| • | Holdings distributed to its members either (i) cash or (ii) equivalent value of new 14% Series C Preferred Units, as elected by the members. |
Related Party Distribution
In connection with the April 2012 Corporate Reorganization, we paid a $18.8 million cash distribution to our common unit holders on a pro rata basis, including to our executive officers and certain of their affiliated entities.
Related Party Debt
In connection with the April 2012 Corporate Reorganization, we entered into the 2022 Note with WCAS Capital IV. WCAS Capital IV is an affiliate of Welsh, Carson, Anderson & Stowe. The 2022 Note is due on April 3, 2022 and interest accrues at an annual rate of 10% and is payable semiannually in arrears on December 31 and June 30 of each year. We may, at our option, choose to defer all or a portion of the accrued interest on the 2022 Note that is due and payable on any payment date, provided that such amount of accrued interest shall be multiplied by 1.3 and added to the principal amount of the note on such interest payment date (with the result that such interest will have accrued at an effective rate of 13.0% instead of 10.0% through such payment date). As of December 31, 2013, such option had not been elected and all interest had been paid in cash. As of December 31, 2013 and March 31, 2014, the outstanding principal amount of the 2022 Note was $14.7 million and $14.7 million, respectively, which included an unamortized discount of $4.1 million and $4.1 million, respectively.
Payables
At December 31, 2013 and 2012, Holdings owed $103,447 and $83,089, respectively, to Welsh, Carson, Anderson and Stowe and certain of their affiliates, representing tax distributions and travel expenses paid by Welsh, Carson, Anderson and Stowe and charged to Holdings.
102
Table of Contents
Repurchase of Incentive Units
We entered into a Limited Liability Company Unit Redemption Agreement, effective as of January 26, 2013, pursuant to which we purchased 2,605 incentive units from John Kerber at a purchase price of $260.21 per unit, which price was based on a third party appraisal and an internal appraisal. The incentive units were purchased from John Kerber for an aggregate purchase price of approximately $677,847. John Kerber is one of our former employees and the brother of William X. Kerber III, our chief information officer.
Lease of Office Space
During 2014, we paid rent on our Dallas office space in the amount of $41,390. During the years ended December 31, 2013, 2012 and 2011, we paid rent on our Dallas office space in the amounts of $254,000, $267,000 and $257,000, respectively. The Dallas office building is owned by 417 Oakbend, LP, a Texas limited partnership. Jeffrey D. York, our Chief Sales Officer, owns a .01% general partnership interest and a 10.49% limited partnership interest in 417 Oakbend, LP.
Real Property Agreements
During 2012 and 2013, we had the following related party transactions with Kilpatrick Partners, L.L.C., or Kilpatrick Partners. Mr. Richison, our President and Chief Executive Officer, is the manager of, and Mr. Richison and his wife own 100% of, Kilpatrick Partners.
| • | We entered into a Real Property Purchase Agreement, dated November 28, 2012, with Kilpatrick Partners pursuant to which we purchased approximately 17.6 acres of land for the construction of a second building at our corporate headquarters in December 2012. The land was purchased from Kilpatrick Partners for a purchase price of approximately $2,324,084, which valuation was determined by a third party appraiser. |
| • | We entered into a Real Property Purchase Agreement, dated October 16, 2013, with Kilpatrick Partners pursuant to which we purchased approximately 18.3 acres of land adjacent to our corporate headquarters in November 2013. The land was purchased from Kilpatrick Partners for a purchase price of approximately $4,788,586, which valuation was determined by a third party appraiser. |
| • | We entered into a Right of First Refusal Agreement, dated October 4, 2013, or the Right of First Refusal Agreement, with Kilpatrick Partners pursuant to which we were granted a right of first refusal to purchase approximately 28.1 acres of land adjacent to our corporate headquarters. Pursuant to the Right of First Refusal Agreement, we have the right to purchase any portion of the covered property for ten days after Kilpatrick Partner’s receipt of a third party bona fide offer to purchase the property. |
Indemnification of Directors and Officers
We have entered and intend to continue to enter into indemnification agreements with our directors which, subject to certain exceptions, require us to indemnify such persons to the fullest extent permitted by applicable law, including indemnification against certain expenses, including attorneys’ fees, judgments, fines or penalties or other amounts paid in settlement in connection with any legal proceedings to which the director was, or is threatened to be made, a party by reason of the fact that such director is or was a director, officer, employee, fiduciary or agent of the Company or was serving as a director, officer, employee or agent of another corporation, partnership, joint venture, trust or other enterprise at the express written request of the Company, provided that such director or officer acted in good faith and in a manner that the director or officer reasonably believed to be in, or not opposed to, the best interest of the Company and, with respect to any criminal proceeding, in a manner in which such person would have had no reasonable cause to believe his conduct was unlawful. Subject to certain limitations, these indemnification agreements also require us to advance expenses to our directors in advance of the final disposition of any action or proceeding for which indemnification is required or permitted.
103
Table of Contents
Contribution Agreement
Under the terms of a contribution agreement that was entered into in connection with the Reorganization, we are required to direct a portion of any repayment of the 2017 Note to the Estate of Richard Aiello and Mr. Levenson and certain of their affiliated or related entities. The amount of these cash payments will be deemed have been paid to WCAS X and WCAS Management Corporation. We anticipate being required to make an aggregate cash payment of approximately $82,000 to such persons that will be allocated based on their pro rata share of the total outstanding Series B Preferred Units of Holdings held immediately prior to the Reorganization. See “Use of Proceeds.”
Directed Share Program
Chad Richison, our president, chief executive officer and director, Craig E. Boelte, our chief financial officer, William X. Kerber III, our chief information officer and Frederick C. Peters II, our director, on behalf of themselves and certain of their affiliates, have indicated an interest in purchasing an aggregate of up to approximately $1.3 million in shares of our common stock in this offering pursuant to the Directed Share Program. For more information, see “Underwriting—Directed Share Program.”
Review, Approval or Ratification of Transactions with Related Parties
We have adopted a formal written policy that our executive officers, directors, holders of more than 5% of any class of our voting securities, and any member of the immediate family of and any entity affiliated with any of the foregoing persons, are not permitted to enter into a related party transaction with us, in which the amount involved exceeds $120,000, without the prior review and approval of our audit committee. In approving or rejecting any such proposal, our audit committee will consider all of the relevant facts and circumstances of the related party transaction and the related party’s relationship and interest in the transaction. All of the transactions described above were entered into prior to the adoption of this policy, except for the entry into the Stockholders Agreement, Registration Rights Agreement, Real Property Purchase Agreement, dated October 16, 2013 and the Right of First Refusal Agreement. All of the transactions described above were either approved or ratified in accordance with the terms of this policy.
104
Table of Contents
PRINCIPAL AND SELLING STOCKHOLDERS
The following table sets forth certain information with respect to the beneficial ownership of our common stock as of March 31, 2014, and as adjusted to reflect the sale of common stock offered by us in our initial public offering, for:
| • | each person, or group of affiliated persons, known by us to be the beneficial owner of more than 5% of our voting securities; |
| • | each of our directors; |
| • | each of our named executive officers; |
| • | all of our directors and executive officers as a group; and |
| • | each of the selling stockholders. |
We have determined beneficial ownership in accordance with the rules of the SEC. Under such rules, a person is generally deemed to beneficially own a security if such person has sole or shared voting or investment power with respect to that security, including with respect to options and warrants that are currently exercisable or exercisable within 60 days. Except as indicated by the footnotes below, we believe, based on the information furnished to us, that the persons and entities named in the table below have sole voting and investment power with respect to all shares of common stock that they beneficially own, subject to community property laws where applicable. Each of the persons and entities named in the table below acquired their shares of common stock pursuant to the Reorganization. See “The Reorganization” for additional information.
Applicable percentage ownership is based on 53,808,304 shares of common stock outstanding at March 31, 2014. For purposes of the table below, we have assumed that 4,606,882 shares of common stock will be issued by us in our initial public offering and that the underwriters will not exercise their option to purchase up to an additional 996,750 shares of common stock. In computing the number of shares of common stock beneficially owned by a person and the percentage ownership of that person, we deemed to be outstanding all unvested shares of restricted stock because holders of unvested restricted stock under the 2014 Plan hold the right to vote such stock. The table below excludes any shares of common stock that may be purchased through the Directed Share Program.
| Shares Beneficially Owned Prior to Offering |
Shares Being Offered |
Shares Beneficially Owned After Offering |
||||||||||||||||||
| Name of Beneficial Owner(1) |
Number |
% |
Number |
% |
||||||||||||||||
| 5% Stockholders: |
||||||||||||||||||||
| Welsh, Carson, Anderson & Stowe X, L. P.(2) |
30,425,136 | 56.5 | 1,813,105 | 28,612,031 | 49.0 | |||||||||||||||
| WCAS Capital Partners IV, L. P.(2) |
323,307 | * | 19,267 | 304,040 | * | |||||||||||||||
| WCAS Management Corporation(2) |
163,337 | * | 9,734 | 153,603 | * | |||||||||||||||
| Ernest Group, Inc.(3) |
7,170,999 | 13.3 | — | 7,170,999 | 12.3 | |||||||||||||||
| Non-Employee Directors: |
||||||||||||||||||||
| Robert J. Levenson(4) |
628,745 | 1.2 | 152,000 | 476,745 | * | |||||||||||||||
| Rob Minicucci |
— | — | — | — | — | |||||||||||||||
| Conner Mulvee |
|
— |
|
— | — | — | — | |||||||||||||
| Frederick C. Peters II |
— | — | — | — | — | |||||||||||||||
| Sanjay Swani |
— | — | — | — | — | |||||||||||||||
| Named Executive Officers: |
||||||||||||||||||||
| Chad Richison(6) |
13,018,729 | 24.2 | — | 13,018,729 | 22.3 | |||||||||||||||
| Craig E. Boelte(7) |
545,769 | 1.0 | — | 545,769 | * | |||||||||||||||
| Jeffrey D. York(8) |
1,367,391 | 2.5 | — | 1,367,391 | 2.3 | |||||||||||||||
| William X. Kerber III(9) |
1,343,175 | 2.5 | — | 1,343,175 | 2.3 | |||||||||||||||
| Others: |
||||||||||||||||||||
| The Estate of Richard Aiello(10) |
220,060 | * | 44,012 | 176,048 | * | |||||||||||||||
| All directors and current executive officers as a group (9 persons) |
16,903,809 | 31.4 | 152,000 | 16,751,809 | 28.7 | |||||||||||||||
| * | Less than one percent of common stock outstanding. |
105
Table of Contents
| (1) | Unless otherwise indicated, the address of each beneficial owner in the table above is c/o Paycom Software, Inc., 7501 W. Memorial Road, Oklahoma City, Oklahoma 73142. |
| (2) | The stockholders are WCAS X, WCAS Capital IV and WCAS Management Corporation. WCAS X Associates LLC, or X Associates, is the general partner of WCAS X. The managing members of X Associates are Pat Welsh, Bruce Anderson, Russ Carson, Tony de Nicola, Paul Queally, Jon Rather, Sanjay Swani, Scott Mackesy, Sean Traynor, Eric Lee, Mike Donovan, Brian Regan, Tom Scully and Tony Ecock. As a result, and by virtue of the relationships described above, each of the managing members of X Associates may be deemed to share beneficial ownership of the shares owned by WCAS X. The general partner of WCAS Capital IV is WCAS CP IV Associates LLC, or CP Associates. The managing members of CP Associates are Pat Welsh, Bruce Anderson, Russ Carson, Tony de Nicola, Paul Queally, Jon Rather, Sanjay Swani, Scott Mackesy, Sean Traynor, Eric Lee, Mike Donovan, Brian Regan, Tom Scully and Tony Ecock. As a result, and by virtue of the relationships described above, each of the managing members of CP Associates may be deemed to share beneficial ownership of the shares owned by WCAS Capital IV. WCAS Management Corporation is an affiliate of Welsh, Carson, Anderson & Stowe. The members of the board of directors of WCAS Management Corporation are Jon Rather, Paul Queally, Tony de Nicola and Russ Carson. As a result, and by virtue of the relationships described above, each of the directors of WCAS Management Corporation may be deemed to share beneficial ownership of the shares owned by WCAS Management Corporation. The address of each of the entities identified in this footnote is 320 Park Avenue, Suite 2500, New York, New York 10022. |
| (3) | Ernest Group, Inc. is a private corporation that is wholly owned by Mr. Richison and certain trusts for Mr. Richison’s children, for which Mr. Richison serves as trustee. Mr. Richison may be deemed to beneficially own the shares of common stock owned by Ernest Group, Inc. |
| (4) | Includes 78,593 shares of common stock owned by the ELK II 2012 Descendants’ Trust u/a dated December 26, 2012, or the ELK Trust, and 78,593 shares of common stock owned by the SLY II 2012 Descendants’ Trust u/a dated December 26, 2012, or the SLY Trust, for which Mr. Levenson is the settlor of the trust. Also includes 157,186 shares of common stock owned by Lenox Capital Group, LLC, for which Mr. Levenson is the managing member. Mr. Levenson plans to sell an aggregate of 152,000 shares of common stock in this offering, consisting of 38,500 shares of common stock owned by the ELK Trust, 38,500 shares of common stock owned by the SLY Trust and 75,000 shares of common stock owned by Lenox Capital Group, LLC. |
| (6) | Includes 7,170,999 shares of common stock owned by Ernest Group, Inc., 229,135 shares of common stock owned by The Ruby Group, Inc. and 5,323,907 shares of restricted stock. Mr. Richison is the sole director of Ernest Group, Inc. and Ernest Group, Inc. is wholly owned by Mr. Richison and certain trusts for Mr. Richison’s children, for which Mr. Richison serves as trustee. Mr. Richison may be deemed to beneficially own the shares of common stock owned by Ernest Group, Inc. Mr. Richison is the sole director and sole shareholder of The Ruby Group, Inc. and may be deemed to beneficially own the shares of common stock owned by The Ruby Group, Inc. |
| (7) | Includes 429,099 shares of restricted stock. |
| (8) | Includes 434,984 shares of restricted stock. |
| (9) | Includes 879,877 shares of common stock owned by WK-EGI, Inc. and 429,099 shares of restricted stock. Mr. Kerber is the sole director of WK-EGI, Inc. and WK-EGI, Inc. is wholly owned by Mr. Kerber and certain trusts for which Mr. Kerber serves as trustee. Mr. Kerber may be deemed to beneficially own the shares of common stock owned by WK-EGI, Inc. |
| (10) | Mr. Aiello was a former director of the Company. |
106
Table of Contents
General
The following summary describes our capital stock as it will be in effect upon the consummation of this offering. Upon consummation of this offering, our authorized capital stock will consist of one hundred million shares of common stock, par value $0.01 per share, and ten million shares of preferred stock, par value $0.01 per share. The following information reflects the filing of our certificate of incorporation. Immediately following the completion of this offering, there are expected to be 50,333,739 shares of common stock and no shares of preferred stock outstanding.
Common Stock
Dividend Rights
Subject to preferences that may be applicable to any then outstanding preferred stock, holders of our common stock are entitled to receive dividends, if any, as may be declared from time to time by our board of directors out of legally available funds. See “Dividend Policy.”
Voting Rights
Except as required by law or matters relating solely to the terms of preferred stock, each outstanding share of common stock will be entitled to one vote on all matters submitted to a vote of stockholders. Holders of shares of our common stock shall have no cumulative voting rights. Except in respect of matters relating to the election and removal of directors on our board of directors and as otherwise provided in our certificate of incorporation or required by law, all matters to be voted on by our stockholders must be approved by a majority of the shares present in person or by proxy at the meeting and entitled to vote on the subject matter. In the case of election of directors, all matters to be voted on by our stockholders must be approved by a plurality of the votes entitled to be cast by all shares of our common stock.
Liquidation
In the event of the liquidation, dissolution or winding up of our company, holders of our common stock will be entitled to share ratably in the net assets legally available for distribution to stockholders after the payment of all of our debts and other liabilities and the satisfaction of any liquidation preference granted to the holders of any then outstanding shares of preferred stock.
Rights and Preferences
Holders of our common stock have no preemptive, conversion, subscription or other rights, and there are no redemption or sinking fund provisions applicable to our common stock. The rights, preferences and privileges of the holders of our common stock are subject to, and may be adversely affected by, the rights of the holders of shares of any series of our preferred stock that we may designate in the future.
Undesignated Preferred Stock
Our board of directors may, without further action by our stockholders, from time to time, direct the issuance of shares of preferred stock in series and may, at the time of issuance, determine the designations, powers, preferences, privileges, and relative participating, optional or special rights as well as the qualifications, limitations or restrictions thereof, including, but not limited to:
| • | the designation of the series; |
| • | the number of shares of the series, which our board of directors may, except where otherwise provided in the preferred stock designation, increase or decrease, but not below the number of shares then outstanding; |
107
Table of Contents
| • | whether dividends, if any, will be cumulative or non-cumulative and the dividend rate of the series; |
| • | the dates at which dividends, if any, will be payable; |
| • | the redemption rights and price or prices, if any, for shares of the series; |
| • | the terms and amounts of any sinking fund provided for the purchase or redemption of shares of the series; |
| • | the amounts payable on shares of the series in the event of any voluntary or involuntary liquidation, dissolution or winding-up of the affairs of our company; |
| • | whether the shares of the series will be convertible into shares of any other class or series, or any other security, of our company or any other entity, and, if so, the specification of the other class or series or other security, the conversion price or prices or rate or rates, any rate adjustments, the date or dates as of which the shares will be convertible and all other terms and conditions upon which the conversion may be made; |
| • | restrictions on the issuance of shares of the same series or of any other class or series; and |
| • | the voting rights, if any, of the holders of the series. |
Satisfaction of any dividend preferences of outstanding shares of preferred stock would reduce the amount of funds available for the payment of dividends on shares of our common stock. Holders of shares of preferred stock may be entitled to receive a preference payment in the event of our liquidation before any payment is made to the holders of shares of our common stock. Under specified circumstances, the issuance of shares of preferred stock may render more difficult or tend to discourage a merger, tender offer or proxy contest, the assumption of control by a holder of a large block of our securities or the removal of incumbent management. We may issue shares of preferred stock with voting and conversion rights which could adversely affect the holders of shares of our common stock and the market value of our common stock. Upon consummation of this offering, there will be no shares of preferred stock outstanding and we have no present intention to issue any shares of preferred stock.
Equity Grants
As of December 31, 2013, no shares of our common stock were issuable upon exercise of outstanding options and no shares of restricted common stock were outstanding under the 2014 Plan.
Stockholders Agreement
After this offering, the Stockholders Agreement Parties will beneficially own or control, in the aggregate 41,111,514 shares of our common stock, or approximately 81.7% of our outstanding shares. For a description of the Stockholders Agreement, see “Certain Relationships and Related Party Transactions—Stockholders Agreement.”
Registration Rights Agreement
After this offering, the parties to the Registration Rights Agreement, including Payroll, the WCAS Funds, WCAS Holdings, the Estate of Richard Aiello, Robert J. Levenson, Sue Ann Jordan, Chad Richison, Jeffrey D. York and certain entities affiliated with these individuals, holding approximately 38,728,664 shares of our common stock, will be entitled to certain registration rights with respect to such shares under the Securities Act. The holders of these registrable securities possess registration rights pursuant to the terms of the Registration Rights Agreement. For a description of the Registration Rights Agreement, see “Certain Relationships and Related Party Transactions—Registration Rights Agreement.”
108
Table of Contents
Anti-Takeover Effects of Our Certificate of Incorporation and Bylaws and Certain Provisions of Delaware Law
Our certificate of incorporation and our bylaws contain provisions that may delay, defer or discourage another party from acquiring control of us. We expect that these provisions, which are summarized below, will discourage coercive takeover practices or inadequate takeover bids. These provisions are also designed to encourage persons seeking to acquire control of us to first negotiate with the board of directors, which we believe may result in an improvement of the terms of any such acquisition in favor of our stockholders. However, they also give the board of directors the power to discourage acquisitions that some stockholders may favor.
Classified Board of Directors
In accordance with the terms of our certificate of incorporation and bylaws, our board of directors will be divided into three classes, as nearly equal in number as practicable, with members of each class serving staggered three-year terms. Our bylaws will provide that the authorized number of directors shall be determined as set forth in the Stockholders Agreement, provided that following the time the Stockholders Agreement is terminated the number of directors shall be fixed exclusively from time to time solely by resolution of the board of directors. Any additional directorships resulting from an increase in the number of directors will be distributed among the three classes as the board of directors may determine in its discretion. Our certificate of incorporation and bylaws also provide that any vacancy on our board of directors, including a vacancy resulting from an enlargement of our board of directors, may be filled only by vote of a majority of our directors. Our classified board of directors could have the effect of delaying or discouraging an acquisition of us or a change in our management.
Undesignated Preferred Stock
The ability to authorize undesignated preferred stock under our certificate of incorporation will make it possible for our board of directors to issue preferred stock with super majority voting, special approval, dividend or other rights or preferences on a discriminatory basis that could impede the success of any attempt to acquire us or otherwise effect a change in control of us. These and other provisions may have the effect of deferring, delaying or discouraging hostile takeovers, or changes in control or management of our company.
Requirements for Advance Notification of Stockholder Meetings, Nominations and Proposals
Our certificate of incorporation and bylaws provide that special meetings of the stockholders may be called only by the majority of our board of directors or the president. Our bylaws prohibit the conduct of any business at a special meeting other than as specified in the notice for such meeting. These provisions may have the effect of deferring, delaying or discouraging hostile takeovers, or changes in control or management of our company.
Our bylaws include advance notice procedures with respect to stockholder proposals and the nomination of candidates for election as directors, other than nominations made by or at the direction of the board of directors or a committee of the board of directors. In order for any matter to be “properly brought” before a meeting, a stockholder will have to comply with advance notice requirements and provide us with certain information. Subject to the terms of the Stockholders Agreement, vacancies and newly created directorships may be filled only by a vote of a majority of the directors then in office, even though less than a quorum, and not by the stockholders. Our bylaws allow the chairman of a meeting of the stockholders to adopt rules and regulations for the conduct of meetings which may have the effect of precluding the conduct of certain business at a meeting if the rules and regulations are not followed. These provisions may also defer, delay or discourage a potential acquirer from conducting a solicitation of proxies to elect the acquirer’s own slate of directors or otherwise attempting to obtain control of our company.
Our certificate of incorporation provides that the board of directors is expressly authorized to make, alter, or repeal our bylaws and that our stockholders may only amend our bylaws with the approval of not less than a majority of the total voting power of all outstanding securities of the Company entitled to vote generally in the election of directors.
109
Table of Contents
No Cumulative Voting
Delaware General Corporation Law provides that stockholders are not entitled to the right to cumulate votes in the election of directors unless our certificate of incorporation provides otherwise and our certificate of incorporation will not expressly provide for cumulative voting.
Action by Written Consent
Pursuant to Section 228 of the Delaware General Corporation Law, any action required to be taken at any annual or special meeting of the stockholders may be taken without a meeting, without prior notice and without a vote if a consent or consents in writing, setting forth the action so taken, is signed by the holders of outstanding stock having not less than the minimum number of votes that would be necessary to authorize or take such action at a meeting at which all shares of our stock entitled to vote thereon were present and voted, unless the Company’s certificate of incorporation provides otherwise. Our certificate of incorporation provides that stockholders may only act by written consent until such date that the parties to the Stockholder Agreement cease collectively to beneficially own (directly or indirectly) more than 50% of the outstanding shares of common stock, or the Trigger Date.
Amendment Provisions
The Delaware General Corporation Law provides generally that the affirmative vote of a majority of the shares entitled to vote on any matter is required to amend a corporation’s certificate of incorporation or bylaws, unless a corporation’s certificate of incorporation or bylaws, as the case may be, requires a greater percentage. Our bylaws may be amended or repealed by a majority vote of our board of directors or the affirmative vote of the holders of a majority of the total voting power of all outstanding securities of the Company entitled to vote in an annual election of directors. In addition, the affirmative vote of the holders of a majority of the total voting power of all outstanding securities of the Company entitled to vote in an annual election of directors is required to amend certain provisions of our certificate of incorporation prior to the Trigger Date. From and after the Trigger Date, the affirmative vote of the holders of at least 66 2⁄3% of the total voting power of all outstanding securities of the Company entitled to vote in annual election of directors will be required to amend certain provisions of our certificate of incorporation.
Authorized but Unissued Shares
The authorized but unissued shares of common stock and preferred stock are available for future issuance without stockholder approval, subject to any limitations imposed by the NYSE. These additional shares may be used for a variety of corporate finance transactions, acquisitions and employee benefit plans. The existence of authorized but unissued and unreserved common stock and preferred stock could make more difficult or discourage an attempt to obtain control of us by means of a proxy contest, tender offer, merger or otherwise, and thereby protect the continuity of our management and possibly deprive the stockholders of opportunities to sell their shares at prices higher than prevailing market prices.
Section 203 of Delaware General Corporation Law
In our certificate of incorporation, we have elected not to be governed by Section 203 of Delaware General Corporation Law. However, our certificate of incorporation will contain provisions that are similar to Section 203. Specifically, our certificate of incorporation will provide that we may not engage in certain “business combinations” with any “interested stockholder” for a three-year period following the time that the person became an interested stockholder, unless:
| • | prior to the time the person became an interested stockholder, our board of directors approved either the business combination or the transaction that resulted in the stockholder becoming an interested stockholder; |
110
Table of Contents
| • | upon consummation of the transaction which resulted in the stockholder becoming an interested stockholder, the interested stockholder owned at least 85% of the voting stock of the Company outstanding at the time the transaction commenced, excluding certain shares; or |
| • | at or subsequent to the time the person became an interested stockholder, the business combination is approved by our board of directors and authorized at an annual or special meeting of stockholders, and not by written consent, by the affirmative vote of at least 66 2/3% of the outstanding voting stock which is not owned by the interested stockholder. |
Generally, a business combination includes a merger, asset or stock sale, or other transaction resulting in a financial benefit to the interested stockholder. Subject to certain exceptions, an interested stockholder is a person who, together with affiliates and associates, owns or, within the previous three years owned, 15% or more of our voting stock. However, in our case, the principal investors (meaning WCAS X and WCAS Capital IV, and their respective affiliates, employees and representatives, and Chad Richison and his affiliates) and any of their direct or indirect transferees receiving 15% or more of our voting stock will not be deemed to be interested stockholders regardless of the percentage of our voting stock owned by them, and accordingly will not be subject to such restrictions, subject to certain exceptions for the acquisition of additional shares of common stock. This provision could delay mergers or other takeover or change in control attempts with respect to us and, accordingly, may discourage attempts to acquire us.
Choice of Forum
Our certificate of incorporation provides that, unless we consent in writing to the selection of an alternative forum, the Court of Chancery of the State of Delaware (or if no Court of Chancery located within the State of Delaware has jurisdiction, the Federal District Court for the District of Delaware) will be the sole and exclusive forum for (i) any derivative action or proceeding brought on our behalf, (ii) any action asserting a claim of breach of a fiduciary duty owed by our directors, officers, or other employees to us or to our stockholders, (iii) any action asserting a claim against us or any director, officer or other employee arising pursuant to any provision of the Delaware General Corporation Law, our certificate of incorporation or bylaws or (iv) any action asserting a claim against us or any director, officer or other employee that is governed by the internal affairs doctrine. It is possible that a court could rule that this provision is not applicable or is unenforceable. Any person or entity purchasing or otherwise acquiring shares of capital stock of the Corporation will be deemed to have notice of and consented to this provision of our certificate of incorporation.
Limitations of Liability and Indemnification
See “Certain Relationships and Related Party Matters—Indemnification of Directors and Officers.”
Listing
Our common stock has been approved for listing on the NYSE under the symbol “PAYC.”
Transfer Agent and Registrar
Upon the closing of this offering, the transfer agent and registrar for our common stock will be American Stock Transfer & Trust Company, LLC.
111
Table of Contents
SHARES ELIGIBLE FOR FUTURE SALE
Prior to this offering, there has not been a public market for shares of our common stock. Future sales of substantial amounts of shares of our common stock, including shares issued upon the exercise of outstanding options, in the public market after our initial public offering, or the possibility of these sales occurring, could cause the prevailing market price for our common stock to fall or impair our ability to raise equity capital in the future.
Upon the completion of this offering, a total of 50,333,739 shares of our common stock will be outstanding, based on the number of shares outstanding as of March 31, 2014. This includes 4,606,882 shares of common stock that we are selling in this offering, which shares may be resold in the public market immediately without restriction or further registration under the Securities Act unless held by our “affiliates,” as that term is defined in Rule 144 under the Securities Act. The remaining outstanding shares of our common stock will be deemed “restricted securities” as that term is defined under Rule 144. Restricted securities may be sold in the public market only if registered under the Securities Act or if those securities qualify for an exemption from registration, including exemptions provided by Rules 144 and 701 under the Securities Act, which are summarized below.
As a result of the lock-up agreements described below and the provisions of Rules 144 and 701, and assuming no extension of the lock-up period and no exercise of the underwriters’ option to purchase additional shares, the shares of our common stock that are deemed “restricted securities” will be available for sale in the public market following the completion of this offering as follows:
| • | shares will be eligible for sale on the date of this prospectus; and |
| • | additional shares will be eligible for sale upon expiration of the lock-up agreements described below 180 days after the date of this prospectus, subject in many cases to the limitations of either Rule 144 or Rule 701 under the Securities Act. |
Lock-Up Agreements
Our officers, directors, and stockholders holding substantially all of our outstanding capital stock have agreed with the underwriters not to dispose of any of our common stock or securities convertible into or exchangeable for shares of our common stock during the 180-day period following the date of this prospectus, except with the prior written consent of Barclays Capital Inc. and J.P. Morgan Securities LLC. See “Underwriting.”
After the offering, our employees, including our executive officers, and/or directors may enter into written trading plans that are intended to comply with Rule 10b5-1 under the Securities Exchange Act of 1934. Sales under these trading plans would not be permitted until the expiration of the lock-up agreements relating to the offering described above.
See “Underwriting” for a more complete description of the lock-up agreements with the underwriters.
Rule 144
In general, under Rule 144 as currently in effect, once we have been subject to public company reporting requirements for at least 90 days, a person who is not deemed to have been one of our affiliates for purposes of the Securities Act at any time during the 90 days preceding a sale and who has beneficially owned the shares proposed to be sold for at least six months, including the holding period of any prior owner other than our affiliates, is entitled to sell those shares without complying with the manner of sale, volume limitation or notice provisions of Rule 144, subject to compliance with the public information requirements of Rule 144. If such a person has beneficially owned the shares proposed to be sold for at least one year, including the holding period of any prior owner other than our affiliates, then that person is entitled to sell those shares without complying with any of the requirements of Rule 144.
112
Table of Contents
In general, under Rule 144, as currently in effect, our affiliates or persons selling shares on behalf of our affiliates are entitled to sell upon the expiration of the lock-up agreements described below, within any three-month period beginning 90 days after the date of this prospectus, a number of shares that does not exceed the greater of:
| • | 1% of the number of shares of common stock then outstanding, which will equal approximately shares immediately after our initial public offering, or |
| • | the average weekly trading volume of the common stock during the four calendar weeks preceding the filing of a notice on Form 144 with respect to such sale. |
Sales under Rule 144 by our affiliates or persons selling shares on behalf of our affiliates are also subject to certain manner of sale provisions and notice requirements and to the availability of current public information about us.
Rule 701
In general, under Rule 701 as currently in effect, any of our employees, consultants or advisors who purchase shares from us in connection with a compensatory stock or option plan or other written agreement in a transaction before the effective date of our initial public offering that was completed in reliance on Rule 701 and complied with the requirements of Rule 701 will, subject to the lock-up restrictions described below, be eligible to resell such shares 90 days after the date of this prospectus in reliance on Rule 144, but without compliance with certain restrictions, including the holding period, contained in Rule 144.
Registration Rights
Upon the expiration of the lock-up agreements, the holders of approximately 38,728,664 shares of our common stock, or their transferees, will be entitled to certain rights with respect to the registration of those shares under the Securities Act. For a description of these registration rights, see “Description of Capital Stock—Registration Rights.” After these shares are registered, they will be freely tradable without restriction under the Securities Act.
Stock Options
As soon as practicable after the effectiveness of the registration statement of which this prospectus forms a part, we intend to file a registration statement on Form S-8 under the Securities Act to register shares of our common stock subject to options outstanding or reserved for issuance under the 2014 Plan. This registration statement will become effective immediately upon filing, and shares covered by the Form S-8 registration statement will thereupon be eligible for sale in the public markets, subject to vesting restrictions, the lock-up agreements described above and Rule 144 limitations applicable to affiliates. For a more complete discussion of the 2014 Plan, see “Executive Compensation—Compensation Arrangements Adopted in Connection with this Offering.”
113
Table of Contents
MATERIAL U.S. FEDERAL INCOME AND ESTATE TAX CONSIDERATIONS FOR NON-U.S. HOLDERS
The following is a general discussion of the material U.S. federal income and estate tax consequences to a non-U.S. holder of the acquisition, ownership and disposition of our common stock. For purposes of this discussion, a non-U.S. holder is any beneficial owner of our common stock, other than a partnership (or entity or arrangement treated as a partnership for U.S. federal income tax purposes), that is not for U.S. federal income tax purposes any of the following:
| • | an individual citizen or resident of the United States; |
| • | a corporation (or other entity treated as a corporation for U.S. federal income tax purposes) created or organized in the United States or under the laws of the United States or any state or the District of Columbia; |
| • | an estate whose income is subject to U.S. federal income tax regardless of its source; or |
| • | a trust (i) the administration of which is subject to the primary supervision of a U.S. court and which has one or more U.S. persons who have the authority to control all substantial decisions of the trust or (ii) which has made a valid election to be treated as a U.S. person. |
If a partnership (or an entity or arrangement treated as a partnership for U.S. federal income tax purposes) holds our common stock, the tax treatment of a partner in the partnership will generally depend on the status of the partner and the activities of the partnership. Accordingly, we urge partnerships that hold our common stock and partners in such partnerships to consult their own tax advisors regarding the tax treatment of acquiring, holding and disposing of our common stock.
This discussion assumes that a non-U.S. holder will hold our common stock as a capital asset (generally, property held for investment). This discussion does not address all aspects of U.S. federal income taxation or any aspects of state, local or non-U.S. taxation, nor does it consider any U.S. federal income tax considerations that may be relevant to non-U.S. holders which may be subject to special treatment under U.S. federal income tax laws, including, without limitation, U.S. expatriates, controlled foreign corporations, passive foreign investment companies, insurance companies, tax-exempt or governmental organizations, dealers in securities or currency, banks or other financial institutions, and investors that hold our common stock as part of a hedge, straddle or conversion transaction. Furthermore, the following discussion is based on current provisions of the Code, and Treasury Regulations and administrative and judicial interpretations thereof, all as in effect on the date hereof, and all of which are subject to change, possibly with retroactive effect.
We urge each prospective investor to consult a tax advisor regarding the U.S. federal, state, local and non-U.S. income and other tax consequences of acquiring, holding and disposing of shares of our common stock.
Dividends on Common Stock
If we pay dividends on our common stock, those payments will constitute dividends for U.S. tax purposes to the extent paid from our current or accumulated earnings and profits, as determined under U.S. federal income tax principles. To the extent those dividends exceed our current and accumulated earnings and profits, the dividends will constitute a return of capital and will first reduce a holder’s adjusted tax basis in its common stock, but not below zero, and then will be treated as gain from the sale of the common stock (see “—Gain on Disposition of Common Stock”).
Any dividend paid out of earnings and profits to a non-U.S. holder of our common stock generally will be subject to U.S. withholding tax at a rate of 30% of the gross amount of the dividend or such lower rate as may be specified by an applicable tax treaty. To receive the benefit of a reduced treaty rate, a non-U.S. holder generally must provide us with an Internal Revenue Service, or IRS, Form W-8BEN (or other applicable form) certifying qualification for the reduced rate. A non-U.S. holder eligible for a reduced rate of U.S. federal withholding tax pursuant to an applicable income tax treaty may obtain a refund of any excess amounts withheld by timely filing an appropriate claim for refund with the IRS.
114
Table of Contents
Notwithstanding the foregoing, dividends received by a non-U.S. holder that are effectively connected with the conduct of a trade or business within the United States by the non-U.S. holder will be exempt from such withholding tax. To obtain this exemption, the non-U.S. holder must provide us with an IRS Form W-8ECI properly certifying such exemption. Such effectively connected dividends, although not subject to withholding tax, generally will be subject to U.S. federal income tax on a net income basis at the same graduated tax rates generally applicable to U.S. persons, subject to any applicable tax treaty providing otherwise. In addition to the income tax described above, dividends received by corporate non-U.S. holders that are effectively connected with the conduct of a trade or business in the United States by the corporate non-U.S. holder may be subject to a branch profits tax at a rate of 30% or such lower rate as may be specified by an applicable tax treaty.
Gain on Disposition of Common Stock
A non-U.S. holder generally will not be subject to U.S. federal income tax on any gain realized upon the sale or other disposition of our common stock unless:
| • | the gain is effectively connected with the conduct of a trade or business within the United States by the non-U.S. holder and, if required by an applicable tax treaty, is attributable to a U.S. permanent establishment maintained by such non-U.S. holder; |
| • | the non-U.S. holder is an individual who is present in the United States for a period or periods aggregating 183 days or more during the calendar year in which the sale or disposition occurs and certain other conditions are met; or |
| • | we become a U.S. real property holding corporation, or USRPHC, for U.S. federal income tax purposes, and the non-U.S. holder holds or has held, directly or indirectly, at any time within the shorter of (i) the five-year period preceding the disposition and (ii) the non-U.S. holder’s holding period, more than 5% of our common stock. Generally, a corporation is a U.S. real property holding corporation if the fair market value of its U.S. real property interests equals or exceeds 50% of the sum of the fair market value of its worldwide real property interests and its other assets used or held for use in a trade or business. |
In the case of a non-U.S. holder described in the first bullet point immediately above, the gain will be subject to U.S. federal income tax on a net income basis generally in the same manner as if the non-U.S. holder were a U.S. person as defined under the Code (unless an applicable income tax treaty provides otherwise), and a non-U.S. holder that is a foreign corporation may be subject to an additional branch profits tax equal to 30% of its effectively connected earnings and profits attributable to such gain (or at such lower rate as may be specified by an applicable income tax treaty). In the case of an individual non-U.S. holder described in the second bullet point immediately above, except as otherwise provided by an applicable income tax treaty, the gain, which may be offset by certain U.S.-source capital losses, will be subject to a flat 30% tax.
We believe we are not and do not anticipate becoming a USRPHC for U.S. federal income tax purposes. If, however, we are or become a USRPHC, so long as our common stock is considered to be regularly traded on an established securities market, only a non-U.S. holder who actually or constructively holds or held (at any time during the shorter of the five year period ending on the date of disposition or the non-U.S. holder’s holding period) more than 5% of our common stock will be subject to U.S. federal income tax, under the third bullet point immediately above, on the disposition of our common stock. Each non-U.S. holder should consult with its tax advisor about the consequences that could result if we are, or become, a USRPHC.
Backup Withholding and Information Reporting
Generally, we must report annually to the IRS the amount of dividends paid to each non-U.S. holder, and the amount, if any, of tax withheld with respect to those dividends. A similar report is sent to each non-U.S. holder. These information reporting requirements apply even if withholding was not required. Pursuant to tax treaties or other agreements, the IRS may make its reports available to tax authorities in the recipient’s country of residence.
115
Table of Contents
Payments of dividends to a non-U.S. holder may be subject to backup withholding (at a rate of 28%) unless the non-U.S. holder establishes an exemption, for example, by properly certifying its non-U.S. status on an IRS Form W-8BEN or another appropriate version of IRS Form W-8. Notwithstanding the foregoing, backup withholding also may apply if we have actual knowledge, or reason to know, that the beneficial owner is a U.S. person that is not an exempt recipient.
Payments of proceeds from the sale or other disposition by a non-U.S. holder of our common stock effected outside the United States by or through a foreign office of a broker generally will not be subject to information reporting or backup withholding. However, information reporting will apply to those payments if the broker does not have documentary evidence that the holder is a non-U.S. holder, an exemption is not otherwise established, and the broker has certain relationships with the United States.
Payments of proceeds from the sale or other disposition by a non-U.S. holder of our common stock effected by or through a U.S. office of a broker generally will be subject to information reporting and backup withholding (at a rate of 28%) unless the non-U.S. holder establishes an exemption, for example, by properly certifying its non-U.S. status on an IRS Form W-8BEN or another appropriate version of IRS Form W-8. Notwithstanding the foregoing, information reporting and backup withholding also may apply if the broker has actual knowledge, or reason to know, that the holder is a U.S. person that is not an exempt recipient.
Backup withholding is not an additional tax. Rather, the U.S. income tax liability of persons subject to backup withholding will be reduced by the amount of tax withheld. If withholding results in an overpayment of taxes, a refund may be obtained, provided that the required information is timely furnished to the IRS.
Foreign Account Tax Compliance Act
The Foreign Account Tax Compliance Act, or FATCA, imposes a 30% withholding tax on any “withholdable payment” to (i) a “foreign financial institution” (as specifically defined for this purpose), unless such institution enters into an agreement with the U.S. government to collect certain amounts and provide to the U.S. tax authorities substantial information regarding account holders or (ii) a foreign entity that is not a financial institution, unless such entity provides the withholding agent with a certification that the foreign entity does not have any substantial U.S. owners or provides the withholding agent with certain information relating to each of its substantial U.S. owners. Under certain limited circumstances, a non-U.S. holder might be eligible for refunds or credits of such taxes.
“Withholdable payments” include U.S.-source payments otherwise subject to nonresident withholding tax and the gross proceeds from the sale of any equity of U.S. issuers. The withholding tax will apply regardless of whether the payment would otherwise be exempt from U.S. nonresident withholding tax (e.g., as capital gain).
This withholding will apply to U.S.-source payments otherwise subject to nonresident withholding tax made on or after July 1, 2014 and to the payment of gross proceeds from the sale of any equity of U.S. issuers made on or after January 1, 2017.
Estate Tax
Our common stock owned or treated as owned by an individual who is not a citizen or resident of the United States (as specifically defined for U.S. federal estate tax purposes) at the time of death will be includible in the individual’s gross estate for U.S. federal estate tax purposes and may be subject to U.S. federal estate tax unless an applicable estate tax treaty provides otherwise.
THE SUMMARY OF MATERIAL UNITED STATES FEDERAL INCOME TAX CONSIDERATIONS ABOVE IS INCLUDED FOR GENERAL INFORMATION PURPOSES ONLY. POTENTIAL PURCHASERS OF OUR COMMON STOCK ARE URGED TO CONSULT THEIR TAX ADVISORS TO DETERMINE THE UNITED STATES FEDERAL, STATE, LOCAL AND NON-UNITED STATES TAX CONSEQUENCES OF PURCHASING, OWNING AND DISPOSING OF OUR COMMON STOCK.
116
Table of Contents
Barclays Capital Inc. and J.P. Morgan Securities LLC are acting as the representatives of the underwriters of this offering. Under the terms of an underwriting agreement, which will be filed as an exhibit to the registration statement, each of the underwriters named below has severally agreed to purchase from us and the selling stockholders the respective number of common stock shown opposite its name below:
| Underwriters |
Number of Shares | |
| Barclays Capital Inc. |
||
| J.P. Morgan Securities LLC |
||
| Pacific Crest Securities LLC |
||
| Stifel, Nicolaus & Company, Incorporated |
||
| Canaccord Genuity Inc. |
||
|
| ||
| Total |
||
|
|
The underwriting agreement provides that the underwriters’ obligation to purchase shares of common stock depends on the satisfaction of the conditions contained in the underwriting agreement including:
| • | the obligation to purchase all of the shares of common stock offered hereby (other than those shares of common stock covered by their option to purchase additional shares as described below), if any of the shares are purchased; |
| • | the representations and warranties made by us and the selling stockholders to the underwriters are true; |
| • | there is no material change in our business or the financial markets; and |
| • | we and the selling stockholders deliver customary closing documents to the underwriters. |
Commissions and Expenses
The following table summarizes the underwriting discounts and commissions we and the selling stockholders will pay to the underwriters. These amounts are shown assuming both no exercise and full exercise of the underwriters’ option to purchase additional shares. The underwriting fee is the difference between the initial price to the public and the amount the underwriters pay to us and the selling stockholders for the shares.
| Us | Selling Stockholders | |||||||||||||||
| No Exercise | Full Exercise | No Exercise | Full Exercise | |||||||||||||
| Per Share |
$ | $ | $ | $ | ||||||||||||
| Total |
$ | $ | $ | $ | ||||||||||||
The representatives have advised us that the underwriters propose to offer the shares of common stock directly to the public at the public offering price on the cover of this prospectus and to selected dealers, which may include the underwriters, at such offering price less a selling concession not in excess of $ per share. After the offering, the representatives may change the offering price and other selling terms.
The expenses of the offering that are payable by us and the selling stockholders are estimated to be approximately $5.6 million (excluding underwriting discounts and commissions). We have agreed to pay expenses incurred by the selling stockholders in connection with the offering, other than the underwriting discounts and commissions.
Option to Purchase Additional Shares
The selling stockholders have granted the underwriters an option exercisable for 30 days after the date of this prospectus to purchase, from time to time, in whole or in part, up to an aggregate of 996,750 shares from the selling stockholders at the public offering price less underwriting discounts and commissions. This option may be
117
Table of Contents
exercised to the extent the underwriters sell more than 6,645,000 shares in connection with this offering. To the extent that this option is exercised, each underwriter will be obligated, subject to certain conditions, to purchase its pro rata portion of these additional shares based on the underwriter’s percentage underwriting commitment in the offering as indicated in the table at the beginning of this Underwriting Section.
Lock-Up Agreements
We, all of our directors and executive officers and our stockholders have agreed that, for a period of 180 days after the date of the final prospectus subject to certain limited exceptions as described below, we and they will not directly or indirectly, without the prior written consent of each of Barclays Capital Inc. and J.P. Morgan Securities LLC, (1) offer for sale, sell, pledge, or otherwise dispose of (or enter into any transaction or device that is designed to, or could be expected to, result in the disposition by any person at any time in the future of) any shares of common stock (including, without limitation, shares of common stock that may be deemed to be beneficially owned by us or them in accordance with the rules and regulations of the SEC and shares of common stock that may be issued upon exercise of any options or warrants) or securities convertible into or exercisable or exchangeable for, or that represent the right to receive shares of, common stock (other than shares that may be sold in this offering), (2) enter into any swap or other derivatives transaction that transfers to another, in whole or in part, any of the economic benefits or risks of ownership of shares of common stock, whether any such transaction described in clause (1) or (2) above is to be settled by delivery of common stock or other securities, in cash or otherwise, (3) cause to be filed a registration statement, including any amendments thereto, with respect to the registration of any shares of common stock or securities convertible, exercisable or exchangeable into common stock or any of our other, or (4) publicly disclose the intention to do any of the foregoing.
Each of the lock-up agreements contain certain exceptions, including the disposition of shares of common stock purchased in open market transactions after the completion of this offering, bona fide gifts, sales, transfers or other dispositions of shares of any class of our common stock, including by will or intestacy, made exclusively between and among the undersigned and members of the undersigned’s family or certain other persons, and the adoption of a Rule 10b5-1 sales plan; provided, in each case, that no filing shall be required under the Exchange Act in connection with the transfer or disposition during the 180-day lock-up period.
Barclays Capital Inc. and J.P. Morgan Securities LLC, in their sole discretion, may release the common stock and other securities subject to the lock-up agreements described above in whole or in part at any time. When determining whether or not to release common stock and other securities from lock-up agreements, Barclays Capital Inc. and J.P. Morgan Securities LLC will consider, among other factors, the holder’s reasons for requesting the release, the number of shares of common stock and other securities for which the release is being requested and market conditions at the time. At least three business days before the effectiveness of any release or waiver of any of the restrictions described above with respect to an officer or director of the Company, Barclays Capital Inc. and J.P. Morgan Securities LLC will notify us of the impending release or waiver and we have agreed to announce the impending release or waiver by press release through a major news service at least two business days before the effective date of the release or waiver, except where the release or waiver is effected solely to permit a transfer of common stock that is not for consideration and where the transferee has agreed in writing to be bound by the same terms as the lock-up agreements described above to the extent and for the duration that such terms remain in effect at the time of transfer.
As described below under “Directed Share Program,” any participant who had agreed to the lock-up provisions described above or any participant who is our employee, will be subject to a 180-day lock up with respect to any shares sold to them pursuant to that program, with the same restrictions and an identical extension provision as the lock-up agreement described above. Any shares sold in the directed share program to our directors or officers shall be subject to the lock-up agreement described above.
118
Table of Contents
Offering Price Determination
Prior to this offering, there has been no public market for our common stock. The initial public offering price was negotiated between the representatives and us. In determining the initial public offering price of our common stock, the representatives considered:
| • | the history and prospects for the industry in which we compete; |
| • | our financial information; |
| • | the ability of our management and our business potential and earning prospects; |
| • | the prevailing securities markets at the time of this offering; and |
| • | the recent market prices of, and the demand for, publicly traded shares of generally comparable companies. |
Indemnification
We and the selling stockholders have agreed to indemnify the underwriters against certain liabilities, including liabilities under the Securities Act and liabilities in connection with the directed share program referred to below, and to contribute to payments that the underwriters may be required to make for these liabilities.
Directed Share Program
At our request, the underwriters have reserved for sale at the initial public offering price up to 5% of the shares offered hereby for our officers, directors, employees, clients, suppliers, vendors and friends and relatives of our employees. The number of shares available for sale to the general public will be reduced to the extent such persons purchase such reserved shares. Any reserved shares not so purchased will be offered by the underwriters to the general public on the same basis as the other shares offered hereby. Any participants will be prohibited from selling, pledging or assigning any shares sold to them pursuant to this program for a period of 180 days after the date of this prospectus. The Directed Share Program will be arranged through our lead underwriter, Barclays Capital Inc.
Chad Richison, our president, chief executive officer and director, Craig E. Boelte, our chief financial officer, William X. Kerber III, our chief information officer and Frederick C. Peters II, our director, on behalf of themselves and certain of their affiliates, have indicated an interest in purchasing an aggregate of up to approximately $1.0 million, $0.1 million, $0.1 million and $0.1 million, respectively, in shares of our common stock at the initial public offering price through the Directed Share Program. Assuming an initial public offering price of $19.00 per share, which is the midpoint of the price range on the cover page of this prospectus, Messrs. Richison, Boelte, Kerber and Peters, directly or through their affiliates, would purchase an aggregate of up to approximately 52,631 shares, 5,263 shares, 5,263 shares and 5,263 shares, respectively, of the 6,645,000 shares in this offering based on these indications of interest. Because these indications of interest, however, are not binding agreements or commitments to purchase, Messrs. Richison, Boelte, Kerber and Peters and these affiliates may determine to purchase fewer shares than they indicated an interest in purchasing or not to purchase any shares in this offering. It is also possible that Messrs. Richison, Boelte, Kerber and Peters and these affiliates could indicate an interest in purchasing additional shares of our common stock. In addition, the underwriters could determine to sell fewer shares to Messrs. Richison, Boelte, Kerber and Peters and these affiliates than they indicated an interest in purchasing or not to sell any shares to such persons.
119
Table of Contents
Stabilization, Short Positions and Penalty Bids
The representatives may engage in stabilizing transactions, short sales and purchases to cover positions created by short sales, and penalty bids or purchases for the purpose of pegging, fixing or maintaining the price of the common stock, in accordance with Regulation M under the Exchange Act:
| • | Stabilizing transactions permit bids to purchase the underlying security so long as the stabilizing bids do not exceed a specified maximum. |
| • | A short position involves a sale by the underwriters of shares in excess of the number of shares the underwriters are obligated to purchase in the offering, which creates the syndicate short position. This short position may be either a covered short position or a naked short position. In a covered short position, the number of shares involved in the sales made by the underwriters in excess of the number of shares they are obligated to purchase is not greater than the number of shares that they may purchase by exercising their option to purchase additional shares. In a naked short position, the number of shares involved is greater than the number of shares in their option to purchase additional shares. The underwriters may close out any short position by either exercising their option to purchase additional shares and/or purchasing shares in the open market. In determining the source of shares to close out the short position, the underwriters will consider, among other things, the price of shares available for purchase in the open market as compared to the price at which they may purchase shares through their option to purchase additional shares. A naked short position is more likely to be created if the underwriters are concerned that there could be downward pressure on the price of the shares in the open market after pricing that could adversely affect investors who purchase in the offering. |
| • | Syndicate covering transactions involve purchases of the common stock in the open market after the distribution has been completed in order to cover syndicate short positions. |
| • | Penalty bids permit the representatives to reclaim a selling concession from a syndicate member when the common stock originally sold by the syndicate member is purchased in a stabilizing or syndicate covering transaction to cover syndicate short positions. |
These stabilizing transactions, syndicate covering transactions and penalty bids may have the effect of raising or maintaining the market price of our common stock or preventing or retarding a decline in the market price of the common stock. As a result, the price of the common stock may be higher than the price that might otherwise exist in the open market. These transactions may be effected on the NYSE or otherwise and, if commenced, may be discontinued at any time.
Neither we nor any of the underwriters make any representation or prediction as to the direction or magnitude of any effect that the transactions described above may have on the price of the common stock. In addition, neither we nor any of the underwriters make any representation that the representatives will engage in these stabilizing transactions or that any transaction, once commenced, will not be discontinued without notice.
Listing
Our common stock has been approved for listing on the NYSE under the symbol “PAYC.”
Stamp Taxes
If you purchase shares of common stock offered in this prospectus, you may be required to pay stamp taxes and other charges under the laws and practices of the country of purchase, in addition to the offering price listed on the cover page of this prospectus.
Other Relationships
The underwriters and certain of their affiliates are full service financial institutions engaged in various activities, which may include securities trading, commercial and investment banking, financial advisory,
120
Table of Contents
investment management, investment research, principal investment, hedging, financing and brokerage activities. The underwriters and certain of their affiliates have, from time to time, performed, and may in the future perform, various commercial and investment banking and financial advisory services for the issuer and its affiliates, for which they received or may in the future receive customary fees and expenses.
In the ordinary course of their various business activities, the underwriters and certain of their affiliates may make or hold a broad array of investments and actively trade debt and equity securities (or related derivative securities) and financial instruments (including bank loans) for their own account and for the accounts of their customers, and such investment and securities activities may involve securities and/or instruments of the issuer or its affiliates. If the underwriters or their affiliates have a lending relationship with us, certain of those underwriters or their affiliates routinely hedge, and underwriters or their affiliates may hedge, their credit exposure to us consistent with their customary risk management policies. Typically, the underwriters and their affiliates would hedge such exposure by entering into transactions which consist of either the purchase of credit default swaps or the creation of short positions in our securities or the securities of our affiliates, including potentially the shares of common stock offered hereby. Any such credit default swaps or short positions could adversely affect future trading prices of the shares of common stock offered hereby. The underwriters and certain of their affiliates may also communicate independent investment recommendations, market color or trading ideas and/or publish or express independent research views in respect of such securities or instruments and may at any time hold, or recommend to clients that they acquire, long and/or short positions in such securities and instruments.
Pursuant to an engagement agreement, we retained Solebury Capital LLC, or Solebury, a FINRA member, to provide certain financial consulting services in connection with this offering. We agreed to pay Solebury, only upon successful completion of this offering, a fee of $350,000 and, at our sole discretion, an additional potential incentive fee of $100,000, which will be included in the underwriting discounts and commissions set forth above. In determining whether we elect to award any or all of the incentive fee, we will consider the level of, and our satisfaction with, the services provided by Solebury throughout the offering process. We also agreed to reimburse Solebury for reasonable and documented travel and other out-of-pocket expenses, not to exceed in each instance $1,000 without our prior written consent and up to a maximum of $25,000, and have provided indemnification of Solebury pursuant to the engagement agreement. Solebury is not acting as an underwriter and has no contact with any public or institutional investor on behalf of us or the underwriters. In addition, Solebury will not underwrite or purchase any of our common shares in this offering or otherwise participate in any such undertaking. We have also engaged Solebury Communications Group LLC, an affiliate of Solebury, to provide us with certain investor relations services on an ongoing basis for a fee of $10,000 per month, and reimbursement of reasonable and duly documented travel and other out-of-pocket expenses incurred in connection with the engagement, not to exceed in each instance $1,000 without our prior written consent. FINRA has determined that payments by us received by Solebury Communications Group LLC within 90 days of effectiveness of the Registration Statement are to be included in underwriting compensation pursuant to FINRA rules. In no event will such payments exceed $50,000.
Selling Restrictions
This prospectus does not constitute an offer to sell to, or a solicitation of an offer to buy from, anyone in any country or jurisdiction (i) in which such an offer or solicitation is not authorized, (ii) in which any person making such offer or solicitation is not qualified to do so or (iii) in which any such offer or solicitation would otherwise be unlawful. No action has been taken that would, or is intended to, permit a public offer of the shares of common stock or possession or distribution of this prospectus or any other offering or publicity material relating to the shares of common stock in any country or jurisdiction (other than the United States) where any such action for that purpose is required. Accordingly, each underwriter has undertaken that it will not, directly or indirectly, offer or sell any shares of common stock or have in its possession, distribute or publish any prospectus, form of application, advertisement or other document or information in any country or jurisdiction except under circumstances that will, to the best of its knowledge and belief, result in compliance with any applicable laws and regulations and all offers and sales of shares of common stock by it will be made on the same terms.
121
Table of Contents
European Economic Area
In relation to each Member State of the European Economic Area which has implemented the Prospectus Directive (each, a “Relevant Member State”) an offer to the public of any common stock which are the subject of the offering contemplated herein may not be made in that Relevant Member State, except that an offer to the public in that Relevant Member State of any common stock may be made at any time under the following exemptions under the Prospectus Directive, if they have been implemented in that Relevant Member State:
| • | to legal entities which are qualified investors as defined under the Prospectus Directive; |
| • | by the underwriters to fewer than 100, or, if the Relevant Member State has implemented the relevant provisions of the 2010 PD Amending Directive, 150, natural or legal persons (other than qualified investors as defined in the Prospectus Directive), as permitted under the Prospectus Directive, subject to obtaining the prior consent of the representatives of the underwriters for any such offer; or |
| • | in any other circumstances falling within Article 3(2) of the Prospectus Directive, |
provided that no such offer of common stock shall result in a requirement for us, the selling stockholders or any underwriter to publish a prospectus pursuant to Article 3 of the Prospectus Directive or supplement a prospectus pursuant to Article 16 of the Prospectus Directive.
Each person in a Relevant Member State who receives any communication in respect of, or who acquires any common stock under, the offers contemplated here in this prospectus will be deemed to have represented, warranted and agreed to and with each underwriter, the selling stockholders and us that:
| • | it is a qualified investor as defined under the Prospectus Directive; and |
| • | in the case of any common stock acquired by it as a financial intermediary, as that term is used in Article 3(2) of the Prospectus Directive, (i) the common stock acquired by it in the offering have not been acquired on behalf of, nor have they been acquired with a view to their offer or resale to, persons in any Relevant Member State other than qualified investors, as that term is defined in the Prospectus Directive, or in the circumstances in which the prior consent of the representatives of the underwriters has been given to the offer or resale or (ii) where common stock have been acquired by it on behalf of persons in any Relevant Member State other than qualified investors, the offer of such common stock to it is not treated under the Prospectus Directive as having been made to such persons. |
For the purposes of this representation and the provision above, the expression an “offer of common stock to the public” in relation to any common stock in any Relevant Member State means the communication in any form and by any means of sufficient information on the terms of the offer and any common stock to be offered so as to enable an investor to decide to purchase or subscribe for the common stock, as the same may be varied in that Relevant Member State by any measure implementing the Prospectus Directive in that Relevant Member State, the expression “Prospectus Directive” means Directive 2003/71/EC (and amendments thereto, including the 2010 PD Amending Directive, to the extent implemented in the Relevant Member State), and includes any relevant implementing measure in each Relevant Member State and the expression “2010 PD Amending Directive” means Directive 2010/73/EU.
United Kingdom
This prospectus has only been communicated or caused to have been communicated and will only be communicated or caused to be communicated as an invitation or inducement to engage in investment activity (within the meaning of Section 21 of the Financial Services and Markets Act of 2000, or the FSMA, as received in connection with the issue or sale of the common stock in circumstances in which Section 21(1) of the FSMA does not apply to us. All applicable provisions of the FSMA have been and will be complied with in respect to anything done in relation to the common stock in, from or otherwise involving the United Kingdom.
122
Table of Contents
Notice to Residents of Canada
The common stock may be sold only to purchasers purchasing as principal that are both “accredited investors” as defined in National Instrument 45-106 Prospectus and Registration Exemptions and “permitted clients” as defined in National Instrument 31-103 Registration Requirements, Exemptions and Ongoing Registrant Obligations. Any resale of the common stock must be made in accordance with an exemption from the prospectus requirements and in compliance with the registration requirements of applicable securities laws.
123
Table of Contents
The validity of the shares of common stock offered hereby will be passed upon for us by Haynes and Boone, LLP, Dallas, Texas. Certain legal matters will be passed upon for the selling stockholders by Kirkland & Ellis LLP, New York, New York. The underwriters are being represented by Gibson, Dunn & Crutcher LLP, New York, New York in connection with the offering.
The audited financial statements included in this prospectus and elsewhere in this registration statement have been so included in reliance upon the report of Grant Thornton LLP, independent registered public accountants, upon the authority of said firm as experts in accounting and auditing.
WHERE YOU CAN FIND ADDITIONAL INFORMATION
We have filed with the SEC a registration statement on Form S-1 under the Securities Act with respect to the shares of common stock offered hereby. This prospectus, which constitutes a part of the registration statement, does not contain all of the information set forth in the registration statement or the exhibits filed therewith. For further information about us and the common stock offered hereby, we refer you to the registration statement and the exhibits filed therewith. Statements contained in this prospectus regarding the contents of any contract or any other document that is filed as an exhibit to the registration statement are not necessarily complete, and in each instance we refer you to the copy of such contract or other document filed as an exhibit to the registration statement. We currently do not file periodic reports with the SEC. Upon closing of our initial public offering, we will be required to file periodic reports, proxy statements and other information with the SEC pursuant to the Exchange Act. A copy of the registration statement and the exhibits filed therewith may be inspected without charge at the public reference room maintained by the SEC, located at 100 F Street, NE, Washington, DC 20549, and copies of all or any part of the registration statement may be obtained from that office. Please call the SEC at 1-800-SEC-0330 for further information about the public reference room. The SEC also maintains a website that contains reports, proxy and information statements and other information regarding registrants that file electronically with the SEC. The address of the website is www.sec.gov.
124
Table of Contents
INDEX TO CONSOLIDATED FINANCIAL STATEMENTS
| Page | ||||
| Paycom Software, Inc. and Subsidiary |
||||
| F-2 | ||||
| F-3 | ||||
| F-4 | ||||
| Paycom Payroll Holdings, LLC and Subsidiaries |
||||
| Consolidated Annual Financial Statements |
||||
| F-6 | ||||
| F-7 | ||||
| Consolidated Statements of Income, Years Ended December 31, 2013, 2012 and 2011 |
F-8 | |||
| Consolidated Statements of Members’ Equity, Years Ended December 31, 2013, 2012 and 2011 |
F-9 | |||
| Consolidated Statements of Cash Flows, Years Ended December 31, 2013, 2012 and 2011 |
F-10 | |||
| F-11 | ||||
F-1
Table of Contents
REPORT OF INDEPENDENT REGISTERED PUBLIC ACCOUNTING FIRM
Board of Directors and Shareholders
Paycom Software, Inc.
We have audited the accompanying consolidated balance sheet of Paycom Software, Inc. (a Delaware corporation) and subsidiary (the “Company”) as of December 31, 2013. This financial statement is the responsibility of the Company’s management. Our responsibility is to express an opinion on this financial statement based on our audit.
We conducted our audit in accordance with the standards of the Public Company Accounting Oversight Board (United States). Those standards require that we plan and perform the audit to obtain reasonable assurance about whether the financial statements are free of material misstatement. We were not engaged to perform an audit of the Company’s internal control over financial reporting. Our audit included consideration of internal control over financial reporting as a basis for designing audit procedures that are appropriate in the circumstances, but not for the purpose of expressing an opinion on the effectiveness of the Company’s internal control over financial reporting. Accordingly, we express no such opinion. An audit also includes examining, on a test basis, evidence supporting the amounts and disclosures in the financial statements, assessing the accounting principles used and significant estimates made by management, as well as evaluating the overall financial statement presentation. We believe that our audit provides a reasonable basis for our opinion.
In our opinion, the consolidated financial statement referred to above presents fairly, in all material respects, the financial position of Paycom Software, Inc. and Subsidiary as of December 31, 2013 in conformity with accounting principles generally accepted in the United States of America.
/s/ GRANT THORNTON LLP
Oklahoma City, Oklahoma
March 10, 2014
F-2
Table of Contents
PAYCOM SOFTWARE, INC. AND SUBSIDIARY
CONSOLIDATED BALANCE SHEET
AS OF DECEMBER 31, 2013
| December 31, 2013 |
||||
| Assets |
||||
| Current assets: |
||||
| Cash and cash equivalents |
$ | 1,000 | ||
|
|
|
|||
| Total assets |
$ | 1,000 | ||
|
|
|
|||
| Commitments and contingencies |
||||
| Stockholder’s equity |
||||
| Common stock, $0.01 par value—100,000,000 shares authorized, 1,000 shared issued and outstanding |
$ | 10 | ||
| Additional paid-in capital |
990 | |||
|
|
|
|||
| Total stockholder’s equity |
$ | 1,000 | ||
|
|
|
|||
See accompanying notes to the consolidated financial statements.
F-3
Table of Contents
PAYCOM SOFTWARE, INC. AND SUBSIDIARY
NOTES TO CONSOLIDATED BALANCE SHEET
AS OF DECEMBER 31, 2013
| 1. | ORGANIZATION |
Paycom Software, Inc. and its wholly-owned subsidiary, Paycom Software Merger Sub, LLC (collectively, “we”, “our,” “us” or “Software”) were incorporated as Delaware corporations on October 31, 2013 and December 24, 2013, respectively, in anticipation of an initial public offering (“IPO”) and was a wholly-owned subsidiary of Paycom Payroll, LLC (“Paycom”). Subsequent to year end, we effected a reorganization whereby we control directly or indirectly, Paycom Payroll Holdings, LLC (“Holdings”), Paycom, WCAS Paycom Holdings, Inc. (“WCAS Holdings”) and WCAS CP IV Blocker, Inc. (“CP IV Blocker”). As a result, we will consolidate the financial results of each of the above listed entities effective January 1, 2014.
| 2. | SUMMARY OF SIGNIFICANT ACCOUNTING POLICIES |
Basis of Accounting and Principles of Consolidation
The balance sheet has been prepared in accordance with accounting principles generally accepted in the United States of America. Separate statements of income, changes in stockholders’ equity and cash flows have not been presented in the financial statements because we have had no business activities.
Our consolidated balance sheet includes Software and its wholly-owned subsidiary, Paycom Software Merger Sub, LLC. Intercompany balances and transactions are eliminated in consolidation.
Cash and Cash Equivalents
We consider all highly liquid debt instruments purchased with a maturity of three months or less and money market mutual funds to be cash equivalents. We maintain cash and cash equivalents in bank deposit accounts which may not be federally insured. The fair value of our cash and cash equivalents approximates carrying value. As of December 31, 2013, all amounts were held in deposit on demand. We have not experienced any losses in such accounts and do not believe there is exposure to any significant credit risk on such accounts.
| 3. | STOCKHOLDER’S EQUITY |
We are authorized to issue 100,000,000 shares of common stock, par value $0.01 per share (“Common Stock”). We have issued 1,000 shares of Common Stock in exchange for $10, all of which were held by Paycom at December 31, 2013.
| 4. | COMMITMENTS AND CONTINGENCIES |
In July 2013, Dr. Lakshmi Arunachalam filed a complaint against Paycom in the U.S. District Court for the District of Delaware alleging that Paycom infringes on U.S. Patent No. 8,244,833 assigned to her. The complaint seeks a permanent injunction, damages, and attorneys’ fees should Paycom be found to infringe. Dr. Arunachalam has asserted similar claims in Delaware for the alleged infringement of the same patent against other payroll processing companies. Dr. Arunachalam has also accused various other entities of infringing related U.S. patents. On October 4, 2013, Paycom filed an answer, affirmative defenses and counterclaims to the complaint. Paycom denied all claims made against us by Dr. Arunachalam in her complaint, asserted various defenses and counterclaims for non-infringement and challenged the validity and enforceability of U.S. Patent No. 8,244,833. Dr. Arunachalam filed a reply to Paycom’s counterclaim on October 28, 2013 and denied non-infringement and invalidity. Paycom believes that this litigation is without merit and intends to vigorously defend itself in this matter. Due to the nature of the claims for this litigation and the uncertainties of the litigation, we are unable to provide an estimate of the potential amount of any loss related to this litigation.
F-4
Table of Contents
We are involved in various other legal proceedings in the ordinary course of business. Although we cannot predict the outcome of these proceedings, legal matters are subject to inherent uncertainties and there exists the possibility that the ultimate resolution of these matters could have a material adverse effect on our business, financial condition, results of operations or cash flows.
| 5. | SUBSEQUENT EVENTS |
In anticipation of an initial public offering, Software consummated the reorganization as of January 1, 2014, pursuant to which, (i) the owners of WCAS Holdings and CP IV Blocker, which are affiliates of Welsh, Carson, Anderson & Stowe, contributed WCAS Holdings and CP IV Blocker to Software in exchange for shares of common stock of Software and (ii) the owners of outstanding Series B Preferred Units of Holdings contributed their Series B Preferred Units for shares of common stock of Software. Immediately after these contributions, our wholly-owned subsidiary merged with and into Holdings with Holdings surviving the merger. Upon consummation of the merger, the remaining holders of outstanding common and incentive units of Holdings received shares of common stock of Software for their common and incentive units by operation of Delaware law and Holdings’ ownership interest in Software was cancelled. Following these transactions, all outstanding Series C Preferred Units were eliminated in an intercompany transaction between Holdings and WCAS Holdings, and Software assumed a 14% note with a face value $46,193 due 2017 (“2017 Note”) (collectively, the “2014 Reorganization”). In connection with the 2014 Reorganization, Software authorized and reserved 11,350,881 shares of our common stock for future issuance under the 2014 Long-Term Incentive Plan (the “2014 Plan”), effective January 1, 2014. The 2014 Plan permits Software to grant an array of equity-based incentive awards to certain officers, employees, contractors and directors.
Effective March 10, 2014, Software adopted an Amended and Restated Certificate of Incorporation, as approved by its board of directors and the majority of its stockholders, which, among other things, increased the number of authorized shares of capital stock from 100,000,000 shares of consisting solely of common stock, $0.01 par value per share, to 110,000,000 shares of capital stock consisting of 100,000,000 shares of common stock, $0.01 par value per share, and 10,000,000 shares of undesignated preferred stock, $0.01 per share. Software’s board of directors may fix the voting powers, designations, powers, preferences and other rights, and any qualifications, limitations or restrictions thereof on each series of preferred stock.
We have evaluated subsequent events through March 10, 2014, the date on which this balance sheet was issued, and determined that no subsequent events had occurred that would require additional disclosure.
F-5
Table of Contents
REPORT OF INDEPENDENT REGISTERED PUBLIC ACCOUNTING FIRM
Board of Directors and Members
Paycom Payroll Holdings, LLC
We have audited the accompanying consolidated balance sheets of Paycom Payroll Holdings, LLC (a Delaware limited liability company) and subsidiaries (the “Company”) as of December 31, 2013 and 2012, and the related consolidated statements of income, members’ equity, and cash flows for each of the three years in the period ended December 31, 2013. These financial statements are the responsibility of the Company’s management. Our responsibility is to express an opinion on these financial statements based on our audits.
We conducted our audits in accordance with the standards of the Public Company Accounting Oversight Board (United States). Those standards require that we plan and perform the audit to obtain reasonable assurance about whether the financial statements are free of material misstatement. We were not engaged to perform an audit of the Company’s internal control over financial reporting. Our audits included consideration of internal control over financial reporting as a basis for designing audit procedures that are appropriate in the circumstances, but not for the purpose of expressing an opinion on the effectiveness of the Company’s internal control over financial reporting. Accordingly, we express no such opinion. An audit also includes examining, on a test basis, evidence supporting the amounts and disclosures in the financial statements, assessing the accounting principles used and significant estimates made by management, as well as evaluating the overall financial statement presentation. We believe that our audits provide a reasonable basis for our opinion.
In our opinion, the consolidated financial statements referred to above present fairly, in all material respects, the financial position of Paycom Payroll Holdings, LLC and subsidiaries as of December 31, 2013 and 2012, and the results of their operations and their cash flows for each of the three years in the period ended December 31, 2013 in conformity with accounting principles generally accepted in the United States of America.
/s/ GRANT THORNTON LLP
Oklahoma City, Oklahoma
March 10, 2014
F-6
Table of Contents
PAYCOM PAYROLL HOLDINGS, LLC AND SUBSIDIARIES
CONSOLIDATED BALANCE SHEETS
AS OF DECEMBER 31, 2013 AND 2012
(IN THOUSANDS, EXCEPT UNIT AND PER UNIT AMOUNTS)
| Pro Forma December 31, |
December 31, | |||||||||||
| 2013 | 2013 | 2012 | ||||||||||
| (Unaudited) | ||||||||||||
| Assets |
||||||||||||
| Current assets: |
||||||||||||
| Cash and cash equivalents |
$ | 13,273 | $ | 13,273 | $ | 13,435 | ||||||
| Restricted cash |
369 | 369 | 368 | |||||||||
| Accounts receivable |
1,705 | 1,705 | 622 | |||||||||
| Prepaid expenses |
2,133 | 2,133 | 686 | |||||||||
| Inventory |
578 | 578 | 714 | |||||||||
| Deferred tax assets |
423 | — | — | |||||||||
|
|
|
|
|
|
|
|||||||
| Current assets before funds held for clients |
18,481 | 18,058 | 15,825 | |||||||||
| Funds held for clients |
455,779 | 455,779 | 324,266 | |||||||||
|
|
|
|
|
|
|
|||||||
| Total current assets |
474,260 | 473,837 | 340,091 | |||||||||
| Property, plant and equipment, net of accumulated depreciation of $11,540 and $8,015 respectively |
38,671 | 38,671 | 25,139 | |||||||||
| Deposits and other assets |
461 | 461 | 417 | |||||||||
| Goodwill |
51,889 | 51,889 | 51,889 | |||||||||
| Intangible assets, net of accumulated amortization of $19,703 and $18,091, respectively |
6,709 | 6,709 | 8,321 | |||||||||
|
|
|
|
|
|
|
|||||||
| Total assets |
$ | 571,990 | $ | 571,567 | $ | 425,857 | ||||||
|
|
|
|
|
|
|
|||||||
| Liabilities and Members’ Equity |
||||||||||||
| Current liabilities: |
||||||||||||
| Accounts payable |
$ | 5,020 | $ | 5,020 | $ | 2,354 | ||||||
| Accrued commissions and bonuses |
3,598 | 3,598 | 1,953 | |||||||||
| Accrued payroll and vacation |
3,087 | 3,087 | 1,925 | |||||||||
| Deferred revenue |
1,582 | 1,582 | 1,037 | |||||||||
| Current portion of long-term debt |
9,545 | 9,545 | 2,151 | |||||||||
| Accrued expenses and other current liabilities |
4,372 | 4,372 | 1,978 | |||||||||
|
|
|
|
|
|
|
|||||||
| Current liabilities before client fund obligation |
27,204 | 27,204 | 11,398 | |||||||||
| Client funds obligation |
455,779 | 455,779 | 324,266 | |||||||||
|
|
|
|
|
|
|
|||||||
| Total current liabilities |
482,983 | 482,983 | 335,664 | |||||||||
|
|
|
|
|
|
|
|||||||
| Deferred tax liabilities |
2,738 | — | — | |||||||||
| Long-term deferred revenue |
10,990 | 10,990 | 7,356 | |||||||||
| Long-term debt, less current portion |
11,545 | 11,545 | 11,959 | |||||||||
| Long-term debt to related party |
60,875 | 14,682 | 14,440 | |||||||||
| Derivative liability |
1,107 | 1,107 | 1,767 | |||||||||
|
|
|
|
|
|
|
|||||||
| Total long-term liabilities |
87,255 | 38,324 | 35,522 | |||||||||
|
|
|
|
|
|
|
|||||||
| Commitments and contingencies |
||||||||||||
| Members’ equity: |
||||||||||||
| Common units, $0.00 par value (285,000 authorized, 270,750 issued and outstanding) |
— | — | — | |||||||||
| Series A Preferred Units, $0.00 par value (700,000 authorized, 671,839 issued and outstanding) |
— | — | — | |||||||||
| Series B Preferred Units, $0.00 par value (270 authorized, 270 issued and outstanding) |
— | — | — | |||||||||
| Series C Preferred Units, $0.00 par value (50,000 authorized, 46,193 issued and outstanding) |
— | — | — | |||||||||
| Members’ capital |
— | 63,645 | 63,542 | |||||||||
| Preferred stock (no shares authorized, no shares issued and outstanding, actual; 10,000,000 shares authorized, no shares issued and outstanding on a pro forma basis) |
— | — | — | |||||||||
| Common stock (no shares authorized, no shares issued and outstanding, actual 100,000,000 shares authorized, 45,708,573 shares issued and outstanding on a pro forma basis) |
17,452 | — | — | |||||||||
| Additional paid in capital |
(13,385 | ) | — | — | ||||||||
| Accumulated deficit |
(2,315 | ) | (13,385 | ) | (8,871 | ) | ||||||
|
|
|
|
|
|
|
|||||||
| Total members’ equity |
1,752 | 50,260 | 54,671 | |||||||||
|
|
|
|
|
|
|
|||||||
| Total liabilities and members’ equity |
$ | 571,990 | $ | 571,567 | $ | 425,857 | ||||||
|
|
|
|
|
|
|
|||||||
See accompanying notes to the consolidated financial statements.
F-7
Table of Contents
PAYCOM PAYROLL HOLDINGS, LLC AND SUBSIDIARIES
CONSOLIDATED STATEMENTS OF INCOME
FOR THE YEARS ENDED DECEMBER 31, 2013, 2012 AND 2011
(IN THOUSANDS, EXCEPT UNIT AND PER UNIT AMOUNTS)
| Year Ended December 31, | ||||||||||||
| 2013 | 2012 | 2011 | ||||||||||
| Revenues |
||||||||||||
| Recurring |
$ | 105,560 | $ | 75,420 | $ | 56,382 | ||||||
| Implementation and other |
2,041 | 1,390 | 824 | |||||||||
|
|
|
|
|
|
|
|||||||
| Total revenues |
107,601 | 76,810 | 57,206 | |||||||||
|
|
|
|
|
|
|
|||||||
| Cost of revenues |
||||||||||||
| Operating expenses |
19,070 | 14,895 | 12,287 | |||||||||
| Depreciation |
1,821 | 1,431 | 987 | |||||||||
|
|
|
|
|
|
|
|||||||
| Total cost of revenues |
20,891 | 16,326 | 13,274 | |||||||||
|
|
|
|
|
|
|
|||||||
| Administrative expenses |
||||||||||||
| Sales and marketing |
42,681 | 29,255 | 22,244 | |||||||||
| Research and development |
2,146 | 1,632 | 1,225 | |||||||||
| General and administrative |
28,884 | 19,450 | 14,707 | |||||||||
| Depreciation and amortization |
3,682 | 4,092 | 4,300 | |||||||||
|
|
|
|
|
|
|
|||||||
| Total administrative expenses |
77,393 | 54,429 | 42,476 | |||||||||
|
|
|
|
|
|
|
|||||||
| Total operating expenses |
98,284 | 70,755 | 55,750 | |||||||||
|
|
|
|
|
|
|
|||||||
| Operating income |
9,317 | 6,055 | 1,456 | |||||||||
| Interest expense |
(2,805 | ) | (2,171 | ) | (134 | ) | ||||||
| Other income, net |
1,199 | 354 | 108 | |||||||||
|
|
|
|
|
|
|
|||||||
| Net income |
$ | 7,711 | $ | 4,238 | $ | 1,430 | ||||||
|
|
|
|
|
|
|
|||||||
| Less: Distribution to Series C Preferred Unitholder |
(6,467 | ) | (4,806 | ) | — | |||||||
|
|
|
|
|
|
|
|||||||
| Net income (loss) available to Series A Preferred Unitholders and common unit holders |
$ | 1,244 | $ | (568 | ) | $ | 1,430 | |||||
|
|
|
|
|
|
|
|||||||
| Net income (loss) per Series A Preferred Unit and common unit: |
||||||||||||
| Basic |
$ | 1.30 | $ | (0.60 | ) | $ | 1.53 | |||||
|
|
|
|
|
|
|
|||||||
| Diluted |
$ | 1.22 | $ | (0.57 | ) | $ | 1.49 | |||||
|
|
|
|
|
|
|
|||||||
| Weighted average units outstanding: |
||||||||||||
| Basic |
955,983 | 948,181 | 935,750 | |||||||||
|
|
|
|
|
|
|
|||||||
| Diluted |
1,018,305 | 1,004,436 | 960,611 | |||||||||
|
|
|
|
|
|
|
|||||||
| Pro forma net income per share (unaudited): |
||||||||||||
| Basic |
$ | 0.02 | ||||||||||
| Diluted |
$ | 0.02 | ||||||||||
| Pro forma weighted average shares outstanding (unaudited): |
||||||||||||
| Basic |
47,686,326 | |||||||||||
| Diluted |
48,371,489 | |||||||||||
See accompanying notes to the consolidated financial statements.
F-8
Table of Contents
PAYCOM PAYROLL HOLDINGS, LLC AND SUBSIDIARIES
CONSOLIDATED STATEMENTS OF MEMBERS’ EQUITY
FOR THE YEARS ENDED DECEMBER 31, 2013, 2012 AND 2011
(IN THOUSANDS, EXCEPT UNIT AND PER UNIT AMOUNTS)
| Number of units | Total Members’ Equity |
|||||||||||||||||||||||||||
| Common | Series A Preferred |
Series B Preferred |
Series C Preferred |
Members’ Capital |
Accumulated Deficit |
|||||||||||||||||||||||
| Balances at December 31, 2010 |
285,000 | 665,000 | 270 | — | $ | 80,208 | $ | (8,130 | ) | $ | 72,078 | |||||||||||||||||
| Distributions to members |
— | — | — | — | — | (1,443 | ) | (1,443 | ) | |||||||||||||||||||
| Common units redeemed |
(14,250 | ) | — | — | — | (1,000 | ) | — | (1,000 | ) | ||||||||||||||||||
| Incentive compensation |
— | — | — | — | 165 | — | 165 | |||||||||||||||||||||
| Net income |
— | — | — | — | — | 1,430 | 1,430 | |||||||||||||||||||||
|
|
|
|
|
|
|
|
|
|
|
|
|
|
|
|||||||||||||||
| Balances at December 31, 2011 |
270,750 | 665,000 | 270 | — | $ | 79,373 | $ | (8,143 | ) | $ | 71,230 | |||||||||||||||||
|
|
|
|
|
|
|
|
|
|
|
|
|
|
|
|||||||||||||||
| Issuance of Series A Preferred Units |
— | 6,839 | — | — | 2,409 | — | 2,409 | |||||||||||||||||||||
| Issuance of Series C Preferred Units |
— | — | — | 46,193 | — | — | — | |||||||||||||||||||||
| Distribution paid to members as return of capital |
— | — | — | — | (18,807 | ) | — | (18,807 | ) | |||||||||||||||||||
| Incentive compensation |
— | — | — | — | 567 | — | 567 | |||||||||||||||||||||
| Distributions to members |
— | — | — | — | — | (4,966 | ) | (4,966 | ) | |||||||||||||||||||
| Net income |
— | — | — | — | — | 4,238 | 4,238 | |||||||||||||||||||||
|
|
|
|
|
|
|
|
|
|
|
|
|
|
|
|||||||||||||||
| Balances at December 31, 2012 |
270,750 | 671,839 | 270 | 46,193 | $ | 63,542 | $ | (8,871 | ) | $ | 54,671 | |||||||||||||||||
|
|
|
|
|
|
|
|
|
|
|
|
|
|
|
|||||||||||||||
| Incentive units redeemed |
— | — | — | — | (1,061 | ) | — | (1,061 | ) | |||||||||||||||||||
| Incentive compensation |
— | — | — | — | 1,164 | — | 1,164 | |||||||||||||||||||||
| Distributions to members |
— | — | — | — | — | (12,225 | ) | (12,225 | ) | |||||||||||||||||||
| Net income |
— | — | — | — | — | 7,711 | 7,711 | |||||||||||||||||||||
|
|
|
|
|
|
|
|
|
|
|
|
|
|
|
|||||||||||||||
| Balances at December 31, 2013 |
270,750 | 671,839 | 270 | 46,193 | $ | 63,645 | $ | (13,385 | ) | $ | 50,260 | |||||||||||||||||
|
|
|
|
|
|
|
|
|
|
|
|
|
|
|
|||||||||||||||
See accompanying notes to the consolidated financial statements.
F-9
Table of Contents
PAYCOM PAYROLL HOLDINGS, LLC AND SUBSIDIARIES
CONSOLIDATED STATEMENTS OF CASH FLOWS
FOR THE YEARS ENDED DECEMBER 31, 2013, 2012 AND 2011
(IN THOUSANDS)
| Year Ended December 31 | ||||||||||||
| 2013 | 2012 | 2011 | ||||||||||
| Operating activities |
||||||||||||
| Net income |
$ | 7,711 | $ | 4,238 | $ | 1,430 | ||||||
| Adjustments to reconcile net income to net cash provided by operating activities |
||||||||||||
| Depreciation and amortization |
5,486 | 5,522 | 5,286 | |||||||||
| Gain on sale of property, plant and equipment |
(248 | ) | — | — | ||||||||
| Amortization of debt discount |
241 | 143 | — | |||||||||
| Amortization of debt issuance costs |
17 | 19 | — | |||||||||
| Incentive compensation |
934 | 503 | 165 | |||||||||
| Change in fair value of derivative liability |
(660 | ) | (333 | ) | — | |||||||
| Changes in operating assets and liabilities |
||||||||||||
| Accounts receivable |
(1,083 | ) | (133 | ) | (241 | ) | ||||||
| Prepaid expenses |
(800 | ) | (395 | ) | 256 | |||||||
| Inventory |
136 | 8 | (75 | ) | ||||||||
| Deposits and other assets |
(44 | ) | (75 | ) | (204 | ) | ||||||
| Accounts payable |
2,667 | 1,157 | (597 | ) | ||||||||
| Accrued commissions and bonuses |
1,645 | 1,461 | 3 | |||||||||
| Accrued payroll and vacation |
1,162 | 351 | 406 | |||||||||
| Deferred revenue |
4,163 | 2,778 | 2,185 | |||||||||
| Accrued expenses and other liabilities |
2,394 | 538 | 471 | |||||||||
|
|
|
|
|
|
|
|||||||
| Net cash provided by operating activities |
23,721 | 15,782 | 9,085 | |||||||||
|
|
|
|
|
|
|
|||||||
| Investing activities |
||||||||||||
| Increase in funds held for clients |
(131,513 | ) | (71,001 | ) | (87,190 | ) | ||||||
| Increase in restricted cash |
(1 | ) | (117 | ) | (251 | ) | ||||||
| Additions to property, plant and equipment |
(17,176 | ) | (5,971 | ) | (14,867 | ) | ||||||
| Proceeds from sale of property, plant and equipment |
248 | 106 | 9 | |||||||||
|
|
|
|
|
|
|
|||||||
| Net cash used in investing activities |
(148,442 | ) | (76,983 | ) | (102,299 | ) | ||||||
|
|
|
|
|
|
|
|||||||
| Financing activities |
||||||||||||
| Proceeds from issuance of long-term debt |
6,979 | 1,750 | 9,612 | |||||||||
| Proceeds from issuance of long-term debt to related party |
— | 16,398 | — | |||||||||
| Payments on long-term debt |
— | (401 | ) | — | ||||||||
| Increase in client funds obligations |
131,513 | 71,001 | 87,191 | |||||||||
| Proceeds from issuance of Series A Preferred Units |
— | 2,409 | — | |||||||||
| Common units redeemed |
— | — | (1,000 | ) | ||||||||
| Distributions paid to members as return of capital |
— | (18,807 | ) | — | ||||||||
| Incentive units redeemed |
(1,061 | ) | — | — | ||||||||
| Payments of deferred offering costs |
(647 | ) | — | — | ||||||||
| Distributions paid to members |
(12,225 | ) | (4,966 | ) | (1,443 | ) | ||||||
|
|
|
|
|
|
|
|||||||
| Net cash provided by financing activities |
124,559 | 67,384 | 94,360 | |||||||||
|
|
|
|
|
|
|
|||||||
| Change in cash and cash equivalents |
(162 | ) | 6,183 | 1,146 | ||||||||
| Cash and cash equivalents |
||||||||||||
| Beginning of year |
13,435 | 7,252 | 6,106 | |||||||||
|
|
|
|
|
|
|
|||||||
| End of year |
$ | 13,273 | $ | 13,435 | $ | 7,252 | ||||||
|
|
|
|
|
|
|
|||||||
| Supplemental cash flow disclosure |
||||||||||||
| Cash paid for interest, net of amounts capitalized |
$ | 2,831 | $ | 2,028 | $ | 134 | ||||||
| Noncash financing and investing activities |
||||||||||||
| Purchase of property, plant and equipment on account |
368 | 167 | 45 | |||||||||
| Issuance of Series C Preferred Units as return of capital distribution |
— | 46,193 | — | |||||||||
See accompanying notes to the consolidated financial statements.
F-10
Table of Contents
PAYCOM PAYROLL HOLDINGS, LLC AND SUBSIDIARIES
NOTES TO CONSOLIDATED FINANCIAL STATEMENTS
DECEMBER 31, 2013, 2012 AND 2011
(IN THOUSANDS, EXCEPT PER UNIT AMOUNTS)
| 1. | ORGANIZATION AND DESCRIPTION OF BUSINESS |
Paycom Payroll Holdings, LLC (“Holdings”), formerly known as Paycom Payroll, LLC, and its wholly owned subsidiaries, Paycom Payroll, LLC (“Paycom”) and Paycom Benefits, LLC (collectively, “we” or “our”), is a leading provider of a cloud-based human capital management solution delivered as Software-as-a-Service. We are headquartered in Oklahoma City, Oklahoma, and have sales offices in 20 states nationwide.
Holdings was incorporated on April 3, 2012 for the purpose of acquiring Paycom and its subsidiary, Paycom Benefits, LLC. Holdings was initially created as a subsidiary of Paycom. As part of the reorganization process, Holdings formed a new wholly-owned subsidiary, Paycom Payroll Merger Sub, LLC (“Merger Sub”), which merged with and into Paycom, with Paycom remaining as the surviving entity. Paycom subsequently cancelled its ownership in Holdings, and became a wholly owned subsidiary of Holdings (“April 2012 Corporate Reorganization”). In connection with the April 2012 Corporate Reorganization, the four existing authorized classes of ownership interest of Paycom were contributed into Holdings and new ownership units were authorized by Holdings.
On October 31, 2013, we incorporated Paycom Software, Inc. (“Software”), which is an indirect wholly-owned subsidiary of Payroll, prior to a reorganization which was consummated on January 1, 2014.
| 2. | SUMMARY OF SIGNIFICANT ACCOUNTING POLICIES |
Basis of Presentation and Principles of Consolidation
The creation of Holdings and its acquisition of Paycom under the April 2012 Corporate Reorganization represented a transaction under common control, which was considered a change in reporting unit and was required to be retrospectively applied to the financial statements of all prior periods when the financial statements were issued for a period that included the date the transaction occurred. Therefore, the consolidated financial statements of Holdings are presented as if Holdings existed and controlled Paycom in periods prior to the creation of Holdings.
Our consolidated financial statements include the financial results of Holdings, Paycom and its wholly owned subsidiaries, Paycom Benefits, LLC and Software. Intercompany balances and transactions are eliminated in consolidation.
Reclassifications
Certain reclassifications were made to the 2012 and 2011 consolidated financial statements to conform to the 2013 presentation. These reclassifications were not material to the financial statements and had no effect on the consolidated members’ equity or net income.
Use of Estimates
The preparation of financial statements in conformity with accounting principles generally accepted in the United States of America requires management to make estimates and assumptions that affect the amounts reported in the financial statements and accompanying notes. Actual results could differ from these estimates. Significant estimates include useful life for long lived and intangible assets, the average life of our clients, the fair market value of our employee incentive units and the fair values of our financial instruments. These estimates are based on historical experience where applicable and other assumptions that management believes are reasonable under circumstances. As such, actual results could differ from these estimates.
F-11
Table of Contents
PAYCOM PAYROLL HOLDINGS, LLC AND SUBSIDIARIES
NOTES TO CONSOLIDATED FINANCIAL STATEMENTS
DECEMBER 31, 2013, 2012 AND 2011
(IN THOUSANDS, EXCEPT PER UNIT AMOUNTS)
Segment Information
We operate in a single operating segment and a single reporting segment. Operating segments are defined as components of an enterprise about which separate financial information is evaluated regularly by the chief operating decision maker in deciding how to allocate resources and assessing performance. Our chief operating decision maker allocates resources and assesses performance based upon financial information at the consolidated level. Since we operate in one operating segment, all required financial segment information is presented in the consolidated financial statements.
Pro Forma Information (Unaudited)
In anticipation of an initial public offering (“IPO”), Software consummated the reorganization as of January 1, 2014 as described under Note 12 (the “2014 Reorganization”). The unaudited pro forma consolidated balance sheet and pro forma basic and diluted net income per share of common stock are not inclusive of all entities described under Note 12 to be reflected in the 2014 Reorganization as those entities are not reflected in our historical financial statements. The unaudited pro forma consolidated balance sheet is based upon the historical consolidated balance sheet as adjusted to reflect:
| • | Adjustments to deferred income tax assets and liabilities as a result of recognizing related deferred tax assets and liabilities assuming that the 2014 Reorganization occurred on December 31, 2013. |
| • | The conversion of common units and Series A Preferred Units to common stock. The amount was estimated given that the Members’ Capital balance ceased to exist upon the 2014 Reorganization. |
| • | The assumption of the 14% note due 2017 which replaced the Series C Preferred Units in connection with the 2014 Reorganization. |
| • | The reclassification of historic accumulated deficit to additional paid in capital due to the 2014 Reorganization. |
Cash and Cash Equivalents
We consider all highly liquid debt instruments purchased with a maturity of three months or less and money market mutual funds to be cash equivalents. We maintain cash and cash equivalents in bank deposit accounts and money market funds, which may not be federally insured. The fair value of our cash and cash equivalents approximates carrying value. As of December 31, 2013 and 2012, all amounts were held in deposit on demand. We have not experienced any losses in such accounts and do not believe there is exposure to any significant credit risk on such accounts.
Restricted Cash
Restricted cash in our consolidated balance sheets primarily consists of cash held in restricted accounts due to requirements under an existing office building lease and our corporate building loan agreements. As of December 31, 2013 and 2012, we had restricted cash of $369 and $368, respectively.
Accounts Receivable
We generally collect revenue from our customers via automatic deduction from clients’ bank accounts at the time processing occurs. Accounts receivable on our consolidated balance sheets consists primarily of revenue fees related to the last day of the period, which are collected on the following business day. Because
F-12
Table of Contents
PAYCOM PAYROLL HOLDINGS, LLC AND SUBSIDIARIES
NOTES TO CONSOLIDATED FINANCIAL STATEMENTS
DECEMBER 31, 2013, 2012 AND 2011
(IN THOUSANDS, EXCEPT PER UNIT AMOUNTS)
accounts receivable are collected via automatic deduction on the following business day, the Company has not recorded an allowance for doubtful accounts.
Deferred offering costs
Deferred offering costs represent legal, accounting and other direct costs related to our efforts to raise capital through an IPO. Future costs related to IPO activities will be deferred until the completion of the IPO, at which time they will be offset against the IPO proceeds. In the event that we terminate our plan for an IPO, any deferred offering costs would be expensed at that time.
As of December 31, 2013, we had capitalized $647 associated with IPO activities and included such amount in prepaid expenses on the consolidated balance sheets. There were no deferred offering costs capitalized as of December 31, 2012.
Inventory
Our inventory consists of five types of time clocks sold to clients as part of our time and attendance services and are stated at the lower of cost or market. Cost is determined using the FIFO cost method.
Time clocks are purchased as finished goods from a third party and as such we do not have any inventory classified as raw materials or work in process inventory. Rental clocks issued to clients under month-to-month operating leases are classified as property, plant, and equipment. We retain inventory in certain lines primarily as replacements for those clients who use the various clocks and have determined that no write-downs for obsolete items was required based on inventory turnover and our historical experience during the years ended December 31, 2013, 2012 and 2011.
Property, Plant and Equipment
Property, plant and equipment is stated at cost, net of accumulated depreciation. Depreciation is determined using the straight line method over the estimated useful lives of the assets as follows:
| Office equipment and furniture & fixtures |
5 years | |||
| Computer equipment and software |
3 years | |||
| Buildings |
30 years | |||
| Leasehold improvements |
3 years | |||
| Rental clocks |
5 years | |||
| Vehicles |
3 years |
Our leasehold improvements are depreciated over the shorter of their estimated useful lives or the related lease terms. Costs incurred during construction of long-lived assets are recorded as construction in progress and are not depreciated until the asset is placed in service.
We capitalize interest incurred related to construction in progress. For the years ended December 31, 2013, 2012 and 2011, we incurred interest costs of $2,563, $2,028 and $439, respectively. For the years ended December 31, 2013, 2012 and 2011, interest expense of $95, $0 and $305, respectively, was capitalized.
Internal Use Software
Expenditures for major software purchases and software developed or obtained for internal use are capitalized and amortized over a three-year period on a straight-line basis. Capitalized costs include external
F-13
Table of Contents
PAYCOM PAYROLL HOLDINGS, LLC AND SUBSIDIARIES
NOTES TO CONSOLIDATED FINANCIAL STATEMENTS
DECEMBER 31, 2013, 2012 AND 2011
(IN THOUSANDS, EXCEPT PER UNIT AMOUNTS)
direct costs of materials and services associated with developing or obtaining internal use computer software and certain payroll and payroll-related costs for employees who are directly associated with internal use computer software projects. The amount of payroll costs that are capitalized with respect to these employees is limited to the time directly spent on such projects. Costs associated with preliminary project stage activities, training, maintenance and all other post-implementation stage activities are expensed as incurred. We also expense internal costs related to minor upgrades and enhancements, as it is impractical to separate these costs from normal maintenance activities.
The total capitalized payroll costs related to internal use computer software projects was $1,221 and $585 as of December 31, 2013 and 2012, respectively which have been included in property, plant and equipment. Amortization expense related to capitalized software costs of $647, $429 and $436 was charged to expense for the years ended December 31, 2013, 2012 and 2011, respectively.
Goodwill and Other Intangible Assets
Goodwill is not amortized, but is instead tested for impairment annually, or earlier if, at the reporting unit level, an indicator of impairment arises. The estimates and assumptions about future results of operations and cash flows made in connection with the impairment testing could differ from future actual results of operations and cash flows. If impairment exists, a write-down to fair value (normally measured by discounting estimated future cash flows) is recorded. Our business is largely homogeneous and, as a result, goodwill is associated with one reporting unit. We have selected June 30 as our annual goodwill impairment testing date and determined there was no impairment as of June 30, 2013. For the years ended December 31, 2013, 2012 and 2011, there were no indicators of impairment. Intangible assets with finite lives are amortized on a straight-line basis over their estimated useful lives.
Impairment of Long-Lived Assets
Long-lived assets, including intangible assets with finite lives, are reviewed for impairment when events or changes in circumstances indicate that the carrying amount of an asset may not be recoverable. Recoverability of assets to be held and used is measured by a comparison of the carrying amount of an asset to estimated undiscounted future cash flows expected to be generated by the asset. If the carrying amount of an asset exceeds its estimated future cash flows, an impairment charge is recognized for the amount by which the carrying amount of the asset exceeds the estimated fair value of the asset. We have determined that there was no impairment of long-lived assets for the years ended December 31, 2013, 2012 or 2011.
Funds Held for Clients and Client Funds Obligation
As part of our payroll and tax filing application, we collect funds for federal, state and local employment taxes from clients, handle applicable regulatory tax filings, correspondence and amendments, remit the funds to appropriate tax agencies, and handle other employer-related services. Amounts collected by us from clients for their federal, state and local employment taxes earn interest during the interval between receipt and disbursement, as we invest these funds in money market funds and certificates of deposit. The interest earned from these investments is included in the consolidated statements of income as other income, net. These investments are shown in the consolidated balance sheets as funds held for clients, and the offsetting liability for the tax filings is shown as client funds obligation.
As of December 31, 2013 and 2012, the funds held for clients were invested in demand deposits, short-term certificates of deposit and money market funds.
F-14
Table of Contents
PAYCOM PAYROLL HOLDINGS, LLC AND SUBSIDIARIES
NOTES TO CONSOLIDATED FINANCIAL STATEMENTS
DECEMBER 31, 2013, 2012 AND 2011
(IN THOUSANDS, EXCEPT PER UNIT AMOUNTS)
Revenue Recognition
Our total revenue is comprised of recurring revenues and implementation and other revenues. We recognize revenue in accordance with accounting standards for software and service companies when all of the following criteria have been met:
| • | There is persuasive evidence of an arrangement; |
| • | The service has been or is being provided to the customer; |
| • | Collection of the fees is reasonably assured; and |
| • | The amount of fees to be paid by the customer is fixed or determinable |
Recurring
Recurring revenues are derived primarily from our talent acquisition, time and labor management, payroll, talent management and human resources applications. Talent acquisition includes application tracking, employment and background checks, on/off-boarding, e-verify and tax credit services. Time and labor management includes time and attendance, scheduling, time-off requests, labor allocation and labor management reports. Payroll includes payroll and tax management, paycom pay, expense management and garnishment management. Talent management includes employee self-service, compensation budgeting, performance management and executive dashboard. Human resources management includes document management, government and compliance, benefits and COBRA administration and personnel action forms.
The services related to recurring revenues are rendered during each client’s payroll period, with the agreed-upon fee being charged and collected as part of our processing of the client’s payroll. Recurring revenues are recognized at the conclusion of processing of each client’s payroll-period, when each respective payroll client is billed. Collectability is reasonably assured as the fees are collected through an Automated Clearing House (“ACH”) as part of the client’s payroll cycle or through direct wire transfer, which minimizes the default risk.
Implementation and other
Implementation and other revenues represent non-refundable conversion fees which are charged to new clients to offset the expense of new client set-up and revenue from the sale of time clocks as part of our employee time and attendance services. Because these conversion fees and sale of time clocks relate to our recurring revenue, we have evaluated such arrangements under the accounting guidance that governs multiple element arrangements.
For arrangements with multiple elements, we evaluate whether each element represents a separate unit of accounting. In order to treat deliverables in a multiple element arrangement as separate units of accounting, the deliverables must have standalone value upon delivery. If the deliverables have stand-alone value upon delivery, we account for each deliverable separately and revenue is recognized for the respective deliverables as they are delivered. If one or more of the deliverables does not have stand-alone value upon delivery, the deliverables that do not have stand-alone value are generally combined with the final deliverable within the arrangement and treated as a single unit of accounting.
When multiple deliverables included in an arrangement are separable into different units of accounting, the arrangement consideration is allocated to the identified separate units of accounting based on their relative selling price. Multiple deliverable arrangements accounting guidance provides a hierarchy to use when
F-15
Table of Contents
PAYCOM PAYROLL HOLDINGS, LLC AND SUBSIDIARIES
NOTES TO CONSOLIDATED FINANCIAL STATEMENTS
DECEMBER 31, 2013, 2012 AND 2011
(IN THOUSANDS, EXCEPT PER UNIT AMOUNTS)
determining the relative selling price for each unit of accounting. Vendor-specific objective evidence (“VSOE”) of selling price, based on the price at which the item is regularly sold by the vendor on a stand-alone basis, should be used if it exists. If VSOE of selling price is not available, third-party evidence (“TPE”) of selling price is used to establish the selling price if it exists, and if not it would be based on our best estimate of selling price.
For the years ended December 31, 2013, 2012 and 2011, we have determined that there is no stand-alone value associated with the upfront conversion fees as they do not have value to our clients on a stand-alone basis nor are they offered as an individual service; therefore, the conversion fees are deferred and recognized ratably over the estimated life of our clients, which we have estimated to be ten years.
For the years ended December 31, 2013, 2012, and 2011, we have determined that the revenues from the employee time and attendance services, and the revenues from the sale of time clocks as part of our time and attendance services, have VSOE of selling price as they are sold on a stand-alone basis. Revenue is therefore recognized for the respective deliverables as they are delivered.
Cost of Revenues
Our costs and expenses applicable to total revenues represent total operating expenses and systems support and technology costs, including labor and related expenses, bank fees, shipping fees and costs of paper stock, envelopes, etc. In addition, costs included to derive gross margins are comprised of support labor and related expenses, related hardware costs and applicable depreciation costs.
Advertising Costs
Advertising costs are expensed the first time that advertising takes place. Advertising expense for the years ended December 31, 2013, 2012 and 2011 was $3,375, $2,309 and $1,674, respectively.
Sales Taxes
We collect and remit sales tax on sales of time and attendance clocks and on payroll services in certain states. These taxes are shown on a net basis, and as such, excluded from revenue. For the years ended December 31, 2013, 2012 and 2011, sales taxes paid were $2,194, $1,604 and $1,092, respectively.
Employee Incentive Units
All incentive unit awards to employees are recognized pro rata over the respective vesting period as compensation costs in the consolidated statements of income based on their fair values measured as of the date of grant.
Income Taxes
We operate as a limited liability company (“LLC”). An LLC combines a corporation’s protection from personal liability for business debts along with the pass-through tax structure of a partnership or sole proprietorship. Business income passes through the business to the LLC members, who report their share of profits or losses on their individual income tax returns. Accordingly, no provision for income taxes is reflected in our consolidated financial statements. Our tax returns are subject to examination by federal and state taxing authorities. If such examinations result in adjustments to the income amounts, the amounts allocated to the LLC members could be adjusted accordingly.
F-16
Table of Contents
PAYCOM PAYROLL HOLDINGS, LLC AND SUBSIDIARIES
NOTES TO CONSOLIDATED FINANCIAL STATEMENTS
DECEMBER 31, 2013, 2012 AND 2011
(IN THOUSANDS, EXCEPT PER UNIT AMOUNTS)
We file income tax returns in the U.S. and various state jurisdictions. We evaluate tax positions taken or expected to be taken in the course of preparing our tax returns and disallow the recognition of tax positions not deemed to meet a “more-likely-than-not” threshold of being sustained by the applicable tax authority. We do not believe there are any tax positions taken within the consolidated financial statements that would not meet this threshold. Our policy is to record interest and penalties, if any, related to uncertain tax positions as a component of general and administrative expenses. We are currently undergoing a sales tax audit in a certain jurisdiction and are not aware of any other potential examinations as of December 31, 2013. However, the tax years 2010 through 2013 remain open to examination for federal income tax purposes and by the other major taxing jurisdictions.
Recently Adopted and Issued Accounting Pronouncements
In February 2013, the Financial Accounting Standards Board (“FASB”) issued authoritative guidance which adds new disclosure requirements for items reclassified out of Accumulated Other Comprehensive Income (“AOCI”). The update requires that an entity present either in a single note or parenthetically on the face of the financial statements, the effect of significant amounts reclassified from each component of AOCI based on its source and the income statement line items affected by the reclassification. The amendment is effective for fiscal years and interim periods beginning on after December 15, 2012. We adopted this new guidance for the year ended December 31, 2013, which did not have a material impact on our consolidated financial statements.
In February 2013, the FASB issued authoritative guidance, which added new disclosure requirements to measure obligations resulting from joint and several liability arrangement for which the total amount of the obligation within the scope of this guidance is fixed at the reporting date and disclose the arrangements and the total outstanding amount of obligation for all joint parties. These disclosures are in addition to existing related party disclosure requirements. The amendment is effective for fiscal years and interim periods beginning after December 15, 2013 and we do not expect the adoption of such guidance to have a material impact on our consolidated financial statements.
| 3. | PROPERTY, PLANT AND EQUIPMENT |
Property, plant and equipment and accumulated depreciation are as follows:
| December 31, | ||||||||
| 2013 | 2012 | |||||||
| Property, plant and equipment |
||||||||
| Furniture, fixtures and office equipment |
$ | 3,189 | $ | 2,887 | ||||
| Computer equipment |
4,832 | 3,498 | ||||||
| Software and capitalized software costs |
5,578 | 3,588 | ||||||
| Rental clocks |
4,865 | 3,480 | ||||||
| Vehicles |
421 | 468 | ||||||
| Buildings |
14,828 | 14,828 | ||||||
| Leasehold improvements |
135 | 135 | ||||||
|
|
|
|
|
|||||
| 33,848 | 28,884 | |||||||
| Less: accumulated depreciation |
(11,540 | ) | (8,015 | ) | ||||
|
|
|
|
|
|||||
| 22,308 | 20,869 | |||||||
| Land |
8,993 | 4,205 | ||||||
| Construction in process |
7,370 | 65 | ||||||
|
|
|
|
|
|||||
| Property, plant and equipment, net |
$ | 38,671 | $ | 25,139 | ||||
|
|
|
|
|
|||||
F-17
Table of Contents
PAYCOM PAYROLL HOLDINGS, LLC AND SUBSIDIARIES
NOTES TO CONSOLIDATED FINANCIAL STATEMENTS
DECEMBER 31, 2013, 2012 AND 2011
(IN THOUSANDS, EXCEPT PER UNIT AMOUNTS)
Rental clocks included in property, plant and equipment, net represent time clocks issued to clients under month-to-month operating leases. As such, these items are transferred from inventory to fixed assets and depreciated over their estimated useful lives.
In October 2012, we began the initial phase on construction of a second building/processing center at our headquarters. Estimated completion of the building is April 2014, and is financed with our funds, along with a construction note convertible to long-term notes payable, upon completion of the construction.
In November 2013 and December 2012, we purchased approximately 18.3 acres and 17.6 acres of land, respectively, from a related party for future expansion at our headquarters for total costs of $4,788 and $2,324, respectively. For more information see Note 10—“Related Party Transactions.”
Depreciation expense for property, plant and equipment, net was $3,873, $3,093 and $2,046 for the years ended December 31, 2013, 2012 and 2011, respectively.
| 4. | GOODWILL AND INTANGIBLE ASSETS, NET |
We had goodwill of $51,889 as of December 31, 2013 and 2012. We performed the required impairment tests of goodwill for the years ended December 31, 2013, 2012 and 2011 and determined there was no impairment for each of those years then ended.
All of the intangible assets are considered to have finite lives and, as such, are subject to amortization. The components of intangible assets are as follows:
| December 31, 2013 | ||||||||||||||||
| Weighted Avg. Remaining Useful Life |
Gross | Accumulated Amortization |
Net | |||||||||||||
| (Years) | ||||||||||||||||
| Intangibles: |
||||||||||||||||
| Customer relationships |
3.5 | $ | 13,997 | $ | (9,098 | ) | $ | 4,899 | ||||||||
| Trade name |
8.5 | 3,194 | (1,384 | ) | 1,810 | |||||||||||
|
|
|
|
|
|
|
|||||||||||
| Total |
$ | 17,191 | $ | (10,482 | ) | $ | 6,709 | |||||||||
|
|
|
|
|
|
|
|||||||||||
| December 31, 2012 | ||||||||||||||||
| Weighted Avg. Remaining Useful Life |
Gross | Accumulated Amortization |
Net | |||||||||||||
| (Years) | ||||||||||||||||
| Intangibles: |
||||||||||||||||
| Customer relationships |
4.5 | $ | 13,997 | $ | (7,699 | ) | $ | 6,298 | ||||||||
| Trade name |
9.5 | 3,194 | (1,171 | ) | 2,023 | |||||||||||
|
|
|
|
|
|
|
|||||||||||
| Total |
$ | 17,191 | $ | (8,870 | ) | $ | 8,321 | |||||||||
|
|
|
|
|
|
|
|||||||||||
The weighted average remaining useful life of the intangible assets was 4.85 years as of December 31, 2013. Amortization of intangible assets for the years ended December 31, 2013, 2012 and 2011 totaled $1,613, $2,414 and $3,216, respectively.
F-18
Table of Contents
PAYCOM PAYROLL HOLDINGS, LLC AND SUBSIDIARIES
NOTES TO CONSOLIDATED FINANCIAL STATEMENTS
DECEMBER 31, 2013, 2012 AND 2011
(IN THOUSANDS, EXCEPT PER UNIT AMOUNTS)
Estimated amortization expense for our existing intangible assets for the next five years and thereafter is as follows:
| Year Ending |
Amortization | |||
| 2014 |
$ | 1,613 | ||
| 2015 |
1,613 | |||
| 2016 |
1,613 | |||
| 2017 |
913 | |||
| 2018 |
213 | |||
| Thereafter |
744 | |||
|
|
|
|||
| $ | 6,709 | |||
|
|
|
|||
| 5. | LONG-TERM DEBT |
Our long-term debt consists of the following:
| December 31, | ||||||||
| 2013 | 2012 | |||||||
| $12,761 term note to bank due December 15, 2018(1)(4) |
$ | 11,963 | $ | 12,360 | ||||
| Land note to bank(2)(4) |
— | 1,750 | ||||||
| Construction note to bank(3)(4) |
9,127 | — | ||||||
| $18,807 note to related party due April 3, 2022(5) |
18,807 | 18,807 | ||||||
| Less: Unamortized debt discounts |
(4,125 | ) | (4,367 | ) | ||||
|
|
|
|
|
|||||
| Total long-term debt (including current portion) |
35,772 | 28,550 | ||||||
| Less: Current portion |
(9,545 | ) | (2,151 | ) | ||||
|
|
|
|
|
|||||
| Total long-term debt, net |
$ | 26,227 | $ | 26,399 | ||||
|
|
|
|
|
|||||
| (1) | In December 2011, we consolidated pre-existing construction loans for the construction of a new corporate headquarters/processing center and gymnasium into a term note. As of December 31, 2013 and 2012, we had a term note with an outstanding principal amount of $11,963 and $12,360, respectively, from Kirkpatrick Bank, due December 15, 2018 (the “2011 Consolidated Loan”). Under the 2011 Consolidated Loan, principal and interest is payable monthly based on a 20 year amortization at an annual rate of 5.0%. The 2011 Consolidated Loan is collateralized by a first mortgage covering our corporate headquarters and is secured by a first lien security interest in certain personal property relating to our corporate headquarters. |
| (2) | In December 2012, we entered into a loan agreement for the purchase of approximately 17.6 acres for future expansion at our headquarters. As of December 31, 2012, the loan agreement had an outstanding principal amount of $1,750 from Kirkpatrick Bank, due April 21, 2013 (the “December 2012 Loan”). Under the December 2012 Loan, interest accrues monthly at the Wall Street Journal U.S. Prime Rate plus 0.5%, adjusted from time to time, but not more often than each day, on the 21st day of each month. As of December 31, 2012, this equated to a rate of 3.25%. Principal on the note was due in one payment on the maturity date, collateralized by a first mortgage covering our corporate headquarters and a first security interest in certain personal property relating to our corporate headquarters. The December 2012 Loan was paid in full during the year ended December 31, 2013 with an advance from the construction loan entered into on March 2013, which is described below. |
F-19
Table of Contents
PAYCOM PAYROLL HOLDINGS, LLC AND SUBSIDIARIES
NOTES TO CONSOLIDATED FINANCIAL STATEMENTS
DECEMBER 31, 2013, 2012 AND 2011
(IN THOUSANDS, EXCEPT PER UNIT AMOUNTS)
| (3) | In March 2013, we entered into a construction loan agreement for the construction of a second building at our corporate headquarters with Kirkpatrick Bank due May 1, 2015, which allowed for a maximum principal amount of $12,271 (the “2013 Construction Loan”). Under the terms of the 2013 Construction Loan, the loan will be converted to long-term notes payable at the “Term Loan Commencement Date.” The “Term Loan Commencement Date” is defined as the first day of the first month after all of the following requirements are completed to the satisfaction of the lender: (i) the construction project has been substantially completed; (ii) we have delivered to the lender a final “as-built” survey of the mortgaged property, acceptable to the lender; (iii) we have delivered all necessary and required insurance covering the mortgaged property, acceptable to the lender; (iv) we have delivered the certificates of occupancy for the premises; and (v) we have accepted the building. Outstanding amounts under the 2013 Construction Loan are secured by a first mortgage covering all of the second headquarters building and a first lien security interest in certain personal property relating to the second headquarters building. Under the 2013 Construction Loan, interest accrues monthly at the Wall Street Journal U.S. Prime Rate plus 0.5%, adjusted monthly, subject to a minimum interest rate of 4.0% per annum. Interest on the 2013 Construction Loan will be paid monthly on the first day of each month. Estimated completion of the building is July 2014. During the year ended December 31, 2013, a portion of the advancement was drawn to repay the December 2012 Loan. |
In November 2013, we entered into a loan agreement for the purchase of approximately 18.3 acres for future expansion at our headquarters with Kirkpatrick Bank, which allowed for a maximum principal amount of $3,000 (“2013 Land Loan”). Under the 2013 Land Loan, interest accrues monthly at the Wall Street Journal U.S. Prime Rate plus 0.5%, adjusted monthly, subject to a minimum interest rate of 4% per annum. Principal and interest on the 2013 Land Loan is due on February 1, 2014.
In December 2013, we consolidated the 2013 Construction Loan and the 2013 Land Loan (“2013 Consolidated Loan”) under a modification agreement whereby the combined maximum principal amount was increased to $14,631. The 2013 Consolidated Loan is collateralized by security interests in the construction mortgage, land mortgage and assignment of leases in property relating to the second building at our corporate headquarters. Under the 2013 Consolidated Loan, interest accrues monthly at the Wall Street Journal U.S. Prime rate plus 0.5%, adjusted monthly subject to a minimum interest rate of 4.0% per annum. As of December 31, 2013, the 2013 Consolidated Loan had an outstanding principal amount of $9,127 and availability of $5,504 for future construction from Kirkpatrick Bank.
| (4) | The 2013 Consolidated Loan, December 2012 Loan, and 2011 Consolidated Loan are subject to certain financial covenants, as defined in the agreements, including, maintaining a debt coverage ratio of indebtedness (defined as current maturities of long-term debt, interest expense and distributions) to EBITDA of less than 1.5 to 1.0. As of December 31, 2013 and 2012, we were not in compliance with one of the financial covenants, related to the debt service ratio. This was due to the December 2012 Loan and the 2013 Consolidated Loan being included in the calculation of the debt service ratio. We obtained a letter of waiver from the lender that excludes these items from the calculation as of December 31, 2013 and 2012, which remains in effect through January 15, 2015. |
| (5) | In connection with the April 2012 Corporate Reorganization, we entered into a 10% Senior Note due 2022 with WCAS Capital Partners IV, L.P., a related party (the “2022 Note”). The 2022 Note is due on April 3, 2022 and interest is payable at an annual rate of 10%, payable semiannually in arrears on December 31 and June 30 of each year. We may, at our option, choose to defer all or a portion of the accrued interest on the notes that is due and payable on any payment date, provided that such amount of accrued interest shall be multiplied by 1.3 and added to the principal amount of the notes on such interest payment date (with the result that such interest shall have accrued at an effective rate of 13.0% |
F-20
Table of Contents
PAYCOM PAYROLL HOLDINGS, LLC AND SUBSIDIARIES
NOTES TO CONSOLIDATED FINANCIAL STATEMENTS
DECEMBER 31, 2013, 2012 AND 2011
(IN THOUSANDS, EXCEPT PER UNIT AMOUNTS)
| instead of 10.0% through such payment date). As of December 31, 2013 and 2012, such option has not been elected and all interest has been paid in cash. |
The note was issued at a discount of $2,409. We are amortizing the discount over the term of the note using the effective interest method. The note also contains certain features by which the holder, WCAS Capital Partners IV, L.P., may force redemption at principal amount plus any accrued interest upon our completion of a public offering or certain events of default. The note also provides for mandatory redemption upon a liquidation event. These features (collectively, the “Prepayment Features”) were determined to meet the definition of a derivative required to be bifurcated and separately accounted for at fair value with changes in fair value recorded in earnings. At inception, the Prepayment Features were valued at $2,100 and recorded as a derivative liability, which is re-measured to determine its fair value as of each reporting date.
The total unamortized discount related to this note was $4,125 and $4,367 as of December 31, 2013 and 2012, respectively.
As of December 31, 2013, the carrying value and fair value of our total long-term debt, including current portion were $35,772 and $38,667, respectively. As of December 31, 2012, the carrying value and fair value of our total long-term debt, including current portion were $28,550 and $29,697. The fair value of variable rate long-term debt approximates market value because the cost of borrowing fluctuates based upon market conditions. The fair value of fixed rate long-term debt is estimated based on the borrowing rates currently available to us for bank loans with similar terms and maturities.
Aggregate future maturities of long-term debt for the next five years and thereafter (including current portion) as of December 31, 2013 are as follows:
|
Year Ending December 31, |
||||
| 2014 |
$ | 9,545 | ||
| 2015 |
440 | |||
| 2016 |
461 | |||
| 2017 |
486 | |||
| 2018 |
10,158 | |||
| Thereafter |
14,682 | |||
|
|
|
|||
| $ | 35,772 | |||
|
|
|
|||
| 6. | EMPLOYEE SAVINGS PLAN |
Under our 401(k) plan, employees are eligible to participate when they have attained the age of 21 and have completed 90 days of service. We have made a safe-harbor election whereby it makes a Qualified Automatic Contribution Arrangement (“QACA”) matching contribution equal to 100% of the first 1% of salary deferrals and 50% of deferrals between 2% and 6%, up to a maximum of 3.5% of salary each plan year. We are allowed to make additional discretionary matching contributions and discretionary profit sharing contributions. Employees are 100% vested in amounts attributable to salary deferrals and rollover contributions. The QACA matching contributions will be 100% vested after two full years of employment from hire date. If an employee terminates prior to completing two full years of employment, they will be 0% vested in these contributions. The discretionary contributions are vested over a six year period. Matching contributions amounted to $1,242, $985 and $702 for the years ended December 31, 2013, 2012 and 2011, respectively.
F-21
Table of Contents
PAYCOM PAYROLL HOLDINGS, LLC AND SUBSIDIARIES
NOTES TO CONSOLIDATED FINANCIAL STATEMENTS
DECEMBER 31, 2013, 2012 AND 2011
(IN THOUSANDS, EXCEPT PER UNIT AMOUNTS)
| 7. | FAIR VALUE OF FINANCIAL INSTRUMENTS |
Our financial instruments consist primarily of cash and cash equivalents, accounts receivable, accounts payable, funds held for clients, client fund obligations, long-term debt and derivative liability. The carrying amount of cash and cash equivalents, accounts receivable, accounts payable, funds held for clients and client fund obligations approximates fair value because of the short-term nature of the instruments.
We measure certain financial assets and liabilities at fair value at each reporting period. Fair value is a market-based measurement that should be determined based on assumptions that market participants would use in pricing an asset or liability. A financial instrument’s classification within the fair value hierarchy is based upon the lowest level of input that is significant to the fair value measurement. Three levels of inputs may be used to measure fair value are as follow:
Level 1—Unadjusted observable inputs that reflect quoted prices in active markets
Level 2—Input other than quoted prices in active markets that are directly or indirectly observable
Level 3—Unobservable inputs that are supported by little or no market activity
We use observable data, when available. During the years ended December 31, 2013, 2012 and 2011, we did not have any transfers between level 1, 2 or 3 in the three-tier fair value hierarchy.
The following tables provide a summary of the fair value of financial instruments that are measured on a recurring basis using the above input categories:
| December 31, 2013 | ||||||||||||||||
| Level 1 | Level 2 | Level 3 | Total | |||||||||||||
| Liabilities |
||||||||||||||||
| Derivative |
$ | — | $ | — | $ | 1,107 | $ | 1,107 | ||||||||
|
|
|
|
|
|
|
|
|
|||||||||
| $ | — | $ | — | $ | 1,107 | $ | 1,107 | |||||||||
|
|
|
|
|
|
|
|
|
|||||||||
| December 31, 2012 | ||||||||||||||||
| Level 1 | Level 2 | Level 3 | Total | |||||||||||||
| Liabilities |
||||||||||||||||
| Derivative |
$ | 1,767 | $ | 1,767 | ||||||||||||
|
|
|
|
|
|
|
|
|
|||||||||
| $ | — | $ | — | $ | 1,767 | $ | 1,767 | |||||||||
|
|
|
|
|
|
|
|
|
|||||||||
The derivative liability related to long-term debt to related party is classified as a Level 3 derivative due to valuation based upon significant unobservable inputs.
The key inputs used to calculate the fair value of the embedded derivative are: probability of exit, remaining term, yield volatility, credit spread, and risk-free rate. In general, increases in the probability of exit, credit spread, and risk-free rate would increase the value of the embedded derivative. Conversely, increases in the remaining term and yield volatility would decrease the value of the embedded derivative.
F-22
Table of Contents
PAYCOM PAYROLL HOLDINGS, LLC AND SUBSIDIARIES
NOTES TO CONSOLIDATED FINANCIAL STATEMENTS
DECEMBER 31, 2013, 2012 AND 2011
(IN THOUSANDS, EXCEPT PER UNIT AMOUNTS)
Quantitative information regarding significant unobservable inputs used for recurring Level 3 fair value measurements of financial instruments as of December 31, 2013 and 2012 were as follows:
| December 31, 2013 | ||||||||
| Valuation Technique | Key Inputs | Range | ||||||
| Derivative Liability |
Lattice Model | Probability of exit | 90% | |||||
| Remaining term | 0.8 years - 8.3 years | |||||||
| Yield Volatility | 21.4% - 31.1% | |||||||
| Credit Spread | 8.90% | |||||||
| Risk-free rate | 0.13% - 2.45% | |||||||
| December 31, 2012 | ||||||||
| Valuation Technique | Key Inputs | Range | ||||||
| Derivative Liability |
Lattice Model | Probability of exit | 90% | |||||
| Remaining term | 3.3 years - 9.3 years | |||||||
| Yield Volatility | 20.4% - 28.5% | |||||||
| Credit Spread | 11.94% | |||||||
| Risk-free rate | 0.36% - 1.78% | |||||||
The following table summarizes the change in fair value of our Level 3 financial instruments for the years ended December 31, 2013 and 2012.
| 2013 | 2012 | |||||||
| Balance, beginning of year |
$ | 1,767 | $ | — | ||||
| Issuances |
— | 2,100 | ||||||
| Change in fair value of derivative liability |
(660 | ) | (333 | ) | ||||
|
|
|
|
|
|||||
| Balance, end of year |
$ | 1,107 | $ | 1,767 | ||||
|
|
|
|
|
|||||
Total change in fair value of derivative liability recognized as other income, net in the consolidated statements of income was $660 and $333 for the years ended December 31, 2013 and 2012, respectively. There was no change in fair value of derivative liability recognized during the year ended December 31, 2011.
| 8. | EARNINGS PER UNIT AND PRO FORMA NET INCOME PER SHARE |
Earnings per unit
Earnings per unit (“EPU”) are based on the weighted average number of Series A Preferred Units and common units for the period. Diluted EPU is computed in a similar manner to basic EPU after assuming issuance of common units for all potentially dilutive common units whether or not they are exercisable. Series A Preferred Units and common units have been combined as a single class for purposes of basic and diluted EPU as Series A Preferred Units and common units contain the same rights and preferences.
F-23
Table of Contents
PAYCOM PAYROLL HOLDINGS, LLC AND SUBSIDIARIES
NOTES TO CONSOLIDATED FINANCIAL STATEMENTS
DECEMBER 31, 2013, 2012 AND 2011
(IN THOUSANDS, EXCEPT PER UNIT AMOUNTS)
The following is a reconciliation of net income (loss) available to Series A Preferred and common unitholders, and the units used in the computation of basic and diluted net earnings (loss) per unit:
| Year Ended December 31, | ||||||||||||
| 2013 | 2012 | 2011 | ||||||||||
| Basic earnings (loss) per unit: |
||||||||||||
| Net income |
$ | 7,711 | $ | 4,238 | $ | 1,430 | ||||||
| Less: Distribution to Series C Preferred Unitholder |
(6,467 | ) | (4,806 | ) | — | |||||||
|
|
|
|
|
|
|
|||||||
| Net income (loss) available to Series A Preferred Unitholders and common unitholders |
1,244 | (568 | ) | 1,430 | ||||||||
| Weighted-average common units outstanding |
955,983 | 948,181 | 935,750 | |||||||||
|
|
|
|
|
|
|
|||||||
| Basic earnings (loss) per unit |
$ | 1.30 | $ | (0.60 | ) | $ | 1.53 | |||||
|
|
|
|
|
|
|
|||||||
| Diluted earnings (loss) per unit: |
||||||||||||
| Net income (loss) available to Series A Preferred Unitholders and common unitholders |
$ | 1,244 | $ | (568 | ) | $ | 1,430 | |||||
| Weighted-average common units outstanding |
955,983 | 948,181 | 935,750 | |||||||||
| Dilutive effect of Incentive Units |
62,322 | 56,255 | 24,861 | |||||||||
|
|
|
|
|
|
|
|||||||
| Total weighted-average common units outstanding, assuming dilution |
1,018,305 | 1,004,436 | 960,611 | |||||||||
|
|
|
|
|
|
|
|||||||
| Diluted earnings (loss) per unit |
$ | 1.22 | $ | (0.57 | ) | $ | 1.49 | |||||
|
|
|
|
|
|
|
|||||||
Pro forma net income per Share (UNAUDITED)
Pro forma basic and diluted net income per share of common stock (unaudited) has been computed to give effect to the pro forma adjustments discussed below. On January 1, 2014, in anticipation of an IPO, we consummated a reorganization as described under Note 12 (the “2014 Reorganization”). Pro forma basic and diluted net income per share of common stock (unaudited) is not inclusive of all entities as described under Note 12 to be reflected in the 2014 Reorganization as those entities are not reflected in our historical financial statements.
Outstanding common units, Series B Preferred Units, and incentive units of Holdings were converted into 45,708,573 common shares and 8,121,101 restricted shares of common stock of Software at the following conversion rates:
| • | Outstanding common units, Series B Preferred Units, WCAS Holdings and CP IV Blocker were contributed to Software in exchange for, or converted into, the number of common shares determined by a ratio of common units, Series B Preferred Units and Series A Preferred Units to shares of common stock of approximately 1:47, resulting in issuance of 44,560,053 common shares. |
| • | Vested incentive units were converted to common shares and restricted shares at various conversion ratios, which ranged from approximately 1:0.2 to 1:24. Unvested incentive units were converted to restricted shares at various conversion ratios, which ranged from 1:24 to 1:47. The conversion to common shares versus restricted shares was determined based on the underlying conditions of the pre-conversion incentive units, reflecting any pre-existing vesting conditions. This resulted in issuance of 1,148,520 and 8,121,101 common shares and restricted shares, respectively. |
F-24
Table of Contents
PAYCOM PAYROLL HOLDINGS, LLC AND SUBSIDIARIES
NOTES TO CONSOLIDATED FINANCIAL STATEMENTS
DECEMBER 31, 2013, 2012 AND 2011
(IN THOUSANDS, EXCEPT PER UNIT AMOUNTS)
A reconciliation of the numerators and denominators of the pro forma basic and diluted net income per share calculations is as follows (in thousands, except per share amounts):
| Pro forma basic net income per share: |
||||
| Historical net income available to Series A Preferred Unitholders and common unitholders |
$ | 1,244 | ||
| Distribution to Series C Preferred Unitholder |
6,467 | |||
|
|
|
|||
| Historical net income |
$ | 7,711 | ||
| Income tax provision from conversion to a C-corporation(1) |
(3,007 | ) | ||
| Interest expense from 14% Note due 2017, net of tax(2) |
(3,944 | ) | ||
|
|
|
|||
| Pro forma net income available to common shareholders |
$ | 760 | ||
|
|
|
|||
| Pro forma weighted average basic shares outstanding |
47,686,326 | |||
| Pro forma basic net income per share |
$ | 0.02 | ||
|
|
|
|||
| Pro forma diluted net income per share: |
||||
| Pro forma net income available to common shareholders |
$ | 760 | ||
|
|
|
|||
| Pro forma weighted average shares outstanding |
47,686,326 | |||
| Dilutive effect of unvested restricted shares |
685,163 | |||
|
|
|
|||
| Pro forma weighted average diluted shares outstanding |
48,371,489 | |||
|
|
|
|||
| Pro forma weighted average diluted net income per share |
$ | 0.02 | ||
|
|
|
The pro forma net income applied in computing the unaudited pro forma net income per share for the year ended December 31, 2013 is based upon the Company’s historical net income as adjusted to reflect:
| (1) | Adjustment to income tax expense in connection with the deferred income tax assets and liabilities recognized, which assumed that Holdings was operating as a C-corporation. The amount was determined using an estimated statutory rate of 39%. |
| (2) | Inclusion of interest expense upon assuming 14% note with a face value of $46,193 due 2017 which accrues interest at 14% per annum (“2017 Note”). The 2017 Note replaced the Series C Preferred Units in the 2014 Reorganization. The adjustment was tax effected using an estimated statutory tax rate of 39%. |
| 9. | MEMBERS’ EQUITY AND INCENTIVE COMPENSATION |
Members’ Equity
Prior to the April 2012 Corporate Reorganization, Paycom had authorized four classes of limited liability company interests (each a “Unit”). Series A Preferred Units are voting units with first priority of distribution, which are entitled to a preferred yield (as defined within our LLC agreement) of 9% with
F-25
Table of Contents
PAYCOM PAYROLL HOLDINGS, LLC AND SUBSIDIARIES
NOTES TO CONSOLIDATED FINANCIAL STATEMENTS
DECEMBER 31, 2013, 2012 AND 2011
(IN THOUSANDS, EXCEPT PER UNIT AMOUNTS)
regard to certain future asset distributions, and conversion features. The Board of Directors authorized 700,000 Series A Preferred Units and as of December 31, 2013 and 2012, 671,839 were issued and outstanding.
Series B Preferred Units are non-voting units, of which 270 units were authorized and as of December 31, 2013 and 2012, 270 were issued and outstanding. These Series B Preferred Units are entitled to receive distributions only after certain conditions have been met. As of December 31, 2013, these conditions had not been met.
Common units are voting units with third priority of distribution. The Board of Directors authorized 285,000 common units and as of December 31, 2013 and 2012, 270,750 were issued and outstanding.
Incentive units are non-voting units reserved for issuance to our employees, officers, directors and other service providers. The Board of Directors authorized 50,000 incentive units. Upon consummation of the April 2012 Corporate Reorganization, all four classes of previously issued units of Paycom were exchanged for our units bearing identical terms. We authorized an additional 24,381 incentive units for the purpose of converting previously issued units.
In connection with the April 2012 Corporate Reorganization, Series C Preferred Units with a face value of $46,193 were issued to one of our members, and 50,000 Series C Preferred Units were authorized and 46,193 Series C Preferred Units were issued. Subsequent to the April 2012 Corporate Reorganization, the Series C Preferred Units holder has first priority to distribution and is entitled to a cumulative preferred yield of 14%. The distributions are paid semi-annually in cash and there were no distributions in arrears as of December 31, 2013 and 2012. These Series C Preferred Units are redeemable upon a deemed liquidation event, and the Series C Preferred Units holder has the ability to cause such liquidation event. Upon such deemed liquidation event, all equity holders are entitled to the same form of consideration. Upon our completion of a qualified initial public offering, the Series C Preferred Unitholders’ ability to cause a liquidation event would be eliminated.
Upon liquidation and following the distribution of the Series C Preferred Units liquidation preference of $46,193 plus any accrued but unpaid dividends, any remaining proceeds would be distributed to the holders of the Series A Preferred Units and common units on a pro rata basis. Series B Preferred Unitholders are entitled to receive distribution only after certain conditions are met.
Employee Incentive Units
2009 Incentive Units
We authorized 50,000 2009 Incentive Units (“2009 Incentive Units”) as part of the 2009 Incentive Units Plan (“2009 Plan”). We may award 2009 Incentive Units under the 2009 Plan to certain officers and employees of Paycom at the discretion of the compensation committee. The units vest 50% on the third annual anniversary of the date of issuance and 50% on the fourth annual anniversary of the date of issuance, provided there is no “Company Sale”. “Company Sale” is defined as (i) a transaction or series of transactions (including by way of merger, consolidation, or sale of the equity) the result of which is that the holders of the units immediately prior to such transaction(s), do not, after giving effect to such transaction(s), own directly or indirectly through one or more intermediaries, at least 50% of the units, (ii) a sale, transfer, conveyance or other disposition, in one or a series of related transaction, of all or substantially all of our assets determined on a consolidated basis, or (iii) the initial sale, in an underwritten public offering registered under the Securities Act of 1933, as amended, or our (or a successor corporation’s) equity securities. Any unvested units become immediately vested upon a Company Sale and would convert to
F-26
Table of Contents
PAYCOM PAYROLL HOLDINGS, LLC AND SUBSIDIARIES
NOTES TO CONSOLIDATED FINANCIAL STATEMENTS
DECEMBER 31, 2013, 2012 AND 2011
(IN THOUSANDS, EXCEPT PER UNIT AMOUNTS)
common units. In addition, all unvested units terminate upon the employee’s termination with us. We have the right, but not the obligation, to repurchase all or any portion of vested units upon termination. We authorized 24,381 units for purposes of converting previously issued units of Paycom into equivalent units of our company as previously discussed.
2012 Management Incentive Units
In connection with April 2012 Corporate Reorganization, we authorized 107,441 Management Incentive Units (“Management Incentive Units”), of which 25,953 and 57,057 were awarded to certain officers and employees of Paycom at the discretion of the Compensation Committee during the years ended December 31, 2013 and 2012, respectively. Vesting of the 2012 Management Incentive Units pool is 50% time based over five years and 50% market based. The market based vesting is based on a cash return on investment of our majority unitholder with a linear vesting scale. Vesting percentages range from 0% up to 2.0 times return on investment from grant value, up to 100% vesting at 3.5 times return on investment from grant value.
2012 CEO Incentive Units
In connection with April 2012 Corporate Reorganization, we authorized and issued 126,067 of CEO Incentive Units (“CEO Incentive Units”) during the year ended December 31, 2012. Vesting of the CEO Incentive Units is 25% time based over five years and 75% market based. The market based vesting is based on a cash return on investment of our majority unitholder with a linear vesting scale. Vesting percentage ranges from 0% up to 1.5 times return on investment from grant value, up to 100% vesting at 2.5 times return on investment from grant value.
We estimate the fair value of grants of all incentive units using a Monte Carlo simulation model. The model requires various assumptions as inputs, including expected life, volatility, risk free rate (based on U.S. Treasury rates as of the grant date), and no expected dividends. Annual volatility was estimated using the historical volatility of comparable guideline companies. We are required to estimate forfeitures and only record compensation costs for those awards that are expected to vest.
The following table presents a summary of the grant-date fair values of incentive units granted and the related assumptions:
| Year Ended December 31, | ||||||||
| 2013 | 2012 | 2011 | ||||||
| Grant-date fair value |
||||||||
| 2009 Plan |
— | $71.78 | $ | 51.16 | ||||
| 2012 Management Incentive Units |
$4.67 - $37.39 | $8.03 - $14.29 | — | |||||
| 2012 CEO Incentive Units |
— | $6.78 - $9.35 | — | |||||
| Risk-free interest rates |
0.71% - 1.41% | 0.72% | 1.74 | % | ||||
| Estimated Volatility |
50.0% | 60.0% | 60.0 | % | ||||
| Expected life (in years) |
5.0 | 5.0 | 5.0 | |||||
F-27
Table of Contents
PAYCOM PAYROLL HOLDINGS, LLC AND SUBSIDIARIES
NOTES TO CONSOLIDATED FINANCIAL STATEMENTS
DECEMBER 31, 2013, 2012 AND 2011
(IN THOUSANDS, EXCEPT PER UNIT AMOUNTS)
The following table sets forth the compensation resulting from employee incentive unit arrangements for the years ended December 31, 2013, 2012 and 2011:
| Year Ended December 31, | ||||||||||||
| 2013 | 2012 | 2011 | ||||||||||
| Operating expenses |
$ | 222 | $ | 87 | $ | 36 | ||||||
| Sales and marketing |
114 | 83 | 57 | |||||||||
| Research and development |
345 | 100 | 25 | |||||||||
| General and administrative |
253 | 233 | 47 | |||||||||
|
|
|
|
|
|
|
|||||||
| $ | 934 | $ | 503 | $ | 165 | |||||||
|
|
|
|
|
|
|
|||||||
The capitalized non-cash incentive compensation expense related to software developed for internal use of $230 and $64 was included in software and capitalized software costs in property, plant and equipment, net in our consolidated balance sheets as of December 31, 2013 and 2012, respectively.
A summary of the status of our non-vested incentive units as of December 31, 2013 and 2012, and related changes during the years ended December 31, 2013, 2012 and 2011 are presented below:
| 2009 Incentive Units | ||||||||||||||||||||||||
| 2013 | 2012 | 2011 | ||||||||||||||||||||||
| Nonvested Units |
Weighted Average Grant-Date Fair Value |
Nonvested Units |
Weighted Average Grant-Date Fair Value |
Nonvested Units |
Weighted Average Grant-Date Fair Value |
|||||||||||||||||||
| Beginning of period |
13,050 | $ | 38.35 | 25,631 | $ | 35.74 | 22,843 | $ | 33.14 | |||||||||||||||
| Awards |
— | — | — | — | 3,875 | $ | 51.16 | |||||||||||||||||
| Modifications |
— | — | 3,405 | $ | 71.78 | — | — | |||||||||||||||||
| Forfeitures |
(128 | ) | $ | 47.34 | (5,716 | ) | $ | 33.74 | (1,087 | ) | $ | 36.19 | ||||||||||||
| Vesting |
(7,981 | ) | $ | 33.22 | (10,270 | ) | $ | 45.48 | — | — | ||||||||||||||
|
|
|
|
|
|
|
|||||||||||||||||||
| End of period |
4,941 | $ | 46.40 | 13,050 | $ | 38.35 | 25,631 | $ | 35.74 | |||||||||||||||
|
|
|
|
|
|
|
|||||||||||||||||||
| 2012 Incentive Units (including CEO) | ||||||||||||||||
| 2013 | 2012 | |||||||||||||||
| Nonvested Units |
Weighted Average Grant-Date Fair Value |
Nonvested Units |
Weighted Average Grant-Date Fair Value |
|||||||||||||
| Beginning of year |
179,224 | $ | 8.53 | — | — | |||||||||||
| Awards |
25,953 | $ | 14.96 | 183,124 | $ | 8.59 | ||||||||||
| Forfeitures |
(1,275 | ) | $ | 14.17 | (3,900 | ) | $ | 11.16 | ||||||||
| Vesting |
(11,564 | ) | $ | 9.47 | — | — | ||||||||||
|
|
|
|
|
|||||||||||||
| End of year |
192,338 | $ | 9.31 | 179,224 | $ | 8.53 | ||||||||||
|
|
|
|
|
|||||||||||||
Our incentive units do not have an exercise price and therefore the intrinsic value of the units equal the fair value.
During the year ended December 31, 2013, we redeemed some of our incentive units through total cash payments of $1,061, resulting in total incremental compensation cost of $796, of which $212 has been capitalized on the date of redemptions.
F-28
Table of Contents
PAYCOM PAYROLL HOLDINGS, LLC AND SUBSIDIARIES
NOTES TO CONSOLIDATED FINANCIAL STATEMENTS
DECEMBER 31, 2013, 2012 AND 2011
(IN THOUSANDS, EXCEPT PER UNIT AMOUNTS)
During the year ended December 31, 2012, there was one modification that affected two employees. The modification amended the vesting period from the original 50% on the third and 50% on the fourth anniversaries, to immediate vesting of 100% of the units. This modification resulted in total incremental compensation costs of $129 for the year ended December 31, 2012. There were no modifications to the incentive units during the years ended December 31, 2013 or 2011.
As of December 31, 2013 and 2012, there was $1,272 and $1,338 of total unrecognized compensation costs related to nonvested incentive units issued to employees, respectively. The unrecognized compensation cost is expected to be recognized over a weighted average of 3.7 years. The fair market value of the incentive unit awards shown in the preceding table are based on our estimated enterprise value at the date of grant, with consideration given to rights and terms of such units relative to other classes of units as appropriate. There were also no units converted during the years ended December 31, 2013, 2012 and 2011.
| 10. | RELATED-PARTY TRANSACTIONS |
During the years ended December 31, 2013, 2012 and 2011, we paid Advantage Benefits Plus (“Advantage”) a total of $10, $11 and $13, respectively, for administering the Company’s employee cafeteria plan. Employee payroll deductions are sent to Advantage and we are billed monthly for an administrative fee. Advantage is owned by the spouse of our Chief Financial Officer.
In addition, during the years ended December 31, 2013, 2012 and 2011, we paid rent on our Dallas office space in the amounts of $254, $267 and $257, respectively. The Dallas office building is owned by 417 Oakbend, LP, a Texas limited partnership. Our Chief Sales Officer owns a .01% general partnership interest and a 10.49% limited partnership interest in 417 Oakbend, LP.
In November 2013 and December 2012, we purchased approximately 18.3 acres and 17.6 acres of land, respectively, for future expansion at our corporate headquarters. The land was purchased from Kilpatrick Partners, L.L.C., for a total cost of $4,788 and $2,324, respectively. The manager of Kilpatrick Partners, L.L.C. is our President and Chief Executive Officer.
In connection with the April 2012 Corporate Reorganization, we entered into the 2022 Note with WCAS Capital Partners IV, L.P., a related party as described in Note 5. The 2022 Note is due on April 3, 2022 and interest is payable at an annual rate of 10%, payable semiannually in arrears on December 31 and June 30 of each year.
At December 31, 2013 and 2012, Holdings owed $103,447 and $83,089, respectively, to Welsh, Carson, Anderson and Stowe and certain of their affiliates, representing tax distributions and travel expenses paid by Welsh, Carson, Anderson and Stowe and charged to Holdings.
We entered into a Limited Liability Company Unit Redemption Agreement, effective as of January 26, 2013, pursuant to which we purchased 2,605 incentive units from John Kerber at a purchase price of $260.21 per unit, which price was based on a third party appraisal and an internal appraisal. The incentive units were purchased from John Kerber for an aggregate purchase price of approximately $677,847. John Kerber is one of our former employees and the brother of William X. Kerber III, our Chief Information Officer.
| 11. | COMMITMENTS AND CONTINGENCIES |
In March 2010, we entered into a funding agreement with the Oklahoma City Economic Development Trust (the “Trust”), and the city of Oklahoma City. The Trust provided $1,968 as an up-front job creation payment
F-29
Table of Contents
PAYCOM PAYROLL HOLDINGS, LLC AND SUBSIDIARIES
NOTES TO CONSOLIDATED FINANCIAL STATEMENTS
DECEMBER 31, 2013, 2012 AND 2011
(IN THOUSANDS, EXCEPT PER UNIT AMOUNTS)
for the construction of certain public infrastructure improvements to our new global headquarters in northwest Oklahoma City. In exchange for the funding, we agreed to create at least 492 jobs over a five year period, with an average first year wage in excess of $37 and make a minimum capital investment in the project of at least $15,000. We further agreed that we would be responsible for repayment of any amount that was not offset by earned job creation payments. As of December 31, 2013 and 2012, we had earned $1,529 and $899, respectively. We believe that we will fulfill the obligations under the agreement within the time frame specified.
In July 2013, Dr. Lakshmi Arunachalam filed a complaint against us in the U.S. District Court for the District of Delaware alleging that Paycom infringes on U.S. Patent No. 8,244,833 assigned to her. The complaint seeks a permanent injunction, damages, and attorneys’ fees should we be found to infringe. Dr. Arunachalam has asserted similar claims in Delaware for the alleged infringement of the same patent against other payroll processing companies. Dr. Arunachalam has also accused various other entities of infringing related U.S. patents. On October 4, 2013, we filed an answer, affirmative defenses and counterclaims to the complaint. We denied all claims made against us by Dr. Arunachalam in her complaint, asserted various defenses and counterclaims for non-infringement and challenged the validity and enforceability of U.S. Patent No. 8,244,833. Dr. Arunachalam filed a reply to our counterclaim on October 28, 2013 and denied non-infringement and invalidity. We believe that this litigation is without merit and intend to vigorously defend ourselves in this matter. Due to the nature of the claims for this litigation and the uncertainties of the litigation, we are unable to provide an estimate of the potential amount of any loss related to this litigation.
We are involved in various other legal proceedings in the ordinary course of business. Although we cannot predict the outcome of these proceedings, legal matters are subject to inherent uncertainties and there exists the possibility that the ultimate resolution of these matters could have a material adverse effect on our business, financial condition, results of operations or cash flows.
Operating Leases
We lease office space under several noncancellable operating leases with contractual terms expiring 2014 to 2019. Minimum rent expenses are recognized over the lease term. Lease term is defined as the fixed noncancellable term of the lease plus all periods, if any, for which failure to renew the lease imposes a penalty on us in such amount that a renewal appears, at the inception of the lease, to be reasonably assured. When a lease contains a predetermined fixed escalation of the minimum rent, we recognize the related rent expense on a straight-line basis and record the difference between the recognized rent expense and the amount payable under the lease as a liability.
Future annual minimum lease payments under noncancellable operating leases with initial or remaining terms of one year or more at December 31, 2013 are as follows:
| Year Ending |
Operating | |||
| 2014 |
$ | 2,222 | ||
| 2015 |
2,092 | |||
| 2016 |
1,767 | |||
| 2017 |
1,465 | |||
| 2018 |
705 | |||
| Thereafter |
53 | |||
|
|
|
|||
| Total minimum |
||||
| lease payments |
$ | 8,304 | ||
|
|
|
|||
F-30
Table of Contents
PAYCOM PAYROLL HOLDINGS, LLC AND SUBSIDIARIES
NOTES TO CONSOLIDATED FINANCIAL STATEMENTS
DECEMBER 31, 2013, 2012 AND 2011
(IN THOUSANDS, EXCEPT PER UNIT AMOUNTS)
Rent expense under operating leases for the years ended December 31, 2013, 2012 and 2011 was $1,946, $1,487, and $1,644, respectively.
| 12. | SUBSEQUENT EVENTS |
In anticipation of an IPO, Software consummated the reorganization as of January 1, 2014, pursuant to which, (i) the owners of WCAS Paycom Holdings Inc. (“WCAS Holdings”) and WCAS CP IV Blocker, Inc. (“CP IV Blocker”), which are affiliates of Welsh, Carson, Anderson & Stowe, contributed WCAS Holdings and CP IV Blocker to Software in exchange for shares of common stock of Software and (ii) the owners of outstanding Series B Preferred Units of Holdings contributed their Series B Preferred Units for shares of common stock of Software. Immediately after these contributions, a wholly-owned subsidiary of Software merged with and into Holdings with Holdings surviving the merger. Upon consummation of the merger, the remaining holders of outstanding common and incentive units of Holdings received shares of common stock of Software for their common and incentive units by operation of Delaware law and Holdings’ ownership interest in Software was cancelled. Following these transactions, all outstanding Series C Preferred Units were eliminated in an intercompany transaction between Holdings and WCAS Holdings, and Software assumed a 14% note with a face value $46,193 due 2017 (“2017 Note”) (collectively, the “2014 Reorganization”). In connection with the 2014 Reorganization, Software authorized and reserved 11,350,881 shares of our common stock for future issuance under the 2014 Long-Term Incentive Plan (the “2014 Plan”), effective January 1, 2014. The 2014 Plan permits Software to grant an array of equity-based incentive awards to certain officers, employees, contractors and directors.
Effective March 10, 2014, Software adopted an Amended and Restated Certificate of Incorporation, as approved by its board of directors and the majority of its stockholders, which, among other things, increased the number of authorized shares of capital stock from 100,000,000 shares of consisting solely of common stock, $0.01 par value per share, to 110,000,000 shares of capital stock consisting of 100,000,000 shares of common stock, $0.01 par value per share, and 10,000,000 shares of undesignated preferred stock, $0.01 per share. Software’s board of directors may fix the voting powers, designations, powers, preferences and other rights, and any qualifications, limitations or restrictions thereof on each series of preferred stock.
Subsequent to December 31, 2013, we signed seven new leases for our sales offices and entered into one amendment to our existing leases thereby resulting in an additional $5,769 in future commitments of noncancellable operating leases with initial or remaining terms of one year or more.
Subsequent events were evaluated for disclosure through March 10, 2014, the date on which these consolidated financial statements were issued.
F-31
Table of Contents
6,645,000 Shares
Paycom Software, Inc.
Common Stock
Prospectus
| Barclays | J.P. Morgan |
| Pacific Crest Securities | Stifel | Canaccord Genuity | ||
, 2014
Table of Contents
PART II
INFORMATION NOT REQUIRED IN PROSPECTUS
| Item 13. | Other Expenses of Issuance and Distribution |
The following table sets forth the expenses payable by the registrant expected to be incurred in connection with the issuance and distribution of the common stock being registered hereby (other than underwriting discounts and commissions). All of such expenses are estimates, except for the Securities and Exchange Commission, or the SEC, registration fee, the Financial Industry Regulatory Authority, or FINRA, filing fee and the listing fee.
| SEC registration fee |
$ | 19,686 | ||
| FINRA filing fee |
15,500 | |||
| Listing fee |
250,000 | |||
| Printing fees and expenses |
300,000 | |||
| Legal fees and expenses |
2,050,000 | |||
| Registrar and transfer agent fees |
10,000 | |||
| Accounting fees and expenses |
2,720,000 | |||
| Miscellaneous expenses |
200,000 | |||
|
|
|
|||
| Total |
$ | 5,565,186 | ||
|
|
|
| Item 14. | Indemnification of Directors and Officers |
Section 145 of the Delaware General Corporation Law authorizes a court to award, or a corporation’s board of directors to grant, indemnity to directors and officers in terms sufficiently broad to permit such indemnification under certain circumstances for liabilities, including reimbursement for expenses incurred, arising under the Securities Act of 1933, as amended, or the Securities Act.
Our certificate of incorporation provides for indemnification of our directors, officers, employees and other agents to the maximum extent permitted by the Delaware General Corporation Law, and our bylaws provide for indemnification of our directors, officers, employees and other agents to the maximum extent permitted by the Delaware General Corporation Law.
We have entered and intend to continue to enter into indemnification agreements with our directors which, subject to certain exceptions, require us to indemnify such persons to the fullest extent permitted by applicable law, including indemnification against certain expenses, including attorneys’ fees, judgments, fines or penalties or other amounts paid in settlement in connection with any legal proceedings to which the director was, or is threatened to be made, a party by reason of the fact that such director is or was a director, officer, employee, fiduciary or agent of the Company or was serving as a director, officer, employee or agent of another corporation, partnership, joint venture, trust or other enterprise at the express written request of the Company, provided that such director or officer acted in good faith and in a manner that the director or officer reasonably believed to be in, or not opposed to, the best interest of the Company and, with respect to any criminal proceeding, in a manner in which such person would have had no reasonable cause to believe his conduct was unlawful. Subject to certain limitations, these indemnification agreements also require us to advance expenses to our directors in advance of the final disposition of any action or proceeding for which indemnification is required or permitted.
We maintain insurance policies that indemnify our directors and officers against various liabilities arising under the Securities Act and the Exchange Act of 1934, as amended, that might be incurred by any director or officer in his capacity as such.
II-1
Table of Contents
The underwriters are obligated, under certain circumstances, pursuant to the underwriting agreement to be filed as Exhibit 1.1 hereto, to indemnify us, our officers, directors and the selling stockholders against liabilities under the Securities Act.
| Item 15. | Recent Sales of Unregistered Securities |
During the past three years, our predecessors, Paycom Software Holdings, LLC, or Holdings, and Paycom Payroll, LLC, or Payroll, issued the following securities that were not registered under the Securities Act:
Incentive Units
During 2011, Payroll granted 3,875 incentive units to eligible officers and other employees under the 2009 Incentive Units Plan. These incentive units vest 50% on the third anniversary of the date of issuance and 50% on the fourth anniversary of the date of issuance. These incentive units were issued with a strike price that was based upon an $80.0 million company enterprise value.
During 2012, Holdings granted 57,057 Management Incentive Units to eligible officers and other employees under the 2012 Incentive Units Plan. These Management Incentive Units vest 50% over five years and 50% based on a cash return on investment to WCAS Paycom Holdings, Inc. with a linear vesting scale. These Management Incentive Units were issued with a strike price that was based upon a $400.0 million company enterprise value.
During 2012, Holdings granted 126,067 CEO Incentive Units to the Chief Executive Officer under the 2012 Incentive Units Plan. These CEO Incentive Units vest 25% over five years and 75% based on a cash return on investment to WCAS Paycom Holdings, Inc. with a linear vesting scale. These CEO Incentive Units were issued with a strike price that was based upon a $550.0 million company enterprise value.
During 2013, Holdings granted 25,953 Management Incentive Units to eligible officers and other employees under the 2012 Incentive Units Plan. These Management Incentive Units vest 50% over five years and 50% based on a cash return on investment of WCAS Paycom Holdings, Inc. with a linear vesting scale. These Management Incentive Units were issued with strike prices that were based upon a company enterprise values of $400.0 million and $550.0 million.
April 2012 Corporate Reorganization
On April 3, 2012, Holdings sold 6,839.0057 Series A Preferred Units to WCAS CP IV Blocker, Inc. for an aggregate purchase price of $2,409,122.44.
On April 3, 2012, pursuant to the Agreement and Plan of Merger by and among Holdings, Payroll and Paycom Payroll Merger Sub, LLC, by operation of Delaware law, all equity securities in Payroll were converted into equivalent equity securities in Holdings bearing identical terms. See “Related Party Transactions.”
On April 3, 2012, Holdings distributed 46,192.8934 Series C Preferred Units to WCAS Paycom Holdings, Inc. as part of the election of WCAS Paycom Holdings, Inc. to receive Series C Preferred Units instead of cash in connection with the recapitalization of Holdings set forth in the limited liability company agreement of Holdings.
The Reorganization
Effective January 1, 2014, we issued 30,452,458 and 136,015 shares of our common stock to WCAS X and WCAS Management Corporation, respectively, in exchange for the contribution of all of the shares of common stock of WCAS Paycom Holdings, Inc. to Software. In addition, we issued 323,307 shares of our common stock to WCAS IV in exchange for the contribution of all of the shares of common stock of WCAS CP IV Blocker, Inc. to Software.
II-2
Table of Contents
Effective January 1, 2014, we issued 628,745 shares of our common stock to Robert J. Levenson (and certain affiliated entities) in exchange for his contribution of 200 Series B Preferred Units of Holdings to Software and we issued 220,060 shares of our common stock Richard Aiello in exchange for his contribution of 70 Series B Preferred Units of Holdings to Software.
Effective January 1, 2014, pursuant to the Agreement and Plan of Merger by and among Paycom, Holdings, Payroll and Paycom Software Merger Sub, LLC, or Software Merger Sub, Software Merger Sub merged with and into Holdings, with all outstanding common units and incentive units of Holdings being converted into shares of our common stock or restricted common stock by operation of Delaware law.
The sales of the above securities were deemed exempt from registration under Section 4(a)(2) or Regulation D of the Securities Act, and in certain circumstances, in reliance on Rule 701 promulgated thereunder as transactions pursuant to compensatory benefit plans and contracts relating to compensation. All of the foregoing securities are deemed restricted securities for purposes of the Securities Act. The recipients of securities in the transactions exempt under Section 4(a)(2) or Regulation D of the Securities Act represented their intention to acquire the securities for investment purposes only and not with a view to or for sale in connection with any distribution thereof and appropriate legends were affixed to the units and instruments issued in such transactions.
| Item 16. | Exhibits and Financial Statement Schedules |
(a) Exhibits. The following exhibits are included herein or incorporated herein by reference:
| Exhibit No. |
Description | |
| 1.1* | Form of Underwriting Agreement. | |
| 2.1** | Agreement and Plan of Merger, by and among Paycom Payroll, LLC, Paycom Payroll Holdings, LLC and Paycom Payroll Merger Sub, LLC, dated April 3, 2012. | |
| 2.2** | Contribution Agreement, by and between WCAS Capital Partners IV, L.P. and WCAS CP IV Blocker, Inc., dated April 3, 2012. | |
| 2.3** | Securities Purchase Agreement, by and among Paycom Payroll Holdings, LLC, WCAS Capital Partners IV, L.P. and WCAS CP IV Blocker, Inc., dated April 3, 2012. | |
| 2.4** | Merger Agreement, by and among Paycom Software, Inc., Paycom Payroll Holdings, LLC, Paycom Payroll, LLC and Paycom Merger Sub, LLC, dated December 30, 2013. | |
| 2.5** | Contribution Agreement, by and between WCAS Capital Partners, IV, L.P. and Paycom Software, Inc., dated December 30, 2013. | |
| 2.6** | Contribution Agreement, by and among Welsh, Carson, Anderson & Stowe X, L.P., WCAS Management Corporation and Paycom Software, Inc., dated December 30, 2013. | |
| 2.7** | Contribution Agreement, by and among Paycom Software, Inc. and each of the signatories thereto, dated December 30, 2013. | |
| 3.1* | Amended and Restated Certificate of Incorporation, as currently in effect. | |
| 3.2* | Bylaws, as currently in effect. | |
| 4.1* | Form of Common Stock Certificate. | |
| 4.2** | Amended and Restated Stockholders’ Agreement. | |
| 4.3** | Registration Rights Agreement. | |
| 5.1* | Opinion of Haynes and Boone, LLP. | |
II-3
Table of Contents
| Exhibit No. |
Description | |
| 10.1** | Form of Indemnification Agreement between Paycom Software, Inc. and each of its directors and executive officers. | |
| 10.2** | Paycom Software, Inc. 2014 Long-Term Incentive Plan. | |
| 10.3** | Form of Restricted Stock Award Agreement (Post-IPO). | |
| 10.4* | Form of Restricted Stock Award Agreement for Non-Executives. | |
| 10.5* | Form of Restricted Stock Award Agreement for Executives with Employment Agreements. | |
| 10.6* | Form of Restricted Stock Award Agreement for Chief Executive Officer. | |
| 10.7** | Executive Employment Agreement by and between Paycom Payroll Holdings, LLC and Chad Richison, dated December 30, 2013. | |
| 10.8** | Executive Employment Agreement by and between Paycom Payroll Holdings, LLC and Craig E. Boelte, dated December 30, 2013. | |
| 10.9** | Executive Employment Agreement by and between Paycom Payroll Holdings, LLC and Jeffrey D. York, dated December 30, 2013. | |
| 10.10** | Executive Employment Agreement by and between Paycom Payroll Holdings, LLC and William X. Kerber III, dated December 30, 2013. | |
| 10.11** | Consolidated, Amended and Restated Loan Agreement, by and between Kirkpatrick Bank and Paycom Payroll, LLC, dated December 15, 2011. | |
| 10.12** | Loan Agreement, by and between Kirkpatrick Bank and Paycom Payroll, LLC, dated March 28, 2013. | |
| 10.13** | 10% Senior Note due April 3, 2022, by and between WCAS Capital Partners IV, L.P. and Paycom Payroll Holdings, LLC, dated April 3, 2012. | |
| 10.14** | 14% Note due April 3, 2017, by and between WCAS Paycom Holdings, Inc. and Welsh, Carson, Anderson & Stowe X, L.P., dated April 3, 2012. | |
| 10.15** | Real Property Purchase Agreement by and between Paycom Payroll, LLC and Kilpatrick Partners, L.L.C., dated November 28, 2012. | |
| 10.16** | Real Property Purchase Agreement by and between Paycom Payroll, LLC Kilpatrick Partners, L.L.C., dated October 16, 2013. | |
| 10.17** | Right of First Refusal Agreement, by and between Kilpatrick Partners, L.L.C. and Paycom Payroll, LLC, dated October 4, 2013. | |
| 21.1** | List of subsidiaries of the Registrant. | |
| 23.1* | Consent of Grant Thornton LLP. | |
| 23.2* | Consent of Grant Thornton LLP. | |
| 23.3* | Consent of Haynes and Boone, LLP (included in Exhibit 5.1). | |
| 24.1** | Power of Attorney. | |
| * | Filed herewith. |
| ** | Previously filed. |
II-4
Table of Contents
| Item 17. | Undertakings |
The undersigned registrant hereby undertakes:
| 1. | To file, during any period in which offers or sales are being made, a post-effective amendment to this registration statement: |
| i. | To include any prospectus required by section 10(a)(3) of the Securities Act of 1933; |
| ii. | To reflect in the prospectus any facts or events arising after the effective date of the registration statement (or the most recent post-effective amendment thereof) which, individually or in the aggregate, represent a fundamental change in the information set forth in the registration statement. Notwithstanding the foregoing, any increase or decrease in volume of securities offered (if the total dollar value of securities offered would not exceed that which was registered) and any deviation from the low or high end of the estimated maximum offering range may be reflected in the form of prospectus filed with the Commission pursuant to Rule 424(b) if, in the aggregate, the changes in volume and price represent no more than 20% change in the maximum aggregate offering price set forth in the “Calculation of Registration Fee” table in the effective registration statement. |
| iii. | To include any material information with respect to the plan of distribution not previously disclosed in the registration statement or any material change to such information in the registration statement. |
| 2. | That, for the purpose of determining any liability under the Securities Act of 1933, each such post-effective amendment shall be deemed to be a new registration statement relating to the securities offered therein, and the offering of such securities at that time shall be deemed to be the initial bona fide offering thereof. |
| 3. | To remove from registration by means of a post-effective amendment any of the securities being registered which remain unsold at the termination of the offering. |
| 4. | That, for the purpose of determining liability under the Securities Act of 1933 to any purchaser, each prospectus filed pursuant to Rule 424(b) as part of a registration statement relating to an offering, other than registration statements relying on Rule 430B or other than prospectuses filed in reliance on Rule 430A, shall be deemed to be part of and included in the registration statement as of the date it is first used after effectiveness. Provided, however, that no statement made in a registration statement or prospectus that is part of the registration statement or made in a document incorporated or deemed incorporated by reference into the registration statement or prospectus that is part of the registration statement will, as to a purchaser with a time of contract of sale prior to such first use, supersede or modify any statement that was made in the registration statement or prospectus that was part of the registration statement or made in any such document immediately prior to such date of first use. |
We have agreed to indemnify our director and officer against certain liabilities, including liabilities under the Securities Act and the benefits of such indemnification are not waived by our director and officer. Insofar as indemnification for liabilities arising under the Securities Act may be permitted to directors, officers and controlling persons of the registrant pursuant to the foregoing provisions, or otherwise, the registrant has been advised that in the opinion of the Securities and Exchange Commission such indemnification is against public policy as expressed in the Act and is, therefore, unenforceable. In the event that a claim for indemnification against such liabilities (other than the payment by the registrant of expenses incurred or paid by a director, officer or controlling person of the registrant in the successful defense of any action, suit or proceeding) is asserted by such director, officer or controlling person in connection with the securities being registered, the registrant will, unless in the opinion of its counsel the matter has been settled by controlling precedent, submit to a court of appropriate jurisdiction the question whether such indemnification by it is against public policy as expressed in the Act and will be governed by the final adjudication of such issue.
II-5
Table of Contents
SIGNATURES
Pursuant to the requirements of the Securities Act of 1933, the registrant has duly caused this Amendment No. 1 to the Registration Statement to be signed on its behalf by the undersigned, thereunto duly authorized in the City of Oklahoma City, State of Oklahoma, on March 31, 2014.
| PAYCOM SOFTWARE, INC. | ||
| By: | /s/ Chad Richison | |
| Chad Richison Chief Executive Officer and Director | ||
Pursuant to the requirements of the Securities Act of 1933, this Amendment No. 1 to the Registration Statement has been signed by the following person in the capacities and on the dates indicated.
| Signature |
Title |
Date | ||
| /s/ Chad Richison Chad Richison |
Chief Executive Officer and Director (Principal Executive Officer) |
March 31, 2014 | ||
| /s/ Craig E. Boelte Craig E. Boelte |
Chief Financial Officer (Principal Accounting and Financial Officer) |
March 31, 2014 | ||
| * Robert J. Levenson |
Director |
March 31, 2014 | ||
| * Rob Minicucci |
Chairman of the Board |
March 31, 2014 | ||
| * Conner Mulvee |
Director |
March 31, 2014 | ||
| * Frederick C. Peters II |
Director |
March 31, 2014 | ||
| * Sanjay Swani |
Director |
March 31, 2014 | ||
| * By: | /s/ Craig E. Boelte | |
| Craig E. Boelte | ||
| Attorney-in-fact |
II-6
Table of Contents
EXHIBIT INDEX
| Exhibit No. |
Description | |
| 1.1* | Form of Underwriting Agreement. | |
| 2.1** | Agreement and Plan of Merger, by and among Paycom Payroll, LLC, Paycom Payroll Holdings, LLC and Paycom Payroll Merger Sub, LLC, dated April 3, 2012. | |
| 2.2** | Contribution Agreement, by and between WCAS Capital Partners IV, L.P. and WCAS CP IV Blocker, Inc., dated April 3, 2012. | |
| 2.3** | Securities Purchase Agreement, by and among Paycom Payroll Holdings, LLC, WCAS Capital Partners IV, L.P. and WCAS CP IV Blocker, Inc., dated April 3, 2012. | |
| 2.4** | Merger Agreement, by and among Paycom Software, Inc., Paycom Payroll Holdings, LLC, Paycom Payroll, LLC and Paycom Merger Sub, LLC, dated December 30, 2013. | |
| 2.5** | Contribution Agreement, by and between WCAS Capital Partners, IV, L.P. and Paycom Software, Inc., dated December 30, 2013. | |
| 2.6** | Contribution Agreement, by and among Welsh, Carson, Anderson & Stowe X, L.P., WCAS Management Corporation and Paycom Software, Inc., dated December 30, 2013. | |
| 2.7** | Contribution Agreement, by and among Paycom Software, Inc. and each of the signatories thereto, dated December 30, 2013. | |
| 3.1* | Amended and Restated Certificate of Incorporation, as currently in effect. | |
| 3.2* | Bylaws, as currently in effect. | |
| 4.1* | Form of Common Stock Certificate. | |
| 4.2** | Amended and Restated Stockholders’ Agreement. | |
| 4.3** | Registration Rights Agreement. | |
| 5.1* | Opinion of Haynes and Boone, LLP. | |
| 10.1** | Form of Indemnification Agreement between Paycom Software, Inc. and each of its directors and executive officers. | |
| 10.2** | Paycom Software, Inc. 2014 Long-Term Incentive Plan. | |
| 10.3** | Form of Restricted Stock Award Agreement (Post-IPO). | |
| 10.4* | Form of Restricted Stock Award Agreement for Non-Executives. | |
| 10.5* | Form of Restricted Stock Award Agreement for Executives with Employment Agreements. | |
| 10.6* | Form of Restricted Stock Award Agreement for Chief Executive Officer. | |
| 10.7** | Executive Employment Agreement by and between Paycom Payroll Holdings, LLC and Chad Richison, dated December 30, 2013. | |
| 10.8** | Executive Employment Agreement by and between Paycom Payroll Holdings, LLC and Craig E. Boelte, dated December 30, 2013. | |
| 10.9** | Executive Employment Agreement by and between Paycom Payroll Holdings, LLC and Jeffrey D. York, dated December 30, 2013. | |
| 10.10** | Executive Employment Agreement by and between Paycom Payroll Holdings, LLC and William X. Kerber III, dated December 30, 2013. | |
| 10.11** | Consolidated, Amended and Restated Loan Agreement, by and between Kirkpatrick Bank and Paycom Payroll, LLC, dated December 15, 2011. | |
Table of Contents
| Exhibit No. |
Description | |
| 10.12** | Loan Agreement, by and between Kirkpatrick Bank and Paycom Payroll, LLC, dated March 28, 2013. | |
| 10.13** | 10% Senior Note due April 3, 2022, by and between WCAS Capital Partners IV, L.P. and Paycom Payroll Holdings, LLC, dated April 3, 2012. | |
| 10.14** | 14% Note due April 3, 2017, by and between WCAS Paycom Holdings, Inc. and Welsh, Carson, Anderson & Stowe X, L.P., dated April 3, 2012. | |
| 10.15** | Real Property Purchase Agreement by and between Paycom Payroll, LLC and Kilpatrick Partners, L.L.C., dated November 28, 2012. | |
| 10.16** | Real Property Purchase Agreement by and between Paycom Payroll, LLC Kilpatrick Partners, L.L.C., dated October 16, 2013. | |
| 10.17** | Right of First Refusal Agreement, by and between Kilpatrick Partners, L.L.C. and Paycom Payroll, LLC, dated October 4, 2013. | |
| 21.1** | List of subsidiaries of the Registrant. | |
| 23.1* | Consent of Grant Thornton LLP. | |
| 23.2* | Consent of Grant Thornton LLP. | |
| 23.3* | Consent of Haynes and Boone, LLP (included in Exhibit 5.1). | |
| 24.1** | Power of Attorney. | |
| * | Filed herewith. |
| ** | Previously filed. |