Attached files
| file | filename |
|---|---|
| 10-K - 10-K - Eos Petro, Inc. | eos10k03262014.htm |
| EX-31.2 - EXHIBIT 31.2 - Eos Petro, Inc. | ex312.htm |
| EX-32.2 - EXHIBIT 32.2 - Eos Petro, Inc. | ex322.htm |
| EX-21.1 - EXHIBIT 21.1 - Eos Petro, Inc. | ex211.htm |
| EX-23.1 - EXHIBIT 23.1 - Eos Petro, Inc. | ex231.htm |
| EX-10.58 - EXHIBIT 10.58 - Eos Petro, Inc. | ex1060.htm |
| EX-32.1 - EXHIBIT 32.1 - Eos Petro, Inc. | ex321.htm |
| EX-10.57 - EXHIBIT 10.57 - Eos Petro, Inc. | ex1057.htm |
| EX-31.1 - EXHIBIT 31.1 - Eos Petro, Inc. | ex311.htm |
Exhibit 99.1
Illinois Basin Posted Crude Oil Prices
Hahn Engineering, Inc.
Petroleum Consultants
P. O. Box 190251
St. Louis, MO 63119
(314) 968-3656
FAX (314) 968-3656
February 3, 2014
Eos Petro, Inc.
Attn: Mr. Nikolas Konstant
2049 Century Park East, Suite 3670
Los Angeles, CA 90067
R: 2013 Works Unit Reserve Evaluation
Gentlemen:
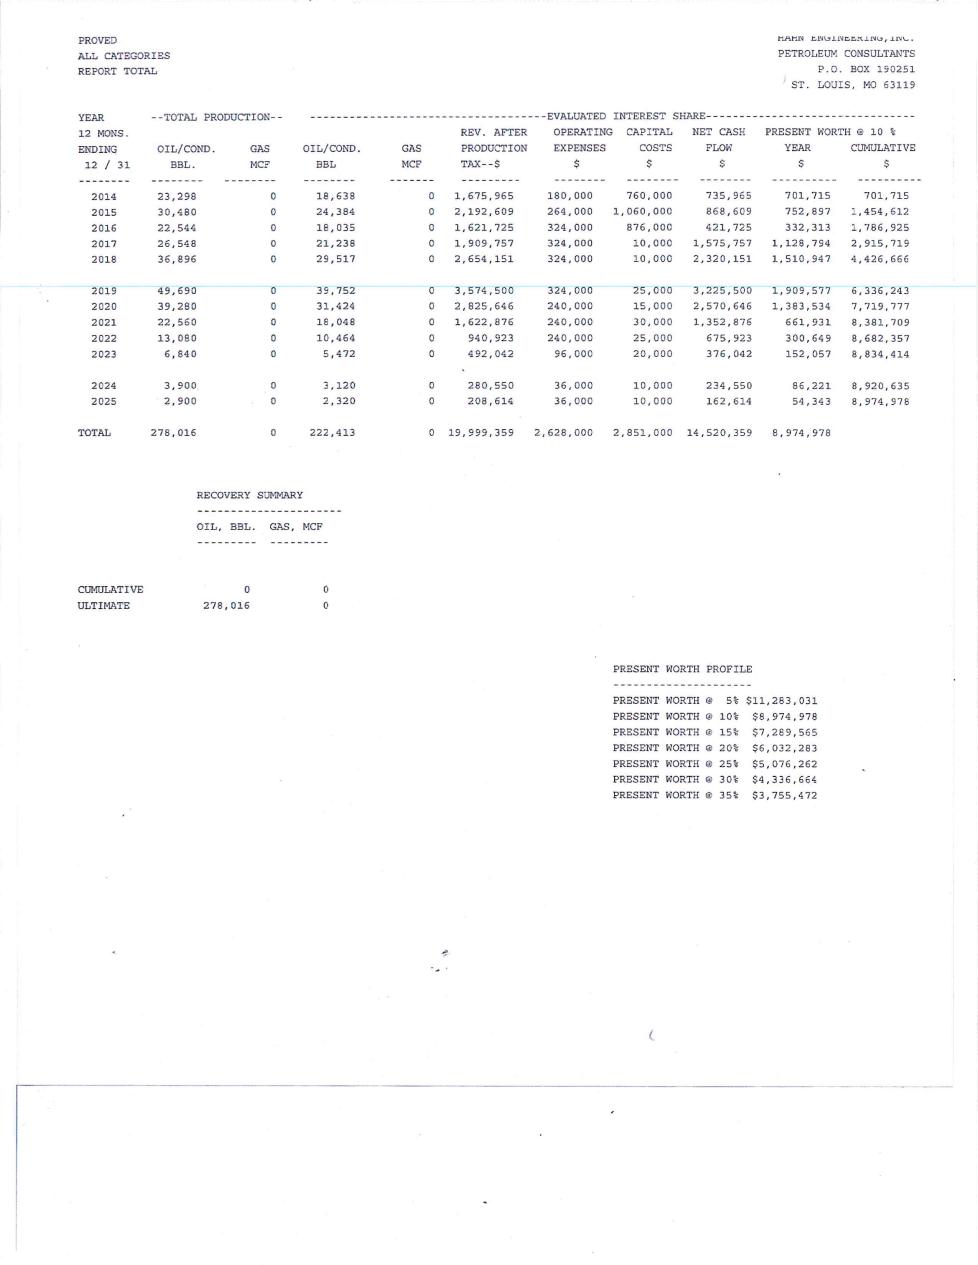
At your request, Hahn Engineering, Inc. has prepared an estimate of the reserves, future production and income attributable to a certain working interest in the Works Unit owned and operated by Eos Petro, Inc. in the Albion Consolidated Field, Edwards County, Illinois, as of December 31, 2013. The purpose of this evaluation was to provide estimates of reserve information in support of the year-end reserves reporting requirements under U. S. Securities Regulation S-K and for other internal business and financial needs. A supplementary third party report is attached hereto as Exhibit A, and incorporated by this reference to this report.
It should be noted that due to a combination of economic and political forces, there is significant uncertainty regarding the forecasting of future hydrocarbon prices. Crude oil prices were based on an average of the posted crude oil price on the 1st day of the each month for the twelve months in 2013, and held constant thereafter as required by the SEC regulations. The recoverable reserves and the income attributable thereto have a direct relationship to the hydrocarbon prices actually received; therefore, volumes of reserves actually recovered and amounts of income actually received may differ significantly for the estimated quantities presented in this report. A summary of the results, as of December 31, 2013, is shown below.
Estimated Reserves and Income of Certain Leasehold Interests
Eos Petro, Inc. as of December 31, 2013
|
------ Proved ------
|
||||||||||||||||
|
--Proved Developed--
|
Undeveloped
|
Total
|
||||||||||||||
|
Producing
|
Non-Producing
|
Undrilled
|
Proved
|
|||||||||||||
|
Gross Reserves
|
||||||||||||||||
|
Oil – Barrels
|
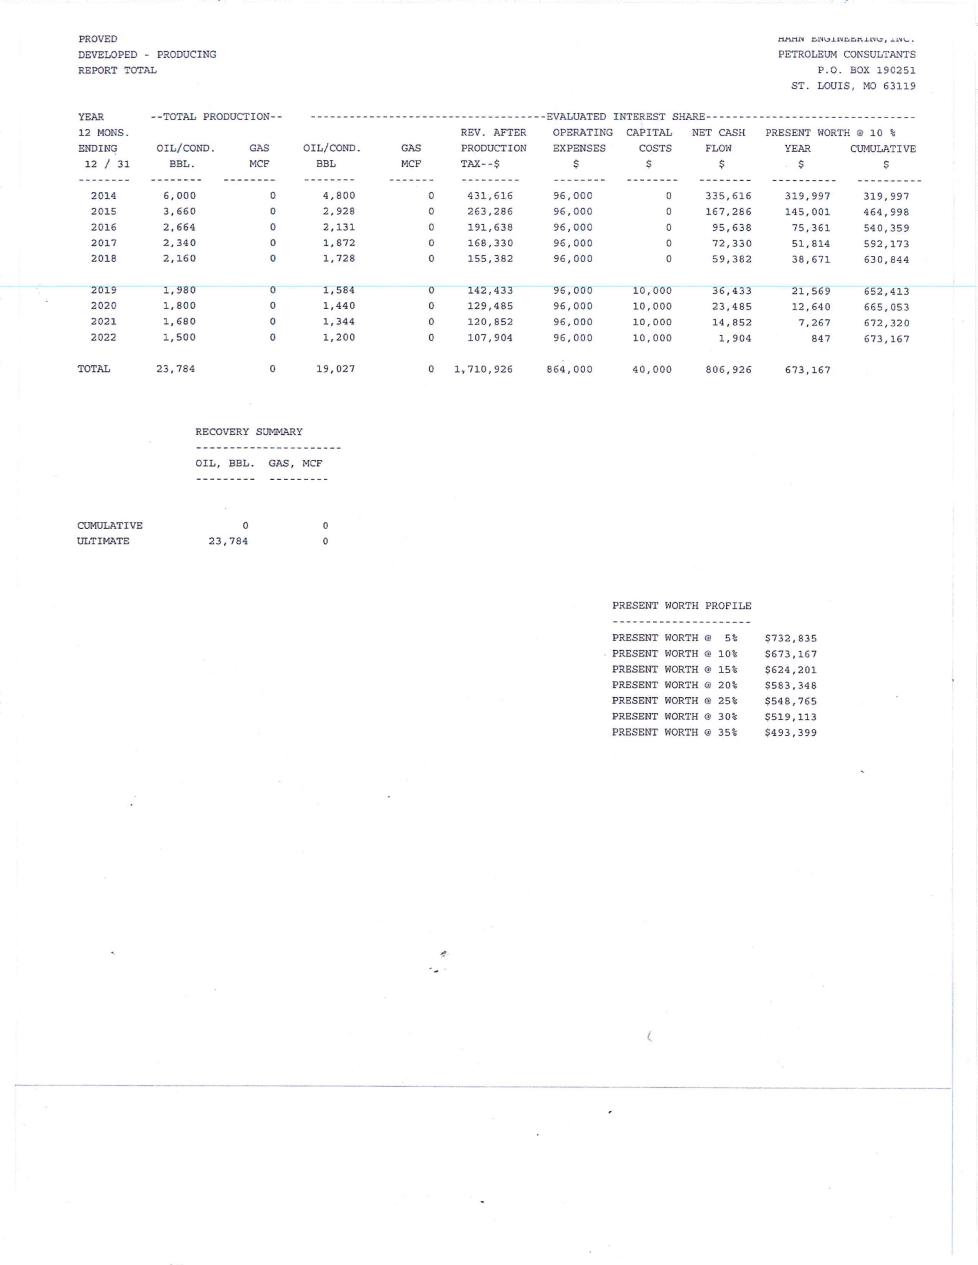
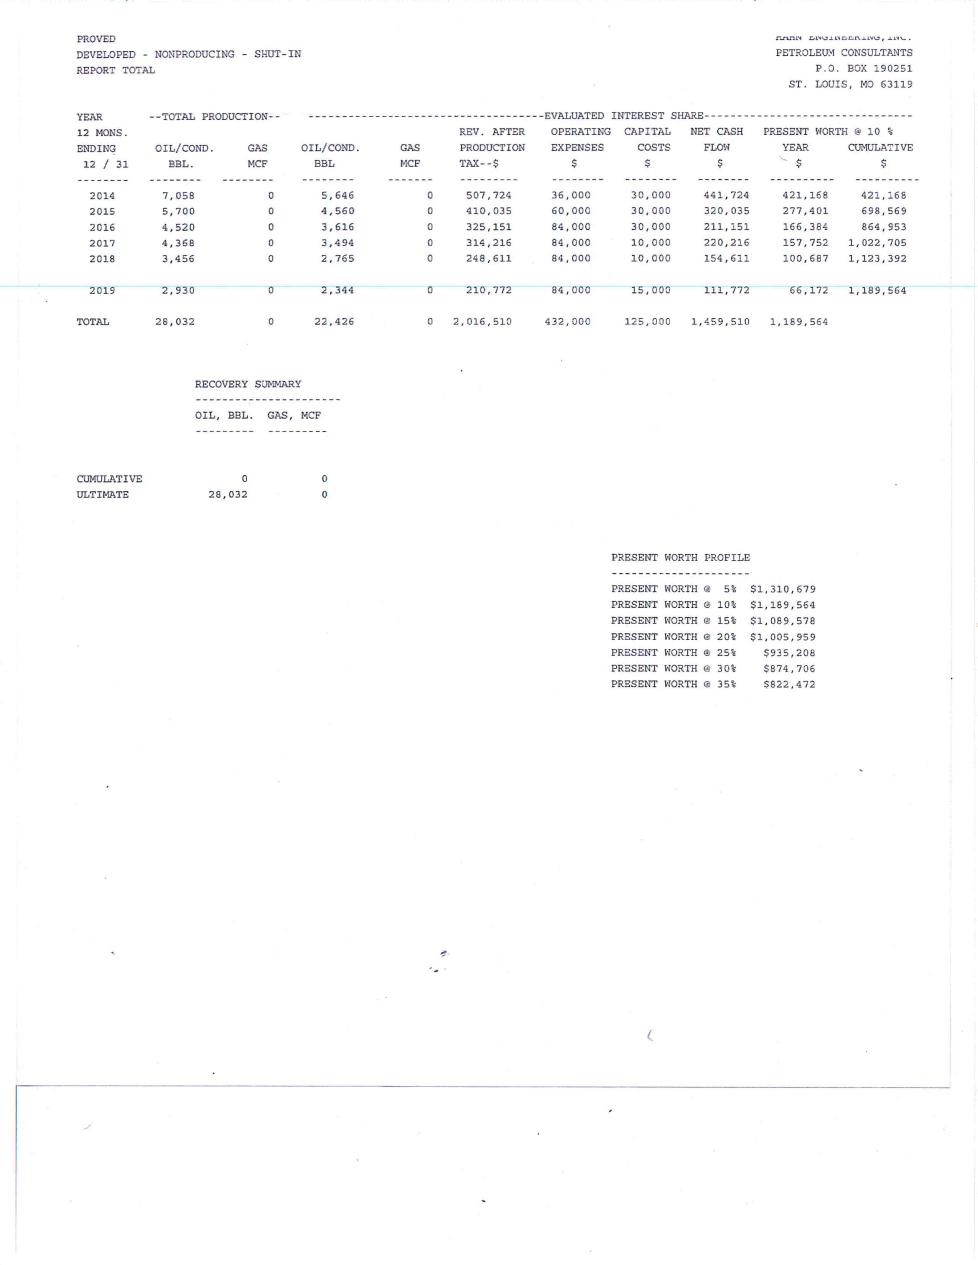
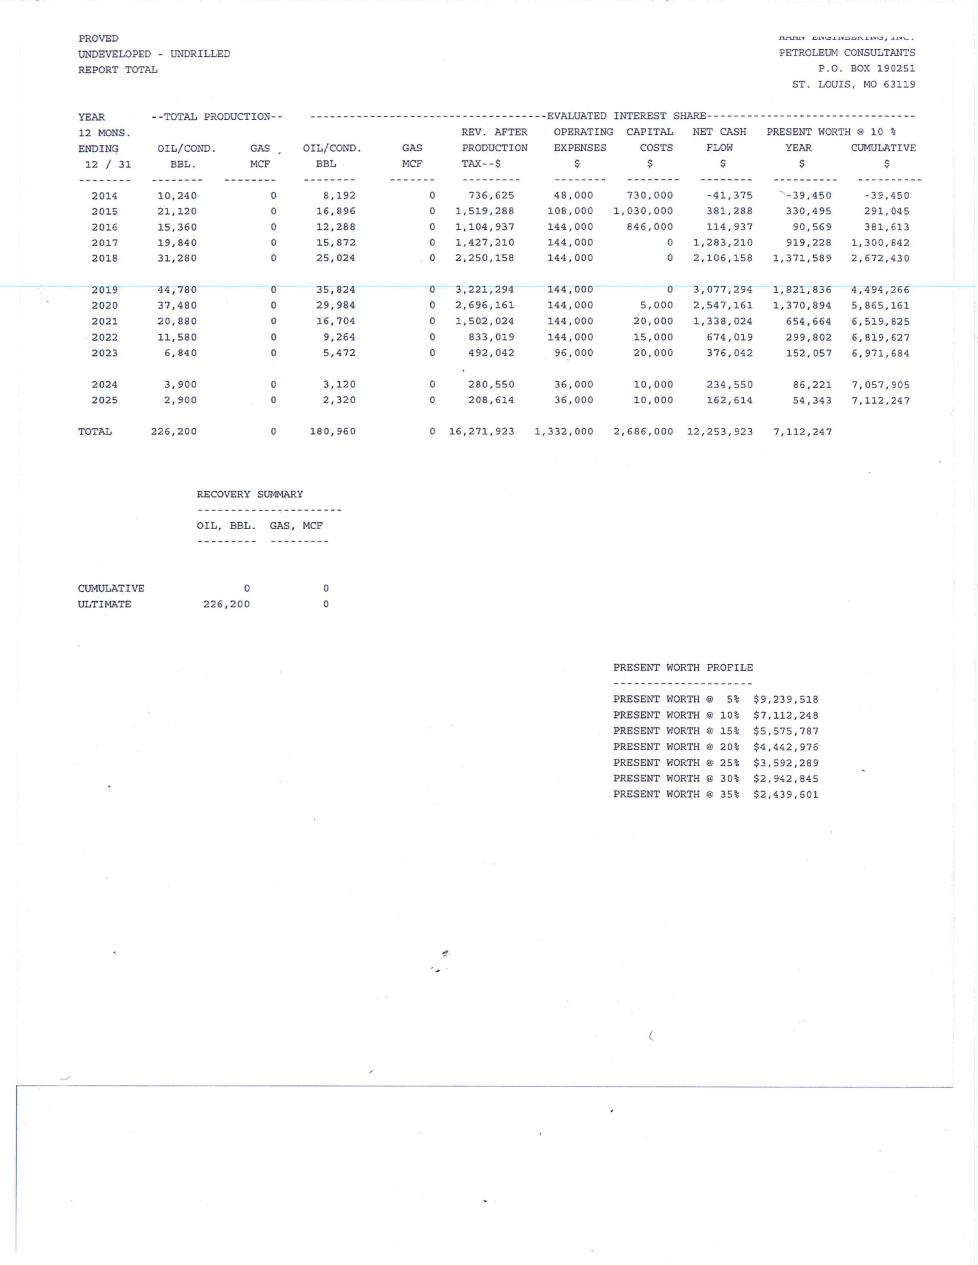
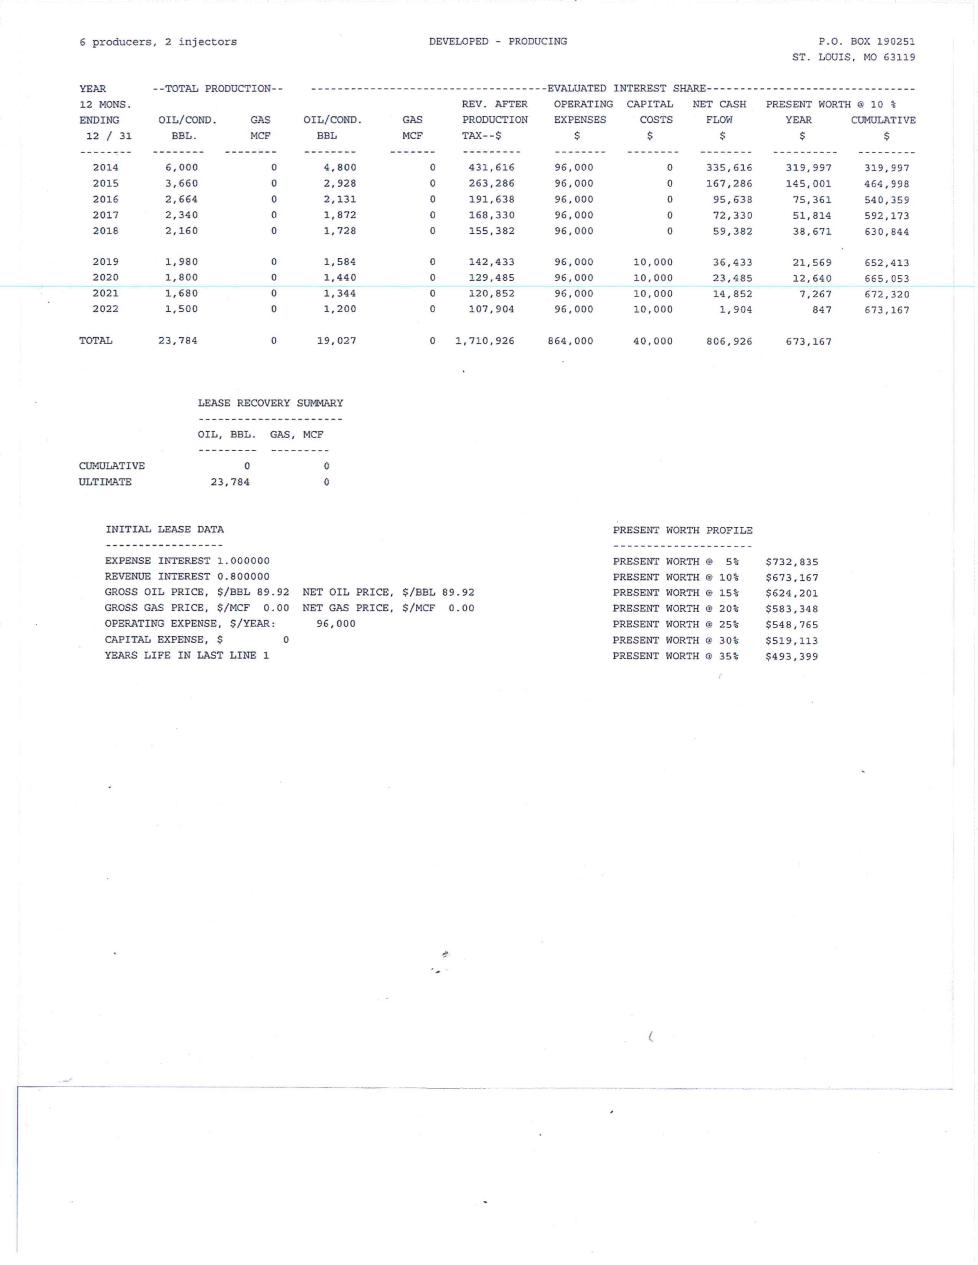
23,784 | 28,032 | 226,200 | 278,016 | ||||||||||||
|
Net Reserves
|
||||||||||||||||
|
Oil – Barrels
|
19,027 | 22,426 | 180,960 | 222,413 | ||||||||||||
|
Income Data
|
||||||||||||||||
|
Future Gross Revenue
|
$ | 1,710,926 | $ | 2,016,510 | $ | 16,271,923 | $ | 19,999,359 | ||||||||
|
Deductions
|
$ | 904,000 | $ | 557,000 | $ | 4,018,000 | $ | 5,479,000 | ||||||||
|
Future Net Income (FNI)
|
$ | 806,926 | $ | 1,459,510 | $ | 12,253,923 | $ | 14,520,359 | ||||||||
|
Discounted FNI @ 10%
|
$ | 673,167 | $ | 1,189,564 | $ | 7,112,247 | $ | 8,974,978 | ||||||||
1
Liquid hydrocarbons are expressed in standard 42 gallon barrels. All gas volumes, if any, is sales gas expressed in millions of cubic feet (MMCF) at the official temperature and pressure bases of the areas in which the gas reserves are located.
The deductions are comprised of the normal direct and indirect costs of operating the wells, i.e. pumper’s expense, electricity, propane, chemical inhibitor, supplies, insurance and normal well repair expense. There is no severance tax in the State of Illinois. The future net income is before the deduction of state and federal income taxes and general administrative overhead, and has not been adjusted for outstanding loans that may exist nor does it include any adjustment for cash on hand or gas production imbalances that may exist. Liquid hydrocarbon reserves account for approximately 100% of the total future gross revenue from the proved developed producing reserves.
The discounted future net income shown above was calculated using a discount rate of 10 percent per annum compounded semi-annually. Future net income was calculated at six other discount rates. These results are shown on each estimated projection of future production and income presented for all reserve categories in this report and in summary form below.
|
Discounted Future Net Income
|
|||||||||||||||||
|
as of December 31, 2013
|
|||||||||||||||||
|
-------------------Proved-------------------
|
|||||||||||||||||
|
Discount
|
--- Proved Developed ---
|
Undeveloped
|
Total
|
||||||||||||||
|
Factor
|
Producing
|
Non-Producing
|
Undrilled
|
Proved
|
|||||||||||||
| 5 | $ | 732,835 | $ | 1,310,679 | $ | 9,239,518 | $ | 11,283,031 | |||||||||
| 15 | $ | 624,201 | $ | 1,089,578 | $ | 5,575,787 | $ | 7,289,565 | |||||||||
| 20 | $ | 583,348 | $ | 1,005,959 | $ | 4,442,976 | $ | 6,032,283 | |||||||||
| 25 | $ | 548,765 | $ | 935,208 | $ | 3,592,289 | $ | 5,076,262 | |||||||||
| 30 | $ | 519,113 | $ | 874,706 | $ | 2,942,845 | $ | 4,336,664 | |||||||||
| 35 | $ | 493,399 | $ | 822,472 | $ | 2,439,601 | $ | 3,755,472 | |||||||||
2
The results shown above are presented for your information and should not be construed as our estimate of fair market value.
Reserves Included in this Report
The proved reserves included herein conform to the definition as set forth in the SEC regulation Part 210.4-10(a).
Estimates of Reserves
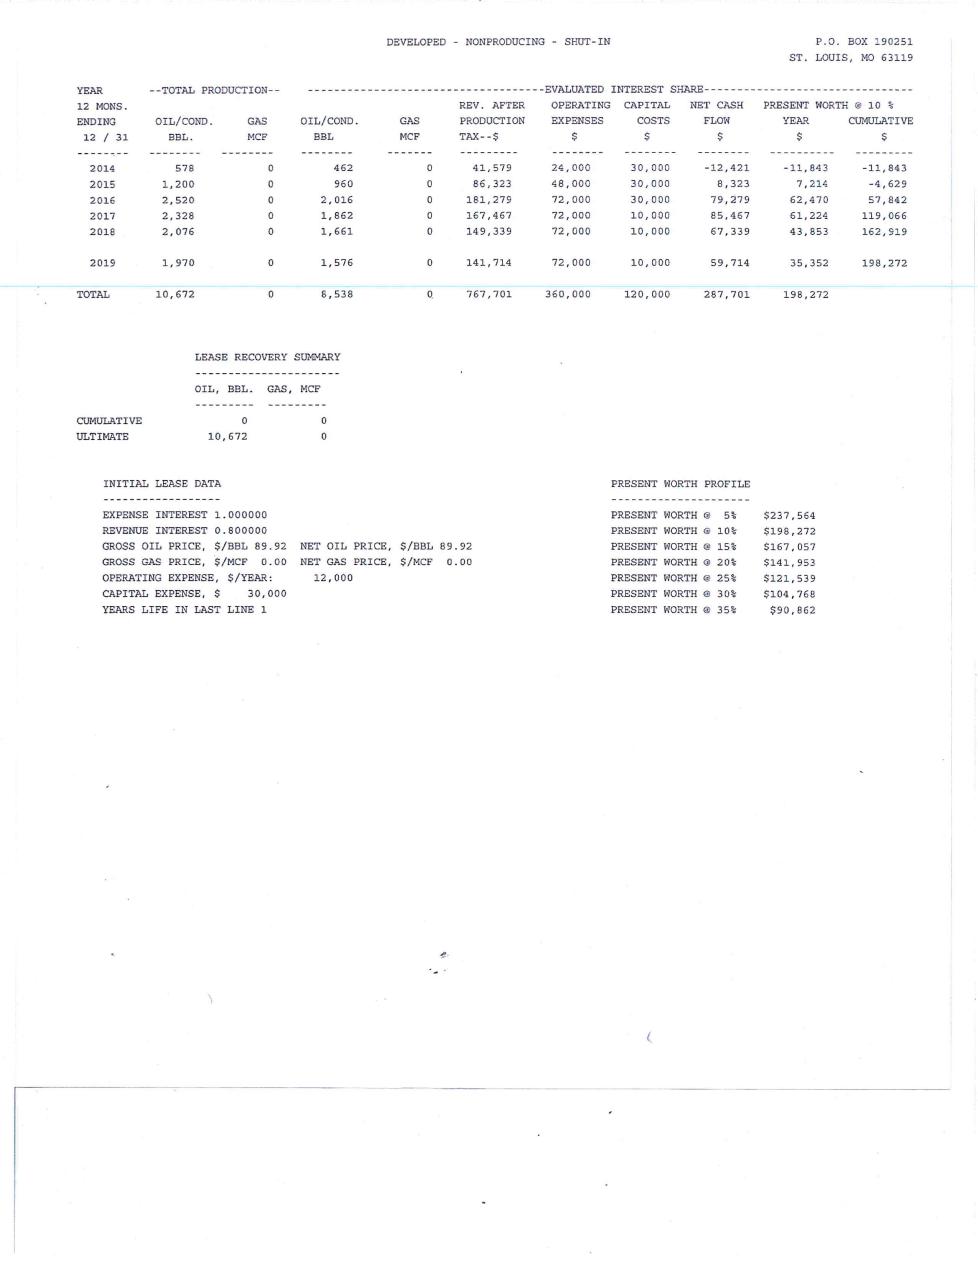
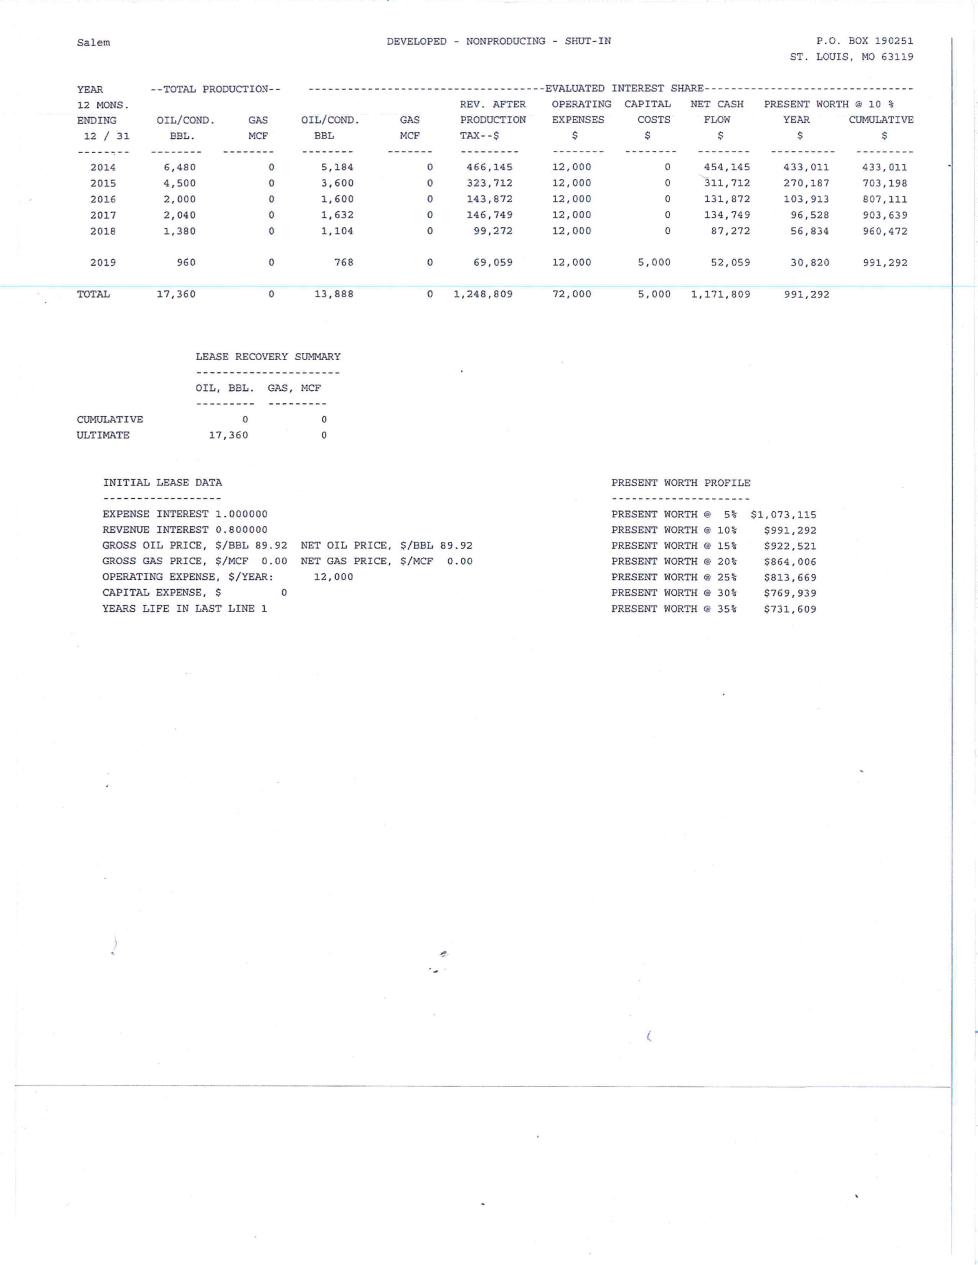
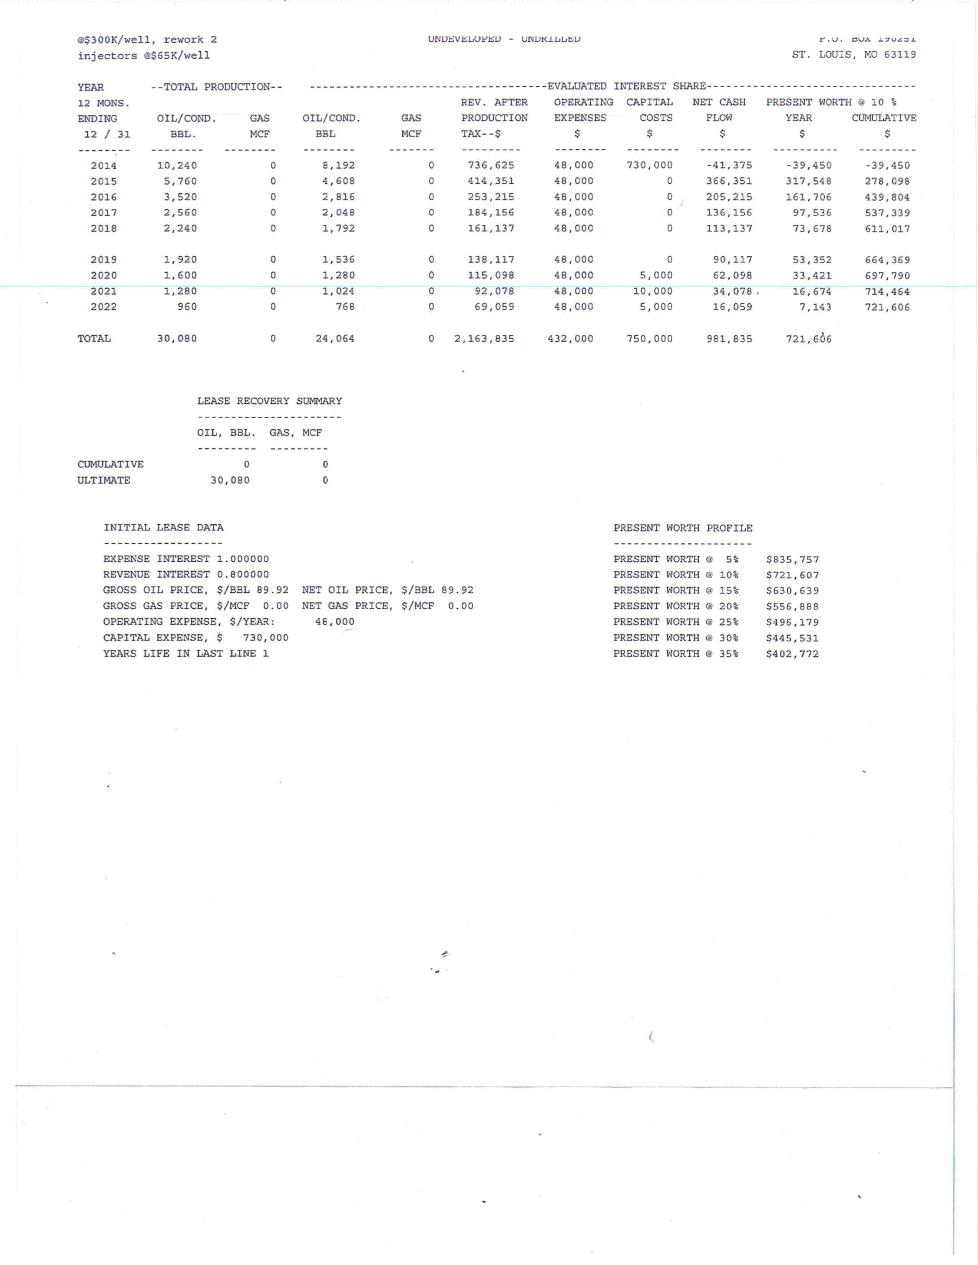
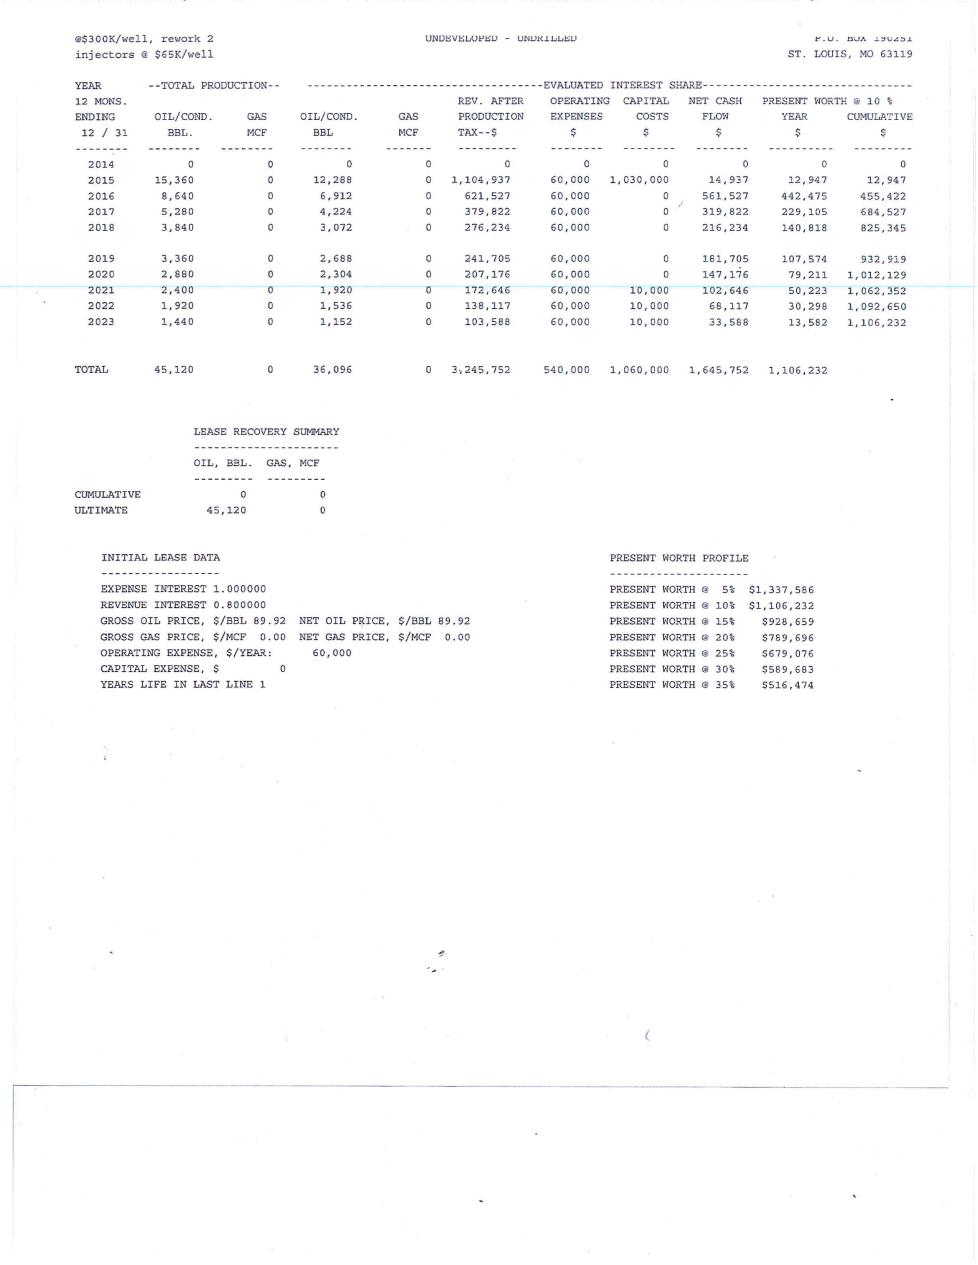
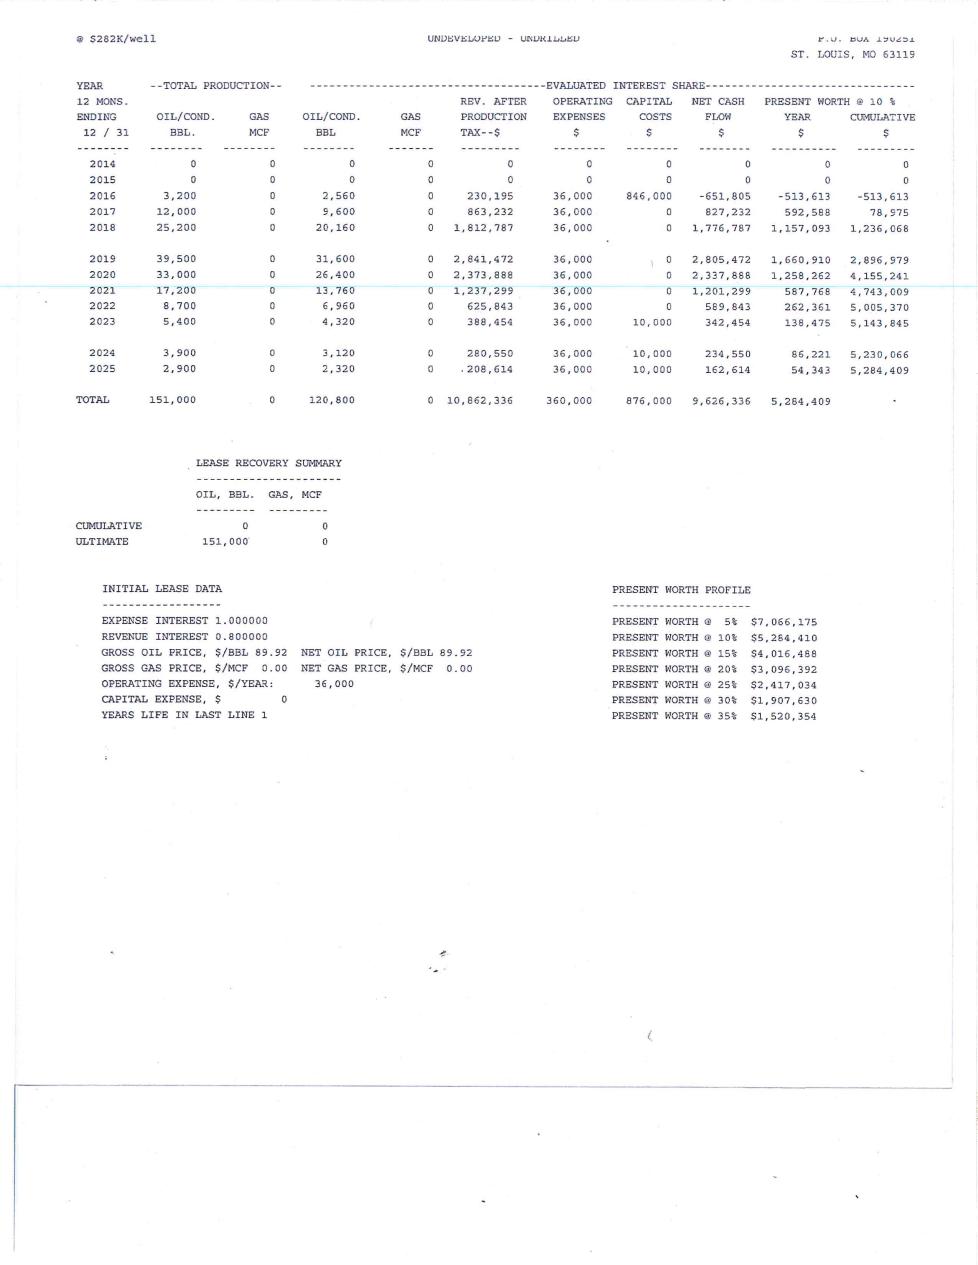
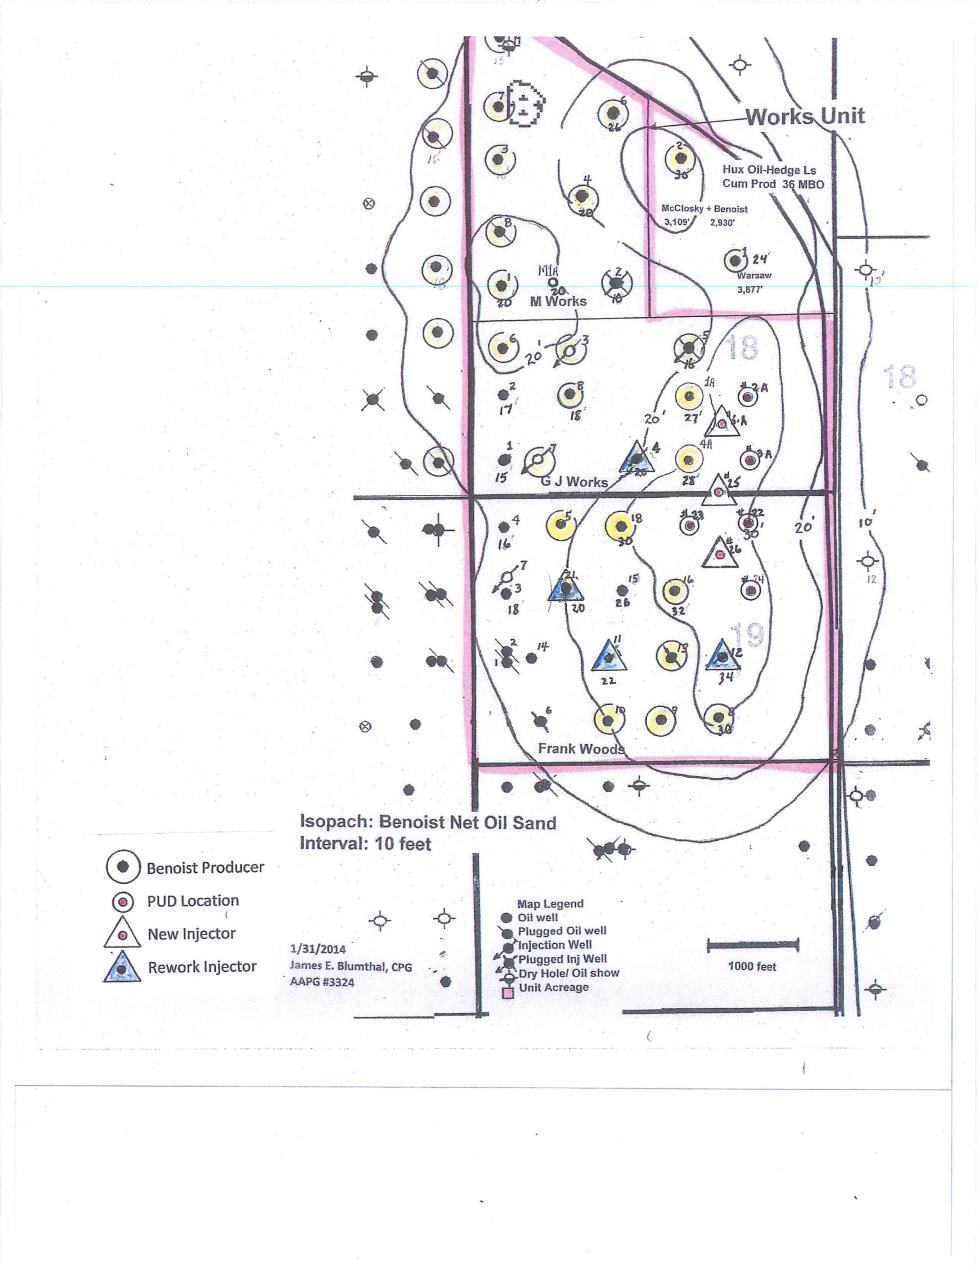
In general, the proved developed producing reserves included herein were estimated by the performance method. The reserves estimated by the performance method utilized extrapolations of various historical oil sales data in those cases where such data were definitive. The proved developed non-producing shut-in reserves were based on well test data taken prior to 2008 when the Works Unit was shut-in due to the death of the owner/operator at that time. It also includes the M. Works #M1A well which was drilled and completed in the Salem formation, but, due to winter weather conditions, is awaiting electrification before being placed on production. Production performance and reserves for this well is based by analogy to a nearby Salem producer. The proved undeveloped undrilled reserves were based on Benoist Sand recoveries by both primary and secondary recovery with a reasonable certainty that they will be recovered. Structure and isopach maps of the Benoist Sand with marked proved locations and recommended injection wells are attached.
3
The reserves included in this report are estimates only and should not be construed as being exact quantities. They may or may not be actually recovered, and if recovered, the revenues therefrom and the actual costs related thereto could be more or less than the estimated amounts. Moreover, estimates of reserves may increase or decrease as a result of future operations.
Future Production Rates
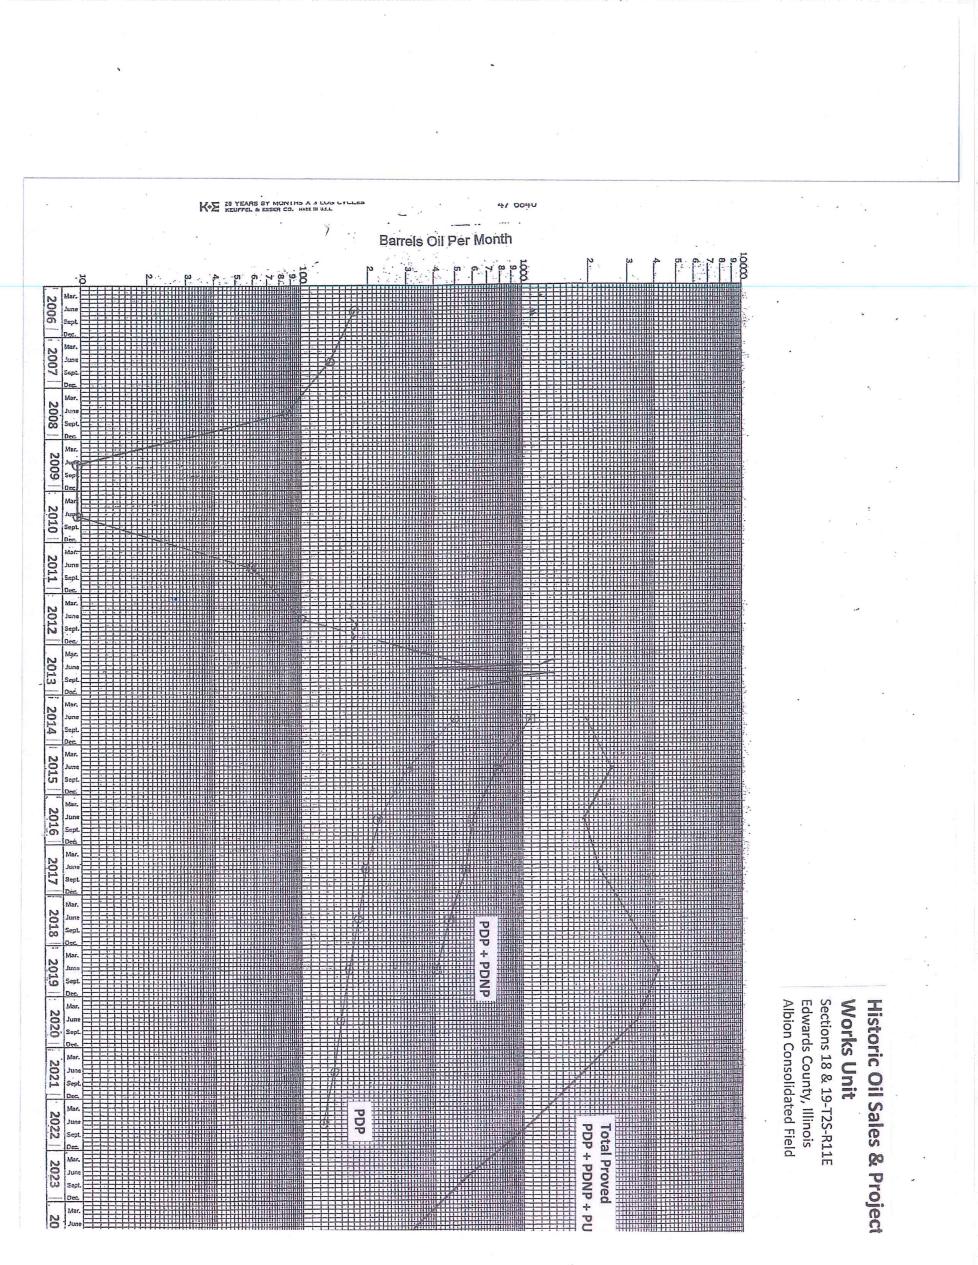
Initial production rates are based on the current producing rates for those wells now on production. The historical oil sales graph plotted monthly since 2006 is attached. Projections of estimated future oil production, as marked, are also shown on the graph. Historical oil production data was available from 1980 through November 2013.
Hydrocarbon Prices
Oil prices were based on the average posted crude oil price for the 1st day of each of the twelve months for the calendar year 2013, or $89.92 per barrel and held constant thereafter per SEC guidelines. See Illinois Basin Posted Crude Oil Price attachment. There is no severance tax in the State of Illinois.
Operating Expenses
Operating expenses for the Works Unit in this report were based on estimated well operating expenses incurred by other operators at other similar wells. These estimated expenses would include pumper’s expense, electricity, propane, chemical inhibitor, supplies, insurance and normal well repair expense. The operating expenses were held constant for the economic life of each lease. No deduction was made for indirect costs such as loan repayments, interest expense and exploration and development prepayments that are not charged directly to the leases or wells.
General
The estimates of reserves presented herein are based upon a detailed study of the properties in which Eos Petro, Inc. owns a working interest. For the purposes of this report, we did not perform any field inspection of the property, nor did we examine the mechanical operation or condition of the wells and facilities. We have not investigated possible environmental liability, therefore our estimates do not include any costs due to such possible liability.
Future revenue estimates include estimates of the costs to plug and abandon the existing wells and facilities, net of any salvage value. Estimated plugging and restoration liability for the existing wells and tank battery facility exceed the estimated salvage value for the well equipment and facility equipment. The estimated net liability, $150,000, is included as capital expenditures over the last 5 years of production split between the proved developed reserve categories.
4
Eos Petro, Inc. has supplied to Hahn Engineering, Inc. their pertinent accounts, records and other data for this investigation. Historical information and data from a prior operator, Superior Oil Company, was also utilized. The ownership interests, expenses and other factual data furnished were accepted as presented. The historical oil sales data was obtained from IHS Energy/Petroleum Information and generally available through November 2013.
Hahn Engineering, Inc. does not have any interest in the subject properties and neither the employment to perform this study nor the compensation is contingent on our estimates of reserves and future income for the subject properties.
Hahn Engineering, Inc. does not guarantee the reserve estimates or the net cash flow projections. Thank you for this opportunity to be of service.
Yours truly,
HAHN ENGINEERING, INC.
/s/ Joseph K. Hahn
Joseph K. Hahn, P.E.
Exhibit A
5
THIRD PARTY REPORT OF RESERVES
By: Hahn Engineering, Inc.
This report is provided to satisfy the requirements contained in Item 1202(a)(8) of U. S. Securities and Exchange Commission Regulation S-K.
The numbering of items below corresponds to the requirements set out in Item 1202(a)(8) of Regulation S-K. Terms to which a meaning is ascribed in Regulation S-K and Regulation S-X have the same meaning in this report.
|
|
i.
|
We have prepared an independent evaluation of the reserves of Eos Petro, Inc. (the “Company”) for the management and the board of directors of the Company. The primary purpose of our evaluation report was to provide estimates of reserve information in support of the Company’s year-end reserves reporting requirements under U. S. Securities Regulation S-K and for other internal business and financial needs of the Company.
|
|
|
ii.
|
We have evaluated the reserves of the Company as of December 31, 2013. The completion date of our report is February 3, 2014.
|
|
|
iii.
|
The following table set forth the geographic area covered by our report, proved reserves estimated using constant prices and costs, and the proportion of the total company that we have evaluated.
|
Our report covers 100% of the Company’s proved oil and natural gas reserves.
|
Company Net Reserves
|
||||||||||||||||
|
Natural
|
Natural
|
Oil
|
||||||||||||||
|
Crude Oil
|
Gas
|
Gas Liquids
|
Equivalent
|
|||||||||||||
|
Category
|
Mbbl
|
MMcf
|
Mbbl
|
Mbbl
|
||||||||||||
|
Proved
|
||||||||||||||||
|
Developed
|
41.45 | 0 | 0 | 41.45 | ||||||||||||
|
U.S.A
|
||||||||||||||||
|
Undeveloped
|
180.96 | 0 | 0 | 180.96 | ||||||||||||
|
U.S.A.
|
||||||||||||||||
|
Total Proved
|
222.41 | 0 | 0 | 222.41 | ||||||||||||
|
|
iv.
|
As noted in item iii, our evaluation covers all of the Company’s proved reserves. We carried out our evaluation in accordance with the definitions and guidelines of the U. S. Securities and Exchange Commission and conform to the FASB Standards.
Data used in our evaluation was obtained from Company files. In the preparation of our report we have accepted as presented, and have relied without independent verification upon a variety of information furnished by the Company such as interests and burdens, recent production, historical production, capital costs, operating expense data, budget forecasts and capital cost estimates. For the purposes of this report, we did not perform any field inspection of the properties, nor did we examine the mechanical operation or condition of the wells and facilities. We have not investigated possible environmental liability related to the properties; therefore, our estimates do not include any costs due to such possible liability. Future revenue estimates include the Company’s estimates of the costs to abandon the wells and production facilities, net of any salvage value. Abandonment costs are included as capital costs.
In our opinion, estimates provided in our report have, in all material respects, have determined in accordance with applicable industry standards, and results in our report and summarized herein are appropriate for inclusion in filings under Regulation S-K.
|
6
|
|
v.
|
As required under SEC Regulation S-K, reserves are those quantities of oil and gas that are estimated to be economically producible under economic conditions. As specified, in determining economic production, constant product reference prices have been based on a 12 month average price, calculated as the unweighted arithmetric average of the first day-of-the-month price for each month with the 12 month period prior to the effective date of our report. In our economic analysis, operating and capital costs are those costs estimated as applicable at the effective date of our report, with no future escalation. Where deemed appropriate, the capital costs and revised operating costs associated with the implementation of committed projects designed to modify specific field operations in the future may be included in economic projections.
|
|
|
vi.
|
Our report has been prepared assuming the continuation of existing regulatory and fiscal conditions subject to the guidance of the SEC regulations. Notwithstanding that the Company currently has well permits to drill many of the wells identified in our report, there is no assurance that changes in regulation will not occur; such changes, which cannot reliably be predicted, could impact the Company’s ability to recover any of the estimated reserves.
|
|
|
vii.
|
Oil and gas reserve estimates have an inherent degree of associated uncertainty the degree of which is affected by many factors. Reserve estimates will vary due to the limited and imprecise nature of data upon which the estimates of reserves are predicated. Moreover, the methods and data used in estimating reserves are often necessarily indirect or analogical in character rather than direct and deductive. Furthermore, the persons involved in the preparation of reserve estimates and associated information are required, in applying geosciences, petroleum engineering and evaluation principles, to make numerous unbiased judgments based upon their educational background, professional training, and professional experience. The extent and significance of the judgments to be made are, in themselves, sufficient to render reserves estimates inherently imprecise. Reserve estimates may change substantially as additional data becomes available and as economic conditions impacting oil and gas prices and costs change. Reserve estimates will also change over time due to other factors such as knowledge and technology, fiscal and economic conditions, contractual, statutory and regulatory provisions.
|
|
|
viii.
|
In our opinion, Hahn Engineering, Inc. has used all methods and procedures as it considered necessary under the circumstances to prepare the report.
|
|
|
ix.
|
A summary of the Company reserves evaluated by us is provided in item iii.
|
Hahn Engineering, Inc.
P. O. Box 190251
St. Louis, MO 63119
February 3, 2014
/s/ Joseph K. Hahn
Joseph K. Hahn, P.E.
President
7
Illinois Basin Posted Crude Oil Prices
By: Plains Marketing L.P. Crude Oil Purchaser
|
Date
|
Posted Price per Bbl.
|
|
12/31/2012
|
$ 85.00
|
|
1/31/2013
|
$ 90.50
|
|
3/01/2013
|
$ 83.75
|
|
4/01/2013
|
$ 90.00
|
|
5/01/2013
|
$ 86.50
|
|
5/31/2013
|
$ 85.00
|
|
7/01/2013
|
$ 89.50
|
|
8/01/2013
|
$ 98.00
|
|
8/30/2013
|
$100.50
|
|
10/01/2013
|
$ 95.00
|
|
11/01/2013
|
$ 89.50
|
|
11/29/2013
|
$ 85.75
|
|
Average
|
$ 89.92
|
8
9
10
11
12
13
14
15
16
17
18
19
20