Attached files
| file | filename |
|---|---|
| EX-10.40 - EX-10.40 - SIRVA INC | d693356dex1040.htm |
| EX-10.46 - EX-10.46 - SIRVA INC | d693356dex1046.htm |
| EX-21.1 - EX-21.1 - SIRVA INC | d693356dex211.htm |
| EX-4.1 - EX-4.1 - SIRVA INC | d693356dex41.htm |
| EX-23.1 - EX-23.1 - SIRVA INC | d693356dex231.htm |
| EX-10.44 - EX-10.44 - SIRVA INC | d693356dex1044.htm |
| EX-10.38 - EX-10.38 - SIRVA INC | d693356dex1038.htm |
| EX-10.42 - EX-10.42 - SIRVA INC | d693356dex1042.htm |
| EX-10.39 - EX-10.39 - SIRVA INC | d693356dex1039.htm |
| EX-4.2 - EX-4.2 - SIRVA INC | d693356dex42.htm |
| EX-10.43 - EX-10.43 - SIRVA INC | d693356dex1043.htm |
| EX-10.45 - EX-10.45 - SIRVA INC | d693356dex1045.htm |
| EX-10.41 - EX-10.41 - SIRVA INC | d693356dex1041.htm |
Table of Contents
As filed with the Securities and Exchange Commission on March 28, 2014
Registration No. 333-
UNITED STATES
SECURITIES AND EXCHANGE COMMISSION
Washington, D.C. 20549
FORM S-1
REGISTRATION STATEMENT UNDER THE SECURITIES ACT OF 1933
SIRVA, Inc.
(Exact name of registrant as specified in its charter)
| Delaware | 4700 | 52-2070058 | ||
| (State or Other Jurisdiction of Incorporation or Organization) |
(Primary Standard Industrial Classification Code Number) |
(I.R.S. Employer Identification Number) |
One Parkview Plaza
Oakbrook Terrace, IL 60181
(630) 570-3050
(Address, Including Zip Code, and Telephone Number, Including Area Code, of Registrant’s Principal Executive Offices)
Thomas Oberdorf
Chief Financial Officer
One Parkview Plaza
Oakbrook Terrace, IL 60181
(630) 570-3050 (Phone)
(Name, Address, Including Zip Code, and Telephone Number, Including Area Code, of Agent For Service)
Copies to:
| Alexander D. Lynch, Esq. Weil, Gotshal & Manges LLP 767 Fifth Avenue New York, New York 10153 (212) 310-8000 (Phone) (212) 310-8007 (Fax) |
Rachel W. Sheridan, Esq. Latham & Watkins LLP 555 Eleventh Street, NW, Suite 1000 Washington, DC 20004 (202) 637-2200 (Phone) (202) 637-2201 (Fax) |
Approximate date of commencement of proposed sale to the public: As soon as practicable after the effective date of this Registration Statement.
If any of the securities being registered on this Form are to be offered on a delayed or continuous basis pursuant to Rule 415 under the Securities Act of 1933, check the following box. ¨
If this Form is filed to register additional securities for an offering pursuant to Rule 462(b) under the Securities Act, please check the following box and list the Securities Act registration statement number of the earlier effective registration statement for the same offering. ¨
If this Form is a post-effective amendment filed pursuant to Rule 462(c) under the Securities Act, check the following box and list the Securities Act registration statement number of the earlier effective registration statement for the same offering. ¨
If this Form is a post-effective amendment filed pursuant to Rule 462(d) under the Securities Act, check the following box and list the Securities Act registration statement number of the earlier effective registration statement for the same offering. ¨
Indicate by check mark whether the registrant is a large accelerated filer, an accelerated filer, a non-accelerated filer or a smaller reporting company. See the definitions of “large accelerated filer,” “accelerated filer” and “smaller reporting company” in Rule 12b-2 of the Exchange Act.
Large accelerated filer ¨ Accelerated filer ¨ Non-accelerated filer x Smaller reporting company ¨
CALCULATION OF REGISTRATION FEE
|
| ||||
| Title of Each Class of Securities to be Registered |
Proposed Maximum Aggregate Offering Price (1)(2) |
Amount of Registration Fee | ||
| Common Stock, $0.01 par value per share |
$175,000,000 | $22,540 | ||
|
| ||||
|
| ||||
| (1) | Estimated solely for the purpose of calculating the registration fee in accordance with Rule 457(o) promulgated under the Securities Act. |
| (2) | Includes shares of common stock that may be issuable upon exercise of an option to purchase additional shares granted to the underwriters. |
The Registrant hereby amends this Registration Statement on such date or dates as may be necessary to delay its effective date until the Registrant shall file a further amendment which specifically states that this Registration Statement shall thereafter become effective in accordance with Section 8(a) of the Securities Act or until the Registration Statement shall become effective on such date as the Commission, acting pursuant to said Section 8(a), may determine.
Table of Contents
The information in this preliminary prospectus is not complete and may be changed. Neither we nor the selling stockholders may sell these securities until the registration statement filed with the Securities and Exchange Commission is effective. This preliminary prospectus is not an offer to sell these securities and neither we nor the selling stockholders are soliciting an offer to buy these securities in any state where the offer or sale is not permitted.
PROSPECTUS (Subject to Completion)
Dated March 28, 2014
Shares

SIRVA, Inc.
Common Stock
SIRVA, Inc. is offering shares of common stock and the selling stockholders are offering shares of common stock. We will not receive any proceeds from the sale of shares by the selling stockholders. This is our initial public offering and no public market currently exists for our shares of common stock. We expect the public offering price to be between $ and $ per share.
We intend to apply to list our common stock on the New York Stock Exchange (the “NYSE”) or NASDAQ Global Market (“Nasdaq”) under the symbol “ .”
Investing in our common stock involves risks. See ‘‘Risk Factors’’ beginning on page 21.
Price $ A SHARE
| Price to Public |
Underwriting and |
Proceeds to |
Proceeds to |
|||||||||||||
| Per share |
$ | $ | $ | $ | ||||||||||||
| Total |
$ | $ | $ | $ | ||||||||||||
We have granted the underwriters the right to purchase an additional shares of common stock, and the selling stockholders have granted the underwriters the right to purchase an additional shares of common stock.
Neither the Securities and Exchange Commission nor any state securities commission has approved or disapproved of these securities or determined if this prospectus is truthful or complete. Any representation to the contrary is a criminal offense.
The underwriters expect to deliver the shares of common stock to purchasers on or about , 2014.
| MORGAN STANLEY | GOLDMAN, SACHS & CO. | J.P. MORGAN |
| BAIRD | WILLIAM BLAIR |
, 2014.
Table of Contents
You should rely only on the information contained in this prospectus or in any free-writing prospectus we may authorize to be delivered or made available to you. Neither we, the selling stockholders nor the underwriters (or any of our or their respective affiliates) have authorized anyone to provide any information other than that contained in this prospectus or in any free writing prospectus prepared by or on behalf of us or to which we have referred you. Neither we, the selling stockholders nor the underwriters (or any of our or their respective affiliates) take any responsibility for, and can provide no assurance as to the reliability of, any other information that others may give you. We, the selling stockholders and the underwriters (or any of our or their respective affiliates) are not making an offer to sell these securities in any jurisdiction where the offer or sale is not permitted. The information contained in this prospectus is only accurate as of the date on the front cover of this prospectus. Our business, financial condition, results of operations and prospectus may have changed since that date.
Trademarks and Trade Names
We own or have the rights to use various trademarks, service marks and trade names referred to in this prospectus, including, among others, SIRVA, SIRVA Relocation, Allied, northAmerican, iMove.com and their respective logos. Solely for convenience, we refer to trademarks, service marks and trade names in this prospectus without the ™, SM and ® symbols. Such references are not intended to indicate, in any way, that we will not assert, to the fullest extent permitted by law, our rights to our trademarks, service marks and trade names. Other trademarks, trade names or service marks appearing in this prospectus are the property of their respective owners.
Market and Industry Information
Market data and industry information used throughout this prospectus is based on management’s knowledge of the industry and the good faith estimates of management. We also relied, to the extent available, upon management’s review of independent industry surveys and publications and other publicly available information prepared by a number of sources, including IBISWorld Inc., Information Week, PwC Talent Mobility 2020, Workforce Management, Worldwide ERC and the American Moving and Storage Association. All of the market data and industry information used in this prospectus involves a number of assumptions and limitations, and you are cautioned not to give undue weight to such estimates. Although we believe that these sources are reliable, we cannot guarantee the accuracy or completeness of this information and we have not independently verified this information. While we believe the estimated market position, market opportunity and market size information included in this prospectus is generally reliable, such information, which in part is derived from management’s estimates and beliefs, is inherently uncertain and imprecise. Projections, assumptions and estimates of our future performance and the future performance of the industry in which we operate are necessarily subject to a high
Table of Contents
degree of uncertainty and risk due to a variety of factors, including those described in “Risk Factors,” “Forward-Looking Statements” and elsewhere in this prospectus. These and other factors could cause results to differ materially from those expressed in our estimates and beliefs and in the estimates prepared by independent parties.
Until , 2014 (25 days after the date of this prospectus), all dealers that effect transactions in these securities, whether or not participating in this offering, may be required to deliver a prospectus. This is in addition to the dealers’ obligation to deliver a prospectus when acting as underwriters and with respect to their unsold allotments or subscriptions.
ii
Table of Contents
This summary highlights information contained elsewhere in this prospectus and does not contain all of the information that you should consider before investing in our common stock. You should read this entire prospectus, including the sections entitled “Risk Factors” and “Management’s Discussion and Analysis of Financial Condition and Results of Operations” and our consolidated financial statements and related notes thereto before making an investment decision. Unless otherwise stated in this prospectus, references to “we,” “our,” “us,” “SIRVA” and the “Company” and similar terms refer to SIRVA, Inc. and its consolidated subsidiaries.
Our Company
We are a leading provider of mobility services for multi-national corporations and government institutions. Our customers, typically corporate human resources departments, use SIRVA’s solutions to optimize the deployment of their professional talent on a global basis—ensuring that their best people are leading their most important initiatives, regardless of where in the world they are located. We serve a blue-chip customer base of more than 1,800 customers, including approximately 28% of the Fortune 500 and two-thirds of the Dow Jones 30.
We play a valuable role as the outsource partner for corporations and government institutions, providing an integrated solution that offers an overall enhanced mobility experience, program control and security for our customers, the relocating employee (the “transferee”) and the transferee’s family. We provide a suite of over 50 distinct mobility services, including relocation assistance and moving services. We enable our corporate and institutional customers to outsource their mobility needs, allowing them to focus on executing their strategies and enhancing their productivity. In 2013, we executed over 280,000 mobility events for our corporate, government and consumer customers. Our approximately 2,700 employees, located both within our offices and on-site within our customers’ human resources departments, provide a customized solution for each transferee.
Consistent with our marketing slogan “Everything you need, everywhere you need it,” we provide our customers with what we believe to be the most global and complete mobility solution. This has enabled us to maintain long-term relationships with our customers, as reflected by our high customer retention rates. For example, from 2011 to 2013, we achieved a 98% retention rate for our corporate customers in our Mobility Solutions segment.
A transfer to a new location is a challenging time for the transferee, their spouse/partner and their entire family, and can be even more difficult if the job is located in a new country with a different language and culture. We assist the corporation and the transferee with each aspect of the mobility process to ensure a smooth relocation and we generate revenue from each of the mobility services that we provide. Our relocation services, or mobility solutions, are provided by us and our network of third-party providers, and our moving services, or mobility networks, are provided through our agent/franchise network.
1
Table of Contents
The following is an example of the transfer of an executive and his family from Boston to Beijing and illustrates the mobility services that we provide:
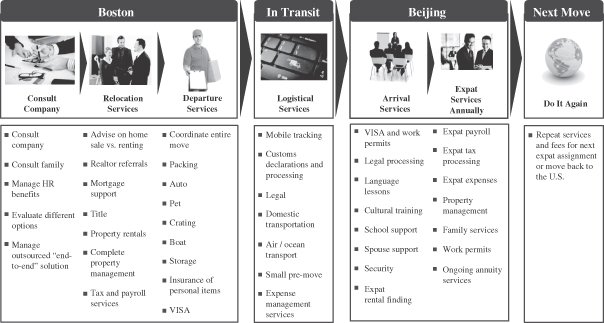
Our expertise in providing mobility services lies in our proprietary processes, our technological capabilities and our knowledge of the complex technical and logistical components of mobilizing talent on a global basis. For example, our technical knowledge of relocation requirements in the key areas of employment law, governance, expatriate taxes, compensation, customs, immigration, cultural integration, logistics and global supply chain optimization help ensure successful mobility events worldwide.
Our technological capabilities are core to our business model and customer value proposition. Our technology team has 140 employees and a dedicated research and development budget. We utilize leading technology to provide everyone involved in a mobility event—from the human resources department, the transferee and the transferee’s family to our agents/franchises and third-party providers—with a secure connection to our flexible technology network. Our technological capabilities have been acknowledged by our customers and their technology experts. In 2013, we were named on the Information Week 500 list of Top Technology Innovators, an annual listing of the most innovative corporate users of business technology in the United States across all industries, for the 11th consecutive year, earning the #126 position.
We operate an asset-light agent/franchise network, which has attributes similar to a traditional franchise model. We provide our mobility services through 1,224 locations, including 66 company-operated locations and 1,158 agent/franchise locations, in approximately 170 countries. We deliver our relocation services, or mobility solutions, directly and through contracted third-party providers. Our network of third-party providers allows us to deliver specialized, local expertise in a wide range of countries and manage such services without incurring the costs of establishing them on an in-house basis. Our agents and franchises operate in the United States and Canada under our nationally recognized moving brands Allied and northAmerican, and in the rest of the world under our Allied brands. Our mobility networks, established over many decades, allow us to deliver a quality customer experience and manage the move, while the agents and franchises provide the capital and labor-intensive aspects of the operations, including moving vehicles, warehouses and packaging and transportation support teams.
2
Table of Contents
Over the period from 2008 to 2013, we completed a series of business initiatives designed to improve our financial performance. These initiatives included implementing new policies intended to improve our risk management, focusing on an asset-light strategy, hiring a new management team, divesting non-core businesses that were not directly related to providing mobility services, and lowering our indebtedness.
Approximately 71% of our 2013 total revenue was derived from contracts with our corporate customers, which generally have durations ranging from one to four years. Approximately 29% of our 2013 total revenue was not from contracts, but was largely funded by corporations that provide “lump sum” payments to their transferring employees. We have a diversified customer base, with no single customer accounting for more than 2.4% of our total revenue in 2013 and our top ten customers accounting for approximately 12% of our total revenue in 2013.
Between 2009 and 2013, we increased our total revenue from $1,676.4 million to $1,994.2 million, Net Service Revenue from $343.2 million to $462.7 million, Adjusted EBITDA from $13.9 million to $76.8 million and net income (loss) from $(78.0) million to $9.7 million. For fiscal years 2011, 2012 and 2013, our total revenue was $1,932.4 million, $1,950.8 million and $1,994.2 million, respectively, Net Service Revenue was $428.9 million, $447.0 million and $462.7 million, respectively, Adjusted EBITDA was $54.4 million, $66.7 million and $76.8 million, respectively, and net income (loss) was $(52.9) million, $(1.4) million and $9.7 million, respectively. For information on how we define Adjusted EBITDA and Net Service Revenue and reconciliations of net income (loss) to Adjusted EBITDA and total revenue to Net Service Revenue, see “—Summary Historical Financial and Other Data.”
Our Market Opportunity
Mobility Services are Critical for Talent Management
The talent needs of multi-national corporations are becoming increasingly global and complex. Strategic business decisions normally depend upon the deployment of employees to the most important projects with speed and agility, which drives demand for mobility services. Mobility services consist of managing numerous, distinct mobility events involving the relocation of the transferee, the transferee’s family and the transferee’s household goods from their originating location to a destination location, while also managing the related legal requirements, visa and immigration requirements, human resources policies and transferee-specific needs.
Trend Toward Outsourcing Mobility Services
In 2012, 90% of U.S.-based corporations surveyed by Worldwide ERC outsourced mobility services. Although large corporations often have a mobility function or capability within their human resources departments, they do not typically possess the expertise or local resources across diverse geographies to manage the numerous processes involved in a mobility event. Accordingly, most corporations outsource these functions to mobility services providers to leverage the provider’s scale, expertise and technology. When seeking a provider of outsourced mobility services, human resources departments seek consistent quality of experience for their transferees, global capabilities with local service delivery, regulatory compliance and security, robust technology capabilities and program management and control.
Large and Growing Global Market
Global mobility services is a large and growing market, consisting of a range of highly diversified services that enable corporations and government institutions to deploy executives and key personnel to locations throughout the world. Globalization, GDP performance, corporate spending and employment levels are key growth drivers in this market. Several trends, including corporate expansion into emerging markets and increased regulatory complexity, are also driving the shift to outsourced mobility services.
3
Table of Contents
U.S. Market
The U.S. mobility services market is well developed and is the largest mobility services market in the world. Third-party research describes U.S. mobility services as consisting of different sub-components, with relocation services and moving services as the largest.
| • | Relocation Services. IBISWorld Inc. (“IBISWorld”) estimates that the market for U.S. relocation services was $11.7 billion for 2013 and is forecasted to grow at an annualized rate of 6.9% from 2013 to 2018 to a total of $16.3 billion. Relocation services include expatriate services, temporary housing, property management, realtor advice, home sale and purchasing assistance and other value-added services. According to IBISWorld, we were a market leader in U.S. relocation services with an 18% U.S. market share in 2012. |
| • | Moving Services. IBISWorld estimates that the market for U.S. moving services was $15.5 billion market for 2014 and is forecasted to grow at an annualized rate of 2.0% from 2014 to 2019 to a total of $17.1 billion. Moving services include moving, valuables protection, records management and storage, integrated logistics and information services and other value-added services. According to the American Moving and Storage Association (“AMSA”), we had a 29% U.S. market share for interstate moves in 2013 among companies that self-report to AMSA. |
International Markets
The international mobility services market has also experienced growth. In 2013, international mobility managers reported that companies moving employees to or from international regions grew an estimated 12% in Central and South America, 10% in the Middle East and 9% in Australia, New Zealand, India and Northeast Asia. According to PricewaterhouseCoopers’ Talent Mobility 2020, the average number of mobile employees from global organizations has grown 25% over the past decade and is estimated to grow an additional 50% by 2020.
| • | Europe. We believe Europe is the second largest location for headquarters of large corporations. 151 of the Global Fortune 500 corporations are headquartered in Europe and account for a significant amount of global mobility volume. |
| • | Asia and Emerging Markets. We believe China, Brazil and India are growing markets for mobility services. As more corporations in these countries develop into global leaders, we believe their mobility needs will increase. Additionally, countries in the Middle East, including the United Arab Emirates, Qatar and Saudi Arabia, are becoming increasingly important to global corporations, driven partially by the energy industry, but also by technology, industrial, retail and business services sectors. |
| • | Australia. Australia is a relatively mature market, which is primarily impacted by the mining sector. Our revenue growth in this region has been predominantly driven by the addition of new services, new customer wins and the strength of our Allied and SIRVA Relocation brands. According to IBISWorld, we had the #1 position in Australia’s moving services market in 2013. |
Competitive Landscape
The mobility services industry is characterized by several well-established competitors. The substantial start-up costs associated with establishing the required infrastructure, establishing a global reach, building an extensive agent network and developing a credible reputation with multi-national corporations could deter new competitors from entering the market. Additionally, global mobility events often require local service delivery capabilities in a wide range of foreign markets and mobility-related local domain expertise, thereby limiting the risk that the industry will be subject to the introduction of disruptive technologies or that existing providers can be replaced by low-cost, off-shoring business models.
4
Table of Contents
Corporate Lump Sum
In addition to relocation benefits programs provided to key executives, corporations also provide mid and low-level employees with lump sum payments to purchase mobility services directly. We believe there is an opportunity to help these transferees acquire mobility services and to enable human resources departments to manage their lump sum programs and provide additional benefits to these transferees. Individual consumers may also seek similar assistance with mobility services in connection with their moves, which we believe is another market opportunity. To take advantage of this, in October 2013 we launched our LumpSum Xpress Marketplace. This program provides an online marketplace for mobility services, enabling transferees to manage their lump sum benefits online and enabling human resources departments to administer and track their lump sum programs.
Do-It-Yourself, Self-Storage and Containerization
There is also a Do-It-Yourself (“DIY”) moving and storage market. In contrast to a full-service corporate solution, DIY relocations are typically completed directly by the transferee or consumer and are normally provided at a lower price point. The DIY market is generally comprised of lower level employees who receive few benefits and consumers that need a more economical service to relocate to their new job and provides an additional market opportunity for mobility solutions providers. In March 2014, we acquired SMARTBOX Portable Self Storage (“SMARTBOX”), a DIY moving and storage company, to address this market opportunity.
Differentiated Delivery Model
We place great value in offering an integrated end-to-end mobility solution to our customers. Both domestically and internationally, we strategically apply our core competencies to directly deliver select mobility services through our own staff and to deliver other services either through our agents and franchises or through partnerships with third-party mobility service providers. This approach enables us to relocate transferees across the globe, while delivering these specialized services with consistent quality on a local basis. Our domain experts work closely with our agent/franchise network and local third-party providers in order to maintain control over the services supply chain and provide our customers and their transferees with a secure experience.
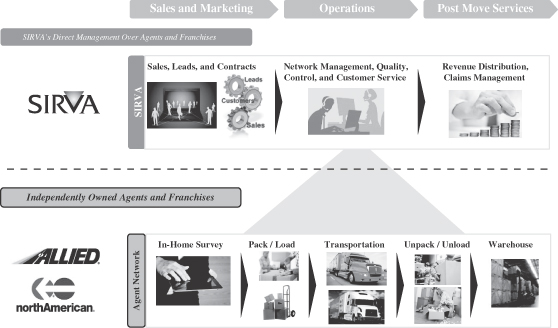
Our independently owned agent network performs the moving and related services that we offer to our customers located in the United States and Canada. The agent network supports the physical transportation of a transferee’s household goods under our two nationally recognized moving brands—Allied and northAmerican. Our network in the United States and Canada, which is similar to a franchise model, includes 419 third-party agents serving customers in 712 locations. We do not own the assets required to move our customers in these locations. In contrast, our agents own and manage these assets required to execute and deliver moving services. They maintain their own fleet of transportation vehicles and real estate portfolio of warehouses and have packing/unpacking crews on their payroll. We believe our agent network positions us to maintain a low fixed-cost structure and provides us with significant operating leverage. We recently renewed the majority of the contracts with our agent network through January 2018.
5
Table of Contents
The following graphic illustrates examples of the services we provide to our agent network and the activities that are performed by our agent network:
Competitive Strengths
The following is a description of the competitive strengths that have helped establish us as a leading global mobility service provider:
Our Broad and Integrated Suite of Service Offerings
We provide an integrated end-to-end mobility solution for our customers. We take ownership of the key aspects of our customers’ global mobility programs and deliver over 50 distinct service offerings through our in-house domain experts, our network of exclusive agents and franchises and our third-party providers. Our broad, integrated suite of services enables us to provide a customized solution for each mobility event, including transferee-specific services at origin, moving of household goods and destination services, and in the case of an international relocation, on-going expatriate services during the foreign assignment.
Our Global Scale
We provide services across six continents and in over 170 countries. We serve more than 1,800 corporate customers globally, including 28% of the Fortune 500 and two-thirds of the Dow Jones 30. We operate two of the four largest nationally recognized moving network brands in the United States—Allied and northAmerican—which are leveraged across a network of 419 third-party agents in the United States and Canada. Internationally, we provide moving services under our Allied brands.
Our Local Delivery and Execution
We have built a worldwide local delivery capability in over 170 countries through our 66 company-operated locations, our 1,158 agent and franchise locations and our third-party provider network. These local agent,
6
Table of Contents
franchises and third-party provider relationships enable us to serve the complex needs of large multi-national corporations even in challenging or undeveloped markets while maintaining an asset-light structure. We actively manage our agent, franchise and third-party provider network, enabling us to deliver a consistent quality of service. We also maintain the ability to provide select services directly through our in-house domain experts to control sensitive aspects of a relocation. For example, our employees provide increased safety for the transferee’s family and protection over their personal information by directly delivering services in many challenging or developing countries, which we believe provides us with a competitive advantage.
Our Deep Domain Expertise
Our deep domain expertise in mobility services and our extensive global experience servicing the corporate human resources departments of Global Fortune 500, mid-size companies and small businesses enables us to accurately anticipate the complexities inherent in any mobility event. We typically review and update our customers’ mobility policy as a key aspect of on-boarding a new customer. We apply our domain expertise to establish our proprietary mobility processes and robust technological capabilities, and combine them with our employees’ knowledge of, and experience in, the complex technical, logistical and technological components in mobilizing talent around the world. Our employees are highly trained and we have certified relocation and moving experts on our teams to serve customers. In addition to providing an enhanced transferee experience and better control, we believe our expertise reduces the risk of non-compliance with laws in different geographies. This helps prevent some of the most critical and costly errors for our customers, such as the deportation of a transferred executive due to an unforeseen visa issue or tax compliance problems in the United States or a foreign country due to inaccurate reporting.
A Leading Technology Capability
Our technology platform is integrated with our customers’ human resources departments, our agent/franchise network and our third-party providers. As of December 31, 2013, we employed 140 full-time technology professionals to develop, maintain and support our technology platforms and services. We have developed an extensive knowledge of the technologies deployed for mobility solutions, which has enabled us to design and build our technology and deploy it to our customers. Our proprietary global assignment platform, SIRVA Connect, provides us with the ability to estimate costs for a move, initiate a transaction, measure and track progress and manage key aspects of a mobility event, as well as collaborate with human resources departments. Transferees are also able to manage their transfer, allowing them to track the movement of their household goods and view and request additional mobility services directly via our platform, which is accessible on the transferee’s laptop, tablet or mobile device. We have the ability to update our technology independently of the corporate IT departments with which we integrate, giving us the freedom to update and innovate our platform on our own schedule.
Our Trusted, Well-Recognized Global Brands

|

|

|
We market the SIRVA brand to human resource professionals globally. We also own two of the top brands in moving services in the United States and Canada—Allied and northAmerican. According to the 2013 Workforce Management Relocation Hotlist, SIRVA held a 19% share globally in relocation services in 2013. In 2013, we were a market leader in U.S. relocation services according to IBISWorld.
7
Table of Contents
Management Team
The core values of our leadership team are integrity, collaboration, customer service and capital efficiency. Our leadership team has a diverse set of management experiences from companies including General Electric, McKinsey & Company, AlliedSignal, Getty Images, Prudential Financial, Xerox, Ricoh, Motorola and Dell Inc. Both our CEO, Wes Lucas, and our CFO, Tom Oberdorf, have over 14 years of experience in their respective roles. Since Mr. Lucas joined us in 2008, Net Service Revenue has grown from $343.2 million to $462.7 million over the period from 2009 to 2013, which represents a compound annual growth rate (“CAGR”) of 8%, and Adjusted EBITDA has grown from $13.9 million to $76.8 million over the period from 2009 to 2013, which represents a CAGR of 53%.
Growth Strategies
We intend to capitalize on our leading position in mobility services and our global scale to increase revenue, enhance our profitability and maximize the return on investment for our stockholders. We seek to achieve these objectives by executing on the following key strategies:
Grow Market Share and Win New Customers
We intend to leverage our leading market position, global presence, well-recognized brands, integrated service offering and commitment to delivering a high-quality of service to grow our market share and win new customers. Our recently implemented sales and marketing initiatives, including an expanded sales team, a new global sales strategy, targeted marketing efforts and new agent/franchise sales process will be integral in our efforts to win new customers. We believe that our differentiated technology solutions will also be a key factor in our ability to increase our market share. In 2013, we won four out of the five largest requests for proposal (“RFPs”) that we competed for and signed 41 new U.S. and Canadian corporate relocation customers. We believe that the addition of these new customers will provide incremental revenue and reinforce our leading position in the mobility services market. We are focused on offering customizable solutions, which enable us to win business and develop long-standing relationships with our customers, leading to a 98% customer retention rate for the period from 2011 to 2013 for our corporate customers in our Mobility Solutions segment.
Expand Globally
We believe there are growth opportunities in Asia, the Middle East, South America and Africa as corporations in these markets continue to expand their global reach, increasing their need for global mobility services, and as U.S. and European multinational corporations continue to focus on growing in these regions. We have an extensive agent/franchise network in these regions, including 85 locations in Asia Pacific, 113 locations in Africa and the Middle East and 63 locations in Central America and South America. In addition, we have 51 company-operated locations in Asia Pacific, three locations in Africa and the Middle East and two locations in Central and South America. In 2012, we hired a team of mobility professionals to lead our growth efforts in Asia, and we have been focused on strengthening our market position in underserved countries in that region, including China, Singapore and Malaysia. Additionally, in 2011 and 2012, we acquired relocation services businesses with locations in India and Brazil and invested in these regions to further strengthen our ability to serve these markets. We are also planning to expand our service offerings in key markets, including offering new immigration services in Malaysia, new destination services in the United Arab Emirates and new relocation services in Qatar.
We are also targeting expansion of our business in Europe. We believe that we can leverage our existing European mobility infrastructure, consisting of 171 agent/franchise locations and two company-operated offices in 42 countries, which we have developed to serve our U.S.-based customers, to market to these European-headquartered companies. We are also investing in sales and marketing capabilities in the region to expand our
8
Table of Contents
customer base. For example, in 2012, we hired a mobility professional with over 20 years of experience in the global mobility industry to lead our European operations. During 2012 and 2013, we had success winning business with three large European-headquartered customers. In addition, in March 2014, we acquired InHouse Relocation GmbH (“InHouse”), a niche German mobility company, to grow our position in Germany.
Increase “Share of Wallet” with Current Customers
Our broad service offerings provide an opportunity to cross-sell our diverse suite of services. Our team of dedicated domain experts works closely with our customers and their transferees to understand their individual needs at every stage of the relocation process and to identify areas where we can increase the quantity and depth of services that we provide to our customers and their transferees. We believe we are positioned to leverage the breadth of our mobility services to expand the scope of our work with a particular customer in a variety of ways. For example, once we have established a relationship with our customers, our account managers seek to add services to the contract, such as our visa services. Our moving counselors also offer transferees additional services during the relocation and at their destination location.
Continue New Product Development
We intend to continue to develop and market new technologies and tools that are designed to solidify our market position, expand our customer base, convert internet leads into revenue generating opportunities and be more responsive to our customers’ needs. We have several projects in various stages of development that we believe can be commercialized into attractive organic growth opportunities. Certain projects in development involve combining our industry expertise, global reach and proprietary technology platform to provide our customers with highly customized solutions. For example, we have recently developed a corporate human resources portal to enable human resources departments to access our mobility services directly, commercialized a global cost estimator and implemented a new reporting tool. We have also developed a portal for transferees so that they can shop directly for services, receive support and track the movement of their household goods. This portal is accessible on the transferee’s mobile phone and tablet. Additionally, we are working on expanding our service offerings to increase customer usage of higher margin services, such as expatriate taxes and compensation services.
Expand Into Adjacent Markets
We are continuously looking for opportunities to enter adjacent markets and capture new business. In October 2013, we launched the LumpSum Xpress Marketplace, targeting individual transferees who receive a lump sum payment to relocate and are obtaining mobility services on their own. These transferees are often a majority of a corporation’s relocating employees and tend to be mid or low-level employees and new hires. We believe this represents an under-served market. Our product provides a portal to our global network of agents, franchises and third-party providers along with our local delivery capability, enabling the transferees to better facilitate their mobility experience and stretch their lump sum allowance by using discounts they earn through our supply chain. The human resources department is now able to offer these transferees a service never before available. The human resources department also benefits from visibility of the relocation services utilized and monies spent, which allows them to better manage this group of transferees.
We are also targeting the estimated $7.0 billion self-storage market and the multi-billion dollar self-moving market and believe that our March 2014 acquisition of SMARTBOX Portable Self Storage (“SMARTBOX”), a DIY moving and storage company, provides a platform for the expansion of our mobility solution into these DIY markets. We believe the SMARTBOX acquisition will allow us to expand our mobility service offering to our corporate customers that want to provide a DIY option to their employees and to consumers looking for a more economical moving and storage option.
9
Table of Contents
Improve Productivity and Operations to Increase Margins
We continually seek to improve our financial and operating performance through productivity improvement initiatives. We utilize Six Sigma, LEAN and other leading operational excellence tools to enhance our productivity. Over the last five years, we have focused on productivity improvements that we believe have positioned us to improve our operating efficiency. We are upgrading our IT systems and modernizing our operating system, installing GPS tracking devices on our agent’s trucks to enable network optimization and automating sales systems to enhance pricing capabilities and invoice processing. We have made significant progress to provide transferees with technology that improves their experience with us and streamlines the implementation of the mobility process. From 2009 to 2013, we reduced selling, general and administrative expense as a percent of Net Service Revenue from 53% to 39%, and Adjusted EBITDA as a percent of Net Service Revenue grew from 4% to 17% over this same period. We believe that there is potential to further increase our productivity.
Revenue Model
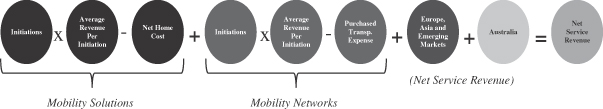
The primary driver of our revenue is initiations, which represent the volume of transferees and families engaging in a mobility event with us. A mobility event can last anywhere from a month to several years. The average revenue per initiation varies depending on the complexity of the mobility event and the number and mix of services utilized. The revenue per initiation includes fees paid by the transferee, fees paid by the corporation and referral fees we receive for services provided by contracted third-party providers.
In our Mobility Solutions segment, our initiations vary from multiple premium services for home owners (initiations with home ownerships) to single services, and cover both domestic and global initiations under contracts signed in the United States. The average revenue per initiation involving home owners is typically the highest because of the need for complex mobility services, higher benefit packages provided to employees and higher value of personal possessions. We earn fees for both the relocation of the transferee and their family from one location to another and also for the destination services we provide, which include visa, corporate housing, cultural training, language lessons, school and spousal/partner support, and additional fees from ongoing services including expatriate payroll, expatriate expenses, property management and other services. As part of our broad suite of service offerings, we also provide home purchase and home sale assistance. Home purchase and sale assistance contributes significant revenue overall by enabling us to capture other complex mobility services as part of the bundled offering, partially offset by the corresponding cost of assisting in these home purchase and sale transactions.
In our Mobility Networks segment, initiations are domestic or international in nature. The average revenue per initiation is a function of the mix of services required by the transferee. International initiations are typically the highest revenue per initiation due to more services needed by the transferee. We recognize revenue invoiced to the transferee and incur costs (purchased transportation expense, or “PTE”) for services provided by our agent/franchise network.
We are the sole contractor used for the program management of relocation services to most of our corporate customers in our Mobility Solutions segment. Our periodic conversations with human resource teams regarding
10
Table of Contents
their budgets for mobility events provide an indication of our future revenue, as corporate expenditure on relocation generally follows budget allocations and the corporate programs for employee benefits are difficult to change. These characteristics of our business model, combined with our high customer retention rate, provide us with visibility into our future business performance.
Our Principal Stockholders
Following the consummation of this offering, affiliates of Aurora Capital Group (“Aurora”) and Equity Group Investments (“EGI”) are expected to own approximately % and % of our outstanding common stock, respectively, or % and %, respectively, if the underwriters exercise their option to purchase additional shares in full. As a result, Aurora and EGI will be able to exert significant voting influence over fundamental and significant corporate matters and transactions. See “Risk Factors—Risks Related to this Offering” and “Principal and Selling Stockholders.”
Aurora and EGI may acquire or hold interests that compete directly with us, or may pursue acquisition opportunities that are complementary to our business, making such an acquisition unavailable to us. Our amended and restated certificate of incorporation will contain provisions renouncing any interest or expectancy held by our directors affiliated with Aurora and EGI in certain corporate opportunities. For further information, see “Risk Factors—Risks Related to Our Company and Our Organizational Structure—Each of Aurora and EGI independently has substantial control over us and will be able to influence corporate matters with respect to us. Aurora and EGI may have interests that differ from each other and from those of our other stockholders.”
Aurora Capital Group
Aurora Capital Group, founded in 1991, is a Los Angeles-based private investment firm. Aurora’s Resurgence Funds focus on investing in equity and debt securities of middle-market companies. Aurora acts as a constructive partner with management teams and other stakeholders to help drive financial growth and operational improvements. Its broad investment mandate allows Aurora to be a flexible source of capital in creating tailored solutions for companies across a variety of industries.
Equity Group Investments
Equity Group Investments is a Chicago-based private investment firm founded by Sam Zell over 40 years ago. The firm’s current investment portfolio has equity interests in real estate, energy, logistics, transportation, media and healthcare. EGI’s current holdings also include fixed-income investments in public and private companies.
Risks Affecting Our Business
Investing in our common stock involves a high degree of risk. You should consider carefully the risks described in “Risk Factors” before making a decision to invest in our common stock. If any of these risks actually occur, our business, financial condition and results of operations would likely be materially adversely affected. In such case, the trading price of our common stock would likely decline, and you may lose all or part of your investment. Below is a summary of some of the principal risks that we face.
| • | We face intense competition in each of our operating segments; |
| • | We may be affected by adverse conditions in the global economy or in global financial markets; |
11
Table of Contents
| • | Our customer contracts do not provide for any minimum purchase amounts, and if our customers are not successful, they could decrease the number of initiations or mobility benefits for their employees, and our customers have the ability to terminate their contract with us on short notice; |
| • | Our growth depends, in large part, on continued growth in outsourcing of mobility services; |
| • | We have a history of operating losses and may not maintain profitability in the future; |
| • | We are exposed to risks related to the purchase, ownership, financing and resale of transferred employees’ homes at a loss; |
| • | We contract to provide our premium home sale product on a fixed percentage basis and inaccurate estimates could materially impact the profitability of these services; |
| • | We often face a long selling cycle to secure a new contract with our corporate customers, as well as long implementation periods that require significant resource commitments; |
| • | Our international operations subject us to risks of doing business in foreign countries, including exposure to, and potential fines and other penalties from, anti-corruption laws and export-control regulations, including those promulgated by the Office of Foreign Assets Control (“OFAC”); |
| • | We are dependent on third-party providers and service instability from these providers could increase our operating costs, expose us to liability and reduce our ability to offer services; |
| • | Several of our business activities are highly regulated; and |
| • | Each of Aurora and EGI independently has substantial control over us and will be able to influence corporate matters with respect to us. |
Corporate Information
We are a Delaware corporation. SIRVA, Inc. was incorporated on March 29, 1998. Our principal executive offices are located at One Parkview Plaza, Oakbrook Terrace, IL 60181. Our telephone number at our principal executive offices is (630) 570-3050. Our corporate website is www.sirva.com. The information that appears on our website is not part of, and is not incorporated into, this prospectus.
12
Table of Contents
THE OFFERING
| Common stock offered by us |
shares ( shares if the underwriters exercise their option to purchase additional shares in full). | |
| Common stock offered by the selling stockholders |
shares ( shares if the underwriters exercise their option to purchase additional shares in full). | |
| Common stock to be outstanding after this offering |
shares ( shares if the underwriters exercise their option to purchase additional shares in full). | |
| Option to purchase additional shares of common stock |
The underwriters also have the option to purchase up to an additional shares of common stock from us and an additional shares of common stock from the selling stockholders identified in this prospectus. The underwriters can exercise this option at any time within 30 days from the date of this prospectus. | |
| Use of proceeds |
We estimate that the net proceeds to us from this offering will be approximately $ million, after deducting underwriting discounts and commissions and estimated expenses payable by us in connection with this offering. This assumes a public offering price of $ per share, which is the midpoint of the range set forth on the cover of this prospectus. We intend to use approximately $ of the net proceeds from this offering to redeem all of our outstanding Series A Preferred Stock, including accumulated dividends, and to use the remainder for general corporate purposes. We will not receive any of the proceeds from the sale of common stock by the selling stockholders. See “Use of Proceeds.” | |
| Dividend policy |
We do not anticipate paying any dividends on our common stock in the foreseeable future; however, we may change this policy in the future. See “Dividend Policy.” | |
| Voting rights |
Each share of our common stock will entitle its holder to one vote on all matters to be voted on by stockholders generally. See “Description of Capital Stock.” | |
| Risk factors |
Investing in our common stock involves a high degree of risk. See “Risk Factors” beginning on page 21 of this prospectus for a discussion of factors you should carefully consider before investing in our common stock. | |
| Proposed NYSE or Nasdaq symbol |
“ .” | |
13
Table of Contents
Unless otherwise indicated, the number of shares of common stock to be outstanding after this offering excludes:
| • | shares of common stock reserved for future grant under our compensation plans; |
| • | shares of our common stock issuable upon the exercise of options to purchase shares of our common stock outstanding as of , 2014, with a weighted average exercise price of $ per share; |
Unless otherwise indicated, all information in this prospectus:
| • | assumes an initial public offering price of $ per share, the midpoint of the range set forth on the cover of this prospectus. |
| • | assumes no exercise of the underwriters’ option to purchase up to additional shares of common stock from us and an additional shares of common stock from the selling stockholders; |
| • | gives effect to our amended and restated certificate of incorporation and our amended and restated bylaws, which will be in effect prior to the consummation of this offering; and |
| • | gives effect to a -for-1 stock split of our common stock prior to the consummation of this offering. |
14
Table of Contents
SUMMARY HISTORICAL FINANCIAL AND OTHER DATA
The following table sets forth our summary historical financial and other data for the periods and as of the dates indicated. We derived our summary consolidated statement of operations data for the years ended December 31, 2013, 2012 and 2011 and our balance sheet data as of December 31, 2013 from our audited consolidated financial statements included elsewhere in this prospectus. We derived our summary consolidated statement of operations data for the fiscal years ended December 31, 2010 and 2009 from our unaudited consolidated financial statements which are not included in this prospectus. The unaudited consolidated financial statements have been prepared on the same basis as the audited consolidated financial statements and, in our opinion, reflect all adjustments necessary for the fair presentation of the financial information set forth in those statements.
The summary unaudited as adjusted balance sheet data as of December 31, 2013 has been prepared to give effect to the issuance of shares of our common stock in this offering at an assumed initial public offering price of $ , which is the midpoint of the range set forth on the cover of this prospectus. The following unaudited summary as adjusted financial information is presented for illustrative purposes only and is not necessarily indicative of the financial position that would have occurred if the relevant transactions had been consummated on the date indicated.
Our historical results are not necessarily indicative of future operating results. You should read the information set forth below in conjunction with “Selected Historical Financial Data,” “Management’s Discussion and Analysis of Financial Condition and Results of Operations” and our financial statements and the related notes thereto included elsewhere in this prospectus.
| Year Ended December 31, | ||||||||||||||||||||
| 2013 | 2012 | 2011 | 2010 | 2009 | ||||||||||||||||
| (in millions, except share and per share data) | ||||||||||||||||||||
| (unaudited) | ||||||||||||||||||||
| Statement of Operations Data: |
||||||||||||||||||||
| Revenue: |
||||||||||||||||||||
| Mobility Solutions |
$ | 148.8 | $ | 138.7 | $ | 143.7 | $ | 135.0 | $ | 129.6 | ||||||||||
| Mobility Networks |
1,088.9 | 1,080.9 | 1,017.0 | 901.2 | 839.1 | |||||||||||||||
| Europe, Asia and Emerging Markets |
72.2 | 63.1 | 58.9 | 51.3 | 45.8 | |||||||||||||||
| Australia |
160.5 | 173.7 | 167.1 | 131.0 | 112.8 | |||||||||||||||
|
|
|
|
|
|
|
|
|
|
|
|||||||||||
| Total service revenue |
1,470.4 | 1,456.4 | 1,386.7 | 1,218.5 | 1,127.3 | |||||||||||||||
| Home revenue |
523.8 | 494.4 | 545.7 | 491.1 | 549.1 | |||||||||||||||
|
|
|
|
|
|
|
|
|
|
|
|||||||||||
| Total revenue |
1,994.2 | 1,950.8 | 1,932.4 | 1,709.6 | 1,676.4 | |||||||||||||||
| Direct expenses: |
||||||||||||||||||||
| Purchased transportation expense |
1,004.6 | 1,006.5 | 953.8 | 839.7 | 781.2 | |||||||||||||||
| Home cost |
526.9 | 497.3 | 549.7 | 496.4 | 552.0 | |||||||||||||||
| Other direct expense |
232.7 | 225.5 | 220.5 | 186.1 | 172.3 | |||||||||||||||
|
|
|
|
|
|
|
|
|
|
|
|||||||||||
| Gross profit |
$ | 230.0 | $ | 221.5 | $ | 208.4 | $ | 187.4 | $ | 170.9 | ||||||||||
| Operating expenses: |
||||||||||||||||||||
| Selling, general and administrative expense |
$ | 180.8 | $ | 184.0 | $ | 192.3 | $ | 173.7 | $ | 180.7 | ||||||||||
| Intangibles amortization |
7.3 | 9.3 | 10.4 | 10.4 | 8.6 | |||||||||||||||
| Restructuring and impairment expense |
2.3 | 2.3 | 3.7 | 0.6 | 7.0 | |||||||||||||||
15
Table of Contents
| Year Ended December 31, | ||||||||||||||||||||
| 2013 | 2012 | 2011 | 2010 | 2009 | ||||||||||||||||
| (in millions, except share and per share data) | ||||||||||||||||||||
| (unaudited) | ||||||||||||||||||||
| Operating income (loss) from continuing operations: |
||||||||||||||||||||
| Mobility Solutions |
$ | 25.5 | $ | 17.9 | $ | 13.1 | $ | 8.5 | $ | 0.2 | ||||||||||
| Mobility Networks |
24.2 | 17.1 | 11.7 | 11.4 | (3.5 | ) | ||||||||||||||
| Europe, Asia and Emerging Markets |
4.6 | 1.3 | 4.8 | 5.3 | 4.9 | |||||||||||||||
| Australia |
2.7 | 1.5 | 1.3 | 0.4 | (0.5 | ) | ||||||||||||||
| Corporate |
(17.4 | ) | (11.9 | ) | (28.9 | ) | (22.9 | ) | (26.5 | ) | ||||||||||
|
|
|
|
|
|
|
|
|
|
|
|||||||||||
| Total operating income (loss) from continuing operations |
$ | 39.6 | $ | 25.9 | $ | 2.0 | $ | 2.7 | $ | (25.4 | ) | |||||||||
|
|
|
|
|
|
|
|
|
|
|
|||||||||||
| Interest expense, net |
$ | 26.2 | $ | 25.1 | $ | 32.2 | $ | 49.9 | $ | 46.5 | ||||||||||
| Debt extinguishment loss (gain) |
8.0 | (0.3 | ) | 16.8 | — | — | ||||||||||||||
| Other expense, net |
0.5 | — | 1.3 | 0.8 | (0.1 | ) | ||||||||||||||
| Income tax expense |
0.2 | 2.2 | 5.0 | 5.1 | 3.8 | |||||||||||||||
|
|
|
|
|
|
|
|
|
|
|
|||||||||||
| Income (loss) from continuing operations |
4.7 | (1.1 | ) | (53.3 | ) | (53.1 | ) | (75.6 | ) | |||||||||||
| Income (loss) from discontinued operations, net of tax |
5.0 | (0.3 | ) | 0.4 | 0.3 | (2.4 | ) | |||||||||||||
|
|
|
|
|
|
|
|
|
|
|
|||||||||||
| Net income (loss) |
9.7 | (1.4 | ) | (52.9 | ) | (52.8 | ) | (78.0 | ) | |||||||||||
| Less: preferred stock dividends |
(20.4 | ) | (27.4 | ) | (18.4 | ) | — | — | ||||||||||||
|
|
|
|
|
|
|
|
|
|
|
|||||||||||
| Net loss available to common stockholders |
$ | (10.7 | ) | $ | (28.8 | ) | $ | (71.3 | ) | $ | (52.8 | ) | $ | (78.0 | ) | |||||
|
|
|
|
|
|
|
|
|
|
|
|||||||||||
| Per Share Data: |
||||||||||||||||||||
| Basic and diluted loss per common share from continuing operations(1) |
$ | (14.97 | ) | $ | (27.60 | ) | $ | (70.32 | ) | $ | (53.02 | ) | $ | (77.51 | ) | |||||
| Basic and diluted earnings (loss) per common share from discontinued operations(1) |
4.78 | (0.21 | ) | 0.42 | 0.27 | (2.48 | ) | |||||||||||||
| Basic and diluted net loss per common share(1) |
(10.19 | ) | (27.81 | ) | (69.90 | ) | (52.75 | ) | (79.99 | ) | ||||||||||
| Weighted-average basic and diluted common shares outstanding |
1,048,465 | 1,033,450 | 1,019,736 | 1,001,641 | 975,364 | |||||||||||||||
| Other Data: |
||||||||||||||||||||
| Net Service Revenue(2) |
$ | 462.7 | $ | 447.0 | $ | 428.9 | $ | 373.5 | $ | 343.2 | ||||||||||
| Adjusted EBITDA(3) |
76.8 | 66.7 | 54.4 | 42.3 | 13.9 | |||||||||||||||
| Adjusted EBITDA as a percent of Net Service Revenue |
16.6 | % | 14.9 | % | 12.7 | % | 11.3 | % | 4.1 | % | ||||||||||
| As of December 31, 2013 | ||||||||
| Actual | As Adjusted(4) | |||||||
| (unaudited) | ||||||||
| Consolidated balance sheet data: |
||||||||
| Total assets |
$ | 427.3 | $ | |||||
| Short-term debt |
51.6 | |||||||
| Long-term debt (including current portions) |
294.0 | |||||||
| Preferred stock (involuntary liquidation value) |
141.9 | |||||||
| (1) | Basic and diluted earnings (loss) per common share is computed by dividing the net income (loss) available to common shareholders by the weighted-average number of shares of common stock outstanding during the period. Share-based compensation awards were not considered in the determination of diluted earnings (loss) per common share because the impact would be anti-dilutive. |
16
Table of Contents
| (2) | Net Service Revenue and the related ratios presented in this prospectus are supplemental measures of our performance that are not required by, or presented in accordance with, the generally accepted accounting principles in the United States (“GAAP”). Net Service Revenue is not a measurement of our financial performance under GAAP and should not be considered as an alternative to service revenue or total revenue or any other performance measures derived in accordance with GAAP. |
Net Service Revenue is defined as total revenue less purchased transportation expense and home cost.
Management uses Net Service Revenue:
| • | as a measurement used in evaluating our consolidated and segment-level operating performance on a consistent basis; |
| • | as a measurement to assess the amount of service revenue remaining after paying purchased transportation expense, which is the primary cost of providing household goods moving services by our agent/franchise network; |
| • | for planning purposes, including the preparation of our internal annual operating budget; and |
| • | to evaluate the performance and effectiveness of our operational strategies. |
By providing Net Service Revenue, together with a reconciliation to GAAP results, we believe we are enhancing investors’ understanding of our business and our results of operations.
Net Service Revenue has limitations as an analytical tool and you should not consider it in isolation, or as a substitute for, analysis of our results as reported under GAAP. Some of the limitations are:
| • | purchased transportation expense is more directly related to some service revenue types than others, thus the mix of service revenue types will effect gross profits; and |
| • | the mix effect on gross profit will effect gross margin metrics. |
We compensate for these limitations by relying primarily on our GAAP results and use Net Service Revenue as a supplemental metric.
To address these limitations, we reconcile Net Service Revenue to the most directly comparable GAAP measure, total revenue. Further, we also review GAAP measures and evaluate individual measures that are not included in Net Service Revenue.
The following table reconciles total revenue to Net Service Revenue:
| Year Ended December 31, | ||||||||||||||||||||
| 2013 | 2012 | 2011 | 2010 | 2009 | ||||||||||||||||
| (in millions) | ||||||||||||||||||||
| Total revenue |
$ | 1,994.2 | $ | 1,950.8 | $ | 1,932.4 | $ | 1,709.6 | $ | 1,676.4 | ||||||||||
| Purchased transportation expense |
(1,004.6 | ) | (1,006.5 | ) | (953.8 | ) | (839.7 | ) | (781.2 | ) | ||||||||||
| Home cost |
(526.9 | ) | (497.3 | ) | (549.7 | ) | (496.4 | ) | (552.0 | ) | ||||||||||
|
|
|
|
|
|
|
|
|
|
|
|||||||||||
| Net Service Revenue |
$ | 462.7 | $ | 447.0 | $ | 428.9 | $ | 373.5 | $ | 343.2 | ||||||||||
|
|
|
|
|
|
|
|
|
|
|
|||||||||||
| (3) | Adjusted EBITDA and the related ratios presented in this prospectus are supplemental measures of our performance that are not required by, or presented in accordance with, GAAP. EBITDA and Adjusted EBITDA are not measurements of our financial performance under GAAP and should not be considered as alternatives to net income, operating income or any other performance measures derived in accordance with GAAP or as alternatives to cash flow from operating activities as measures of our liquidity. |
EBITDA represents income from continuing operations before interest, taxes, depreciation and amortization. We have included Adjusted EBITDA because we believe it provides management and
17
Table of Contents
investors with additional information to measure our performance and liquidity, estimate our value and evaluate our ability to service debt. Adjusted EBITDA eliminates the effects of items that we do not consider indicative of our core operating performance.
Management uses EBITDA and Adjusted EBITDA or comparable metrics:
| • | as a measurement used in evaluating our consolidated and segment-level operating performance on a consistent basis; |
| • | to calculate incentive compensation for our employees; |
| • | for planning purposes, including the preparation of our internal annual operating budget; |
| • | to evaluate the performance and effectiveness of our operational strategies; and |
| • | to assess compliance with various metrics associated with our debt agreements. |
Management believes the inclusion of the adjustments to EBITDA are appropriate to provide additional information to investors about certain material items that we do not expect to continue at the same level in the future. By providing EBITDA and Adjusted EBITDA, together with a reconciliation to GAAP results, we believe we are enhancing investors’ understanding of our business and our results of operations, as well as assisting investors in evaluating how well we are executing strategic initiatives. We believe EBITDA and Adjusted EBITDA are used by investors as a supplemental measure to evaluate the overall operating performance of companies in our industry.
In evaluating EBITDA and Adjusted EBITDA, you should be aware that in the future we will incur expenses such as those used in calculating EBITDA and Adjusted EBITDA. Our presentation of EBITDA and Adjusted EBITDA should not be construed as an inference that our future results will be unaffected by usual or nonrecurring items.
EBITDA and Adjusted EBITDA have limitations as analytical tools and you should not consider them in isolation, or as substitutes for, analysis of our results as reported under GAAP. Some of the limitations are:
| • | they do not reflect interest expense, or the cash requirements necessary to service interest or principal payments, on our debt; |
| • | they do not reflect our cash expenditures, or future requirements for capital expenditures or contractual commitments; |
| • | they do not reflect changes in, or cash requirements for, our working capital needs; |
| • | although depreciation and amortization are non-cash charges, the assets being depreciated and amortized will often have to be replaced in the future, and EBITDA and Adjusted EBITDA do not reflect the cash requirements for such replacements; |
| • | they do not reflect our tax expense or the cash requirements to pay our taxes; |
| • | Adjusted EBITDA does not reflect the non-cash component of employee compensation; |
| • | Adjusted EBITDA does not reflect the impact of earnings or charges resulting from matters we consider not to be indicative of our ongoing operations, as discussed in our presentation of Adjusted EBITDA and “Management’s Discussion and Analysis of Financial Condition and Results of Operations” in this prospectus; and |
| • | other companies in our industry may calculate these measures differently than we do, limiting their usefulness as comparative measures. |
Because of these limitations, EBITDA and Adjusted EBITDA should not be considered as a measure of discretionary cash available to us to invest in the growth of our business. We compensate for these limitations by relying primarily on our GAAP results and using EBITDA and Adjusted EBITDA only supplementally.
18
Table of Contents
To address these limitations, we reconcile Adjusted EBITDA to the most directly comparable GAAP measure, (loss) income from continuing operations. Further, we also review GAAP measures and evaluate individual measures that are not included in Adjusted EBITDA.
The following table reconciles income (loss) from continuing operations to EBITDA and EBITDA to Adjusted EBITDA:
| Year Ended December 31, | ||||||||||||||||||||
| 2013 | 2012 | 2011 | 2010 | 2009 | ||||||||||||||||
| (in millions) | ||||||||||||||||||||
| Income (loss) from continuing operations |
$ | 4.7 | $ | (1.1 | ) | $ | (53.3 | ) | $ | (53.1 | ) | $ | (75.6 | ) | ||||||
| Interest expense, net |
26.2 | 25.1 | 32.2 | 49.9 | 46.5 | |||||||||||||||
| Income tax expense |
0.2 | 2.2 | 5.0 | 5.2 | 3.7 | |||||||||||||||
| Depreciation and amortization |
25.5 | 28.1 | 27.7 | 27.0 | 28.5 | |||||||||||||||
|
|
|
|
|
|
|
|
|
|
|
|||||||||||
| EBITDA |
56.6 | 54.3 | 11.6 | 29.0 | 3.1 | |||||||||||||||
|
|
|
|
|
|
|
|
|
|
|
|||||||||||
| Debt extinguishment loss (gain)(a) |
8.0 | (0.3 | ) | 16.8 | — | — | ||||||||||||||
| Restructuring and impairment expense(b) |
2.3 | 2.3 | 3.7 | 0.6 | 7.6 | |||||||||||||||
| Severance and other cost-savings initiative expenses(c) |
1.0 | 2.5 | 5.4 | 2.2 | 0.3 | |||||||||||||||
| Supplier contract termination costs(d) |
— | 0.1 | 5.2 | 6.0 | — | |||||||||||||||
| Pension expense(e) |
2.8 | 3.0 | 2.1 | 2.5 | 2.7 | |||||||||||||||
| Non-recurring professional fees and settlements(f) |
0.5 | 0.1 | 2.7 | 0.6 | — | |||||||||||||||
| Mortgage repurchases and reinsurance losses(g) |
— | 3.9 | 4.2 | — | — | |||||||||||||||
| Acquisitions and new location related costs(h) |
1.0 | 0.3 | 0.8 | — | — | |||||||||||||||
| New customer related costs(i) |
3.0 | — | — | — | — | |||||||||||||||
| Foreign exchange losses(j) |
0.9 | — | 1.4 | 1.3 | 0.1 | |||||||||||||||
| Board of director fees(k) |
— | 0.5 | 0.5 | — | — | |||||||||||||||
| Stock compensation(l) |
0.7 | — | — | 0.1 | 0.1 | |||||||||||||||
|
|
|
|
|
|
|
|
|
|
|
|||||||||||
| Subtotal adjustments |
20.2 | 12.4 | 42.8 | 13.3 | 10.8 | |||||||||||||||
|
|
|
|
|
|
|
|
|
|
|
|||||||||||
| Adjusted EBITDA |
$ | 76.8 | $ | 66.7 | $ | 54.4 | $ | 42.3 | $ | 13.9 | ||||||||||
|
|
|
|
|
|
|
|
|
|
|
|||||||||||
| (a) | Charges recognized related to debt refinancing activities in the applicable periods as discussed further in Note 7 “Long-term Debt” to the Company’s Audited Financial Statements included elsewhere in this prospectus. |
| (b) | Costs incurred or accrued for various restructuring plans implemented throughout the business, including severance and employee benefits and facility exit costs as discussed further in Note 14 “Restructuring and Impairments” to the Company’s audited financial statements included elsewhere in this prospectus. |
| (c) | Costs incurred in connection with various cost savings initiatives implemented throughout the business including severance and employee benefits, hiring costs and compensation and other costs associated with completion of the debt refinancings. |
| (d) | Costs incurred to cancel certain information technology contracts associated with our decision to insource the functions previously provided by those suppliers. |
| (e) | Expenses associated with our frozen U.S. defined benefit pension plans. See Note 11 “Pension Plans and Other Benefits” to the Company’s audited financial statements included elsewhere in this prospectus. |
19
Table of Contents
| (f) | Legal, consulting and other professional fees and settlements, including tax consulting related to an Australian Tax Authority examination, costs related to our project to migrate applications from a mainframe platform to a server-based platform, and Australia franchise settlements and bad-debt write-offs. |
| (g) | Costs related to mortgage loan sale indemnification liabilities and mortgage reinsurance losses for years prior to us exiting the reinsurance business in 2009. See “Reinsurance Reserves” included within Note 2 “Summary of Significant Accounting Policies” as well as Note 17 “Contingencies” to the Company’s audited financial statements included elsewhere in this prospectus. |
| (h) | Costs incurred to acquire a business in Brazil and expand a business in India, consolidate warehouses in Australia and open new locations in Asia, including legal and professional fees, travel expenses and labor costs to move equipment and customer’s household goods stored by us. |
| (i) | Upfront costs incurred to implement major new customer service capabilities, including compensation and benefits for added staffing and associated hiring and training expenses. |
| (j) | Net losses associated with translation of foreign denominated assets and liabilities. See “Foreign Currency Translation” included within Note 2 “Summary of Significant Accounting Policies” to the Company’s Audited Financial Statements included elsewhere in this prospectus. |
| (k) | Expenses paid for board of director services and reimbursement of board member travel and related expenses. |
| (l) | Non-cash stock-based compensation expense for our board of directors and management. See Note 12 “Capital Stock and Incentive Plans” to the Company’s audited financial statements included elsewhere in this prospectus. |
| (4) | As adjusted information gives effect to this offering and the application of the net proceeds therefrom. |
20
Table of Contents
An investment in our common stock involves a high degree of risk. You should consider carefully the following risks and all of the other information contained in this prospectus, including our consolidated financial statements and related notes to such statements, before investing in our common stock. If any of the following risks actually occur, it could have a material adverse effect on our business, financial condition and results of operations. As a result, the trading price of our common stock could decline and you could lose part or all of your investment.
Risks Related to Our Business and Industry
We face intense competition in each of our operating segments and, if we are unable to compete successfully, it could have a material adverse effect on our business, financial condition and results of operations.
Our industry is highly competitive, highly fragmented and subject to rapid change. We believe that the principal competitive factors in our markets are the quality of the transferee experience, the ability to integrate with customer technology, global and local presence, scope of expertise, the capacity to handle a large volume of initiations and cost competitiveness. Across our operating segments, we compete with a variety of foreign and domestic companies, some of which have greater resources (financial or otherwise), larger customer bases, greater experience and more brand recognition than we do. In addition, some of our competitors who do not have global service capabilities may expand their services to countries in which we are located, which could result in increased competition for employees and could adversely impact our competitive position. New competitors could emerge that have stronger competitive positions as a result of the strategic consolidation of smaller competitors or of companies that each provides different or more comprehensive services or that service different industries. Our top competitors for large multi-national corporations include Cartus Corporation, Brookfield Global Relocation Services and Weichert Relocation Resources. We also compete with single service providers, including a wide variety of real estate brokers, moving companies, accounting firms, mortgage firms, destination service providers and business process outsourcing firms. Our Allied and northAmerican agent networks compete domestically with Unigroup Inc. (the operator of United Van Lines LLC and Mayflower Transit, LLC), Atlas World Group, Graebel Companies, Inc. and Wheaton Van Lines, Inc. Our agent network also faces competition from smaller independent movers, self-storage companies and self-haul service providers. In addition, in international markets our competitors include the Asian Tigers Group, Crown Relocations, Grace Removals Group, Santa Fe Transports Intl. Ltd, Sterling International Group and WridgWays.
As the mobility services business becomes more global in nature with a greater emphasis on relocation of employees throughout the world, we will face additional competition from firms that provide services on an international basis. Increased competition in the mobility services industry and potential new entrants into this industry may result in lower prices and volumes, higher costs for experienced personnel and lower profitability. If we are unable to compete successfully in this highly competitive industry, it could have a material adverse effect on our business, financial condition and results of operations.
Adverse conditions in the global economy or in global financial markets could have a material adverse effect on our business, financial condition and results of operations.
Our business, financial condition and results of operations have been, and will continue to be, affected by global economic conditions. From time to time, the global economy and financial markets have experienced downturns stemming from a multitude of factors, including adverse credit conditions impacted by concerns about sovereign debt, the housing and mortgage crisis, slower or receding economic activity, concerns about inflation and deflation, fluctuating energy costs, high unemployment, decreased consumer confidence, reduced corporate profits and capital spending, adverse business conditions, liquidity concerns and other factors. Although recent economic data has suggested the beginning of a global financial recovery, the severity or length of time these
21
Table of Contents
economic and financial market conditions may persist is unknown and there could be a further deterioration in financial markets and confidence in major economies. During challenging economic times and in tight credit markets many customers may delay or reduce their spending generally, and specifically their spending on mobility-related benefits. This could result in reductions in sales of our mobility services, longer sales cycles and increased pressure to decrease prices. These results may persist even if economic or financial market conditions improve. Any of these events could have a material adverse effect on our business, financial condition and results of operations.
In addition, continued uncertainty in the stock and credit markets may negatively affect our ability to access additional short-term and long-term financing, including future securitization transactions, on reasonable terms or our ability to attain additional short-term and long-term financing at all, which would have a material adverse impact on our liquidity and financial condition. In addition, if one or more of the financial institutions that support our credit facilities fails, we may not be able to find a replacement, which would negatively impact our ability to borrow under our credit facilities. Disruptions in the financial markets also may adversely affect our credit rating and the market value of our common stock. If the current pressures on credit continue or worsen, we may not be able to refinance, if necessary, our outstanding debt when due, which could have a material adverse effect on our business. While we believe we will have adequate sources of liquidity to meet our anticipated requirements for working capital, contractual commitments and capital expenditures based on curtailed operating plans, or if our operating results worsen significantly, or our cash flow or capital resources prove inadequate, we could face liquidity problems that could have a material adverse effect on our business, financial condition and results of operations.
Our customer contracts do not provide for any minimum purchase requirements, and if our customers are not successful, they could decrease the number of initiations or mobility benefits for their employees, decide to decrease their outsourcing of mobility services or seek to pay less for our mobility services. Additionally, our customers typically have the ability to terminate their contract with us on short notice. If the revenue we derive from each of our customer contracts decreases or if our customers terminate their contracts with us it could have a material adverse effect on our business, financial condition and results of operations.
Our revenue depends, in part, on the success of our customers. If our customers are not successful, the amount of mobility services initiations, the level of benefits that customers outsource and the level of benefits, including mobility services benefits, they provide to their employees may decrease. Our contracts with our customers do not contain any minimum revenue requirements. If a customer were to reduce the number of its employees who are eligible to utilize our services, reduce the benefits that it provides to their employees or choose not to outsource some of the functions that have historically been performed by us, the level of revenue generated by such contracts may not meet expectations and may decline from prior periods. Certain customers may also seek pricing concessions from us. We may not be able to reduce costs sufficiently to offset the reduced volume and the reduced revenue. In addition, our multi-year customer contracts typically are terminable without cause. Our customers may not elect to renew these contracts or may seek to negotiate more favorable terms when such contracts are up for renewal. Large customers also have the ability to negotiate lower prices, which result in lower margins, and negotiate away certain protective provisions in our contracts. We may face increased competition and pricing pressure as our customer contracts become subject to renewal. Any reduction in the amount of business we receive from our customers, increased pricing pressure, or our inability to successfully renew our customer contracts on their current or more favorable terms, or retain our customers could have a material adverse effect on our business, financial condition and results of operations.
Our growth depends, in large part, on continued growth in outsourcing of mobility services and, if such growth does not continue, it could have a material adverse effect on our business, financial condition and results of operations.
Our revenue growth depends, in large part, on continued growth in the outsourcing of mobility services rather than corporations performing such services in-house. There can be no assurance that the trend toward
22
Table of Contents
outsourcing mobility services will continue. In addition, part of our growth will also depend on the increased use of outsourcing in international markets, particularly in Europe, where companies do not outsource such services at the same rate as companies in the United States. Recently European companies have been outsourcing more mobility services, however this trend may not continue. A significant change in the trend toward outsourcing, either in the United States, Europe or in any of our other geographic markets, could have a material adverse effect on our business, financial condition and results of operations.
We have a history of operating losses and may not maintain profitability in the future.
We incurred losses from continuing operations in 2011 and 2012. If our revenue grows more slowly than we anticipate, or if our operating expenses are higher than we expect, or if we continue to incur operating losses, we may not be able to remain profitable. We can provide no assurances that we will be profitable in the future. We may not be able to operate and manage on a profitable basis or ensure that cash flow from operations will be sufficient to pay our operating costs.
Our Mobility Solutions segment exposes us to certain risks related to the purchase, ownership, financing and resale of transferred employees’ homes at a loss, which could have a material adverse effect on our business, financial condition and results of operations.
In our Mobility Solutions segment, we offer our customers home purchase and home sale assistance for their employees. Home sale assistance is provided through our standard home sale product and our premium home sale product. Our premium home sale product may require us, subject to certain conditions, to purchase homes after a period of time. When we purchase a home, we own the home for a period of time and the home enters our inventory until we close on the home sale to a third-party buyer. Accordingly, we incur costs associated with the ownership of the home, such as repair and maintenance costs, insurance costs and property taxes, while the home is in our inventory. In connection with our premium home sale product, we do not pass these expenses on to our customers. In the future, if our premium home sale product becomes a larger portion of our business, we may be obligated to purchase additional homes, which expose us to greater risk of holding homes in inventory, incurring higher costs on such homes and exposure to loss on re-sale risk. Additionally, weak real estate markets (including negative conditions in certain local or regional markets) can increase the number of homes that we take into inventory, increase the time we hold such homes in our inventory and increase our premium home sale expense, all of which would increase our overall costs. Weak markets could also lower the volume of home sale transactions, which could reduce our revenue. We also could be particularly impacted by sudden shifts in the real estate market that do not allow us to adjust our pricing to align it in relation to current market conditions. Because we finance the purchase of homes taken into inventory, an increase in the number of homes that we take into inventory also increases our borrowings under one of our securitization facilities and our $50.0 million asset-based revolving credit facility that matures in 2018 (the “ABL Revolver”) and related interest costs. As of December 31, 2013, 51% of our securitization facility had been utilized and there were no borrowings under our ABL Revolver. If we are unable to manage costs associated with managing the sales of real estate in general, it could have a material adverse effect on our business, financial condition and results of operations.
We contract to provide our premium home sale product on a fixed percentage basis and inaccurate estimates could impact the profitability of these services, which could have a material adverse effect on our business, financial condition and results of operations.
Approximately 56% of our contracts in our Mobility Solutions segment where we provide a home sale assistance program contain provisions whereby we agree to provide our premium home sale product to our customers. Our pricing for this product is highly dependent on our internal forecasts and predictions about the market stability of the subject properties and the accuracy of independent appraisals on the subject property, which could turn out to be inaccurate. As a result, we are subject to risks associated with estimating, planning and performing these services. If our projections are inaccurate, it could have a material adverse effect on our business, financial condition and results of operations.
23
Table of Contents
We often face a long selling cycle to secure a new contract with our corporate customers, as well as long implementation periods that require significant resource commitments, which can result in long lead times before we earn revenue from new relationships.
We often face a long selling cycle to secure new contracts with our corporate customers. On average, it can take between two and six months from the initiation of a potential corporate customer’s RFP process to our engagement by a customer. If we are successful in obtaining an engagement, that is generally followed by another two to six month implementation period in which the services are planned in detail, our contract is negotiated, the customer’s human resources department is trained in our services and our technology is integrated with that of our customer. This implementation period can also require coordination with the customer’s current mobility services provider and the process of transferring employee data can further lengthen the implementation period. We typically incur significant business development expenses during the selling cycle. We may not succeed in winning a new customer’s business, in which case we receive no revenue and may receive no reimbursement for such expenses. Even if we succeed in developing a relationship with a potential new customer and begin to plan the services in detail, a potential customer may choose a competitor or decide to retain the work in-house prior to the signing of a final contract. If we enter into a contract with a customer, we will typically receive no revenue until implementation actually begins. Once the contract implementation begins, it will take several months to service the customer, which delays revenue. In addition, because we recognize revenue upon completion of the home sale, moving or other services, the fact that the relocation process takes several months from initiation to completion further extends the time from RFP win to revenue recognition. Our customers may also experience delays in obtaining internal approvals or delays associated with technology or system implementations, thereby further lengthening the implementation cycle. If we are not successful in obtaining contractual commitments after the selling cycle, in maintaining contractual commitments after the implementation cycle or minimizing the duration of unprofitable initial periods in our contracts, it could have a material adverse effect on our business, financial condition and results of operations.
Our international operations subject us to social, political and economic risks of doing business in foreign countries. We have recently voluntarily self-disclosed certain activities to the Office of Foreign Assets Control (“OFAC”) of the U.S. Department of Treasury, which may have been in violation of regulations promulgated by OFAC and may be subject to fines and other penalties.
We conduct a significant portion of our business and we employ a substantial number of people outside of the United States. Our agent/franchise network also employs a substantial number of people outside of the United States. As a result, we are subject to risks associated with doing business globally. For the year ended December 31, 2013, revenue from our international operations (including our Europe, Asia and Emerging Markets and Australia segments) represented approximately 15% of our total revenue, and we intend to continue our expansion into international markets, particularly Europe, Asia, the Middle East and South America. Our international operations are subject to risks not generally experienced by our U.S. operations, including:
| • | difficulties and costs of staffing and managing international operations among diverse geographies, languages and cultures; |
| • | the impact of regional or country-specific business cycles and economic instability; |
| • | fluctuations in foreign currency exchange rates; |
| • | longer receivables collection periods and greater difficulty in collection accounts receivable; |
| • | exposure to anti-corruption laws, including the Foreign Corrupt Practices Act of 1977, as amended, (the “FCPA”) and the U.K. Bribery Act 2010 (the “UKBA”), and export-control regulations, including those promulgated by OFAC; |
| • | exposure to local economic conditions and local laws and regulations; |
| • | exposure to local labor laws, particularly newly enacted labor laws in China and the TUPE laws in the European Union and the United Kingdom; |
24
Table of Contents
| • | limited borrowing capabilities relating to activities in non-U.S. countries; |
| • | economic and/or credit conditions abroad; |
| • | potential adverse changes in the political and/or economic stability of foreign countries or in their diplomatic relations with the U.S.; |
| • | restrictions on the withdrawal of foreign investment and earnings; |
| • | government policies against businesses owned by foreigners; |
| • | investment restrictions or requirements; |
| • | diminished ability to legally enforce our contractual rights in foreign countries; |
| • | difficulty in protecting our brand, reputation and intellectual property; |
| • | increases in anti-American sentiment and the identification of us as an American brand; |
| • | restrictions on the ability to obtain or retain licenses required for operation; |
| • | foreign exchange restrictions; |
| • | withholding and other taxes on third party cross-border transactions as well as remittances and other payments by subsidiaries; |
| • | adverse changes in regulatory or tax requirements; |
| • | restrictions on foreign ownership of subsidiaries; |
| • | multijurisdictional data protection and privacy laws; and |
| • | tariffs and other trade barriers. |
If we are unable to manage the complexity of our global operations successfully, it could have a material adverse effect on our business, financial condition and results of operations.
OFAC administers trade and economic sanctions against various countries including, without limitation, Cuba, Iran, Syria, and Sudan (“Sanctioned Countries”). As part of our business, we or our agents have arranged for the transportation of personal household effects into or out of Sanctioned Countries on behalf of U.S. and foreign government transferees, corporate transferees and individuals. These activities have taken place between the United States and Sanctioned Countries and between third countries and Sanctioned Countries. Certain of these activities may have been in violation of OFAC regulations. Although OFAC regulations contain certain general licenses or exceptions that may have been applicable to some of these activities, we have filed an initial voluntary disclosure with OFAC reporting possible violations with respect to these activities. We intend to complete our factual and legal analysis and file a final voluntary disclosure in due course and we may seek further guidance from OFAC as to whether such activities were authorized. If we are found to have violated OFAC regulations, we may be subject to potential penalties (including monetary fines) and our reputation may be harmed. We are also taking steps to prevent any future activities involving Sanctioned Countries that may be in violation of OFAC regulations and to further enhance our existing OFAC compliance procedures. There can be no guarantee as to the outcome of our investigation, the effectiveness of our compliance procedures, the content of our final voluntary disclosure or OFAC’s response.
We depend on third-party providers and service instability from these providers could increase our operating costs, expose us to liability and reduce our ability to offer an end-to-end service offering for our customers, which could adversely affect our revenue, results of operations and customer relationships.
We utilize third-party providers to, among other things, provide title insurance, visa and immigration related services and conduct certain local “on-the-ground” services in connection with international and domestic
25
Table of Contents
relocations. Although there are competitive markets for many of these services and a significant number of our third-party providers could be replaced without material disruptions to our business, there could be substantial difficulties and delays in replacing certain of these providers and we may have to pay increased prices to secure any replacement services. Additionally, if a third-party service provider does not adequately perform certain critical functions, our customers or other third parties could seek to recoup resulting damages from these acts or omissions from us. Our inability to secure the services of these third parties or increases in the prices we must pay to secure their services, could have a material adverse effect on our business, financial condition and results of operations.
Damage to our reputation and our brand names, including Allied, northAmerican and SIRVA, could have a material adverse effect on our business, financial condition and results of operations.
We believe that our strong brand names, including Allied, northAmerican and SIRVA, are among our most valuable assets. We believe that our brand image, brand awareness and reputation have contributed significantly to the success of our business. Maintaining and enhancing our brand image, which we believe is important to maintaining and expanding our customer base and increasing sales, may require us to make additional investments in areas such as merchandising, marketing and employee training. These investments may be substantial and may not ultimately be successful. If we are unable to maintain and enhance our brand image, brand awareness and reputation, it could have a material adverse effect on our business, financial condition and results of operations.
Our business is subject to seasonal fluctuations, which lead to fluctuations in our results of operations and could have a material adverse effect on our business, financial condition and results of operations.
The mobility services we provide are subject to seasonal fluctuations, with our strongest operating results and revenue occurring during the second and third quarters of the calendar year (with the exception of our Australia business segment, which has the strongest operating results and revenue in the first and fourth quarters of the year) due to increased levels of household moves and home sales during the summer months. Certain of our operating expenses are fixed and cannot be reduced during the fall and winter months, when there is decreased demand for our services. See “Business—Seasonality.” Such a decrease in the demand for our services reduces our ability to spread our fixed costs among a greater number of transactions. In addition, our working capital requirements increase on a short-term basis during the summer months. If we are unable to successfully capitalize on the peak summer season or successfully manage these seasonal changes, it could have a material adverse effect on our business, financial condition and results of operations.
Cybersecurity and privacy breaches may hurt our business, damage our reputation, increase our costs, and cause losses.
We store sensitive personal information about our customers and transferees in our systems and networks. Our security systems and IT infrastructure may not adequately protect against security breaches, cyber-attacks or other unauthorized access to such information. Third parties, including vendors or suppliers that provide services for our operations, could also be a source of security risk to us in the event of a failure of their own security systems and infrastructure. Additionally, a number of our employees work from home offices or other remote locations and access our systems remotely, which further increases the risk of privacy breaches. Any significant violations of data privacy could result in the loss of business, litigation, regulatory investigations, the payment of damages and penalties and damage to our reputation, which could have a material adverse effect on our business, financial condition and results of operations.
We derive significant revenue from contracts with the U.S. government; a reduction in U.S. Government spending may adversely affect our results of operations and financial condition.
During 2013, services provided to government agencies accounted for approximately 12.3% of our global mobility networks initiations and 9.4% of our domestic mobility networks initiations. Due partially to the
26
Table of Contents
sequestration on March 1, 2013, and the government shutdown in October 2013, for instance, our domestic military shipment volumes in our Mobility Networks segment declined by approximately 28% for the year ended December 31, 2013, as compared to the prior year. Under the Budget Control Act of 2011 (the “Budget Control Act”) the U.S. government committed to significantly reduce the federal deficit over the next ten years, and substantial spending cuts to the U.S. budget are likely to occur in the future. As a result, future purchasing decisions by our U.S. government customers could be reduced, delayed or cancelled. It is difficult to predict the various ways in which budget cuts could be implemented; however, we expect that sequestration, as currently provided for under the Budget Control Act, would result in lower revenue, profits and cash flows for our company. To the extent that federal government spending is delayed or curtailed by government actions, including the sequestration that began on March 1, 2013, and future government shutdowns such as the one that occurred in October 2013, our business, financial condition or results of operations may be adversely affected.
We are subject to litigation as a result of our operations and such litigation could have a material adverse effect on our business, financial condition and results of operations.
We are subject to litigation resulting from our operations, including litigation resulting from accidents involving our agents and their drivers. These accidents have involved, and in the future may involve, serious injuries or the loss of life. In addition, we occasionally are subject to litigation resulting from our home sale assistance transactions. These lawsuits generally involve disclosure issues, property damage issues and title claims. We may also be involved in litigation or other proceedings relating to intellectual property, commercial arrangements, vicarious liability based upon conduct of individuals or entities outside of our control, general fraud claims and employment law. We cannot predict with certainty the cost of defense, the cost of prosecution, insurance coverage or the ultimate outcome of litigation and other proceedings filed by or against us, including remedies or damage awards. Any such litigation, whether or not successful, may result in liability, result in monetary damages or other penalties or forms of relief or harm our reputation, which could have a material adverse effect on our business, financial condition and results of operations.
We purchase a portfolio of corporate insurance coverages including policies for general liability, auto liability, workers’ compensation, employers’ liability, directors and officers, property, and errors and omissions. We require each of our agents to contribute to a fund that is used primarily for the purchase of insurance and payment of the deductible portion of claim costs related to third-party liability claims resulting from moves and trucking operations performed by our agent network under our operating authority. The ultimate settlement of these claims could differ materially from the assumptions used to calculate the reserves, which could have a material adverse effect on our business, financial condition and results of operations.
We intend to expand into adjacent markets and develop new products and, if we fail to do so or if any such expansion or new product is not successful, it could have a material adverse effect on our business, financial condition and results of operations.
We intend to continue to expand our business into adjacent markets, such as the DIY moving and storage market. We have also recently internally developed and launched our LumpSum Xpress Marketplace, which targets mid-level employees of our current and potential customers who receive a lump sum payment from their company, which can be used to purchase mobility services. Our expansion into adjacent markets and our new product development may not be successful and we will incur expenses related to such initiatives, which could have a material adverse effect on our business, financial condition and results of operations. In addition, our expansion into these markets will require us to compete with new, larger and more experienced competitors, which involves various risks, including the need to invest significant resources and the possibility that returns on such investments will not be achieved for several years, or at all. In attempting to establish a presence in new markets, we expect to incur significant expenses and face various other challenges, such as expanding our sales force and management personnel, to cover these new markets. We may not succeed in our efforts to expand into adjacent markets or develop new products, and if we are not successful, it could have a material adverse effect on our business, financial condition and results of operations.
27
Table of Contents
Any acquisitions that we intend to make in the future could have a material adverse effect on our business, financial condition and results of operations.
Part of our growth strategy is to make future acquisitions of complimentary and down-stream services. We evaluate, and expect in the future to evaluate, potential strategic acquisitions of complementary businesses. We may not be successful in identifying acquisition candidates. In addition, we may not be able to successfully integrate businesses that we acquire. Integrating acquired companies involves complex operational and personnel-related challenges, including:
| • | the possible defection of a significant number of employees; |
| • | increased amortization of intangibles; |
| • | the disruption of our ongoing businesses; |
| • | possible inconsistencies in standards, controls, procedures and policies; |
| • | failure to maintain important business relationships and contracts; |
| • | unanticipated costs of terminating or relocating facilities and operations; |
| • | unanticipated expenses related to integration; |
| • | potential unknown liabilities associated with acquired businesses; and |
| • | loss of business from downstream services, such as destination services, that the acquired company may have provided to competitors of SIRVA. |
A prolonged diversion of management’s attention and any delays or difficulties encountered in connection with the integration of any business that we have acquired or may acquire in the future could prevent us from realizing the anticipated cost savings and revenue growth from our acquisitions. We may have potential write-offs of acquired assets and an impairment of any goodwill recorded as a result of acquisitions. As of December 31, 2013, we had $56.4 million of goodwill that could be subject to impairment. To the extent we pay the purchase price of any acquisition in cash, it would reduce our cash reserves, and to the extent the purchase price is paid with our stock, it could be dilutive to our stockholders. To the extent we pay the purchase price with proceeds from the incurrence of debt, it would increase our already high level of indebtedness and could negatively affect our liquidity and restrict our operations. Our competitors may be willing or able to pay more than us for acquisitions, which may cause us to lose certain acquisitions that we would otherwise desire to complete. We cannot ensure that acquisitions will not have a material adverse effect on our business, financial condition and results of operations.
We may be unable to maintain recent cost savings or realize anticipated cost savings and other benefits from our productivity improvement initiatives in the future, which could have a material adverse effect on our business, financial condition and results of operations.
We have achieved cost savings from various productivity improvement initiatives targeted at reducing costs and enhancing organizational effectiveness while consolidating existing processes and facilities, and we expect to continue to identify additional cost savings. These measures included reducing our overall headcount by over 450 employees over the period from 2009 to 2013. We may not be able to achieve or maintain the anticipated cost savings and other benefits from these initiatives. If our cost savings or such benefits are less than our estimates or take longer to implement than we project, the savings or other benefits we projected may not be fully realized, which could have a material adverse effect on our business, financial condition and results of operations.
We depend on our highly trained executive officers and employees. Any loss of these employees could have a material adverse effect on our business, financial condition and results of operations.
Our operations are managed by a small number of key executive officers, many of whom have substantial experience in the mobility industry. The success of our business continues to depend to a significant degree upon
28
Table of Contents
the continued contributions of such key executive officers and employees, both individually and as a group. Our ability to attract and retain our employees is generally subject to numerous factors, including the compensation and benefits we pay, the mix between the fixed and variable compensation we pay our employees and prevailing compensation rates, and competition for qualified executives is intense. We do not have key man or similar life insurance covering our executive officers and other members of senior management. We have entered into employment agreements with each of our executive officers, but these agreements do not guarantee that these executives will remain with us. Additionally, the mobility services business is a specialized industry and there are a limited number of individuals with knowledge of the industry. It is possible that the loss of the services of one or a combination of our key employees, including Wes Lucas, our Chief Executive Officer, and our inability to find suitable replacements, could have a material adverse effect on our business, financial condition and results of operations.
The ability to attract, retain and develop qualified employees is critical to our success and growth.
In order for us to successfully compete and grow, we must attract, retain and develop the necessary personnel who can provide the needed expertise for our business. While we have a number of key personnel who have substantial experience with our operations, we must also develop our personnel to provide succession plans capable of maintaining continuity in the midst of the inevitable unpredictability of human capital. The market for qualified personnel is competitive, and we may not succeed in recruiting additional personnel or we may fail to effectively replace current personnel who depart with qualified or effective successors. Our effort to retain and develop personnel may also result in significant additional expenses, which could adversely affect our profitability. We cannot guarantee that qualified employees will continue to be employed or that we will be able to attract and retain qualified personnel in the future. Failure to retain or attract key personnel could have a material adverse effect on our business, financial condition and results of operations.
We may be required to repurchase mortgage loans or indemnify buyers against losses in some circumstances, which could have a material adverse effect on our business, financial condition and results of operations.
During 2013, SIRVA Mortgage, Inc., our wholly-owned subsidiary (“SIRVA Mortgage”), closed on 2,917 mortgages. We sell the mortgage loans that we originate, and when we sell our mortgage loans, we are required to make customary representations and warranties to purchasers, guarantors and insurers about the mortgage loans and the manner in which they were originated. Our loan-sale agreements require us to repurchase or substitute mortgage loans, or indemnify buyers against losses, in the event we breach these representations or warranties, including representations and warranties as to the accuracy of the statements made by the borrower. In addition, we may be required to repurchase mortgage loans as a result of early payment defaults by the borrower (e.g., failure to make a payment within the first 30-120 days) on a mortgage loan that we have sold. If we are required to repurchase or substitute loans or if we are required to indemnify buyers of our mortgage loans, it could have a material adverse effect on our business, financial condition and results of operations.
We are exposed to foreign currency fluctuations, which could have a material adverse effect on our business, financial condition and results of operations.
In many cases, we generate revenue in U.S. dollars and incur costs related to such revenue in local currency. If the value of the U.S. dollar drops relative to other currencies, our cost of providing services outside the United States will increase accordingly when translated to U.S. dollars. In addition, a portion of our revenue is denominated in foreign currencies. If the U.S. dollar increases in value relative to such currencies, the value of such revenue will decrease accordingly when measured in U.S. dollars. Any significant fluctuations in the currency exchange rates between the U.S. dollar and the other currencies of countries in which we operate could have a material adverse effect on our business, financial condition and results of operations.
29
Table of Contents
A significant uninsured loss or a loss in excess of our insurance coverage could have a material adverse effect on our business, financial condition and results of operations.
We maintain insurance covering our normal business operations, including property and casualty protection that we believe is adequate. We do not generally carry insurance covering wars, acts of terrorism, earthquakes or other similar catastrophic events. In addition, the financial health of our insurers may deteriorate and may not be able to respond if we should have claims reaching their policies, and we may not be able to obtain adequate insurance coverage on financially reasonable terms in the future. A significant uninsured loss or a loss in excess of our insurance coverage could have a material adverse effect on our business, financial condition and results of operations.
Changes in accounting standards, subjective assumptions and estimates used by management related to complex accounting matters could have a material adverse effect on our business, financial condition and results of operations.
GAAP and related accounting pronouncements, implementation guidance and interpretations with regard to a wide range of matters, such as stock-based compensation, asset impairments, valuation reserves, income taxes and fair value accounting, are highly complex and involve many subjective assumptions, estimates and judgments made by management. Changes in these rules or their interpretations or changes in underlying assumptions, estimates or judgments made by management could have a material adverse effect on our business, financial condition and results of operations. We will also be affected by changes to GAAP as a result of the convergence with many International Financial Reporting Standards.
We base revenue estimates for new contracts upon historical data provided by our customers. If our estimates based upon the data provided are inaccurate or if the customer does not experience the same level of estimated activity in future periods, it could impact our ability to plan our business and may have a material adverse effect on our business, results of operations and financial condition.
During the RFP process, potential customers provide us with historical data, including the number of mobility solutions initiations they experience per year. Upon winning a new contract, we use historical customer data, together with our experience with similarly situated customers, to estimate, based primarily on the customer’s average initiations and our historical average revenue per initiation, the revenue that we will derive from a new contract. We use these expected revenue amounts to plan our business and they are critical in our decisions regarding headcount and capital expenditures. If the number of initiations from a particular customer decreases from amounts experienced in previous year, we could experience a decrease in our income from continuing operations due to higher operating costs relative to revenue, which could impact our ability to forecast future growth and have a material adverse effect on our business, results of operations and financial condition.
We may be limited in our ability to utilize, or may not be able to utilize, net operating loss carryforwards to reduce our future tax liability.
Our ability to utilize net operating losses (“NOLs”) and other tax attributes is limited if we undergo an “ownership change” within the meaning of Section 382 of the Internal Revenue Code of 1986, as amended (the “Code”). This ownership change provision has and will continue to subject our tax loss carryforwards to annual limitations, which will restrict our ability to use them to offset our taxable income in periods following the ownership change.
As of December 31, 2013, we had a net operating loss carryforward of $90.7 million. Due to prior ownership changes, which are subject to the Section 382 provisions, we are limited to $31.8 million of tax benefits from U.S. federal NOLs and $8.8 million of tax benefits from state NOLs reported at December 31, 2013. U.S. federal NOL carryforwards will begin to expire in 2022 and will completely expire in 2035. Our state NOL carryforwards may be used over various periods ranging from one to 20 years.
30
Table of Contents
We have had significant financial losses in previous years and as a result we currently maintain a full valuation allowance for our deferred tax assets including our federal and state NOL carryforwards.
We rely on information technology to operate our business and maintain our competitiveness, and any difficulties with our information systems or our information systems providers could delay or disrupt our ability to service our customers and impair our competitiveness.
We rely on sophisticated information systems to manage and monitor the flow of goods that we are transporting, provide mobility services to our customers, market our services, manage our business and communicate with our customers, and we anticipate that our reliance on technology will increase in the future. Our future success depends, in part, upon our ability to develop and implement technology solutions that anticipate and keep pace with continuing changes in technology, industry standards and customer preferences. We may not be successful in anticipating or responding to these developments on a timely and cost-effective basis, and our technology, such as our LumpSum Xpress Marketplace, may not be accepted by our existing and potential customers. Additionally, the effort to gain technological expertise and develop new technologies in our business requires us to incur significant expenses. If we cannot offer new technologies as quickly as our competitors or if our competitors develop more cost-effective technologies, it may adversely impact our ability to compete effectively, which could have a material adverse effect on our business, financial condition and results of operations.
In addition, our information technologies and systems are vulnerable to damage or interruption from various causes, including natural disasters, war and acts of terrorism, power losses, computer systems failure, internet and telecommunications or data network failures, operator error, losses and corruption of data and similar events and computer viruses, penetration by individuals seeking to disrupt operations or misappropriate information and other physical or electronic breaches of security. Our disaster recovery plan may not be adequate in the event of an actual disaster or other business interruption. Any extended interruption in our technologies or systems could significantly impact our operations, which could have a material adverse effect on our business, financial condition and results of operations. Additionally, our business interruption insurance may be insufficient to compensate us for losses that may occur.
We have registered, among other trademarks, “SIRVA,” “Allied,” “northAmerican” and their respective logos as trademarks in the United States. Competitors may adopt service names similar to ours, thereby harming our ability to build brand identity and possibly leading to user confusion. In addition, there could be potential trade name or trademark infringement claims brought by owners of other trademarks that are similar to our trademarks. Litigation or proceedings before the U.S. Patent and Trademark Office or other governmental authorities and administrative bodies in the United States and abroad may be necessary in the future to enforce our intellectual property rights and to determine the validity and scope of the proprietary rights of others. Our efforts to enforce or protect our proprietary rights may be ineffective and could result in substantial costs and diversion of resources, which could harm our business and results of operations.
Failure to protect our proprietary information or intellectual property rights could have a material adverse effect on our business, financial condition and results of operations.
We rely primarily on a combination of confidentiality procedures and patent, copyright and trademark laws to protect our proprietary information and intellectual property. We generally seek to protect our unpatented proprietary information and intellectual property, trade secrets, processes and know-how by confidentiality and non-disclosure with our employees and third parties. However, these agreements may provide inadequate protection. Moreover, those agreements may be breached and we may not have adequate remedies for any such breach. In addition, our trade secrets may be disclosed to or otherwise become known or be independently developed by competitors or others. Despite our efforts to protect our proprietary information and intellectual property, unauthorized parties may attempt to copy aspects of the software or other technology that we have
31
Table of Contents
developed or obtain and use our proprietary information. In addition, the laws of some countries do not protect our proprietary information or intellectual property to as great an extent as the laws of the United States, and many countries do not enforce these laws as diligently as government agencies and private parties in the United States.
With respect to some of our proprietary technologies, such as our LumpSum Xpress Marketplace, we have filed patent applications to protect our intellectual property rights in these technologies. There can be no assurance that our patent applications will be approved, that any patents issued will adequately protect our intellectual property rights or that such patents will not be challenged by third parties or found by a judicial authority to be invalid or unenforceable. Additionally, we outsource some of our intellectual property development to third parties, and we cannot be assured that the patent applications of such third parties will be approved, that any patents issued will protect their intellectual property rights or that any such patents will not be challenged by third parties or found by a judicial authority to be invalid or unenforceable. If we are unable to protect our proprietary information or intellectual property, it could have a material adverse effect on our business, financial condition and results of operations.
We may be subject to liability and other risks if we infringe upon the trademarks or other intellectual property rights of third parties.
We may be subject to costly litigation in the event that we infringe upon or otherwise violate, unintentionally or otherwise, a third party’s proprietary rights. Third parties may have, or may eventually be issued, patents that could be infringed upon by our services or technology. Any of these third parties could raise a claim of infringement against us with respect to our services or technology. We may also be subject to claims by third parties for breach of copyright, trademark, license usage or other intellectual property rights. To the extent that our employees use intellectual property owned by others in their work for us, disputes may arise as to the rights in related or resulting know-how and inventions. Any claim from third parties may result in a limitation on our ability to use the intellectual property that is subject to these claims. Even if we believe that intellectual property related claims are without merit, defending against such claims is time consuming and expensive and could result in the diversion of the time and attention of our management and employees. Claims of intellectual property infringement also might require us to redesign affected services, enter into costly settlement or license agreements, pay costly damage awards or face a temporary or permanent injunction prohibiting us from marketing or selling certain of our services. Even if we are party to an agreement for indemnification against such costs, the indemnifying party, if any in such circumstances, may be unable to uphold its contractual obligations. In the event of such claims, if we cannot or do not license the infringed intellectual property on reasonable terms or substitute similar intellectual property from another source, it could have a material adverse effect on our business, financial condition and results of operations.
Risks Related to our Mobility Agent/Franchise Network
If we are unable to recruit and retain a sufficient number of agents, representatives or owner-operators to sustain the operations in our Mobility Networks segment, it could have a material adverse effect on our business, financial condition and results of operations.
Our Mobility Networks segment relies on our agent network and their employees, representatives and owner-operators to market our services and to act as intermediaries with customers, and to provide a significant portion of our packing, warehousing and hauling services. Owner-operators are independent contractors who generally own their tractors and provide hauling and other services. We and our agents have had some difficulty obtaining or retaining qualified owner-operators due to overall transportation industry conditions such as an aging workforce and an absence of younger drivers to replace our out-going drivers. Fluctuations in the economy and fuel prices, as well as a lifestyle that requires drivers to often be away from home from four to eight weeks at a time, create challenges for new entrants to that business. Further, competition for long haul owner-operators is strong among competing moving companies. Our agent network must pay higher wages or offer a better lifestyle
32
Table of Contents
to attract owner-operators that satisfy our standards. If our agents are unable to recruit and retain a sufficient number of owner-operators, it could impact the ability of our agents to provide adequate and timely moving services to our customers, which could have a material adverse effect on our business, financial condition and results of operations.
Our agents are independent businesses that provide moving and storage services to our and their own customers, and in 2013 the top 20 of our 419 agents in the United States and Canada accounted for approximately 39% of our mobility networks initiations in 2013. In 2013, we entered into multi-year agreements with the majority of our agent/franchise network that expire in January 2018; however, if after January 2018, an agent were to terminate its relationship with us, we might not be able to recruit a replacement agent to service the same geographic region with similar capacity and quality. Generally, there are few additional new entrants into this business, and thus recruiting new agents often requires a conversion of an agent from a competing van line, which can be time-consuming, costly and difficult. Competing companies may also recruit our agents. Failure to recruit and retain our agents could have a material adverse on our business, financial condition and results of operations.
Actions taken by our agents may harm our brands or reputation, or result in legal actions against us, which could have a material adverse effect on our business, financial condition and results of operations.
We believe that our strong brand names, including Allied, northAmerican and SIRVA, are among our most valuable assets. Our proprietary network of agents in North America operate their businesses using our brand names and, in the case of most intrastate moves, without our involvement or approval. Our agents are independent third parties with their own financial objectives, and actions taken by them or negative publicity associated with them, including their failure to comply with local laws and regulation and with their contracts with us, could harm our brands or reputation, or result in legal actions against us. In many such cases, these actions are beyond our control. Our brand value could diminish significantly if any such incidents or other matters erode customer confidence in us, which could have a material adverse effect on our business, financial condition and results of operations.
Our agents’ owner-operators are currently not considered to be their employees by taxing and other regulatory authorities. Should these authorities change their position and consider our agents’ owner-operators to be their employees, their costs could increase significantly and cause them to renegotiate their arrangements with us, we may not be able to reach a new agreement on acceptable terms or at all, and we may not be able to pass on any related cost increases to our customers, which could have a material adverse effect on our business, financial condition and results of operations.
From time-to-time, certain parties, including the U.S. Internal Revenue Service (the “IRS”), state tax authorities, labor relations boards and the owner-operators themselves, have sought to assert that owner-operators in the trucking industry are employees rather than independent contractors. The agents within our agent/franchise network consider all of their owner-operators to be independent contractors. Tax authorities may successfully challenge this position or federal and state tax or other applicable laws may change. If owner-operators were deemed to be employees, our agents’ costs related to tax, unemployment compensation, benefits and workers’ compensation could increase significantly. Any significant increase in our agents’ costs could cause them to seek to restructure their current arrangements with us or increase the rates that they charge us which we may not be able to pass on to our customers, any of which could have a material adverse effect on our business, financial condition and results of operations.
If we have any conflicts with our agents or they become dissatisfied with their relationship with us and make claims against us or seek to terminate their relationship with us, it could have a material adverse effect on our business, financial condition and results of operations.
We may not be able to maintain satisfactory relationships with our agents, and the nature of such relationships could give rise to conflict. For example, agents may become dissatisfied with the amount of
33
Table of Contents
contractual fees and dues that we charge under agent and other applicable agreements, particularly in the event that we decide to further increase our fees. In addition, they may disagree with certain of our network-wide policies and procedures, including policies regarding safety, dictating brand standards and affecting their marketing efforts, or they may be disappointed with any national marketing campaigns that we designed to develop our brands. If we experience any conflicts with our agents on a large scale, our agents may challenge our actions, rules or policies in arbitration or litigation, which could also result in litigation, and could have a material adverse effect on our business, financial condition and results of operations.
Risks Related to Government Regulation
Several of our business activities are highly regulated and any failure to comply with such regulations or any changes in such regulations could have a material adverse effect on our business, financial condition and results of operations.
Several of our and our agent/franchise network’s business activities are highly regulated by federal, state and foreign authorities, including our moving services, our mortgage origination services, our real estate brokerage services and title insurance commitments offered through our title agency offered in connection with our home sale services. We could also be affected by changes in state transfer tax laws and regulations and changes to federal tax rulings could impact the cost and viability of home sale program benefits that we manage for our customers. Additionally, rules and regulations affecting driver qualification, drivers’ logs and documentation, hours of service and equipment inspection and operation may materially and adversely affect our business operations.
We are also subject to various other rules and regulations such as:
| • | the Gramm-Leach Bliley Act, which governs the disclosure and safeguarding of consumer financial information; |
| • | the Sarbanes-Oxley Act of 2002 (the “Sarbanes-Oxley Act”); |
| • | the Dodd-Frank Wall Street Reform and Consumer Protection Act (the “Dodd-Frank Act”); |
| • | various state, federal and international privacy laws; |
| • | various transportation rules and regulations enforced by the U.S. Department of Transportation (the “DOT”), the Federal Motor Carrier Safety Administration (the “FMCSA”), the Department of Homeland Security and Customs and Border Protection; |
| • | laws that impact mortgage origination services such as the Real Estate Settlement Procedures Act, Truth in Lending Act, Fair Housing Act, Equal Credit and Opportunity Act, Fair Credit Reporting Act, Home Mortgage Disclosure Act and similar state laws and regulations; |
| • | the USA PATRIOT ACT; |
| • | anti-corruption laws, including the FCPA and the UKBA; |
| • | restrictions on transactions with persons on the Specially Designated Nationals and Blocked Persons list promulgated by OFAC; |
| • | the Affiliated Marketing Rule, which prohibits or restricts the sharing of certain consumer credit information among affiliated companies without notice and/or consent of the consumer; |
| • | laws and regulations in jurisdictions outside the United States in which we do business; |
| • | state and federal employment laws and regulations, including any changes that would require classification of independent contractors to employee status, and wage and hour regulations; |
| • | Federal Trade Commission regulations restricting unsolicited telephone calls to residential and wireless telephone subscribers by means of automatic telephone dialing systems that would require us to maintain a “do not call list” and to train our personnel to comply with such regulations; |
34
Table of Contents
| • | increases in state, local or federal taxes that could diminish profitability or liquidity; and |
| • | consumer fraud statutes. |
Additionally, our home sales assistance programs are structured around the IRS’s interpretation of the definition of income under IRS Code Section 61 and application of that section to the treatment of expenses incurred in relocation home sale programs as expressed in several IRS Revenue Rulings. A revision to any such rulings or an IRS policy change that results in a different interpretation of such rulings could have a material adverse effect on our business, financial condition and results of operations.
These laws and regulations are complex and compliance with such laws and regulations is time-consuming and costly. Any changes to these laws or regulations or any new laws or regulations may make it more difficult for us to operate our business and increase our operating or compliance costs, which could have a material adverse effect on our business, financial condition and results of operations. If we fail to comply with any of the foregoing laws and regulations, we may be subject to fines, penalties, injunctions and/ or potential criminal violations, which could have a material adverse effect on our business, financial condition and results of operations.
There is also a risk that a change in current laws or regulations could adversely affect the real estate market. For instance, regulations or changes to monetary policy that could cause higher mortgage interest rates or further limits on mortgage tax deductions could negatively impact the purchase and sale of residential homes. Future legislative or regulatory changes that make compliance more difficult or expensive in areas such as mortgage lending or transportation of goods or that negatively affect the real estate market may have a material adverse effect on our business, financial condition and results of operations.
We are required to maintain a number of certificates, permits, licenses and other approvals or authorizations in order to operate our business, and if we fail to maintain them it could have a material adverse effect on our business, financial condition and results of operations.
We are required to maintain a wide variety of certificates, permits, licenses and other approvals. For example, we maintain licenses and permits issued by the FMCSA and the DOT (both required to transport household goods across state lines), as well as the Federal Maritime Commission (required to transport household goods by water between the United States and a foreign country) and banking regulators. We also hold various real estate broker licenses and mortgage lending licenses. Additionally, SIRVA Mortgage is required to hold a license to engage in mortgage origination activities in each state where it originates loans. Our wholly-owned subsidiary DJK Residential LLC is required to hold a real estate license to engage in real estate brokerage activity in each state where it provides real estate brokerage or property management services. Our ability to receive referral fees (a significant revenue source is dependent on our wholly-owned subsidiary SIRVA Relocation LLC (“SIRVA Relocation”) maintaining a real estate broker’s license as well. Our ability to receive title insurance commissions is dependent on maintaining our title insurance license. Our wholly owned subsidiary SIRVA Settlement, Inc. is required to maintain a license in each state where it issues title insurance commitments.
If we are unable to maintain or renew our existing certificates, permits, licenses or other approvals, or if we are unable to obtain any new certificates, permits licenses or other approvals that may be required in the future, we or our agents may be prevented or temporarily suspended from conducting critical aspects of our business and we may be subject to fines and other penalties, which could have a material adverse effect on our business, financial condition and results of operations.
35
Table of Contents
The creation of the Consumer Financial Protection Bureau (the “CFPB”) and its recently issued rules will likely increase our regulatory compliance burden and associated costs, which could have a material adverse effect on our business, financial condition and results of operations.
As a mortgage lender, we are subject to examination by the CFPB, which regulates consumer financial products and services. In July 2011, the CFPB obtained rulemaking and enforcement authority pursuant to the Dodd-Frank Act and began official operations.
The CFPB has broad rule-making authority, supervisory review and enforcement powers over mortgage participants, including originators, and can order, among other things, rescission or reformation of contracts, the refund of moneys or the return of real property, restitution, disgorgement or compensation for unjust enrichment, the payment of damages or other monetary relief, public notifications regarding violations, limits on activities or functions, and civil money penalties. The CFPB has been active in investigations and enforcement actions, and issued large civil monetary penalties in 2012. We also have experienced an increase in the scope and breadth of state audits that we are regularly subject to in our mortgage origination business. The increase in such audits heightens our risk of additional regulation and increases the cost of compliance, together which could materially adversely affect our margins.
The CFPB’s examination authority extends over all federal and state non-depository lending institutions, including mortgage lenders. The CFPB has authority to inspect short-term lenders’ books and records and lending practices, including marketing, underwriting, loan application and processing and collections. If the CFPB adopts any rules or regulations that significantly restrict the conduct of our consumer loan business, any such rules or regulations could have a material adverse effect on our business, prospects, results of operations and financial condition or could make the continuance of all or part of our U.S. consumer loan business impractical or unprofitable. Such examinations, as well as regulations that the CFPB might issue in the future, could ultimately increase our administrative burdens and have a material adverse effect our business, financial condition and results of operations.
The CFPB’s recently enacted rules will likely increase our administrative and compliance costs. They could also adversely affect the availability and cost of residential mortgage credit. In addition, the effective dates for these new rules are aggressive in some cases and it may be difficult for us to implement the procedures necessary to comply with these new rules by the dates on which they are to become effective. The CFPB has indicated that they plan to conduct at least one audit of every financial institution in the United States within the next five years. These increased costs of compliance, the effect of these rules on the mortgage industry and any failure in our ability to comply with these new rules by their effective dates, could have a material adverse effect on our business, financial condition and results of operations.
Actions by the CFPB could have a significant impact on us by, for example, requiring us to limit or change our business practices, limiting our ability to pursue business opportunities, requiring us to invest valuable management time and resources in compliance efforts, imposing additional costs on us, including requiring us to process refunds in certain circumstances, limiting fees we can charge for services, requiring us to meet more stringent capital requirements, impacting the value of our assets, delaying our ability to respond to marketplace changes, requiring us to alter our services in a manner that would make them less attractive to consumers and impair our ability to offer them profitably, or requiring us to make other changes that could harm our business.
The CFPB recently issued “ability-to-repay” and “qualified mortgage” rules that may have a negative impact on our loan origination process, which could adversely affect our business, operating results, and financial condition.
On January 10, 2013, the CFPB issued a final rule to implement the “qualified mortgage” provisions of the Dodd-Frank Act requiring mortgage lenders to consider consumers’ ability to repay home loans before extending them credit. The CFPB’s “qualified mortgage” rule, which became effective on January 10, 2014, describes
36
Table of Contents
certain minimum requirements for lenders making ability-to-repay determinations, but does not dictate that they follow particular underwriting models. Lenders will be presumed to have complied with the ability-to-repay rule if they issue “qualified mortgages,” which are generally defined as mortgage loans prohibiting or limiting certain risky features. Loans that do not meet the ability-to-repay standard can be challenged in court by borrowers who default and the absence of ability-to-repay status can be used against a lender in foreclosure proceedings. Any loans that we make outside of the “qualified mortgage” criteria could expose us to an increased risk of liability and reduce or delay our ability to foreclose on the underlying property. It is difficult to predict how the CFPB’s “qualified mortgage” rule will impact us when it takes effect, but any decreases in mortgage origination volume or increases in compliance and foreclosure costs caused by the rule could have a material adverse effect on our business, operating results and financial condition.
We are subject to anti-corruption statutes, and if we fail to comply with such statutes it could have a material adverse effect on our business, financial condition and results of operations.
As a global business, we are subject to anti-bribery laws and regulations of the U.S. government and those of various international and subnational jurisdictions, and our failure to successfully comply with these rules and regulations may expose us to liabilities. These laws and regulations apply to companies, individual directors, officers, employees and agents, and may restrict our operations, trade practices, investment decisions and partnering activities. In particular, our international operations are subject to U.S. and foreign anti-corruption laws and regulations, such as the FCPA, as well as anti-corruption laws of the various jurisdictions in which we operate. The FCPA and other laws prohibit us and our officers, directors, employees and agents acting on our behalf from corruptly offering, promising, authorizing or providing anything of value to foreign officials for the purposes of influencing official decisions or obtaining or retaining business or otherwise obtaining favorable treatment. As part of our business, we deal with state-owned business enterprises, the employees and representatives of which may be considered foreign officials for purposes of the FCPA. We are subject to the jurisdiction of various governments and regulatory agencies outside of the United States, which may bring our personnel into contact with foreign officials responsible for issuing or renewing permits, licenses or approvals or for enforcing other governmental regulations. In addition, some of the international locations in which we operate lack a developed legal system and have elevated levels of corruption. Our global operations expose us to the risk of violating, or being accused of violating, the foregoing or other anti-corruption laws. Such violations could be punishable by criminal fines, imprisonment, civil penalties, disgorgement of profits, injunctions and debarment from government contracts, as well as other remedial measures. Investigations of alleged violations can be very expensive and disruptive. If we have been determined to be in violation of the FCPA, the UKBA or other anti-corruption laws, we could be subject to significant fines, penalties, repayments, other damages (in certain cases, treble damages) which could have a material and adverse effect on our business, financial condition and results of operations.
The DOT’s Compliance Safety Accountability (“CSA”) rulemaking could have a material adverse effect on our business, financial condition and results of operations.
Under the DOT’s CSA initiative, a compliance and enforcement initiative designed to monitor commercial motor vehicle safety, the fleets and drivers in our agent network are evaluated and ranked based on certain safety-related standards. The current methodology for determining a carrier’s DOT safety rating has been expanded, and, as a result, certain current and potential drivers may no longer be eligible to drive for our agents, and our safety rating could be adversely impacted. A reduction in eligible drivers or a poor fleet ranking may result in our agent network encountering difficulty attracting and retaining qualified drivers, serving our customers and could cause our customers to use a mobility network with higher fleet rankings than ours, which could have a material adverse effect on our business, financial condition and results of operations.
37
Table of Contents
We are subject to a wide range of environmental laws and regulations, which are complex and costly to comply with and, if we fail to comply with such laws and regulations it could have a material adverse effect on our business, financial condition and results of operations.
We are subject to a wide range of environmental laws and regulations under the foreign, U.S., state and local laws including laws and regulations relating to the discharge of pollutants into the water, air and land, the use, management and disposal of hazardous substances, and the cleanup of contaminated sites. In certain European locations, we are required to recycle specified portions of our waste products. We could incur substantial costs, including cleanup costs, fines and civil or criminal penalties, third-party property damage or personal injury claims, or the reduction or suspension of our operations as a result of violations of or liabilities under environmental laws or non-compliance with the environmental permits required at our facilities. In addition, we own or lease, or in the past have owned or leased, facilities at which underground storage tanks are located, some of which may have leaked in the past. We have been, and may in the future be responsible for, investigating and remediating contamination at these sites, or at off-site locations where we sent hazardous wastes for disposal. If we are unable to comply with applicable environmental laws and regulations or otherwise become subject to future or contingent environmental liabilities, including remediation costs, it could have a material adverse effect on our business, financial condition and results of operations.
Risks Related to Our Company and Our Organizational Structure
Our substantial indebtedness could adversely affect our ability to raise additional capital to fund our operations, limit our ability to react to changes in the economy or our industry, expose us to interest rate risk to the extent of our variable rate debt and prevent us from meeting our debt obligations.
As of December 31, 2013, we had total outstanding long-term debt of $294.0 million and total outstanding short-term debt of $51.6 million, primarily comprised of drawings on our mortgage warehouse facilities. For the year ended December 31, 2013, total payments under our annual debt service obligations, including interest and principal, were $28.3 million. Our indebtedness could have significant negative consequences, including:
| • | increasing our vulnerability to adverse economic, industry or competitive developments; |
| • | requiring a substantial portion of cash flow from operations to be dedicated to the payment of principal and interest on our indebtedness, therefore reducing our ability to use our cash flow to fund our operations, capital expenditures and future business opportunities; |
| • | exposing us to the risk of increased interest rates because certain of our borrowings, including and most significantly borrowings under our ABL Revolver and Term Loan (defined below), are at variable rates of interest; |
| • | making it more difficult for us to satisfy our obligations with respect to our indebtedness, and any failure to comply with the obligations of any of our debt instruments, including restrictive covenants and borrowing conditions, could result in an event of default under the agreements governing such indebtedness; |
| • | restricting us from making strategic acquisitions or causing us to make non-strategic divestitures; |
| • | limiting our flexibility in planning for, or reacting to, changes in our business or market conditions and placing us at a competitive disadvantage compared to our competitors who are less highly leveraged and who, therefore, may be able to take advantage of opportunities that our leverage prevents us from exploiting. |
$289.3 million of our indebtedness as of December 31, 2013 consists of indebtedness under our $300.0 million term loan that matures in 2019 (the “Term Loan”). We may not be able to refinance our Term Loan or any other existing indebtedness because of our high level of debt, debt incurrence restrictions under our debt agreements or because of adverse conditions in credit markets generally, which could have a material adverse effect on our business, financial condition and results of operations.
38
Table of Contents
Further, our securitization (receivable sales) facility is subject to the credit worthiness of our customers. If a customer does not have satisfactory credit, we may not be able to obtain the funding we need to service such customer’s account and we may be required to seek other forms of potentially less attractive financing to fund our home sales assistance activities and relocation funding services, which could have an adverse effect on our business, financial condition and results of operations.
Finally, our mortgage business uses a warehouse line of credit to fund loans that we originate. We sell our loans to investors or to Fannie Mae. If we are unable to sell our loans that we have originated in a timely manner and replenish our warehouse line of credit, we will be limited in our ability to continue to originate mortgage loans, which could have an adverse effect on our business, financial condition and results of operations.
Despite our indebtedness level, we still may be able to incur significant additional amounts of debt, which could further exacerbate the risks associated with our substantial indebtedness.
We and our subsidiaries may be able to incur substantial additional indebtedness in the future. Although the credit agreements governing our Term Loan and ABL Revolver contain restrictions on the incurrence of additional indebtedness, these restrictions are subject to a number of significant qualifications and exceptions, and under certain circumstances, the amount of indebtedness that could be incurred in compliance with these restrictions could be substantial. For example, as of December 31, 2013, we had approximately $39.0 million of additional borrowing capacity under our ABL Revolver, which borrowing capacity depends, in part, on accounts receivable and other assets that fluctuate from time to time and may further depend on lenders’ discretionary ability to impose reserves and availability blocks and to recharacterize assets that might otherwise incrementally increase borrowing availability. If new debt is added to our outstanding debt levels, the risks related to our indebtedness that we will face would increase.
We are dependent upon our lenders for financing to execute our business strategy and meet our liquidity needs. If our lenders are unable to fund borrowings under their credit commitments or we are unable to borrow, it could have a material adverse effect on our business, financial condition and results of operations.
During periods of volatile credit markets, there is risk that any lenders, even those with strong balance sheets and sound lending practices, could fail or refuse to honor their legal commitments and obligations under existing credit commitments, including but not limited to, extending credit up to the maximum permitted by a credit facility. If our lenders are unable to fund borrowings under their revolving credit commitments or we are unable to borrow (such as having insufficient capacity under our borrowing base), it could be difficult in such environments to obtain sufficient liquidity to meet our operational needs, which could have a material adverse effect on our business, financial condition and results of operations.
Our ability to obtain additional capital on commercially reasonable terms may be limited.
Although we believe our cash and cash equivalents, as well as cash we expect to generate from operations and availability under our ABL Revolver, provide adequate resources to fund ongoing operating requirements, we may need to seek additional financing to compete effectively.
If we are unable to obtain capital on commercially reasonable terms, it could:
| • | reduce funds available to us for purposes such as working capital, capital expenditures, research and development, strategic acquisitions and other general corporate purposes; |
| • | restrict our ability to introduce new products or exploit business opportunities; |
| • | increase our vulnerability to economic downturns and competitive pressures in the markets in which we operate; and |
39
Table of Contents
| • | place us at a competitive disadvantage. |
Any of these factors would have a material adverse effect on our business, financial condition and results of operations.
Our debt obligations may limit our flexibility in managing our business.
The credit agreements governing our ABL Revolver and Term Loan require us to comply with a number of customary financial and other covenants, such as maintaining debt service coverage and leverage ratios in certain situations and maintaining insurance coverage. See “Management’s Discussion and Analysis of Financial Condition and Results of Operations—Liquidity and Capital Resources.” These covenants may limit our flexibility in our operations, and breaches of these covenants could result in defaults under the instruments governing the applicable indebtedness even if we had satisfied our payment obligations. If we were to default on the credit agreements or other debt instruments, it could have a material adverse effect on our business, financial condition and results of operations.
We are a holding company with no significant independent operations and, therefore, rely on our subsidiaries to make funds available to us.
We are a holding company with no significant independent operations and no significant assets other than the capital stock of our subsidiaries, including SIRVA Worldwide, Inc., our direct wholly owned subsidiary (“SIRVA Worldwide”). Therefore, our cash flow and our ability to meet our obligations depend on the receipt of dividends or other distributions from our subsidiaries. The ability of our subsidiaries to pay any dividends and distributions will be subject to, among other things, the terms of our ABL Revolver and Term Loan, which each contain a number of significant covenants that, among other matters, restrict our ability to incur additional indebtedness, incur capital lease obligations, pay dividends, make acquisitions or engage in mergers or consolidations, make capital expenditures, and receive dividends and distributions from SIRVA Worldwide except to fund our operating expenses in the ordinary course of business. In addition, we are required to comply with specified financial ratios and tests, including consolidated leverage ratio and consolidated interest coverage ratio requirements. See “Description of Certain Indebtedness.” There can be no assurance that our subsidiaries will generate cash flow sufficient to pay dividends or distributions to us to enable us to meet our obligations. Our inability to receive funds from our operating subsidiaries could adversely affect our ability to meet our obligations and to make dividend payments and other distributions to holders of our common stock.
Each of Aurora and EGI independently has substantial control over us and will be able to influence corporate matters with respect to us. Aurora and EGI may have interests that differ from each other and from those of our other stockholders.
After giving effect to this offering, Aurora and EGI will directly or indirectly hold, in the aggregate, approximately % and % of the voting power of our outstanding common stock, respectively. As a result, each of Aurora and EGI are able to strongly influence the election of our directors and potentially control the outcome of any corporate transaction or other matter submitted to our stockholders for approval, including potential mergers or acquisitions, asset sales and other significant corporate transactions. See “Certain Relationships and Related Person Transactions.” So long as Aurora and EGI continue to own a majority of our common stock, they will have the ability to control the vote in any election of directors and will have the ability to prevent any transaction that requires stockholder approval, regardless of whether others believe the transaction is in our best interests.
The interests of Aurora and EGI may not coincide with each other or the best interests of other holders of our common stock. This concentration of voting power could also have the effect of delaying, deterring or preventing a change of control or other business combination that might otherwise be beneficial to the stockholders of our common stock. It may also adversely affect the trading price for our common stock to the
40
Table of Contents
extent investors perceive disadvantages in owning stock with a controlling stockholder. In addition, Aurora and EGI are in the business of making investments in companies and may, from time to time, acquire interests in businesses that directly or indirectly compete with our business, as well as businesses that are significant existing or potential customers.
We have elected to take advantage of the “controlled company” exemption to the corporate governance rules for publicly listed companies, which could make our common stock less attractive to some investors or otherwise harm our stock price.
Following the consummation of this offering, we expect that Aurora will continue to control a majority of the voting power of our outstanding common stock. As a result, we expect to qualify as a “controlled company” under the corporate governance rules for publicly listed companies. Under these rules, we are not required to have a majority of our board of directors be independent, nor are we required to have a compensation committee or an independent nominating function. Following this offering, we intend to utilize these exemptions for so long as we continue to qualify as a “controlled company.” Accordingly, should the interests of Aurora, as our controlling stockholder, differ from those of our other stockholders, our other stockholders may not have the same protections afforded to stockholders of companies that are subject to all of the corporate governance rules for publicly listed companies. Our status as a controlled company could make our common stock less attractive to some investors or otherwise harm our stock price.
Risks Related to this Offering
There is no existing public market for our common stock and an active, liquid trading market for our common stock may not develop.
There is no existing public market for our common stock. We cannot predict the extent to which investor interest in our company will lead to the development of an active trading market or how liquid that market may become. If an active trading market does not develop, you may have difficulty selling any of our shares that you purchase. The initial public offering price of our common stock will be determined by negotiation between us and the underwriters and may not be indicative of prices that will prevail following the completion of this offering. The market price of our common stock may decline below the initial public offering price, and you may not be able to resell your shares at, or above, the initial public offering price.
Future sales of our common stock or securities convertible into or exchangeable for common stock could depress the market price of our common stock.
We and substantially all of our stockholders, including our existing selling stockholders, may sell additional shares of common stock in subsequent public offerings. We may also issue additional shares of common stock or convertible debt securities to finance future acquisitions. Sales of substantial amounts of our common stock in the public market, or the perception that such sales could occur, could adversely affect the market price of our common stock. This includes shares of common stock that we are selling in this offering and shares of common stock that the selling stockholders are selling in this offering, which may be resold immediately in the public market. Our directors, executive officers, Aurora and EGI will be subject to the lock-up agreements described in “Underwriting” and are subject to the Rule 144 holding period requirements described in “Shares Eligible for Future Sale—Lock-up Arrangements and Registration Rights.” After giving effect to this offering, we will have shares of common stock authorized and shares of common stock outstanding. After this offering and upon expiration of the lock-up agreements, and subject to vesting requirements and the requirements of Rule 144 of the Securities Act of 1933, as amended (the “Securities Act”), approximately additional shares will be eligible for sale in the public market (or shares if the underwriters exercise in full their option to purchase additional shares).
Aurora and EGI (and certain permitted transferees thereof) have registration rights with respect to the common stock they hold. These shares may be sold in the public market and are subject to the 180-day lock-up period for awards held by our executive officers and directors.
41
Table of Contents
The underwriters may, in their sole discretion and without notice, release all or any portion of the shares subject to lock-up agreements prior to expiration of the lock-up period. Subject to the terms of the lock-up agreements, we also may issue our shares of common stock or securities convertible into our common stock from time to time in connection with a financing, acquisition, investments or otherwise. We cannot predict the size of future issuances of our common stock or the effect, if any, that future issuances and sales of our common stock will have on the market price of our common stock. Any such issuance could result in substantial dilution to our existing stockholders. Due to these factors, sales of a substantial number of shares of our common stock in the public market could occur at any time. These sales, or the perception in the market that the holders of a large number of shares intend to or could sell shares, could reduce the market price of our common stock. Any decline in the price of shares of our common stock could impede our ability to raise capital through the issuance of additional shares of our common stock or other equity securities.
We will incur increased costs as a result of operating as a publicly traded company, and our management will be required to devote substantial time to new compliance initiatives.
As a publicly traded company, we will incur additional legal, accounting and other expenses that we do not currently incur as a private company. Although we are currently unable to estimate these costs with any degree of certainty, they may be material in amount. In addition, the Sarbanes-Oxley Act, the Dodd-Frank Act and the rules of the Securities and Exchange Commission (the “SEC”) and the NYSE or Nasdaq, have imposed various requirements on public companies. Our management and other personnel will need to devote a substantial amount of time to these compliance initiatives, as well as to investor relations. Moreover, these rules and regulations will increase our legal and financial compliance costs and will make some activities more time-consuming and costly. For example, we expect these rules and regulations to make it more difficult and more expensive for us to obtain director and officer liability insurance, and we may be required to incur additional costs to maintain the same or similar coverage.
Furthermore, if we are not able to comply with the requirements of Section 404 of the Sarbanes-Oxley Act in a timely manner, the market price of our common stock could decline and we could be subject to potential delisting by the NYSE or Nasdaq and review by such exchange, the SEC, or other regulatory authorities, which would require the expenditure by us of additional financial and management resources. As a result, our stockholders could lose confidence in our financial reporting, which would harm our business and the market price of our common stock.
Our internal control over financial reporting does not currently meet the standards required by Section 404 of the Sarbanes-Oxley Act, and failure to achieve and maintain effective internal control over financial reporting in accordance with Section 404 of the Sarbanes-Oxley Act could have a material adverse effect on our business, financial condition and results of operations.
We do not currently document or test our compliance with these controls on a periodic basis in accordance with Section 404. Furthermore, we have not tested our internal controls in accordance with Section 404 and, due to our lack of documentation, such a test would not be possible to perform at this time.
We are in the early stages of addressing our internal control procedures to satisfy the requirements of Section 404, which requires an annual management assessment of the effectiveness of our internal control over financial reporting. If we are not able to implement the requirements of Section 404 in a timely manner or with adequate compliance, our independent registered public accounting firm may not be able to attest to the effectiveness of our internal control over financial reporting. If we are unable to maintain adequate internal control over financial reporting, we may be unable to report our financial information on a timely basis, may suffer adverse regulatory consequences or violations of applicable stock exchange listing rules and may breach the covenants under our credit facilities. There could also be a negative reaction in the financial markets due to a loss of investor confidence in us and the reliability of our financial statements.
42
Table of Contents
In addition, we will incur additional costs in order to improve our internal control over financial reporting and comply with Section 404, including increased auditing and legal fees and costs associated with hiring additional accounting and administrative staff.
The price of our common stock may be volatile and you could lose all or part of your investment.
Securities markets worldwide have experienced, and are likely to continue to experience, significant price and volume fluctuations. This market volatility, as well as general economic, market or political conditions could reduce the market price of our common stock regardless of our results of operations. The trading price of our common stock is likely to be highly volatile and could be subject to wide price fluctuations in response to various factors, including, among other things, the risk factors described herein, and other factors beyond our control. Factors affecting the trading price of our common stock could include:
| • | market conditions in the broader stock market; |
| • | actual or anticipated variations in our quarterly financial and operating results; |
| • | variations in operating results of similar companies; |
| • | introduction of new services by us, our competitors or our customers; |
| • | issuance of new, negative or changed securities analysts’ reports or recommendations or estimates; |
| • | investor perceptions of us and the industries in which we or our customers operate; |
| • | sales, or anticipated sales, of our stock, including sales by existing stockholders; |
| • | additions or departures of key personnel; |
| • | regulatory or political developments; |
| • | stock-based compensation expense under applicable accounting standards; |
| • | litigation and governmental investigations; and |
| • | changing economic conditions. |
These and other factors may cause the market price and demand for shares of our common stock to fluctuate substantially, which may limit or prevent investors from readily selling their shares of common stock and may otherwise negatively affect the liquidity of our common stock. In addition, in the past, when the market price of a stock has been volatile, holders of that stock have sometimes instituted securities class action litigation against the company that issued the stock. Securities litigation against us, regardless of the merits or outcome, could result in substantial costs and divert the time and attention of our management from our business, which could significantly harm our business, profitability and reputation.
We do not anticipate paying any dividends for the foreseeable future.
We do not intend in the foreseeable future to pay any dividends to holders of our common stock. We currently intend to retain our future earnings, if any, for the foreseeable future, to repay indebtedness and to support our general corporate purposes. Therefore, you are not likely to receive any dividends on your common stock for the foreseeable future, and the success of an investment in shares of our common stock will depend upon any future appreciation in their value. There is no guarantee that shares of our common stock will appreciate in value or even maintain the price at which our stockholders have purchased their shares. However, the payment of future dividends will be at the discretion of our board of directors, subject to applicable law, and will depend on, among other things, our earnings, financial condition, capital requirements, level of indebtedness, statutory and contractual restrictions apply to the payment of dividends and other considerations that our board of directors deems relevant. Our debt agreements limit the amounts available to us to pay cash dividends, and, to the extent that we require additional funding, sources may prohibit the payment of a dividend. See “Dividend Policy.” As a consequence of these limitations and restrictions, we may not be able to make, or may have to reduce or eliminate, the payment of dividends on our common stock.
43
Table of Contents
If you purchase shares of common stock sold in this offering, you will incur immediate and substantial dilution.
The initial public offering price per share is substantially higher than the pro forma net tangible book value per share immediately after this offering. As a result, you will pay a price per share that substantially exceeds the book value of our assets after subtracting the book value of our liabilities. Based on our pro forma net tangible book value as of , 2014 and assuming an offering price of $ per share, the midpoint of the range set forth on the cover page of this prospectus, you will incur immediate and substantial dilution in the amount of $ per share. See “Dilution.”
44
Table of Contents
This prospectus contains forward-looking statements that are subject to risks and uncertainties. All statements other than statements of historical fact included in this prospectus are forward-looking statements. Forward-looking statements give our current expectations and projections relating to our financial condition, results of operations, plans, objectives, future performance and business. You can identify forward-looking statements by the fact that they do not relate strictly to historical or current facts. These statements may include words such as “anticipate,” “estimate,” “expect,” “project,” “plan,” “intend,” “believe,” “may,” “should,” “can have,” “forecast,” “likely” and other words and terms of similar meaning in connection with any discussion of the timing or nature of future operating or financial performance or other events.
The forward-looking statements contained in this prospectus are based on assumptions that we have made in light of our industry experience and our perceptions of historical trends, current conditions, expected future developments and other factors we believe are appropriate under the circumstances. As you read and consider this prospectus, you should understand that these statements are not guarantees of performance or results. They involve risks, uncertainties (many of which are beyond our control) and assumptions. Although we believe that these forward-looking statements are based on reasonable assumptions, you should be aware that many factors could affect our actual operating and financial performance and cause our performance to differ materially from the performance anticipated in the forward-looking statements. We believe these factors include, but are not limited to, those described under “Risk Factors” and “Management’s Discussion and Analysis of Financial Condition and Results of Operations.” Should one or more of these risks or uncertainties materialize, or should any of these assumptions prove incorrect, our actual operating and financial performance may vary in material respects from the performance projected in these forward-looking statements.
Any forward-looking statement made by us in this prospectus speaks only as of the date on which we make it. Factors or events that could cause our actual operating and financial performance to differ may emerge from time to time, and it is not possible for us to predict all of them. We undertake no obligation to publicly update any forward-looking statement, whether as a result of new information, future developments or otherwise, except as may be required by law.
45
Table of Contents
We estimate that the net proceeds to us from this offering will be approximately $ million based on public offering price of $ per share, which is the midpoint of the range set forth on the cover of this prospectus, after deducting underwriting discounts and commissions and estimated expenses payable by us in connection with this offering.
We intend to use approximately $ of the net proceeds from this offering to redeem all of our outstanding Series A Preferred Stock, including accumulated dividends, and to use the remainder for general corporate purposes.
A $1.00 increase (decrease) in the assumed initial public offering price of $ per share would increase (decrease) the net proceeds to us from this offering by $ million, assuming the number of shares offered by us, as set forth on the cover page of this prospectus, remains the same and after deducting underwriting discounts and commissions and estimated expenses payable by us.
We will not receive any proceeds from the sale of shares of common stock by the selling stockholders, including from any exercise by the underwriters of their option to purchase additional shares.
46
Table of Contents
We do not intend to pay cash dividends on our common stock in the foreseeable future. We are a holding company that does not conduct any business operations of our own. As a result, our ability to pay cash dividends on our common stock depends on cash dividends and distributions and other transfers from our subsidiaries. The declaration and payment of dividends is subject to the discretion of our board of directors, subject to applicable law, and depends on various factors, including our net income, financial condition, cash requirements, future prospects and other factors deemed relevant by our board of directors. The amounts available to us to pay cash dividends are also restricted by the terms of our debt agreements. See “Description of Certain Indebtedness.”
In addition, under Delaware law, our board of directors may declare dividends only to the extent of our surplus (which is defined as total assets at fair market value minus total liabilities, minus statutory capital) or, if there is no surplus, out of our net profits for the then current and/or immediately preceding fiscal year.
Any future determination to pay dividends will be at the discretion of our board of directors, and will take into account:
| • | restrictions in our debt instruments; |
| • | general economic business conditions; |
| • | our capital requirements and the capital requirements of our subsidiaries; |
| • | our financial condition and results of operations; |
| • | the ability of our operating subsidiaries to pay dividends and make distributions to us; and |
| • | such other factors as our board of directors may deem relevant. |
47
Table of Contents
The following table sets forth our cash and cash equivalents and consolidated capitalization as of December 31, 2013:
| • | on an actual basis; and |
| • | on a pro forma as adjusted basis to give effect to (i) a -for-1 stock split for our common stock prior to the consummation of this offering and (ii) the sale of shares of our common stock in this offering and the application of the net proceeds received by us from this offering as described under “Use of Proceeds.” |
This table should be read in conjunction with “Use of Proceeds,” “Selected Historical Financial Data,” “Management’s Discussion and Analysis of Financial Condition and Results of Operations,” “Description of Capital Stock” and our financial statements and the related notes thereto included elsewhere in this prospectus.
| As of December 31, 2013 | ||||||||
| Actual | Pro Forma As Adjusted(1) |
|||||||
| (in millions, except share data) | ||||||||
| Cash and cash equivalents |
$ | 28.0 | $ | |||||
|
|
|
|
|
|||||
| Long-Term Debt: |
||||||||
| Term Loan(2) |
$ | 289.3 | $ | |||||
| ABL Revolver(3) |
— | |||||||
| Capital lease obligations |
3.5 | |||||||
| Other debt |
1.2 | |||||||
|
|
|
|||||||
| Total long-term debt, including current portion |
$ | 294.0 | $ | |||||
|
|
|
|
|
|||||
| Stockholders’ Equity: |
||||||||
| Series A preferred stock, $0.01 par value; 1,000,000 shares authorized; 99,444 shares issued and outstanding, actual; shares issued and outstanding pro forma |
— | |||||||
| Common stock, $0.01 par value; 4,000,000 shares authorized; 1,073,146 shares issued and outstanding, actual; shares issued and outstanding pro forma |
— | |||||||
| Additional paid-in-capital |
116.6 | |||||||
| Accumulated other comprehensive loss |
(37.5 | ) | ||||||
| Accumulated deficit |
(256.1 | ) | ||||||
|
|
|
|
|
|||||
| Total stockholders’ deficit |
(177.0 | ) | ||||||
|
|
|
|
|
|||||
| Total capitalization |
$ | 117.0 | $ | |||||
|
|
|
|
|
|||||
| (1) | Assuming the number of shares sold by us in this offering remains the same as set forth on the cover page, a $1.00 increase or decrease in the assumed initial public offering price would increase or decrease, as applicable, our pro forma total capitalization by approximately $ million. |
| (2) | Our Term Loan provides for $300.0 million in borrowing and matures in 2019. See Note 7 “Long-term Debt” to the Company’s audited financial statements included elsewhere in this prospectus and “Description of Other Indebtedness.” |
| (3) | Our ABL Revolver provides for $50.0 million in borrowing, subject to borrowing base limitations, and matures in 2018. See Note 7 “Long-term Debt” to the Company’s audited financial statements included elsewhere in this prospectus and “Description of Other Indebtedness.” Our borrowing capacity depends, in part, on inventory, accounts receivable and other assets that fluctuate from time to time and may further depend on lenders’ discretionary ability to impose reserves and availability blocks and to recharacterize assets that might otherwise incrementally increase borrowing availability. |
48
Table of Contents
If you invest in our common stock, your interest will be diluted to the extent of the difference between the initial public offering price per share of common stock and the pro forma net tangible book value per share of our common stock upon the consummation of this offering and the use of proceeds therefrom. Dilution results from the fact that the per share offering price of our common stock is substantially in excess of the book value per share attributable to our existing investors.
Our pro forma net tangible book value as of December 31, 2013 would have been approximately $ , or $ per share, of our common stock. Pro forma net tangible book value represents the amount of total tangible assets less total liabilities and pro forma net tangible book value per share represents pro forma net tangible book value divided by the number of shares of common stock outstanding, in each case, after giving effect this offering.
After giving effect to (i) the sale of shares of common stock in this offering at the assumed initial public offering price of $ per share (the midpoint of the range set forth on the cover of this prospectus) and (ii) the application of the net proceeds from this offering, our pro forma net tangible book value would have been $ , or $ per share. This represents an immediate increase in pro forma net tangible book value of $ per share to our existing investors and an immediate dilution in pro forma net tangible book value of $ per share to new investors.
The following table illustrates this dilution on a per share of common stock basis:
| Assumed initial public offering price per share |
$ | |||||||
| Pro forma net tangible book value per share as of December 31, 2013 |
$ | |||||||
| Increase in pro forma net tangible book value per share attributable to new investors |
||||||||
|
|
|
|||||||
| Pro forma as adjusted net tangible book value per share after this offering |
||||||||
|
|
|
|||||||
| Dilution in pro forma net tangible book value per share to new investors |
$ | |||||||
|
|
|
The following table summarizes, on a pro forma basis as of December 31, 2013 after giving effect to this offering, the total number of shares of common stock purchased from us, the total cash consideration paid to us and the average price per share paid by our existing investors and by new investors purchasing shares in this offering.
| Shares Purchased | Total Consideration | Average Price Per Share |
||||||||||||||||
| Number | Percent | Amount | Percent | |||||||||||||||
| Existing stockholders |
% | $ | % | $ | ||||||||||||||
| New investors |
$ | |||||||||||||||||
|
|
|
|
|
|
|
|
||||||||||||
| Total |
100 | % | $ | 100 | % | $ | ||||||||||||
|
|
|
|
|
|
|
|
|
|
||||||||||
If the underwriters were to fully exercise their option to purchase additional shares of our common stock from us and additional shares of our common stock from the selling stockholders, the percentage of shares of our common stock held by existing stockholders would be %, and the percentage of shares of our common stock held by new investors would be %.
The above discussion and tables are based on the number of shares outstanding at December 31, 2013 and assume no exercise of outstanding options. To the extent that outstanding options are exercised, there will be further dilution to new investors purchasing common stock in this offering. In addition, we may choose to raise additional capital due to market conditions or strategic considerations even if we believe we have sufficient funds for our current or future operating plans. To the extent that additional capital is raised through the sale of equity or convertible debt securities, the issuance of such securities could result in further dilution to our stockholders.
49
Table of Contents
SELECTED HISTORICAL FINANCIAL DATA
The following table sets forth our selected historical financial and other data for the periods and as of the dates indicated. We derived our consolidated statement of operations data for the years ended December 31, 2013, 2012 and 2011 and our balance sheet data as of December 31, 2013 and 2012 from our audited consolidated financial statements included elsewhere in this prospectus. We derived our consolidated statement of operations data for the years ended December 31, 2010 and December 31, 2009 and our balance sheet data as of December 31, 2011, 2010 and 2009 from our unaudited consolidated financial statements which are not included in this prospectus. The unaudited consolidated financial statements have been prepared on the same basis as the audited consolidated financial statements and, in our opinion, reflect all adjustments necessary for the fair presentation of the financial information set forth in those statements.
Our historical results are not necessarily indicative of future operating results. You should read the information set forth below in conjunction with “Management’s Discussion and Analysis of Financial Condition and Results of Operations” and our financial statements and the related notes thereto included elsewhere in this prospectus.
| Year Ended December 31, | ||||||||||||||||||||
| 2013 | 2012 | 2011 | 2010 | 2009 | ||||||||||||||||
| (in millions, except share and per share data) | ||||||||||||||||||||
| (unaudited) | ||||||||||||||||||||
| Statement of Operations Data: |
||||||||||||||||||||
| Revenue: |
||||||||||||||||||||
| Mobility Solutions |
$ | 148.8 | $ | 138.7 | $ | 143.7 | $ | 135.0 | $ | 129.6 | ||||||||||
| Mobility Networks |
1,088.9 | 1,080.9 | 1,017.0 | 901.2 | 839.1 | |||||||||||||||
| Europe, Asia and Emerging Markets |
72.2 | 63.1 | 58.9 | 51.3 | 45.8 | |||||||||||||||
| Australia |
160.5 | 173.7 | 167.1 | 131.0 | 112.8 | |||||||||||||||
|
|
|
|
|
|
|
|
|
|
|
|||||||||||
| Total service revenue |
1,470.4 | 1,456.4 | 1,386.7 | 1,218.5 | 1,127.3 | |||||||||||||||
| Home revenue |
523.8 | 494.4 | 545.7 | 491.1 | 549.1 | |||||||||||||||
|
|
|
|
|
|
|
|
|
|
|
|||||||||||
| Total revenue |
1,994.2 | 1,950.8 | 1,932.4 | 1,709.6 | 1,676.4 | |||||||||||||||
| Direct expenses: |
||||||||||||||||||||
| Purchased transportation expense |
1,004.6 | 1,006.5 | 953.8 | 839.7 | 781.2 | |||||||||||||||
| Home cost |
526.9 | 497.3 | 549.7 | 496.4 | 552.0 | |||||||||||||||
| Other direct expense |
232.7 | 225.5 | 220.5 | 186.1 | 172.3 | |||||||||||||||
|
|
|
|
|
|
|
|
|
|
|
|||||||||||
| Gross profit |
$ | 230.0 | $ | 221.5 | $ | 208.4 | $ | 187.4 | $ | 170.9 | ||||||||||
| Operating expenses: |
||||||||||||||||||||
| Selling, general and administrative expense |
$ | 180.8 | $ | 184.0 | $ | 192.3 | $ | 173.7 | $ | 180.7 | ||||||||||
| Intangibles amortization |
7.3 | 9.3 | 10.4 | 10.4 | 8.6 | |||||||||||||||
| Restructuring and impairment expense |
2.3 | 2.3 | 3.7 | 0.6 | 7.0 | |||||||||||||||
| Operating income (loss) from continuing operations: |
||||||||||||||||||||
| Mobility Solutions |
$ | 25.5 | $ | 17.9 | $ | 13.1 | $ | 8.5 | $ | 0.2 | ||||||||||
| Mobility Networks |
24.2 | 17.1 | 11.7 | 11.4 | (3.5 | ) | ||||||||||||||
| Europe, Asia and Emerging Markets |
4.6 | 1.3 | 4.8 | 5.3 | 4.9 | |||||||||||||||
| Australia |
2.7 | 1.5 | 1.3 | 0.4 | (0.5 | ) | ||||||||||||||
| Corporate |
(17.4 | ) | (11.9 | ) | (28.9 | ) | (22.9 | ) | (26.5 | ) | ||||||||||
|
|
|
|
|
|
|
|
|
|
|
|||||||||||
| Total operating income (loss) from continuing operations |
$ | 39.6 | $ | 25.9 | $ | 2.0 | $ | 2.7 | $ | (25.4 | ) | |||||||||
|
|
|
|
|
|
|
|
|
|
|
|||||||||||
| Interest expense, net |
$ | 26.2 | $ | 25.1 | $ | 32.2 | $ | 49.9 | $ | 46.5 | ||||||||||
| Debt extinguishment loss (gain) |
8.0 | (0.3 | ) | 16.8 | — | — | ||||||||||||||
| Other expense, net |
0.5 | — | 1.3 | 0.8 | (0.1 | ) | ||||||||||||||
| Income tax expense |
0.2 | 2.2 | 5.0 | 5.1 | 3.8 | |||||||||||||||
|
|
|
|
|
|
|
|
|
|
|
|||||||||||
| Income (loss) from continuing operations |
4.7 | (1.1 | ) | (53.3 | ) | (53.1 | ) | (75.6 | ) | |||||||||||
| Income (loss) income from discontinued operations, net of tax |
5.0 | (0.3 | ) | 0.4 | 0.3 | (2.4 | ) | |||||||||||||
|
|
|
|
|
|
|
|
|
|
|
|||||||||||
| Net income (loss) |
9.7 | (1.4 | ) | (52.9 | ) | (52.8 | ) | (78.0 | ) | |||||||||||
| Less: preferred stock dividends |
(20.4 | ) | (27.4 | ) | (18.4 | ) | — | — | ||||||||||||
|
|
|
|
|
|
|
|
|
|
|
|||||||||||
| Net loss available to common stockholders |
$ | (10.7 | ) | $ | (28.8 | ) | $ | (71.3 | ) | $ | (52.8 | ) | $ | (78.0 | ) | |||||
|
|
|
|
|
|
|
|
|
|
|
|||||||||||
50
Table of Contents
| Year Ended December 31, | ||||||||||||||||||||
| 2013 | 2012 | 2011 | 2010 | 2009 | ||||||||||||||||
| (in millions, except share and per share data) | ||||||||||||||||||||
| (unaudited) | ||||||||||||||||||||
| Per Share Data: |
||||||||||||||||||||
| Basic and diluted loss per common share from continuing operations |
$ | (14.97 | ) | $ | (27.60 | ) | $ | (70.32 | ) | $ | (53.02 | ) | $ | (77.51 | ) | |||||
| Basic and diluted earnings (loss) per common share from discontinued operations |
4.78 | (0.21 | ) | 0.42 | 0.27 | (2.48 | ) | |||||||||||||
| Basic and diluted net loss per common share |
(10.19 | ) | (27.81 | ) | (69.90 | ) | (52.75 | ) | (79.99 | ) | ||||||||||
| Weighted-average basic and diluted common shares outstanding |
1,048,465 | 1,033,450 | 1,019,736 | 1,001,641 | 975,364 | |||||||||||||||
| Balance Sheet Data: |
||||||||||||||||||||
| Total assets |
$ | 427.3 | $ | 433.2 | $ | 447.8 | $ | 423.9 | $ | 416.7 | ||||||||||
| Short-term debt |
51.6 | 56.7 | 57.6 | 21.9 | 36.9 | |||||||||||||||
| Long-term debt (including current portions) |
294.0 | 172.6 | 181.2 | 329.5 | 298.0 | |||||||||||||||
| Preferred stock (involuntary liquidation value) |
141.9 | 230.6 | 191.9 | — | — | |||||||||||||||
51
Table of Contents
MANAGEMENT’S DISCUSSION AND ANALYSIS OF
FINANCIAL CONDITION AND RESULTS OF OPERATIONS
You should read the following discussion and analysis of our financial condition and results of operations together with “Selected Historical Financial Data” and our consolidated financial statements and the related notes and other financial information and operating data, which are included elsewhere in this prospectus. Some of the information contained in this discussion and analysis, including information with respect to our plans and strategy for our business, includes forward-looking statements that involve risks and uncertainties. You should review the “Risk Factors” and “Forward-Looking Statements” sections of this prospectus for a discussion of important factors that could cause actual results to differ materially from the results described in or implied by the forward-looking statements contained in the following discussion and analysis. Historical results are not necessarily indicative of the results to be expected for any future period. Results for any interim period may not necessarily be indicative of the results that may be expected for a full year.
Overview
We are a leading provider of mobility services for multi-national corporations and government institutions. Our customers, typically corporate human resources departments, use SIRVA’s solutions to optimize the deployment of their professional talent on a global basis – ensuring that their best people are leading their most important initiatives, regardless of where in the world they are located. We serve a blue-chip customer base of more than 1,800 customers, including approximately 28% of the Fortune 500 and two-thirds of the Dow Jones 30.
Our History
We initially built our mobility services business through several acquisitions. In 1998, we acquired North American Van Lines, which has been in business since 1933. In 1999, we enhanced our mobility services capabilities through the acquisition of Allied Van Lines, which has been in business since 1928. From 1999 through 2004, we made a number of additional acquisitions of mobility-related businesses around the world. As we built our business, we recognized a trend for corporate customers to outsource many aspects of employee relocation services to mobility service providers. To take advantage of this opportunity, and to expand into mobility services, we made several more acquisitions of mobility services providers and developed our network of mobility services vendors. In November 2003, we completed an initial public offering of our common stock.
As a result of various factors, including acquisitions of asset-heavy businesses, acquisitions of non-core businesses, inadequate accounting control and significant related expenditures, liquidity deficiencies and taking a significant number of homes into inventory during a declining housing market, we sought bankruptcy protection and filed a pre-packaged bankruptcy plan under Chapter 11 of the U.S. Bankruptcy Code in February 2008. We emerged from bankruptcy in May 2008 as a private company controlled by Aurora and EGI. The pre-packaged bankruptcy plan allowed us to obtain relief from our debt service. After emerging from bankruptcy, we also terminated certain unfavorable customer contracts and began the process of revising certain unfavorable provisions in our customer contracts.
From 2008 through 2011, we completed a series of business initiatives designed to reduce our risk and improve our financial performance, including the following:
- Hired a new management team—We hired a new CEO in July 2008 and a new CFO, a new CIO and a new President for Asia in 2011, and recruited a number of other key executives.
- Focused on asset-light strategy—In order to focus on our asset-light businesses, we continued to divest many of our asset-heavy businesses, including our United Kingdom and Ireland moving services businesses in March 2008. Prior to that, in 2007 we sold both our New Zealand local moving services business and our Continental Europe moving services businesses which, combined, had operated in thirteen countries.
52
Table of Contents
- Divested non-core businesses—We continued to divest non-core business that was not directly related to providing mobility services, including the sale of the last of our logistics businesses in 2013. This divesture was in addition to the sale of our U.K. industrial moving business in 2002, the sale of six of our seven logistics businesses in 2004 and 2005, the sale of our U.S. insurance business in 2005 and the sale of our U.K. construction management business in 2007.
- Improved our risk management—We developed and implemented new policies, programs, structures and corporate governance for home assistance that were designed to minimize risk and the number of homes in inventory, which we believe reduces our exposure to the carrying costs of homes and to fluctuations in the housing market. We also were able to revise or enter into new contracts with our corporate customers that implemented our new policies and addressed our exposure to real estate and home price fluctuations. In addition, we developed and implemented new policies, programs, structures and corporate governance to tighten our mortgage underwriting process.
- Enhanced our liquidity—We enhanced our liquidity by significantly lowering our indebtedness through the bankruptcy process and related recapitalization. In March 2011, we completed a refinancing of our senior secured credit facility by entering into a new $160.0 million term loan to replace the existing senior secured credit facility term loan and a new $50.0 million asset-based revolving credit facility to replace the existing senior secured credit facility revolver. We recorded a debt extinguishment loss of $18.9 million for the year ended December 31, 2011 associated with this refinancing.
Beginning in 2012, we initiated the implementation of our growth strategy through the following initiatives:
- Expanded our mobility services—We focused on increasing the breadth and depth of mobility services that we provide to multi-national corporations and government institutions by enhancing our in-house capabilities, introducing new products, expanding our solutions offered to customers and entering new adjacent markets.
- Developed technology—We developed our integrated technology platform that interconnects our system with the human resources departments of our corporate customers, individual transferees and our agents and third-party vendors. Our technology is a key selling point and has improved customer and transferee satisfaction, enhanced our ability to manage our agents/franchises and vendors, reduced our costs and improved our management and financial reporting. In October 2013, in order to better serve the corporate relocation market, we launched our LumpSum Xpress Marketplace product.
- Enhanced our sales and marketing capabilities—We focused the majority of our sales and marketing efforts on penetrating the Fortune 1000 and Fortune Global 500 accounts on a global basis. In addition, we targeted the market segments that depend relatively more on their employee talent for their success, such as the technology, energy, financial services, pharmaceutical and business services industries. We have enhanced our sales and marketing capabilities through various initiatives led by a new Chief Commercial Officer, who we hired in 2012, which we believe have improved the coordination and execution of global sales opportunities as evidenced by an increased win rate for new large corporate customers.
- Expanded in Europe, Asia and Emerging Markets—We believe market opportunities exist for outsourced mobility services from companies operating in Europe, Asia, the Middle East, Africa and South America. In order to take advantage of this opportunity, we have opened new locations, acquired or increased our ownership interest in businesses in China, India, Brazil and Germany that provide relocation and moving services and hired local sales and marketing personnel.
- Improved Capital Structure—In March 2013, we completed a debt refinancing that included entering into the Term Loan and the ABL Revolver. A portion of the proceeds from the Term Loan were used to redeem a portion of our outstanding Series A Preferred Stock and to pay accrued and unpaid dividends.
53
Table of Contents
Since 2009, we have improved our results of operations and have expanded our business. Our revenue has increased from $1,676.4 million in 2009 to $1,994.2 million in 2013, our Net Service Revenue has increased from $343.2 million in 2009 to $462.7 million in 2013, our Adjusted EBITDA has increased from $13.9 million in 2009 to $76.8 million in 2013, and we recorded a net loss of $78.0 million in 2009 as compared to net income of $9.7 million in 2013.
How We Assess the Performance of Our Business
In assessing the performance of our business, we consider a variety of performance and financial measures. These include Net Service Revenue, Adjusted EBITDA, new corporate customer contracts and estimated annualized service revenue under these new contracts, mobility solutions initiations, average revenue per mobility solutions initiation, mobility networks initiations, average revenue per mobility networks initiation and average home sale price.
Net Service Revenue
In our Mobility Networks, Europe, Asia and Emerging Markets and Australia segments, Net Service Revenue is a metric we use to access the amount of revenue remaining after paying PTE, which is the primary cost of providing household goods moving services. In our Mobility Solutions segment, Net Service Revenue is a metric we use to deduct the difference between home revenue and home cost, which is considered an expense of our premium home sale assistance program. Net Service Revenue is defined as total revenue less PTE and home cost.
Adjusted EBITDA
In evaluating our business, we consider and use Adjusted EBITDA as a supplemental measure of our operating performance. Adjusted EBITDA is a key measure used by management to evaluate our operating performance and is defined as earnings (loss) from continuing operations before interest, taxes, depreciation and amortization (“EBITDA”), further adjusted to eliminate the effects of items that we do not consider indicative of our core operating performance. The exclusion of certain expenses in calculating Adjusted EBITDA facilitates operating performance comparisons on a period-to-period basis. A reconciliation of Adjusted EBITDA to income (loss) from continuing operations is presented in “Summary—Summary Historical Financial and Other Data.”
New Corporate Customer Contracts
To measure the performance of our operating segments and our sales and marketing activities, we track the number of new contracts that we enter into with corporate customers during a period as well as the estimated annualized service revenue from such contracts. We estimate that the annual service revenue attributable to corporate contracts signed in 2011, 2012 and 2013 is approximately $51.0 million, $60.0 million and $86.0 million, respectively.
For each of our new corporate contracts, we estimate the amount of annual revenue that will be generated by these contracts. The estimate is based on information that we receive from the customer regarding its historical trends of relocation initiations and its relocation budgets. The amounts represent the estimated annual amount that will be generated by such contracts once they are fully implemented, which is usually in the second or third year after we enter into the contract. Our contracts generally do not provide for any minimum revenue thresholds or required usage levels and may be terminated at will by the customer prior to reaching the expected levels of revenue generation. Accordingly, the actual amount of revenue generated by these contracts may differ materially from such estimates.
54
Table of Contents
Mobility Solutions Initiations
We generate a substantial portion of our Net Service Revenue by providing mobility services. We track mobility solutions initiations, defined as new transfers by our corporate customers, as a key indicator of the volume of mobility services that we will provide in the current and future periods. A mobility solutions initiation may also include a household move. If the household move is through our network, this may also result in a mobility networks initiation and the revenue attributable to the household move will be recognized in our Mobility Networks segment.
Average Revenue per Mobility Solutions Initiation
Average revenue generated per initiation reflects the depth and breadth of mobility services that we and our third-party vendors are providing to our corporate customers and the success of our cross-selling efforts. Average revenue per initiation is influenced by transferee homeownership, family size, the level of benefits provided by the corporate customer, the types of services provided, whether the transfer is to another country and the mix of standard home sale and premium home sale services provided.
Mobility Networks Initiations
We track mobility networks initiations, which are household goods moves by transferees of our corporate customers, individual consumers and military and government personnel. We receive revenue on international moves, interstate moves and certain intrastate moves. The number of mobility network initiations in a period has a direct impact on our service revenue. We count a mobility networks initiation for operational purposes when we load a move at the origin location, but defer revenue and expense recognition until it has been delivered or our services have been completed. We do not collect revenue in connection with certain local moves performed by our agent/franchise network.
Average Revenue per Mobility Networks Initiation
Average revenue per mobility networks initiation reflects the size, weight, distance and breadth and depth of moving services provided. Average revenue per initiation is also impacted by customer mix, with moves for international transferees typically providing higher revenue due to the additional services involved (e.g. extra crating and customs services).
Average Home Sale Price
Our home revenue is impacted by the average price of the homes that we sell in connection with our premium home sale assistance program.
Factors Affecting Our Business
General Economic Conditions
Because a significant portion of our revenue is derived from our contracts with large multi-national corporations, our results of operations are affected by global economic conditions, particularly economic conditions in the United States, that impact these corporations. While we believe our diverse customer base limits our exposure to any particular industry or geography, global economic conditions may impact overall levels of corporate spending as well as average home sale prices, which can directly affect our results of operations. Favorable general economic conditions can also result in the deployment of personnel to take advantage of market opportunities. General economic conditions may also affect the U.S. federal government’s budget, which can impact expenditures, including expenditures on transfers of military and civilian personnel. From time to time, certain industries that employ workers with specific technical skills, such as information technology or oil and gas exploration, deploy workers to meet industry demands, which are impacted by general economic conditions.
55
Table of Contents
Unemployment
Employment levels can also impact the number of mobility solutions and mobility networks initiations, which can affect our results of operations. When the employment market is tight, with unemployment at low levels, corporations may expand the geographic scope of their recruitment efforts and may offer their employees an enhanced scope of relocation benefits, which could result in more initiations and higher average revenue per initiation. Relatively high levels of unemployment may result in fewer initiations.
Globalization
As corporations expand their global reach and enter new markets, they may choose to deploy existing personnel to new markets to ensure that the right talent is working on new projects, or in response to the lack of sufficient local talent in new markets. In addition, as new multi-national corporations in developing economies become more prominent global players, they may also seek to deploy talent to additional regions of the world. Any trends that impact globalization could impact demand for our mobility services and our results of operations.
Outsourcing
Our results of operations are impacted by the rate that our existing and potential customers outsource their mobility needs or elect to manage all or a portion of these services in house or as part of another function (such as travel or business expense reimbursement).
Seasonality
Our business segments are subject to seasonal fluctuations. Revenue for our Mobility Solutions, Mobility Networks and Europe, Asia and Emerging Markets segments is generally higher in the second and third quarters of the calendar year, while revenue in our Australia segment is typically higher in the first and fourth quarters, corresponding to the summer months in each hemisphere. A significant portion of the expenses we incur, such as PTE and cost of homes sold, are directly related to the number of mobility initiations that occur in a given period and vary with revenue. However, certain of our other expenses, such as interest payments, facilities costs and certain personnel-related costs, are fixed and cannot be increased or reduced to match the seasonal changes. Consequently, our net income is generally higher in the second and third quarter of each year.
Currency Fluctuations
A portion of the assets, liabilities and commitments that are to be settled in cash and are denominated in foreign currencies for transaction purposes are sensitive to changes in currency exchange rates, which can impact our results of operations. We review and analyze our results of operations excluding the effect of foreign currency translation because we believe this better represents the underlying trends that impact our business. Unless otherwise indicated the effect of foreign currency translation on the period to period comparisons presented below is not material.
Components of Results of Operations
The following is a description of certain components of our results of operations and the factors that impact those components.
Revenue
Service Revenue. We earn our mobility network revenue based on the size and weight of the initiation, the distance transported and the complexity of a moving assignment. The complexity of a move is impacted by the number of additional origin and destination services requested or required based on the customer’s needs or the physical characteristic of the origin or destination locations. These additional services include packing/unpacking, crating, appliance, home theater and backyard play set disconnect/reconnect, piano handling, extra labor and storage. In addition, we earn revenue when an individual transferee elects incremental protection for
56
Table of Contents
the transported goods which we refer to as “valuation” that provides for a higher protection amount to be assigned to the customer’s household goods being transported. Service revenue also includes fuel and insurance surcharges based on industry tariff guidelines.
We also provide home purchase and home sale assistance, for which we earn a service fee. The fees we receive for our services come from a mix of customer paid fees and real estate referral fees. The amount of fees is based upon several factors including, among others, the type of home sale assistance program (premium or standard), the value of the home, the volume of business and the mix of other services provided and fees charged by us. Client service fees under our premium home sale product are charged as a fixed percentage of the home value. Costs associated with the service typically include, but are not limited to, real estate brokerage commissions, mortgage origination, title insurance and property management. Under our standard home sale product, we receive a flat service fee and we bill the customer for all costs associated with the sale of a home. In addition to the above, we receive referral fees from qualified real estate agents for the listing or home purchase referral of a transferred employee. We also provide additional services associated with the home purchase and home sale assistance. These services include mortgage assistance, title insurance and other products for which we earn revenue per transaction.
We also receive fees for a number of mobility services that we either manage or directly provide in connection with each initiation. We manage the provision of a large variety of services through our network of third-party providers and earn a management fee. These management fees are typically billed as a corporate fee for each mobility service or for a bundle of services. We may also earn referral fees from the third-party providers. For services we provide directly, we earn a service fee. These services include expense management, corporate housing, destination services, and visa and immigration.
Home Revenue. Home revenue represents proceeds received from the sale of homes that we acquire in connection with our premium home sale product and does not include the revenue that we earn in connection with this product, which is included in service revenue as described above.
Direct Expenses
Purchased transportation expense. The cost of services provided by our network agents and other suppliers when providing transportation and moving services is PTE. For domestic initiations, PTE includes costs for packing, loading, transportation, unloading, unpacking, origin and destination services and fuel and insurance surcharges. For international initiations, PTE also includes costs for customs clearance and security and port charges.
Home cost. Home cost represents the amount paid to purchase a home from a transferee utilizing our premium home sale product as well as adjustments to net realizable value of relocation properties held for resale based on expected sale proceeds.
Other direct expense. Other direct expense is comprised of costs to assist transferees with home transactions. In our premium home sale assistance program, these costs include real estate broker commissions, closing activities and property management responsibilities, as well as salaries and benefits of relocation counselors and other customer-facing functions. In our standard home assistance program, only salaries and benefits of relocation counselors and other customer-facing functions are direct costs to us. Other direct expense also includes costs associated with household goods related damage and loss and delay claims related to operations in our Mobility Networks, Europe, Asia and Emerging Markets, and Australia segments. For a limited portion of our business, primarily in the Australia segment, we have direct expenses for employees (drivers, packers, warehouse personnel, etc.), warehouse facilities, transportation and warehouse equipment costs including equipment depreciation, and other cost of sales. These direct expenses are not categorized as PTE because they are incurred directly by us and not our network agents.
57
Table of Contents
Gross Profit and Gross Margin
Gross profit is equal to total revenue minus total direct expenses. Gross margin is equal to gross profit divided by total revenue. Gross profit and gross margin have been and will continue to be affected by a variety of factors, including the mix of revenue attributable to each of our segments and the mix of products offered within those segments.
Operating Expenses
Selling, general and administrative expense. Selling, general and administrative expenses includes payroll and benefits, employee incentives, professional fees, including legal and accounting fees, legal reserves and legal settlement costs, technology costs, travel and administration costs, depreciation expense, office facility rents and operating costs, communications costs, and other expenses related to each of our operating centers and our corporate headquarters, as well as share-based compensation. Selling expenses include sales and marketing staff wages, commissions and benefits, as well as advertising and other sales and marketing costs.
While selling expenses may vary in proportion with service revenue, general and administrative expenses do not generally vary in proportion with service revenue. As a result, selling, general and administrative expenses as a percentage of service revenue may be higher in lower volume quarters and lower in higher volume quarters. Selling, general and administrative expense as a percentage of service revenue is typically highest in the first and fourth quarter.
Following the completion of this offering, we will incur additional legal, accounting and other expenses that we did not incur as a private company, including costs associated with public company reporting and corporate governance requirements. These requirements include compliance with the Sarbanes-Oxley Act as well as other rules implemented by the SEC and applicable stock exchange rules. We expect these rules and regulations to substantially increase our legal and financial compliance costs and to make certain financial reporting and other activities more time-consuming and costly.
Intangibles amortization. Intangibles amortization consists of the amortization of our trade names and customer relationships.
Restructuring and impairment expense. Restructuring and impairment expense consists primarily of costs associated with severance and employee benefits and lease exit costs.
Interest Expense, Net
Interest expense, net consists primarily of interest on borrowings under our Term Loan and ABL Revolver, less interest income earned on our cash and cash equivalents. Interest expense, net also includes interest due on our second lien debt. The majority of this second lien debt was cancelled in 2011 in exchange for the issuance of our Series A Preferred Stock, and all remaining amounts were fully repaid during the year ended December 31, 2013.
Debt Extinguishment Loss (Gain), Net
Debt extinguishment loss consists primarily of charges incurred in connection with our 2011 and 2013 debt refinancings. Debt extinguishment gains were related to the settlement of a note payable and the partial forgiveness of a state incentive loan.
Other Expense, Net
Other expense, net includes items such as gains or losses due to foreign exchange and other miscellaneous items.
58
Table of Contents
Income Tax Expense
We are subject to corporate income tax in all of the jurisdictions in which we operate. Our effective tax rate differs from applicable statutory tax rate primarily due to a full valuation allowance against the U.S. and certain foreign subsidiaries’ net deferred tax assets, and the relative amount of income or loss earned in the various jurisdictions and changes in uncertain tax position liabilities and related interest and penalties.
Consolidated Results of Operations
The following tables set forth our statements of operations in dollars and as a percentage of revenue for the periods presented.
| Year Ended December 31, | ||||||||||||||||||||||||
| 2013 | 2012 | 2011 | ||||||||||||||||||||||
| (in millions) | ||||||||||||||||||||||||
| Revenue: |
||||||||||||||||||||||||
| Service revenue |
$ | 1,470.4 | 73.7 | % | $ | 1,456.4 | 74.7 | % | $ | 1,386.7 | 71.8 | % | ||||||||||||
| Home revenue |
523.8 | 26.3 | % | 494.4 | 25.3 | % | 545.7 | 28.2 | % | |||||||||||||||
|
|
|
|
|
|
|
|
|
|
|
|
|
|||||||||||||
| Total revenue |
1,994.2 | 100.0 | % | 1,950.8 | 100.0 | % | 1,932.4 | 100.0 | % | |||||||||||||||
| Direct expenses: |
||||||||||||||||||||||||
| Purchased transportation expense |
1,004.6 | 50.4 | % | 1,006.5 | 51.6 | % | 953.8 | 49.4 | % | |||||||||||||||
| Home cost |
526.9 | 26.4 | % | 497.3 | 25.5 | % | 549.7 | 28.4 | % | |||||||||||||||
| Other direct expense |
232.7 | 11.7 | % | 225.5 | 11.5 | % | 220.5 | 11.4 | % | |||||||||||||||
|
|
|
|
|
|
|
|
|
|
|
|
|
|||||||||||||
| Gross profit |
230.0 | 11.5 | % | 221.5 | 11.4 | % | 208.4 | 10.8 | % | |||||||||||||||
| Operating expenses: |
||||||||||||||||||||||||
| Selling, general and administrative expense |
180.8 | 9.0 | % | 184.0 | 9.5 | % | 192.3 | 10.0 | % | |||||||||||||||
| Intangibles amortization |
7.3 | 0.4 | % | 9.3 | 0.5 | % | 10.4 | 0.5 | % | |||||||||||||||
| Restructuring and impairment expense |
2.3 | 0.1 | % | 2.3 | 0.1 | % | 3.7 | 0.2 | % | |||||||||||||||
|
|
|
|
|
|
|
|
|
|
|
|
|
|||||||||||||
| Operating income from continuing operations |
39.6 | 2.0 | % | 25.9 | 1.3 | % | 2.0 | 0.1 | % | |||||||||||||||
| Interest expense, net |
26.2 | 1.4 | % | 25.1 | 1.3 | % | 32.2 | 1.7 | % | |||||||||||||||
| Debt extinguishment loss (gain), net |
8.0 | 0.4 | % | (0.3 | ) | (0.0 | )% | 16.8 | 0.8 | % | ||||||||||||||
| Other expense, net |
0.5 | 0.0 | % | — | 0.0 | % | 1.3 | 0.1 | % | |||||||||||||||
| Income tax expense |
0.2 | 0.0 | % | 2.2 | 0.1 | % | 5.0 | 0.2 | % | |||||||||||||||
|
|
|
|
|
|
|
|
|
|
|
|
|
|||||||||||||
| Income (loss) from continuing operations |
4.7 | 0.2 | % | (1.1 | ) | (0.1 | )% | (53.3 | ) | (2.7 | )% | |||||||||||||
| Income (loss) from discontinued operations, net |
5.0 | 0.3 | % | (0.3 | ) | (0.0 | )% | 0.4 | 0.0 | % | ||||||||||||||
|
|
|
|
|
|
|
|
|
|
|
|
|
|||||||||||||
| Net income (loss) |
$ | 9.7 | 0.5 | % | $ | (1.4 | ) | (0.1 | )% | $ | (52.9 | ) | (2.7 | )% | ||||||||||
|
|
|
|
|
|
|
|
|
|
|
|
|
|||||||||||||
The following tables set forth certain supplemental measures of our operating performance. Net Service Revenue and Adjusted EBITDA are non-GAAP financial measures and a reconciliation of each item to their nearest GAAP equivalent appears in “Summary—Summary Historical Financial and Other Data.”
| Year Ended December 31, | ||||||||||||
| 2013 | 2012 | 2011 | ||||||||||
| (in millions) | ||||||||||||
| Net Service Revenue |
$ | 462.7 | $ | 447.0 | $ | 428.9 | ||||||
| Adjusted EBITDA |
76.8 | 66.7 | 54.4 | |||||||||
| Adjusted EBITDA as a % of Net Service Revenue |
16.6 | % | 14.9 | % | 12.7 | % | ||||||
59
Table of Contents
For the Years Ended December 31, 2013 and December 31, 2012
Revenue. Revenue was $1,994.2 million in 2013, a $43.4 million, or 2.2%, increase from $1,950.8 million in 2012. Excluding the unfavorable effect of changes in exchange rates of $12.7 million, revenue increased by $56.1 million, or 2.9%.
Service revenue was $1,470.4 million in 2013, a $14.0 million, or 1.0%, increase from $1,456.7 million in 2012. Excluding the unfavorable impact of changes in exchange rates of $12.5 million, service revenue increased $26.5 million, or 1.8%, with increases in our Mobility Solutions segment of $10.1 million, Mobility Networks segment of $10.0 million, and Europe, Asia and Emerging Markets segment of $9.9 million, which were partially offset by a decrease in Australia of $3.5 million due to reduced volume from large customers in the mining sector. Home revenue increased by $29.4 million as a result of a 3.0% increase in the number of premium product homes sold and a 2.9% increase in the average home sale price.
Gross profit. Gross profit was $230.0 million in 2013, an $8.5 million, or 3.8%, increase compared to $221.5 million in 2012. Excluding the unfavorable effect of changes in exchange rates of $3.0 million, gross profit increased by $11.5 million, or 5.2%. The increase in gross profit was driven by higher gross profit in all of our operating segments except Australia. Gross margin was 11.5% in 2013, a 0.1 percentage point increase compared to 11.4% for 2012.
Operating expenses. Operating expenses were $190.4 million in 2013, a $5.2 million, or 2.6%, decrease compared to $195.6 million in 2012. Excluding the favorable effect of changes in exchange rates of $2.6 million, operating expenses decreased by $2.6 million, or 1.3%. This decrease was primarily driven by a $2.0 million decrease in professional fees, a $1.9 million decrease in intangibles amortization expense and a $1.5 million decrease in advertising costs. These decreases were partially offset by a $0.9 million increase in rent expense, a benefit of $0.7 million resulting from adjustments to certain accrued liabilities in 2012, a $0.7 million increase in stock compensation expense and a $0.5 million increase in various other expenses.
We recorded $2.3 million of restructuring expenses related to cost savings initiatives which were predominantly related to reductions in headcount in both 2013 and 2012.
Operating income from continuing operations. Operating income from continuing operations was $39.6 million in 2013, a $13.7 million, or 52.9%, increase from $25.9 million in 2012. The improvement reflected higher gross profit and lower operating expenses.
Interest expense, net. Interest expense was $26.2 million in 2013, a $1.1 million, or 4.4%, increase compared to $25.1 million in 2012. The increase reflected our higher average debt resulting from our 2013 debt refinancing which was partially offset by lower interest rates as a result of our 2013 debt refinancing.
Debt extinguishment (gain) loss, net. Debt extinguishment loss, net was $8.0 million in 2013 compared to a gain of $0.3 million in 2012. The debt extinguishment loss of $8.0 million in 2013 was primarily attributable to our 2013 debt refinancing.
Income tax expense. Income tax expense was $0.2 million in 2013, based on a pre-tax income from continuing operations of $4.9 million, resulting in an effective tax rate of 3.6%. Income tax expense was $2.2 million in 2012 based on a pre-tax income from continuing operations of $1.1 million resulting in an effective tax rate of 201.8%. Our effective tax rate differs from the U.S. statutory tax rate primarily due to a full valuation allowance against the U.S. and certain foreign subsidiaries’ net deferred tax assets, recognizing tax benefits of $2.5 million and $1.7 million in 2013 and 2012 from adjustments to uncertain tax positions, and the relative amount of income or loss earned in the various jurisdictions.
Income (loss) from continuing operations. Income from continuing operations was $4.7 million in 2013, a $5.8 million increase from a loss from continuing operations of $1.1 million in 2012.
60
Table of Contents
Net Service Revenue. Net Service Revenue was $462.7 million in 2013, a $15.7 million, or 3.5%, increase from $447.0 million in 2012. Excluding the unfavorable impact of changes in exchange rates of $6.8 million, Net Service Revenue increased $22.5 million, or 5.1%. The increase in Net Service Revenue was primarily due to the improvement in service revenue of $26.5 million, excluding the impact of exchange rates, and a decrease in PTE as a percentage of service revenue from 69.1% in 2012 to 68.1% in 2013 resulting in a $5.1 million positive impact, which was partially offset by an increase in purchase transportation expense of $8.9 million due to increased volume.
Adjusted EBITDA. Adjusted EBITDA was $76.8 million in 2013, a $10.1 million, or 15.0%, increase from $66.7 million in 2012. Excluding the negative impact of changes in exchange rates of $0.7 million, Adjusted EBITDA increased $10.8 million, or 16.2%. The increase in Adjusted EBITDA was primarily due to a $14.1 million increase in operating income, excluding the impact of exchange rates, partially offset by an increase in depreciation and amortization expense of $2.3 million. Adjusted EBITDA as a percentage of Net Service Revenue was 16.6% in 2013, a 1.7 percentage point increase from 14.9% in 2012.
For the Years Ended December 31, 2012 and December 31, 2011
Revenue. Revenue was $1,950.8 million in 2012, an $18.4 million, or 1.0%, increase from $1,932.4 million in 2011. Excluding the unfavorable effect of changes in exchange rates of $1.5 million, revenue increased by $19.9 million, or 1.0%.
Service revenue was $1,456.4 million in 2012, a $69.7 million, or 5.0%, increase from $1,386.7 million in 2011. Excluding the unfavorable impact of changes in exchange rates of $1.5 million, service revenue increased $71.2 million, or 5.1%, with increases in our Mobility Networks segment of $66.0 million, Europe, Asia and Emerging Markets segment of $4.9 million and Australia segment of $5.3 million, which were partially offset by a decrease in our Mobility Solutions segment of $5.0 million. Home sale revenue decreased by $51.3 million as a result of a 13.9% decrease in the number of mobility solutions initiations involving our premium home sale product.
Gross profit. Gross profit was $221.5 million in 2012, a $13.1 million, or 6.4%, increase from $208.4 million in 2011. The increase was primarily due to higher gross profit in all operating segments and lower premium home sale expense in our Mobility Solutions segment. Gross margin was 11.4% in 2012, a 0.6 percentage point increase from 10.8% in 2011.
Operating expenses. Operating expenses were $195.6 million in 2012, a $10.8 million, or 5.1%, decrease from $206.4 million in 2011. The decrease reflected a $9.0 million decrease in professional fees primarily related to the termination of legacy information technology contracts in the fourth quarter of 2011, a $1.4 million decrease in restructuring and impairment charges, a $1.4 million decrease in rent expense, a $1.0 million decrease in intangibles amortization and benefits from a $0.7 million adjustment in accrued liabilities in 2012. These decreases were partially offset by a $1.5 million increase in depreciation expense related to our prior investments in information technology.
Operating income from continuing operations. Operating income from continuing operations was $25.9 million in 2012, a $23.9 million increase from $2.0 million in 2011. The increase reflected higher gross profit and lower operating expenses discussed above.
Interest expense, net. Interest expense was $25.1 million in 2012, a $7.1 million, or 22.2%, decrease from $32.2 million in 2011. The decrease was driven by a $183.5 million decrease in our second lien debt in March 2011 that was exchanged for our Series A Preferred Stock.
Debt extinguishment (gain) loss, net. Debt extinguishment gain was $0.3 million in 2012 compared to a loss of $16.8 million in 2011. Loss on debt extinguishment of $16.8 million in 2011 related primarily to our 2011 debt refinancing.
61
Table of Contents
Income tax expense, net. Income tax expense was $2.2 million in 2012 based on a pre-tax income from continuing operations of $1.1 million resulting in an effective tax rate of 201.8%. Income tax expense was $5.0 million in 2011, based on a pre-tax loss from continuing operations of $48.3 million, resulting in an effective tax rate of (10.5)%. Our effective tax rate differs from the applicable statutory tax rate primarily due to a full valuation allowance against the U.S. and certain foreign subsidiaries’ net deferred tax assets, and a net tax (benefit) expense of $(1.7) million and $1.0 million in 2012 and 2011, respectively, related to adjustments to uncertain tax positions, and the relative amount of income or loss earned in the various jurisdictions.
Loss from continuing operations. Loss from continuing operations was $1.1 million and $53.3 million in 2012 and 2011, respectively.
Net Service Revenue. Net Service Revenue was $447.0 million in 2012, an $18.1 million, or 4.2%, increase from $428.9 million in 2011. The increase in Net Service Revenue was primarily due to the improvement in service revenue of $71.3 million, excluding the impact of exchange rate changes, offset in part by an increase in purchase transportation expense of $49.0 million due to volume gains and an increase in PTE as a percentage of service revenue increasing from 68.8% in 2011 to 69.1% in 2012, resulting in a $5.3 million negative impact.
Adjusted EBITDA. Adjusted EBITDA was $66.7 million in 2012, a $12.3 million, or 22.6%, increase from $54.4 million in 2011. The increase in Adjusted EBITDA was primarily due to a $23.8 million improvement in operating income, excluding the impact of exchange rate changes, partially offset by a decrease of $11.9 million in the net adjustments impacting operating income made in 2012 compared to 2011 in arriving at Adjusted EBITDA. Adjusted EBITDA as a percentage of Net Service Revenue was 14.9% in 2012, a 2.2 percentage point increase from 12.7% in 2011.
62
Table of Contents
Segment Reporting
We have four operating segments, (i) Mobility Solutions, (ii) Mobility Networks, (iii) Europe, Asia and Emerging Markets and (iv) Australia. We evaluate segment performance based upon segment revenue, segment income from operations, segment Net Service Revenue and segment Adjusted EBITDA. The following table sets forth these metrics for each of our segments for the periods presented.
| Year Ended December 31, | ||||||||||||
| 2013 | 2012 | 2011 | ||||||||||
| (in millions) | ||||||||||||
| Revenue: |
||||||||||||
| Mobility Solutions |
$ | 672.6 | $ | 633.1 | $ | 689.4 | ||||||
| Mobility Networks |
1,088.9 | 1,080.9 | 1,017.0 | |||||||||
| Europe, Asia and Emerging Markets |
72.2 | 63.1 | 58.9 | |||||||||
| Australia |
160.5 | 173.7 | 167.1 | |||||||||
|
|
|
|
|
|
|
|||||||
| Total |
$ | 1,944.2 | $ | 1,950.8 | $ | 1,932.4 | ||||||
|
|
|
|
|
|
|
|||||||
| Net Service Revenue(a): |
||||||||||||
| Mobility Solutions |
$ | 145.7 | $ | 135.8 | $ | 139.7 | ||||||
| Mobility Networks |
160.1 | 155.5 | 144.5 | |||||||||
| Europe, Asia and Emerging Markets |
59.7 | 51.5 | 47.3 | |||||||||
| Australia |
97.2 | 104.2 | 97.4 | |||||||||
|
|
|
|
|
|
|
|||||||
| Total |
$ | 462.7 | $ | 447.0 | $ | 428.9 | ||||||
|
|
|
|
|
|
|
|||||||
| Income from Operations: |
||||||||||||
| Mobility Solutions |
$ | 25.5 | $ | 17.9 | $ | 13.1 | ||||||
| Mobility Networks |
24.2 | 17.1 | 11.7 | |||||||||
| Europe, Asia and Emerging Markets |
4.6 | 1.3 | 4.8 | |||||||||
| Australia |
2.7 | 1.5 | 1.3 | |||||||||
| Corporate |
(17.4 | ) | (11.9 | ) | (28.9 | ) | ||||||
|
|
|
|
|
|
|
|||||||
| Total |
$ | 39.6 | $ | 25.9 | $ | 2.0 | ||||||
|
|
|
|
|
|
|
|||||||
| Adjusted EBITDA: |
||||||||||||
| Mobility Solutions |
$ | 32.5 | $ | 27.4 | $ | 22.8 | ||||||
| Mobility Networks |
42.1 | 38.3 | 30.4 | |||||||||
| Europe, Asia and Emerging Markets |
7.6 | 4.5 | 7.0 | |||||||||
| Australia |
7.8 | 7.2 | 9.0 | |||||||||
| Corporate |
(13.2 | ) | (10.7 | ) | (14.8 | ) | ||||||
|
|
|
|
|
|
|
|||||||
| Total |
$ | 76.8 | $ | 66.7 | $ | 54.4 | ||||||
|
|
|
|
|
|
|
|||||||
63
Table of Contents
| (a) | The following table reconciles Net Service Revenue to total revenue for each of our operating segments: |
| Year Ended December 31, | ||||||||||||
| 2013 | 2012 | 2011 | ||||||||||
| (in millions) | ||||||||||||
| Mobility Solutions |
||||||||||||
| Total revenue |
$ | 672.6 | $ | 633.1 | $ | 689.4 | ||||||
| Home cost |
526.9 | 497.3 | 549.7 | |||||||||
|
|
|
|
|
|
|
|||||||
| Net Service Revenue |
$ | 145.7 | $ | 135.8 | $ | 139.7 | ||||||
|
|
|
|
|
|
|
|||||||
| Mobility Networks |
||||||||||||
| Total revenue |
$ | 1,088.9 | $ | 1,080.9 | $ | 1,017.0 | ||||||
| Purchased transportation expense |
928.8 | 925.4 | 872.5 | |||||||||
|
|
|
|
|
|
|
|||||||
| Net Service Revenue |
$ | 160.1 | $ | 155.5 | $ | 144.5 | ||||||
|
|
|
|
|
|
|
|||||||
| Europe, Asia and Emerging Markets |
||||||||||||
| Total revenue |
$ | 72.2 | $ | 63.1 | $ | 58.9 | ||||||
| Purchased transportation expense |
12.5 | 11.6 | 11.6 | |||||||||
|
|
|
|
|
|
|
|||||||
| Net Service Revenue |
$ | 59.7 | $ | 51.5 | $ | 47.3 | ||||||
|
|
|
|
|
|
|
|||||||
| Australia |
||||||||||||
| Total revenue |
$ | 160.5 | $ | 173.7 | $ | 167.1 | ||||||
| Purchased transportation expense |
63.3 | 69.5 | 69.7 | |||||||||
|
|
|
|
|
|
|
|||||||
| Net Service Revenue |
$ | 97.2 | $ | 104.2 | $ | 97.4 | ||||||
|
|
|
|
|
|
|
|||||||
Mobility Solutions
In our Mobility Solutions segment, we provide a broad range of relocation services to assist our customers that have contracts signed in the United States and Canada at each stage of an international or domestic mobility event, including policy consultation, temporary living services, move management services, global assignment management, global compensation services, immigration and visa services, orientation, settling and destination services and property management-related services including home selling and home finding or rental assistance, closing and title insurance services and mortgage origination and assistance. Additionally, we assist the human resource departments of our corporate customers in administering their mobility programs with compliance reporting, expense tracking, cost analysis and projection, vendor management, satisfaction surveys and management reporting services. We also provide consulting services to the human resources departments that include mobility policy and program development, benchmarking and educational seminars. Our consulting, mobility policy services and program development, vendor management, satisfaction surveys, and education seminars are performed by our employees. Many of the destination services including visa and immigration, rental assistance, settling-in services, and cross-cultural training are performed by our network of third-party providers.
Mobility Networks
In our Mobility Networks segment, we provide international, interstate and some intrastate household goods moving services to our customers in the United States and Canada through our agent network (Allied and northAmerican), and through our agent/franchise network and third-party providers internationally. We act as a network manager for our agent/franchise network, providing, among other things, brand management, contract negotiations, expense distribution, network optimization, dispatching for the network, billing, collection and claims handling. We operate an asset-light model, which has many of the characteristics of a franchise model, in which we sign exclusive long-term contracts with local agents that operate under our brands, perform the capital and labor-intensive moving services, and own the trucks and other assets required to perform physical moving.
64
Table of Contents
Europe, Asia and Emerging Markets
In our Europe, Asia and Emerging Markets business segment, we provide our full range of mobility services in Europe, Asia, the Middle East and Brazil. In these markets, we provide a similar range of services that we offer through our Mobility Solutions and Mobility Networks segments through a combination of company-owned and agent/franchise networks.
Australia
In our Australia business segment, we provide a similar range of services that we offer through our Mobility Solutions and Mobility Networks segments through a combination of company-operated and franchise networks. We provide household goods moves on behalf of corporate customers through company-owned branches or those owned by our franchises rather than through an agent/franchise network as there are only a limited number of moving companies in this region.
Corporate
Costs associated with corporate governance activities that are not allocated to the four operating segments are reflected in Corporate. The Corporate function also provides a number of shared operational, IT and administrative services to each segment so that they do not have to replicate these services and incur duplicative costs. These shared costs are allocated to the operating segments based primarily on specific identification, projected revenue, headcount and estimated use of time. Interest expense and other non-operating items are not allocated or reviewed on a segment basis.
In order to service global customers, relocation and moving services are often provided by one segment on behalf of a customer invoiced by another segment. In those instances, the segment providing the service invoices their charges to the segment invoicing the customer in order to provide meaningful financial performance analysis at a segment level. Revenue and expense associated with these intercompany transactions are eliminated for both segment and consolidated reporting.
Segment Results of Operations
Mobility Solutions
| Year ended December 31, | ||||||||||||
| 2013 | 2012 | 2011 | ||||||||||
| (in millions) | ||||||||||||
| Service revenue |
$ | 148.8 | $ | 138.7 | $ | 143.7 | ||||||
| Home revenue |
523.8 | 494.4 | 545.7 | |||||||||
|
|
|
|
|
|
|
|||||||
| Total revenue |
672.6 | 633.1 | 689.4 | |||||||||
| Direct expenses: |
||||||||||||
| Home cost |
526.9 | 497.3 | 549.7 | |||||||||
| Other direct expense |
86.6 | 81.3 | 87.7 | |||||||||
|
|
|
|
|
|
|
|||||||
| Gross profit |
59.1 | 54.5 | 52.0 | |||||||||
| Income from continuing operations |
25.5 | 17.9 | 13.1 | |||||||||
| Net Service Revenue |
145.7 | 135.8 | 139.7 | |||||||||
| Adjusted EBITDA |
32.5 | 27.4 | 22.8 | |||||||||
| Adjusted EBITDA as a percentage of Net Service Revenue |
22.3 | % | 20.2 | % | 16.3 | % | ||||||
65
Table of Contents
For the Years Ended December 31, 2013 and December 31, 2012
Total revenue was $672.6 million in 2013, a $39.5 million, or 6.3%, increase from $633.1 million in 2012. Home revenue was $523.8 million in 2013, a $29.4 million, or 6.0%, increase from $494.4 million for 2012. The increase in home revenue was driven by a 3.0% increase in the number of homes sold and a 2.9% increase in average home sale price. Service revenue was $148.8 million in 2013, a $10.1 million, or 7.3%, increase from $138.7 million in 2012. The increase in service revenue was related to higher referral fees, mortgage origination volume, premium home sale closing volume, and average home sales price, partially offset by decreases in standard home sale closing volume and corporate housing and property management revenue.
Gross profit was $59.1 million in 2013, a $4.6 million, or 8.5%, increase from $54.5 million in 2012. Gross margin was 8.8% in 2013, a 0.2 percentage point increase from 8.6% in 2012. The improvement in gross profit was driven by an increase in referral fees, mortgage origination volume, premium home sale closing volume and average home sales price.
Operating expenses were $33.6 million in 2013, a $3.0 million, or 8.0%, decrease from $36.6 million in 2012. The decline was primarily driven by lower salaries and professional fees.
Operating income was $25.5 million in 2013, a $7.6 million, or 42.0%, increase from $17.9 million in 2012. The increase primarily reflected higher gross profit and lower operating expenses as discussed further above.
Net Service Revenue was $145.7 million in 2013, a $9.9 million, or 7.3%, increase from $135.8 million in 2012. The increase in Net Service Revenue was primarily due to the improvement in service revenue of $10.1 million.
Adjusted EBITDA was $32.5 million in 2013, a $5.1 million, or 18.4%, increase from $27.4 million in 2012. The increase in Adjusted EBITDA was primarily due to the improvement in operating income of $7.6 million, partially offset by a reduction in adjustments of $2.4 million primarily related to mortgage reinsurance losses which declined $3.0 million. Adjusted EBITDA as a percentage of Net Service Revenue was 22.3% in 2013, a 2.1 percentage point increase from 20.2% in 2012.
For the Years Ended December 31, 2012 and December 31, 2011
Total revenue was $633.1 million in 2012, a $56.3 million, or 8.2%, decrease from $689.4 million in 2011. Home revenue was $494.4 million in 2012, a $51.3 million, or 9.4%, decrease from $545.7 million in 2011. The decrease in home revenue reflected a 13.9% decrease in the number of homes sold which was partially offset by an increase in average home sale price. Service revenue was $138.7 million in 2012, a $5.0 million, or 3.5%, decrease from $143.7 million in 2011. The decrease in service revenue was related to a decrease in closing volumes which was partially offset by an increase in mortgage revenue.
Gross profit was $54.5 million in 2012, a $2.5 million, or 4.9%, increase from $52.0 million in 2011. Gross margin was 8.6% in 2012 as compared to 7.5% in 2011. The increase in gross profit was driven by an increase in average mortgage margin per sold loan of 0.4 percentage points and referral fees as a percentage of revenue.
Operating expenses were $36.6 million in 2012, a $2.3 million, or 5.9%, decrease from $38.9 million in 2011. The decrease was primarily the result of lower salaries, legal costs, and professional fees. These decreases were partially offset by a restructuring charge of $0.6 million in 2012 for costs to exit a facility and a cost savings initiative.
Operating income was $17.9 million in 2012, a $4.8 million, or 36.9%, increase from $13.1 million in 2011. The increase in operating income was primarily driven by higher mortgage revenue, lower operating expenses, and lower premium home sale expense.
66
Table of Contents
Net Service Revenue was $135.8 million in 2012, a $3.9 million, or 2.8%, decrease from $139.7 million in 2011. The decrease in Net Service Revenue was primarily due to the decline in service revenue of $5.0 million, which was partially offset by a decrease in premium home sale expense of $1.1 million.
Adjusted EBITDA was $27.4 million in 2012, a $4.6 million, or 20.6%, increase from $22.8 million in 2011. The increase in Adjusted EBITDA was primarily due to the improvement in operating income of $4.8 million. Adjusted EBITDA as a percentage of Net Service Revenue was 20.2% in 2012, a 3.9 percentage point increase from 16.3% in 2011.
Mobility Networks
| Year ended December 31, | ||||||||||||
| 2013 | 2012 | 2011 | ||||||||||
| (in millions) | ||||||||||||
| Service revenue |
$ | 1,088.9 | $ | 1,080.9 | $ | 1,017.0 | ||||||
| Direct expenses: |
||||||||||||
| Purchased transportation expense |
928.8 | 925.4 | 872.5 | |||||||||
| Other direct expense |
57.5 | 56.3 | 54.5 | |||||||||
|
|
|
|
|
|
|
|||||||
| Gross profit |
102.6 | 99.2 | 90.0 | |||||||||
| Income from continuing operations |
24.2 | 17.1 | 11.7 | |||||||||
| Net Service Revenue |
160.1 | 155.5 | 144.5 | |||||||||
| Adjusted EBITDA |
42.1 | 38.3 | 30.4 | |||||||||
| Adjusted EBITDA as a percentage of Net Service Revenue |
26.3 | % | 24.6 | % | 21.0 | % | ||||||
For the Years Ended December 31, 2013 and December 31, 2012
Revenue was $1,088.9 million in 2013, an $8.0 million, or 0.7%, increase from $1,080.9 million in 2012. Excluding the unfavorable effect of changes in exchange rates of $2.0 million, revenue increased by $10.0 million, or 0.9%. The increase was driven primarily by a 1.4% increase in revenue per initiation due to general rate increases, larger origin and destination service charges and more valuation revenue. The increase in revenue per initiation was partially offset by a 0.5% decline in initiation volumes with a 28.3% reduction in domestic military volumes offsetting a 2.6% increase in all other initiations.
Gross profit was $102.6 million in 2013, a $3.4 million, or 3.4%, increase from $99.2 million in 2012. Gross margin was 9.4% in 2013, a 0.2 percentage point increase from 9.2% in 2012. The improvement in gross margin was primarily due to general rate increases, lower third-party transportation expenses and a higher percentage of initiations with valuation revenue.
Operating expenses were $78.4 million in 2013, a $3.7 million, or 4.6%, decrease from $82.1 million in 2012. The decrease was primarily driven by lower intangible and agent contract amortization, professional fees and depreciation expense.
Operating income from continuing operations was $24.2 million in 2013, a $7.1 million, or 41.8%, increase from $17.1 million in 2012. The increase reflected the higher gross profit from improved margin per initiation and lower operating expenses.
Net Service Revenue was $160.1 million in 2013, a $4.6 million, or 2.9%, increase from $155.5 million in 2012. The increase in Net Service Revenue was primarily due to the improvement in service revenue of $10.0 million, excluding the impact of exchange rates, and PTE as a percentage of service revenue decreasing from 85.6% in 2012 to 85.3% in 2013 resulting in a $3.3 million positive impact, partially offset by an increase in purchase transportation expense of $8.5 million due to volume gains.
67
Table of Contents
Adjusted EBITDA was $42.1 million in 2013, a $3.8 million, or 10.1%, increase from $38.3 million in 2012. The increase in Adjusted EBITDA was primarily due to the improvement in operating income of $7.1 million, partially offset by a reduction in adjustments of $1.1 million primarily related to restructuring and severance expense, and a reduction in depreciation and amortization expense of $2.2 million. Adjusted EBITDA as a percentage of Net Service Revenue was 26.3% in 2013, a 1.7 percentage point increase from 24.6% in 2012.
For the Years Ended December 31, 2012 and December 31, 2011
Revenue was $1,080.9 million in 2012, a $63.9 million, or 6.3%, increase from $1,017.0 million in 2011. Excluding the unfavorable effect of changes in exchange rates of $2.1 million, revenue increased by $66.0 million, or 6.5%. The increase in revenue was driven by a 19.9% increase in domestic military initiation volumes and a 7.0% increase in international initiation volumes, which was offset in part by a 1.1% decline in initiation volumes in our other channels. Revenue per initiation increased 3.9% primarily due to general rate increases, improved yield management, larger origin and destination service charges, more valuation revenue, and higher fuel surcharges.
Gross profit was $99.2 million in 2012, a $9.2 million, or 10.3%, increase from $90.0 million in 2011. Gross margin was 9.2% in 2012, a 0.4 percentage point increase from 8.8% in 2011. The increase in gross margin was primarily due to general rate increases, improved yield management and more valuation revenue.
Total operating expenses were $82.1 million in 2012, a $3.8 million, or 4.9%, increase from $78.3 million in 2011. The increase resulted from a $2.4 million increase in depreciation expense associated with our investment in upgraded information technology infrastructure and applications and a $1.7 million restructuring charge related to a cost savings initiative. These increases were partially offset by a $0.7 million decrease in intangibles amortization expense.
Operating income from continuing operations was $17.1 million in 2012, a $5.4 million, or 46.7%, increase from $11.7 million in 2011. The increase reflected higher gross profits from increased average revenue per initiation and initiation volume partially offset by higher operating expenses.
Net Service Revenue was $155.5 million in 2012, an $11.0 million, or 7.7%, increase from $144.5 million in 2011. The increase in Net Service Revenue was primarily due to the improvement in service revenue of $66.0 million, excluding the impact of exchange rate changes, and a decrease in PTE as a percentage of service revenue from 85.8% in 2011 to 85.6% in 2012 resulting in a $2.0 million positive impact, which was partially offset by an increase in purchase transportation expense of $56.7 million due to volume gains.
Adjusted EBITDA was $38.3 million in 2012, a $7.9 million, or 25.9%, increase from $30.4 million in 2011. The increase in Adjusted EBITDA was primarily due to the improvement in operating income of $5.5 million, excluding exchange rate changes, an increase in depreciation and amortization of $1.7 million and a $0.9 million increase in adjustments primarily related to restructuring expense. Adjusted EBITDA as a percentage of Net Service Revenue was 24.6% in 2012, a 3.6 percentage point increase from 21.0% in 2011.
68
Table of Contents
Europe, Asia and Emerging Markets
| Year ended December 31, | ||||||||||||
| 2013 | 2012 | 2011 | ||||||||||
| (in millions) | ||||||||||||
| Service revenue |
$ | 72.2 | $ | 63.1 | $ | 58.9 | ||||||
| Direct expenses: |
||||||||||||
| Purchased transportation expense |
12.5 | 11.6 | 11.6 | |||||||||
| Other direct expense |
31.5 | 27.2 | 23.1 | |||||||||
|
|
|
|
|
|
|
|||||||
| Gross profit |
28.2 | 24.3 | 24.2 | |||||||||
| Income from continuing operations |
4.6 | 1.3 | 4.8 | |||||||||
| Net Service Revenue |
59.7 | 51.5 | 47.3 | |||||||||
| Adjusted EBITDA |
7.6 | 4.5 | 7.0 | |||||||||
| Adjusted EBITDA as a percentage of Net Service Revenue |
12.7 | % | 8.7 | % | 14.8 | % | ||||||
For the Years Ended December 31, 2013 and December 31, 2012
Revenue was $72.2 million in 2013, a $9.1 million, or 14.4%, increase from $63.1 million in 2012. Excluding the unfavorable effect of changes in exchange rates of $0.8 million, revenue increased by $9.9 million, or 15.6%. The increase was driven by a higher volume of international initiations and added volume from new global customers.
Gross profit was $28.2 million in 2013, a $3.9 million, or 16.1%, increase from $24.3 million in 2012. Gross profit increased by $4.2 million, or 17.4%. The increase was driven by higher initiation volume in Singapore, China and UAE and higher volume and pricing across all markets in the relocation business due to new customer volumes. Gross margin was 39.1% in 2013, a 0.6 percentage increase from 38.5% in 2012.
Operating expenses were $23.6 million in 2013, a $0.6 million, or 2.8%, increase from $23.0 million in 2012. The increase was the result of higher operating costs as it relates to setting up new customers and servicing the new customer engagements. The increase was lessened by the positive impact of cost savings initiatives which reduced staffing-related costs by $0.8 million.
Operating income from continuing operations was $4.6 million in 2013, a $3.3 million increase from $1.3 million in 2012. Operating income increased as higher gross profits were partially offset by higher operating expenses due to volume reduced partially by productivity initiatives put into place at the beginning of 2012.
Net Service Revenue was $59.7 million in 2013, an $8.2 million, or 15.8%, increase from $51.5 million in 2012. Changes in exchange rates had a $0.7 million negative impact. The increase in Net Service Revenue was primarily due to the improvement in service revenue of $9.9 million, excluding the impact of exchange rate changes, and a decrease in PTE as a percentage of service revenue from 18.4% in 2012 to 17.3% in 2013 resulting in a $0.8 million positive impact, which was partially offset by an increase in purchase transportation expense of $1.8 million due to volume gains.
Adjusted EBITDA was $7.6 million in 2013, a $3.1 million, or 67.9%, increase from $4.5 million in 2012. The increase in Adjusted EBITDA was primarily due to the improvement in operating income of $3.3 million, partially offset by a reduction in adjustments of $0.3 million. Adjusted EBITDA as a percentage of Net Service Revenue was 12.7% in 2013, a 4.0 percentage point increase from 8.7% in 2012.
For the Years Ended December 31, 2012 and December 31, 2011
Revenue was $63.1 million in 2012, a $4.2 million, or 7.2%, increase from $58.9 million in 2011. Excluding the unfavorable effect of changes in exchange rates of $0.7 million, revenue increased by $4.9 million, or 8.4%. The increase was driven by a higher volume of international initiations and added volume from new global customers in the relocation business.
69
Table of Contents
Gross profit was $24.3 million in 2012, a $0.1 million, or 0.4%, increase compared to $24.2 million in 2011. Changes in exchange rates had a $0.3 million negative impact. The increase was driven by higher initiation volumes partially offset by a decline in average gross margin. Gross margin was 38.5% in 2012, a 2.6 percentage point decrease from 41.1% in 2011. The decline in gross margin was the result of a shift towards lower margin services and competitive price pressure in local markets.
Operating expenses were $23.0 million in 2012, a $3.6 million, or 18.7%, increase from $19.4 million in 2011. The increase was primarily the result of higher salary and benefit expense due to increased headcount and the acquisition of our India joint venture in the second quarter of 2011, as well as a $0.8 million restructuring charge related to a cost savings initiative.
Operating income from continuing operations was $1.3 million in 2012, a $3.5 million decrease from $4.8 million in 2011. Operating income declined primarily due to an increase in operating expenses due to our investment in expanded service capabilities. We opened seven new locations and incurred start-up costs of $0.7 million.
Net Service Revenue was $51.5 million in 2012, a $4.2 million, or 8.8%, increase from $47.3 million in 2011. Changes in exchange rates had a $0.5 million negative impact. The increase in Net Service Revenue was primarily due to the improvement in service revenue of $4.9 million, excluding the impact of exchange rate changes, and a decrease in PTE as a percentage of service revenue from 19.6% in 2011 to 18.4% in 2012 resulting in a $0.7 million positive impact, which was partially offset by an increase in purchase transportation expense of $0.9 million due to volume gains.
Adjusted EBITDA was $4.5 million in 2012, a $2.5 million, or 35.6%, decrease from $7.0 million in 2011. The decrease in Adjusted EBITDA was primarily due to the decline in operating income of $3.5 million, partially offset by and an increase in adjustments of $0.8 million primarily related to restructuring expense. Adjusted EBITDA as a percentage of Net Service Revenue was 8.7% in 2012, a 6.1 percentage point decrease from 14.8% in 2011.
Australia
| Year ended December 31, | ||||||||||||
| 2013 | 2012 | 2011 | ||||||||||
| (in millions) | ||||||||||||
| Service revenue |
$ | 160.5 | $ | 173.7 | $ | 167.1 | ||||||
| Direct expenses: |
||||||||||||
| Purchased transportation expense |
63.3 | 69.5 | 69.7 | |||||||||
| Other direct expense |
57.1 | 60.7 | 55.2 | |||||||||
|
|
|
|
|
|
|
|||||||
| Gross profit |
40.1 | 43.5 | 42.2 | |||||||||
| Income from continuing operations |
2.7 | 1.5 | 1.3 | |||||||||
| Net Service Revenue |
97.2 | 104.2 | 97.4 | |||||||||
| Adjusted EBITDA |
7.8 | 7.2 | 9.0 | |||||||||
| Adjusted EBITDA as a percentage of Net Service Revenue |
8.0 | % | 6.9 | % | 9.3 | % | ||||||
For the Years Ended December 31, 2013 and December 31, 2012
Revenue was $160.5 million in 2013, a $13.2 million, or 7.6%, decrease from $173.7 million in 2012. Excluding the unfavorable effect of changes in exchange rates of $9.7 million, revenue decreased by $3.5 million, or 2.0%. The decrease was primarily driven by reduced volume from large customers in the mining sector.
70
Table of Contents
Gross profit was $40.1 million in 2013, a $3.4 million, or 7.7%, decrease from $43.5 million in 2012. Excluding the unfavorable effect of changes in exchange rates of $2.5 million, gross profit decreased by $0.9 million, or 2.0%. The decline was primarily driven by lower revenue. Gross margin was 25.0% in 2013 and 2012.
Operating expenses were $37.4 million in 2013, a $4.6 million, or 11.1%, decrease from $42.0 million in 2012. Excluding the favorable effect of changes in exchange rates of $2.2 million, operating expenses decreased $2.4 million, or 5.9%. The decline was primarily driven by lower salary, travel, marketing and professional fee expenses.
Operating income from continuing operations was $2.7 million in 2013, a $1.2 million, or 93.2%, increase from $1.5 million in 2012. Operating income increased as operating expense reductions more than offset the decline in gross profit.
Net Service Revenue was $97.2 million in 2013, a $7.0 million, or 6.7%, decrease from $104.2 million in 2012. Excluding the unfavorable effect of changes in exchange rates of $5.9 million, Net Service Revenue decreased by $1.1 million, or 1.0%. The decrease in Net Service Revenue was primarily due to the decline in service revenue of $3.5 million, excluding exchange impacts, partially offset by a reduction in PTE of $1.4 million due to volume declines and a decrease in PTE as a percentage of service revenue from 40.0% in 2012 to 39.4% in 2013 resulting in a $1.0 million positive impact.
Adjusted EBITDA was $7.8 million in 2013, a $0.6 million, or 8.4%, increase from $7.2 million in 2012. Excluding the unfavorable effect of changes in exchange rates of $0.6 million, Adjusted EBITDA increased by $1.2 million, or 16.9%. The increase in Adjusted EBITDA was primarily due to the improvement in operating income of $1.5 million, excluding the impact of exchange rate changes. Adjusted EBITDA as a percentage of Net Service Revenue was 8.0% in 2013, a 1.1 percentage point increase from 6.9% in 2012.
For the Years Ended December 31, 2012 and December 31, 2011
Revenue was $173.7 million in 2012, a $6.6 million, or 3.9%, increase from $167.1 million in 2011. Excluding the favorable effect of changes in exchange rates of $1.3 million, revenue increased by $5.3 million, or 3.2%. The increase was driven by continued growth from the mining sector which impacted the movement of employees into Australia and strong growth in our relocation business due to new contracts won and ongoing growth from our existing customer base.
Gross profit was $43.5 million in 2012, a $1.3 million, or 2.7%, increase from $42.2 million in 2011. Changes in exchange rates had a $0.4 million positive impact. The increase was driven by higher revenue partially offset by increased property costs associated with moves to new facilities. Gross margin was 25.0% in 2012, a 0.3 percentage point decrease from 25.3% in 2011.
Operating expenses were $42.0 million in 2012, a $1.1 million, or 2.7%, increase from $40.9 million in 2011. The increase reflected higher salaries and benefits from increasing growth in the relocation business and merit increases, as well as a $0.2 million restructuring charge related to cost saving initiatives.
Operating income from continuing operations was $1.5 million in 2012, a $0.2 million, or 3.2%, increase from $1.3 million in 2011. Operating income increased as higher gross profit was partially offset by an increase in operating expenses.
Net Service Revenue was $104.2 million in 2012, a $6.8 million, or 6.9%, increase from $97.4 million in 2011. Excluding the favorable effect of changes in exchange rates of $0.7 million, Net Service Revenue increased by $6.1 million, or 6.1%. The increase in Net Service Revenue was primarily due to the improvement in service revenue of $5.3 million, excluding the impact of exchange rate changes, and a decrease in PTE as a percentage of service revenue from 41.7% in 2011 to 40.0% in 2012 resulting in a $2.9 million positive impact, which was partially offset by an increase in PTE of $2.1 million due to volume gains.
71
Table of Contents
Adjusted EBITDA was $7.2 million in 2012, a $1.8 million, or 20.4%, decrease from $9.0 million in 2011. The decrease in Adjusted EBITDA was primarily due to a decrease in adjustments of $1.5 million primarily related to an Australian Tax Authority review expenses, and a reduction in depreciation and amortization of $0.4 million. Adjusted EBITDA as a percentage of Net Service Revenue was 6.9% in 2012, a 2.4 percentage point decrease from 9.3% in 2011.
Corporate
For the Years ended December 31, 2013 and December 31, 2012
Corporate expenses were $17.4 million in 2013, representing a $5.5 million increase from $11.9 million in 2012. The increase was primarily the result of a $1.5 million increase in restructuring expenses, a $0.7 million increase in stock compensation expense, a $0.7 million increase in depreciation expense and a $1.9 million net increase in various other expenses as well as $0.7 million of benefits in 2012 from adjustments to accrued liabilities.
For the Years ended December 31, 2012 and December 31, 2011
Corporate expenses were $11.9 million in 2012, representing a $17.0 million decrease from $28.9 million in 2011. The decrease was primarily driven by the termination of legacy information technology contracts in the fourth quarter of 2011, a decrease in restructuring charges, lower salaries and benefits, lower rent, adjustments to certain accrued liabilities, lower impairment charges, and a net decrease in various expenses of $2.5 million.
Results of Discontinued Operations
In 2013, our board of directors authorized a disposal plan involving a non-core logistics business, the Special Products Division, a component of our Mobility Networks segment. The sale of the Special Products Division was completed on April 30, 2013. The results of this business are reported as discontinued operations in our consolidated statements of operations data for all periods presented.
In 2005, we sold our subsidiaries Transguard Insurance Company of America, Inc., National Association of Independent Truckers, LLC, Vanguard Insurance Agency, Inc., and other related companies of our U.S. insurance business (collectively, our “U.S. Insurance Business”). Proceeds from the sale included $20.0 million of payments due in annual installments during the years 2009 through 2013. The third, fourth and fifth payments of $4.0 million were received in 2013, 2012 and 2011, respectively. As part of the sale, we guaranteed the U.S. Insurance Business closing balance sheet net loss reserves against adverse development up to a maximum of $20.0 million. We were also entitled to receive 55% of any favorable reserve development.
Gains related to favorable loss reserve development were deferred until they were realized. The final determination of the reserve development amounts was based upon an actuarial evaluation of the closing balance sheet net loss reserves which was agreed between the parties in the second quarter of 2013. We received cumulative payments for favorable reserve development through the final settlement date of $6.1 million, which was recognized in 2013 and recorded in discontinued operations. Payments for favorable loss development of $1.5 million, $1.8 million and $1.6 million were received in 2013, 2012 and 2011, respectively.
The following table sets forth certain financial data for our discontinued operations for the periods presented:
| Year ended December 31, | ||||||||||||
| 2013 | 2012 | 2011 | ||||||||||
| (in millions) | ||||||||||||
| Revenue |
$ | 7.5 | $ | 22.0 | $ | 24.6 | ||||||
| Gross profit |
— | 1.8 | 2.6 | |||||||||
| Income (loss) from discontinued operations, net |
5.0 | (0.3 | ) | 0.4 | ||||||||
72
Table of Contents
Income from discontinued operations of $5.0 million for 2013 includes a net gain of $5.8 million related to the final settlement of the U.S. Insurance Business reserve guaranty liability, a net gain of $0.6 million related to the sale of SPD and a net loss of $1.4 million from the operating activities of SPD. Loss from discontinued operations of $0.3 million for 2012 includes a loss of $0.7 million from the operating activities of SPD which was partially offset by a gain of $0.4 million related to the U.S. Insurance Business. Income from discontinued operations of $0.4 million for 2011 includes a net gain of $0.3 million related the U.S. Insurance Business and net income of $0.1 million from the operating activities of SPD.
Liquidity and Capital Resources
Our primary sources of liquidity are, and after the completion of this offering are expected to continue to be, our existing cash and cash equivalent balances, cash flows from operations, borrowings under our ABL Revolver and borrowings under our Warehousing Facilities.
Our principal needs for liquidity have been, and for the foreseeable future will continue to be, debt service, capital expenditures, working capital, acquisitions, mortgage origination, home equity payments and real estate purchases. Our strategy includes expansion into high growth segments and entry into new geographic markets. We anticipate that the execution of these components of our strategy will not require a significant amount of resources and will be funded primarily through cash provided by operations.
The main portion of our capital expenditures has been related to computer equipment purchases, software development and transportation and warehouse equipment purchases. Our capital expenditures for the years ended December 31, 2013, 2012 and 2011 were $12.4 million, $10.6 million, and $15.4 million, respectively. We believe that our cash flow from operations, available cash and cash equivalents and available borrowings under our ABL Revolver will be sufficient to meet our liquidity needs. We anticipate that to the extent that we require additional liquidity, it will be funded through the incurrence of other indebtedness, equity financings or a combination. We cannot assure you that we will be able to obtain this additional liquidity on reasonable terms, or at all. Additionally, our liquidity and our ability to meet our obligations and fund our capital requirements are also dependent on our future financial performance, which is subject to general economic, financial and other factors that are beyond our control. Accordingly, we cannot assure you that our business will generate sufficient cash flow from operations or that future borrowings will be available under our credit facilities or otherwise to meet our liquidity needs. Although we have no specific current plans to do so, if we decide to pursue one or more significant acquisitions, we may incur additional debt or sell additional equity to finance such acquisitions.
Cash Flows
The following table presents a summary of cash flows from operating, investing and financing activities for the years ended December 31, 2013, 2012 and 2011.
| Year ended December 31, | ||||||||||||
| 2013 | 2012 | 2011 | ||||||||||
| (in millions) | ||||||||||||
| Net cash (used for) provided by operating activities |
$ | 16.5 | $ | 20.6 | $ | (41.4 | ) | |||||
| Net cash used for investing activities |
(9.5 | ) | (6.1 | ) | (10.3 | ) | ||||||
| Net cash provided by (used for) financing activities |
(2.9 | ) | (14.3 | ) | 53.4 | |||||||
As part of our relocation product offering, we provide home equity payments to relocating customer employees, purchase the customer employees’ homes under buyout programs in certain circumstances, and provide mortgage loans for home purchases. These equity advances, purchased homes, and mortgages are classified as current assets on our balance sheet, and movements in these assets are reflected in our cash flow from operations. The cash needed to finance these assets is largely provided by our securitization facility, as well as our mortgage warehouse facilities and ABL Revolver, movements in which are reflected in our cash flow from financing activities.
73
Table of Contents
Cash flows from operating activities
Net cash provided by operating activities was $16.5 million in 2013, a $4.1 million decrease compared to $20.6 million in 2012. The decrease in cash provided was primarily due to an increase in working capital of $13.7 million, mostly related to other current liabilities, partially offset by an increase of $12.9 million in net income adjusted for non-cash items.
Net cash provided by operating activities was $20.6 million in 2012, a $62.0 million increase compared to a net cash use of $41.4 million in 2011. The increase in cash provided was primarily due to a reduction in net originations of mortgages held for resale of $36.6 million and an increase of $36.1 million in net income adjusted for non-cash items, partially offset by an increase in working capital of $13.5 million, mostly related to accounts receivable.
Cash flows from investing activities
Net cash used for investing activities was $9.5 million and $6.1 million for the years ended December 31, 2013 and 2012, respectively. Capital expenditures were $12.4 million and $10.6 million in 2013 and 2012, respectively. Proceeds of $5.5 million and $5.8 million were received in 2013 and 2012, respectively, for the sale of our U.S. Insurance Business. Net proceeds of $0.7 million were received in 2013 for the sale of the Special Products Division.
Net cash used for investing activities was $6.1 million and $10.3 million for the years ended December 31, 2012 and 2011, respectively. Capital expenditures were $10.6 million and $15.4 million in 2012 and 2011, respectively. Proceeds of $5.8 million and $5.6 million were received in 2012 and 2011, respectively, for the sale of our U.S. Insurance Business.
Cash flows from financing activities
Net cash used for financing activities was $2.9 million and $14.3 million for the years ended December 31, 2013 and 2012, respectively. Cash flows from financing activities consist primarily of bank borrowing draw-downs and repayments and changes in our mortgage warehouse facilities and our ABL Revolver. Net proceeds from borrowings were $116.3 million in 2013 compared to net repayments on borrowings of $12.1 million in 2012. In 2013, $109.0 million was used to redeem preferred stock. Repayments on capital lease obligations were $1.8 million and $2.2 million in 2013 and 2012, respectively. Debt issuance costs were $8.4 million in 2013.
Net cash used for financing activities was $14.3 million for the year ended December 31, 2012 compared to net cash provided by financing activities of $53.4 million for the year ended December 31, 2011. Cash flows from financing activities consist primarily of bank borrowing draw-downs and repayments and changes in our mortgage warehouse facilities and ABL Revolver. Net repayments on borrowings were $12.1 million in 2012 compared to net proceeds from borrowings of $62.5 million in 2011. Repayments on capital lease obligations were $2.2 million and $3.0 million in 2012 and 2011, respectively. Debt issuance costs were $6.1 million in 2011.
Refinancing
In March 2013, we completed a refinancing (the “Refinancing”) by entering into the Term Loan to replace our existing term loan and second lien term loan and the ABL Revolver to replace our existing revolving credit loan. $109.0 million of the proceeds from the Term Loan were used to redeem 85,421 shares of our Series A Preferred Stock, including any accrued and unpaid dividends.
Credit Facilities
As part of the Refinancing, SIRVA Worldwide entered into the ABL Revolver, with a group of lenders, with Goldman Sachs Bank USA serving as agent for the lenders. The ABL Revolver matures on March 27, 2018.
74
Table of Contents
Under the terms of the ABL Revolver, we may borrow up to the maximum borrowing limit of $50.0 million less any outstanding letters of credit, subject to a borrowing base formula. The ABL Revolver provides for an advance rate of up to 85% of eligible accounts receivable of SIRVA Worldwide and certain of its subsidiaries, subject to limitations on certain accounts. All obligations under the ABL Revolver are guaranteed by certain of SIRVA Worldwide’s present and future subsidiaries. All obligations under the ABL Revolver, and the guarantees of those obligations, are secured, subject to certain exceptions, on a first-lien basis by all current assets of SIRVA Worldwide and its domestic subsidiaries, including, without limitation, accounts receivable, relocation properties held for resale, cash and cash equivalents and certain related assets and on a second-lien basis by substantially all of the other assets of SIRVA Worldwide and its domestic subsidiaries.
Borrowings under the ABL Revolver bear interest at our option, at either the London interbank rate, or a Base Rate (as defined in the ABL Revolver) plus, in each case, the applicable margin. The applicable margin is generally determined in accordance with a pricing grid based on our excess availability (as defined in the ABL Revolver) and ranges from 1.75% to 2.25% for London interbank loans and from 0.75% to 1.25% for Base Rate loans.
The ABL Revolver contains a $30 million sub-facility for the issuance of letters of credit and a $20 million sub-facility for swing line loans that can be borrowed and repaid on a same day basis. A fixed charge coverage ratio is tested when minimum availability thresholds are not met or during the continuance of an event of default.
At February 28, 2014, there was $44.5 million of aggregate borrowing availability, $4.3 million borrowed and $15.3 million of letters of credit outstanding.
As part of the Refinancing, we entered into our Term Loan, with a group of lenders with Goldman Sachs Bank USA serving as administrative agent and collateral agent for the lenders. All obligations under our Term Loan are guaranteed by certain of SIRVA Worldwide’s present and future subsidiaries. All obligations under the Term Loan, and the guarantees of those obligations, are secured, subject to certain exceptions, on a first-lien basis by (i) a pledge of 100% of certain of the capital stock held by us or any subsidiary guarantor and (ii) substantially all of the non-current assets of SIRVA Worldwide and its domestic subsidiaries and on a second-lien basis by substantially all current assets of SIRVA Worldwide and its domestic subsidiaries, including, without limitation, accounts receivable, relocation properties held for resale, cash and cash equivalents and certain related assets.
Our Term Loan currently bears interest at a rate per annum equal to, at our option, either (i) a base rate determined by reference to the higher of (a) the prime rate, (b) the federal funds effective rate plus 0.50% and (c) the one-month LIBOR rate plus 1.00% or (ii) a LIBOR rate (for the relevant interest period, and in any event, never less than 1.25%), subject to certain adjustments, in each case plus an applicable margin. The applicable margin with respect to outstanding base rate borrowings is currently 5.25% per annum and the applicable margin with respect to outstanding LIBOR borrowings is currently 6.25% per annum. The weighted average interest rate for the Term Loan since inception through February 28, 2014 was 7.5%. The Term Loan requires principal repayments in the form of quarterly installments of $0.75 million which commenced on June 30, 2013.
The Term Loan contains a number of covenants that, among other matters, restrict SIRVA Worldwide’s ability to incur additional indebtedness, pay dividends to us, make acquisitions or engage in mergers or consolidations, and make capital expenditures or incur capital lease obligations. While the Term Loan generally permits dividends and distributions on the capital stock of SIRVA Worldwide’s subsidiaries to SIRVA Worldwide, such dividends from SIRVA Worldwide to SIRVA, Inc. are generally restricted. The Term Loan requires SIRVA Worldwide to maintain certain financial ratios, including a consolidated interest coverage ratio and consolidated leverage ratio.
The Term Loan contains customary events of default, including events of default resulting from, among other things, nonpayment of principal, interest or other amounts, failure to perform covenants, inaccuracy of
75
Table of Contents
representations or warranties in any material respect, cross-defaults with respect to other material indebtedness of over $7.5 million, certain undischarged judgments, the occurrence of certain ERISA or bankruptcy or insolvency events or the occurrence of a change in control (defined in the Term Loan). A bankruptcy or insolvency event of default will cause the obligations under the Term Loan to automatically become immediately due and payable.
Redemption of Series A Preferred Stock
As part of the Refinancing, $109.0 million of proceeds was used to redeem 85,421 shares of Series A Preferred Stock, including $23.6 million of accrued and unpaid dividends. Following this redemption, 99,444 shares of Series A Preferred Stock remain outstanding. In the absence of a liquidation or redemption, we have no obligation to pay cash dividends on the preferred stock; however, after the repayment of all obligations under the Term Loan and the ABL Revolver, we have the option to pay cash dividends.
Mortgage Warehouse Facilities
SIRVA Mortgage has various credit facilities to fund its mortgage loans held for resale.
SIRVA Mortgage executed master repurchase agreements with Citibank, N.A. for a $40.0 million committed revolving mortgage loan facility and a $30.0 million uncommitted revolving mortgage loan facility. These facilities expire in August 2014. There was $13.8 million and $21.6 million outstanding against the committed revolving mortgage loan facility as of December 31, 2013, and December 31, 2012, respectively. SIRVA Mortgage will pay a monthly facility fee of 25 basis points on the committed amount of $40.0 million. This facility has dividend restrictions and financial covenants, which require SIRVA Mortgage to maintain a minimum tangible net worth of $20.0 million, a maximum total debt to tangible net worth ratio of 12:1 at all times and a liquidity requirement, as defined in the agreement, of $6.5 million as of the end of each month.
SIRVA Mortgage executed a master repurchase agreement with US Bank, N.A. for a $30.0 million committed revolving mortgage loan facility. This facility expires in May 2014. There was $18.0 million and $14.6 million outstanding against the committed revolving mortgage loan facility as of December 31, 2013 and December 31, 2012, respectively. SIRVA Mortgage is required to pay a monthly facility fee of 25 basis points on the committed amount of $30.0 million. This facility has dividend restrictions and financial covenants, which requires SIRVA Mortgage to maintain a minimum tangible net worth of $13.5 million, a maximum total debt to tangible net worth ratio of 12:1 at all times and a liquidity requirements, as defined in the agreement, of $6.5 million as of the end of each month.
SIRVA Mortgage executed a master repurchase agreement with Associated Bank, N.A. for a $30.0 million committed revolving mortgage loan facility. This facility expires in July 2014. There was $14.9 million and $16.0 million outstanding against the committed revolving mortgage loan facility as of December 31, 2013 and December 31, 2012, respectively. This facility has dividend restrictions and financial covenants, which requires SIRVA Mortgage to maintain a minimum tangible net worth of $13.5 million, a maximum total debt to tangible net worth ratio of 12:1 at all times and an unencumbered cash requirement of $3.0 million as of the end of each month.
We expect to extend each of these facilities for additional one-year terms upon their respective expirations.
During the years ended December 31, 2013 and 2012, interest on these facilities was payable monthly at a rate equivalent LIBOR plus 225.0 basis points to 350 basis points with a floor of zero to 3.50% (contract rates between 3.25% and 3.67% at December 31, 2013 and 3.75% and 4.00% at December 31, 2012). The interest rate spread varies depending upon such factors as the type of mortgage financed, amount of time a mortgage loan has been closed and not yet sold to investors and other factors. The interest is recorded in other direct expense in the Consolidated Statements of Operations.
76
Table of Contents
Securitization Facilities
Mobility Solutions Receivable Securitization
We have a program to sell certain receivables generated by SIRVA Relocation, a mobility services subsidiary, which expires in December 2015. As of December 31, 2013, the maximum borrowing capacity under the facility was $100.0 million and approximately 51% of the facility had been utilized. The receivables are primarily service fees, home equity advances and other payments made on behalf of transferees and corporate customers. Invoice due dates typically range from seven to 60 days. The equity payments are evidenced by promissory notes executed by the transferees and/or supported by the underlying value of the transferees’ properties and contract arrangements with corporate customers. The equity advances generally are due within 180 to 270 days or upon the earlier sale of the underlying property.
SIRVA Relocation sells receivable portfolios to SIRVA Relocation Credit, LLC (“SRC”). The receivables securitization program is accounted for as a sale of financial assets. At each sales transaction, SRC transfers its ownership in all of its receivable on a non-recourse basis to a third-party financial institution in exchange for a cash advance and a securitization receivable. SRC’s assets are not available to pay our general obligations. The program does not contain any financial covenants, but does contain cross-default provisions to our ABL Revolver and Term Loan and requirements for financial reporting and actions consistent with the maintenance and servicing of the receivable obligations.
Mobility Networks Receivable Securitization
In July 2013, we entered into a program to sell certain receivables generated by our Mobility Networks segment to Deutsche Bank AG (“Deutsche Bank”). The agreements have an indefinite term but can be cancelled with 30 day notice by Deutsche Bank. The receivables are amounts due from one large corporate customer. The receivables are generally due within 120 days and are secured by a contractual arrangement with the large corporate customer. We are not processing any new receivable activity through this program and anticipate that it will be terminated in 2014.
Critical Accounting Policies
The preparation of financial statements in conformity with U.S. generally accepted accounting principles requires management to make estimates and assumptions that affect the amounts reported in the consolidated financial statements and accompanying notes. We believe that the following are critical areas that either require significant judgment by management or may be affected by changes in general market conditions outside the control of management. As a result, changes in estimates and general market conditions could cause actual results to differ materially from future expected results.
The accounting policies we believe to be most critical to understanding our financial results and condition and that require complex and subjective management judgments are discussed below.
Income Taxes
Our income tax expense, deferred tax assets and liabilities and reserves for unrecognized tax benefits reflect management’s best assessment of estimated future taxes to be paid. We are subject to income taxes in both the U.S. and numerous foreign jurisdictions. Significant judgments and estimates are required in determining the consolidated income tax expense. Deferred income taxes arise from temporary differences between the tax and financial statement recognition of revenue and expense. In evaluating our ability to recover our deferred tax assets within the jurisdiction from which they arise we consider all available positive and negative evidence, including scheduled reversals of deferred tax liabilities, projected future taxable income, tax planning strategies and recent financial operations. Management assesses the available positive and negative evidence to estimate if
77
Table of Contents
sufficient future taxable income will be generated to realize the existing deferred tax assets. A significant piece of objective negative evidence evaluated was the cumulative pre-tax loss incurred over the three-year period ended December 31, 2013. Such objective evidence limits the ability to consider other subjective evidence such as the Company’s projections for future growth. On the basis of this evaluation, a full valuation allowance for the U.S. and certain foreign subsidiaries’ net deferred tax assets has been recorded at December 31, 2013 and 2012.
Our ability to utilize our NOLs and other tax attributes is limited if we undergo an “ownership change” within the meaning of Section 382 of the Code. An ownership change is generally defined as a greater than 50 percentage point increase in equity ownership by five-percent shareholders in any three-year period. Due to prior ownership changes under these provisions, we are limited to $31.8 million of tax benefits from U.S. federal net operating losses and $8.8 million of tax benefits from state net operating losses reported at December 31, 2013. U.S. federal net operating losses will begin to expire in 2022.
Changes in tax laws and rates could also affect recorded deferred tax assets and liabilities in the future. Management is not aware of any such changes that would have a material effect on our results of operations, cash flows or financial position.
The calculation of our tax liabilities involves dealing with uncertainties in the application of complex tax laws and regulations in a multitude of jurisdictions across our global operations.
Tax benefits from an uncertain tax position are recognized when it is more likely than not that the position will be sustained upon examination, including resolutions of any related appeals or litigation processes, based on the technical merits. We adjust our liabilities for uncertain tax positions when our judgment changes as a result of the evaluation of new information not previously available. Due to the complexity of some of these uncertainties, the ultimate resolution may result in a payment that is materially different from our current estimate of the tax liabilities. These differences will be reflected as increases or decreases to income tax expense in the period in which they are determined. There are no unrecognized tax benefits expected to be settled in the next 12 months.
Pension Benefits
We have a qualified defined benefit pension plan covering certain of our domestic employees. This defined benefit pension plan was amended in 2002 to freeze participation and benefit accruals. We also have an unfunded, nonqualified plan that provides retirement benefits not otherwise provided under the qualified plan, because of the benefit limitations imposed by Sections 415 and 401(a)(17) of the Code. This plan ensures that an executive receives the total pension benefit to which he or she otherwise would be entitled, were it not for such limitation. Several statistical and other factors, which attempt to anticipate future events, are used in calculating the expense and liability related to the plans. Key factors include assumptions about the expected rates of return on plan assets and discount rates, as determined by us, within certain guidelines. We consider market conditions, including changes in investment returns and interest rates, in making these assumptions.
We determine the expected long-term rate of return on plan assets based on the plan assets’ historical long-term investment performance, current asset allocation, and estimates of future long-term returns by asset class. Plan assets are comprised of equity and fixed income securities. The expected rate of return on plan assets is a long-term assumption and generally does not change annually. The discount rate reflects the market rate for high-quality fixed income debt instruments on our annual measurement date (December 31) and is subject to change each year. Holding all other assumptions constant, a 1% increase or decrease in the assumed rate of return on plan assets would have decreased or increased, respectively, 2013 net periodic pension expense by approximately $1.1 million. Likewise, a 0.25% increase or decrease in the discount rate would have decreased or increased, respectively 2013 net periodic pension expense by approximately $0.3 million.
Unrecognized actuarial gains and losses are being recognized over approximately a 9-year period, which represents the expected remaining service life of the employee group. Unrecognized actuarial gains and losses
78
Table of Contents
arise from several factors including experience and assumption changes in the obligations and from the difference between expected returns and actual returns on plan assets. We have recorded unrecognized actuarial losses within accumulated other comprehensive loss, net of tax. These unrecognized losses will be systematically recognized from accumulated other comprehensive loss as an increase in future net periodic pension expense. Similarly, actuarial gains and losses that arise in the future, which have not yet been recognized as a component of net periodic benefit cost will be recognized as increases or decreases in other comprehensive income, net of tax, in the period they arise. The actuarial assumptions we use in determining our pension benefits may differ materially from actual results because of changing market and economic conditions, higher or lower withdrawal rates or longer or shorter life spans of participants. While we believe that the assumptions used are appropriate, differences in actual experience or changes in assumptions might materially affect our financial position or results of operations.
Contractual Obligations
The following table provides a summary at December 31, 2013 of our contractual cash obligations:
| Payments Due by Period | ||||||||||||||||||||
| Total | Less than 1 year |
1-3 years | 3-5 years | After 5 years |
||||||||||||||||
| (in millions) | ||||||||||||||||||||
| Contractual obligations |
||||||||||||||||||||
| Long-term debt(a) |
$ | 299.0 | $ | 3.6 | $ | 6.6 | $ | 6.0 | $ | 282.8 | ||||||||||
| Interest payments on long-term debt(b) |
110.1 | 22.5 | 44.3 | 43.3 | — | |||||||||||||||
| Operating leases |
75.1 | 15.5 | 20.8 | 15.4 | 23.4 | |||||||||||||||
| Household goods claim reserves(c) |
12.6 | 12.1 | 0.5 | — | — | |||||||||||||||
| Capital lease obligations |
3.5 | 2.2 | 1.3 | — | — | |||||||||||||||
| Interest payments on capital leases |
0.2 | 0.1 | 0.1 | — | — | |||||||||||||||
|
|
|
|
|
|
|
|
|
|
|
|||||||||||
| Total contractual cash obligations |
$ | 500.5 | $ | 56.0 | $ | 73.6 | $ | 64.7 | $ | 306.2 | ||||||||||
|
|
|
|
|
|
|
|
|
|
|
|||||||||||
| (a) | Long-term debt includes principal payments related to our $300.0 million Term Loan and other debt and excludes capital lease obligations. |
| (b) | The following assumptions were made for interest payments on long-term debt: |
$300.0 million Term Loan—A floating interest rate on the principal outstanding of 7.5% is assumed for 2014 and all years thereafter.
$50.0 million ABL Revolver—Interest on borrowings under our revolving credit facility is excluded because at December 31, 2013 no amounts were outstanding.
Indiana Economic Development Corporation Loan—A fixed interest rate on the principal outstanding of 5.0% is assumed for 2014 and all years thereafter.
| (c) | Estimated costs to settle claims related to household goods damage and loss. |
Pension Plans
Our policy is to fund our pension plans as required by the Employee Retirement Income Security Act (“ERISA”), the IRS and local statutory law. As of December 31, 2013, our aggregate pension liability was $33.3 million. We currently estimate that we will contribute approximately $6.9 million to our pension plans in 2014, as determined by minimum required contribution calculations. Due to the future impact of various market conditions, rates of return and changes in plan participants, we cannot provide a meaningful estimate of our future pension plan contributions beyond 2014.
79
Table of Contents
Off-Balance Sheet Arrangements
We have an off-balance sheet arrangement that enables us to sell up to $100.0 million of certain receivables to an independent third-party financial institution in order to provide a cost effective way to offer home equity payments to our relocation services customers. The receivables are primarily for service fees, home equity payments, final equity payments, lump sum payments, employee expense reimbursements and third-party payments advanced by us and are collateralized by promissory notes, the underlying value of the properties and contract arrangements with the corporate customers. Invoice due dates typically range from seven to 60 days. The equity payment terms can extend to 180 to 270 days or upon the sale of the underlying property. Under the terms of the sales agreement, we are responsible to service the equity advances and other payments during their life, including administration and collection on the receivables, on behalf of the independent third-party financial institution. Servicing fees we receive under the sales agreement are deemed adequate compensation to us for performing the servicing; accordingly, no servicing asset or liability has been recognized. As of December 31, 2013, 51% of the facility has been utilized. Proceeds from receivables sold exceeded collections paid by $3.7 million and $0.4 million for the years ended December 31, 2013 and 2012, respectively.
The program does not contain any financial covenants, but does contain cross-default provisions to our ABL Revolver and Term Loan and requirements for financial reporting and actions consistent with the maintenance and servicing of the receivable obligations.
Quantitative and Qualitative Disclosures about Market Risk
We are exposed to various market risks, including changes in interest rates and foreign currency exchange rates.
Interest Rate Risk
We are exposed to various interest rate risks that arise in the normal course of business. We finance our operations with borrowings comprised primarily of variable rate indebtedness. Significant increases in interest rates could adversely affect our operating margins, results of operations and our ability to service indebtedness. Because our Term Loan has a LIBOR floor of 1.25%, a 1% increase in market rates would have increased our gross interest expense by approximately $0.1 million for the year ended December 31, 2013. A 1% increase in the effective interest rate would have increased our gross interest expense by $2.8 million for the year ended December 31, 2013. The interest rate swap instruments described below will not mitigate the impact of a rate increase until the 90 day LIBOR rate exceeds 2.5%.
We utilize interest rate agreements to manage interest rate exposure. The principal objective of such contracts is to minimize the risks and/or costs associated with financial activities. We do not utilize financial instruments for trading purposes. The counterparties to these contractual arrangements are financial institutions with which we also have other financial relationships. We are exposed to credit loss in the event of nonperformance by these counterparties, but we have no reason to anticipate non-performance by the other parties.
80
Table of Contents
We have an interest rate cap agreement that limits the impact of rising interest rates on a portion of our variable rate term loan. The agreement requires the counterparty to pay our incremental interest expense on any incremental rate increase over the cap rate for the stated notational principal amount. This agreement qualifies for hedge accounting treatment, therefore, market rate changes in the effective portion of this derivative are reported in accumulated other comprehensive income. The following table provides a summary of the interest rate cap agreement:
| Capped Interest Rate (90-day Libor) |
2.5% | 3.5% | 4.0% | 5.0% | ||||
| Notional amount |
$150,000,000 | $125,000,000 | $100,000,000 | $75,000,000 | ||||
| Effective date |
7/2/2014 | 4/1/2015 | 4/1/2016 | 4/1/2017 | ||||
| Expiration date |
3/31/2015 | 3/31/2016 | 3/31/2017 | 3/31/2018 | ||||
| Counterparty |
JPMorgan Chase | JPMorgan Chase | JPMorgan Chase | JPMorgan Chase |
We are also exposed to interest rate risk arising from our interest rate lock commitments issued on residential mortgage loans intended to be held for sale and mortgages held for sale. We use a combination of forward contracts for the sales of loans, forward sales of mortgage-backed securities and call or put options on U.S. Treasury futures to manage our exposure to this interest rate risk.
Foreign Currency Risk
Assets, liabilities and commitments that are to be settled in cash and are denominated in foreign currencies for transaction purposes are sensitive to changes in currency exchange rates. All material trade receivable balances are denominated in the host currency of the local operation. For the years ended December 31, 2013, 2012 and 2011, we recognized a currency loss of $0.9 million, an insignificant currency loss and a currency loss of $1.4 million, respectively, for transactional related items.
Recent Accounting Pronouncements
There are no accounting standards that, when adopted, are expected to materially affect our financial condition or results of operations. See Note 2 “Summary of Significant Accounting Policies” to the Company’s audited financial statements included elsewhere in this prospectus.
81
Table of Contents
We are a leading provider of mobility services for multi-national corporations and government institutions. Our customers, typically corporate human resources departments, use SIRVA’s solutions to optimize the deployment of their professional talent on a global basis—ensuring that their best people are leading their most important initiatives, regardless of where in the world they are located. We serve a blue-chip customer base of more than 1,800 customers, including approximately 28% of the Fortune 500 and two-thirds of the Dow Jones 30.
We play a valuable role as the outsource partner for corporations and government institutions, providing an integrated solution that offers an overall enhanced mobility experience, program control and security for our customers, the transferee and the transferee’s family. We provide a suite of over 50 distinct mobility services, including relocation assistance and moving services. We enable our corporate and institutional customers to outsource their mobility needs, allowing enabling them to focus on executing their strategies and enhancing their productivity. In 2013, we executed over 280,000 mobility events for our corporate, government and consumer customers. Our approximately 2,700 employees, located both within our offices and on-site within our customers’ human resources departments, provide a customized solution for each transferee.
Consistent with our marketing slogan “Everything you need, everywhere you need it,” we provide our customers with what we believe to be the most global and complete mobility solution. This has enabled us to maintain long-term relationships with our customers, as reflected by our high customer retention rates. For example, from 2011 to 2013, we achieved a 98% retention rate for our corporate customers in our Mobility Solutions segment.
A transfer to a new location is a challenging time for the transferee, their spouse/partner and their entire family, and can be even more difficult if the job is located in a new country with a different language and culture. We assist the corporation and the transferee with each aspect of the mobility process to ensure a smooth relocation and we generate revenue from each of the mobility services that we provide. Our relocation services, or mobility solutions, are provided by us and our network of third-party providers, and our moving services, or mobility networks, are provided through our agent/franchise network.
The following is an example of the transfer of an executive and his family from Boston to Beijing and illustrates the mobility services that we provide:
82
Table of Contents
A mobility event typically triggers many challenging questions for the transferee and the transferee’s family, including:
| • | Will we be happy and successful in a new location and in a new culture? |
| • | Will my spouse/partner find a new job and will my kids find a good school? |
| • | How will my family fit into the new culture, find friends and adjust while I try to be successful at my new job? |
| • | What do I do with my current home—sell it or rent it? |
| • | Do I buy or rent my new home? |
| • | How will we move all of our personal things to our new home? |
| • | How can I ensure I am compliant with domestic tax laws and those in the new country I’m going to? |
| • | What new laws are applicable for visa and employment rules, and what are the new local human resources requirements? |
We assist the corporation, the transferee and the transferee’s family in meeting these challenges.
Our expertise in providing mobility services lies in our proprietary processes, our technological capabilities and our knowledge of the complex technical and logistical components of mobilizing talent on a global basis. For example, our technical knowledge of relocation requirements in the key areas of employment law, governance, expatriate taxes, compensation, customs, immigration, cultural integration, logistics and global supply chain optimization help ensure successful mobility events worldwide.
Our technological capabilities are core to our business model and customer value proposition. Our technology team has 140 employees and a dedicated research and development budget. We utilize leading technology to provide everyone involved in a mobility event—from the human resources department, the transferee and the transferee’s family to our agents/franchises and third-party providers—with a secure connection to our flexible technology network. Our technological capabilities have been acknowledged by our customers and their technology experts. In 2013, we were named on the Information Week 500 list of Top Technology Innovators, an annual listing of the most innovative corporate users of business technology in the United States across all industries, for the 11th consecutive year, earning the #126 position.
We operate an asset-light agent/franchise network, which has attributes similar to a traditional franchise model. We provide our mobility services through 1,224 locations, including 66 company-operated locations and 1,158 agent/franchise locations, in approximately 170 countries. We deliver our relocation services, or mobility solutions, directly and through contracted third-party providers. Our network of third-party providers allows us to deliver specialized, local expertise in a wide range of countries and manage such services without incurring the costs of establishing them on an in-house basis. Our agents and franchises operate in the United States and Canada under our nationally recognized moving brands Allied and north American, and in the rest of the world under our Allied brands. Our mobility networks, established over many decades, allow us to deliver a quality customer experience and manage the move, while the agents and franchises provide the capital and labor-intensive aspects of the operations, including moving vehicles, warehouses and packaging and transportation support teams.
Over the period from 2008 to 2013, we completed a series of business initiatives designed to improve our financial performance. These initiatives included implementing new policies intended to improve our risk management, focusing on an asset-light strategy, hiring a new management team, divesting non-core businesses that were not directly related to providing mobility services, and lowering our indebtedness.
Approximately 71% of our 2013 total revenue was derived from contracts with our corporate customers, which generally have durations ranging from one to four years. Approximately 29% of our 2013 total revenue was not from contracts, but was largely funded by corporations that provide “lump sum” payments to their
83
Table of Contents
transferring employees. We have a diversified customer base, with no single customer accounting for more than 2.4% of our total revenue in 2013 and our top ten customers accounting for approximately 12% of our total revenue in 2013.
Between 2009 and 2013, we increased our total revenue from $1,676.4 million to $1,994.2 million, Net Service Revenue from $343.2 million to $462.7 million, Adjusted EBITDA from $13.9 million to $76.8 million and net income (loss) from $(78.0) million to $9.7 million. For fiscal years 2011, 2012 and 2013, our total revenue was $1,932.4 million, $1,950.8 million and $1,994.2 million, respectively, Net Service Revenue was $428.9 million, $447.0 million and $462.7 million, respectively, Adjusted EBITDA was $54.4 million, $66.7 million and $76.8 million, respectively, and net income (loss) was $(52.9) million, $(1.4) million and $9.7 million, respectively. For information on how we define Adjusted EBITDA and Net Service Revenue and reconciliations of net income (loss) to Adjusted EBITDA and total revenue to Net Service Revenue, see “Summary—Summary Historical Financial and Other Data.” The following graph sets forth our Net Service Revenue and Adjusted EBITDA for the periods presented:
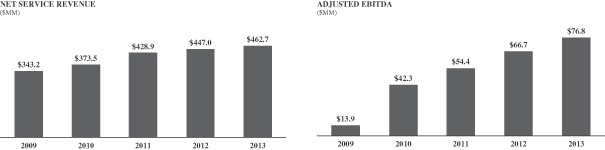
Our Market Opportunity
Mobility Services are Critical for Talent Management
The talent needs of multi-national corporations are becoming increasingly global and complex. Strategic business decisions normally depend upon the deployment of employees to the most important projects with speed and agility, which drives demand for mobility services. Mobility services consist of managing numerous, distinct mobility events involving the relocation of the transferee, the transferee’s family and the transferee’s household goods from their originating location to a destination location, while also managing the related legal requirements, visa and immigration requirements, human resources policies and transferee-specific needs.
Trend Toward Outsourcing Mobility Services
In 2012, 90% of U.S.-based corporations surveyed by Worldwide ERC outsourced mobility services. Although large corporations often have a mobility function or capability within their human resources departments, they do not typically possess the expertise or local resources across diverse geographies to manage the numerous processes involved in a mobility event. Accordingly, most corporations outsource these functions to mobility services providers to leverage the provider’s scale, expertise and technology.
Our Customers’ Key Buying Criteria
Multi-national corporations are often seeking a “one stop shop” outsourcing relationship with their mobility services provider in order to better address the complexity of mobilizing talent while also achieving operational and cost efficiencies. We believe the key factors used by multi-national corporations in selecting an outsourced mobility services provider are:
| • | Quality of the Experience. Deliver a high level of satisfaction and a timely, convenient delivery to the transferee of a quality mobility experience. |
84
Table of Contents
| • | Technology. Provide technology that integrates with customer’s IT systems, interfaces with transferees and allows for real time access regardless of location through mobile applications and reporting capabilities to meet a human resources department’s needs. |
| • | Global Presence. Produce a consistent experience regardless of location in the world, even in developing or remote countries. |
| • | Scale. Have the operational capabilities to handle any relocation, regardless of size or volume, from a single employee relocation to the group move of an entire corporate division. |
| • | New Product Innovation. Create new services that are customized to the unique needs of each customer’s HR department and innovate with value-added services for the transferee and their family. |
| • | Scope of Expertise. Expertise and experience in handling the complexities of a global mobility program, including legal, tax, employment regulations, payroll and human resource policies in the countries in which the customer operates. |
| • | Supply Chain Management and Efficiency. Provide the service and quality through a competitive and cost-effective supply chain. |
Large and Growing Global Market
Global mobility services is a large and growing market, consisting of a range of highly diversified services that enable corporations and government institutions to deploy executives and key personnel to locations throughout the world. Globalization, GDP performance, corporate spending and employment levels are key growth drivers in this market. Several trends, including corporate expansion into emerging markets and increased regulatory complexity, are also driving the shift to outsourced mobility services.
U.S. Market
The U.S. mobility services market is well developed and is the largest mobility services market in the world. Third-party research describes U.S. mobility services as consisting of different sub-components, with relocation services and moving services as the largest.
| • | Relocation Services. IBISWorld estimates that the market for U.S. relocation services was $11.7 billion for 2013 and is forecasted to grow at an annualized rate of 6.9% from 2013 to 2018 to a total of $16.3 billion. Relocation services include expatriate services, temporary housing, property management, realtor advice, home sale and purchasing assistance and other value-added services. According to IBISWorld, we were a market leader in U.S. relocation services with an 18% U.S. market share in 2012. |
| • | Moving Services. IBISWorld estimates that the market for U.S. moving services was $15.5 billion market for 2014 and is forecasted to grow at an annualized rate of 2.0% from 2014 to 2019 to a total of $17.1 billion. Moving services include moving valuables protection, records management and storage, integrated logistics and information services and other value-added services. According to AMSA, we had a 29% U.S. market share for interstate moves in 2013 among companies that self-report to AMSA. |
International Markets
The international mobility services market has also experienced growth. In 2013, international mobility managers reported that companies moving employees to or from international regions grew an estimated 12% in Central and South America, 10% in the Middle East and 9% in Australia, New Zealand, India and Northeast Asia. According to PricewaterhouseCoopers’ Talent Mobility 2020, the average number of mobile employees from global organizations has grown 25% over the past decade and is estimated to grow an additional 50% by 2020.
85
Table of Contents
| • | Europe. We believe Europe is the second largest location for headquarters of large corporations. 151 of the Global Fortune 500 corporations are headquartered in Europe and account for a significant amount of global mobility volume. |
| • | Asia and Emerging Markets. We believe China, Brazil and India are growing markets for mobility services. As more corporations in these countries develop into global leaders, we believe their mobility needs will increase. Additionally, countries in the Middle East, including the United Arab Emirates, Qatar and Saudi Arabia, are becoming increasingly important to global corporations, driven partially by the energy industry, but also by technology, industrial, retail and business services sectors. |
| • | Australia. Australia is a relatively mature market, which is primarily impacted by the mining sector. Our revenue growth in this region has been predominantly driven by the addition of new services, new customer wins and the strength of our Allied and SIRVA Relocation brands. According to IBISWorld, we had the #1 position in Australia’s moving services market in 2013. |
Competitive Landscape
The mobility services industry is characterized by several well-established competitors. The substantial start-up costs associated with establishing the required infrastructure, establishing a global reach, building an extensive agent network and developing a credible reputation with multi-national corporations could deter new competitors from entering the market. Additionally, global mobility events often require local service delivery capabilities in a wide range of foreign markets and mobility-related local domain expertise, thereby limiting the risk that the industry will be subject to the introduction of disruptive technologies or that existing providers can be replaced by low-cost, off-shoring business models.
Corporate Lump Sum
In addition to relocation benefits programs provided to key executives, corporations also provide mid and low-level employees with lump sum payments to purchase mobility services directly. We believe there is an opportunity to help these transferees acquire mobility services and to enable human resources departments to manage their lump sum programs and provide additional benefits to these transferees. Individual consumers may also seek similar assistance with mobility services in connection with their moves, which we believe is another market opportunity. To take advantage of this, in October 2013 we launched our LumpSum Xpress Marketplace. This program provides an online marketplace for mobility services, enabling transferees to manage their lump sum benefits online and enabling human resources departments to administer and track their lump sum programs.
Do-It-Yourself, Self-Storage and Containerization
There is also a DIY moving and storage market. In contrast to a full-service corporate solution, DIY relocations are typically completed directly by the transferee or consumer and are normally provided at a lower price point. The DIY market is generally comprised of lower level employees who receive fewer benefits and consumers that need a more economical service to relocate to their new job and provides an additional market opportunity for mobility solutions providers. In March 2014, we acquired SMARTBOX, a DIY moving and storage company, to address this market opportunity.
Secular Drivers of Growth in Mobility Services
We believe the mobility services industry is supported by the following secular growth drivers:
| • | Globalization. As corporations expand their global reach and enter new markets, the lack of sufficient local talent in key growth areas and the emergence of new multi-national corporations in developing economies is likely to increase the need to deploy talent around the world. |
86
Table of Contents
| • | GDP Growth. Improving macroeconomic conditions can result in multi-national corporations seeking to expand the size of their workforce in various markets, which can increase their executive and key employee relocation volumes. |
| • | Corporate Spending. As economic and political conditions improve, businesses are more inclined to undertake new corporate initiatives, projects and investments, which can lead to increased relocations. |
| • | Employment Levels. Employment growth typically results in increased need for the relocation of executives and key personnel to the locations where they can make the highest impact and results in an increase in the relocation benefits provided by a corporation to an employee as the competition for talent increases. |
Industry-Specific Growth Drivers
We believe the following industry trends further support growth in the mobility services industry:
| • | International Relocation Dynamics. As businesses expand globally into emerging markets, they face a growing need to deploy talent to the most critical parts of their business in key growth regions. As a result, many businesses are not merely transferring talent on an “expat” basis but are creating flexible global organizations that deploy talent around the world continually. |
| • | Complex Regulatory Environment. Increasingly complex government regulations and compliance requirements associated with international relocations are placing an added burden on human resources departments due to changing local laws in tax, immigration, employment and other human resources regulations. These more complex regulatory environments require particular domain expertise and a local presence in foreign markets. The high costs of failure associated with a corporation’s inability to manage these processes can be significantly disruptive to its business operations. For example, the risk of failure is high if an executive has problems with a work permit while on an expat assignment or if the transferee encounters issues with U.S. or local taxes. |
| • | Shift To Outsourcing. In addition, human resources departments do not typically possess the expertise or local resources in every country in the world to manage the numerous processes involved in a mobility event. “In-house” relocation programs can be costly to operate. As a result, corporations seek outsourced mobility services providers that can provide more comprehensive service offerings and global networks to provide the required expertise worldwide and reduce the administrative costs associated with complex relocations. |
As a leading, globally-integrated mobility services provider, we believe we are positioned to capitalize on growth opportunities resulting from these industry dynamics and secular drivers.
Competitive Strengths
The following is a description of the competitive strengths that have helped establish us as a leading global mobility service provider:
Our Broad and Integrated Suite of Service Offerings
We provide an integrated end-to-end mobility solution for our customers. We take ownership of the key aspects of our customers’ global mobility programs and deliver over 50 distinct service offerings through our in-house domain experts, our network of exclusive agents and franchises and our third-party providers. Our broad, integrated suite of services offerings enable us to provide a customized solution for each mobility event, including transferee-specific services at origin, moving of household goods and destination services, and in the case of an international relocation, on-going expatriate services during the foreign assignment.
Our Global Scale
We provide services across six continents and in over 170 countries. We serve more than 1,800 corporate customers globally, including 28% of the Fortune 500 and two-thirds of the Dow Jones 30. We operate two of the
87
Table of Contents
four largest nationally recognized moving network brands in the United States—Allied and northAmerican—which are leveraged across a network of 419 third-party agents in the United States and Canada. Internationally, we provide moving services under our Allied brands.
Our Local Delivery and Execution
We have built a worldwide local delivery capability in over 170 countries through our 66 company-operated locations, our 1,158 agent and franchise locations and our third-party provider network. These local agent, franchises and third-party provider relationships enable us to serve the complex needs of large multi-national corporations even in challenging or undeveloped markets while maintaining an asset-light structure. We actively manage our agent, franchise and third-party provider network, enabling us to deliver a consistent quality of service. We also maintain the ability to provide select services directly through our in-house domain experts to control sensitive aspects of a relocation. For example, our employees provide increased safety for the transferee’s family and protection over their personal information by directly delivering services in many challenging or developing countries which we believe provides us with a competitive advantage.
Our Deep Domain Expertise
Our deep domain expertise in mobility services and our extensive global experience servicing the corporate human resources departments of Global Fortune 500, mid-size companies and small businesses enables us to accurately anticipate the complexities inherent in any mobility event. We typically review and update our customers’ mobility policy as a key aspect of on-boarding a new customer. We apply our domain expertise to establish our proprietary mobility processes and robust technological capabilities, and combine them with our employees’ knowledge of, and experience in, the complex technical, logistical and technological components in mobilizing talent around the world. Our employees are highly trained and we have certified relocation and moving experts on our teams to serve customers. In addition to providing an enhanced transferee experience and better control, we believe our expertise reduces the risk of non-compliance with laws in different geographies. This helps prevent some of the most critical and costly errors for our customers, such as the deportation of a transferred executive due to an unforeseen visa issue or tax compliance problems in the United States or a foreign country due to inaccurate reporting.
A Leading Technology Capability
Our technology platform is integrated with our customers’ human resources departments, our agent/franchise network and our third-party providers. As of December 31, 2013, we employed 140 full-time technology professionals to develop, maintain and support our technology platforms and services. We have developed an extensive knowledge of the technologies deployed for mobility solutions, which has enabled us to design and build our technology and deploy it to our customers. Our proprietary global assignment platform, SIRVA Connect, provides us with the ability to estimate costs for a move, initiate a transaction, measure and track progress and manage key aspects of a mobility event, as well as collaborate with human resources departments. Transferees are also able to manage their transfer, allowing them to track the movement of their household goods and view and request additional mobility services directly via our platform, which is accessible on the transferee’s laptop, tablet or mobile device. We have the ability to update our technology independently of the corporate IT departments with which we integrate, giving us the freedom to update and innovate our platform on our own schedule.
88
Table of Contents
Our Trusted, Well-Recognized Global Brands
|
|
|
|
We market the SIRVA brand to human resource professionals globally. We also own two of the top brands in moving services in the United States and Canada—Allied and northAmerican. According to the 2013 Workforce Management Relocation Hotlist, SIRVA held a 19% share globally in relocation services in 2013. In 2013, we were a market leader in U.S. relocation services according to IBISWorld.
Management Team
The core values of our leadership team are integrity, collaboration, customer service and capital efficiency. Our leadership team has a diverse set of management experiences from companies including General Electric, McKinsey & Company, AlliedSignal, Getty Images, Prudential Financial, Xerox, Ricoh, Motorola and Dell Inc. Both our CEO, Wes Lucas, and our CFO, Tom Oberdorf, have over 14 years of experience in their respective roles. Since Mr. Lucas joined us in 2008, Net Service Revenue has grown from $343.2 million to $462.7 million over the period from 2009 to 2013, which represents a CAGR of 8%, and Adjusted EBITDA has grown from $13.9 million to $76.8 million over the period from 2009 to 2013, which represents a CAGR of 53%.
Growth Strategies
We intend to capitalize on our leading position in mobility services and our global scale to increase revenue, enhance our profitability and maximize the return on investment for our stockholders. We seek to achieve these objectives by executing on the following key strategies:
Grow Market Share and Win New Customers
We intend to leverage our leading market position, global presence, well-recognized brands, integrated service offering and commitment to delivering a high-quality of service to grow our market share and win new customers. Our recently implemented sales and marketing initiatives, including an expanded sales team, a new global sales strategy, targeted marketing efforts and new agent/franchise sales process will be integral in our efforts to win new customers. We believe that our differentiated technology solutions will also be a key factor in our ability to increase our market share. In 2013, we won four out of the five largest RFPs that we competed for and signed 41 new U.S. and Canadian corporate relocation customers. We believe that the addition of these new customers will provide incremental revenue and reinforce our leading position in the mobility services market. We are focused on offering customizable solutions, which enable us to win business and develop long-standing relationships with our customers, leading to a 98% customer retention rate for the period from 2011 to 2013 for our corporate customers in our Mobility Solutions segment.
Expand Globally
We believe there are growth opportunities in Asia, the Middle East, South America and Africa as corporations in these markets continue to expand their global reach, increasing their need for global mobility services, and as U.S. and European multinational corporations continue to focus on growing in these regions. We have an extensive agent/franchise network in these regions, including 85 locations in Asia Pacific, 113 locations in Africa and the Middle East and 63 locations in Central America and South America. In addition, we have 51 company-operated locations in Asia Pacific, three locations in Africa and the Middle East and two locations in Central and South America. In 2012, we hired a team of mobility professionals to lead our growth efforts in Asia, and we have been focused on strengthening our market position in underserved countries in that region, including China, Singapore and Malaysia. Additionally, in 2011 and 2012, we acquired relocation services businesses with locations in India and Brazil and invested in these regions to further strengthen our ability to serve these markets.
89
Table of Contents
We are also planning to expand our service offerings in key markets, including offering new immigration services in Malaysia, new destination services in the United Arab Emirates and new relocation services in Qatar.
We are also targeting expansion of our business in Europe. We believe that we can leverage our existing European mobility infrastructure, consisting of 171 agent/franchise locations and two company-operated offices in 42 countries, which we have developed to serve our U.S.-based customers, to market to these European-headquartered companies. We are also investing in sales and marketing capabilities in the region to expand our customer base. For example, in 2012, we hired a mobility professional with over 20 years of experience in the global mobility industry to lead our European operations. During 2012 and 2013, we had success winning business with three large European-headquartered customers. In addition, in March 2014, we acquired InHouse, a niche German mobility company, to grow our position in Germany.
Increase “Share of Wallet” with Current Customers
Our broad service offerings provide an opportunity to cross-sell our diverse suite of services. Our team of dedicated domain experts works closely with our customers and their transferees to understand their individual needs at every stage of the relocation process and to identify areas where we can increase the quantity and depth of services that we provide to our customers and their transferees. We believe we are positioned to leverage the breadth of our mobility services to expand the scope of our work with a particular customer in a variety of ways. For example, once we have established a relationship with our customers, our account managers seek to add services to the contract, such as our visa services. Our moving counselors also offer transferees additional services during the relocation and at their destination location.
Continue New Product Development
We intend to continue to develop and market new technologies and tools that are designed to solidify our market position, expand our customer base, convert internet leads into revenue generating opportunities and be more responsive to our customers’ needs. We have several projects in various stages of development that we believe can be commercialized into attractive organic growth opportunities. Certain projects in development involve combining our industry expertise, global reach and proprietary technology platform to provide our customers with highly customized solutions. For example, we have recently developed a corporate human resources portal to enable human resources departments to access our mobility services directly, commercialized a global cost estimator and implemented a new reporting tool. We have also developed a portal for transferees so that they can directly shop for services, receive support and track the movement of their household goods. This portal is accessible on the transferee’s mobile phone and tablet. Additionally, we are working on expanding our service offerings to increase customer usage of higher margin services, such as expatriate taxes and compensation services.
Expand Into Adjacent Markets
We are continuously looking for opportunities to enter adjacent markets and capture new business. In October 2013, we launched the LumpSum Xpress Marketplace targeting individual transferees who receive a lump sum payment to relocate and are obtaining mobility services on their own. These transferees are often a majority of a corporation’s relocating employees and tend to be mid or low-level employees and new hires. We believe this represents an under-served market. Our product provides a portal to our global network of agents, franchises and third-party providers along with our local delivery capability, enabling the transferees to better facilitate their mobility experience and stretch their lump sum allowance by using discounts they earn through our supply chain. The human resources department is now able to offer these transferees a service never before available. The human resources department also benefits from visibility of the relocation services utilized and monies spent, which allows them to better manage this group of transferees.
90
Table of Contents
We are also targeting the estimated $7.0 billion self-storage market and the multi-billion dollar self-moving market and believe that our March 2014 acquisition of SMARTBOX, a DIY moving and storage company, provides a platform for the expansion of our mobility solution into these DIY markets. We believe the SMARTBOX acquisition will allow us to expand our mobility service offering to our corporate customers that want to provide a DIY option to their employees and to consumers looking for a more economical moving and storage option.
Improve Productivity and Operations to Increase Margins
We continually seek to improve our financial and operating performance through productivity improvement initiatives. We utilize Six Sigma, LEAN and other leading operational excellence tools to enhance our productivity. Over the last five years, we have focused on productivity improvements that we believe have positioned us to improve our operating efficiency. We are upgrading our IT systems and modernizing our operating system, installing GPS tracking devices on our agent’s trucks to enable network optimization and automating sales systems to enhance pricing capabilities and invoice processing. We have made significant progress to provide transferees with technology that improves their experience with us and streamlines the implementation of the mobility process. From 2009 to 2013, we have reduced selling, general and administrative expense as a percent of Net Service Revenue from 53% to 39%, and Adjusted EBITDA as a percent of Net Service Revenue grew from 4% to 17% over this same period. We believe that there is potential to further increase our productivity.
Differentiated Delivery Model
We place great value in offering an integrated end-to-end mobility solution to our customers. Both domestically and internationally, we strategically apply our core competencies to directly deliver select mobility services through our own staff and to deliver other services either through our agents and franchises or through partnerships with third-party mobility service providers. This approach enables us to relocate transferees across the globe, while delivering these specialized services with consistent quality on a local basis. Our domain experts work closely with our agent/franchise network and local third-party providers in order to maintain control over the services supply chain and provide our customers and their transferees with a secure experience.
Our independently owned agent network performs the moving and related services that we offer to our customers located in the United States and Canada. The agent network supports the physical transportation of a transferee’s household goods under our two nationally recognized moving brands – Allied and northAmerican. Our network in the United States and Canada, which is similar to a franchise model, includes 419 third-party agents serving customers in 712 locations. We do not own the assets required to move our customers in these locations. In contrast, our agents own and manage these assets required to execute and deliver moving services. They maintain their own fleet of transportation vehicles and real estate portfolio of warehouses and have packing/unpacking crews on their payroll. We believe our agent network positions us to maintain a low fixed-cost structure and provides us with significant operating leverage. We recently renewed the majority of our contracts with our agent network through January 2018.
91
Table of Contents
The following graphic illustrates examples of the services we provide to our agent network and the activities that are performed by our agent network:
Our Role
We act as a network manager for our agents and franchises, providing technology-enabled services associated with a move, including: integrated logistics and information services, IT systems, load optimization, billing, insurance, collection and claims handling, valuables protection and additional value-added services such as customs and referrals.
Agents’ and Franchise’s Role
Our agents and franchises are independently owned and work with us on an exclusive basis under standardized contracts that we execute with each agent/franchisee. In 2013, we entered into multi-year agreements with the majority of our agent/franchise network that expire in January 2018. The agents and franchises own the trucks and trailers used in moves and provide the capital and labor-intensive services of the move, including in-home surveying, packing, loading, transportation, unloading and unpacking. Our agents and franchises provide moving services for intrastate, interstate and international households, office and industrial moves, and also records management and storage.
Our Services and Solutions
We offer over 50 distinct mobility services. Our services assist our customers at every stage of an international or domestic mobility event. For example, our employees provide consulting, mobility policy services and program development, vendor management, satisfaction surveys, and education seminars.
Our in-house services are provided through our operating centers domestically and internationally to meet the global relocation needs of our customers. Our mobility services are provided by a team of approximately 2,700 employees located around the world. Visa and immigration law, rental assistance, language schools, and cross-cultural training, require very specific field expertise and are performed by third-parties.
92
Table of Contents
Corporate Services
We provide consulting services to facilitate the development of our customer’s mobility programs and policies to best meet their corporate needs and the mobility requirements of their employees. We benchmark policy parameters and provide cost analyses of various policy options to help our corporate customers implement successful and competitive programs.
As part of our ongoing relationship with our corporate customers, we also provide management reporting, educational seminars and other tools to help ensure that their mobility needs are being met. We have also developed applications, including an interactive dashboard, an ad-hoc report writer, and a dynamic report library, which provide detailed overviews of all ongoing relocations, associated expenses and service utilization. These applications enable human resources departments to better track all aspects of their relocation processes and manage their relocation programs. These tools also support our customers’ budgeting and accrual reporting process. We work with our customers and receive ongoing feedback from them through many applications, including our customer satisfaction surveys, to enhance our service quality.
Employee Services
Relocating employees of our corporate customers require services that vary depending on the overall mobility objectives of the customer and the destination and origin locations involved with a relocation assignment. The relocation services are described in the corporate customer’s mobility policies and include services at the origin, transport policies, destination services and on-going services. We provide a broad range of services that support a transferring employee at their origin and destination and utilize our global network of agents across 170 countries and our 1,224 company-operated and agent/franchise locations to provide our customers with access to leading professionals in fields where assistance may be required.
Employee Services—Origin. Transferring employees receive policy counseling at the outset of their move and throughout the move to help ensure understanding, compliance and satisfaction. We provide an upfront assessment and pre-decision services for employees prior to a relocation, which is designed to improve the success rate of transfers for the corporate customer.
The type and breadth of origin services are dependent on whether the employee is a homeowner or renter. Origin services may include customer home sale assistance, advice on tax, property management or lease cancellation. Through our network of real estate brokers, we assist our corporate transferees in selling their existing home. We work with leading real estate professionals in each location where we operate and are able to offer our customers access to premium services.
Employee Services—Transit. Each transferring employee requires transportation of household goods, provided through our agent/franchise network, which enables us to ensure service quality and timely delivery of their goods. We also provide employee counseling and timeline management to support the employee’s moving needs. In some cases, the employee’s goods require short- or long-term household goods storage depending on the type of assignment.
Employee Services—Destination. Depending on the nature of the employee’s move, such employee may receive home finding, mortgage support or rental assistance services from us and our extensive network of local providers throughout the world. During their move, we will arrange temporary living accommodations, if required. Such arrangements include short stay (45-60 days) and long stay (three to five year) alternatives.
We also support the employee’s family needs as required in the customer’s policy. We provide assistance services to the family, such as school search, spouse/partner job search and other family needs. For international assignments, we can also provide education, expat tax, expense management, language, visa, immigration and cultural training services.
93
Table of Contents
Employee Services—Ongoing. We offer ongoing services, including compensation and payroll administration, expense management, property management, tax services, work permit support and family support. We provide these services throughout the employee’s mobility event. As the employee incurs expenses associated with their mobility event, they can utilize our technology tools to ensure they are reimbursed for their expenses. These expenses can be audited and reviewed by us under the tax guidelines associated with relocation activities, which differ by region. International and cross-regional relocations typically require ongoing support services. These ongoing services provide us with incremental recurring revenue opportunities.
Moving Services
We provide moving, logistics and technology-enabled solutions to our customers in the U.S. and Canada through our Allied and northAmerican agent/franchise network. The local agents and franchises in our network operate under our brands, perform capital and labor-intensive moving services and own trucks and other assets required to perform physical moving. We provide moving services associated with large and complex international and domestic moves, as well as smaller interstate moves.
For international mobility events, we operate under the Allied brands to implement the moving of household goods outside of the United States.
Technology Platform
As a mobility services provider focused on speed of delivery and high quality customer experience, our technology capability is core to our business model and customer value proposition. Our technology team has 140 employees and a dedicated research and development budget. We utilize technology to provide our customers and third-party providers with a global technology platform securely connecting each service provider involved in the mobility event within a flexible framework. The following graphic illustrates the role of our technology platform in connecting us, our customers, agents, franchises and third-party providers.
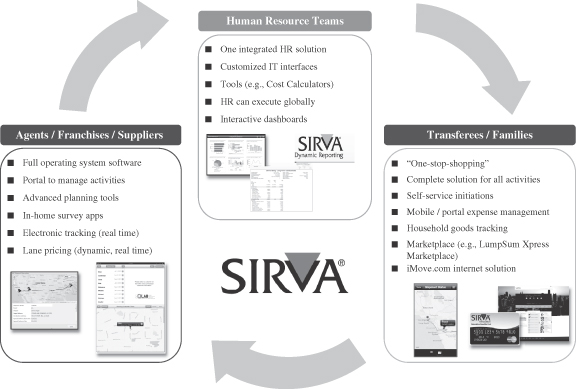
94
Table of Contents
Our technological capabilities have been acknowledged by our customers and technology experts. In 2013, we were named on the Information Week 500 list of top technology innovators, an annual listing of the most innovative corporate users of business technology in the United States across all industries, for the 11th consecutive year, earning the #126 position.
The Benefits of Our Technology
Our technology platform connects us to human resource teams, transferees, consumers, agents, franchises and third-party providers and provides a platform with applications that help each party in the relocation process execute through us and with each other. In addition to creating an enhanced user experience for the customer, our technology platform allows us to operate more efficiently in managing the relocation process. We believe our technology platform is a key differentiator from our competitors, and that it enables us to develop close and deep relationships with our transferees and customers.
Technology for Human Resources Departments. Our technology platform provides human resources departments with integrated real-time access to the data associated with its relocation processes through an interactive dashboard and customized portals, which simplifies the tasks of overseeing, managing, estimating, and administering our mobility services. We provide a broad range of applications with tools such as cost calculators, accrual reporting in multiple formats, audit changes with history tracking, automated initiation and authorization process, employee details screens and expense management systems.
95
Table of Contents
We work closely with our corporate customers to develop customized portals and operating systems to help administer their mobility programs and facilitate the relocation of their transferees. The following selected case studies illustrate the benefits of our tailored technology enabled solutions, which we believe helps us win business with leading global corporations:
| Global Software Company | Customer’s Need
• Customer wanted to improve their process to request and compute cost estimates, route approvals and create an executive’s transfer agreement
SIRVA’s Solution
• Developed a self-service web portal to facilitate the policy selection, approval and cost estimation process that:
• Improves accuracy and quality of analytics
• Provides full process tracking of data and financials
• Is secure and easy to administer
• Utilizes a Software-as-a-Service model with an annual subscription fee
• Key reason for human resources department to select SIRVA for RFP
• New product technology can be “resold” to other customers | |
| Global Industrial Conglomerate | Customer’s Need
• Customer required assistance tracking the tax and immigration status for hundreds of project assignees
SIRVA’s Solution
• SIRVA consulted on the optimal mobility policy
• Created a middleware IT operating system connecting the corporation’s human resources systems and SIRVA
• Developed an operating system for immigration, taxes, expenses and project management for transferees
• The system manages operations and interactions between all parties for accountability and ensures compliance for tax and immigration
• Software-as-a-Service model with an annual subscription fee
• Customer shares in development costs | |
96
Table of Contents
Technology for Transferees and Consumers
We have a well-developed proprietary and scalable software-as-a-service system, including iMove.com, our mobile task manager, and LumpSum Xpress Marketplace (described below), to support our operations and provide 24/7 global support to our customers. Additionally, we have developed a large variety of applications, including online needs assessments, personal task managers, electronic expense submission and management, message center, household goods tracking, applications for iPhone and Android, digital journal, policy documents and destination tools, to help transferees and consumers better manage their process.
Technology for Agents/Franchises and Suppliers
We have developed sophisticated technology solutions for our agents, franchises and third-party providers. Our Leads, Appointments and Bookings platform (“QLAB”) provides a portal to manage the entire order lifecycle from the lead at the first customer contact through the entire sales process until the customer accepts the order. For example, QLAB facilitates the in-home survey of household goods by our agents and provides dynamic pricing information for moves. We also utilize logistics systems, which allow us to maximize the capacity of our network and optimize work streams.
New Products and Innovation
LumpSum Xpress Marketplace
In October 2013, we launched our LumpSum Xpress Marketplace, an online portal for relocation and moving services, which enables corporate transferees to easily manage their lump sum benefits online and enables human resources departments to administer their lump sum programs. LumpSum Xpress Marketplace offers employees the information they need to relocate in one convenient location and also provides access to premier vendors that provide high quality service. Within the portal, employees can manage their lump sum benefits with tools that enable enhanced expense management and greater transparency into their spending. Human resources departments can gain clarity into employee lump sum spending, allowing them to refine their mobility policies and reimbursement amounts to reflect true costs. Additionally, the portal simplifies corporate reporting and reduces administrative paperwork by enabling companies to authorize and deliver services before employees are on payroll, which improves the employee’s onboarding experience.
We expect that LumpSum Xpress will enable us to expand beyond the employees of our corporate customers to address the needs of consumers. The portal offers a comprehensive database of relocation and moving services and provides consumers with an opportunity to implement a relocation independently.
Other Technology Initiatives
Our other technology initiatives include enhancements to our internal operating systems and software infrastructure. We have developed QLAB, our sales management software, to centralize pricing and improve our pricing effectiveness. We are focused on introducing new processes and IT systems to upgrade our capabilities and achieve cost reductions and improve productivity.
Our Customers
We have more than 1,800 customers, consisting of a diverse mix of leading multinational, national, mid-sized regional corporations and government institutions. We also provide services to many consumers. During 2013, our customers generated an aggregate of almost $2.0 billion in revenue in approximately 170 countries, with no single customer accounted for more than 2.4% of our total revenue in 2013 and our top ten customers accounted for approximately 12% of our total revenue in 2013. We believe that our focus on providing flexible and highly customized solutions to our customers enables us to develop long-standing relationships, reflected in a retention rate of over 98% from 2011 to 2013 for our corporate customers in our Mobility Solutions segment.
97
Table of Contents
Corporate
We have more than 1,800 corporate and government institution customers. We have renewable contracts with our corporate and government institution customers, with terms typically ranging from one to four years. Certain of our contracts provide that we are the exclusive provider of mobility services to such customer. Our customer base is well-diversified across a large number of industries, including energy, professional services, financial institutions, technology, specialty chemicals, automotive, aerospace and defense and business services, with no more than 8% of our total revenue coming from one industry in 2013. Services provided to corporate customers and government institutions accounted for approximately 71% of our total revenue in 2013.
Employees and Consumers
Our employee and consumer customers are comprised primarily of employees of corporations who receive a lump sum amount for reimbursement of relocation expenses, as opposed to comprehensive relocation services. Some corporations provide a list of mobility companies that their employees can use to select a mobility services provider. In 2013, services provided to employees and consumers accounted for approximately 29% of our total revenue. Services to these customers are typically provided on a non-contractual basis, but they are not required to use a particular provider.
In 2013, we launched our LumpSum Xpress Portal which is an online marketplace for relocation and moving services and helps consumers find services throughout every stage of their relocation process. We believe that the introduction of the portal will enable us to not only attract new business from the employees of our corporate customers, but also increase demand for our services among independent consumers. Additionally, we have been expanding into new adjacent markets, including moving storage and containerization, to offer a broad range of moving and relocation services to consumers.
Government Agencies
We provided relocation and mobility services to 45 state and federal government agencies in the United States in 2013. We believe there are growth opportunities for these customers, including the DEA, DOD and other government agencies. Services provided to government agencies accounted for approximately 8.7% of total global initiations in 2013.
Risk Management
Risk management is a critical aspect of our business. Since 2008 we have developed and implemented new policies for assisting employees with their real estate transactions that are designed to minimize the time period that we hold a home in inventory, and, as a result, we believe we have reduced our risk profile. As part of our mobility solutions services, we assist transferees in the buying and selling of homes and also provide assistance with mortgage originations.
We offer a premium home sale assistance program to a select number of transferees. As part of this program, we are required to take a home into inventory if the home is not purchased by a third party in a predetermined amount of time. The home remains in inventory until we can close on the home sale with a third-party buyer. As of December 31, 2013, we had 29 homes in inventory that were not already under contract to be sold.
We also originate mortgages through our affiliate, SIRVA Mortgage, Inc. This service was established to serve the transferees of our customers. We are not in the business of retaining or managing mortgage portfolios. Our model is to originate and fund the mortgages using a warehouse line of credit and then sell the loan to investors, primarily banks. We are responsible for the proper underwriting of the loans we originate. This requires the proper documentation and ensuring the accuracy of information used to make the loans. We have built and implemented processes and procedures, employ loan origination software and use various other loan
98
Table of Contents
compliance programs in our business to facilitate and manage all of our loan processes, including origination, underwriting, post-closing and secondary market activity. These processes are designed to ensure our loans are originated in compliance with proper underwriting standards and the numerous laws and regulations on both the federal and state level that impact the mortgage lending business. Our work is subject to regular audit and review by state regulators, our warehouse banks and the investors to whom we sell our loans. If loans are not properly underwritten, we may be required to repurchase them. In order to mitigate the risk of mortgage put-backs from certain mortgages that we previously sold, we entered into agreements with our largest investors. These settlement agreements prevent the investor from demanding put-backs for loans originated and sold in a defined period when there is a default on the underlying loan and the investor claims there was an underwriting deficiency.
Competition
We compete with a limited number of global providers, as well as a highly fragmented set of single service providers. Our top competitors for large multi-national corporations include Cartus Corporation, Brookfield Global Relocation Services and Weichert Relocation Resources. We also compete with single service providers, including a wide variety of real estate brokers, moving companies, accounting firms, mortgage firms, destination service providers and business process outsourcing firms. Our Allied and northAmerican agent networks compete in the United States and Canada with Unigroup Inc. (the operator of United Van Lines LLC and Mayflower Transit, LLC), Atlas World Group, Graebel Companies, Inc. and Wheaton Van Lines, Inc. Our agent network also faces competition from smaller independent movers, self-storage and self-haul service providers. In addition, in international markets our competitors include the Asian Tigers Group, Crown Relocations, Grace Removals Group, Santa Fe Transports Intl. Ltd, Sterling International Group and WridgWays. The most significant competitive factors in this segment are integration of services, quality of the transferee experience, global and local presence, scope of expertise, scalability and cost competitiveness.
Sales and Marketing
Go-To-Market Strategy
We use a disciplined sales process and a targeted marketing effort focused on increasing the quality and quantity of our corporate pipeline, increasing RFP win rates and improving our lead generation capabilities. Our go-to-market strategy positions us as a strategic partner to corporate human resources departments, which we believe are the primary decision makers for selecting mobility services providers. We highlight the benefits of our global reach, deep domain expertise and asset-light operating model for both corporations and transferees. Our sales and marketing teams are focused on large multi-national corporations, mid-size and small corporations, and consumers. Our marketing efforts are aligned with the customers buying process.
| • | Large Corporations: |
| • | Direct Sales Force. Our direct sales force focuses on large multi-national, mid-sized and small corporations. We market directly to large corporations across a broad range of industries and geographies. We also segment our sales force by target industry to align our sales and marketing experience with the specific needs of an industry. In addition, we also work closely with our agents/franchises to sell to corporations where they have personal relationships. |
| • | Market and Branding Campaigns. We launched several global branding campaigns over the last four years that targeted Fortune 1,000 and Fortune Global 500 corporations. We also recently launched a new global branding campaign that was designed to better communicate our benefits to potential customers. The campaign was supported by market research that better defined attractive industry segments, as well as our target buyer’s needs and purchasing habits. We have also recently launched branding campaigns to increase our brand awareness and demand in the consumer market. |
99
Table of Contents
| • | Medium Sized Corporations: |
| • | Agent/Franchise Sales Force. Our agent/franchise sales force collaborates with our direct sales force to sell mobility services to mid-size and smaller companies, both domestically and internationally. We do not segment these markets by target industry. Our go-to-market strategy aims to establish continuity and maximize our market presence. |
| • | Individuals |
| • | Internet Lead Generation. We also have an internet lead generation capability targeting the consumer market that contributed over 550,000 leads in 2013. |
Recent Sales and Marketing Initiatives
In 2013, we engaged in more active RFPs than in prior years and our RFP win rate has increased as a result of the signing of 41 new U.S. and Canadian corporate relocation customers. In addition, we anticipate that the following initiatives will enable us to maintain a successful RFP process in the future and will provide opportunities for continued growth.
| • | New Sales Strategy. We developed a new global sales strategy and the supporting sales RFP presentation materials with improved content and stronger sales messaging. The upgraded strategy is designed to better communicate the value of our technology platform, service approach and global network and positions us as a better mobility partner to corporate customers. |
| • | Targeted Marketing Efforts. In order to improve our win rate with corporations that have an incumbent service provider, we have implemented a number of targeting efforts. These efforts include gathering critical information in order to proactively target potential customers in their buying window, offering creative programs to overcome the obstacles of switching mobility providers, and developing sales strategies and plans for our target accounts. |
| • | Upgraded Sales Force. We added new sales capabilities and resources to North America, Europe, Asia, the Middle East and South America, improved our training program to develop more effective selling practices, and enhanced our management of our regional sales force through SalesForce’s sales dashboard. Our upgraded sales force enables us to better support the RFP process in Asia and Europe from the United States. |
| • | New Agent/Franchise Lead Process. We implemented a new agent/franchise lead process that we believe enhances lead generation opportunities and improves our sales collaboration with our agents. We are assisting the sales teams at agents/franchises to improve their selling capabilities. |
| • | Improved “Best and Final” Bid Process. We strengthened the implementation and preparation of our best and final bid process by improving our preparation sessions, bringing key executives into best and final bid process, and creating a best and final bid team of subject matter experts to support large RFPs in the United States and Europe. |
| • | New Sales Approach. We deployed a new sales approach aimed at educating potential customers about our value proposition several months before their current contracts expire. This approach involves our senior executives who consult with the potential customers’ human resources executives as to how to improve the deployment of key employee personnel and better support their mobility-related human resource goals. In Asia and Europe we host workshops for expatriates in order to convey how our services can improve their mobility experiences. We also conduct training seminars in Asia, the Middle East, South America and other emerging market to further expand knowledge of our services and capabilities. |
| • | New CCO. We hired a new Chief Commercial Officer, Linda Smith, in 2012. Ms. Smith was previously a senior sales executive at Xerox and other large companies. |
100
Table of Contents
Government Regulation
Our mortgage origination operations provided as part of our home sale and home purchase assistance services are heavily regulated. We are subject to federal, state and local laws that regulate and restrict the manner in which we operate in the residential mortgage industry, including Real Estate Settlement Procedures Act, the Truth in Lending Act and the Home Mortgage Disclosure Improvement Act. In addition, the passage of the Dodd-Frank Act has increased, and will continue to increase, regulation of the mortgage industry, including: generally prohibiting lenders from making residential mortgage loans unless a good faith determination is made of a borrower’s creditworthiness based on verified and documented information; requiring the CFPB to enact regulations to help assure that consumers are provided with timely and understandable information about residential mortgage loans that protect them against unfair, deceptive and abusive practices; and requiring federal regulators to establish minimum national underwriting guidelines for residential mortgages that lenders will be allowed to securitize and sell to third-party investors without retaining any of the loans’ default risk.
Our Mobility Networks segment is regulated by the Surface Transportation Board and the Federal Motor Carrier Safety Administration, which are independent agencies within the U.S. Department of Transportation. The Surface Transportation Board has jurisdiction similar to the former Interstate Commerce Commission over such issues as rates, tariffs, antitrust immunity and undercharge and overcharge claims. The Department of Transportation, and in particular the Federal Motor Carrier Safety Administration, also has jurisdiction over such matters as safety, the registration of motor carriers, freight forwarders and brokers, insurance (financial responsibility) matters, financial reporting requirements and enforcement of leasing and loading and unloading practices.
In addition, we are subject to federal and state laws governing consumer privacy, such as the Gramm-Leach-Bliley Act and the Affiliated Marketing Rule.
Employees
As of December 31, 2013, we had approximately 2,700 total employees. Of our total employees, 1,485 were based in the United States and Canada in our Mobility Solutions and Mobility Networks segments, 550 employees were in our Europe, Asia and Emerging Markets segment and 706 were in our Australia segment. None of our employees are represented by a union, and we have no labor-related work stoppages. We believe that we have a good relationship with our employees.
Properties
Our corporate headquarters is located in an approximately 52,400 square foot facility at One Parkview Plaza, Oakbrook Terrace, Illinois, and is leased under an agreement expiring in November 2024. In addition, we own executive and administrative office space at 5001 U.S. Highway 30 West, Fort Wayne, Indiana. We do not own any other real property.
As of November 30, 2013, we held lease obligations for over 70 properties throughout North and South America, Australia and New Zealand, Asia, the Middle East and Europe. The following chart reflects the locations of our lease obligations. All leased properties used in our operations consist of administrative offices, warehouses and distribution facilities.
| Location |
Number of Lease Obligations |
|||
| North and South America |
13 | |||
| Australia and New Zealand |
34 | |||
| Asia |
26 | |||
| Middle East |
4 | |||
| Europe |
1 | |||
101
Table of Contents
We believe that our offices, warehouse and distribution facilities are generally well maintained and suitable to support our current and planned business needs.
Seasonality
Our business segments are subject to seasonal fluctuations. Revenue for our Mobility Solutions, Mobility Networks and Europe, Asia and Emerging Markets segments is generally higher in the second and third quarters of the calendar year, while revenue in our Australia segment is typically higher in the first and fourth quarters, corresponding to the summer months in each hemisphere. A significant portion of the expenses we incur, such as PTE and cost of homes sold, are directly related to the number of mobility initiations that occur in a given period and vary with revenue. However, certain of our other expenses, such as interest payments, facilities costs and certain personnel-related costs, are fixed and cannot be increased or reduced to match the seasonal changes. Consequently, our net income is generally higher in the second and third quarter of each year.
Legal Proceedings
We are involved in certain claims and legal actions arising in the ordinary course of our business. Such litigation and other proceedings may include, but are not limited to, actions relating to the conduct of, and accidents involving, our agents and their drivers. Such claims often relate to accidents that have, and in the future may result, in serious injuries or the loss of lives. While the results of such claims and legal actions cannot be predicted with certainty, we do not believe based on information currently available to us that the final outcome of these proceedings will have a material adverse effect on our business, financial condition or results of operations.
102
Table of Contents
Executive Officers and Directors
The following table sets forth the names and ages, as of March 1, 2014, of the individuals who serve as our directors, executive officers and key employees.
| Name |
Age |
Position | ||||
| Wes Lucas |
50 | Chief Executive Officer and Director | ||||
| Thomas Oberdorf |
56 | Chief Financial Officer | ||||
| Jason Birnbaum |
42 | Chief Technology Officer | ||||
| Linda Smith |
56 | Chief Commercial Officer | ||||
| Deborah Balli |
51 | President, Relocation Services | ||||
| Andrew Coolidge |
42 | Chief Operating Officer, Moving Services | ||||
| Bill Lyon |
48 | President, Agent Networks | ||||
| Jacob George |
42 | President, Asia and Middle East | ||||
| Mike Filipovic |
53 | President, Australia and New Zealand | ||||
| Dennis Thompson |
54 | Chief Accounting Officer | ||||
| Margaret Pais |
53 | Executive Vice President, Human Resources | ||||
| Lawrence Bossidy |
79 | Chairman and Director | ||||
| Ellen Havdala |
48 | Director | ||||
| Douglas C. Laux |
61 | Director | ||||
| Mats Lindstrand |
55 | Director | ||||
| Ryan McCarthy |
37 | Director | ||||
| Gerald Parsky |
71 | Director | ||||
| Mark Sotir |
50 | Director | ||||
| John D. Watkins, Jr. |
53 | Director | ||||
Wes Lucas is our Chief Executive Officer, a position he has held since July 2008. Prior to this position, Mr. Lucas was a co-founder of BioMass Capital, a renewable energy company, from 2007 to 2008, and continues as a Director of BioMass Capital AB. Prior to this position, Mr. Lucas was the Chief Executive Officer of Quebecor World Inc. from 2006 to 2007, an entity that filed for protection under Chapter 11 of the U.S. Bankruptcy Code in 2008. Mr. Lucas was the Chairman, Chief Executive Officer and President from 2001 to 2006 of Sun Chemical Corporation. Mr. Lucas’ past experience also includes working at AlliedSignal and McKinsey & Company. Mr. Lucas received a B.S. in finance and accounting from the University of California, Berkeley and an MBA from Harvard Business School. Mr. Lucas was elected to serve on our board of directors due to being a seasoned executive with experience in a variety of senior roles at global Fortune 500 corporations as well as high-tech growth companies.
Thomas Oberdorf is our Chief Financial Officer, a position he has held since August 2011. Prior to this position, Mr. Oberdorf was a consultant from August 2010 to March 2011 for Orchards Brand Corporation. Mr. Oberdorf was the Executive Vice President and Chief Financial Officer of Infogroup, Inc. from December 2008 to July 2010 and prior to that position, Mr. Oberdorf was Chief Financial Officer of Getty Images, Inc. Mr. Oberdorf also serves as a director of UFP Technologies.
Jason Birnbaum is our Chief Technology Officer, a position he has held since August 2011. Prior to this position, Mr. Birnbaum was Chief Information Officer of the Global Supply Chain of GE Healthcare, a position he held from 2009 to 2011. Mr. Birnbaum is a 16-year veteran of GE, holding multiple CIO and technology positions in the Consumer and Industrial and Healthcare divisions.
Deborah Balli is our President of Relocation Services, a position she has held since June 2008. Prior to this position, Ms. Balli was our Senior Vice President of Operations of Relocation Services from 2007 to 2008.
103
Table of Contents
Ms. Balli joined the Company in 1996 and has held various leadership roles at the Company, including as general manager and business unit director. Ms. Balli holds the Employee Relocation Council’s Certified Relocation Professional and Global Mobility Specialist designations.
Andrew Coolidge is our Chief Operating Officer of Moving Services, a position he has held since December 2012. Prior to this position, Mr. Coolidge was Executive Vice President of Moving Services from September 2009 to December 2012. From December 2007 to August 2009, Mr. Coolidge was Vice President and General Manager of our international moving business. Mr. Coolidge has previous experience at Sears Roebuck & Company, where he held multiple positions.
Bill Lyon is our President of Agent Networks, a position he has held since December 2012. Prior to this position, Mr. Lyon was Vice President and General Manager of Allied Van Lines from October 2008 to December 2013 and Vice President of Operations of SIRVA from 2000 to 2008. Mr. Lyon has worked in the moving industry for approximately 30 years.
Jacob George is our President of Asia and Middle East, a position he has held since December 2011. Prior to this position, Mr. George was Senior Vice President, Asia of Cartus Corporation from 2010 to 2011. Mr. George has previous experience working for Primacy, LLC as the President of Asia from 2007 to 2010.
Mike Filipovic is our President of Australia and New Zealand, a position he has held since November 2005. Prior to this position, Mr. Filipovic was Chief Financial Officer, Asia Pacific from 2002 to 2005. Mr. Filipovic’s past experience includes working at Motorola Australia, BHP Biliton and Franklin Mint.
Linda Smith is our Chief Commercial Officer, a position she has held since April 2012. Prior to this position, Ms. Smith was Vice President of Ricoh Global Services and Area Vice President of Field Sale Operations from 2009 to March 2012. Ms. Smith has also held various executive positions at Xerox Corp, including Vice President and General Manager of Field Sales Operations, National Vice President of National Agent Channel Marketing and Vice President of United States Marketing.
Dennis Thompson is our Chief Accounting Officer, a position he has held since March 2013. Prior to this position, Mr. Thompson served as our Chief Financial Officer of Moving Services, North America from April 2010 to March 2013, and Vice President of Financial Planning and Analysis from August 2007 to April 2010.
Margaret Pais is our Executive Vice President, Human Resources, a position she has held since March 2009. Prior to this position, Ms. Pais was Vice President of Human Resources for Relocation from May 2006 to March 2009. Ms. Pais has also held human resources positions in technology companies, including Dell, Inc.
Lawrence Bossidy has served as Chairman and director since February 2013. Mr. Bossidy is currently a member of Aurora’s outside Advisory Board, a position that he has held since 2004. Previously, Mr. Bossidy was Chairman and Chief Executive Officer of Honeywell International. Prior to this position Mr. Bossidy served as Chairman and Chief Executive Officer of AlliedSignal. Mr. Bossidy’s past experience includes working at General Electric. Mr. Bossidy also serves as a director of Berkshire Hills Bancorp and chairman and director of Dubois, Inc. Mr. Bossidy holds a B.A. degree from Colgate University. Mr. Bossidy was elected to serve on our board of directors due to his extensive experience as an executive and his affiliation with Aurora.
Ellen Havdala has served as a director since February 2013. She is a Managing Director of Chai Trust Company, the family office of Sam Zell, a position she has held since November 2013. Ms. Havdala has worked in a variety of capacities for Zell’s affiliated companies since 1990. From 2010 to 2013, Ms. Havdala served on the board of Rewards Network. From 2003 to 2012, Ms. Havdala served on the board of WRS Holding Company. Prior to her present role, Ms. Havdala served as a Managing Director at Equity Group Investments, a division of Chai Trust Company. Previously, Ms. Havdala served as Vice President of Scott Sports Group, Inc., and as Executive Vice President at Equity International. Ms. Havdala holds an A.B. from Harvard College.
104
Table of Contents
Ms. Havdala was elected to serve on our board of directors due to her extensive restructuring experience and her affiliation with EGI.
Douglas C. Laux has been a director since May 2008. Mr. Laux currently serves as the Chief Financial Officer of InterAct Public Safety Systems, a position he has held since January 2011. Prior to this position, Mr. Laux was the Chief Financial Officer Remy International from October 2008 to November 2010. Mr. Laux previously served in Chief Financial Officer positions at EaglePicher and ANC Rental Corporation. Mr. Laux also currently serves on the board of directors and as chairman of the audit committee of R.J O’Brien & Associates LLC. Mr. Laux holds a B.S. degree in Accountancy from the University of Illinois. Mr. Laux was elected to serve on our board of directors due to his senior level of experience serving in chief financial officer positions.
Mats Lindstrand has been a director since February 2013. Mr. Lindstrand is currently the Managing Partner and Founder of BioMass Capital AB, a renewable energy company headquartered in Stockholm Sweden, having founded the firm in 2007. Prior to this position, Mr. Lindstrand was a Director at McKinsey & Company in Europe, where he was a consultant for 21 years, joining the firm in 1987. Mr. Lindstrand held several leadership positions at McKinsey & Company, including the Global Practice Leader for Basic Materials from 2004 to 2008, and also for Forest Products from 1996 to 2004. In addition to BioMass Capital, Mr. Lindstrand has built several other businesses, including Sensec AB, a leading security system company. Mr. Lindstrand also currently serves on the board of directors of BioMass Capital AB, Papyrus AB, and EA group. Mr. Lindstrand holds an Masters in Civil Engineering from the Royal Institute of Technology in Sweden, and an MBA from Columbia Business School. Mr. Lindstrand was elected to serve on our board of directors due to his experience with growing companies and his relationships with European corporations.
Ryan McCarthy has been a director since February 2013. Mr. McCarthy is currently a Partner at Aurora Resurgence, having joined the firm in 2007 as a founding member. Previously, Mr. McCarthy was a Senior Director at Alvarez & Marsal where he served in numerous interim management positions providing turnaround management to underperforming businesses. Prior to Alvarez & Marsal, Mr. McCarthy worked in the Global Energy and Power Group in the investment banking division of Banc of America Securities. Mr. McCarthy also currently serves on the board of directors of Aurora Resurgence control investments, including Alltub SAS (a global cosmetic packaging company) and TOPS Parking and International Cookware Group. Mr. McCarthy holds a B.S. degree in Accounting and Finance from the Kelley School of Business at Indiana University. Mr. McCarthy was elected to serve on the board of directors due to his experience in both turning around and growing companies and due to his affiliation with Aurora.
Gerald Parsky has been a director since February 2013. Mr. Parsky is currently the Chairman of Aurora Capital Group, which he founded in 1991. Mr. Parsky’s past experience includes working as the Assistant Secretary of the Treasury for International Affairs and as a Senior Partner at the law firm of Gibson, Dunn and Crutcher LLP. Mr. Parsky also currently serves on the board of directors of The Irvine Company. Mr. Parsky holds an A.B. degree from Princeton University and a J.D. from the University of Virginia Law School. Mr. Parsky was elected to serve on our board of directors due to his extensive experience in investment advisory services and his affiliation with Aurora.
Mark Sotir has been a director since June 2010. He is a Managing Director at Equity Group Investments, a division of Chai Trust Company. Since 2013, Mr. Sotir has served as Executive Chairman of the board of Exterran Holdings, Inc. Previously, Mr. Sotir served as Director and Executive Vice Chairman from 2011 to 2013 of Exterran’s board. Since 2013, Mr. Sotir has been the Chairman of Veridiam. Since 2008, Mr. Sotir has served as Chairman of Rewards Network Inc. Mr. Sotir’s other board directorships have included: WRS Holding Company from 2008 to 2013, Middlebrook Pharmaceuticals from 2008 to 2010, and VIA Wines Group from 2007 to 2011. From 2007 to 2008, Mr. Sotir served as the interim President of Tribune Interactive, a division of Tribune Company, which filed for protection under Chapter 11 of the U.S. Bankruptcy Code in December 2008. In this role, he served on the boards of CareerBuilder, Cars.com, QuadrantOne and Metromix. Before joining
105
Table of Contents
EGI in 2006, Mr. Sotir was the Chief Executive Officer of Sunburst Technology Corporation. He was also the President of Budget Group, Inc. Mr. Sotir holds an MBA from Harvard Business School and a B.A. from Amherst College. Mr. Sotir was elected to serve on our board of directors due to his experience as a seasoned executive and his affiliation with EGI.
John D. Watkins, Jr. has been a director since September 2012. Mr. Watkins is currently the Chief Executive Officer of ASC Fine Wines-China, which he joined in October 2012. Prior to this position, Mr. Watkins served as President and Chief Executive Officer of GE AVIC Civil Avionics Systems Company, Ltd. from 2010 to 2012. Mr. Watkins’ past experience includes multiple positions at Cummins Inc.-East Asia, Cummins China Investment Co. from 2003 to 2009. Mr. Watkins holds a B.S. from Miami University and an M.S. from Stanford University Graduate School of Business. Mr. Watkins was elected to serve on our board of directors due to his senior level of experience as an executive, and due to his relationships in Asia as a result of being the Chairman of the American Chamber of Commerce in China from 2009 to 2010.
Board of Directors
Our business and affairs are managed under the direction of our board of directors. Upon the completion of this offering, our amended and restated bylaws will provide that our board of directors will consist of between and directors. Upon the consummation of this offering, our board of directors will be composed of directors. Our executive officers and key employees serve at the discretion of our board of directors.
Controlled Company Exception
After the completion of this offering, affiliates of Aurora will continue to beneficially own shares representing more than 50% of the voting power of our shares eligible to vote in the election of directors. As a result, we will be a “controlled company” for purposes of the rules of the NYSE or Nasdaq. Under these corporate governance standards, a company of which more than 50% of the voting power for the election of directors is held by an individual, group or another company is a “controlled company” and may elect not to comply with certain corporate governance standards, including the requirements (1) that a majority of our board of directors consist of independent directors, (2) that our board of directors have a compensation committee that is comprised entirely of independent directors, (3) that our director nominees are selected, or recommended for selection by the board of directors, either by (a) independent directors constituting a majority of the board’s independent directors in a vote in which only independent directors participate or (b) a nominating and corporate governance committee comprised solely of independent directors and (4) an annual performance evaluation of the nominating and corporate governance and compensation committees. For at least some period following this offering, we intend to utilize these exemptions. As a result, although we will have a fully independent audit committee and have independent director representation on our compensation and nominating and corporate governance committees upon closing this offering, immediately following this offering we do not expect the majority of our directors will be independent or that our compensation committee or nominating and corporate governance committee will be comprised entirely of independent directors. Accordingly, although we may transition to fully independent compensation and nominating and corporate governance committees prior to the time we cease to be a “controlled company,” for such period of time you will not have the same protections afforded to stockholders of companies that are subject to all of these corporate governance requirements. In the event that we cease to be a “controlled company” and our shares continue to be listed on the NYSE or Nasdaq, we will be required to comply with these provisions within the applicable transition periods. The controlled company exemption does not modify the independence requirements for the audit committee, and we are in compliance with the requirements of the Sarbanes-Oxley Act and the NYSE or Nasdaq rules, which require that our audit committee be composed of at least three members, one of whom will be independent upon the listing of our common stock on the NYSE or Nasdaq, a majority of whom will be independent within 90 days of the date of this prospectus and each of whom will be independent within one year of the date of this prospectus.
106
Table of Contents
Director Independence
Our board of directors has affirmatively determined that and are independent directors under the applicable rules of the NYSE and Nasdaq and as such term is defined in Rule 10A-3(b)(1) under the Exchange Act. In accordance with the NYSE and Nasdaq corporate governance rules, a majority of our directors will be independent within specified periods from the effective date of our registration statement for this offering.
Board Committees
Our board of directors has the authority to appoint committees to perform certain management and administration functions. Upon the consummation of this offering, our board of directors will have three committees: the audit committee, the compensation committee and the nominating and corporate governance committee.
Audit Committee
The primary purpose of our audit committee is to assist the board’s oversight of:
| • | the adequacy integrity of our financial statements; |
| • | our internal financial reporting and compliance with our disclosure controls and procedures; |
| • | the qualifications, engagement, compensation, independence and performance of our independent registered public accounting firm; |
| • | our independent registered public accounting firm’s annual audit of our financial statements and any engagement to provide other services; |
| • | the performance of our internal audit function; |
| • | our legal and regulatory compliance; and |
| • | the application of our codes of business conduct and ethics as established by management and the board. |
Upon the consummation of this offering, , and will serve on the audit committee. will serve as chairman of the audit committee and also qualifies as an “audit committee financial expert” as such term has been defined by the SEC in Item 401(h)(2) of Regulation S-K. Our board of directors has affirmatively determined that meets the definition of an “independent director” for the purposes of serving on the audit committee under applicable SEC and NYSE or Nasdaq rules, and we intend to comply with these independence requirements for all members of the audit committee within the time periods specified therein. The audit committee is governed by a charter that complies with the rules of the NYSE or Nasdaq.
Compensation Committee
The primary purposes of our compensation committee are to:
| • | oversee our executive compensation policies and practices; |
| • | review and determine the compensation of our executive officers (including our chief executive officer); |
| • | provide oversight of our compensation policies, plans and benefit programs including reviewing, and approving all equity incentive plans, policies and programs; and |
| • | approve and recommend to the board of directors reports on compensation matters required to be included in our annual proxy statement or annual report. |
107
Table of Contents
Upon the consummation of this offering, , and will serve on the compensation committee, and will serve as the chairman. Our board of directors has affirmatively determined that meets the definition of an “independent director” for the purposes of serving on the compensation committee under applicable NYSE or Nasdaq rules, and we intend to comply with these independence requirements for all members of the compensation committee within the time periods specified therein. The compensation committee is governed by a charter that complies with the rules of the NYSE or Nasdaq.
Nominating and Corporate Governance Committee
The primary purposes of our nominating and corporate governance committee are to:
| • | recommend to the board of directors for approval the qualifications, qualities, skills and expertise required for board of directors membership; |
| • | identify potential members of the board of directors consistent with the criteria approved by the board and select and recommend to the board the director nominees for election at the next annual meeting of stockholders or to otherwise fill vacancies; |
| • | evaluate and make recommendations regarding the structure, membership and governance of the committees of the board of directors; |
| • | develop and make recommendations to the board with regard to our corporate governance policies and principles; and |
| • | oversee the annual review of the board of directors’ performance. |
Upon the consummation of this offering, , and will serve on the nominating and corporate governance committee, and will serve as the chairman. Our board of directors has affirmatively determined that meets the definition of an “independent director” for the purposes of serving on the nominating and corporate governance committee under applicable NYSE or Nasdaq rules, and we intend to comply with these independence requirements for all members of the nominating and corporate governance committee within the time periods specified therein. The nominating and corporate governance committee is governed by a charter that complies with the rules of the NYSE or Nasdaq.
Compensation Committee Interlocks and Insider Participation
None of our executive officers serves, or in the past year has served, as a member of the compensation committee (or other committee performing equivalent functions) of any entity that has one or more executive officers serving on our board of directors or compensation committee. No interlocking relationship exists between any member of the compensation committee (or other committee performing equivalent functions) and any executive, member of the board of directors or member of the compensation committee (or other committee performing equivalent functions) of any other company.
Code of Business Conduct and Ethics
We have adopted a code of business conduct and ethics that applies to all of our employees, officers and directors, including those officers responsible for financial reporting. These standards are designed to deter wrongdoing and to promote honest and ethical conduct. The code of business conduct and ethics will be available on our web site at www.sirva.com. Any waiver of the code for directors or executive officers may be made only by our board of directors and will be promptly disclosed to our stockholders as required by applicable U.S. federal securities laws and the corporate governance rules of the NYSE or Nasdaq. Amendments to the code must be approved by our board of directors and will be promptly disclosed (other than technical, administrative or non-substantive changes). Any amendments to the code, or any waivers of its requirements, will be disclosed on our website.
108
Table of Contents
Corporate Governance Guidelines
Our board of directors will adopt corporate governance guidelines in accordance with the corporate governance rules of the NYSE or Nasdaq, as applicable, that serve as a flexible framework within which our board of directors and its committees operate. These guidelines will cover a number of areas including the size and composition of the board, board membership criteria and director qualifications, director responsibilities, board agenda, roles of the Chairman of the board, Chief Executive Officer and presiding director, meetings of independent directors, committee responsibilities and assignments, board member access to management and independent advisors, director communications with third parties, director compensation, director orientation and continuing education, evaluation of senior management and management succession planning. A copy of our corporate governance guidelines will be posted on our website.
Indemnification of Officers and Directors
Our amended and restated bylaws provide that we will indemnify our directors and officers to the fullest extent permitted by the General Corporation Law of the State of Delaware (the “DGCL”). We have established directors’ and officers’ liability insurance that insures such persons against the costs of defense, settlement or payment of a judgment under certain circumstances.
Our amended and restated certificate of incorporation provides that our directors will not be liable for monetary damages for breach of fiduciary duty, except for liability relating to any breach of the director’s duty of loyalty, acts or omissions not in good faith or which involve intentional misconduct or a knowing violation of law, violations under Section 174 of the DGCL or any transaction from which the director derived an improper personal benefit.
109
Table of Contents
EXECUTIVE AND DIRECTOR COMPENSATION
The following discussion and analysis of compensation arrangements should be read with the compensation tables and related disclosures set forth below. This discussion contains forward-looking statements that are based on our current plans and expectations regarding future compensation programs. Actual compensation programs that we adopt may differ materially from the programs summarized in this discussion.
Compensation Discussion and Analysis
This section explains the objectives and design of our executive compensation program and our compensation-setting process. It provides qualitative information regarding the manner in which compensation is earned by our executive officers and explains the decisions we made for compensation with respect to 2013 for each of the named executive officers listed below.
Named Executive Officers
For 2013, our named executive officers were:
| • | Wes Lucas, President and Chief Executive Officer; |
| • | Tom Oberdorf, Executive Vice President and Chief Financial Officer; |
| • | Deborah Balli, Executive Vice President, President of Global Relocation Services; |
| • | Linda Smith, Executive Vice President and Chief Commercial Officer; and |
| • | Jacob George, Executive Vice President, President of Asia and Middle East |
Overview
The compensation committee of our board of directors oversees our executive compensation program and determines the compensation of our executive officers, including our named executive officers. The compensation committee consists of two members, each of whom are nominees of Aurora and EGI. Following this offering, the compensation committee of our board of directors will continue to oversee our executive compensation program. We also intend to develop and maintain a compensation framework that is appropriate and competitive for a public company. Therefore, although we currently do not intend to alter our compensation objectives, other than as described herein, following this offering, our compensation committee may establish executive compensation objectives and programs that are different from those currently in place.
Objectives and Design
Our executive compensation program is designed to meet the following objectives:
| • | Attract and retain executive officers who contribute to our overall success; |
| • | Align compensation with our business goals, strategy and results; and |
| • | Motivate and reward high levels of performance. |
These objectives collectively seek to link compensation to our overall performance, which helps to ensure that the interests of our executives are aligned with the interests of our stockholders. These objectives serve as guiding principles in our compensation program design.
Our compensation philosophy generally is to set our target total compensation (base salary, annual cash incentives and long-term incentives) at a competitive market rate for similarly situated individuals at companies we consider to be our peers and competitors for talented individuals, such as our executives. In addition, our
110
Table of Contents
compensation philosophy is guided by our leadership behaviors. We believe that our success is dependent on our executive officers demonstrating these traits. Our leadership traits are:
| • | Delivers Results—Sets challenging stretch goals, then meets or exceeds those commitments and takes ownership for delivering results. |
| • | Manages the Customer Experience—Works to provide superior value to the customer, making each interaction a positive one. |
| • | Exercises Good Business Judgment—Possesses a clear sense of direction, focusing on key priorities, balancing both short and long term goals. |
| • | Leads People Effectively—Thinks and acts like a leader regardless of position. Retains the key talent across the organization and hires key new talent. |
| • | Team Culture— Trust-based, inclusive group with all members working together as a global, seamless team. Communicates candidly, openly, and frequently; viewed as truthful and credible both internally and externally. Builds high performance teams. |
| • | Leads Organizational Change—Embraces people development processes, including among other things, talent management, defining clear management performance objectives, coaching, performance management and new talent integration. Embraces robust succession planning to ensure consistency in leadership and capabilities. |
| • | Possesses Position-Specific Knowledge and Skills—Understands and uses all tools and techniques for job success and customer satisfaction. |
Compensation Committee
The goals of our compensation committee with respect to executive compensation are to attract, retain, motivate and reward talented executives, to tie annual short and long-term compensation incentives to the achievement of specified performance objectives, and to achieve long-term creation of value for our stockholders by aligning the interests of these executives with those of our stockholders. To achieve these goals, we endeavor to maintain compensation plans that are intended to tie a substantial portion of our executives’ overall compensation to key strategic, operational and financial goals such as Adjusted EBITDA, and other non-financial goals that the compensation committee deems important. From time to time, the compensation committee evaluates individual executive performance with a goal of setting compensation at levels they believe, based on industry data and their general business and industry knowledge and experience, are comparable with executives in other companies of similar size and stage of development, while taking into account our relative performance and our own strategic goals.
Setting Executive Compensation
The compensation committee has designed our compensation programs to motivate the named executive officers and our other executive officers to achieve and exceed goals set by the compensation committee that are reflective of our leadership traits and core values and to retain these individuals. To assist the compensation committee in setting these goals, and monitor and review compensation levels and opportunities, management has in the past hired outside consultants and it continues to have the ability to hire or terminate such consultants as necessary.
We did not engage a compensation consultant for determining the 2013 compensation for our named executive officers. However, to assist it in making compensation decisions, management has historically compared each element of total compensation against executive compensation survey data, including surveys published by Towers Watson & Co. and by Mercer, Inc., and made recommendations to the compensation committee based upon this review.
111
Table of Contents
The compensation committee has established policies or targets for the allocation of compensation between base salary and cash incentive payments. The compensation committee’s targeted allocation of compensation between base salary and Management Incentive Plan (“MIP”) payouts for our named executive officers (aside from our Chief Executive Officer) is 56%-67% of the cash pay mix attributable to base salary and 33-44% of the cash pay mix attributable to MIP payouts. To attract and retain experienced talent, the compensation committee generally sets base salary for named executive officers and other executive officers at a competitive market rate based upon management’s review of the survey results. Actual compensation paid to the named executive officers and our other executive officers can fall below or exceed target levels depending upon our financial results and individual performance.
Role of Executive Officers in Compensation Decisions
Our Chief Executive Officer and our Executive Vice President of Human Resources annually review the performance of each named executive officer and our other executive officers (other than the Chief Executive Officer, whose performance is reviewed by the compensation committee after seeking input from the board of directors). During this review, succession planning is considered, as well as strengths and development opportunities for the named executive officers and our other executive officers. The Chief Executive Officer discusses the results of this review and offers recommendations to the compensation committee. After consideration of these recommendations, the compensation committee determines annual cash incentive opportunities for the named executive officers and our other executive officers, sets our performance objectives and establishes Adjusted EBITDA performance targets. The compensation committee engages in an independent review of the Chief Executive Officer’s performance and then seeks ratification of its review from the independent members of the board of directors.
In 2013, our Chief Executive Officer proposed adjustments to base salary and equity compensation levels and opportunities for the named executive officers and our other executive officers based upon relevant market compensation survey data, including surveys published by Towers Watson & Co. and Mercer, Inc. The compensation committee then considered these recommendations, made its decisions for the named executive officers and our other executive officers, and sought the ratification of the independent members of the board of directors on our Chief Executive Officer’s compensation.
Principal Components of Compensation
For our fiscal year ended December 31, 2013, the principal components of compensation for the named executive officers were base salary, annual cash incentives, long-term incentives, bonus, 401(k) matching and perquisites and other benefits.
Base Salary
We provide the named executive officers with a base salary to compensate them for services rendered during the fiscal year at a threshold level. Base salary levels are determined as part of our annual performance review process. The key factors for assessing an individual’s performance for 2013 included the achievement of goals and objectives established by the compensation committee, and/or continued demonstration of our leadership traits and core values.
In connection with the performance review process, a base salary range for 2013 was determined for each named executive officer. While general industry survey data, an internal review of the named executive officer’s compensation, both individually and relative to other executive officers, as well as other factors such as an individual’s promotion or other change in job responsibility and the need to retain associates, including the named executive officers, were considered, the final base salary determinations were based primarily on Mr. Lucas’s qualitative review and recommendation to the compensation committee. We strive to pay a base salary for each position that is competitive within our industry to attract and retain top-level talent in a highly competitive market. Three of our named executive officers were recruited from other companies within the last
112
Table of Contents
three years and their initial base salaries were determined by negotiations between us and the named executive officer. These negotiations were guided by reference to market data.
The compensation committee has not yet established the named executive officers’ base salaries for 2014 and, therefore, they currently continue at their 2013 levels.
Management Incentive Plan Compensation
We grant annual cash incentive opportunities to the named executive officers under the MIP. For 2013, the annual cash incentive opportunity for each of our named executive officers as a percentage of base salary was targeted at: Mr. Lucas (186%), Mr. Oberdorf (80%), Ms. Smith (60%), Ms. Balli (80%) and Mr. George (50%).
Each named executive officer’s annual MIP target is set forth in his or her employment agreement. Payouts under the MIP are typically approved by the compensation committee in the first quarter of each year and paid after our audited consolidated financial statements are approved by the board of directors, subject to the named executive officer’s continued employment through the payment date.
The compensation committee has latitude to design annual cash incentive opportunities that promote the achievement of corporate goals and the participation by the named executive officers in our growth and profitability. For 2013, cash incentives under our MIP were based on an individual component, which is based on individual performance objectives for each executive officer, and a company component, which is based upon the attainment of an Adjusted EBITDA target (with Adjusted EBITDA calculated as set forth in the section entitled “Summary—Summary Historical Financial and Other Data”) or more directed targets within the employee’s span of control, such as specific business EBITDA or cost savings targets for the year ended December 31, 2013.
The compensation committee evaluates the allocation between the individual and company component within the MIP on an annual basis and has the flexibility to adjust the structure including allocation percentages amongst the two components as needed in order to better align the incentives under the MIP. In addition to awards under the MIP, the compensation committee may grant special or supplemental benefits at their discretion.
Actual payments under the MIP for the year ended December 31, 2013 were calculated based on performance results as compared to the agreed upon goals. The components for the MIP payouts for a participant are (i) 80% established by targeted Adjusted EBITDA or more directed targets within the employee’s span of control, such as specific business EBITDA or cost savings targets and (ii) 20% established by performance in achieving individual performance objectives (“MBOs”) relating to the participant’s role. Mr. Lucas’s MBOs for 2013 included improving leverage, hiring and integrating new sales leaders, increasing global mobility solutions sales and U.S. mobility networks sales, introducing new products to market and improving productivity and efficiency of operations. Mr. Oberdorf’s MBOs for 2013 included increasing cash flow, improving leverage, increasing sales and revenue growth, increasing penetration of current products, generating cash to service debt and optimizing return on investment of capital expenditures. Ms. Smith’s MBOs for 2013 included increasing share-of-wallet revenue, growing revenue, winning new customer contracts, optimizing revenue lead management and launching new products. Ms. Balli’s MBOs for 2013 included growing revenue and winning customer contracts, increasing productivity of operations and reducing SG&A expenses, driving new contract margins and developing new global and domestic operating systems. Mr. George’s MBOs for 2013 included winning customers in Asia, developing a growth strategy in China, expanding our Middle East capabilities and building capabilities in India. The following table illustrates the potential MIP payouts for the company component for 2013 for each named executive officer except Mr. George:
| Adjusted EBITDA Below Threshold |
Adjusted EBITDA At Threshold |
Achieve Adjusted EBITDA Target |
Adjusted EBITDA Above Target | |||||
| Company Component of MIP |
0% of target (any payment would |
55% of target | 100% of target | Payment over 100% of target at the discretion of the board of directors |
113
Table of Contents
Adjusted EBITDA performance for 2013 below $68.0 million would result in no payout to a participant for the company component; however the board of directors has the discretion to make any payments relating to the company component of the MIP even if Adjusted EBITDA thresholds are not achieved. In the event that Adjusted EBITDA performance for 2013 was above $80.0 million, payments in excess of 100% of target are granted at the discretion of the board of directors. In the case of Mr. George, the company component of MIP relates to the financial performance of the Asia and Middle East regions.
Long-Term Incentives
We believe that long-term incentives in the form of equity-based awards align the interests of our executive officers with those of our stockholders for periods greater than the single year focus of the MIP. They also provide an opportunity for increased equity ownership by our executive officers and encourage retention. We believe equity-based awards provide meaningful incentives to our executive officers to increase the value of our stock over time and have a stake in our long-term success. In making equity-based awards during 2013, the compensation committee considered the named executive officer’s level of responsibility, prior experience, individual performance, and market data for the particular position. For 2013, these long-term incentives consisted of stock options and restricted stock.
In February 2013, our board of directors adopted the Stock Incentive Plan (the “SIP”). Stock options and grants of common stock are awarded through the SIP and administered by the compensation committee.
Stock Options
Stock options only reward an executive for the increase in our stock price during the holding period. Stock options represent the high-risk component of our long-term incentives, as the potential value of each stock option can fall to zero if the price of our stock is lower than the exercise price.
The size of stock option grants for executive officers is based primarily on the target dollar value of the award, translated into a number of option shares based on the estimated economic value of the award using the Black-Scholes option pricing formula. All stock options granted to our named executive officers, directors and other employees are non-qualified stock options under the Code.
In 2013, the compensation committee approved grants of stock options to certain executives, including one named executive officer, Mr. Lucas. The stock options granted to Mr. Lucas are reflected below in the Grants of Plan Based Awards Table. The Compensation Committee determined a stock option target award value it deemed appropriate to ensure that Mr. Lucas remains motivated and focused on providing strong management. The target award value was consistent with equity grants made to Mr. Lucas during his first five years of service as our CEO. All stock options granted in 2013 had an exercise price per share of $200, which the compensation committee determined was the fair market value of our stock on the date of grant. The stock options granted to Mr. Lucas and to other individuals vest over five years, at a rate of 20% per year, beginning on the first anniversary of the grant date. This vesting schedule was selected due to its prevalence in the market place. All stock options granted in 2013 expire on February 12, 2023.
Restricted Stock
During the year ended December 31, 2013, one of our named executive officers, Mr. Oberdorf, received restricted stock awards. The purpose of the restricted stock awards was to provide equity participation to our executives. Restricted stock awards were awarded through the Long-Term Incentive Plan (the “LTIP”), which was administered by the compensation committee. Restricted stock awards are shares of our common stock subject to repurchase by us for less than fair market value upon certain conditions or events. In 2013, the compensation committee granted these awards as a result of provisions in Mr. Oberdorf’s employment agreement where either time requirements or certain performance measures were satisfied in 2013. The restricted stock granted to Mr. Oberdorf vests based on the passage of time over a five year period with 10% vesting in 2014,
114
Table of Contents
15% vesting in 2015, 20% vesting in 2016, 25% vesting in 2017 and the remaining 30% vesting in 2018. Any unvested shares are forfeited upon Mr. Oberdorf’s termination of employment. No other named executive officers are entitled to future grants of restricted stock pursuant to the terms of their employment agreements. Additionally, all of Mr. Oberdorf’s unvested share will immediately vest upon this offering.
Bonus
For 2013, we granted discretionary cash bonuses to two of our named executive officers to compensate them for significant contributions during the year. We do not expect cash bonuses to be a material component of our compensation in future periods.
401(k) and Other Benefits
Our executive officers are eligible to participate in our employee benefit plans provided to other employees on the same terms. These benefits include a 401(k) plan with a company matching contribution of up to $1,912 annually to each employee, including our named executive officers. These benefits also include a group health insurance and short and long-term disability insurance.
In addition to the benefits offered to all employees, certain executive officers, are provided additional benefits that are considered perquisites, which are part of an executive officer’s total compensation and treated as taxable income under the applicable tax laws. In 2013, perquisites for certain of our named executive officers included an annual automobile allowance, annual office expense allowance, commuting costs and annual executive physicals. Such perquisites and employee benefits are intended to promote health, convenience, security and financial protection to our executives. Detailed information about these perquisites is included below in a footnote to the “All Other Compensation” column of the 2013 Summary Compensation Table.
Severance and Change in Control Arrangements
Our executive officers, including our named executive officers, have terms in their employment agreements that would provide severance benefits on specified terminations of employment or if we experience a change of control. The terms and estimated amounts of these benefits are described below under “—Employment Agreements and Severance Benefits.” Most of these arrangements were negotiated when the executive officers were hired and have terms that we believed were reasonably necessary to hire and retain these individuals in our market for executive talent.
Tax and Accounting Considerations
We recognize a charge to earnings for accounting purposes for equity awards over their vesting period. In the past, we have not considered the accounting impact as a material factor in determining the equity award amounts for our executive officers. However, as a public company, we expect that the compensation committee will consider the accounting impact of equity awards in addition to considering the impact to dilution and overhang when deciding on amounts and terms of equity awards. We do not require executive compensation to be tax deductible, but instead balance the cost and benefits of tax deductibility to comply with our executive compensation goals. For example, Section 162(m) of the Code, generally disallows a tax deduction to a publicly held corporation for compensation in excess of $1.0 million paid in any taxable year to its chief executive officer and certain other executive officers unless the compensation qualifies as “performance-based compensation” within the meaning of Section 162(m). Under a special Section 162(m) exception, any compensation paid pursuant to a compensation plan in existence before the effective date of this initial public offering will generally not be subject to the $1.0 million limitation until the earliest of: (i) the expiration of the compensation plan, (ii) a material modification of the compensation plan (as determined under Section 162(m)), (iii) the issuance of all the employer stock and other compensation allocated under the compensation plan or (iv) the first meeting of stockholders at which directors are elected after the close of the third calendar year following the year in which
115
Table of Contents
the public offering occurs. As a private company, we have not taken the deductibility limit of Section 162(m) into consideration in setting compensation for our executive officers because Section 162(m) did not apply to us. Once we are a public company, we expect that the compensation committee will consider the deductibility of compensation, but will be fully authorized to approve compensation that is not deductible when it believes that such payments are appropriate to attract and retain executive talent.
2013 Summary Compensation Table
The following table sets forth certain information with respect to compensation earned by or paid to our named executive officers for the year ended December 31, 2013.
| Name and Principal Position |
Year | Salary ($) |
Stock Awards ($)(1) |
Option Awards ($)(2) |
Non-Equity Incentive Plan Compensation(3) |
Bonus(4) | All Other Compensation ($)(5) |
Total ($) |
||||||||||||||||||||||||
| Wes Lucas |
2013 | 700,000 | — | 472,279 | 1,078,792 | — | 103,617 | 2,354,688 | ||||||||||||||||||||||||
| Chief Executive Officer |
||||||||||||||||||||||||||||||||
| Tom Oberdorf |
2013 | 475,000 | 100,000 | — | 327,937 | 38,203 | 1,912 | 943,052 | ||||||||||||||||||||||||
| Chief Financial Officer |
||||||||||||||||||||||||||||||||
| Linda Smith |
2013 | 330,000 | — | — | 170,872 | 26,826 | 156,066 | 683,764 | ||||||||||||||||||||||||
| Executive Vice President and Chief Commercial Officer |
||||||||||||||||||||||||||||||||
| Deborah Balli |
2013 | 340,000 | — | — | 203,135 | — | 1,912 | 545,047 | ||||||||||||||||||||||||
| President of Global Relocation Services |
||||||||||||||||||||||||||||||||
| Jacob George(6) |
2013 | 435,428 | — | — | 226,824 | — | — | 662,252 | ||||||||||||||||||||||||
| President of Asia and Middle East |
||||||||||||||||||||||||||||||||
| (1) | The estimated fair value of the restricted stock was initially based on a valuation made by an independent third party. Our estimated enterprise value took into consideration the lack of control and limited marketability of the securities. Subsequently the estimated fair value was updated to reflect business results over time as well as a review of share trading transactions involving the our stock among our private equity owners. The estimated fair value of the stock option awards was based on a review of share trading transactions involving our stock among our private equity owners. As required by SEC rules, amounts shown in the column “Stock Awards” for the year ended December 31, 2013 presents the aggregate grant date fair value of stock awards granted in the fiscal year in accordance with accounting rules ASC 718, Compensation—Stock Compensation. For a description of the assumptions used in calculating the fair value of equity awards in 2013 under ASC 718, see Note 12 of the Company’s audited financial statements included elsewhere in this prospectus. |
| (2) | As required by SEC rules, amounts shown in the column “Option Awards” presents the aggregate grant date fair value of option awards granted in the fiscal year in accordance with accounting rules ASC 718, Compensation—Stock Compensation. For a description of the assumptions used in calculating the fair value of equity awards in 2013 under ASC 718, see Note 12 to the Company’s audited financial statements included elsewhere in this prospectus. These amounts reflect our cumulative accounting expense over the vesting period and do not correspond to the actual values that were to be realized by the named executive officers. |
116
Table of Contents
| (3) | For the year ended December 31, 2013, MIP amounts were approved for both the company component and the individual component of the MIP. We attained EBITDA of $76.8 million for the year ended December 31, 2013, which is equivalent to an approximately 83% payout of the assigned bonus target for the company component for each named executive officer except Mr. George. The individual component bonus of the MIP was approved during the first quarter of fiscal year 2014 following a review of each named executive officer’s individual performance and contribution to our strategic and financial goals. The following table shows the Non-Equity Incentive Plan Compensation provided to the named executive officers. |
| Name |
MIP Company Component | MIP Individual Component | Total Non-Equity Incentive Plan Compensation |
|||||||||
| Wes Lucas |
$ | 862,992 | $ | 215,800 | $ | 1,078,792 | ||||||
| Tom Oberdorf |
$ | 252,259 | $ | 75,678 | $ | 327,937 | ||||||
| Linda Smith |
$ | 131,440 | $ | 39,432 | $ | 170,872 | ||||||
| Deborah Balli |
$ | 180,564 | $ | 22,571 | $ | 203,135 | ||||||
| Jacob George |
$ | 183,312 | $ | 43,512 | $ | 226,824 | ||||||
| (4) | Reflects amounts payable as part of a special payment to these named executive officers. |
| (5) | This column includes matching contributions made under our 401(k) plan and perquisites and other personal benefits, as set forth in the below table. |
| Name |
401(k) Match | Office Allowance(a) |
Commuting Expenses(b) |
Automobile Expenses(c) |
Executive Physical Expenses(d) |
Relocation Expenses(e) |
||||||||||||||||||
| Wes Lucas |
$ | 1,912 | $ | 42,000 | $ | 35,123 | $ | 16,800 | $ | 7,782 | $ | — | ||||||||||||
| Tom Oberdorf |
1,912 | — | — | — | — | — | ||||||||||||||||||
| Linda Smith |
1,912 | — | — | — | — | 154,154 | ||||||||||||||||||
| Deborah Balli |
1,912 | — | — | — | — | — | ||||||||||||||||||
| Jacob George |
— | — | — | — | — | — | ||||||||||||||||||
| (a) | This column represents reimbursed expenses incurred by the executive in maintaining his office in Jackson, WY. |
| (b) | This column represents the commuting related expense to and from the Company’s corporate headquarters. |
| (c) | This column represents an annual automobile allowance. |
| (d) | This column represents expenses for an annual executive physical. |
| (e) | This column represents moving and related expenses. |
| (6) | Mr. George’s cash compensation was paid in Singapore dollars. For convenience, this has been converted into U.S. dollars at the December 31, 2013 exchange rate of SGD$1.262373 per U.S.$1.00. |
117
Table of Contents
2013 Grants of Plan-Based Awards
The following table summarizes plan-based awards granted to our named executive officers for the year ended December 31, 2013.
| Estimated Possible Future Payouts Under Non-Equity Incentive Plan Awards |
All Other Stock Awards: Number of Shares of Units |
All Other Option Awards: Number of Securities Underlying Options |
Exercise or Base Price of Option Awards |
Grant Date Fair Value of Stock and Option Awards(1)(2) |
||||||||||||||||||||||||||||||||
| Name |
Grant Date |
Approval Date |
Threshold ($) |
Target ($) |
Maximum ($)(3) |
(#) | (#) | ($/Sh) | ($) | |||||||||||||||||||||||||||
| Wes Lucas |
||||||||||||||||||||||||||||||||||||
| Stock Option Grant |
5/21/2013 | 5/21/2013 | N/A | N/A | N/A | 0 | 7,118 | 200 | 472,279 | |||||||||||||||||||||||||||
| MIP Payment |
N/A | N/A | 572,000 | 1,300,000 | — | |||||||||||||||||||||||||||||||
| Tom Oberdorf |
||||||||||||||||||||||||||||||||||||
| Restricted Stock Grant |
8/28/2013 | 8/28/2013 | N/A | N/A | N/A | 500 | — | N/A | 100,000 | |||||||||||||||||||||||||||
| MIP Payment |
N/A | N/A | 167,200 | 380,000 | — | |||||||||||||||||||||||||||||||
| Linda Smith |
||||||||||||||||||||||||||||||||||||
| MIP Payment |
N/A | N/A | 87,120 | 198,000 | — | — | — | N/A | — | |||||||||||||||||||||||||||
| Deborah Balli |
||||||||||||||||||||||||||||||||||||
| MIP Payment |
N/A | N/A | 119,680 | 272,000 | — | — | — | N/A | — | |||||||||||||||||||||||||||
| Jacob George |
||||||||||||||||||||||||||||||||||||
| MIP Payment(4) |
N/A | N/A | 82,731 | 217,714 | — | — | — | N/A | — | |||||||||||||||||||||||||||
| (1) | As required by SEC rules, amounts shown in the column “Grant Date Fair Value of Stock and Option Awards” for the year ended December 31, 2013 presents the aggregate grant date fair value of stock awards granted in the fiscal year in accordance with accounting rules ASC 718, Compensation—Stock Compensation. For a description of the assumptions used in calculating the fair value of equity awards in 2013 under ASC 718, see Note 12 to the Company’s audited financial statements included elsewhere in this prospectus. The estimated fair value of the grant date was $200 per share. The estimated fair value of the restricted stock was initially based on a valuation done by an independent third party. Our estimated enterprise value took into consideration the lack of control and limited marketability of the securities. Subsequently the estimated fair value was updated to reflect business results over time as well as a review of share trading transactions involving our stock among our private equity owners. The estimated fair value of the stock option awards was based on a review of share trading transactions involving our stock among our private equity owners. |
| (2) | As required by SEC rules, amounts shown in the column “Grant Date Fair Value of Stock and Option Awards” present the aggregate grant date fair value of option awards granted in the fiscal year in accordance with accounting rules ASC 718, Compensation—Stock Compensation. For a description of the assumptions used in calculating the fair value of equity awards in 2013 under ASC 718, see Note 12 to the Company’s audited financial statements included elsewhere in this prospectus. These amounts reflect our cumulative accounting expense over the vesting period and do not correspond to the actual values that were to be realized by the named executive officers. |
| (3) | Any non-equity incentive plan awards in excess of the target amounts will be granted at the discretion of the board of directors. |
| (4) | Mr. George’s MIP payment will be paid in Singapore dollars. For convenience, the threshold and target MIP payments have been converted into U.S. dollars at the December 31, 2013 exchange rate of SGD$1.262373 per U.S.$1.00. |
118
Table of Contents
2013 Outstanding Equity Awards at Fiscal Year-End
The following table sets forth certain information with respect to outstanding equity awards held by our named executive officers as of December 31, 2013.
| Option Awards | Stock Awards | |||||||||||||||||||||||||||
| Name |
Grant Date |
Number of Securities Underlying Unexercised Options (#) Exercisable |
Number of Securities Underlying Unexercised Options (#) Unexercisable(1) |
Option Exercise Price ($) |
Option Expiration Date |
Number of Shares or Units of Stock That Have Not Vested (#)(2) |
Market Value of Shares or Units of Stock That Have Not Vested ($) |
|||||||||||||||||||||
| Wes Lucas |
5/21/2013 | — | 7,118 | $ | 200 | 2/12/2023 | — | N/A | ||||||||||||||||||||
| Tom Oberdorf |
8/28/2013 | — | — | N/A | N/A | 500 | 100,000 | |||||||||||||||||||||
| 8/2/2012 | — | — | N/A | N/A | 900 | 180,000 | ||||||||||||||||||||||
| 8/1/2012 | — | — | N/A | N/A | 450 | 90,000 | ||||||||||||||||||||||
| 9/27/2011 | — | — | N/A | N/A | 3,750 | 750,000 | ||||||||||||||||||||||
| Linda Smith |
8/13/2012 | — | — | N/A | N/A | 1,980 | 396,000 | |||||||||||||||||||||
| Deborah Balli |
N/A | — | — | N/A | N/A | — | N/A | |||||||||||||||||||||
| Jacob George |
2/3/2011 | — | — | N/A | N/A | 1,980 | 396,000 | |||||||||||||||||||||
| (1) | Stock options vest over five years, at a rate of 20% per year, beginning on the first anniversary of the grant dates listed above. |
| (2) | Restricted stock vests over five years at a rate of 10% in the first year, 15% in the second year, 20% in the third year, 25% in the fourth year and 30% in the fifth year. All unvested restricted stock will vest upon the closing of this offering. |
Options Exercised and Stock Vested in 2013
The following table sets forth certain information with respect to stock vested by our named executive officers in fiscal year 2013. None of our executive officers exercised options during 2013.
| Stock Awards | ||||||||
| Name |
Number of Shares Acquired on Vesting (#) |
Value Realized on Vesting ($) |
||||||
| Wes Lucas |
10,508 | 2,101,600 | ||||||
| Tom Oberdorf |
900 | 180,000 | ||||||
| Linda Smith |
220 | 44,000 | ||||||
| Deborah Balli |
1,616 | 323,200 | ||||||
| Jacob George |
431 | 86,200 | ||||||
Pension Benefits
Our named executive officers did not participate in any defined benefit pension plan during 2013.
Nonqualified Deferred Compensation
In the year ended December 31, 2013, our named executive officers received no nonqualified deferred compensation and had no deferred compensation benefits.
Employment Agreements and Severance Benefits
We entered into an employment agreement with Wes Lucas on July 17, 2008, which was amended and restated as of October 1, 2009. Mr. Lucas’ contract period is valid through July 17, 2014 and automatically renews on an annual basis, unless he is terminated by certain agreed upon terms or we provide notice at least 60
119
Table of Contents
days prior to the expiration date. The agreement provides that Mr. Lucas will receive an initial annualized base salary of $700,000. The board of directors or compensation committee, based on its review, has discretion to increase (but not reduce) the base salary each year. The agreement also provides for annual cash incentive payments for Mr. Lucas determined by the board of directors or the compensation committee based on performance incentives established with respect to that particular year. Pursuant to a subscription agreement entered into on the same date as his employment agreement, Mr. Lucas was granted 35,028 restricted shares of our common stock. If we terminate Mr. Lucas’ employment at any time without cause (as defined in the agreement) or Mr. Lucas resigns with good reason (as defined in the agreement), we must provide Mr. Lucas with, subject to his execution of a release of claims, (a) payment equal to one year’s base salary paid in bi-weekly installments, (b) medical benefits, automobile allowance and other office reimbursements for a one year period and (c) equity vesting through his one-year severance period. Alternatively, upon termination without cause or resignation by Mr. Lucas with good reason within a two year period following a change of control (as defined in the agreement), we must provide Mr. Lucas with, subject to his execution of a release of claims, (a) a lump sum payment equal to two year’s base salary and (b) medical benefits, automobile allowance and other office reimbursements for a one year period.
We entered into an employment agreement with Tom Oberdorf on August 2, 2011. Mr. Oberdorf’s contract period is valid through August 3, 2016 and automatically renews on an annual basis, unless he is terminated by certain agreed upon terms or we provide notice at least 60 days prior to the expiration date. The agreement provides that Mr. Oberdorf will receive an initial annualized base salary of $475,000. The board of directors or compensation committee, based on its review, has discretion to increase (but not reduce) the base salary each year. The agreement also provides for annual cash incentive payments for Mr. Oberdorf determined by the board of directors or the compensation committee based on performance incentives established with respect to that particular year. Pursuant to a subscription agreement entered into on the same date as his employment agreement, Mr. Oberdorf was initially granted 5,000 restricted shares of our common stock on the date of his employment agreement and was also granted an additional 1,000 restricted shares of the Company’s common stock on August 2, 2012. Additionally, Mr. Oberdorf’s employment agreement provides that he shall receive a total of 1,000 restricted shares of our common stock upon the attainment of certain performance goals. Mr. Oberdorf received 500 performance related restricted shares on August 1, 2012, and an additional 500 performance-related restricted shares on August 28, 2013. If we terminate Mr. Oberdorf’s employment at any time without cause (as defined in the agreement) or Mr. Oberdorf resigns with good reason (as defined in the agreement), we must provide Mr. Oberdorf with, subject to his execution of a release of claims, (a) payment equal to one year’s base salary paid in bi-weekly installments and (b) medical benefits for a one year period. Alternatively, upon termination without cause or resignation by Mr. Oberdorf for good reason within a two year period following a change of control (as defined in the agreement), we must provide Mr. Oberdorf with, subject to his execution of a release of claims, a lump sum payment equal to 18 months base salary.
We entered into an employment agreement with Linda Smith on April 2, 2012. Ms. Smith’s contract period is valid through January 1, 2017 and automatically renews on an annual basis, unless she is terminated by certain agreed upon terms or we provide notice at least 60 days prior to the expiration date. The agreement provides that Ms. Smith will receive an initial annualized base salary of $330,000. The board of directors or compensation committee, based on its review, has discretion to increase (but not reduce) the base salary each year. The agreement also provides for annual cash incentive payments for Ms. Smith determined by the board of directors or the compensation committee based on performance incentives established with respect to that particular year. Pursuant to a subscription agreement entered into on the same date as her employment agreement, Ms. Smith was granted 2,200 restricted shares of our common stock. If we terminate Ms. Smith’s employment at any time without cause (as defined in the agreement) or Ms. Smith resigns with good reason (as defined in the agreement), we must provide Ms. Smith with, subject to her execution of a release of claims, (a) payment equal to one year base salary paid in bi-weekly installments and (b) medical benefits for one year. Alternatively, upon termination without cause or resignation by Ms. Smith with good reason within a two year period following a change of control (as defined in the agreement), we must provide Ms. Smith, subject to her execution of a release of claims, with a lump sum payment equal to 18 months base salary.
120
Table of Contents
We entered into an employment agreement with Deborah Balli on December 18, 2008. Ms. Balli’s contract period is valid through December 18, 2014 and automatically renews on an annual basis, unless she is terminated by certain agreed upon terms or we provide notice at least 60 days prior to the expiration date. The agreement provides that Ms. Balli will receive an initial annualized base salary of $330,000. The board of directors or compensation committee, based on its review, has discretion to increase (but not reduce) the base salary each year. The agreement also provides for annual cash incentive payments for Ms. Balli determined by the board of directors or the compensation committee based on performance incentives established with respect to that particular year. Pursuant to a subscription agreement entered into on the same date as her employment agreement, Ms. Balli was granted 5,389 restricted shares of our common stock. If we terminate Ms. Balli’s employment at any time without cause (as defined in the agreement) or Ms. Balli resigns with good reason, we must provide Ms. Balli with, subject to her execution of a release of claims, (a) payment equal to 18 months base salary payable in bi-weekly installments and (b) medical benefits for an 18 month period. In addition, upon termination without cause or resignation by Ms. Balli with good reason within a two year period following a change of control (as defined in the agreement), we must provide Ms. Balli, subject to her execution of a release of claims, with a lump sum payment equal to 18 months base salary and medical benefits for an 18 month period.
We entered into an employment agreement with Jacob George on December 1, 2010. Mr. George’s contract period is valid through December 1, 2015 and automatically renews on an annual basis, unless he is terminated by certain agreed upon terms or we provide notice at least six months prior to the expiration date. The agreement provides that Mr. George will receive an initial annualized base salary of SGD $549,672. The board of directors or compensation committee, based on its review, has discretion to increase (but not reduce) the base salary each year. The agreement also provides for annual cash incentive payments for Mr. George determined by the board of directors or the compensation committee based on performance incentives established with respect to that particular year. In addition, pursuant to his employment agreement Mr. George received a one-time cash bonus of SGD $384,711 in January 2011. Pursuant to a subscription agreement entered into on the same date as his employment agreement, Mr. George was granted 2,156 restricted shares of our common stock. If we terminate Mr. George’s employment at any time without cause (as defined in the agreement) or Mr. George resigns with good reason (as defined in the agreement), we must provide Mr. George with, subject to his execution of a release of claims, (a) payment equal to one year’s base salary payable in bi-weekly installments and (b) medical benefits for one year. In addition, upon termination without cause or resignation by Mr. George with good reason within a two year period following a change of control (as defined in the agreement), we must provide Mr. George with, subject to his execution of a release of claims, a lump sum payment equal to 18 months base salary.
121
Table of Contents
Potential Payments Upon Termination or Change in Control
The table below shows the estimated value transfer to each named executive officer under various scenarios relating to a termination of employment. The table below assumes that such termination occurred on December 31, 2013, and payments are made under the employment agreements then in effect. The actual amounts that would be paid to any named executive officer can only be determined at the time of an actual termination of employment and would vary from those listed below.
| Termination without Cause and without a Change in control |
Termination without Cause or for Good Reason within Two Years Following a Change in Control |
|||||||||||||||||||||||
| Name |
Severance Pay ($) |
Benefits ($) |
Accelerated Equity Vesting ($) |
Severance Pay ($) |
Benefits ($) |
Accelerated Equity Vesting ($) (1) |
||||||||||||||||||
| Wes Lucas |
700,000 | 89,685 | N/A | 1,400,000 | 89,685 | — | ||||||||||||||||||
| Tom Oberdorf |
475,000 | 23,103 | N/A | 712,500 | — | 1,120,000 | ||||||||||||||||||
| Linda Smith |
330,000 | 15,516 | N/A | 495,000 | — | 396,000 | ||||||||||||||||||
| Deborah Balli |
510,000 | 15,516 | N/A | 510,000 | 23,274 | N/A | ||||||||||||||||||
| Jacob George |
435,428 | 11,105 | N/A | 653,142 | — | 396,000 | ||||||||||||||||||
| (1) | Represents equity awards that would vest pursuant to the “single-trigger” vesting provision described below. |
All of the grants of restricted stock and stock options made to our named executive officers contain a “single-trigger” vesting provision, meaning that any unvested grants of restricted stock and stock options will vest in full upon a change of control. The following table sets forth certain information with respect to equity awards that will vest upon a change of control assuming that such change of control occurred on December 31, 2013:
| Name |
Accelerated Equity Vesting ($) |
|||
| Wes Lucas |
— | |||
| Tom Oberdorf |
1,120,000 | |||
| Linda Smith |
396,000 | |||
| Deborah Balli |
— | |||
| Jacob George |
396,000 | |||
Non-Competition, Non-Solicitation and Confidentiality
Each of our executive officers’ employment agreements, including those of our named executive officers, contain non-competition, non-solicitation and confidentiality covenants. Pursuant to such agreements, each executive officer has agreed not to compete with us for a specified period following such executive officer’s date of termination (the “Restricted Period”). In addition, each executive officer may not solicit any of our employees during the term of his employment or for the Restricted Period or disclose any confidential information provided by our employment. The Restricted Periods for our Named Executive Officers range from one to three years.
2013 Stock Incentive Plan
The purpose of our SIP is to enable us to attract retain and motive our employees, non-employee directors, independent contractors and consultants. We have reserved an aggregate of 25,694 shares of our common stock for the issuance of awards under the SIP. This number is subject to adjustment in the event of a stock split, stock dividend or other change in our capitalization. Effective upon the closing of this offering, our board of directors has determined not to grant any further awards under our SIP.
Our board of directors has acted as administrator of the SIP. The administrator has the power to select, from among the individuals eligible for awards, the individuals to whom awards will be granted, and to determine the specific terms and conditions of each award, subject to the provisions of the SIP.
122
Table of Contents
The SIP permits the granting of stock, restricted stock, stock options, reload stock options, stock purchase warrants, other rights to acquire stock, securities convertible into or redeemable for stock, stock appreciation rights, phantom stock, dividend equivalents, performance units and performance shares. The board of directors generally may terminate, suspend or amend the SIP in a manner that does not adversely affect outstanding awards at any time. No amendment may be made without stockholder approval if such amendment otherwise requires stockholder approval by reason of any law, regulation or rule applicable to the SIP. No awards may be granted under the 2013 after the date that is ten years from the date the SIP was adopted by our board of directors.
Long-Term Incentive Plan
The LTIP authorizes our compensation committee to grant options, restricted shares or restricted shares units to selected employees. The LTIP is administered by the compensation committee of the board of directors. The compensation committee shall determine the recipients of awards, the types of awards to be granted and the applicable terms, provisions, limitations and performance requirements of such awards. The compensation committee will also have the authority to conclusively interpret the LTIP and any award agreements under the plan.
The Company has reserved 107,778 of our shares of common stock for issuance pursuant to the LTIP. To the extent any award under the LTIP is cancelled, terminated or forfeited, then the number of shares of common stock covered by the award or stock option so cancelled, terminated or forfeited will again be available for awards under the LTIP.
The number of shares of common stock available for grants or subject to outstanding awards shall be proportionally adjusted in the event of any dividend payable in capital stock of the Company, and any stock split, share combination, extraordinary cash dividend, recapitalization, reorganization, merger, consolidation, split-up, spin-off, combination, exchange of shares or other similar event.
The compensation committee, in its sole discretion, may determine that an award will be immediately vested in whole or in part, or that all or any portion may not be vested until a date, or dates, subsequent to its grant date, or until the occurrence of one or more specified events, subject in any case to the terms of the LTIP. The compensation committee may impose on any award such additional terms and conditions as the compensation committee determines, including terms requiring forfeiture of awards in the event of a participant’s termination of service.
The Compensation Committee generally may terminate, suspend or amend the LTIP in a manner that does not adversely affect outstanding awards at any time. No amendment may be made without stockholder approval if such amendment otherwise requires stockholder approval by reason of any law, regulation or rule applicable to the LTIP. The LTIP will expire on the tenth anniversary of its adoption by the board of directors, unless earlier terminated.
123
Table of Contents
2013 Director Compensation
During 2013, our directors have not received cash compensation for their service as a director. However, certain directors have been granted stock options. The following table sets forth certain information with respect to stock options granted to our directors in fiscal year 2013.
| Name |
Option Awards ($)(1) |
Total ($) |
||||||
| Mats Lindstrand |
547,000 | 547,000 | ||||||
| John Watkins, Jr |
547,000 | 547,000 | ||||||
| Douglas C. Laux |
120,000 | 120,000 | ||||||
| Lawrence A. Bossidy |
2,190,000 | 2,190,000 | ||||||
| (1) | Amounts reported are the grant date fair value of stock option awards calculated in accordance with FASB ASC 718. For information regarding the assumptions used in valuing these awards, see Note 12 to the Company’s audited financial statements included elsewhere in this prospectus. All stock options granted in 2013 had an exercise price per share of $200. Represents 2,735 option awards granted to Mr. Lindstrand, 2,735 option awards granted to Mr. Watkins, 600 option awards granted to Mr. Laux and 10,950 option awards granted to Mr. Bossidy. |
The following table sets forth the number of shares of restricted stock and stock options held by our directors as of December 31, 2013:
| Name |
Restricted Stock(1) | Stock Options(2) | ||||||
| Lawrence A. Bossidy |
— | 10,950 | ||||||
| Douglas C. Laux |
5,389 | 600 | ||||||
| Mats Lindstrand |
— | 2,735 | ||||||
| Mark Sotir |
5,389 | — | ||||||
| John Watkins, Jr. |
— | 2,735 | ||||||
| (1) | As of December 31, 2013, all shares of restricted stock were fully vested. |
| (2) | As of December 31, 2013, all stock options were unvested. |
Compensation Policies and Practices as They Relate to Risk Management
In accordance with the applicable disclosure requirements, to the extent that risks may arise from our compensation policies and practices that are reasonably likely to have a material adverse effect on us, we are required to discuss those policies and practices for compensating our employees (including employees that are not named executive officers) as they relate to our risk management practices and the possibility of incentivizing risk-taking. The compensation committee has evaluated the policies and practices of compensating our employees in light of the relevant factors, including the following:
| • | the allocation of compensation between cash and equity awards and the focus on stock-based compensation, including options and stock awards generally vesting over a period of years, thereby mitigating against short-term risk taking; |
| • | MIP payouts are not based solely on our performance, but also require achievement of individual performance objectives; and |
| • | the financial performance targets of our MIP program are the budgeted objectives that are reviewed and approved by our board of directors and/or the compensation committee |
Based on such evaluation, the compensation committee has determined that our policies and practices are not reasonably likely to have a material adverse effect on us.
124
Table of Contents
CERTAIN RELATIONSHIPS AND RELATED PERSON TRANSACTIONS
Set forth below is a description of certain relationships and related person transactions between us or our subsidiaries, and our directors, executive officers and holders of more than 5% of our voting securities. We believe that all of the following transactions were entered into with terms as favorable as could have been obtained from unaffiliated third parties.
Arrangements with Our Investors
Stockholders Agreement
On February 12, 2013, we entered into an amended and restated stockholders agreement with certain of our stockholders, including affiliated funds of Aurora and EGI, our executive officers and directors.
The stockholders agreement includes customary provisions regarding the election of members of our board of directors, inspection rights, information rights, share transfer restrictions, tag-along rights, drag-along rights and certain preemptive rights. The stockholders agreement will terminate upon this offering.
Registration Rights Agreement
On May 12, 2008, registration rights were granted to certain holders of our common stock, which included funds managed by Aurora and EGI, pursuant to a registration rights agreement (the “Registration Rights Agreement”). The Registration Rights Agreement provides for (1) shelf demand registration rights, which require us to effect registration of Registrable Common Stock (as defined in the Registration Rights Agreement) upon a written request by one or more holders of at least 15% of the outstanding shares of Registrable Common Stock, subject to certain limitations, (2) demand registration rights at any time after the expiration or cessation of effectiveness of a shelf registration statement filed by the Company as a result of a shelf demand request upon a written request by one or more holders of at least 15% of the outstanding shares of Registrable Common Stock and (3) piggy-back registration rights, either in a demand registration or in an incidental registration by us. The holders of our common stock are limited to six demand registrations. In addition, we agree to indemnify all holders of Registrable Securities against specified liabilities in connection to registrations made pursuant to the above-mentioned registration rights.
Series A Preferred Stock Ownership by Aurora and EGI
We issued shares of our Series A Preferred Stock in connection with the cancellation of our previously outstanding second lien term loan debt. During 2011, $183.5 million of the second lien term loan debt was cancelled in exchange for up to $10.0 million in cash and 173,503 shares of our Series A Preferred Stock. The holders who participated in this exchange retained the option to receive the cash consideration in preferred stock and exercised this option in March 2012. As a result of the exercise of this option, an additional 11,362 shares of our Series A Preferred Stock were issued. After the completion of the exchange, Aurora and EGI held 84,616 and 80,824 shares of our Series A Preferred Stock, respectively. Additionally, in March 2013, we used $109.0 million of the proceeds from the refinancing of our previously outstanding senior secured credit facilities to redeem 85,421 shares of our Series A Preferred Stock. After the redemption, Aurora and EGI held 53,827 and 43,471 shares of our Series A Preferred Stock, respectively. We will use the net proceeds from this offering to redeem all of our Series A Preferred Stock, including accumulated dividends. See “Use of Proceeds.”
Investor Rights Agreement
On March 17, 2011 in connection with the exchange of our second lien term loan debt for our Series A Preferred Stock, we entered into an investor rights agreement (the “Investor Rights Agreement”) with the holders of our Series A Preferred Stock, including Aurora and EGI. Pursuant to the investor rights agreement, holders of our Series A Preferred Stock were granted certain information rights, inspection rights, pre-emptive rights and rights of first refusal. The Investor Rights Agreement also restricts our ability to redeem or pay dividends on our common stock, issue certain types of equity securities, sell or dispose of a material portion of our assets and incur debt.
125
Table of Contents
Investor Guarantee
Affiliates of EGI and Aurora have provided guarantees (the “Investor Guarantees”) with respect to letters of credit issued pursuant to the ABL Revolver. Each of the EGI and Aurora affiliates has guaranteed the payment of 50% of the letters of credit issued pursuant to the ABL Revolver. The Investor Guarantees shall be terminated either (i) upon the repayment of all obligations under the ABL Revolver and the termination of the ABL Revolver or (ii) on May 7, 2015 provided, that we can demonstrate sufficient projected excess availability, which is the total availability for loans, less our trade payables aged in excess of historical levels and book overdrafts.
Employment Agreements
We have entered into employment agreements with each of Mr. Lucas, Mr. Oberdorf, Ms. Smith, Ms. Balli and Mr. George. For more information regarding these agreements, see “Executive and Director Compensation—Employment Agreements and Severance Benefits.”
Indemnification Agreements
We expect to enter into indemnification agreements with our current directors and executive officers prior to the completion of this offering and expect to enter in a similar agreement with any new directors or executive officers.
Mortgage Loans
One of our mortgage lending subsidiaries, SIRVA Mortgage, has made, in the ordinary course of business, mortgage loans to certain of our employees. Such mortgage loans were made on substantially the same terms, including interest rates and collateral requirements, as those prevailing at the time for comparable transactions with our other customers generally and were made in the ordinary course of business. Our lending subsidiary sells these mortgage loans, soon after origination, into the secondary market in the ordinary course of business.
Policies for Approval of Related Person Transactions
In connection with this offering, we will adopt a written policy relating to the approval of related person transactions. Our audit committee will review and approve or ratify all relationships and related person transactions between us and (i) our directors, director nominees, executive officers or their immediate family members, (ii) any 5% record or beneficial owner of our common stock or (iii) any immediate family member of any person specified in (i) and (ii) above. Our compliance director will be primarily responsible for the development and implementation of processes and controls to obtain information from our directors and executive officers with respect to related party transactions and for determining, based on the facts and circumstances, whether we or a related person have a direct or indirect material interest in the transaction.
As set forth in the related person transaction policy, in the course of its review and approval or ratification of a related party transaction, the committee will consider:
| • | the nature of the related person’s interest in the transaction; |
| • | the availability of other sources of comparable products or services; |
| • | the material terms of the transaction, including, without limitation, the amount and type of transaction; and |
| • | the importance of the transaction to us. |
Any member of the audit committee who is a related person with respect to a transaction under review will not be permitted to participate in the discussions or approval or ratification of the transaction. However, such member of the audit committee will provide all material information concerning the transaction to the audit committee.
126
Table of Contents
PRINCIPAL AND SELLING STOCKHOLDERS
Security Ownership
The following table shows information as of , 2014 regarding the beneficial ownership of our common stock (1) prior to this offering and (2) as adjusted to give effect to this offering by:
| • | each person or group who is known by us to own beneficially more than 5% of our common stock; |
| • | each member of our board of directors and each of our named executive officers; |
| • | all members of our board and our executive officers as a group; and |
| • | each selling stockholder. |
For further information regarding material transactions between us and certain of our selling stockholders, see “Certain Relationship and Related Person Transactions.”
Beneficial ownership of shares is determined under rules of the SEC and generally includes any shares over which a person exercises sole or shared voting or investment power. Except as noted by footnote, and subject to community property laws where applicable, we believe based on the information provided to us that the persons and entities named in the table below have sole voting and investment power with respect to all shares of our common stock shown as beneficially owned by them. Percentage of beneficial ownership is based on shares of common stock outstanding as of , 2014 and shares of common stock outstanding after giving effect to this offering, assuming no exercise of the underwriters’ option to purchase additional shares, or shares of common stock, assuming the underwriters exercise their option to purchase additional shares in full. Shares of common stock subject to options currently exercisable or exercisable within 60 days of the date of this prospectus are deemed to be outstanding and beneficially owned by the person holding the options for the purposes of computing the percentage of beneficial ownership of that person and any group of which that person is a member, but are not deemed outstanding for the purpose of computing the percentage of beneficial ownership for any other person. Except as otherwise indicated, the persons named in the table below have sole voting and investment power with respect to all shares of capital stock held by them. Unless otherwise indicated, the address for each holder listed below is care of One Parkview Plaza, Oakbrook Terrace, IL 60181.
| Shares of common stock beneficially owned before this offering |
Shares offered | Shares of common stock beneficially owned after this offering (assuming no exercise of the option to purchase additional shares) |
Shares of common stock beneficially owned after this offering assuming full exercise of the option to purchase additional shares | |||||||||||||
| Name and address |
Number of shares |
Percentage of shares |
Number of shares |
Percentage of shares |
Number of shares |
Percentage of shares |
Number of shares |
Percentage of shares | ||||||||
| 5% stockholders: |
||||||||||||||||
| Affiliates of Aurora Capital Group(1) |
||||||||||||||||
| Funds Managed by Equity Group Investments(2) |
||||||||||||||||
| Named executive officers and directors: |
||||||||||||||||
| Wes Lucas |
||||||||||||||||
| Tom Oberdorf |
||||||||||||||||
| Linda Smith |
||||||||||||||||
| Deborah Balli |
||||||||||||||||
| Jacob George |
||||||||||||||||
127
Table of Contents
| Shares of common stock beneficially owned before this offering |
Shares offered | Shares of common stock beneficially owned after this offering (assuming no exercise of the option to purchase additional shares) |
Shares of common stock beneficially owned after this offering assuming full exercise of the option to purchase additional shares | |||||||||||||
| Name and address |
Number of shares |
Percentage of shares |
Number of shares |
Percentage of shares |
Number of shares |
Percentage of shares |
Number of shares |
Percentage of shares | ||||||||
| Lawrence A. Bossidy |
||||||||||||||||
| Ellen Havdala |
||||||||||||||||
| Douglas C. Laux |
||||||||||||||||
| Mats Lindstrand |
||||||||||||||||
| Ryan C. McCarthy |
||||||||||||||||
| Gerald L. Parsky(3) |
||||||||||||||||
| Mark Sotir |
||||||||||||||||
| John David Watkins, Jr. |
||||||||||||||||
| All board of director members and executive officers as a group (18 persons) |
||||||||||||||||
| * | Less than 1% |
| (1) | All of the common stock is held of record by Commercial Finance Services 1107, LLC, a Delaware limited liability company (“CFS 1107”). CFS 1107 is controlled by Aurora Resurgence Capital Partners II LLC, a Delaware limited liability company (“ARCAP II”). Gerald L. Parsky and Steven D. Smith, the managing members of ARCAP II, jointly control ARCAP II and thus may be deemed to share beneficial ownership of the securities held by CFS 1107. The address of each of the foregoing entities and persons is c/o Aurora Capital Group, 10877 Wilshire Boulevard, Suite 2100, Los Angeles, CA 90024. |
| (2) | The direct ownership of common stock consists of 202,449 shares held by EGI Fund (08-10) Investors, L.L.C. (“EGI 08-10”) and 129,611 shares held by EGI Fund (11-13) Investors, L.L.C. (“EGI 11-13”). The non-member manager of EGI 08-10 and managing member of EGI 11-13 is Chai Trust Company, LLC, an Illinois limited liability company that shares voting and dispositive power over the shares held by EGI 08-10 and EGI 11-13. The following individuals are the senior managing directors of Chai Trust Company, LLC: Donald Liebentritt, Kellie Zell, JoAnn Zell, Matthew Zell, Jon Wasserman and Robert M. Levin. The business address of each of the foregoing entities and persons is c/o Equity Group Investments, Two North Riverside Plaza, Suite 600, Chicago, IL 60606. |
| (3) | Mr. Parsky is a controlling person of ARCAP II, which exercises voting and investment power over the shares of common stock beneficially owned by Aurora, and may be deemed to beneficially own the shares held by CFS 1107. Mr. Parsky disclaims beneficial ownership of the shares of common stock held by CFS 1107, except to the extent of his pecuniary interest therein. |
128
Table of Contents
DESCRIPTION OF CERTAIN INDEBTEDNESS
Revolving Credit Facility
As part of the refinancing we completed in March 2013, SIRVA Worldwide entered into our ABL Revolver, with a group of lenders, with Goldman Sachs Bank USA serving as administrative agent for the lenders. The ABL Revolver matures on March 27, 2018. Under the terms of the ABL Revolver, we may borrow up to the maximum borrowing limit of $50.0 million less any outstanding letters of credit, subject to a borrowing base formula. The ABL Revolver provides for an advance rate of up to 85% of eligible accounts receivable of SIRVA Worldwide and certain of its subsidiaries, subject to limitations on certain accounts. All obligations under the ABL Revolver are guaranteed by certain of SIRVA Worldwide’s present and future subsidiaries. All obligations under the ABL Revolver, and the guarantees of those obligations, are secured, subject to certain exceptions, on a first-lien basis by all current assets of SIRVA Worldwide and its domestic subsidiaries, including, without limitation, accounts receivable, relocation properties held for resale, cash and cash equivalents and certain related assets and on a second-lien basis by substantially all of the other assets of SIRVA Worldwide and its domestic subsidiaries.
Borrowings under the ABL Revolver bear interest at our option, at either the London interbank rate, or a Base Rate (as defined in the ABL Revolver) plus, in each case, the applicable margin. The applicable margin is generally determined in accordance with a pricing grid based on our excess availability (as defined in the ABL Revolver) and ranges from 1.75% to 2.25% for London interbank loans and from 0.75% to 1.25% for Base Rate loans.
The ABL Revolver contains a $30 million sub-facility for the issuance of letters of credit and a $20 million sub-facility for swing line loans that can be borrowed and repaid on a same day basis. A fixed charge coverage ratio is tested when minimum availability thresholds are not met or during the continuance of an event of default.
At February 28, 2014, there was $44.5 million of aggregate borrowing availability under the ABL Revolver, $4.3 million borrowed and $15.3 million letters of credit outstanding.
Term Loan
Also as part of the refinancing we completed in March 2013, we entered into our $300.0 million six-year Term Loan, with a group of lenders with Goldman Sachs Bank USA serving as administrative agent and collateral agent for the lenders. All obligations under our Term Loan are guaranteed by certain of SIRVA Worldwide’s present and future subsidiaries. All obligations under the Term Loan, and the guarantees of those obligations, are secured, subject to certain exceptions, on a first-lien basis by (i) a pledge of 100% of certain of the capital stock held by us or any subsidiary guarantor and (ii) substantially all of the long-term assets of SIRVA Worldwide and its domestic subsidiaries and on a second-lien basis by substantially all current assets of SIRVA Worldwide and its domestic subsidiaries, including, without limitation, accounts receivable, relocation properties held for resale, cash and cash equivalents and certain related assets.
Our Term Loan currently bears interest at a rate per annum equal to, at our option, either (i) a base rate determined by reference to the higher of (a) the prime rate, (b) the federal funds effective rate plus 0.50% and (c) the one-month LIBOR rate plus 1.00% or (ii) a LIBOR rate (for the relevant interest period, and in any event, never less than 1.25%), subject to certain adjustments, in each case plus an applicable margin. The applicable margin with respect to outstanding base rate borrowings is currently 5.25% per annum and the applicable margin with respect to outstanding LIBOR borrowings is currently 6.25% per annum. The weighted average interest rate for the Term Loan since inception through February 28, 2014 was 7.5%. The Term Loan requires principal repayments in the form of quarterly installments of $0.75 million which commenced on June 30, 2013.
The Term Loan contains a number of covenants that, among other matters, restrict SIRVA Worldwide’s ability to incur additional indebtedness, pay dividends to us, make acquisitions or engage in mergers or consolidations, and make capital expenditures or incur capital lease obligations. While the Term Loan generally
129
Table of Contents
permits dividends and distributions on the capital stock of SIRVA Worldwide’s subsidiaries to SIRVA Worldwide, such dividends from SIRVA Worldwide to the Company are generally restricted. The Term Loan requires SIRVA Worldwide to maintain certain financial ratios, including a consolidated interest coverage ratio and consolidated leverage ratio. Based on the formulas set forth in the term loan credit agreement, as of December 31, 2013, we were required to maintain a maximum consolidated leverage ratio of 5.25 to 1.00 and a minimum interest coverage ratio of 2.25 to 1.00.
The Term Loan contains customary events of default, including events of default resulting from, among other things, nonpayment of principal, interest or other amounts, failure to perform covenants, inaccuracy of representations or warranties in any material respect, cross-defaults with respect to other material indebtedness of over $7.5 million, certain undischarged judgments, the occurrence of certain ERISA or bankruptcy or insolvency events or the occurrence of a change in control (as defined in the Term Loan). A bankruptcy or insolvency event of default will cause the obligations under the Term Loan to automatically become immediately due and payable.
Mortgage Credit Facilities
SIRVA Mortgage has various credit facilities to fund our mortgage loans held for resale.
SIRVA Mortgage executed master repurchase agreements with Citibank, N.A. for a $40.0 million committed revolving mortgage loan facility and a $30.0 million uncommitted revolving mortgage loan facility. These facilities expire in August 2014. There was $13.8 million and $21.6 million outstanding against the committed revolving mortgage loan facility as of December 31, 2013 and December 31, 2012, respectively. SIRVA Mortgage is required to pay a monthly facility fee of 12.5 basis points on the committed amount of $40.0 million. This facility has financial covenants which include a minimum tangible net worth of $20.0 million, a maximum total debt to tangible net worth ratio of 12:1 at all times and liquidity requirements (as defined in the agreement) of $6.5 million as of the end of each month.
SIRVA Mortgage executed a master repurchase agreement with US Bank, N.A. for a $30.0 million committed revolving mortgage loan facility. This facility expires in May 2014. There was $18.0 million and $14.6 million outstanding against the committed revolving mortgage loan facility as of December 31, 2013 and December 31, 2012, respectively. SIRVA Mortgage is required to pay a monthly facility fee of 25 basis points on the committed amount of $30.0 million. This facility has financial covenants which include a minimum tangible net worth of $13.5 million, a maximum total debt to tangible net worth ratio of 12:1 at all times and liquidity requirements (as defined in the agreement) of $6.5 million as of the end of each month.
SIRVA Mortgage executed a master repurchase agreement with Associated Bank, N.A. for a $30.0 million committed revolving mortgage loan facility. This facility expires in July 2014. There was $14.9 million and $16.0 million outstanding against the committed revolving mortgage loan facility as of December 31, 2013 and December 31, 2012, respectively. This facility has financial covenants which include a minimum tangible net worth of $13.5 million, a maximum total debt to tangible net worth ratio of 12:1 at all times and an unencumbered cash requirement of $3.0 million as of the end of each month.
During the years ended December 31, 2013 and 2012, interest on these facilities was payable monthly at a rate equivalent LIBOR plus 225.0 basis points to 350.0 basis points with a floor of zero to 3.50% (contract rates between 3.25% and 3.67% at December 31, 2013 and 3.75% and 4.00% at December 31, 2012). The interest rate spread varies depending upon such factors as the type of mortgage financed, amount of time a mortgage loan has been closed and not yet sold to investors and other factors.
Securitization Facilities
Mobility Solutions Receivable Securitization
We have a program to sell certain receivables generated by SIRVA Relocation to an independent third-party financial institution. On December 31, 2012, we entered into an agreement to amend and extend the facility. The
130
Table of Contents
maturity date has been extended until December 2015. As of December 31, 2013, the maximum borrowing capacity under the facility was $100.0 million and approximately 51% of the facility had been utilized. The receivables are primarily home equity payments and other payments made by us on behalf of transferees and corporate customers. The equity payments are evidenced by promissory notes executed by the transferees and/or supported by the underlying value of the transferees’ properties and contract arrangements with corporate customers. The equity advances generally are due within 180 to 270 days or upon the earlier sale of the underlying property.
SIRVA Relocation sells receivable portfolios to a consolidated wholly-owned bankruptcy remote special purpose vehicle, SRC. SRC then transfers its ownership in all of its receivable on a non-recourse basis to a third-party financial institution in exchange for a cash advance and a securitization receivable. SRC’s assets are not available to pay our general obligations. The receivables securitization program is accounted for as a sale of financial assets. The program does not contain any financial covenants, but does contain cross-default provisions to our ABL Revolver and Term Loan and requirements for financial reporting and actions consistent with the maintenance and servicing of the receivable obligations.
Mobility Networks Receivable Securitization
In July 2013, we entered into a program to sell certain receivables generated by our Mobility Networks segment to Deutsche Bank. The agreements have an indefinite term but can be cancelled with 30 day notice by Deutsche Bank. The receivables are amounts due from one large corporate customer. The receivables are generally due within 120 days and are secured by a contractual arrangement with the large corporate customer. We are not processing any new activity through this program and anticipate that it will be terminated in 2014.
131
Table of Contents
The following is a description of the material terms of our amended and restated certificate of incorporation and amended and restated bylaws as they will be in effect following the consummation of this offering. We refer you to our amended and restated certificate of incorporation and amended and restated bylaws, copies of which will be filed as exhibits to the registration statement of which this prospectus is a part.
Authorized Capitalization
Upon the consummation of this offering, our authorized capital stock shall consist of (i) shares of common stock, par value $0.01 per share, of which shares shall be issued and outstanding and (ii) shares of preferred stock, par value $0.01 per share, none of which will be outstanding.
Common Stock
Holders of our common stock are entitled to the following rights.
Voting Rights
Directors will be elected by a plurality of the votes entitled to be cast except as set forth below with respect to directors to be elected by the holders of common stock. Our stockholders will not have cumulative voting rights. Except as otherwise provided in our amended and restated certificate of incorporation or as required by law, all matters to be voted on by our stockholders other than matters relating to the election and removal of directors must be approved by a majority of the shares present in person or by proxy at the meeting and entitled to vote on the subject matter or by a written resolution of the stockholders representing the number of affirmative votes required for such matter at a meeting.
Dividend Rights
Holders of common stock will share equally in any dividend declared by our board of directors, subject to the rights of the holders of any outstanding preferred stock.
Liquidation Rights
In the event of any voluntary or involuntary liquidation, dissolution or winding up of our affairs, holders of our common stock would be entitled to share ratably in our assets that are legally available for distribution to stockholders after payment of liabilities. If we have any preferred stock outstanding at such time, holders of the preferred stock may be entitled to distribution and/or liquidation preferences. In either such case, we must pay the applicable distribution to the holders of our preferred stock before we may pay distributions to the holders of our common stock.
Other Rights
Our stockholders have no preemptive or other rights to subscribe for additional shares. All holders of our common stock are entitled to share equally on a share-for-share basis in any assets available for distribution to common stockholders upon our liquidation, dissolution or winding up. All outstanding shares are, and all shares offered by this prospectus will be, when sold, validly issued, fully paid and nonassessable.
Preferred Stock
Our board of directors is authorized to provide for the issuance of preferred stock in one or more series and to fix the preferences, powers and relative, participating, optional or other special rights and qualifications,
132
Table of Contents
limitations or restrictions thereof, including the dividend rate, conversion rights, voting rights, redemption rights and liquidation preference and to fix the number of shares to be included in any such series without any further vote or action by our stockholders. Any preferred stock so issued may rank senior to our common stock with respect to the payment of dividends or amounts upon liquidation, dissolution or winding up, or both. In addition, any such shares of preferred stock may have class or series voting rights. The issuance of preferred stock may have the effect of delaying, deferring or preventing a change in control of our company without further action by the stockholders and may adversely affect the voting and other rights of the holders of our common stock.
Registration Rights
Our existing stockholders have certain registration rights with respect to our common stock pursuant to a registration rights agreement. See “Certain Relationships and Related Person Transactions—Registration Rights Agreement.”
Corporate Opportunities
Our amended and restated certificate of incorporation provides that directors appointed by Aurora or EGI do not have any obligation to offer us an opportunity to participate in business opportunities presented to Aurora and EGI even if the opportunity is one that we might reasonably have pursued (and therefore may be free to compete with us in the same business or similar businesses), and that, to the extent permitted by law, Aurora and EGI will not be liable to us or our stockholders for breach of any duty by reason of any such activities.
Listing
We intend to apply to have our common stock listed on the NYSE or Nasdaq under the symbol “ .”
Transfer Agent and Registrar
The transfer agent and registrar for our common stock will be .
133
Table of Contents
SHARES ELIGIBLE FOR FUTURE SALE
There is no existing public market for our common stock. Future sales of our common stock in the public market, or the perception that sales may occur, could materially adversely affect the prevailing market price of our common stock at such time and our ability to raise equity capital in the future.
Sale of Restricted Securities
Upon consummation of this offering, we will have shares of our common stock outstanding (or shares, if the underwriters exercise their option to purchase additional shares in full). Of these shares, all shares sold in this offering will be freely tradable without further restriction or registration under the Securities Act, except that any shares purchased by our affiliates may generally only be sold in compliance with Rule 144, which is described below. Of the remaining outstanding shares, shares will be deemed “restricted securities” under the Securities Act.
Lock-Up Arrangements and Registration Rights
In connection with this offering, we, each of our directors, executive officers and the selling stockholders, as well as certain other stockholders, will enter into lock-up agreements described under “Underwriting” that restrict the sale of our securities for up to 180 days after the date of this prospectus, subject to certain exceptions or an extension in certain circumstances.
In addition, following the expiration of the lock-up period, certain stockholders will have the right, subject to certain conditions, to require us to register the sale of their shares of our common stock under federal securities laws. See “Certain Relationships and Related Person Transactions—Registration Rights Agreement.” If these stockholders exercise this right, our other existing stockholders may require us to register their registrable securities.
Following the lock-up periods described above, all of the shares of our common stock that are restricted securities or are held by our affiliates as of the date of this prospectus will be eligible for sale in the public market in compliance with Rule 144 under the Securities Act.
Rule 144
The shares of our common stock sold in this offering will generally be freely transferable without restriction or further registration under the Securities Act, except that any shares of our common stock held by an “affiliate” of ours may not be resold publicly except in compliance with the registration requirements of the Securities Act or under an exemption under Rule 144 or otherwise. Rule 144 permits our common stock that has been acquired by a person who is an affiliate of ours, or has been an affiliate of ours within the past three months, to be sold into the market in an amount that does not exceed, during any three-month period, the greater of:
| • | one percent of the total number of shares of our common stock outstanding; or |
| • | the average weekly reported trading volume of our common stock for the four calendar weeks prior to the sale. |
Such sales are also subject to specific manner of sale provisions, a six-month holding period requirement, notice requirements and the availability of current public information about us.
Approximately shares of our common stock that are not subject to lock-up arrangements described above will be eligible for sale under Rule 144 immediately upon the closing
Rule 144 also provides that a person who is not deemed to have been an affiliate of ours at any time during the three months preceding a sale, and who has for at least six months beneficially owned shares of our common stock that are restricted securities, will be entitled to freely sell such shares of our common stock subject only to
134
Table of Contents
the availability of current public information regarding us. A person who is not deemed to have been an affiliate of ours at any time during the three months preceding a sale, and who has beneficially owned for at least one year shares of our common stock that are restricted securities, will be entitled to freely sell such shares of our common stock under Rule 144 without regard to the current public information requirements of Rule 144.
Additional Registration Statements
We intend to file a registration statement on Form S-8 under the Securities Act to register shares of our common stock to be issued or reserved for issuance under our equity incentive plans. Such registration statement is expected to be filed soon after the date of this prospectus and will automatically become effective upon filing with the SEC. Accordingly, shares registered under such registration statement will be available for sale in the open market, unless such shares are subject to vesting restrictions with us or the lock-up restrictions described above.
135
Table of Contents
MATERIAL U.S. FEDERAL INCOME TAX CONSIDERATIONS FOR
NON-U.S. HOLDERS
The following discussion summarizes the material U.S. federal income and estate tax consequences to non-U.S. holders (as defined below) of ownership and disposition of our common stock. This summary does not provide a complete analysis of all potential U.S. federal income tax and estate tax considerations relating thereto. The information provided below is based on the Internal Revenue Code of 1986, as amended (the “Code”), and administrative pronouncements, judicial decisions and final, temporary and proposed Treasury regulations as of the date hereof, changes to any of which subsequent to the date of this prospectus may affect the tax consequences described herein. In addition, this summary does not address the Medicare tax on certain investment income or any state, local or foreign taxes or any U.S. federal tax laws other than U.S. federal income tax laws and estate tax laws. Persons considering the purchase, ownership, or disposition of our common stock should consult their tax advisors concerning U.S. federal, state, local, foreign or other tax consequences in light of their particular situations.
As used in this section, a “non-U.S. holder” is a beneficial owner of our common stock that is not, for U.S. federal income tax purposes:
| • | any individual who is a citizen or resident of the United States, |
| • | a corporation (or other entity taxable as a corporation) created or organized in or under the laws of the United States, any state thereof or the District of Columbia, |
| • | any estate the income of which is subject to U.S. federal income taxation regardless of its source, or |
| • | any trust if (i) a court within the United States is able to exercise primary supervision over the administration of the trust and one or more U.S. persons have the authority to control all substantial decisions of the trust or (ii) it has a valid election in effect under applicable U.S. Treasury regulations to be treated as a U.S. person. |
If you are an individual, you may, in many cases, be deemed to be a resident alien, as opposed to a nonresident alien, by virtue of being present in the United States for at least 31 days in the calendar year and for an aggregate of at least 183 days during a three-year period ending in the current calendar year. For these purposes, all the days present in the current year, one-third of the days present in the immediately preceding year, and one-sixth of the days present in the second preceding year are counted. Resident aliens are subject to U.S. federal income tax as if they were U.S. citizens. Such an individual is urged to consult his or her own tax advisor regarding the U.S. federal income tax consequences of the ownership or disposition of our common stock. If a partnership or other pass-through entity is a beneficial owner of our common stock, the tax treatment of a partner in the partnership or an owner of the entity will depend upon the status of the partner or other owner and the activities of the partnership or other entity. Any partner in a partnership or owner of a pass-through entity holding shares of our common stock should consult its own tax advisor.
This discussion assumes that a non-U.S. holder will hold our common stock as a capital asset (generally, property held for investment). The summary generally does not address tax considerations that may be relevant to particular investors because of their specific circumstances, or because they are subject to special rules, including, without limitation if the investor is a “controlled foreign corporation,” “passive foreign investment company” or former citizen or long-term resident of the United States. If you fall within any of the foregoing categories, this description does not apply to you, and you should consult with your own tax advisor about the tax consequences of acquiring, owning, and disposing of our common stock.
INVESTORS CONSIDERING THE PURCHASE OF OUR COMMON STOCK SHOULD CONSULT THEIR OWN TAX ADVISORS REGARDING THE APPLICATION OF THE U.S. FEDERAL INCOME AND ESTATE TAX LAWS TO THEIR PARTICULAR SITUATIONS AND THE CONSEQUENCES OF FOREIGN, STATE OR LOCAL LAWS AND TAX TREATIES.
136
Table of Contents
Distributions on Common Stock
We do not expect to declare or pay any dividends on our common stock in the foreseeable future. If we do pay dividends on shares of our common stock, however, such distributions will constitute dividends for U.S. federal income tax purposes to the extent paid from our current or accumulated earnings and profits, as determined under U.S. federal income tax principles. Distributions in excess of our current and accumulated earnings and profits will constitute a return of capital that is applied against and reduces, but not below zero, a non-U.S. holder’s adjusted tax basis in shares of our common stock. Any remaining excess will be treated as gain realized on the sale or other disposition of our common stock. See “—Disposition of Common Stock.”
Any dividend paid to a non-U.S. holder on our common stock will generally be subject to U.S. federal withholding tax at a 30% rate. The withholding tax might not apply, however, or might apply at a reduced rate, under the terms of an applicable U.S. income tax treaty. You should consult your tax advisors regarding your entitlement to benefits under a relevant income tax treaty. Generally, in order for us or our paying agent to withhold tax at a lower treaty rate, a non-U.S. holder must certify its entitlement to treaty benefits. A non-U.S. holder generally can meet this certification requirement by providing an IRS Form W-8BEN (or any successor form) or appropriate substitute form to us or our paying agent. If the non-U.S. holder holds the stock through a financial institution or other agent acting on the holder’s behalf, the holder will be required to provide appropriate documentation to the agent. The holder’s agent will then be required to provide certification to us or our paying agent, either directly or through other intermediaries.
Dividends received by a non-U.S. holder that are effectively connected with a U.S. trade or business conducted by the non-U.S. holder, and if required by an applicable U.S. income tax treaty, are attributable to a permanent establishment (or, in certain cases involving individual holders, a fixed base) maintained by the non-U.S. holder in the United States, are not subject to such withholding tax. To obtain this exemption, a non-U.S. holder must provide us with an IRS Form W-8ECI properly certifying such exemption. Such effectively connected dividends, although not subject to withholding tax, are taxed at the same graduated rates applicable to U.S. persons, net of certain deductions and credits. In addition to the graduated tax described above, such effectively connected dividends received by corporate non-U.S. holders may also be subject to a branch profits tax at a rate of 30% or such lower rate as may be specified by an applicable tax treaty.
Dispositions of Common Stock
Subject to the discussion below on backup withholding and other withholding requirements, gain realized by a non-U.S. holder on a sale, exchange or other disposition of our common stock generally will not be subject to U.S. federal income or withholding tax, unless:
| • | the gain (1) is effectively connected with the conduct by the non-U.S. holder of a U.S. trade or business and (2) if required by an applicable U.S. income tax treaty, is attributable to a permanent establishment (or, in certain cases involving individual holders, a fixed base) maintained by the non-U.S. holder in the United States (in which case the special rules described below apply), |
| • | the non-U.S. holder is an individual who is present in the United States for 183 or more days in the taxable year of such disposition and certain other conditions are met (in which case the gain would be subject to a flat 30% tax, or such reduced rate as may be specified by an applicable income tax treaty, which may be offset by U.S. source capital losses), or |
| • | we are, or have been, a U.S. real property holding corporation (a “USRPHC”) for U.S. federal income tax purposes at any time during the shorter of the five-year period ending on the date of disposition of our common stock and the non-U.S. holder’s holding period for our common stock. |
Generally, a corporation is a USRPHC if the fair market value of its “United States real property interests” equals 50% or more of the sum of the fair market value of (a) its worldwide real property interests and (b) its other assets used or held for use in a trade or business. The tax relating to stock in a USRPHC does not apply to a non-U.S. holder whose holdings, actual and constructive, amount to 5% or less of our common stock at all times during
137
Table of Contents
the applicable period, provided that our common stock is regularly traded on an established securities market. We believe we have not been and are not currently a USRPHC, and do not anticipate being a USRPHC in the future.
If any gain from the sale, exchange or other disposition of our common stock, (1) is effectively connected with a U.S. trade or business conducted by a non-U.S. holder and (2) if required by an applicable U.S. income tax treaty, is attributable to a permanent establishment (or, in certain cases involving individuals, a fixed base) maintained by such non-U.S. holder in the United States, then the gain generally will be subject to U.S. federal income tax at the same graduated rates applicable to U.S. persons, net of certain deductions and credits. If the non-U.S. holder is a corporation, it also may be subject to the branch profits tax at a 30% rate, or such lower rate as may be specified by an applicable income tax treaty.
U.S. Federal Estate Tax
The estates of nonresident alien individuals generally are subject to U.S. federal estate tax on property with a U.S. situs. Because we are a U.S. corporation, our common stock will be U.S. situs property and therefore will be included in the taxable estate of a nonresident alien decedent, unless an applicable estate tax treaty between the United States and the decedent’s country of residence provides otherwise.
Backup Withholding and Information Reporting
Any dividends that are paid to a non-U.S. holder must be reported annually to the IRS and to the non-U.S. holder. Copies of these information returns also may be made available to the tax authorities of the country in which the non-U.S. holder resides under the provisions of various treaties or agreements for the exchange of information. Unless the non-U.S. holder is an exempt recipient, dividends paid on our common stock and the gross proceeds from a taxable disposition of our common stock may be subject to additional information reporting and may also be subject to U.S. federal backup withholding (at a rate of 28%) if such non-U.S. holder fails to comply with applicable U.S. information reporting and certification requirements. Provision of any IRS Form W-8 appropriate to the non-U.S. holder’s circumstances will satisfy the certification requirements necessary to avoid the backup withholding tax.
Backup withholding is not an additional tax. Any amounts so withheld under the backup withholding rules will be refunded by the IRS or credited against the non-U.S. holder’s U.S. federal income tax liability, provided that the required information is timely furnished to the IRS.
Other Withholding Requirements
Non-U.S. holders of our common stock may be subject to U.S. withholding tax at a rate of 30% under sections 1471 through 1474 of the Code (commonly referred to as “FATCA”). This withholding tax may apply if a non-U.S. holder (or any foreign intermediary that receives a payment on a non-U.S. holder’s behalf) does not comply with certain U.S. information reporting requirements and does not otherwise qualify for an exemption from these rules. The payments potentially subject to this withholding tax include dividends on, and gross proceeds from the sale or other disposition of, our common stock. If FATCA is not complied with, the withholding tax described above will apply to dividends paid on or after July 1, 2014, and to gross proceeds from the sale or other disposition of our common stock on or after January 1, 2017. Certain non-U.S. holders located in jurisdictions that have an intergovernmental agreement with the United States governing FATCA may be subject to different rules. Non-U.S. holders should consult their tax advisors regarding the possible implications of FATCA for their investment in our common stock.
THE PRECEDING DISCUSSION OF U.S. FEDERAL TAX CONSIDERATIONS IS FOR GENERAL INFORMATION ONLY. IT IS NOT TAX ADVICE. EACH PROSPECTIVE INVESTOR SHOULD CONSULT ITS OWN TAX ADVISOR REGARDING THE PARTICULAR U.S. FEDERAL, STATE, LOCAL AND FOREIGN TAX CONSEQUENCES OF PURCHASING, HOLDING AND DISPOSING OF OUR COMMON STOCK, INCLUDING THE CONSEQUENCES OF ANY PROPOSED CHANGE IN APPLICABLE LAWS.
138
Table of Contents
Under the terms and subject to the conditions in an underwriting agreement dated the date of this prospectus, the underwriters named below, for whom Morgan Stanley & Co. LLC and Goldman, Sachs & Co. are acting as representatives, have severally agreed to purchase, and we and the selling stockholders have agreed to sell to them, severally, the number of shares indicated below:
| Name |
Number of Shares | |
| Morgan Stanley & Co. LLC |
||
| Goldman, Sachs & Co. |
||
| J.P. Morgan Securities LLC |
||
| Robert W. Baird & Co. Incorporated |
||
| William Blair & Company, L.L.C. |
||
| Total |
||
|
|
The underwriters and the representatives are collectively referred to as the “underwriters” and the “representatives,” respectively. The underwriters are offering the shares of common stock subject to their acceptance of the shares from us and subject to prior sale. The underwriting agreement provides that the obligations of the several underwriters to pay for and accept delivery of the shares of common stock offered by this prospectus are subject to the approval of certain legal matters by their counsel and to certain other conditions. The underwriters are obligated to take and pay for all of the shares of common stock offered by this prospectus if any such shares are taken. However, the underwriters are not required to take or pay for the shares covered by the underwriters’ over-allotment option described below.
The underwriters initially propose to offer part of the shares of common stock directly to the public at the offering price listed on the cover page of this prospectus and part to certain dealers. After the initial offering of the shares of common stock, the offering price and other selling terms may from time to time be varied by the representatives.
We have granted to the underwriters an option, exercisable for 30 days from the date of this prospectus, to purchase up to additional shares of common stock at the public offering price listed on the cover page of this prospectus, less underwriting discounts and commissions, and the selling stockholders have granted to the underwriters an option, exercisable for 30 days from the date of the prospectus, to purchase up to additional shares of common stock at the public offering price listed on the cover page of this prospectus, less underwriting discounts and commissions. The underwriters may exercise this option solely for the purpose of covering over-allotments, if any, made in connection with the offering of the shares of common stock offered by this prospectus. To the extent the option is exercised, each underwriter will become obligated, subject to certain conditions, to purchase about the same percentage of the additional shares of common stock as the number listed next to the underwriter’s name in the preceding table bears to the total number of shares of common stock listed next to the names of all underwriters in the preceding table.
The following table shows the per share and total public offering price, underwriting discounts and commissions, and proceeds before expenses to us and the selling stockholders. These amounts are shown assuming both no exercise and full exercise of the underwriters’ option to purchase up to an additional shares of common stock.
| Total | ||||||||||||
| Per Share | No Exercise | Full Exercise | ||||||||||
| Public offering price |
$ | $ | $ | |||||||||
| Underwriting discounts and commissions to be paid by: |
||||||||||||
| Us |
$ | $ | $ | |||||||||
| The selling stockholders |
$ | $ | $ | |||||||||
| Proceeds, before expenses, to us |
$ | $ | $ | |||||||||
| Proceeds, before expenses, to selling stockholders |
$ | $ | $ | |||||||||
139
Table of Contents
The estimated offering expenses payable by us, exclusive of the underwriting discounts and commissions, are approximately $ . We have agreed to reimburse the underwriters for expense relating to clearance of this offering with the Financial Industry Regulatory Authority up to $ .
The underwriters have informed us that they do not intend sales to discretionary accounts to exceed 5% of the total number of shares of common stock offered by them.
We expect the shares to be approved for listing on the NYSE or Nasdaq under the trading symbol “ ”.
We and all directors and officers and the holders of all of our outstanding stock and stock options have agreed that, without the prior written consent of Morgan Stanley & Co. LLC on behalf of the underwriters, we and they will not, during the period ending 180 days after the date of this prospectus (the “restricted period”):
| • | offer, pledge, sell, contract to sell, sell any option or contract to purchase, purchase any option or contract to sell, grant any option, right or warrant to purchase, lend or otherwise transfer or dispose of, directly or indirectly, any shares of common stock or any securities convertible into or exercisable or exchangeable for shares of common stock; |
| • | file any registration statement with the Securities and Exchange Commission relating to the offering of any shares of common stock or any securities convertible into or exercisable or exchangeable for common stock; or |
| • | enter into any swap or other arrangement that transfers to another, in whole or in part, any of the economic consequences of ownership of the common stock, |
whether any such transaction described above is to be settled by delivery of common stock or such other securities, in cash or otherwise. In addition, we and each such person agrees that, without the prior written consent of Morgan Stanley & Co. LLC on behalf of the underwriters, we or such other person will not, during the restricted period, make any demand for, or exercise any right with respect to, the registration of any shares of common stock or any security convertible into or exercisable or exchangeable for common stock.
The restrictions described in the immediately preceding paragraph to do not apply to:
| • | the sale of shares to the underwriters; or |
| • | the issuance by the Company of shares of common stock upon the exercise of an option or a warrant or the conversion of a security outstanding on the date of this prospectus of which the underwriters have been advised in writing; or |
| • | the establishment of a trading plan pursuant to Rule 10b5-1 under the Securities Exchange Act of 1934, as amended (the “Exchange Act”), for the transfer of shares of common stock, provided that (i) such plan does not provide for the transfer of common stock during the restricted period and (ii) to the extent a public announcement or filing under the Exchange Act, if any, is required of or voluntarily made regarding the establishment of such plan, such announcement or filing shall include a statement to the effect that no transfer of common stock may be made under such plan during the restricted period. |
The restricted period described in the preceding paragraph will be extended if:
| • | during the last 17 days of the restricted period we issue an earnings release or material news event relating to us occurs, or |
| • | prior to the expiration of the restricted period, we announce that we will release earnings results during the 16-day period beginning on the last day of the restricted period or provide notification to Morgan Stanley & Co. LLC of any earnings release or material news or material event that may give rise to an extension of the initial restricted period, |
140
Table of Contents
in which case the restrictions described in the preceding paragraph will continue to apply until the expiration of the 18-day period beginning on the issuance of the earnings release or the occurrence of the material news or material event.
Morgan Stanley & Co. LLC, in its sole discretion, may release the common stock and other securities subject to the lock-up agreements described above in whole or in part at any time with or without notice.
In order to facilitate the offering of the common stock, the underwriters may engage in transactions that stabilize, maintain or otherwise affect the price of the common stock. Specifically, the underwriters may sell more shares than they are obligated to purchase under the underwriting agreement, creating a short position. A short sale is covered if the short position is no greater than the number of shares available for purchase by the underwriters under the over-allotment option. The underwriters can close out a covered short sale by exercising the over-allotment option or purchasing shares in the open market. In determining the source of shares to close out a covered short sale, the underwriters will consider, among other things, the open market price of shares compared to the price available under the over-allotment option. The underwriters may also sell shares in excess of the over-allotment option, creating a naked short position. The underwriters must close out any naked short position by purchasing shares in the open market. A naked short position is more likely to be created if the underwriters are concerned that there may be downward pressure on the price of the common stock in the open market after pricing that could adversely affect investors who purchase in this offering. As an additional means of facilitating this offering, the underwriters may bid for, and purchase, shares of common stock in the open market to stabilize the price of the common stock. These activities may raise or maintain the market price of the common stock above independent market levels or prevent or retard a decline in the market price of the common stock. The underwriters are not required to engage in these activities and may end any of these activities at any time.
We, the selling stockholders and the underwriters have agreed to indemnify each other against certain liabilities, including liabilities under the Securities Act.
A prospectus in electronic format may be made available on websites maintained by one or more underwriters, or selling group members, if any, participating in this offering. The representatives may agree to allocate a number of shares of common stock to underwriters for sale to their online brokerage account holders. Internet distributions will be allocated by the representatives to underwriters that may make Internet distributions on the same basis as other allocations.
The underwriters and their respective affiliates are full service financial institutions engaged in various activities, which may include securities trading, commercial and investment banking, financial advisory, investment management, investment research, principal investment, hedging, financing and brokerage activities. Affiliates of certain of the underwriters are arrangers, lenders and/or agents under the Term Loan and the ABL Revolver and receive customary fees and expenses in connection therewith. Certain of the underwriters and their respective affiliates may in the future perform various financial advisory and investment banking services for us, for which they will receive customary fees and expenses.
In addition, in the ordinary course of their various business activities, the underwriters and their respective affiliates may make or hold a broad array of investments and actively trade debt and equity securities (or related derivative securities) and financial instruments (including bank loans) for their own account and for the accounts of their customers and may at any time hold long and short positions in such securities and instruments. Such investment and securities activities may involve our securities and instruments. The underwriters and their respective affiliates may also make investment recommendations or publish or express independent research views in respect of such securities or instruments and may at any time hold, or recommend to customers that they acquire, long or short positions in such securities and instruments.
Rothschild Inc. (“Rothschild”) has acted as our financial advisor in connection with this offering. Rothschild is not acting as an underwriter in connection with this offering, and accordingly, Rothschild is neither purchasing
141
Table of Contents
shares nor offering shares to the public in connection with this offering. The maximum aggregate compensation that Rothschild is eligible to receive in connection with this offering, including reimbursement of out-of-pocket expenses, is $ .
Pricing of the Offering
There is no existing public market for our common stock. The initial public offering price was determined by negotiations between us and the representatives. Among the factors considered in determining the initial public offering price were our future prospects and those of our industry in general, our sales, earnings and certain other financial and operating information in recent periods, and the price-earnings ratios, price-sales ratios, market prices of securities, and certain financial and operating information of companies engaged in activities similar to ours. The estimated initial public offering price range set forth on the cover page of this preliminary prospectus is subject to change as a result of market conditions and other factors. We cannot assure you that the prices at which the shares will sell in the public market after this offering will not be lower than the initial public offering price or that an active trading market in our common stock will develop and continue after this offering.
Selling Restrictions
European Economic Area
In relation to each Member State of the European Economic Area which has implemented the Prospectus Directive (each, a “Relevant Member State”) an offer to the public of any shares of our common stock may not be made in that Relevant Member State, except that an offer to the public in that Relevant Member State of any shares of our common stock may be made at any time under the following exemptions under the Prospectus Directive, if they have been implemented in that Relevant Member State:
(a) to any legal entity which is a qualified investor as defined in the Prospectus Directive;
(b) to fewer than 100 or, if the Relevant Member State has implemented the relevant provision of the 2010 PD Amending Directive, 150, natural or legal persons (other than qualified investors as defined in the Prospectus Directive), as permitted under the Prospectus Directive, subject to obtaining the prior consent of the representatives for any such offer; or
(c) in any other circumstances falling within Article 3(2) of the Prospectus Directive, provided that no such offer of shares of our common stock shall result in a requirement for the publication by us or any underwriter of a prospectus pursuant to Article 3 of the Prospectus Directive.
For the purposes of this provision, the expression an “offer to the public” in relation to any shares of our common stock in any Relevant Member State means the communication in any form and by any means of sufficient information on the terms of the offer and any shares of our common stock to be offered so as to enable an investor to decide to purchase any shares of our common stock, as the same may be varied in that Member State by any measure implementing the Prospectus Directive in that Member State, the expression “Prospectus Directive” means Directive 2003/71/EC (and amendments thereto, including the 2010 PD Amending Directive, to the extent implemented in the Relevant Member State), and includes any relevant implementing measure in the Relevant Member State, and the expression “2010 PD Amending Directive” means Directive 2010/73/EU.
United Kingdom
Each underwriter has represented and agreed that:
(a) it has only communicated or caused to be communicated and will only communicate or cause to be communicated an invitation or inducement to engage in investment activity (within the meaning of Section 21 of the FSMA) received by it in connection with the issue or sale of the shares of our common stock in circumstances in which Section 21(1) of the FSMA does not apply to us; and
142
Table of Contents
(b) it has complied and will comply with all applicable provisions of the FSMA with respect to anything done by it in relation to the shares of our common stock in, from or otherwise involving the United Kingdom.
Notice to Prospective Investors in Switzerland
The shares of common stock may not be publicly offered in Switzerland and will not be listed on the SIX Swiss Exchange (“SIX”) or on any other stock exchange or regulated trading facility in Switzerland. This document has been prepared without regard to the disclosure standards for issuance prospectuses under art. 652a or art. 1156 of the Swiss Code of Obligations or the disclosure standards for listing prospectuses under art. 27 ff. of the SIX Listing Rules or the listing rules of any other stock exchange or regulated trading facility in Switzerland. Neither this document nor any other offering or marketing material relating to the shares or the offering may be publicly distributed or otherwise made publicly available in Switzerland.
Neither this document nor any other offering or marketing material relating to the offering, the Company, or the shares have been or will be filed with or approved by any Swiss regulatory authority. In particular, this document will not be filed with, and the offer of shares will not be supervised by, the Swiss Financial Market Supervisory Authority FINMA (“FINMA”), and the offer of shares has not been and will not be authorized under the Swiss Federal Act on Collective Investment Schemes (“CISA”). The investor protection afforded to acquirers of interests in collective investment schemes under the CISA does not extend to acquirers of shares.
Notice to Prospective Investors in the Dubai International Financial Centre
This prospectus relates to an Exempt Offer in accordance with the Offered Securities Rules of the Dubai Financial Services Authority (“DFSA”). This prospectus is intended for distribution only to persons of a type specified in the Offered Securities Rules of the DFSA. It must not be delivered to, or relied on by, any other person. The DFSA has no responsibility for reviewing or verifying any documents in connection with Exempt Offers. The DFSA has not approved this prospectus nor taken steps to verify the information set forth herein and has no responsibility for the prospectus. The shares to which this prospectus relates may be illiquid and/or subject to restrictions on their resale. Prospective purchasers of the shares offered should conduct their own due diligence on the shares. If you do not understand the contents of this prospectus you should consult an authorized financial advisor.
Notice to Prospective Investors in Hong Kong
The shares of common stock have not been offered or sold and will not be offered or sold in Hong Kong, by means of any document, other than (a) to “professional investors” as defined in the Securities and Futures Ordinance (Cap. 571) of Hong Kong and any rules made under that Ordinance; or (b) in other circumstances which do not result in the document being a “prospectus” as defined in the Companies Ordinance (Cap. 32) of Hong Kong or which do not constitute an offer to the public within the meaning of that Ordinance. No advertisement, invitation or document relating to the shares of common stock has been or may be issued or has been or may be in the possession of any person for the purposes of issue, whether in Hong Kong or elsewhere, which is directed at, or the contents of which are likely to be accessed or read by, the public of Hong Kong (except if permitted to do so under the securities laws of Hong Kong) other than with respect to shares of common stock which are or are intended to be disposed of only to persons outside Hong Kong or only to “professional investors” as defined in the Securities and Futures Ordinance and any rules made under that Ordinance.
Notice to Prospective Investors in Japan
The shares of common stock have not been and will not be registered under the Financial Instruments and Exchange Law of Japan (Law No. 25 of 1948, as amended) and, accordingly, will not be offered or sold, directly or indirectly, in Japan, or for the benefit of any Japanese Person or to others for re-offering or resale, directly or
143
Table of Contents
indirectly, in Japan or to any Japanese Person, except in compliance with all applicable laws, regulations and ministerial guidelines promulgated by relevant Japanese governmental or regulatory authorities in effect at the relevant time. For the purposes of this paragraph, “Japanese Person” shall mean any person resident in Japan, including any corporation or other entity organized under the laws of Japan.
Notice to Prospective Investors in Singapore
This prospectus has not been registered as a prospectus with the Monetary Authority of Singapore. Accordingly, this prospectus and any other document or material in connection with the offer or sale, or invitation for subscription or purchase, of the shares of common stock may not be circulated or distributed, nor may the shares of common stock be offered or sold, or be made the subject of an invitation for subscription or purchase, whether directly or indirectly, to persons in Singapore other than (i) to an institutional investor under Section 274 of the Securities and Futures Act, Chapter 289 of Singapore (the “SFA”), (ii) to a relevant person pursuant to Section 275(1), or any person pursuant to Section 275(1A), and in accordance with the conditions specified in Section 275, of the SFA, or (iii) otherwise pursuant to, and in accordance with the conditions of, any other applicable provision of the SFA.
Where the shares of common stock are subscribed or purchased under Section 275 of the SFA by a relevant person which is:
(a) a corporation (which is not an accredited investor (as defined in Section 4A of the SFA)) the sole business of which is to hold investments and the entire share capital of which is owned by one or more individuals, each of whom is an accredited investor; or
(b) a trust (where the trustee is not an accredited investor) whose sole purpose is to hold investments and each beneficiary of the trust is an individual who is an accredited investor,
securities (as defined in Section 239(1) of the SFA) of that corporation or the beneficiaries’ rights and interest (howsoever described) in that trust shall not be transferred within six months after that corporation or that trust has acquired the shares of common stock pursuant to an offer made under Section 275 of the SFA except:
(a) to an institutional investor or to a relevant person defined in Section 275(2) of the SFA, or to any person arising from an offer referred to in Section 275(1A) or Section 276(4)(i)(B) of the SFA;
(b) where no consideration is or will be given for the transfer;
(c) where the transfer is by operation of law;
(d) as specified in Section 276(7) of the SFA; or
(e) as specified in Regulation 32 of the Securities and Futures (Offers of Investments) (Shares and Debentures) Regulations 2005 of Singapore.
144
Table of Contents
Weil, Gotshal & Manges LLP, New York, New York, has passed upon the validity of the common stock offered hereby on behalf of us. Certain legal matters will be passed upon on behalf of the underwriters by Latham & Watkins LLP, Washington, District of Columbia.
The consolidated financial statements of SIRVA, Inc. as of December 31, 2013 and 2012 and for each of the three years in the period ended December 31, 2013, appearing in this prospectus and registration statement have been audited by Ernst & Young LLP, independent registered public accounting firm, as set forth in their report thereon appearing elsewhere herein, and are included in reliance upon such report given on the authority of such firm as experts in accounting and auditing.
WHERE YOU CAN FIND MORE INFORMATION
We have filed a registration statement on Form S-1 with the SEC for the stock we are offering by this prospectus. This prospectus does not include all of the information contained in the registration statement. You should refer to the registration statement and its exhibits for additional information. Whenever we make reference in this prospectus to any of our contracts, agreements or other documents, the references are not necessarily complete and you should refer to the exhibits attached to the registration statement for copies of the actual contract, agreement or other document. When we complete this offering, we will also be required to file annual, quarterly and current reports, proxy statements and other information with the SEC.
You can read our SEC filings, including the registration statement, over the Internet at the SEC’s website at http://www.sec.gov. You may also read and copy any document we file with the SEC at its public reference facilities at 100 F Street, N.E., Room 1580, Washington, DC 20549. You may also obtain copies of the documents at prescribed rates by writing to the Public Reference Section at the SEC at 100 F Street, NE, Room 1580, Washington, DC 20549. Please call the SEC at 1-800-SEC-0330 for further information on the operation of the public reference facilities.
You may obtain a copy of any of our filings, at no cost, by writing or telephoning us at:
One Parkview Plaza
Oakbrook Terrace, IL 60181
Telephone: (630) 570-3050
145
Table of Contents
| Page | ||||
| AUDITED CONSOLIDATED FINANCIAL STATEMENTS: |
||||
| F-2 | ||||
| Consolidated Statements of Operations for the Years Ended December 31, 2013, 2012 and 2011 |
F-3 | |||
| F-4 | ||||
| F-5 | ||||
| F-6 | ||||
| Consolidated Statements of Cash Flows for the Years Ended December 31, 2013, 2012 and 2011 |
F-7 | |||
| F-8 | ||||
F-1
Table of Contents
Report of Independent Registered Public Accounting Firm
The Board of Directors and Stockholders of SIRVA, Inc.
We have audited the accompanying consolidated balance sheets of SIRVA, Inc. as of December 31, 2013 and 2012, and the related consolidated statements of operations, comprehensive income (loss), stockholders’ equity (deficit), and cash flows for each of the three years in the period ended December 31, 2013. These financial statements are the responsibility of the Company’s management. Our responsibility is to express an opinion on these financial statements based on our audits.
We conducted our audits in accordance with the standards of the Public Company Accounting Oversight Board (United States). Those standards require that we plan and perform the audit to obtain reasonable assurance about whether the financial statements are free of material misstatement. We were not engaged to perform an audit of the Company’s internal control over financial reporting. Our audits included consideration of internal control over financial reporting as a basis for designing audit procedures that are appropriate in the circumstances, but not for the purpose of expressing an opinion on the effectiveness of the Company’s internal control over financial reporting. Accordingly, we express no such opinion. An audit also includes examining, on a test basis, evidence supporting the amounts and disclosures in the financial statements, assessing the accounting principles used and significant estimates made by management, and evaluating the overall financial statement presentation. We believe that our audits provide a reasonable basis for our opinion.
In our opinion, the financial statements referred to above present fairly, in all material respects, the consolidated financial position of SIRVA, Inc. at December 31, 2013 and 2012, and the consolidated results of its operations and its cash flows for each of the three years in the period ended December 31, 2013, in conformity with U.S. generally accepted accounting principles.
/s/ Ernst & Young LLP
Chicago, Illinois
March 27, 2014
F-2
Table of Contents
SIRVA, INC.
Consolidated Statements of Operations
| For the Years Ended December 31, |
||||||||||||
| (In millions, except share and per share amounts) |
2013 | 2012 | 2011 | |||||||||
| Revenue: |
||||||||||||
| Service revenue |
$ | 1,470.4 | $ | 1,456.4 | $ | 1,386.7 | ||||||
| Home revenue |
523.8 | 494.4 | 545.7 | |||||||||
|
|
|
|
|
|
|
|||||||
| Total revenue |
1,994.2 | 1,950.8 | 1,932.4 | |||||||||
| Direct expenses: |
||||||||||||
| Purchased transportation expense |
1,004.6 | 1,006.5 | 953.8 | |||||||||
| Home cost |
526.9 | 497.3 | 549.7 | |||||||||
| Other direct expense |
232.7 | 225.5 | 220.5 | |||||||||
|
|
|
|
|
|
|
|||||||
| Total direct expenses |
1,764.2 | 1,729.3 | 1,724.0 | |||||||||
|
|
|
|
|
|
|
|||||||
| Gross profit |
230.0 | 221.5 | 208.4 | |||||||||
| Operating expenses: |
||||||||||||
| Selling, general and administrative expense |
180.8 | 184.0 | 192.3 | |||||||||
| Intangibles amortization |
7.3 | 9.3 | 10.4 | |||||||||
| Restructuring and impairment expense |
2.3 | 2.3 | 3.7 | |||||||||
|
|
|
|
|
|
|
|||||||
| Operating income from continuing operations |
39.6 | 25.9 | 2.0 | |||||||||
| Interest expense, net |
26.2 | 25.1 | 32.2 | |||||||||
| Debt extinguishment loss (gain), net |
8.0 | (0.3 | ) | 16.8 | ||||||||
| Other expense, net |
0.5 | — | 1.3 | |||||||||
|
|
|
|
|
|
|
|||||||
| Income (loss) from continuing operations before income taxes |
4.9 | 1.1 | (48.3 | ) | ||||||||
| Income tax expense |
0.2 | 2.2 | 5.0 | |||||||||
|
|
|
|
|
|
|
|||||||
| Income (loss) from continuing operations |
4.7 | (1.1 | ) | (53.3 | ) | |||||||
| Income (loss) from discontinued operations, net of income taxes |
5.0 | (0.3 | ) | 0.4 | ||||||||
|
|
|
|
|
|
|
|||||||
| Net income (loss) |
9.7 | (1.4 | ) | (52.9 | ) | |||||||
| Less: preferred stock dividends |
(20.4 | ) | (27.4 | ) | (18.4 | ) | ||||||
|
|
|
|
|
|
|
|||||||
| Net loss available to common stockholders |
$ | (10.7 | ) | $ | (28.8 | ) | $ | (71.3 | ) | |||
|
|
|
|
|
|
|
|||||||
| Earnings (loss) per common share: |
||||||||||||
| Basic and diluted loss per share from continuing operations |
$ | (14.97 | ) | $ | (27.60 | ) | $ | (70.32 | ) | |||
| Basic and diluted earnings (loss) per share from discontinued operations |
$ | 4.78 | $ | (0.21 | ) | $ | 0.42 | |||||
| Basic and diluted net loss per share |
$ | (10.19 | ) | $ | (27.81 | ) | $ | (69.90 | ) | |||
| Weighted-average common shares outstanding: |
||||||||||||
| Basic and diluted |
1,048,465 | 1,033,450 | 1,019,736 | |||||||||
F-3
Table of Contents
SIRVA, INC.
Consolidated Statements of Comprehensive Income (Loss)
| For the Years Ended December 31, |
||||||||||||
| (In millions) |
2013 | 2012 | 2011 | |||||||||
| Net income (loss) |
$ | 9.7 | $ | (1.4 | ) | $ | (52.9 | ) | ||||
| Other comprehensive income (loss), net of tax: |
||||||||||||
| Defined benefit pension plans |
20.8 | (8.7 | ) | (10.6 | ) | |||||||
| Foreign currency translation adjustments |
(5.3 | ) | 1.7 | (0.6 | ) | |||||||
| Unrealized cash flow hedging loss |
(0.2 | ) | — | — | ||||||||
|
|
|
|
|
|
|
|||||||
| Total other comprehensive income (loss), net of tax |
15.3 | (7.0 | ) | (11.2 | ) | |||||||
|
|
|
|
|
|
|
|||||||
| Comprehensive income (loss) |
$ | 25.0 | $ | (8.4 | ) | $ | (64.1 | ) | ||||
|
|
|
|
|
|
|
|||||||
The accompanying notes are an integral part of the consolidated financial statements.
F-4
Table of Contents
SIRVA, INC.
| At December 31, | ||||||||
| (In millions, except share and per share amounts) |
2013 | 2012 | ||||||
| Assets | ||||||||
| Current assets: |
||||||||
| Cash and cash equivalents |
$ | 28.0 | $ | 24.5 | ||||
| Restricted cash |
8.3 | 8.5 | ||||||
| Accounts receivable, net of allowance for doubtful accounts |
156.5 | 162.5 | ||||||
| Mortgages held for resale |
50.5 | 57.5 | ||||||
| Relocation properties held for resale |
15.8 | 9.7 | ||||||
| Prepaid expenses |
14.2 | 11.9 | ||||||
| Other current assets |
5.9 | 5.3 | ||||||
|
|
|
|
|
|||||
| Total current assets |
279.2 | 279.9 | ||||||
| Goodwill |
56.4 | 58.6 | ||||||
| Property and equipment, net |
54.0 | 52.5 | ||||||
| Other intangible assets, net |
25.3 | 34.0 | ||||||
| Other assets |
12.4 | 8.2 | ||||||
|
|
|
|
|
|||||
| Total non-current assets |
148.1 | 153.3 | ||||||
|
|
|
|
|
|||||
| Total assets |
$ | 427.3 | $ | 433.2 | ||||
|
|
|
|
|
|||||
| Liabilities and Stockholders’ Equity (Deficit) | ||||||||
| Current liabilities: |
||||||||
| Current portion of long-term debt |
$ | 5.8 | $ | 12.4 | ||||
| Short-term debt |
51.6 | 56.7 | ||||||
| Accounts payable |
69.1 | 65.8 | ||||||
| Accrued purchased transportation expense |
51.7 | 54.6 | ||||||
| Compensation and benefits |
16.7 | 15.1 | ||||||
| Deferred revenue |
14.6 | 13.2 | ||||||
| Household goods claim reserves |
12.1 | 14.5 | ||||||
| Other current liabilities |
41.9 | 59.3 | ||||||
|
|
|
|
|
|||||
| Total current liabilities |
263.5 | 291.6 | ||||||
| Long-term debt |
288.2 | 160.2 | ||||||
| Pension liabilities |
33.2 | 58.2 | ||||||
| Other liabilities |
19.4 | 16.9 | ||||||
|
|
|
|
|
|||||
| Total non-current liabilities |
340.8 | 235.3 | ||||||
|
|
|
|
|
|||||
| Total liabilities |
604.3 | 526.9 | ||||||
| Commitments and contingencies |
— | — | ||||||
| Stockholders’ equity (deficit): |
||||||||
| Series A preferred stock-$0.01 par value, 1,000,000 shares authorized with 99,444 and 184,865 shares issued and outstanding at December 31, 2013 and 2012 (involuntary liquidation value—$141.9 and $230.6 at December 31, 2013 and 2012) |
— | — | ||||||
| Common stock-$0.01 par value, 4,000,000 shares authorized with 1,073,146 and 1,071,818 shares issued and outstanding at December 31, 2013 and 2012 |
— | — | ||||||
| Additional paid-in-capital |
116.6 | 201.3 | ||||||
| Accumulated other comprehensive loss |
(37.5 | ) | (52.8 | ) | ||||
| Accumulated deficit |
(256.1 | ) | (242.2 | ) | ||||
|
|
|
|
|
|||||
| Total stockholders’ deficit |
(177.0 | ) | (93.7 | ) | ||||
|
|
|
|
|
|||||
| Total liabilities and stockholders’ deficit |
$ | 427.3 | $ | 433.2 | ||||
|
|
|
|
|
|||||
The accompanying notes are an integral part of the consolidated financial statements.
F-5
Table of Contents
SIRVA, INC.
Consolidated Statements of Stockholders’ Equity (Deficit)
| (In millions, except share amounts) |
Series A Preferred Stock |
Common Stock | Additional Paid-in- Capital |
Accumulated Other Comprehensive Loss |
Accumulated Deficit |
Total Stockholders’ Equity (Deficit) |
||||||||||||||||||||||||||
| Shares | Amount | Shares | Amount | |||||||||||||||||||||||||||||
| Balance at December 31, 2010 |
— | $ | — | 1,070,345 | $ | — | $ | 16.3 | $ | (34.6 | ) | $ | (186.3 | ) | $ | (204.6 | ) | |||||||||||||||
| Net loss |
— | — | — | — | — | — | (52.9 | ) | (52.9 | ) | ||||||||||||||||||||||
| Other comprehensive loss |
— | — | — | — | — | (11.2 | ) | — | (11.2 | ) | ||||||||||||||||||||||
| Issuance of preferred stock |
173,503 | — | — | — | 173.5 | — | — | 173.5 | ||||||||||||||||||||||||
| Restricted stock expense |
— | — | — | — | 0.1 | — | — | 0.1 | ||||||||||||||||||||||||
| Issuance of restricted stock |
— | — | 8,156 | — | — | — | — | — | ||||||||||||||||||||||||
| Forfeiture of nonvested restricted stock |
— | — | (9,055 | ) | — | — | — | — | — | |||||||||||||||||||||||
|
|
|
|
|
|
|
|
|
|
|
|
|
|
|
|
|
|||||||||||||||||
| Balance at December 31, 2011 |
173,503 | — | 1,069,446 | — | 189.9 | (45.8 | ) | (239.2 | ) | (95.1 | ) | |||||||||||||||||||||
| Net loss |
— | — | — | — | — | — | (1.4 | ) | (1.4 | ) | ||||||||||||||||||||||
| Other comprehensive loss |
— | — | — | — | — | (7.0 | ) | — | (7.0 | ) | ||||||||||||||||||||||
| Issuance of preferred stock |
11,362 | — | — | — | 11.4 | — | (1.6 | ) | 9.8 | |||||||||||||||||||||||
| Issuance of restricted stock |
— | — | 4,528 | — | — | — | — | — | ||||||||||||||||||||||||
| Forfeiture of nonvested restricted stock |
— | — | (2,156 | ) | — | — | — | — | — | |||||||||||||||||||||||
|
|
|
|
|
|
|
|
|
|
|
|
|
|
|
|
|
|||||||||||||||||
| Balance at December 31, 2012 |
184,865 | — | 1,071,818 | — | 201.3 | (52.8 | ) | (242.2 | ) | (93.7 | ) | |||||||||||||||||||||
| Net income |
— | — | — | — | — | — | 9.7 | 9.7 | ||||||||||||||||||||||||
| Other comprehensive income |
— | — | — | — | — | 15.3 | — | 15.3 | ||||||||||||||||||||||||
| Redemption of preferred stock |
(85,421 | ) | — | — | — | (85.4 | ) | — | (23.6 | ) | (109.0 | ) | ||||||||||||||||||||
| Issuance of restricted stock |
— | — | 1,328 | — | — | — | — | — | ||||||||||||||||||||||||
| Stock compensation |
— | — | — | — | 0.7 | — | — | 0.7 | ||||||||||||||||||||||||
|
|
|
|
|
|
|
|
|
|
|
|
|
|
|
|
|
|||||||||||||||||
| Balance at December 31, 2013 |
99,444 | $ | — | 1,073,146 | $ | — | $ | 116.6 | $ | (37.5 | ) | $ | (256.1 | ) | $ | (177.0 | ) | |||||||||||||||
|
|
|
|
|
|
|
|
|
|
|
|
|
|
|
|
|
|||||||||||||||||
The accompanying notes are an integral part of the consolidated financial statements.
F-6
Table of Contents
SIRVA, INC.
Consolidated Statements of Cash Flows
| For the Years Ended December 31, |
||||||||||||
| (In millions) |
2013 | 2012 | 2011 | |||||||||
| Cash flows from operating activities: |
||||||||||||
| Net income (loss) |
$ | 9.7 | $ | (1.4 | ) | $ | (52.9 | ) | ||||
| Adjustments to reconcile net income (loss) to net cash provided by (used for) operating activities: |
||||||||||||
| Depreciation and amortization |
25.5 | 28.1 | 27.7 | |||||||||
| Debt-related amortization |
2.5 | 2.7 | 3.1 | |||||||||
| Increase (decrease) in provision for losses on accounts receivable and relocation properties held for resale |
1.3 | (1.2 | ) | (2.3 | ) | |||||||
| Deferred income taxes |
0.1 | 0.9 | 0.3 | |||||||||
| Gain on sale of assets |
(0.2 | ) | (0.5 | ) | (1.0 | ) | ||||||
| Gain on business dispositions |
(6.4 | ) | — | — | ||||||||
| Debt extinguishment loss (gain) |
8.0 | (0.3 | ) | 16.8 | ||||||||
| Impairments |
— | — | 0.5 | |||||||||
| Stock compensation |
0.7 | — | — | |||||||||
| Change in operating assets and liabilities: |
||||||||||||
| Sales of mortgages held for resale |
771.3 | 650.4 | 587.9 | |||||||||
| Originations of mortgages held for resale |
(765.1 | ) | (645.7 | ) | (619.8 | ) | ||||||
| Accounts receivable |
(1.6 | ) | (20.5 | ) | (1.8 | ) | ||||||
| Relocation properties held for resale |
(6.8 | ) | 10.7 | 10.1 | ||||||||
| Accounts payable |
1.4 | (2.5 | ) | (2.7 | ) | |||||||
| Other current assets and liabilities |
(11.7 | ) | 8.8 | 4.4 | ||||||||
| Other non-current assets and liabilities |
(12.2 | ) | (8.9 | ) | (11.7 | ) | ||||||
|
|
|
|
|
|
|
|||||||
| Net cash provided by (used for) operating activities |
16.5 | 20.6 | (41.4 | ) | ||||||||
| Cash flows from investing activities: |
||||||||||||
| Capital expenditures |
(12.4 | ) | (10.6 | ) | (15.4 | ) | ||||||
| Proceeds from dispositions |
6.2 | 5.8 | 5.6 | |||||||||
| Proceeds from the sale of property and equipment |
0.3 | 0.2 | 0.8 | |||||||||
| Acquisitions, net of cash acquired |
— | (0.2 | ) | (0.6 | ) | |||||||
| Other |
(3.6 | ) | (1.3 | ) | (0.7 | ) | ||||||
|
|
|
|
|
|
|
|||||||
| Net cash used for investing activities |
(9.5 | ) | (6.1 | ) | (10.3 | ) | ||||||
| Cash flows from financing activities: |
||||||||||||
| (Repayments) borrowings on mortgage and relocation facilities |
(5.4 | ) | (2.1 | ) | 36.0 | |||||||
| Repayments on revolving line of credit |
— | — | (44.9 | ) | ||||||||
| Borrowings on short-term and long-term debt |
299.1 | 5.9 | 161.9 | |||||||||
| Repayments on short-term and long-term debt |
(177.4 | ) | (15.9 | ) | (90.5 | ) | ||||||
| Preferred stock redemption |
(109.0 | ) | — | — | ||||||||
| Repayments on capital lease obligations |
(1.8 | ) | (2.2 | ) | (3.0 | ) | ||||||
| Debt issuance costs |
(8.4 | ) | — | (6.1 | ) | |||||||
|
|
|
|
|
|
|
|||||||
| Net cash (used for) provided by financing activities |
(2.9 | ) | (14.3 | ) | 53.4 | |||||||
| Effect of exchange rate changes on cash and cash equivalents |
(0.6 | ) | 0.3 | — | ||||||||
|
|
|
|
|
|
|
|||||||
| Net increase in cash and cash equivalents |
3.5 | 0.5 | 1.7 | |||||||||
| Cash and cash equivalents at beginning of year |
24.5 | 24.0 | 22.3 | |||||||||
|
|
|
|
|
|
|
|||||||
| Cash and cash equivalents at end of year |
$ | 28.0 | $ | 24.5 | $ | 24.0 | ||||||
|
|
|
|
|
|
|
|||||||
| Supplemental cash flow information: |
||||||||||||
| Interest paid |
$ | 22.8 | $ | 22.5 | $ | 38.3 | ||||||
| Income taxes paid |
$ | 4.5 | $ | 4.4 | $ | 7.4 | ||||||
The accompanying notes are an integral part of the consolidated financial statements.
F-7
Table of Contents
SIRVA, INC.
Notes to the Consolidated Financial Statements
Note 1. The Company
SIRVA, Inc. (the “Company”) is a global provider of mobility services to corporate customers, military and government agencies, and the consumer market. The Company markets its services under the brand names of SIRVA Relocation®, northAmerican®, Allied®, Allied International and SIRVA Move Management, among others, with operations located throughout the United States, Canada, United Kingdom, continental Europe, Brazil, Australia, New Zealand, the Middle East and Asia. The Company conducts its U.S. and Canadian operations primarily through a network of exclusive agents. In Europe, Brazil, the Middle East and the Asia Pacific region, operations are conducted through a combination of its company-operated locations, its proprietary agent/franchise network and its network of affiliated preferred providers.
Note 2. Summary of Significant Accounting Policies
Basis of Presentation
The consolidated financial statements include the accounts of SIRVA, Inc. and its controlled subsidiaries. The Company’s fiscal year ends on December 31. All intercompany accounts and transactions have been eliminated in consolidation.
Reclassifications
Certain prior period amounts have been reclassified to conform to the current period presentation and had no effect on reported earnings.
Use of Estimates
The preparation of financial statements in conformity with U.S. generally accepted accounting principles (“GAAP”) requires management to make estimates, judgments and assumptions that affect the amounts reported in the consolidated financial statements and accompanying notes. Actual amounts and results could differ from these estimates.
Foreign Currency Translation
The Company’s foreign operations use the local currency as their functional currency. Assets and liabilities of these operations are translated to U.S. dollars at the exchange rates in effect on the balance sheet date. Income statement items are translated at the average exchange rate for the relevant period. The impact of currency fluctuation is included in stockholders’ equity (deficit) as a component of accumulated other comprehensive loss.
Foreign exchange transaction losses are included in other expense, net in the Consolidated Statements of Operations and were $0.9 million, insignificant and $1.4 million for the years ended December 31, 2013, 2012 and 2011, respectively.
Revenue Recognition
Service revenue is recognized when the related service is provided to customers. Revenue is not recognized until sales prices are fixed or determinable and collectability is reasonably assured.
In the Company’s moving services operations, revenue and related direct expenses, including packing, transportation and other costs associated with the service, are recognized on the date a shipment (also referred to as an “initiation”) is completed. In situations where the Company’s agent or franchisee, affiliated preferred provider or supplier networks are used to complete an initiation, the cost of such services is reflected as purchased transportation expense in the Company’s consolidated financial statements.
F-8
Table of Contents
In the Company’s relocation services operations, fees for home sale assistance are paid by customers at either a set price per transferred employee (standard home sale product), or a fixed percentage of the home’s selling price (premium home sale product) and are recorded in service revenue. For the standard home sale product, homes are acquired for the account of the corporate customers, and therefore all costs and liabilities relating to acquisition, ownership and disposition of the property are the responsibility of the corporate customer. The Company recognizes service revenue at the date the home is sold to a third-party buyer. For the premium home sale product, the Company acquires the homes for its own account, and therefore the costs and liabilities relating to acquisition, ownership and disposition of the property are the responsibility of the Company. The Company recognizes service revenue at the date the Company acquires the home from a transferred employee (also referred to as a “transferee”). When the Company acquires a property from a transferee, the property is included in relocation properties held for resale in the Consolidated Balance Sheets (see Relocation Properties Held for Resale below for further details). The Company records the proceeds received from the sale of a relocation property held for resale as home revenue when it closes on the home sale to a third-party buyer.
Additionally, the Company receives fees from Company-qualified real estate brokers for the listing or home purchase referral of a transferred employee. The listing referral fee revenue is recognized when the Company closes on the home sale to a third-party buyer. The home purchase referral fee revenue is recognized when a transferee closes on the purchase of a destination home from a third-party seller.
Cash Equivalents
Cash equivalents are highly liquid investments with original maturities of three months or less.
Restricted Cash
At December 31, 2013 and 2012, restricted cash of $8.3 million and $8.5 million, respectively, were limited as to use primarily in the Company’s reinsurance subsidiary due to certain capital requirements and in its relocation businesses related to customer deposits.
Allowance for Doubtful Accounts
Trade accounts receivable are recorded at the invoiced amount and do not bear interest. An allowance for doubtful accounts receivable is maintained for estimated losses resulting from the inability of the Company’s customers and agents to make required payments. The Company records a bad debt reserve for all receivables based on their aging and historical experience. The Company’s allowance for doubtful accounts receivable at December 31, 2013 and 2012 was $2.6 million and $2.1 million, respectively. Losses on accounts receivable were $0.5 million and insignificant for the years ended December 31, 2013 and 2012, respectively. Recovery of losses on accounts receivable was $0.6 million for the year ended December 31, 2011.
Relocation Properties Held for Resale
The Company purchases homes under certain home sale assistance programs. These properties are residential homes held for resale and are recorded in current assets at net realizable value. In estimating the expected sales proceeds for unsold homes, the Company uses, on a property by property basis, the lower of cost or the current sales price as provided in the Multiple Listing Service and an estimate of expected future market declines based on historical results which are recorded in home cost in the Consolidated Statements of Operations. Costs to sell relocation properties of $40.2 million, $38.3 million and $43.9 million for the years ended December 31, 2013, 2012 and 2011, respectively are included in other direct expense in the Consolidated Statements of Operations.
F-9
Table of Contents
Property and Equipment, Net
Property and equipment, net consisted of the following:
| December 31, | ||||||||||||
| 2013 | 2012 | Useful life (years) |
||||||||||
| (In millions) | ||||||||||||
| Land |
$ | 2.5 | $ | 2.5 | ||||||||
| Buildings and improvements |
15.9 | 15.0 | 3 to 40 | |||||||||
| Developed software for internal use |
50.3 | 43.4 | 1 to 5 | |||||||||
| Computer equipment and other software |
31.7 | 27.7 | 1 to 5 | |||||||||
| Transportation equipment |
9.1 | 11.3 | 4 to 15 | |||||||||
| Warehouse equipment |
6.0 | 6.3 | 7 to 10 | |||||||||
| Other |
8.7 | 7.7 | 1 to 10 | |||||||||
| Projects in process |
6.7 | 6.4 | ||||||||||
|
|
|
|
|
|||||||||
| 130.9 | 120.3 | |||||||||||
| Less accumulated depreciation |
(76.9 | ) | (67.8 | ) | ||||||||
|
|
|
|
|
|||||||||
| $ | 54.0 | $ | 52.5 | |||||||||
|
|
|
|
|
|||||||||
Transportation equipment includes tractors, straight trucks, trailers and van equipment. Leased property and equipment meeting certain criteria are capitalized, and the present value of the related lease payments is recorded as a liability. The Company capitalizes costs incurred during the application development-stage for internally developed software intended for internal use such as direct external costs and direct payroll-related costs incurred to develop the software prior to implementation. Preliminary project costs and post-implementation costs such as training, maintenance and support are expensed as incurred.
Depreciation is computed on a straight-line basis over the estimated useful lives of the respective assets. Depreciation of capitalized leased assets is computed on a straight-line basis over the shorter of the term of the lease or the useful life of the capitalized leased asset. When development is substantially complete on internally developed software intended for internal use, the cost of the software is amortized on a straight-line basis over the expected life of the software. Depreciation expense was $16.5 million, $16.7 million and $15.3 million for the years ended December 31, 2013, 2012 and 2011, respectively. Repairs and maintenance expenditures are expensed as incurred.
Goodwill
The Company evaluates goodwill using a qualitative assessment to determine whether it is more likely than not that the fair value of any reporting unit is less than its carrying amount. If the Company determines that the fair value of the reporting unit may be less than its carrying amount, a two-step impairment test is performed. The first step compares the book value of a reporting unit, including goodwill, with its fair value. The fair value is estimated based on a market approach and a discounted cash flow analysis, also known as the income approach. If the book value of a reporting unit exceeds its fair value, the Company performs the second step to estimate an implied fair value of the reporting unit’s goodwill by allocating the fair value of the reporting unit to all of the assets and liabilities other than goodwill (including any unrecognized intangible assets). The difference between the fair value of the reporting unit and the fair value of all the assets and liabilities other than goodwill is the implied fair value of that goodwill. The amount of impairment loss is equal to the excess of the book value of the goodwill over the implied fair value of that goodwill. There were no goodwill impairments during the years ended December 31, 2013, 2012 or 2011, respectively.
F-10
Table of Contents
Impairment of Long-lived Assets
The Company periodically reviews the carrying value of its property and equipment and its intangible assets to assess whether current events or circumstances indicate that such carrying value may not be recoverable. If the review indicates that the carrying value of the asset is greater than the expected undiscounted cash flows to be generated by such asset, then an impairment loss is recognized. An impairment loss is measured as the amount by which the carrying value of such asset exceeds its fair value. The Company generally measures fair value by discounting estimated future cash flows from such assets using an appropriate discount rate. Considerable management judgment is necessary to estimate the fair value of assets and, accordingly, actual results could vary significantly from such estimates. Assets to be disposed of are carried at the lower of their carrying value or fair value less costs to sell.
Household Goods Claim Reserves
The Company estimates claims relating to household goods damage and loss based principally on actuarial methods applied to historical trends. A household goods claims analysis is performed that compares open and closed claim costs, as well as estimates for incurred but not reported claim costs, to the original estimates. Any changes to those estimates are recorded as appropriate. Household goods claims expense was $36.3 million, $33.5 million and $31.7 million for the years ended December 31, 2013, 2012 and 2011, respectively, and was recorded in other direct expense in the Consolidated Statements of Operations.
Pension and Postretirement Benefits
The Company has a qualified and an unqualified defined benefit pension plan. Amounts relating to these plans are recorded based on actuarial calculations, which use various assumptions, such as discount rates and expected return on assets. See Note 11 “Pension Plans and Other Benefits” for further details.
Leases
The Company has noncancelable lease commitments under operating leases for office space, warehouse facilities, transportation equipment and office equipment. Tenant improvement allowances or other incentives provided in a facility lease are amortized on a straight-line basis over the lease term as a reduction of rent expense. Leasehold improvements are depreciated over the shorter of the useful life or the term of the lease.
Fair Value of Financial Instruments
The amounts included in the consolidated financial statements for cash and cash equivalents, restricted cash, accounts receivable, short-term debt, accounts payable and other accrued liabilities approximate their fair values because of their short-term maturities. Mortgages held for resale and derivative instruments are carried at fair value. The carrying value of long-term debt approximates fair value due to variable interest rates.
Derivative Instruments
In the normal course of business, the Company is subject to risk from adverse fluctuations in interest rates, which may result in higher interest on variable-rate debt or a decline in the value of the Company’s interest rate lock commitments issued on residential mortgage loans intended to be held for resale and mortgages held for resale. See Note 10 “Financial Instruments” for further details. The Company manages these risks through a program that includes the use of derivative financial instruments. Counterparties to these contracts are major financial institutions. The Company is exposed to credit loss in the event of nonperformance by these counterparties, however, the Company does not anticipate nonperformance. The Company does not use derivative instruments for trading or speculative purposes. The Company’s objective in managing exposure to market risk is to limit the impact on earnings and cash flow. The extent to which the Company uses such instruments is dependent on its access to these contracts in the financial markets and its success using other methods.
F-11
Table of Contents
All of the Company’s outstanding derivative financial instruments are recognized in the balance sheet at their fair values using Level 2 inputs from the fair value hierarchy. The effect on earnings from recognizing the fair values of these derivative financial instruments depends on their intended use, their hedge designation, and their effectiveness in offsetting changes in the fair values of the exposures they are hedging. Changes in the effective portions of the fair values of instruments used to reduce or eliminate adverse fluctuations in cash flows of anticipated or forecasted transactions are reported in equity as a component of accumulated other comprehensive loss. Amounts in accumulated other comprehensive loss are reclassified to earnings when the related hedged items affect earnings or the anticipated transactions are no longer probable. Changes in the fair values of derivative instruments that are not designated as hedges or do not qualify for hedge accounting treatment are reported currently in earnings. Amounts reported in earnings are classified consistent with the item being hedged.
For derivative financial instruments accounted for as hedging instruments, the Company formally designates and documents, at inception, the financial instrument as a hedge of a specific underlying exposure, the risk management objective, and the manner in which effectiveness of the hedge will be assessed. The Company formally assesses, both at inception and at each reporting period thereafter, whether the derivative financial instruments used in hedging transactions are effective in offsetting changes in fair value or cash flows of the related underlying exposures. Any ineffective portion of the change in fair value of the instruments is recognized immediately in earnings. The Company discontinues the use of hedge accounting prospectively when (1) the derivative instrument is no longer effective in offsetting changes in fair value or cash flows of the underlying hedged item; (2) the derivative instrument expires, is sold, terminated, or exercised; or (3) the Company elects to change the designation of the hedging instrument.
Advertising and Promotion Costs
The Company expenses radio, television and print material advertising costs, and other promotional materials, as incurred. The Company incurred advertising costs of $3.5 million, $5.0 million and $5.3 million for the years ended December 31, 2013, 2012 and 2011, respectively.
Agent and Customer Incentives
The Company offers its agents certain volume incentives which the Company recognizes over the period the incentive is earned. The Company recognized agent incentive expense included in purchased transportation expense in the Consolidated Statements of Operations of $3.4 million, $3.5 million and $2.6 million for the years ended December 31, 2013, 2012 and 2011, respectively, as these incentives increase the amount paid to agents for services.
Incentives offered to customers are based upon meeting certain revenue thresholds and are recognized by the Company over the period the incentives are earned as a reduction in revenue in the Consolidated Statements of Operations. The Company recognized customer incentives of $2.4 million in each of the years ended December 31, 2013, 2012 and 2011.
Reinsurance Reserves
The Company’s reinsurance subsidiary has reinsurance contracts for loans from 1998 through 2009 that required private mortgage insurance originated by SIRVA Mortgage. The reinsurance contracts indemnify third-party primary mortgage insurance companies for losses that fall between a stated minimum and maximum loss rate on each annual pool of originated loans. As a result of participating in this loss exposure, the Company is contractually entitled to receive a portion of the insurance premium from the primary mortgage insurance companies. Insurance premium revenue received is recognized in service revenue in the Consolidated Statements of Operations and was $0.3 million, $0.5 million and $0.7 million for the years ended December 31, 2013, 2012 and 2011, respectively. The Company estimates its claims by recording a reserve related to known loan
F-12
Table of Contents
delinquencies, further developing the reserve based on the age of the delinquency, as well as estimating an incurred but not reported claim expense. Any changes to those estimates are recorded as appropriate. At December 31, 2013 and 2012, reinsurance reserves were $1.0 million and $2.0 million, respectively.
Income Taxes
The Company accounts for income taxes using the asset and liability method. Deferred tax assets and liabilities are recognized for the future tax consequences attributable to differences between the financial statement carrying amounts of existing assets and liabilities and their respective tax bases. Deferred tax assets and liabilities are measured using enacted tax laws and tax rates expected to apply to taxable income in the years in which those temporary differences are expected to be recovered or settled. The effect on deferred tax assets and liabilities due to a change in tax rates is recognized in earnings in the period that includes the enactment date. In addition, the amounts of any future tax benefits are reduced by a valuation allowance to the extent such benefits are not expected to be realized on a more likely than not basis. Significant management judgment is required in determining the provision for income taxes and, in particular, any valuation allowance recorded against deferred tax assets.
Contingencies
The Company evaluates contingent liabilities, including threatened or pending litigation, and records accruals when the outcome of these matters is deemed probable and the liability is reasonably estimable. The Company makes these assessments based on the facts and circumstances and, in some instances, based in part on the advice of outside counsel. See Note 17 “Contingencies” for further details.
New Accounting Standards
In February 2013, the FASB issued Accounting Standards Update (ASU) 2013-02, Reporting of Amounts Reclassified Out of Accumulated Other Comprehensive Income. Under ASU 2013-02, an entity is required to provide information about the amounts reclassified out of accumulated other comprehensive income (AOCI) by component. In addition, an entity is required to present, either on the face of the financial statements or in the notes, significant amounts classified out of AOCI by the respective line items of net income, but only if the amount reclassified is required to be reclassified in its entirety in the same reporting period. For amounts that are not required to be reclassified in their entirety to net income, an entity is required to cross-reference to other disclosures that provide details about those amounts. ASU 2013-02 does not change the current requirements for reporting net income or other comprehensive income in the financial statements. ASU 2013-02 is effective for annual periods beginning after December 15, 2012 and early adoption is permitted. The Company adopted ASU 2013-02 in 2013 and disclosed the reclassifications for the years ended December 31, 2013, 2012 and 2011. The adoption of ASU 2013-02 did not have a material impact on the consolidated financial statements.
In March 2013, the FASB issued ASU 2013-05, Foreign Currency Matters (Topic 830): Parent’s Accounting for the Cumulative Translation Adjustment upon Derecognition of Certain Subsidiaries or Groups of Assets within a Foreign Entity or of an Investment in a Foreign Entity. This amendment clarifies the applicable guidance for the release of cumulative translation adjustment into net earnings. When an entity ceases to have a controlling financial interest in a subsidiary or group of assets within a foreign entity, the entity is required to apply the guidance in ASC Topic 830-30, Translation of Financial Statements, to release any related cumulative translation adjustment into net earnings. ASU 2013-05 is effective prospectively for fiscal years, and interim reporting periods within those years, beginning after December 15, 2013. The Company does not expect the adoption of ASU 2013-05 to have a material impact on the consolidated financial statements.
In July 2013, the FASB issued ASU 2013-11, Presentation of an Unrecognized Tax Benefit When a Net Operating Loss Carryforward, a Similar Tax Loss, or a Tax Credit Carryforward Exists. The guidance requires the presentation of certain unrecognized tax benefits as reductions to deferred tax assets rather than as liabilities
F-13
Table of Contents
in the consolidated balance sheets when a net operating loss carryforward, a similar tax loss, or a tax credit carryforward exists. The amendment is effective for interim and annual periods beginning after December 15, 2013. Early adoption and retrospective application are permitted. The Company does not expect the adoption of ASU 2013-11 to have a material impact on the consolidated financial statements.
Note 3. Earnings (Loss) Per Common Share
Basic and diluted earnings (loss) per common share is computed by dividing net income (loss) available to common stockholders by the weighted-average number of common stock outstanding during the period. The Company uses the treasury stock method to reflect the potential dilutive effect of share-based compensation awards. Shared-based compensation awards were not considered in the determination of diluted earnings (loss) per common share because the impact would be anti-dilutive.
The following sets forth the computation of loss from continuing operations available to common stockholders:
| Years Ended December 31, | ||||||||||||
| 2013 | 2012 | 2011 | ||||||||||
| (In millions) | ||||||||||||
| Income (loss) from continuing operations |
$ | 4.7 | $ | (1.1 | ) | $ | (53.3 | ) | ||||
| Less: preferred stock dividends |
(20.4 | ) | (27.4 | ) | (18.4 | ) | ||||||
|
|
|
|
|
|
|
|||||||
| Loss from continuing operations available to common stockholders |
$ | (15.7 | ) | $ | (28.5 | ) | $ | (71.7 | ) | |||
|
|
|
|
|
|
|
|||||||
See Note 12 “Capital Stock and Incentive Plans” for further details related to the Company’s Series A Preferred Stock and share-based compensation plans.
F-14
Table of Contents
Note 4. Accumulated Other Comprehensive Loss
The following table summarizes the changes in accumulated other comprehensive loss:
| Unrealized Losses on Defined Benefit Pension Plans |
Foreign Currency Translation Adjustments |
Unrealized Cash Flow Hedging Loss |
Accumulated Other Comprehensive Loss |
|||||||||||||
| (In millions) | ||||||||||||||||
| Balance at December 31, 2010 |
$ | (30.3 | ) | $ | (4.3 | ) | $ | — | $ | (34.6 | ) | |||||
| Other comprehensive loss before reclassifications |
(12.4 | ) | (0.6 | ) | — | (13.0 | ) | |||||||||
| Amounts reclassified from accumulated other comprehensive loss |
1.8 | — | — | 1.8 | ||||||||||||
|
|
|
|
|
|
|
|
|
|||||||||
| Other comprehensive loss |
(10.6 | ) | (0.6 | ) | — | (11.2 | ) | |||||||||
|
|
|
|
|
|
|
|
|
|||||||||
| Balance at December 31, 2011 |
(40.9 | ) | (4.9 | ) | — | (45.8 | ) | |||||||||
| Other comprehensive (loss) income before reclassifications |
(11.6 | ) | 1.7 | — | (9.9 | ) | ||||||||||
| Amounts reclassified from accumulated other comprehensive loss |
2.9 | — | — | 2.9 | ||||||||||||
|
|
|
|
|
|
|
|
|
|||||||||
| Other comprehensive (loss) income |
(8.7 | ) | 1.7 | — | (7.0 | ) | ||||||||||
|
|
|
|
|
|
|
|
|
|||||||||
| Balance at December 31, 2012 |
(49.6 | ) | (3.2 | ) | — | (52.8 | ) | |||||||||
| Other comprehensive income (loss) before reclassifications |
16.8 | (5.3 | ) | (0.2 | ) | 11.3 | ||||||||||
| Amounts reclassified from accumulated other comprehensive income (loss) |
4.0 | — | — | 4.0 | ||||||||||||
|
|
|
|
|
|
|
|
|
|||||||||
| Other comprehensive income (loss) |
20.8 | (5.3 | ) | (0.2 | ) | 15.3 | ||||||||||
|
|
|
|
|
|
|
|
|
|||||||||
| Balance at December 31, 2013 |
$ | (28.8 | ) | $ | (8.5 | ) | $ | (0.2 | ) | $ | (37.5 | ) | ||||
|
|
|
|
|
|
|
|
|
|||||||||
The components of other comprehensive income (loss) before reclassifications for the year ended December 31, 2013 are net of tax expense of $0.6 million. Amounts reclassified from accumulated other comprehensive income (loss) associated with unrealized losses on pension and post retirement plans are recorded as a component of selling, general and administrative expense in the Consolidated Statements of Operations.
F-15
Table of Contents
Note 5. Goodwill and Other Intangible Assets
The changes in the carrying amount of goodwill were:
| Mobility Solutions |
Mobility Networks |
Europe, Asia and Emerging Markets |
Australia | Consolidated | ||||||||||||||||
| (In millions) | ||||||||||||||||||||
| Balance at December 31, 2011 |
$ | 4.4 | $ | 31.6 | $ | 8.7 | $ | 12.9 | $ | 57.6 | ||||||||||
| Acquisition |
— | — | 0.3 | — | 0.3 | |||||||||||||||
| Effect of currency translation |
— | — | 0.5 | 0.2 | 0.7 | |||||||||||||||
|
|
|
|
|
|
|
|
|
|
|
|||||||||||
| Balance at December 31, 2012 |
4.4 | 31.6 | 9.5 | 13.1 | 58.6 | |||||||||||||||
| Effect of currency translation |
— | — | (0.4 | ) | (1.8 | ) | (2.2 | ) | ||||||||||||
|
|
|
|
|
|
|
|
|
|
|
|||||||||||
| Balance at December 31, 2013 |
$ | 4.4 | $ | 31.6 | $ | 9.1 | $ | 11.3 | $ | 56.4 | ||||||||||
|
|
|
|
|
|
|
|
|
|
|
|||||||||||
Intangible assets consisted of the following:
| December 31, | Amortization Period (Years) |
|||||||||||||||||||
| 2013 | 2012 | 2013 | 2012 | |||||||||||||||||
| Gross Carrying Amount | Accumulated Amortization | |||||||||||||||||||
| (In millions) | ||||||||||||||||||||
| Customer relationships |
$ | 41.9 | $ | 44.0 | $ | 28.6 | $ | 26.0 | 20 | |||||||||||
| Trade names |
36.6 | 37.5 | 24.6 | 22.0 | 20 | |||||||||||||||
| Other intangibles |
2.2 | 2.2 | 2.2 | 1.7 | 6 | |||||||||||||||
|
|
|
|
|
|
|
|
|
|||||||||||||
| Total |
$ | 80.7 | $ | 83.7 | $ | 55.4 | $ | 49.7 | ||||||||||||
|
|
|
|
|
|
|
|
|
|||||||||||||
Estimated amortization expense for the next five years is as follows: $5.7 million in 2014; $4.4 million in 2015; $3.4 million in 2016; $2.7 million in 2017; and $2.1 million in 2018.
Note 6. Short-term Debt
Short-term debt consisted of the following:
| December 31, | ||||||||
| 2013 | 2012 | |||||||
| (In millions) | ||||||||
| Mortgage warehouse facilities |
$ | 46.7 | $ | 52.2 | ||||
| Securitization transfer proceeds |
2.4 | 2.6 | ||||||
| Foreign subsidiaries lines of credit |
— | 0.7 | ||||||
| Other |
2.5 | 1.2 | ||||||
|
|
|
|
|
|||||
| $ | 51.6 | $ | 56.7 | |||||
|
|
|
|
|
|||||
Mortgage Warehouse Facilities
SIRVA Mortgage has various credit facilities to fund its mortgage loans held for resale.
SIRVA Mortgage executed master repurchase agreements with CitiBank, N.A. for a $40.0 million committed revolving mortgage loan facility and a $30.0 million uncommitted revolving mortgage loan facility. This facility expires in August 2014. There was $13.8 million and $21.6 million outstanding against the committed revolving mortgage loan facility as of December 31, 2013 and 2012, respectively. SIRVA Mortgage will pay a monthly facility fee of 25 basis points on the committed amount of $40.0 million. This facility has
F-16
Table of Contents
dividend restrictions and financial covenants, which require SIRVA Mortgage to maintain a minimum tangible net worth of $20.0 million, a maximum total debt to tangible net worth of 12:1 at all times and a liquidity requirement as defined in the agreement of $6.5 million as of the end of each month.
SIRVA Mortgage executed a master repurchase agreement with US Bank, N.A. for a $30.0 million committed revolving mortgage loan facility. This facility expires in May 2014. There was $18.0 million and $14.6 million outstanding against the committed revolving mortgage loan facility as of December 31, 2013 and 2012, respectively. SIRVA Mortgage will pay a monthly facility fee of 25 basis points on the committed amount of $30.0 million. This facility has dividend restrictions and financial covenants, which require SIRVA Mortgage to maintain a minimum tangible net worth of $13.5 million, a maximum total debt to tangible net worth of 12:1 at all times and a liquidity requirement as defined in the agreement of $6.5 million as of the end of each month.
SIRVA Mortgage executed a master repurchase agreement with Associated Bank, N.A. for a $30.0 million committed revolving mortgage loan facility. This facility expires in July 2014. There was $14.9 million and $16.0 million outstanding against the committed revolving mortgage loan facility as of December 31, 2013 and 2012, respectively. This facility has dividend restrictions and financial covenants, which require SIRVA Mortgage to maintain a minimum tangible net worth of $13.5 million, a maximum total debt to tangible net worth of 12:1 at all times and an unencumbered cash requirement of $3.0 million as of the end of each month.
SIRVA Mortgage was in compliance with all financial covenants for each of the facilities for the years ended December 31, 2013, 2012 and 2011.
During the years ended December 31, 2013, 2012 and 2011, interest on these facilities was payable monthly at a rate equivalent to the London Interbank Offered Rate (“LIBOR”) plus 225 basis points to 350 basis points with a floor of zero to 3.50% (contract rates between 3.25% and 3.67% at December 31, 2013 and 3.75% and 4.00% and December 31, 2012). The interest rate spread varies depending upon such factors as the type of mortgage financed, amount of time a mortgage loan has been closed and not yet sold to investors, and other factors. Interest expense of $1.8 million, $1.9 million and $1.6 million for the years ended December 31, 2013, 2012 and 2011, respectively, is recorded in other direct expense in the Consolidated Statements of Operations.
Securitization Transfer Proceeds
Certain transactions under the receivable securitization program discussed in Note 10 “Financial Instruments” do not qualify as a sale of a financial asset. The proceeds received from these transfers are accounted for as a financing transaction and are classified as short-term debt. Proceeds from these receivable transfers as of December 31, 2013 and 2012 were $2.4 million and $2.6 million, respectively. The weighted-average interest rate at December 31, 2013 and 2012 was 3.21% and 3.12%, respectively.
Foreign Subsidiaries Lines of Credit
Certain foreign subsidiaries of the Company maintain credit facilities totaling $6.2 million at December 31, 2013. The outstanding balance was zero and $0.7 million at December 31, 2013 and 2012, respectively. Interest is payable monthly or quarterly at the base lending rate plus margins up to 190 basis points (contract rates between 9.20% and 13.50% at December 31, 2013 and 9.45% and 13.50% at December 31, 2012). Commitment fees on the unused portion of each applicable credit facility are insignificant. The Company had bank guarantees issued against these lines of credit of $2.3 million and $2.4 million at December 31, 2013 and 2012, respectively. These facilities are generally secured by the assets of the applicable subsidiary or are secured by letters of credit and guarantees from certain of the Company’s other subsidiaries.
F-17
Table of Contents
Relocation Financing Facility
The Company’s subsidiary, SIRVA Finance Limited, maintained a relocation financing facility with a European bank of zero and $4.9 million as of December 31, 2013 and 2012, respectively. The outstanding balance on this relocation financing facility was zero at both December 31, 2013 and 2012. The facility was committed, secured by the underlying relocation assets, and guaranteed by corporate customers. Interest was payable monthly at the base lending rate (Bank of England) plus a margin. As of December 31, 2012, the margin was 225 basis points resulting in a contract rate of 2.75%. The facility was cancelled October 8, 2013.
Note 7. Long-term Debt
Long-term debt consisted of the following:
| December 31, | ||||||||
| 2013 | 2012 | |||||||
| (In millions) | ||||||||
| Term loan |
$ | 289.3 | $ | 149.5 | ||||
| Second lien facility |
— | 20.3 | ||||||
| Capital lease obligations |
3.5 | 1.0 | ||||||
| Other |
1.2 | 1.8 | ||||||
|
|
|
|
|
|||||
| Total debt |
294.0 | 172.6 | ||||||
| Less current portion |
5.8 | 12.4 | ||||||
|
|
|
|
|
|||||
| Total long-term debt |
$ | 288.2 | $ | 160.2 | ||||
|
|
|
|
|
|||||
2013 Refinancing
In March 2013, SIRVA Worldwide, Inc. (“SIRVA Worldwide”), a wholly-owned subsidiary of the Company, completed a refinancing by entering into a new $300 million term loan (“Term Loan”) to replace the prior Term Loan (“2011 Term Loan”) and second lien term loan. SIRVA Worldwide also entered into a new $50 million asset-based revolving credit facility (“ABL Revolver”) to replace the prior ABL Revolver (“2011 ABL Revolver”). The Company deferred debt issuance costs of $6.8 million associated with the refinancing to be amortized over the life of the facilities and recorded a debt extinguishment loss of $8.5 million during the year ended December 31, 2013.
Term Loan
The Term Loan was issued at a 2.6% discount of $7.8 million. Principal payments are due as follows: $3.0 million annually in 2014 through 2018; and the remaining balance on March 27, 2019. The interest rate on the Term Loan is LIBOR plus 6.25% or prime plus 5.25%. Interest is payable quarterly.
The Term Loan is guaranteed by certain of SIRVA Worldwide’s present and future subsidiaries and is secured on a first lien basis by substantially all of the assets of SIRVA Worldwide and its domestic subsidiaries other than assets securing the ABL Revolver. The Term Loan has a second lien against the assets securing the ABL Revolver. The Term Loan contains a number of covenants that, among other matters, restrict SIRVA Worldwide’s ability to incur additional indebtedness, pay dividends, make acquisitions or engage in mergers or consolidations, and make capital expenditures or incur capital lease obligations. While the Term Loan generally permits dividends and distributions on the capital stock of SIRVA Worldwide’s subsidiaries to SIRVA Worldwide, such dividends from SIRVA Worldwide to the Company are generally restricted. The Term Loan requires SIRVA Worldwide to maintain certain financial ratios, including a consolidated interest coverage ratio and consolidated leverage ratio. The Term Loan also includes certain cross-default provisions such that a default under any other loan agreement in excess of $7.5 million that has not been cured within an applicable grace period would cause a default under the Term Loan.
F-18
Table of Contents
ABL Revolver
The ABL Revolver is a $50 million asset-based revolving credit facility maturing on March 27, 2018. It provides for an advance rate of up to 85% of eligible accounts receivable of SIRVA Worldwide and certain of its subsidiaries, subject to limitations on certain accounts. The interest rate on loans is LIBOR plus 1.75%-2.25% or prime plus 0.75%-1.25%. No borrowings were outstanding as of December 31, 2013 and 2012.
The ABL Revolver is guaranteed by certain of SIRVA Worldwide’s present and future subsidiaries and is secured on a first lien basis by substantially all current assets, including, without limitation, accounts receivable, relocation properties held for resale, cash and cash equivalents and certain related assets. The ABL Revolver has a second lien against the assets securing the Term Loan. The ABL Revolver contains a $30 million sub-facility for the issuance of letters of credit and a $20 million sub-facility for swing line loans that can be borrowed and repaid on a same day basis. A fixed charge coverage ratio is required to be maintained when minimum availability thresholds are not met or during the continuance of an event of default. Letters of credit outstanding were $17.3 million and $17.9 million and unused letter of credit availability was $12.7 million and $12.1 million at December 31, 2013 and 2012, respectively.
Affiliates of two of the Company’s stockholders have provided guarantees (the “Investor Guarantees”) with respect to letters of credit issued pursuant to the ABL Revolver. Each of the affiliates has guaranteed the payment of 50% of the letters of credit issued pursuant to the ABL Revolver. The Investor Guarantees shall be terminated either (i) upon the repayment of all obligations under the ABL Revolver and the termination of the ABL Revolver or (ii) on May 7, 2015 provided, that SIRVA Worldwide can demonstrate sufficient projected excess availability, which is the total availability for loans, less SIRVA Worldwide’s trade payables aged in excess of historical levels and book overdrafts.
2011 Refinancing
On March 17, 2011, the Company completed a refinancing of its senior secured credit facility by entering into a $160 million term loan (2011 Term Loan) to replace the existing senior secured credit facility term loan and a $50 million asset-based revolving credit facility (2011 ABL Revolver) to replace the existing senior secured credit facility revolver. The Company deferred debt issuance costs of $6.0 million associated with the refinancing to be amortized over the life of the facilities and recorded a debt extinguishment loss of $18.9 million during the year ended December 31, 2011.
In connection with the refinancing, $183.5 million of second lien principal and deferred interest outstanding was cancelled in exchange for shares of the Company’s Series A Preferred Stock. See Note 12 “Capital Stock and Incentive Plans” for further details.
Other Note Payable
On May 12, 2008, a $2.0 million note was executed having the same terms as the second lien facility. In March 2011, outstanding principal and accrued interest of $2.8 million as of February 28, 2011 was settled in full with a payment of $0.7 million. A gain on debt extinguishment of $2.1 million was recorded for the year ended December 31, 2011. The other note payable balances at December 31, 2013 and 2012 relate to a loan provided to the Company by the Indiana Economic Development Corporation.
F-19
Table of Contents
Other
Future maturities of capital lease obligations and long-term debt principal outstanding at December 31, 2013 are as follows:
| Capital Leases |
Long-term Debt |
|||||||
| (In millions) | ||||||||
| 2014 |
$ | 2.1 | $ | 3.6 | ||||
| 2015 |
1.3 | 3.6 | ||||||
| 2016 |
0.1 | 3.0 | ||||||
| 2017 |
— | 3.0 | ||||||
| 2018 |
— | 3.0 | ||||||
| Thereafter |
— | 282.8 | ||||||
|
|
|
|
|
|||||
| Total minimum lease payments and debt principal, respectively |
$ | 3.5 | $ | 299.0 | ||||
|
|
|
|
|
|||||
The cost of assets, primarily computer equipment and software, under capital leases was $10.9 million and $7.3 million as of December 31, 2013 and 2012, respectively, with accumulated amortization of $8.5 million and $6.1 million as of December 31, 2013 and 2012, respectively.
Note 8. Income Taxes
The components of income (loss) from continuing operations before income taxes were:
| Years Ended December 31, | ||||||||||||
| 2013 | 2012 | 2011 | ||||||||||
| (In millions) | ||||||||||||
| U.S. operations |
$ | (2.6 | ) | $ | (4.4 | ) | $ | (55.8 | ) | |||
| Foreign operations |
7.5 | 5.5 | 7.5 | |||||||||
|
|
|
|
|
|
|
|||||||
| $ | 4.9 | $ | 1.1 | $ | (48.3 | ) | ||||||
|
|
|
|
|
|
|
|||||||
Income tax expense (benefit) related to continuing operations included:
| Years Ended December 31, | ||||||||||||
| 2013 | 2012 | 2011 | ||||||||||
| (In millions) | ||||||||||||
| Current: |
||||||||||||
| Federal |
$ | (0.7 | ) | $ | 0.1 | $ | (0.3 | ) | ||||
| Foreign |
0.1 | 0.9 | 3.7 | |||||||||
| State |
0.2 | — | 0.5 | |||||||||
|
|
|
|
|
|
|
|||||||
| Total current taxes |
(0.4 | ) | 1.0 | 3.9 | ||||||||
| Deferred: |
||||||||||||
| Federal |
1.2 | 1.2 | 1.2 | |||||||||
| Foreign |
(0.8 | ) | (0.1 | ) | (0.3 | ) | ||||||
| State |
0.2 | 0.1 | 0.2 | |||||||||
|
|
|
|
|
|
|
|||||||
| Total deferred taxes |
0.6 | 1.2 | 1.1 | |||||||||
|
|
|
|
|
|
|
|||||||
| Income tax expense |
$ | 0.2 | $ | 2.2 | $ | 5.0 | ||||||
|
|
|
|
|
|
|
|||||||
F-20
Table of Contents
The Company’s effective tax rate from continuing operations differed from the U.S. statutory federal income tax rate of 35%. The sources and tax effects of the differences are as follows:
| Years Ended December 31, | ||||||||||||
| 2013 | 2012 | 2011 | ||||||||||
| (In millions) | ||||||||||||
| Income tax expense (benefit) at U.S. federal statutory rate of 35% |
$ | 1.7 | $ | 0.4 | $ | (16.9 | ) | |||||
| Permanent differences |
0.2 | 0.1 | 0.1 | |||||||||
| Change in valuation allowances |
1.6 | 3.3 | 21.4 | |||||||||
| State income tax |
0.3 | 0.5 | 0.5 | |||||||||
| Foreign rate differential |
(1.0 | ) | (0.6 | ) | (0.9 | ) | ||||||
| Change in uncertain tax positions |
(2.5 | ) | (1.7 | ) | 1.0 | |||||||
| Other |
(0.1 | ) | 0.2 | (0.2 | ) | |||||||
|
|
|
|
|
|
|
|||||||
| Income tax expense |
$ | 0.2 | $ | 2.2 | $ | 5.0 | ||||||
|
|
|
|
|
|
|
|||||||
The components of deferred income taxes were as follows:
| December 31, | ||||||||
| 2013 | 2012 | |||||||
| (In millions) | ||||||||
| Deferred tax assets: |
||||||||
| Net operating loss carryforwards |
$ | 42.6 | $ | 34.0 | ||||
| Pension obligation |
2.8 | 4.3 | ||||||
| Reserves |
5.6 | 4.8 | ||||||
| Intangibles |
7.8 | 14.7 | ||||||
| Employee benefits |
4.0 | 3.8 | ||||||
|
|
|
|
|
|||||
| Total gross deferred tax assets |
62.8 | 61.6 | ||||||
| Less valuation allowance |
(32.1 | ) | (30.0 | ) | ||||
|
|
|
|
|
|||||
| Net deferred tax asset |
30.7 | 31.6 | ||||||
| Deferred tax liabilities: |
||||||||
| Intangibles |
17.7 | 19.5 | ||||||
| Property and equipment |
10.3 | 10.2 | ||||||
| Foreign earnings |
7.2 | 6.8 | ||||||
| Unrealized gains and other |
3.5 | 3.1 | ||||||
|
|
|
|
|
|||||
| Total gross deferred tax liabilities |
38.7 | 39.6 | ||||||
|
|
|
|
|
|||||
| Net deferred tax liabilities |
(8.0 | ) | (8.0 | ) | ||||
| Less net current deferred tax assets |
1.2 | 2.5 | ||||||
|
|
|
|
|
|||||
| Net non-current deferred tax liabilities |
$ | (9.2 | ) | $ | (10.5 | ) | ||
|
|
|
|
|
|||||
Management assesses the available positive and negative evidence to estimate if sufficient future taxable income will be generated to realize the existing deferred tax assets. A significant piece of objective negative evidence evaluated was the cumulative pre-tax loss incurred over the three year period ended December 31, 2013. Such objective evidence limits the ability to consider other subjective evidence such as the Company’s projections for future growth. On the basis of this evaluation, a full valuation allowance for the U.S. and certain foreign subsidiaries’ net deferred tax assets has been recorded at December 31, 2013 and 2012. The change in the valuation allowance was an increase of $2.1 million, $2.2 million and $19.9 million for the years ended December 31, 2013, 2012 and 2011, respectively.
The Company’s ability to utilize its net operating losses and other tax attributes is limited if the Company undergoes an “ownership change” within the meaning of Section 382 of the Internal Revenue Code. An ownership change is generally defined as a greater than 50 percentage point increase in equity ownership by five-
F-21
Table of Contents
percent shareholders in any three-year period. Due to prior ownership changes under these provisions, the Company is limited to $31.8 million of tax benefits from U.S. federal net operating losses and $8.8 million of tax benefits from state net operating losses reported at December 31, 2013. U.S. federal net operating losses will begin to expire in 2022.
Deferred U.S. federal income taxes and non-U.S. withholding taxes of $7.2 million have been provided by the Company on $20.2 million of undistributed foreign earnings accumulated through December 31, 2013.
A reconciliation of the beginning and ending amount of unrecognized tax benefits is as follows:
| (In millions) | ||||
| Balance on December 31, 2011 |
$ | 5.3 | ||
| Prior year decrease |
(0.5 | ) | ||
|
|
|
|||
| Balance on December 31, 2012 |
4.8 | |||
| Settlements |
(3.0 | ) | ||
| Prior year decrease |
(1.6 | ) | ||
|
|
|
|||
| Balance on December 31, 2013 |
$ | 0.2 | ||
|
|
|
|||
At December 31, 2013 and 2012, the Company had $0.2 million and $4.8 million, respectively, of gross unrecognized tax benefits, which would affect the effective tax rate if recognized. There are no unrecognized tax benefits expected to be settled in the next 12 months.
The Company recognizes interest and penalties related to unrecognized tax benefits in income tax expense in the Consolidated Statements of Operations. At December 31, 2013 and 2012, accrued liabilities for interest and penalties were insignificant and $2.5 million, respectively. Interest and penalties related to unrecognized tax benefits affecting earnings were net benefits of $0.9 million and $1.2 million for the years ended December 31, 2013 and 2012, respectively.
The Company is subject to taxation in the U.S., various state and foreign jurisdictions. The Internal Revenue Service has examined the Company’s 2010 and 2009 U.S. federal income tax returns. The tax years 2011 and 2012 remain open to examination for federal income tax purposes. Although tax years 2010 and prior are not subject to examination because of the expiration of the statute of limitations, the Company has various regular and alternative minimum tax net operating loss carryforwards that it may utilize in future years. The Internal Revenue Service could propose adjustments to the closed years by reducing the net operating loss carryforward available to future years provided the net operating loss carryforwards are utilized in an open year. However, the Company does not expect such issue to arise with respect to its closed years. The status of state and foreign tax examinations varies by jurisdiction. The Company does not anticipate any material adjustments to its financial statements resulting from tax examinations currently in progress.
Note 9. Operating Leases
The Company has non-cancelable lease commitments under operating leases for rental of office space, warehouse facilities, transportation equipment and office equipment. The Company’s rental expense under these operating leases was $18.2 million, $19.4 million and $18.3 million for the years ended December 31, 2013, 2012 and 2011, respectively. The Company subleases certain of its leased facilities to third parties. Sublease income was $0.8 million, $1.2 million and $0.6 million for the years ended December 31, 2013, 2012 and 2011, respectively.
F-22
Table of Contents
Future minimum payments to be made under operating leases and received from subleases arrangements at December 31, 2013 are:
| Operating Leases |
Sublease Income |
|||||||
| (In millions) | ||||||||
| 2014 |
$ | 15.5 | $ | 0.4 | ||||
| 2015 |
11.6 | — | ||||||
| 2016 |
9.2 | — | ||||||
| 2017 |
8.0 | — | ||||||
| 2018 |
7.4 | — | ||||||
| Thereafter |
23.4 | — | ||||||
|
|
|
|
|
|||||
| Total |
$ | 75.1 | $ | 0.4 | ||||
|
|
|
|
|
|||||
Note 10. Financial Instruments
Fair value is defined as the price that would be received to sell an asset or paid to transfer a liability in the principal or most advantageous market in an orderly transaction between market participants on the measurement date. Fair value disclosures are reflected in a three-level hierarchy, maximizing the use of observable inputs and minimizing the use of unobservable inputs.
The three levels are defined as follows:
| • | Level 1—inputs to the valuation methodology are quoted prices (unadjusted) for an identical asset or liability in an active market. |
| • | Level 2—inputs to the valuation methodology include quoted prices for a similar asset or liability in an active market or model-derived valuations in which all significant inputs are observable for substantially the full term of the asset or liability. |
| • | Level 3—inputs to the valuation methodology are unobservable and significant to the fair value measurement of the asset or liability. |
The Company measures certain financial assets and liabilities at fair value on a recurring basis, as reflected in the table below:
| Level 2 | ||||||||
| 2013 | 2012 | |||||||
| (In millions) | ||||||||
| Assets |
||||||||
| Mortgages held for resale |
$ | 50.5 | $ | 57.5 | ||||
| Interest rate lock commitments |
0.6 | 1.1 | ||||||
| Forward mortgage-backed securities sales contracts |
0.6 | — | ||||||
| Interest rate cap agreements |
0.6 | — | ||||||
|
|
|
|
|
|||||
| Total assets |
$ | 52.3 | $ | 58.6 | ||||
|
|
|
|
|
|||||
Mortgages Held For Resale
Mortgages held for resale consist of residential mortgage loans originated by the Company’s subsidiary SIRVA Mortgage, Inc. (“SIRVA Mortgage”). The loans are collateralized by the underlying real estate associated with the mortgage loan. Loans are accounted for using the fair value option with changes in fair value recorded as a component of revenue in the Consolidated Statements of Operations. Fair value is determined using inputs from Level 2 of the fair value hierarchy, including market values provided by third-party investors for similar loans. Sales of loans are made without recourse provided the loans meet predetermined specifications as defined in the agreements with private investors.
F-23
Table of Contents
The Company recognizes gains or losses on the sale of residential mortgage loans originated by SIRVA Mortgage at the date the loans are funded by private investors pursuant to the existing sales commitment. The gain or loss equals the difference between the basis in the loan and the net proceeds received and is included in service revenue in the Consolidated Statements of Operations. Revenue for the collection of origination fees and discount points is deferred until the sale of the mortgage loans to third-party investors.
The portfolio is stratified into loans saleable or unsaleable under conventional terms. The unpaid principal balance of loans considered saleable under conventional terms was $49.4 million and $55.3 million at December 31, 2013 and 2012, respectively. The excess of fair value over the unpaid principal balance was $0.6 million and $1.5 million at December 31, 2013 and 2012, respectively. The unpaid principal balance of loans not considered saleable under conventional terms was $0.5 million and $1.2 million at December 31, 2013 and 2012, respectively. The excess of unpaid principal balance over fair value was insignificant and $0.5 million at December 31, 2013 and 2012, respectively.
Residential Mortgage Loan Interest Rate Agreements
The Company attempts to mitigate the risk that a change in interest rates may result in a decline in the value of the Company’s interest rate lock commitments (“IRLCs”) issued on residential mortgage loans intended to be held for resale and mortgages held for resale. These are economically hedged with forward contracts for the sale of loans on a best-effort basis with private investors; forward sales of mortgage-backed securities (“MBS”); and call or put options on U.S. Treasury futures (“Treasury options”). IRLC’s, forward sales of MBS, and Treasury options are derivative instruments that are recognized and measured at fair value in the Consolidated Balance Sheets.
At December 31, 2013 and 2012, the Company had $49.4 million and $55.3 million, respectively, of mortgages held for resale under conventional terms. At December 31, 2013 and 2012, $32.1 million and $52.5 million, respectively, were closed loans committed to a private investor pursuant to an existing sales commitment. At December 31, 2013 and 2012, $17.3 million and $2.8 million, respectively, were economically hedged by forward sales of MBS.
At December 31, 2013 and 2012, the Company had IRLCs of $45.8 million and $57.4 million, respectively, of which $29.3 million and $41.2 million, respectively, were economically hedged by forward sales of MBS. The fair value of IRLCs was an asset of $0.6 million and $1.1 million at December 31, 2013 and 2012, respectively. Fair value is measured using current market rates for the associated mortgage loans (Level 2).
At December 31, 2013 and 2012, the Company had open forward contracts to sell MBS of $44.0 million and $43.0 million, respectively. The fair value of these contracts was an asset of $0.3 million at December 31, 2013 and was insignificant at December 31, 2012. Fair value is measured using quotes obtained from brokers (Level 2).
At December 31, 2013 and 2012, the Company had unsettled closed forward contracts to sell MBS of $34.0 million and $38.0 million, respectively. The fair value of these contracts was an asset of $0.3 million at December 31, 2013 and was insignificant at December 31, 2012. Fair value is measured using the actual purchase and sales price of these closed positions (Level 2).
At both December 31, 2013 and 2012, the Company owned no Treasury options. When Treasury options are used, fair value is measured utilizing the Black-Scholes pricing model or by reference to market prices (Level 2).
Changes in fair value of IRLCs, forward sales of MBS, and Treasury options are recorded in current period earnings and were a gain of $0.1 million, a gain of $0.6 million and a loss of $0.5 million in the years ended December 31, 2013, 2012 and 2011, respectively.
F-24
Table of Contents
Term Debt Interest Rate Cap Agreements
The Company has attempted to mitigate the variability of interest rate payments on its variable-rate debt by entering into interest rate caps during the years ended December 31, 2011 and 2013. The 2011 instrument capped the LIBOR interest rate at 5.0% on a notional amount of $80 million of variable-rate debt through April 2014. The 2013 instrument capped the LIBOR interest rate at 2.5% on $150 million of debt from July 2014 through March 2015, at 3.5% on $125 million of debt from April 2015 through March 2016, at 4.0% on $100 million of debt from April 2016 through March 2017, and at 5.0% on $75 million of debt from April 2017 through March 2018.
Both interest rate caps have been designated as a cash flow hedges. The fair value of the 2011 cap was zero and insignificant at December 31, 2013 and 2012, respectively. Expense of $0.2 million related to the 2011 cap was reclassified into earnings in the year ended December 31, 2013, and an insignificant amount was reclassified during each of the years ended December 31, 2012 and 2011. The fair value of the 2013 cap was $0.6 million at December 31, 2013. The amount reclassified into earnings during the year ended December 31, 2013 related to the 2013 cap was zero and the amount expected to be reclassified into earnings within the next 12 months is insignificant. The Company recorded an unrealized loss of $0.2 million for both caps in accumulated comprehensive loss for the year ended December 31, 2013.
Residential Mortgage Loan Servicing Rights
In June 2012, the Company was re-approved by Fannie Mae (“FNMA”—a government-sponsored enterprise) whereby the Company sells certain of its mortgage loans held for resale to FNMA but retains the mortgage servicing responsibilities (“MSR” or “servicing rights”) and FNMA has no recourse to the Company’s other assets for failure of debtors to pay when due. The Company receives monthly servicing fees based on a percentage of the outstanding balance and amortizes the associated servicing asset in proportion to and over the period of estimated servicing income (level yield method) and assesses the servicing asset for impairment based on fair value at each reporting date. In July 2013, the Company began to sell loans to FNMA. The Company identifies classes of servicing assets based on financial asset type and interest rates. At December 31, 2013 and 2012, the Company serviced $35.3 million and zero, respectively, of residential mortgage loans for investors. Interest rates of the servicing portfolio range from 2.38% to 5.25% with a weighted average coupon of 4.17%. The net carrying amount of the residential MSR portfolio was $0.4 million and zero as of December 31, 2013 and 2012, respectively.
Mobility Solutions Receivable Securitization
The Company has a program to sell certain receivables generated by SIRVA Relocation LLC (“SIRVA Relocation”), a mobility services subsidiary, which expires in December 2015. The receivables are primarily home equity advances and other payments made on behalf of transferees and corporate customers. The equity advances are evidenced by promissory notes executed by the transferees and supported by the underlying value of the transferees’ properties and contract arrangements with corporate customers. The equity advances generally are due within 180 to 270 days or upon the earlier sale of the underlying property.
SIRVA Relocation sells receivable portfolios to a consolidated wholly-owned bankruptcy remote special purpose vehicle, SIRVA Relocation Credit, LLC (“SRC”). The receivables securitization program is accounted for as a sale of financial assets. At each sale transaction, SRC transfers its ownership in all of its receivables on a non-recourse basis to the third-party financial institution in exchange for a cash advance and a securitization receivable (“securitization AR”), which is discussed further below. The loss on transfer to the independent third-party financial institution was $3.0 million, $3.6 million and $3.6 million for the years ended December 31, 2013, 2012 and 2011, respectively, and has been included in selling, general and administrative expense in the Consolidated Statements of Operations.
F-25
Table of Contents
As of December 31, 2013, 51% of the $100.0 million facility has been utilized. The table below summarizes certain cash flows received from and paid to the special purpose subsidiary.
| (In millions) | ||||
| Balance from securitizations on December 31, 2011 |
$ | 46.6 | ||
| Proceeds from new securitizations |
779.5 | |||
| Net collections paid to purchasers |
(779.1 | ) | ||
|
|
|
|||
| Balance from securitizations on December 31, 2012 |
47.0 | |||
| Proceeds from new securitizations |
828.8 | |||
| Net collections paid to purchasers |
(825.1 | ) | ||
|
|
|
|||
| Balance from securitizations on December 31, 2013 |
$ | 50.7 | ||
|
|
|
|||
Ineligible receivables and the difference between receivables sold and cash advanced are recorded as a component of accounts receivable in the Consolidated Balance Sheets. The fair value of the securitization AR is estimated by considering the history of performance of these types of receivables, the underlying security, the subordinate position of the securitization AR, current interest rates, and economic conditions. The key assumptions used to estimate fair value include the discount rate (approximately 5.8%), the expected weighted-average life of the underlying receivable (approximately two months), and anticipated credit losses (which have been immaterial based on historical experience). At December 31, 2013 and 2012, the securitization AR, carried at amounts that approximate fair value, was $4.3 million and $2.6 million, respectively. An immediate 20% increase in the discount rate would reduce the fair value of the securitization AR at December 31, 2013 by an immaterial amount.
Under the terms of the program, SIRVA Relocation is responsible for servicing the receivables during their life, including administration and collection of the receivables, on behalf of the financial institution. Fees are paid to SIRVA Relocation by SRC at the rate of 0.6% of the transferred receivables. The fees are considered adequate compensation for the services involved as they approximate the costs of providing the services. Accordingly, no servicing asset or liability is recorded.
The program does not contain any financial covenants, but does contain cross-default provisions to the Company’s credit facilities and requirements for financial reporting and actions consistent with the maintenance and servicing of the receivable obligations.
Mobility Networks Receivable Securitization
In July 2013, the Company entered into a program to sell certain receivables generated by its Mobility Networks segment to Deutsche Bank AG (“Deutsche Bank”). The agreements have an indefinite term but can be cancelled with 30 day notice by Deutsche Bank. The receivables are amounts due from one large corporate customer. The receivables are generally due within 120 days and are secured by a contractual arrangement with the large corporate customer.
This receivables securitization program is accounted for as a sale of financial assets. At each sale transaction, the Company transfers its ownership in all of its receivables generated by this customer on a non-recourse basis to Deutsche Bank in exchange for a cash receipt less a discounted amount based on time to maturity and an assumed discount factor. There were $6.8 million and zero receivables sold under these agreements during years ended December 31, 2013 and 2012, respectively.
F-26
Table of Contents
Note 11. Pension Plans and Other Benefits
Defined Benefit Plans
The Company has a qualified defined benefit pension plan covering certain of its domestic employees. This defined benefit pension plan was amended in 2002 to freeze participation and benefit accruals. The Company also has an unfunded, nonqualified plan that provides retirement benefits not otherwise provided under the qualified plan, because of the benefit limitations imposed by Sections 415 and 401(a)(17) of the Internal Revenue Code of 1986, as amended (“Internal Revenue Code”). This plan ensures that an executive receives the total pension benefit to which he or she otherwise would be entitled, were it not for such limitations.
Information on the defined benefit plans and amounts recognized in the Consolidated Balance Sheets at December 31, 2013 and 2012, based on actuarial valuations measured as of December 31, are as follows:
| 2013 | 2012 | |||||||
| (In millions) | ||||||||
| Change in accumulated benefit obligation: |
||||||||
| Benefit obligation at beginning of year |
$ | 169.4 | $ | 152.8 | ||||
| Interest cost |
6.5 | 7.0 | ||||||
| Actuarial (gain) loss |
(15.2 | ) | 15.9 | |||||
| Benefits paid |
(6.3 | ) | (6.3 | ) | ||||
|
|
|
|
|
|||||
| Benefit obligation at end of year |
$ | 154.4 | $ | 169.4 | ||||
|
|
|
|
|
|||||
| Change in plan assets at fair value: |
||||||||
| Beginning balance |
$ | 111.1 | $ | 99.8 | ||||
| Actual return on plan assets |
10.2 | 11.2 | ||||||
| Company contribution |
6.1 | 6.4 | ||||||
| Benefits paid |
(6.3 | ) | (6.3 | ) | ||||
|
|
|
|
|
|||||
| Ending balance |
$ | 121.1 | $ | 111.1 | ||||
|
|
|
|
|
|||||
| Unfunded status at end of year |
$ | (33.3 | ) | $ | (58.3 | ) | ||
|
|
|
|
|
|||||
| Amounts recognized in the Consolidated Balance Sheets consist of: |
||||||||
| Other current liabilities |
$ | 0.1 | $ | 0.1 | ||||
| Pension liabilities |
33.2 | 58.2 | ||||||
|
|
|
|
|
|||||
| $ | 33.3 | $ | 58.3 | |||||
|
|
|
|
|
|||||
| Weighted-average assumptions used for measurements of the projected benefit obligation: |
||||||||
| Discount rate |
4.80 | % | 3.90 | % | ||||
| Salary growth rate |
N/A | * | N/A | * | ||||
| Years Ended December 31, | ||||||||||||
| 2013 | 2012 | 2011 | ||||||||||
| (In millions) | ||||||||||||
| Components of net periodic benefit expense: |
||||||||||||
| Interest cost |
$ | 6.5 | $ | 7.0 | $ | 7.3 | ||||||
| Expected return on plan assets |
(7.7 | ) | (6.9 | ) | (7.0 | ) | ||||||
| Amortization of net loss |
4.0 | 2.9 | 1.8 | |||||||||
|
|
|
|
|
|
|
|||||||
| Net periodic benefit expense |
$ | 2.8 | $ | 3.0 | $ | 2.1 | ||||||
|
|
|
|
|
|
|
|||||||
| Weighted-average assumptions used to measure net periodic expense: |
||||||||||||
| Discount rate |
3.90 | % | 4.70 | % | 5.40 | % | ||||||
| Expected rate of return on plan assets |
7.00 | % | 7.00 | % | 7.50 | % | ||||||
| Salary growth rate |
N/A | * | N/A | * | N/A | * | ||||||
| * | Not applicable |
F-27
Table of Contents
Included in accumulated other comprehensive loss as of December 31, 2013 is an unrecognized net actuarial loss of $28.8 million. The estimated net actuarial loss that will be amortized from accumulated other comprehensive loss into net periodic benefit cost in 2014 will be $1.5 million.
The discount rate for determining the pension obligation incorporates discounting projected pension plan cash flows with spot rates from a hypothetical yield curve based on a portfolio of AA-graded bonds with yields falling within the 40th to 90th percentiles. Because the plan was frozen in 2002 and participants are no longer accruing service benefits, there will be no future compensation increases.
The expected rate of return on plan assets is determined by the plan assets’ historical long-term investment performance, current asset allocation, and estimates of future long-term returns by asset class. In developing its expected long-term rate of return assumption, the Company’s pension asset class 10-year weighted-average returns for each of the last 10 years were reviewed. The expected long-term rate of return for 2014 will be 7.0%.
The Company invests in several asset classes to ensure diversification of the plan assets with the intent to minimize the risk of large losses. Plan assets are targeted to be allocated 55% in equity securities (27.5% in U.S. equity and 27.5% in non-U.S. equity) and 45% in fixed income securities. The actual asset allocations are reviewed and rebalanced on a periodic basis to maintain the target allocations.
The fair values of the Company’s pension plan assets at December 31 by asset category are as follows:
| Quoted Prices in Active Markets for Identical Assets (Level 1) |
Significant Observable Inputs (Level 2) |
Significant Unobservable Inputs (Level 3) |
Total | |||||||||||||
| (In millions) | ||||||||||||||||
| 2013 |
||||||||||||||||
| Fixed income |
$ | — | $ | 52.5 | $ | — | $ | 52.5 | ||||||||
| U.S. equities |
6.4 | 28.0 | — | 34.4 | ||||||||||||
| Non—U.S. equities |
9.8 | 24.4 | — | 34.2 | ||||||||||||
|
|
|
|
|
|
|
|
|
|||||||||
| Total |
$ | 16.2 | $ | 104.9 | $ | — | $ | 121.1 | ||||||||
|
|
|
|
|
|
|
|
|
|||||||||
| 2012 |
||||||||||||||||
| Fixed income |
$ | — | $ | 52.3 | $ | — | $ | 52.3 | ||||||||
| U.S. equities |
7.5 | 31.5 | — | 39.0 | ||||||||||||
| Non—U.S. equities |
8.5 | 11.3 | — | 19.8 | ||||||||||||
|
|
|
|
|
|
|
|
|
|||||||||
| Total |
$ | 16.0 | $ | 95.1 | $ | — | $ | 111.1 | ||||||||
|
|
|
|
|
|
|
|
|
|||||||||
Estimated future benefit payments are as follows: $7.9 million in 2014; $8.6 million in 2015; $9.0 million in 2016; $9.1 million in 2017; $9.5 million in 2018 and $52.2 million for the years 2019 to 2023.
The Company intends to fund at least the minimum amount required under the Employee Retirement Income Security Act of 1974, as amended (“ERISA”). The Company expects to make contributions of $6.9 million in 2014, as determined by minimum required contribution calculations.
Defined Contribution Plan
The Company sponsors a defined contribution plan pursuant to Section 401(k) of the Internal Revenue Code. The plan is subject to the provisions of ERISA. The Company incurred expense of $0.4 million, $0.1 million and zero for matching contributions during the years ended December 31, 2013, 2012 and 2011, respectively. The Company’s incurred expenses for 2012 and 2011 were minimized due to matching contributions being funded by forfeitures.
F-28
Table of Contents
Note 12. Capital Stock and Incentive Plans
Series A Preferred Stock
During 2011, the Company issued 173,503 shares in exchange for partial cancellation of the second lien debt. During 2012, 11,362 shares were issued as part of the final settlement of the exchange. During 2013, $109.0 million of the proceeds from the 2013 debt refinancing were used to redeem 85,421 shares, including any accrued and unpaid dividends. See Note 7 “Long-term Debt” for further details.
Upon a liquidation, the holders of Series A Preferred Stock are entitled to a complete return of their liquidation value in the preferred stock of $1,000 per share and a 13% per annum yield on the Series A Preferred Stock, compounded quarterly, prior to the holders of common stock having any rights to distributions. The stock has no voting rights and is not convertible. The Company can redeem the stock at any time by paying the full liquidation value, including unpaid dividends. Holders of Series A Preferred Stock can require a redemption if a change in the Company’s ownership occurs. Subject to certain exceptions, the Company and its holders of Series A Preferred Stock have a right of first refusal on any sale or transfer of the stock. Preferred stock is subject to transfer restrictions.
Cumulative preferred stock dividends in arrears were $42.5 million and $45.8 million at December 31, 2013 and 2012, respectively. In the absence of a liquidation or redemption, the Company has no obligation to pay cash dividends on the Series A Preferred Stock. The Company may elect to pay cash dividends on Series A Preferred Stock after repayment of all obligations under the ABL Revolver and Term Loan. No preferred dividends have been declared.
Common Stock
Holders of shares of common stock are entitled to receive dividends when and if declared by the Board of Directors and are entitled to one vote per share on all matters submitted to a vote of the shareholders.
Long-term Incentive Plan
In 2009, the Company implemented a Long Term Incentive Plan (the “LTIP”) for any member of the Board of Directors, officer, key employee, or former key employee of, or consultant to, the Company or any of its subsidiaries, or any shareholder who has the right to select a member of the Board of Directors. The LTIP provides for the offer of up to 107,778 shares of the Company’s common stock. The shares of common stock to be delivered under the LTIP may consist, in whole or in part, of common stock held in treasury or authorized but unissued shares of common stock, not reserved for any other purpose. The LTIP provides for the award to eligible participants of restricted shares, restricted stock units, and stock options, including incentive stock options (within the meaning of section 422 of the Internal Revenue Code). Restricted stock granted under the LTIP to members of the Board of Directors generally vests over three years from the date that the director was elected to the Board of Directors. Restricted stock granted under the LTIP to officers and key employees generally vests over five years.
Compensation expense for equity awards is recognized over the vesting period based on their grant-date fair value. For the years ended December 31, 2013, 2012 and 2011, non-cash stock compensation expense related to restricted was $0.1 million, insignificant and insignificant, respectively. As of December 31, 2013, total unrecognized compensation cost related to restricted stock was $0.2 million. The total fair value of restricted stock vested during the years ended December 31, 2013, 2012 and 2011 was $0.1 million, insignificant and insignificant, respectively. The estimated fair value of the restricted stock for the year ended December 31, 2013 was based on a review of share trading transactions involving the Company’s stock among its private equity owners.
F-29
Table of Contents
Information with respect to restricted stock activity is as follows:
| Restricted Stock Shares |
Weighted- Average Grant Date Fair Value |
|||||||
| Nonvested at December 31, 2012 |
29,976 | $ | 4.10 | |||||
| Granted |
1,328 | 200.00 | ||||||
| Vested |
(17,088 | ) | 3.10 | |||||
| Forfeited |
— | — | ||||||
|
|
|
|
|
|||||
| Nonvested at December 31, 2013 |
14,216 | $ | 23.60 | |||||
|
|
|
|
|
|||||
Equity Award Plan
In 2010, the Company implemented a Leaders Equity Award Plan (the “Plan”) for key employees. The Plan provides for the issuance of up to 12,000,000 units. The Plan is funded upon a sale of the Company’s common stock to a third party above a strike price of $331 per share (an “Eligible Sale”). Through an amendment to the stockholders’ agreement effective as of July 1, 2010, the Company’s stockholders agreed to fund the Plan through the payment to the Company of 1.5% of the sales price of any Eligible Sale. An amount equal to 1.5% of the sales price of an Eligible Sale is distributed to participants based on their prorata share of units in the Plan, up to a maximum of $12.0 million. For the first sale of equity and large sales involving more than 50% of the Company’s shares, 50% of the award value is paid in cash six months after the sale, and the remaining 50% is paid 12 months after the sale. Most other types of sales do not have a waiting period. In order to receive a payment under the Plan, participants generally must be employed by the Company at the time of the distribution. Compensation expense will not be recognized until consummation of an Eligible Sale.
Stock Option Plan
In 2013, the Company implemented a Stock Incentive Plan (the “Incentive Plan”) for any employee, non-employee director, independent contractor or consultant of the Company or any of its subsidiaries. The aggregate number of common shares that may be issued pursuant to all incentive stock options granted under this Incentive Plan including amendments is 26,294. Stock options granted under the Incentive Plan generally vest over five years.
Information with respect to stock option activity is as follows:
| Stock Options |
Weighted- Average Exercise Price |
|||||||
| Outstanding at December 31, 2012 |
— | $ | — | |||||
| Stock options granted |
26,294 | 200.00 | ||||||
| Stock options vested |
— | — | ||||||
| Stock options forfeited |
— | — | ||||||
|
|
|
|
|
|||||
| Outstanding at December 31, 2013 |
26,294 | $ | 200.00 | |||||
|
|
|
|
|
|||||
The weighted-average remaining contractual life of these options is 9.23 years. At December 31, 2013 the number of options that were exercisable was zero.
The weighted-average fair values at date of grant for options granted through December 31, 2013 were $66.63. All fair values were estimated using the Black-Scholes option valuation model with the following assumptions: risk-free interest rates of 1.19% to 1.77%, expected volatility of 30.7%, expected life of 6.5 years and no dividend payments.
F-30
Table of Contents
Compensation expense for stock option awards is recognized over the vesting period based on their grant-date fair value. For the years ended December 31, 2013, 2012 and 2011, non-cash stock compensation expense related to stock options was $0.6 million, zero and zero, respectively, and is recorded as a component of selling, general and administrative expense. As of December 31, 2013, total unrecognized compensation cost related to stock options is $1.1 million.
Note 13. Segments
The Company has four operating segments, (i) Mobility Solutions, (ii) Mobility Networks, (iii) Europe, Asia and Emerging Markets, and (iv) Australia.
Mobility Solutions: The Company provides a broad range of relocation services to assist its customers that are based in the United States and Canada at each stage of an international or domestic mobility event, including policy consultation, temporary living services, move management services, global assignment management services, global compensation services, immigration and visa services, orientation, settling and destination services, and property management-related services including home selling and finding assistance, closing and title insurance services and mortgage origination and assistance. Additionally, the Company assists the human resource departments of its corporate customers in administering their mobility programs with compliance and reporting, expense tracking, cost analysis and projection, and management reporting services.
Mobility Networks: The Company provides international, interstate and intrastate household goods moving services to its customers in the United States and Canada through its agent network (Allied and northAmerican) and through its supplier network internationally. The Company acts as a network manager for its agent network, providing, among other things, brand management, load optimization, billing, collection and claims handling. It operates an asset-light model, which has many of the characteristics of a franchise model, in which it signs exclusive long-term contracts with local agents that operate under its brands, perform the capital and labor-intensive moving services, and own the trucks and other assets required to perform physical moving.
Europe, Asia and Emerging Markets: In these markets, the Company provides a similar range of services that it offers through its Mobility Solutions and Mobility Networks segments through a combination of company-owned and agent/franchise networks.
Australia: The Company provides a full range of mobility services in this geographic region including household goods moves on behalf of corporate customers through company-operated branches or those owned by its franchises rather than through an agent network as there are only a limited number of moving companies in this region.
Costs associated with corporate governance activities that are not allocated to the four operating segments are reflected in Corporate below. The Corporate function also provides a number of shared operational, information technology and administrative services to each segment so that they do not have to replicate these services and incur duplicative costs. These shared costs are allocated to the operating segments based primarily on specific identification, projected revenue, headcount and estimated use of time. Interest expense and other non-operating items are not allocated or reviewed on a segment basis.
In order to service global customers, relocation and moving services are often provided by one segment on behalf of a customer invoiced by another segment. In those instances, the segment providing the service invoices their charges to the segment invoicing the customer in order to provide meaningful financial analysis at a segment level. Revenue and expense associated with these intercompany transactions are eliminated for both segment and consolidated reporting.
F-31
Table of Contents
| Mobility Solutions(1) |
Mobility Networks |
Europe, Asia and Emerging Markets |
Australia | Corporate | Consolidated | |||||||||||||||||||
| (In millions) | ||||||||||||||||||||||||
| Year ended December 31, 2013 |
||||||||||||||||||||||||
| Revenue |
$ | 672.6 | $ | 1,088.9 | $ | 72.2 | $ | 160.5 | $ | — | $ | 1,994.2 | ||||||||||||
| Adjusted EBITDA(2) |
32.5 | 42.1 | 7.6 | 7.8 | (13.2 | ) | 76.8 | |||||||||||||||||
| Depreciation and amortization |
3.9 | 16.0 | 1.5 | 4.1 | — | 25.5 | ||||||||||||||||||
| Total assets(3) |
136.8 | 167.9 | 49.7 | 48.3 | 24.6 | 427.3 | ||||||||||||||||||
| Capital expenditures |
3.7 | 2.4 | 1.2 | 1.5 | 3.6 | 12.4 | ||||||||||||||||||
| Year ended December 31, 2012 |
||||||||||||||||||||||||
| Revenue |
$ | 633.1 | $ | 1,080.9 | $ | 63.1 | $ | 173.7 | $ | — | $ | 1,950.8 | ||||||||||||
| Adjusted EBITDA(2) |
27.4 | 38.3 | 4.5 | 7.2 | (10.7 | ) | 66.7 | |||||||||||||||||
| Depreciation and amortization |
4.1 | 17.2 | 1.4 | 5.4 | — | 28.1 | ||||||||||||||||||
| Total assets(3) |
129.2 | 177.8 | 44.5 | 61.5 | 20.2 | 433.2 | ||||||||||||||||||
| Capital expenditures |
1.7 | 4.6 | 0.8 | 2.4 | 1.1 | 10.6 | ||||||||||||||||||
| Year ended December 31, 2011 |
||||||||||||||||||||||||
| Revenue |
$ | 689.4 | $ | 1,017.0 | $ | 58.9 | $ | 167.1 | $ | — | $ | 1,932.4 | ||||||||||||
| Adjusted EBITDA(2) |
22.8 | 30.4 | 7.0 | 9.0 | (14.8 | ) | 54.4 | |||||||||||||||||
| Depreciation and amortization |
4.2 | 16.5 | 1.3 | 5.7 | — | 27.7 | ||||||||||||||||||
| Capital expenditures |
2.2 | 8.6 | 0.7 | 3.2 | 0.7 | 15.4 | ||||||||||||||||||
| (1) | Revenue in the Mobility Solutions segment is comprised of service revenue of $148.8 million, $138.7 million and $143.7 million and home revenue of $523.8 million, $494.4 million and $545.7 million for the years ended December 31, 2013, 2012 and 2011, respectively. |
| (2) | The Company evaluates the performance of its segments based on segment Adjusted EBITDA, which is defined as income from continuing operations before interest, taxes, depreciation and amortization (“EBITDA”), further adjusted to exclude certain other costs and expenses permitted in calculating covenant compliance under the Company’s Term Loan. EBITDA and Adjusted EBITDA do not represent and should not be considered alternatives to net income or operating income under GAAP and may not be comparable to similarly titled measures in other businesses. |
Management uses Adjusted EBITDA:
| • | as a measurement used in evaluating its consolidated and segment-level performance on a consistent basis; |
| • | to calculate incentive compensation for its employees; |
| • | for planning purposes, including the preparation of its internal annual operating budget; |
| • | to evaluate the performance and effectiveness of its operational strategies; and |
| • | to assess compliance with various metrics associated with its debt agreements. |
Adjusted EBITDA has limitations as an analytical tool, and should not be considered in isolation, or as a substitute for analysis of the Company’s results as reported under GAAP. Some of the limitations are:
| • | Adjusted EBITDA does not reflect interest expense, or the cash requirements necessary to service interest or principal payments, on the Company’s debt; |
| • | although depreciation and amortization are non-cash charges, the assets being depreciated and amortized may have to be replaced in the future, and Adjusted EBITDA does not reflect the cash requirements for such replacements; |
F-32
Table of Contents
| • | Adjusted EBITDA does not reflect the Company’s tax expense or the cash requirements to pay its taxes; |
| • | Adjusted EBITDA does not reflect the non-cash component of employee compensation; and |
| • | Adjusted EBITDA does not reflect certain other costs and expenses which are permitted to be excluded in calculating covenant compliance under the Company’s Term Loan or the cash requirements to pay for such costs and expenses. |
The following tables reconcile income (loss) from continuing operations to Adjusted EBITDA:
| Years Ended December 31, | ||||||||||||
| 2013 | 2012 | 2011 | ||||||||||
| (In millions) | ||||||||||||
| Income (loss) from continuing operations |
$ | 4.7 | $ | (1.1 | ) | $ | (53.3 | ) | ||||
| Interest expense, net |
26.2 | 25.1 | 32.2 | |||||||||
| Income tax expense |
0.2 | 2.2 | 5.0 | |||||||||
| Depreciation and amortization expense |
25.5 | 28.1 | 27.7 | |||||||||
|
|
|
|
|
|
|
|||||||
| EBITDA |
56.6 | 54.3 | 11.6 | |||||||||
| Debt extinguishment loss (gain)(a) |
8.0 | (0.3 | ) | 16.8 | ||||||||
| Restructuring and impairment expense(b) |
2.3 | 2.3 | 3.7 | |||||||||
| Severance and other cost-savings initiative expenses(c) |
1.0 | 2.5 | 5.4 | |||||||||
| Supplier contract termination costs(d) |
— | 0.1 | 5.2 | |||||||||
| Pension expense(e) |
2.8 | 3.0 | 2.1 | |||||||||
| Professional fees and settlements(f) |
0.5 | 0.1 | 2.7 | |||||||||
| Mortgage repurchases and reinsurance losses(g) |
— | 3.9 | 4.2 | |||||||||
| Acquisitions, new location and new customer related costs(h) |
1.0 | 0.3 | 0.8 | |||||||||
| New customer related costs(i) |
3.0 | — | — | |||||||||
| Foreign exchange losses(j) |
0.9 | — | 1.4 | |||||||||
| Board of director fees(k) |
— | 0.5 | 0.5 | |||||||||
| Stock compensation(l) |
0.7 | — | — | |||||||||
|
|
|
|
|
|
|
|||||||
| Subtotal adjustments |
20.2 | 12.4 | 42.8 | |||||||||
|
|
|
|
|
|
|
|||||||
| Adjusted EBITDA |
$ | 76.8 | $ | 66.7 | $ | 54.4 | ||||||
|
|
|
|
|
|
|
|||||||
| (a) | Charges recognized related to debt refinancing activities in the applicable periods as discussed further in Note 7 “Long-term Debt”. |
| (b) | Costs incurred or accrued for various restructuring plans implemented throughout the business including severance and employee benefits and facility exit costs as discussed further in Note 14 “Restructuring and Impairments”. |
| (c) | Costs incurred in connection with various cost savings initiatives implemented throughout the business including severance and employee benefits, hiring costs, and compensation and other costs associated with the completion of the debt refinancings. |
| (d) | Costs incurred to cancel certain information technology contracts associated with the Company’s decision to insource the functions previously provided by those suppliers. |
| (e) | Expenses associated with the Company’s frozen U.S. defined benefit pension plans. See Note 11 “Pension Plans and Other Benefits” for further details. |
| (f) | Legal, consulting and other professional fees and settlements, including tax consulting costs related to an Australian Tax Authority examination, costs related to the Company’s project to migrate applications from a mainframe platform to a server-based platform, and Australia franchise settlements and bad-debt write-offs. |
| (g) | Costs related to mortgage loan sale indemnification liabilities and mortgage reinsurance. See “Reinsurance Reserves” included within Note 2 “Summary of Significant Accounting Policies” as well as Note 17 “Contingencies” for further details. |
F-33
Table of Contents
| (h) | Costs incurred to open up new locations in Asia, relocate warehouses in Australia, acquire a business in Brazil, and expand business in India, including legal and professional fees, travel expenses, and labor costs to move equipment and customer’s household goods stored by the Company. |
| (i) | Costs incurred to implement major new customer service capabilities, including compensation and benefits for added staffing and associated hiring and training expenses. |
| (j) | Net losses associated with translation of foreign denominated assets and liabilities. See “Foreign Currency Translation” included within Note 2 “Summary of Significant Accounting Policies” for further details. |
| (k) | Expenses paid for board of director services and reimbursement of board member travel and related expenses. |
| (l) | Non-cash stock-based compensation expense for the Company’s board of directors and management. See Note 12 “Capital Stock and Incentive Plans” for further details. |
| (3) | Corporate assets consist of assets that cannot be specifically identified with a reportable segment such as cash, equipment, debt issuance costs, and other miscellaneous assets. |
Revenue for the years ended December 31, 2013, 2012 and 2011 and long-lived assets (property and equipment, net) at December 31, 2013 and 2012 by geographic area were as follows:
| 2013 | 2012 | 2011 | ||||||||||||||||||
| Revenue | Long-lived Assets |
Revenue | Long-lived Assets |
Revenue | ||||||||||||||||
| (In millions) | ||||||||||||||||||||
| United States |
$ | 1,685.2 | $ | 43.0 | $ | 1,638.1 | $ | 39.3 | $ | 1,632.3 | ||||||||||
| Australia / New Zealand |
160.5 | 7.8 | 173.7 | 10.2 | 167.1 | |||||||||||||||
| Other non-U.S |
148.5 | 3.2 | 139.0 | 3.0 | 133.0 | |||||||||||||||
|
|
|
|
|
|
|
|
|
|
|
|||||||||||
| Total continuing operations |
$ | 1,994.2 | $ | 54.0 | $ | 1,950.8 | $ | 52.5 | $ | 1,932.4 | ||||||||||
|
|
|
|
|
|
|
|
|
|
|
|||||||||||
Note 14. Restructuring and Impairments
During the year ended December 31, 2013, the Company established a restructuring plan related to a reduction in personnel to be completed in 2014. The total cost of the restructuring plan in 2013 was $1.8 million for severance and employee benefits. The Company also incurred expenses of $0.2 million for lease contract termination fees and remaining lease rentals on facilities exited and other costs of $0.3 million.
During the year ended December 31, 2012, the Company established a restructuring plan related to a reduction in personnel to be completed in 2013. The total cost of the restructuring plan in 2012 was $3.2 million for severance and employee benefits. Other severance costs of $0.2 million were also incurred in 2012. In addition, the Company reduced the accrual for remaining lease payments by $1.1 million related to one of its facilities as a result of its decision to terminate the related agreement before the contractual term.
During the year ended December 31, 2011, the Company incurred expenses of $3.2 million and $0.5 million for exit costs and impairments related to one of its facilities.
F-34
Table of Contents
The restructuring accrual activity for the years ended December 31, 2013 and 2012 was as follows:
| Severance and Employee Benefits |
Contract Termination & Other Costs |
Total | ||||||||||
| (In millions) | ||||||||||||
| Balance at December 31, 2010 |
$ | — | $ | 4.0 | $ | 4.0 | ||||||
| Restructuring charge |
— | 3.2 | 3.2 | |||||||||
| Payments |
— | (1.1 | ) | (1.1 | ) | |||||||
| Accretion |
— | 0.5 | 0.5 | |||||||||
|
|
|
|
|
|
|
|||||||
| Balance at December 31, 2011 |
— | 6.6 | 6.6 | |||||||||
| Restructuring charge (income) |
3.4 | (1.1 | ) | 2.3 | ||||||||
| Payments |
(0.2 | ) | (2.7 | ) | (2.9 | ) | ||||||
| Accretion |
— | (0.2 | ) | (0.2 | ) | |||||||
|
|
|
|
|
|
|
|||||||
| Balance at December 31, 2012 |
3.2 | 2.6 | 5.8 | |||||||||
| Restructuring charge |
1.8 | 0.5 | 2.3 | |||||||||
| Payments |
(2.3 | ) | (2.9 | ) | (5.2 | ) | ||||||
|
|
|
|
|
|
|
|||||||
| Balance at December 31, 2013 |
$ | 2.7 | $ | 0.2 | $ | 2.9 | ||||||
|
|
|
|
|
|
|
|||||||
Note 15. Subsequent Events
The Company evaluated subsequent events through March 27, 2014, the date these consolidated financial statements were available to be issued.
In March 2014, the Company acquired the assets of SMARTBOX Portable Self Storage LLC. and certain affiliated entities, a Virginia-based portable moving and storage services company. SMARTBOX offers individuals and businesses affordable and convenient storage and local and long-distance moving solutions in 43 markets throughout the United States and operates 19 franchise locations and a call center operation in Richmond, Virginia. The acquired business will become a part of the Mobility Networks segment.
In March 2014, the Company acquired InHouse Relocation GmbH, a Germany-based mobility services provider. InHouse Relocation offers mobility, move management and visa and immigration services to corporate customers throughout continental Europe, operates 3 locations in Germany and is headquartered in Munich, Germany. The acquired business will become a part of the Europe, Asia and Emerging Markets segment.
Aggregate consideration paid with respect to the above acquisitions is $5.7 million. Due to the immaterial nature of these transactions, both individually and in the aggregate, pro forma and other disclosures were not considered necessary.
Note 16. Discontinued Operations
Business Disposition—SPD
During 2013, the Company disposed of its Special Products Division (“SPD”), a component of the Mobility Networks segment. The results of this business are reported in discontinued operations in the Consolidated Statements of Operations.
Business Disposition—U.S. Insurance Business
In 2005, the Company sold its subsidiaries Transguard Insurance Company of America, Inc., National Association of Independent Truckers, LLC, Vanguard Insurance Agency, Inc., and other related companies of the
F-35
Table of Contents
U.S. insurance business (collectively, the “U.S. Insurance Business”). Proceeds from the sale included $20.0 million of payments due in annual installments during the years 2009 through 2013. The third, fourth and fifth payments of $4.0 million were received in 2011, 2012 and 2013, respectively. As part of the sale, the Company guaranteed the U.S. Insurance Business closing balance sheet net loss reserves against adverse development up to a maximum of $20.0 million. The Company also was entitled to receive 55% of any favorable reserve development.
Gains related to favorable loss reserve development were deferred until they were realized. The final determination of the reserve development amounts was based upon an actuarial evaluation of the closing balance sheet net loss reserves which was agreed between the parties in the second quarter of 2013. The Company received cumulative payments for favorable reserve development through the final settlement date of $6.1 million, which was recognized in 2013 and recorded in discontinued operations. Payments for favorable loss development of $1.5 million, $1.8 million and $1.6 million were received in 2013, 2012 and 2011, respectively.
Income (loss) from discontinued operations includes the following:
| Years Ended December 31, | ||||||||||||
| 2013 | 2012 | 2011 | ||||||||||
| (In millions) | ||||||||||||
| Revenue |
$ | 7.5 | $ | 22.0 | $ | 24.6 | ||||||
| Gross profit |
— | 1.8 | 2.6 | |||||||||
| Income (loss) from discontinued operations, net of tax |
5.0 | (0.3 | ) | 0.4 | ||||||||
Income from discontinued operations of $5.0 million for the year ended December 31, 2013 includes a net gain of $5.8 million related to the final settlement of the favorable reserve development related to the U.S. Insurance business, a net gain of $0.6 million related to the sale of SPD and a net loss of $1.4 million from the operating activities of SPD.
Loss from discontinued operations of $0.3 million for the year ended December 31, 2012 includes a loss of $0.7 million from the operating activities of SPD partially offset by a gain of $0.4 million related to the U.S. Insurance business.
Income from discontinued operations of $0.4 million for the year ended December 31, 2011 includes a net gain of $0.3 million related to the U.S. Insurance business and net income of $0.1 million from the operating activities of SPD.
Note 17. Contingencies
Litigation
The Company is involved from time-to-time in lawsuits and other routine legal matters incidental to its business, including lawsuits relating to the conduct of its agents and drivers and home sale assistance programs. Such lawsuits have arisen, and in the future may arise, from accidents involving serious injuries or the loss of life or for disclosure issues regarding a property condition. While the Company may be liable for damages or suffer reputational harm from litigation, the Company believes that such legal proceedings will not have a materially adverse effect on its financial position, results of operations or liquidity.
Residential Mortgage Loans
Loans sold are subject to certain indemnification provisions with investors, including the repurchase of loans sold and repayment of certain sales proceeds to investors under certain conditions. The Company makes representations and warranties that loans sold to investors meet their program’s guidelines and that the information
F-36
Table of Contents
provided by the borrowers is accurate and complete. In the event of a default on a loan sold, the investor may make a claim for losses due to document deficiencies, program compliance, early payment default, and fraud or borrower misrepresentations. At December 31, 2013 and 2012, the Company recorded an accrual of $0.4 million and $4.3 million, respectively, as an estimate of its obligations under these indemnification provisions.
In April and May, 2013, the Company completed global settlements with two of its largest investors for $3.0 million and $0.8 million, respectively. The settlements released the Company from future recourse as a result of the aforementioned indemnification provisions for all loans sold to those investors through the settlement dates.
During the years ended December 31, 2013, 2012 and 2011, the Company repurchased loans of $0.2 million, $1.4 million and $2.1 million, respectively. Losses associated with the repurchase of these loans were insignificant, $0.5 million and $0.8 million in 2013, 2012 and 2011, respectively. At December 31, 2013 and 2012, the Company had repurchased loans of zero and $0.1 million, respectively. These loans are recorded at fair value at the time of repurchase.
F-37
Table of Contents
Table of Contents
PART II
INFORMATION NOT REQUIRED IN PROSPECTUS
| ITEM 13. | OTHER EXPENSES OF ISSUANCE AND DISTRIBUTION. |
The expenses, other than underwriting commissions, expected to be incurred by us, or the Registrant, in connection with the issuance and distribution of the securities being registered under this Registration Statement are estimated to be as follows:
| SEC Registration Fee |
$ | 22,540 | ||
| Financial Industry Regulatory Authority, Inc. Filing Fee |
26,750 | |||
| NYSE or Nasdaq Listing Fee |
* | |||
| Printing and Engraving |
* | |||
| Legal Fees and Expenses |
* | |||
| Accounting Fees and Expenses |
* | |||
| Transfer Agent and Registrar Fees |
* | |||
| Miscellaneous |
* | |||
|
|
|
|||
| Total |
$ | * | ||
|
|
|
| * | To be completed by amendment. |
| ITEM 14. | INDEMNIFICATION OF DIRECTORS AND OFFICERS. |
The Registrant is governed by the Delaware General Corporation Law, or DGCL. Section 145 of the DGCL provides that a corporation may indemnify any person, including an officer or director, who was or is, or is threatened to be made, a party to any threatened, pending or completed legal action, suit or proceeding, whether civil, criminal, administrative or investigative (other than an action by or in the right of such corporation), by reason of the fact that such person was or is an officer, director, employee or agent of such corporation or is or was serving at the request of such corporation as a director, officer, employee or agent of another corporation or enterprise. The indemnity may include expenses (including attorneys’ fees), judgments, fines and amounts paid in settlement actually and reasonably incurred by such person in connection with such action, suit or proceeding, provided such officer, director, employee or agent acted in good faith and in a manner such person reasonably believed to be in, or not opposed to, the corporation’s best interest and, for criminal proceedings, had no reasonable cause to believe that such person’s conduct was unlawful. A Delaware corporation may indemnify any person, including an officer or director, who was or is, or is threatened to be made, a party to any threatened, pending or contemplated action or suit by or in the right of such corporation, under the same conditions, except that such indemnification is limited to expenses (including attorneys’ fees) actually and reasonably incurred by such person, and except that no indemnification is permitted without judicial approval if such person is adjudged to be liable to such corporation. Where an officer or director of a corporation is successful, on the merits or otherwise, in the defense of any action, suit or proceeding referred to above, or any claim, issue or matter therein, the corporation must indemnify that person against the expenses (including attorneys’ fees) which such officer or director actually and reasonably incurred in connection therewith.
The Registrant’s amended and restated bylaws will authorize the indemnification of its officers and directors, consistent with Section 145 of the Delaware General Corporation Law, as amended. The Registrant intends to enter into indemnification agreements with each of its directors and executive officers. These agreements, among other things, will require the Registrant to indemnify each director and executive officer to the fullest extent permitted by Delaware law, including indemnification of expenses such as attorneys’ fees, judgments, fines and settlement amounts incurred by the director or executive officer in any action or proceeding, including any action or proceeding by or in right of the Registrant, arising out of the person’s services as a director or executive officer.
II-1
Table of Contents
Reference is made to Section 102(b)(7) of the DGCL, which enables a corporation in its original certificate of incorporation or an amendment thereto to eliminate or limit the personal liability of a director for violations of the director’s fiduciary duty, except (i) for any breach of the director’s duty of loyalty to the corporation or its stockholders, (ii) for acts or omissions not in good faith or which involve intentional misconduct or a knowing violation of law, (iii) pursuant to Section 174 of the DGCL, which provides for liability of directors for unlawful payments of dividends of unlawful stock purchase or redemptions or (iv) for any transaction from which a director derived an improper personal benefit.
The Registrant expects to maintain standard policies of insurance that provide coverage (i) to its directors and officers against loss rising from claims made by reason of breach of duty or other wrongful act and (ii) to the Registrant with respect to indemnification payments that it may make to such directors and officers.
The proposed form of Underwriting Agreement to be filed as Exhibit 1.1 to this Registration Statement provides for indemnification to the Registrant’s directors and officers by the underwriters against certain liabilities.
| ITEM 15. | RECENT SALES OF UNREGISTERED SECURITIES. |
Preferred Stock Issuances
Since January 1, 2010, we have made the following sales of unregistered securities:
On March 17, 2011, pursuant to an exchange and purchase agreement we sold 169,538 shares of our Series A Preferred Stock to certain of our creditors in exchange for the cancellation of $169.5 million debt outstanding under our second lien term loan facility.
On June 21, 201,1 we sold 3,963 shares of our Series A Preferred Stock to certain of our creditors in exchange for the cancellation of $4.0 million debt outstanding under our second lien term loan facility.
On March 11, 2012, we issued 11,362 shares of our Series A Preferred Stock to certain of our creditors pursuant to their option to convert cash consideration previously received in exchange for the cancellation of debt into shares of our Series A preferred stock.
Plan-Related Common Stock Issuance
From January 1, 2010 to February 28, 2014, we granted to our directors, officers and employees options to purchase 26,294 shares of our common stock with per share exercise prices of $200 under our Stock Incentive Plan.
From January 1, 2010 to February 28, 2014, we granted to our officers and employees an aggregate of 20,480 shares of our common stock under our LTIP.
Other Common Stock Issuances
On April 26, 2013 and November 20, 2013, we granted an aggregate of 804 shares of our common stock to one of our former employees pursuant to a separation agreement.
The shares of common stock in all of the transactions listed above were issued in reliance on Section 4(2) of the Securities Act of 1933, as amended, as the sale of the security did not involve a public offering. Appropriate legends were affixed to the share certificate issued in each transaction.
II-2
Table of Contents
| ITEM 16. | EXHIBITS AND FINANCIAL STATEMENT SCHEDULES |
| (a) | Exhibits |
| Exhibit |
Description of Exhibits | |
| 1.1* | Form of Underwriting Agreement | |
| 3.1* | Form of Amended and Restated Certificate of Incorporation of SIRVA, Inc. | |
| 3.2* | Form of Amended and Restated Bylaws of SIRVA, Inc. | |
| 4.1 | Certificate of Designations, Preferences and Other Special Rights of Series A Preferred Stock of SIRVA, Inc. | |
| 4.2 | Certificate of Amendment of Certificate of Designations, Preferences and Other Special Rights of Series A Preferred Stock of SIRVA, Inc. | |
| 5.1* | Opinion of Weil, Gotshal & Manges LLP | |
| 10.1* | Credit Agreement, dated as of March 27, 2013, among SIRVA Worldwide, Inc., as borrower, SIRVA Inc., as holdings, the lenders from time to time party thereto and Goldman Sachs Bank USA, as administrative and collateral agent. | |
| 10.2* | First Amendment to Credit Agreement, dated as of March 12, 2014 among SIRVA Worldwide, Inc., as borrower, SIRVA, Inc., as holdings, Goldman Sachs Bank USA, as administrative agent and the guarantors listed thereto. | |
| 10.3* | Credit Agreement, dated as of March 27, 2013, by and among SIRVA, Inc., SIRVA Worldwide, Inc., North American Van Lines, Inc., Allied Van Lines, Inc. and SIRVA Relocation LLC, as borrowers, the lenders from time to time parties thereto and Goldman Sachs Bank USA, as agent, syndication agent and documentation agent. | |
| 10.4* | Guarantee and Collateral Agreement, dated as of March 27, 2013, made by SIRVA, Inc., SIRVA Worldwide, Inc. and certain of its subsidiaries in favor of Goldman Sachs Bank USA, as collateral agent. | |
| 10.5* | Guarantee and Collateral Agreement, dated as of March 27, 2013, made by SIRVA, Inc., SIRVA Worldwide, Inc. and certain of its subsidiaries in favor of Goldman Sachs Bank USA, as agent. | |
| 10.6* | Master Repurchase Agreement, dated as of March 24, 2010, among Citibank, N.A. as buyer and SIRVA Mortgage, Inc. as seller. | |
| 10.7* | Amendment Number One to the Master Purchase Agreement, dated July 30, 2010, between SIRVA Mortgage, Inc., as seller, and Citibank, N.A., as buyer. | |
| 10.8* | Amendment Number Two to the Master Purchase Agreement, dated August 13, 2010, between SIRVA Mortgage, Inc., as seller, and Citibank, N.A., as buyer. | |
| 10.9* | Amendment Number Three to the Master Purchase Agreement, dated September 15, 2010, between SIRVA Mortgage, Inc., as seller, and Citibank, N.A., as buyer. | |
| 10.10* | Amendment Number Four to the Master Purchase Agreement, dated March 23, 2011, between SIRVA Mortgage, Inc., as seller, and Citibank, N.A., as buyer. | |
| 10.11* | Amendment Number Five to the Master Purchase Agreement, dated May 13, 2011, between SIRVA Mortgage, Inc., as seller, and Citibank, N.A., as buyer. | |
| 10.12* | Amendment Number Six to the Master Purchase Agreement, dated June 15, 2011, between SIRVA Mortgage, Inc., as seller, and Citibank, N.A., as buyer. | |
II-3
Table of Contents
| Exhibit |
Description of Exhibits | |
| 10.13* | Amendment Number Seven to the Master Purchase Agreement, dated January 26, 2012, between SIRVA Mortgage, Inc., as seller, and Citibank, N.A., as buyer. | |
| 10.14* | Amendment Number Eight to the Master Purchase Agreement, dated June 14, 2012, between SIRVA Mortgage, Inc., as seller, and Citibank, N.A., as buyer. | |
| 10.15* | Amendment Number Nine to the Master Purchase Agreement, dated August 13, 2012, between SIRVA Mortgage, Inc., as seller, and Citibank, N.A., as buyer. | |
| 10.16* | Amendment Number Ten to the Master Purchase Agreement, dated November 9, 2012, between SIRVA Mortgage, Inc., as seller, and Citibank, N.A., as buyer. | |
| 10.17* | Amendment Number Eleven to the Master Purchase Agreement, December 14, 2012, between SIRVA Mortgage, Inc., as seller, and Citibank, N.A., as buyer. | |
| 10.18* | Amendment Number Twelve to the Master Purchase Agreement, dated June 14, 2013, between SIRVA Mortgage, Inc., as seller, and Citibank, N.A., as buyer. | |
| 10.19* | Amendment Number Thirteen to the Master Purchase Agreement, dated August 13, 2013, between SIRVA Mortgage, Inc., as seller, and Citibank, N.A., as buyer. | |
| 10.20* | Mortgage Loan Repurchase Agreement, dated as of July 11, 2011, among Associated Bank, N.A. as buyer and SIRVA Mortgage, Inc. as seller. | |
| 10.21* | First Amendment to Mortgage Loan Repurchase Agreement, dated July 10, 2012, among Associated Bank, N.A. as buyer and SIRVA Mortgage, Inc. as seller. | |
| 10.22* | Second Amendment to Mortgage Loan Repurchase Agreement, dated July 9, 2013, among Associated Bank, N.A. as buyer and SIRVA Mortgage, Inc. as seller. | |
| 10.23* | Master Repurchase Agreement, dated December 30, 2009, among U.S. Bank National Association as buyer and SIRVA Mortgage, Inc. as seller. | |
| 10.24* | First Amendment to Master Repurchase Agreement, dated July 16, 2010, among U.S. Bank National Association as buyer and SIRVA Mortgage, Inc. as seller. | |
| 10.25* | Second Amendment to Master Repurchase Agreement, dated September 2, 2010, among U.S. Bank National Association as buyer and SIRVA Mortgage, Inc. as seller. | |
| 10.26* | Third Amendment to Master Repurchase Agreement, dated March 23, 2011, among U.S. Bank National Association as buyer and SIRVA Mortgage, Inc. as seller. | |
| 10.27* | Fourth Amendment to Master Repurchase Agreement, dated May 31, 2011, among U.S. Bank National Association as buyer and SIRVA Mortgage, Inc. as seller. | |
| 10.28* | Fifth Amendment to Master Repurchase Agreement, dated May 31, 2012, among U.S. Bank National Association as buyer and SIRVA Mortgage, Inc. as seller. | |
| 10.29* | Sixth Amendment to Master Repurchase Agreement, dated May 30, 2013, among U.S. Bank National Association as buyer and SIRVA Mortgage, Inc. as seller. | |
| 10.30* | Receivables Sale Agreement, dated September 30, 2008, among SIRVA Relocation Credit, LLC as seller, SIRVA Relocation LLC as initial master servicer, Executive Relocation Corporation and SIRVA Global Relocation, Inc. as initial subservicers, Wells Fargo Bank, National Association as agent and syndication agent and the purchasers from time to time party thereto. | |
| 10.31* | Consent and Amendment to Receivables Sale Agreement, dated January 30, 2009, among SIRVA Relocation Credit, LLC as seller, SIRVA Relocation LLC, Executive Relocation Corporation and SIRVA Global Relocation, Inc. as servicers and originators, and Wells Fargo Bank, National Association as agent and sole purchaser. | |
II-4
Table of Contents
| Exhibit |
Description of Exhibits | |
| 10.32* | Amendment to Receivables Sale Agreement, dated May 31, 2009, among SIRVA Relocation Credit, LLC as seller, SIRVA Relocation LLC, Executive Relocation Corporation and SIRVA Global Relocation, Inc. as servicers and originators, and Wells Fargo Bank, National Association as agent and sole purchaser. | |
| 10.33* | Consent and Amendment to Receivables Sale Agreement, dated December 23, 2009, among SIRVA Relocation Credit, LLC as seller, SIRVA Relocation LLC, Executive Relocation Corporation and SIRVA Global Relocation, Inc. as servicers and originators, and Wells Fargo Bank, National Association as agent and sole purchaser. | |
| 10.34* | Consent and Amendment to Receivables Sale Agreement, dated March 17, 2011, among SIRVA Relocation Credit, LLC as seller, SIRVA Relocation LLC and SIRVA Global Relocation, Inc. as servicers and originators, and Wells Fargo Bank, National Association as agent and sole purchaser. | |
| 10.35* | Amendment to Receivables Sale Agreement, dated September 28, 2012, among SIRVA Relocation Credit, LLC as seller, SIRVA Relocation LLC and SIRVA Global Relocation, Inc. as servicers and originators, and Wells Fargo Bank, National Association as agent and sole purchaser. | |
| 10.36* | Amendment to Receivables Sale Agreement, dated December 31, 2012, among SIRVA Relocation Credit, LLC as seller, SIRVA Relocation LLC and SIRVA Global Relocation, Inc. as servicers and originators, and Wells Fargo Bank, National Association as agent and sole purchaser. | |
| 10.37* | Third Amended and Restated Purchase and Sale Agreement, dated September 30, 2008, between SIRVA Relocation LLC and SIRVA Global Relocation, Inc. as originators and SIRVA Relocation Credit, LLC as buyer. | |
| 10.38 | Employment Agreement, dated as of July 17, 2008, between SIRVA, Inc. and Wes W. Lucas. | |
| 10.39 | Employment Agreement, dated as of August 2, 2011, between SIRVA, Inc. and Thomas Oberdorf. | |
| 10.40 | Employment Agreement, dated as of April 2, 2012, between SIRVA, Inc. and Linda Smith. | |
| 10.41 | Employment Agreement, dated as of December 18, 2008, between SIRVA, Inc. and Deborah Balli. | |
| 10.42 | Employment Agreement, dated as of December 1, 2010, between SIRVA, Inc. and Jacob George. | |
| 10.43 | Investor Rights Agreement dated as of March 17, 2011, by and among SIRVA, Inc. and the holders of SIRVA, Inc.’s Series A Preferred Stock party thereto. | |
| 10.44 | Amendment No. 1 to the Investor Rights Agreement, dated as of February 12, 2013, by and among SIRVA, Inc. and the holders of SIRVA, Inc.’s Series A Preferred Stock party thereto. | |
| 10.45 | Registration Rights Agreement, dated as of May 12, 2008, by and among SIRVA, Inc. and the holders of common stock named therein. | |
| 10.46 | Amended and Restated Stockholders’ Agreement, dated as of February 12, 2013, among SIRVA Inc. and the stockholders named therein or bound thereby. | |
| 21.1 | Subsidiaries of the Registrant | |
| 23.1 | Consent of Ernst & Young LLP | |
| 24.1 | Power or Attorney (included on signature page to this Registration Statement) | |
| * | To be filed by amendment. |
II-5
Table of Contents
| ITEM 17. | UNDERTAKINGS. |
The undersigned registrant hereby undertakes to provide to the underwriter at the closing specified in the underwriting agreements, certificates in such denominations and registered in such names as required by the underwriters to permit prompt delivery to each purchaser.
Insofar as indemnification for liabilities arising under the Securities Act of 1933 may be permitted to directors, officers and controlling persons of the registrant pursuant to the foregoing provisions, or otherwise, the registrant has been advised that in the opinion of the Securities and Exchange Commission such indemnification is against public policy as expressed in the Act and is, therefore, unenforceable. In the event that a claim for indemnification against such liabilities (other than the payment by the registrant of expenses incurred or paid by a director, officer or controlling person of the registrant in the successful defense of any action, suit or proceeding) is asserted by such director, officer or controlling person in connection with the securities being registered, the registrant will, unless in the opinion of its counsel the matter has been settled by controlling precedent, submit to a court of appropriate jurisdiction the question whether such indemnification by it is against public policy as expressed in the Act and will be governed by the final adjudication of such issue.
The undersigned registrant hereby undertakes that:
| (1) | For purposes of determining any liability under the Securities Act of 1933, the information omitted from the form of prospectus filed as part of this registration statement in reliance upon Rule 430A and contained in a form of prospectus filed by the registrant pursuant to Rule 424(b)(1) or (4) or 497(h) under the Securities Act shall be deemed to be part of this registration statement as of the time it was declared effective. |
| (2) | For the purpose of determining any liability under the Securities Act of 1933, each post-effective amendment that contains a form of prospectus shall be deemed to be a new registration statement relating to the securities offered therein, and the offering of such securities at that time shall be deemed to be the initial bona fide offering thereof. |
II-6
Table of Contents
SIGNATURES
Pursuant to the requirements of the Securities Act of 1933, the registrant has duly caused this registration statement to be signed on its behalf by the undersigned, thereunto duly authorized, in the City of Oakbrook Terrace, State of Illinois, on March 28, 2014.
| SIRVA, Inc. | ||
| By: |
/s/ Wes Lucas | |
| Name: |
Wes Lucas | |
| Title: |
Chief Executive Officer | |
POWER OF ATTORNEY
KNOW ALL MEN BY THESE PRESENTS, that each of the undersigned constitutes and appoints each of Wes Lucas or Tom Oberdorf, or any of them, each acting alone, his true and lawful attorney-in-fact and agent, with full power of substitution and resubstitution, for such person and in his name, place and stead, in any and all capacities, to sign this Registration Statement on Form S-1 (including all pre-effective and post-effective amendments and registration statements filed pursuant to Rule 462(b) under the Securities Act of 1933), and to file the same, with all exhibits thereto, and other documents in connection therewith, with the SEC, granting unto said attorneys-in-fact and agents, each acting alone, full power and authority to do and perform each and every act and thing requisite and necessary to be done in and about the premises, as fully to all intents and purposes as he might or could do in person, hereby ratifying and confirming that any such attorney-in-fact and agent, or his substitute or substitutes, may lawfully do or cause to be done by virtue hereof.
Pursuant to the requirements of the Securities Act of 1933, this registration statement has been signed by the following persons in the capacities indicated on March 28, 2014.
| Signature |
Title | |
| /s/ Wes Lucas Wes Lucas |
Chief Executive Officer (Principal Executive Officer) | |
| /s/ Tom Oberdorf Tom Oberdorf |
Chief Financial Officer (Principal Financial Officer) | |
| /s/ Denny Thompson Denny Thompson |
Chief Accounting Officer | |
| /s/ Lawrence Bossidy Lawrence Bossidy |
Director | |
| /s/ Ellen Havdala Ellen Havdala |
Director | |
| /s/ Douglas C. Laux Douglas C. Laux |
Director | |
| /s/ Mats Lindstrand Mats Lindstrand |
Director | |
II-7
Table of Contents
| Signature |
Title | |
| /s/ Ryan McCarthy Ryan McCarthy |
Director | |
| /s/ Gerald Parsky Gerald Parsky |
Director | |
| /s/ Mark Sotir Mark Sotir |
Director | |
| /s/ John D. Watkins, Jr. John D. Watkins, Jr. |
Director | |
II-8
Table of Contents
EXHIBIT INDEX
| Exhibit |
Description of Exhibits | |
| 1.1* | Form of Underwriting Agreement | |
| 3.1* | Form of Amended and Restated Certificate of Incorporation of SIRVA, Inc. | |
| 3.2* | Form of Amended and Restated Bylaws of SIRVA, Inc. | |
| 4.1 | Certificate of Designations, Preferences and Other Special Rights of Series A Preferred Stock of SIRVA, Inc. | |
| 4.2 | Certificate of Amendment of Certificate of Designations, Preferences and Other Special Rights of Series A Preferred Stock of SIRVA, Inc. | |
| 5.1* | Opinion of Weil, Gotshal & Manges LLP | |
| 10.1* | Credit Agreement, dated as of March 27, 2013, among SIRVA Worldwide, Inc., as borrower, SIRVA Inc., as holdings, the lenders from time to time party thereto and Goldman Sachs Bank USA, as administrative and collateral agent. | |
| 10.2* | First Amendment to Credit Agreement, dated as of March 12, 2014 among SIRVA Worldwide, Inc., as borrower, SIRVA, Inc., as holdings, Goldman Sachs Bank USA, as administrative agent and the guarantors listed thereto. | |
| 10.3* | Credit Agreement, dated as of March 27, 2013, by and among SIRVA, Inc., SIRVA Worldwide, Inc., North American Van Lines, Inc., Allied Van Lines, Inc. and SIRVA Relocation LLC, as borrowers, the lenders from time to time parties thereto and Goldman Sachs Bank USA, as agent, syndication agent and documentation agent. | |
| 10.4* | Guarantee and Collateral Agreement, dated as of March 27, 2013, made by SIRVA, Inc., SIRVA Worldwide, Inc. and certain of its subsidiaries in favor of Goldman Sachs Bank USA, as collateral agent. | |
| 10.5* | Guarantee and Collateral Agreement, dated as of March 27, 2013, made by SIRVA, Inc., SIRVA Worldwide, Inc. and certain of its subsidiaries in favor of Goldman Sachs Bank USA, as agent. | |
| 10.6* | Master Repurchase Agreement, dated as of March 24, 2010, among Citibank, N.A. as buyer and SIRVA Mortgage, Inc. as seller. | |
| 10.7* | Amendment Number One to the Master Purchase Agreement, dated July 30, 2010, between SIRVA Mortgage, Inc., as seller, and Citibank, N.A., as buyer. | |
| 10.8* | Amendment Number Two to the Master Purchase Agreement, dated August 13, 2010, between SIRVA Mortgage, Inc., as seller, and Citibank, N.A., as buyer. | |
| 10.9* | Amendment Number Three to the Master Purchase Agreement, dated September 15, 2010, between SIRVA Mortgage, Inc., as seller, and Citibank, N.A., as buyer. | |
| 10.10* | Amendment Number Four to the Master Purchase Agreement, dated March 23, 2011, between SIRVA Mortgage, Inc., as seller, and Citibank, N.A., as buyer. | |
| 10.11* | Amendment Number Five to the Master Purchase Agreement, dated May 13, 2011, between SIRVA Mortgage, Inc., as seller, and Citibank, N.A., as buyer. | |
| 10.12* | Amendment Number Six to the Master Purchase Agreement, dated June 15, 2011, between SIRVA Mortgage, Inc., as seller, and Citibank, N.A., as buyer. | |
| 10.13* | Amendment Number Seven to the Master Purchase Agreement, dated January 26, 2012, between SIRVA Mortgage, Inc., as seller, and Citibank, N.A., as buyer. | |
| 10.14* | Amendment Number Eight to the Master Purchase Agreement, dated June 14, 2012, between SIRVA Mortgage, Inc., as seller, and Citibank, N.A., as buyer. | |
II-9
Table of Contents
| Exhibit |
Description of Exhibits | |
| 10.15* | Amendment Number Nine to the Master Purchase Agreement, dated August 13, 2012, between SIRVA Mortgage, Inc., as seller, and Citibank, N.A., as buyer. | |
| 10.16* | Amendment Number Ten to the Master Purchase Agreement, dated November 9, 2012, between SIRVA Mortgage, Inc., as seller, and Citibank, N.A., as buyer. | |
| 10.17* | Amendment Number Eleven to the Master Purchase Agreement, December 14, 2012, between SIRVA Mortgage, Inc., as seller, and Citibank, N.A., as buyer. | |
| 10.18* | Amendment Number Twelve to the Master Purchase Agreement, dated June 14, 2013, between SIRVA Mortgage, Inc., as seller, and Citibank, N.A., as buyer. | |
| 10.19* | Amendment Number Thirteen to the Master Purchase Agreement, dated August 13, 2013, between SIRVA Mortgage, Inc., as seller, and Citibank, N.A., as buyer. | |
| 10.20* | Mortgage Loan Repurchase Agreement, dated as of July 11, 2011, among Associated Bank, N.A. as buyer and SIRVA Mortgage, Inc. as seller. | |
| 10.21* | First Amendment to Mortgage Loan Repurchase Agreement, dated July 10, 2012, among Associated Bank, N.A. as buyer and SIRVA Mortgage, Inc. as seller. | |
| 10.22* | Second Amendment to Mortgage Loan Repurchase Agreement, dated July 9, 2013, among Associated Bank, N.A. as buyer and SIRVA Mortgage, Inc. as seller. | |
| 10.23* | Master Repurchase Agreement, dated December 30, 2009, among U.S. Bank National Association as buyer and SIRVA Mortgage, Inc. as seller. | |
| 10.24* | First Amendment to Master Repurchase Agreement, dated July 16, 2010, among U.S. Bank National Association as buyer and SIRVA Mortgage, Inc. as seller. | |
| 10.25* | Second Amendment to Master Repurchase Agreement, dated September 2, 2010, among U.S. Bank National Association as buyer and SIRVA Mortgage, Inc. as seller. | |
| 10.26* | Third Amendment to Master Repurchase Agreement, dated March 23, 2011, among U.S. Bank National Association as buyer and SIRVA Mortgage, Inc. as seller. | |
| 10.27* | Fourth Amendment to Master Repurchase Agreement, dated May 31, 2011, among U.S. Bank National Association as buyer and SIRVA Mortgage, Inc. as seller. | |
| 10.28* | Fifth Amendment to Master Repurchase Agreement, dated May 31, 2012, among U.S. Bank National Association as buyer and SIRVA Mortgage, Inc. as seller. | |
| 10.29* | Sixth Amendment to Master Repurchase Agreement, dated May 30, 2013, among U.S. Bank National Association as buyer and SIRVA Mortgage, Inc. as seller. | |
| 10.30* | Receivables Sale Agreement, dated September 30, 2008, among SIRVA Relocation Credit, LLC as seller, SIRVA Relocation LLC as initial master servicer, Executive Relocation Corporation and SIRVA Global Relocation, Inc. as initial subservicers, Wells Fargo Bank, National Association as agent and syndication agent and the purchasers from time to time party thereto. | |
| 10.31* | Consent and Amendment to Receivables Sale Agreement, dated January 30, 2009, among SIRVA Relocation Credit, LLC as seller, SIRVA Relocation LLC, Executive Relocation Corporation and SIRVA Global Relocation, Inc. as servicers and originators, and Wells Fargo Bank, National Association as agent and sole purchaser. | |
| 10.32* | Amendment to Receivables Sale Agreement, dated May 31, 2009, among SIRVA Relocation Credit, LLC as seller, SIRVA Relocation LLC, Executive Relocation Corporation and SIRVA Global Relocation, Inc. as servicers and originators, and Wells Fargo Bank, National Association as agent and sole purchaser. | |
II-10
Table of Contents
| Exhibit |
Description of Exhibits | |
| 10.33* | Consent and Amendment to Receivables Sale Agreement, dated December 23, 2009, among SIRVA Relocation Credit, LLC as seller, SIRVA Relocation LLC, Executive Relocation Corporation and SIRVA Global Relocation, Inc. as servicers and originators, and Wells Fargo Bank, National Association as agent and sole purchaser. | |
| 10.34* | Consent and Amendment to Receivables Sale Agreement, dated March 17, 2011, among SIRVA Relocation Credit, LLC as seller, SIRVA Relocation LLC and SIRVA Global Relocation, Inc. as servicers and originators, and Wells Fargo Bank, National Association as agent and sole purchaser. | |
| 10.35* | Amendment to Receivables Sale Agreement, dated September 28, 2012, among SIRVA Relocation Credit, LLC as seller, SIRVA Relocation LLC and SIRVA Global Relocation, Inc. as servicers and originators, and Wells Fargo Bank, National Association as agent and sole purchaser. | |
| 10.36* | Amendment to Receivables Sale Agreement, dated December 31, 2012, among SIRVA Relocation Credit, LLC as seller, SIRVA Relocation LLC and SIRVA Global Relocation, Inc. as servicers and originators, and Wells Fargo Bank, National Association as agent and sole purchaser. | |
| 10.37* | Third Amended and Restated Purchase and Sale Agreement, dated September 30, 2008, between SIRVA Relocation LLC and SIRVA Global Relocation, Inc. as originators and SIRVA Relocation Credit, LLC as buyer. | |
| 10.38 | Employment Agreement, dated as of July 17, 2008, between SIRVA, Inc. and Wes W. Lucas. | |
| 10.39 | Employment Agreement, dated as of August 2, 2011, between SIRVA, Inc. and Thomas Oberdorf. | |
| 10.40 | Employment Agreement, dated as of April 2, 2012, between SIRVA, Inc. and Linda Smith. | |
| 10.41 | Employment Agreement, dated as of December 18, 2008, between SIRVA, Inc. and Deborah Balli. | |
| 10.42 | Employment Agreement, dated as of December 1, 2010, between SIRVA, Inc. and Jacob George. | |
| 10.43 | Investor Rights Agreement dated as of March 17, 2011, by and among SIRVA, Inc. and the holders of SIRVA, Inc.’s Series A Preferred Stock party thereto. | |
| 10.44 | Amendment No. 1 to the Investor Rights Agreement, dated as of February 12, 2013, by and among SIRVA, Inc. and the holders of SIRVA, Inc.’s Series A Preferred Stock party thereto. | |
| 10.45 | Registration Rights Agreement, dated as of May 12, 2008, by and among SIRVA, Inc. and the holders of common stock named therein. | |
| 10.46 | Amended and Restated Stockholders’ Agreement, dated as of February 12, 2013, among SIRVA Inc. and the stockholders named therein or bound thereby. | |
| 21.1 | Subsidiaries of the Registrant | |
| 23.1 | Consent of Ernst & Young LLP | |
| 24.1 | Power or Attorney (included on signature page to this Registration Statement) | |
| * | To be filed by amendment. |
II-11