Attached files
UNITED STATES
SECURITIES AND EXCHANGE COMMISSION
WASHINGTON, D.C. 20549
FORM 10-K
|
(Mark One) |
|
|
|
☒ |
|
ANNUAL REPORT PURSUANT TO SECTION 13 OR 15(d) |
For the fiscal year ended December 31, 2013
OR
|
|
||
|
☐ |
|
TRANSITION REPORT PURSUANT TO SECTION 13 OR 15(d) OF THE SECURITIES EXCHANGE ACT OF 1934 |
For the transition period from to
Commission File Number 001-36200
OXFORD IMMUNOTEC GLOBAL PLC
(Exact name of registrant as specified in its charter)
|
England and Wales |
|
Not Applicable |
|
(State or Other Jurisdiction of |
|
(I.R.S. Employer |
| Incorporation or Organization) | Identification No.) |
|
|
||
|
94C Innovation Drive, Milton Park, Abingdon OX14 4RZ, United Kingdom |
|
Not Applicable |
|
(Address of Principal Executive Offices) |
|
(Zip Code) |
+44 (0)1235 442780
(Registrant’s Telephone Number, Including Area Code)
Securities registered pursuant to Section 12(b) of the Act:
|
|
||
|
Title of each class |
|
Name of exchange on which registered |
|
Ordinary Shares, £0.006705 nominal value per share |
|
The NASDAQ Global Market |
Securities registered pursuant to Section 12(g) of the Act
None
Indicate by check mark if the registrant is a well-known seasoned issuer, as defined in Rule 405 of the Securities Act. Yes ☐ No ☒
Indicate by check mark if the registrant is not required to file reports pursuant to Section 13 or 15(d) of the Act. Yes ☐ No ☒
Indicate by check mark whether the registrant: (1) has filed all reports required to be filed by Section 13 or 15(d) of the Securities Exchange Act of 1934 during the preceding 12 months (or for such shorter period that the registrant was required to file such reports); and (2) has been subject to such filing requirements for the past 90 days. Yes ☒ No ☐
Indicate by check mark whether the registrant has submitted electronically and posted on its corporate Web site, if any, every Interactive Data File required to be submitted and posted pursuant to Rule 405 of Regulation S-T during the preceding 12 months (or for such shorter period that the registrant was required to submit and post such files). Yes ☒ No ☐
Indicate by check mark if disclosure of delinquent filers pursuant to Item 405 of Regulation S-K is not contained herein, and will not be contained, to the best of registrant’s knowledge, in definitive proxy or information statements incorporated by reference in Part III of this Form 10-K or any amendment to this Form 10-K. ☐
Indicate by check mark whether the registrant is a large accelerated filer, an accelerated filer, a non-accelerated filer or a smaller reporting company. See the definitions of “large accelerated filer,” “accelerated filer” and “smaller reporting company” in Rule 12b-2 of the Exchange Act (check one):
|
|
|
|
||||
|
Large accelerated filer ☐ |
|
Accelerated filer ☐ |
|
Non-accelerated filer ☒ |
|
Smaller reporting company ☐ |
|
|
|
|
|
(Do not check if a smaller reporting company) |
|
|
Indicate by check mark whether the registrant is a shell company (as defined in Rule 12b-2 of the Exchange Act). Yes ☐ No ☒
As of March 21, 2014, there were 17,266,300 Ordinary Shares, nominal value £0.006705, of Oxford Immunotec Global PLC outstanding.
As of the second quarter of 2013, the aggregate market value of the registant’s Ordinary Shares held by non-affiliates was approximately: N/A.
DOCUMENTS INCORPORATED BY REFERENCE
The following documents (or parts thereof) are incorporated by reference into the following parts of this Form 10-K: Certain information required by Part III of this Annual Report on Form 10-K is incorporated from our definitive proxy statement pursuant to Regulation 14A, to be filed with the Commission not later than 120 days after the close of our fiscal year ended December 31, 2013.
Special Note Regarding Forward-Looking Statements
This Annual Report on Form 10-K, and exhibits thereto, contains estimates, predictions, opinions, projections and other statements that may be interpreted as “forward-looking statements” within the meaning of Section 21E of the Securities Exchange Act of 1934, as amended, or the Exchange Act that involve substantial risks and uncertainties. The forward-looking statements are contained principally in Part 1, Item 1: “Business,” Part I, Item 1A: “Risk Factors,” and Part II, Item 7: “Management’s Discussion and Analysis of Final Condition and Results of Operations,” but are also contained elsewhere in this Annual Report. In some cases, you can identify forward-looking statements by the words “may,” “might,” “will,” “would,” “could,” “should,” “intend,” “plan,” “contemplate,” “expect,” “anticipate,” “believe,” “estimate,” “predict,” “project,” “target,” “potential,” “continue,” and “ongoing” and other comparable expressions intended to identify statements about the future, although not all forward-looking statements contain these identifying words. These statements involve known and unknown risks, uncertainties and other factors that may cause our actual results, level of activity, performance or achievements to differ materially from those currently anticipated. Forward-looking statements are neither historical facts nor assurances of future performance. Although we believe that we have a reasonable basis for each forward-looking statement contained in this Annual Report, we caution you that these statements are based on a combination of facts and factors currently known by us and our expectations of the future, about which we cannot be certain and that involve substantial risks and uncertainties. Such risks and uncertainties include, but are not limited to:
|
● |
our history of losses, our ability to achieve or sustain profitability and our ability to manage our growth; |
|
● |
our ability to further develop, commercialize and achieve market acceptance of our current and future products; |
|
● |
continued demand for diagnostic products for tuberculosis and the development of new market opportunities; |
|
● |
our ability to compete successfully and to maintain and expand our sales network; |
|
● |
decisions by insurers and other third party payors with respect to coverage and reimbursements; |
|
● |
our dependence on certain of our customers, suppliers and service providers; |
|
● |
disruptions to our business, including disruptions at our laboratories and manufacturing facilities; |
|
● |
our ability to effectively use our current financial resources and our ability to obtain additional capital resources; |
|
● |
the integrity and uninterrupted operation of our information technology and storage systems; |
|
● |
the impact of currency fluctuations on our business; |
|
● |
our ability to make successful acquisitions or investments and to manage the integration of such acquisitions or investments; |
|
● |
our ability to retain key members of our management; |
|
● |
the impact of taxes on our business, including our ability to use net operating losses; |
|
● |
the impact of legislative and regulatory developments, including healthcare reform, on our business; |
|
● |
the impact of product liability, intellectual property and commercial litigation on our business; |
|
● |
our ability to comply with SEC reporting, antifraud, anti-corruption, environmental, health and safety laws and regulations; |
|
● |
our ability to protect and enforce our intellectual property rights; |
|
● |
our status as an emerging growth company and as an English company listing ordinary shares in the United States; |
|
● |
the volatility of the price of our share price, substantial future sales of our shares and the fact that we do not pay dividends; and |
|
● |
the impact of anti-takeover provisions under U.K. law and our articles of association. |
You should refer to “Item 1A, Risk Factors” in this Annual Report for a discussion of other important factors that may cause our actual results to differ materially from those expressed or implied by our forward-looking statements. As a result of these factors, we cannot assure you that the forward-looking statements in this Annual Report will prove to be accurate. Further, if our forward-looking statements prove to be inaccurate, the inaccuracy may be material. In light of the significant uncertainties in these forward-looking statements, you should not regard these statements as a representation or warranty by us that we will achieve our objectives and plans in any specified time frame, or at all. The forward-looking statements in this Annual Report represent our views only as of the date of this Annual Report. Subsequent events and developments may cause our views to change. While we may elect to update these forward-looking statements at some point in the future, we undertake no obligation to publicly update any forward-looking statements, except as required by law. You should, therefore, not rely on these forward-looking statements as representing our views as of any date subsequent to the date of this Annual Report.
Table of Contents
|
Page | ||
|
|
||
|
PART I |
||
|
Item 1. |
Business |
1 |
|
Item 1A. |
Risk Factors |
22 |
|
Item 1B. |
Unresolved Staff Comments |
40 |
|
Item 2. |
Properties |
40 |
|
Item 3. |
Legal Proceedings |
40 |
|
Item 4. |
Mine Safety Disclosures |
40 |
|
PART II |
||
|
Item 5. |
Market for Registrants Common Equity, Related Stockholder Matters and Issuer Purchases of Equity Securities |
41 |
|
Item 6. |
Selected Consolidated Financial Data |
44 |
|
Item 7. |
Management’s Discussion and Analysis of Financial Condition and Results of Operations |
47 |
|
Item 7A. |
Quantitative and Qualitative Disclosures About Market Risk |
59 |
|
Item 8. |
Financial Statements and Supplementary Data |
60 |
|
Item 9. |
Changes in and Disagreements with Accountants on Accounting and Financial Disclosure |
61 |
|
Item 9A. |
Controls and Procedures |
61 |
|
Item 9B. |
Other Information |
61 |
|
PART III |
||
|
Item 10. |
Directors, Executive Officers and Corporate Governance |
62 |
|
Item 11. |
Executive Compensation |
62 |
|
Item 12. |
Security Ownership of Certain Beneficial Owners and Management and Related Stockholder Matters |
62 |
|
Item 13. |
Certain Relationships and Related Transactions, and Director Independence |
62 |
|
Item 14. |
Principal Accounting Fees and Services |
62 |
|
PART IV |
||
|
Item 15. |
Exhibits, Financial Statement Schedules |
63 |
|
Signatures |
68 | |
Part I
Item 1. Business
Overview
We are a global, commercial-stage diagnostics company committed to improving patient care by providing advanced, innovative tests in the field of immunology. Our proprietary T-SPOT®1 technology platform allows us to measure the responses of specific immune cells, known as T cells, to inform the diagnosis, prognosis and monitoring of patients with immunologically controlled diseases. T cells are a central component of the human body’s immune system, and are implicated in the control and progression of many medical conditions, including certain types of infectious diseases, cancers and autoimmune diseases.
The initial product we have developed using our T-SPOT technology platform is our T-SPOT.TB test, which is used to test for latent Tuberculosis (TB) infection, or LTBI. Our T-SPOT.TB test has been approved for sale in over 50 countries, including the United States, where we have received pre-market approval, or PMA, from the FDA, in Europe, where we have obtained a CE mark, as well as in Japan and China. Our T-SPOT.TB test has been included in clinical guidelines for TB screening in 17 countries, including the United States, several European countries and Japan. In addition, we have established reimbursement for our test in the United States, as well as a Current Procedural Terminology, or CPT2, code that is used only for our test. We believe that many payors rely upon CPT codes to determine the amount they pay providers. Outside the United States, we have established reimbursement in several countries where reimbursement applies, including Japan, Switzerland and Germany. Our customers benefit from the existence of reimbursement mechanisms as it provides more certainty of the amount they will be paid for performing our test.
Tuberculosis remains a significant global public health problem. According to the WHO, approximately two billion people globally have LTBI, and on average each carries a 10% lifetime risk of progressing to active TB disease. In 2012, approximately 8.6 million people contracted active TB disease, of which approximately 1.3 million people died.
A central component of TB control strategies worldwide, particularly in developed markets, is to screen large numbers of people in high-risk groups for LTBI. These screening programs seek to identify infected people so that treatment can be administered to prevent these individuals from subsequently progressing to active TB disease and infecting others. According to the World Health Organization, or WHO, at least 50 million such screening tests are performed worldwide each year. The vast majority of these tests are performed using the 100-year-old tuberculin skin test, or TST, which our T-SPOT.TB test is designed to replace.
Our penetration of this global LTBI testing market is in its early stages. We estimate that approximately 90% of testing is still performed with the TST, giving us a significant opportunity for long-term growth through displacement of the TST. We offer our T-SPOT.TB test in two formats to accommodate customer preference and maximize sales. Our in vitro diagnostic kit format, which is available globally, allows customers to perform the test in their own institutions. In our service format, which we offer in the United States and the United Kingdom, we perform our T-SPOT.TB test on samples sent by customers to our laboratory facilities. In our experience, once a customer begins using our T-SPOT.TB test instead of the TST, the customer rarely goes back to using the TST. This purchasing pattern allows us to continually leverage our sales force to generate new business, rather than to maintain existing customers.
We believe the annual global market opportunity for our T-SPOT.TB test is well in excess of $1 billion, assuming we can largely displace the TST in the developed world.
We are a global business with 157 employees, including sales and marketing teams, on three continents, and laboratories in the United States and the United Kingdom. In 2013, we sold to customers in 49 countries and derived 55% of our revenue from outside the United States for the year ended December 31, 2013. Our current customer base is comprised of over 1,000 active customers, consisting of hospitals, public health departments, commercial testing laboratories, importers and distributors.
TB overview
Tuberculosis is a common and, if not properly treated, potentially lethal infectious disease caused by a bacterium called Mycobacterium tuberculosis. When an individual with active TB disease of the respiratory tract coughs, sneezes, yells or spits, respiratory fluid droplets that contain M. tuberculosis are expelled into the air and can infect others. TB typically infects the lungs, but the lymph nodes, kidneys, brain and bones may also be infected. Within two to ten weeks of the original infection, a specific T cell immune response usually develops. This immune response prevents further multiplication and spread of the TB bacteria. Individuals who have a successful T cell immune response will still have live bacteria in their body and are considered to have LTBI. Those with LTBI are asymptomatic and are not infectious; however, each person with LTBI has on average a 10% chance of progressing to active TB disease over his or her lifetime.
TB is considered to have progressed to active TB disease when the body is unable to effectively control the replication of the TB bacteria and their growth causes damage to the body. This risk of progression to active TB disease is significantly elevated among individuals with weakened immune systems, such as smokers, those with HIV or diabetes or those on drugs that suppress the immune system (e.g., those taking biologic therapies for autoimmune disease or those undergoing immune-suppression post-transplantation). When a person develops active TB disease, the symptoms, including coughing, chest pains, weakness, weight loss, fever and night sweats, may be mild for many months. This can lead to delays in seeking care, which can result in transmission of the bacteria to others. As the disease progresses, the person may develop symptoms that can become increasingly worse. Without proper treatment, up to two thirds of people with active TB disease will die.
1 “T-SPOT®,” “T-Cell Xtend®,” “Oxford Diagnostic Laboratories®,” “ODL®,” the Oxford Immunotec logo, our laboratory logo and other marks are our trademarks. Solely for convenience, trademarks and trade names referred to in this Annual Report on Form 10-K, including logos, artwork and other visual displays, may appear without the ® or ™ symbols, but such references are not intended to indicate in any way that we will not assert, to the fullest extent under applicable law, our rights to these trademarks and trade names.
2 CPT is a registered trademark of the American Medical Association.
According to the WHO, approximately one-third of the world’s population, over two billion people, is infected with M. tuberculosis. This represents an enormous population of infected persons at risk of progressing to active TB disease. Despite the availability of an effective treatment, TB is one of the leading causes of infectious disease death worldwide. In 2012, the WHO estimated that approximately 8.6 million people contracted active TB disease, of which approximately 1.3 million people died. TB is a leading killer of people living with HIV, causing one quarter of all deaths in that population. Although TB rates are declining slowly across the world, even in the developed world current screening and management tools have failed to eliminate the disease. For example, in the United States an estimated 11 million people have LTBI, which acts as a constant source of new infections. In addition, new cases of TB commonly arise from immigration and from travel to and from countries with higher incidence of TB.
There are three broad strategies to control TB: vaccination, finding and treating active TB disease, and finding and treating LTBI to prevent the development of new cases.
|
• |
Vaccination. The traditional means of seeking to protect individuals who may be exposed to infectious diseases is vaccination. The only vaccine available for TB is the Bacille Calmette-Guerin, or BCG, vaccine, which was first used in the 1920s. The vaccine is widely used around the world outside the United States; however, BCG’s efficacy is highly variable and it does not provide adequate protection against TB disease in adults. Therefore, the vaccine alone is insufficient to control TB. |
|
• |
Finding and treating active TB disease. Although TB is typically a curable disease when treated with the standard multi-month regimen of potent antibiotics, diagnosing active TB can be problematic. For instance, TB symptoms are often non-specific and/or confused with other diseases, causing delays in seeking and receiving appropriate medical diagnosis. In addition, traditional diagnostic tests for active TB disease are imperfect. Delays in diagnosis result in increased morbidity and mortality and worsen the spread of TB infection, as people with active TB disease can infect as many as 10 to 15 people per year. The emergence of drug resistant TB strains is a growing problem, as they make treatment with standard anti-TB drugs more difficult and in some instances, where resistance is present to all front-line drugs, the mortality rate exceeds 50%. |
|
• |
Finding and treating LTBI. The identification of individuals with LTBI by screening high-risk groups is an essential component of TB control in developed markets. In the United States, for example, screening high-risk groups has been an important practice for more than four decades. In the United States and other countries with a low incidence of TB, most new, active TB disease cases have occurred among persons who were once infected, contained the initial infection, and then later progressed from LTBI to active TB disease. The identification and treatment of individuals with LTBI prevents any further risk of these individuals progressing to active TB disease and prevents the further spread of TB. |
The United States has one of the most comprehensive LTBI screening programs in the world. Several high-risk groups have been identified by the U.S. Centers for Disease Control and Prevention, or the CDC, for screening and subsequent treatment of LTBI, including:
|
• |
healthcare workers; |
|
• |
those with immunosuppressive conditions, such as diabetes and certain carcinomas, persons receiving organ transplants and persons receiving immunosuppressive agents; |
|
• |
those with HIV and those working at HIV clinics; |
|
• |
refugees and immigrants from countries with high incidence of TB; |
|
• |
close contacts of active TB cases; |
|
• |
prisoners and jail detainees, as well as staff employed in prisons and jails; |
|
• |
intravenous drug users and staff employed at substance abuse centers; |
|
• |
homeless persons and staff employed at homeless facilities; and |
|
• |
those living in congregate living facilities, such as nursing homes or assisted living facilities. |
In addition to the screening of high-risk groups recommended by the CDC, TB screening is also mandated by many states to include additional populations, such as day care staff, school teachers and pupils, and police officer candidates. Additionally, the screening of healthcare workers is recommended as part of the accreditation standards for U.S. hospitals and screening of certain U.S. military personnel for LTBI is included in military guidelines.
Generally, other developed markets have similar practices to screen high-risk groups for LTBI, although the populations screened may differ from those in the United States.
In total, we estimate that there are 22 million LTBI tests performed each year in the United States, the majority of which are performed within the healthcare system in a variety of settings, including hospitals, public health offices, physicians’ offices and clinics. Outside the United States, we estimate the total number of tests to be 28 million each year, for a combined market size of 50 million LTBI tests annually.
Current TB skin test and its limitations
The primary test currently used for TB screening is the 100-year-old TST. The TST is administered by injecting an extract from cultured M. tuberculosis, called Tuberculin or PPD, into the skin of a subject’s forearm using a needle and syringe. The injection of the PPD into the skin of a subject previously infected with TB stimulates the immune response, including T cells, causing the formation of a hard lump at the site of the injection. Because it takes time for this reaction to occur, the subject must return 48 to 72 hours after the PPD injection to have the result read. The test result is graded by feeling for the boundaries of the swelling, marking these with a pen and then measuring the diameter with a ruler.
The TST suffers from several limitations, including the following:
|
• |
Antiquated technique results in substantial test variability. The technique of administering the PPD injection and reading the TST is inherently variable. Too little of the PPD may be injected to stimulate the appropriate response, the injection may be too shallow, allowing the PPD to leak out of the skin, or the PPD may be injected too deeply to stimulate the appropriate response. Because this technique is inherently operator dependent, healthcare workers who administer the PPD injections and read TST tests should undergo specialist training. However, even with such training, test results vary with the training levels, responsibility, and conscious and unconscious bias of the healthcare workers administering the injections and reading the tests. Variability in the size of the swelling due to administration of the injection averages approximately 15%. Similarly, variation in reading test results among experienced healthcare workers is also estimated at approximately 15%. |
|
• |
Multiple patient visits required. The TST requires that the patient return 48 to 72 hours from the time of injection. This requirement presents a significant logistical challenge. Additionally, non-return rates can be as high as 30%, resulting in considerable time and money being wasted to persuade the subjects to be rescreened as well as the duplicated materials costs and time associated with retesting. |
|
• |
False negatives. False-negative results to the TST are common due to a number of factors relating to the quality of the PPD used and the patient receiving the injection. Specifically, the PPD may be improperly stored, improperly diluted or contaminated. In addition, a fungal, viral or bacterial infection (including active TB disease) can suppress the TST response, leading to a false-negative. False negatives are also prominent among newborns and elderly subjects. Other conditions can also cause false-negative TST results, including HIV, certain live-virus vaccinations (e.g., measles, mumps and polio), chronic renal failure, nutritional factors, diseases affecting the lymphoid organs (e.g., Hodgkin’s disease, lymphoma, chronic lymphocytic leukemia and sarcoidosis), drugs (e.g., corticosteroids, tumor necrosis factor (TNF) biologics and many other immunosuppressive agents) and stress. |
|
• |
False positives. False-positive results to the TST are common and are attributed to the presence in the PPD of antigens that are shared with other mycobacteria. As a result, the TST can cross-react in those patients who are infected with non-tuberculous mycobacteria as well as those patients who have received the BCG vaccine, which is the most widely administered vaccine in the world. |
|
• |
“Boosting” of results. The TST result can also be “boosted,” which occurs when an infected subject’s reaction to an initially false-negative skin test causes increased sensitivity in a subsequent test such that it tests positive. The misinterpretation of a boosted reaction as a new infection with M. tuberculosis can result in unnecessary additional testing for the subject, unnecessary treatment and unnecessary testing of other personnel. As a result of this “boosting” effect, when the TST is used, the CDC recommends two-step testing for newly employed healthcare workers in order to ensure that an initial negative test is not a false negative. This recommendation effectively requires four patient visits when using the TST (two administrations of the PPD and two reads), a process that can lead to significant and costly delays in the hiring of new personnel at U.S. healthcare institutions. |
Our solution
Our T-SPOT.TB test is a highly sensitive and specific, single-cell based method for identifying LTBI. It is a single-tube blood test that directly measures antigen-specific T cells that indicate LTBI.
Our T-SPOT.TB test takes advantage of the T cell response that results from infection with M. tuberculosis. Our T-SPOT.TB test quantifies individual M. tuberculosis-sensitized T cells by challenging them with M. tuberculosis antigens that are recognized by the immune system. We employ two antigens, ESAT-6 and CFP10, to stimulate T cells that have previously been exposed to M. tuberculosis, which causes them to release a cytokine called interferon-gamma. Interferon-gamma is one of the dominant cytokines released by activated T cells when encountering M. tuberculosis. In contrast to the PPD reagent used in the TST, these two antigens are not shared with the BCG vaccine or with non-tuberculous mycobacteria. Because our test detects individual T cells via their release of interferon-gamma, our test is sometimes referred to generically as an interferon-gamma release assay, or IGRA.
We believe our T-SPOT.TB test has a number of compelling advantages that make it a superior alternative to the 100-year-old TST, including:
|
• |
In head-to-head studies, our T-SPOT.TB test is frequently found to have higher sensitivity than the TST. In regulatory clinical trials (see “—Regulatory approvals and clinical validation”), we have demonstrated a sensitivity for the T-SPOT.TB test that exceeds 95%. In comparison, the TST is reported to have a sensitivity between 75-90% in similar populations. In addition, and unlike the TST, our T-SPOT.TB test is not significantly affected by immune-suppression. |
|
• |
Our T-SPOT.TB test is more specific than the TST, primarily because the antigens in our T-SPOT.TB test do not cross-react in individuals who have had the BCG vaccination or who have been infected with most other non-tuberculous mycobacteria. |
|
• |
Our T-SPOT.TB test requires a simple blood draw, which does not require specifically trained healthcare workers to administer the test. |
|
• |
There is no requirement for a return visit in 48 to 72 hours to obtain our T-SPOT.TB test result. This makes the testing process more convenient for patients and avoids the costs and inconvenience of readministering the test to those who fail to return to have the TST read. |
|
• |
Our T-SPOT.TB test does not suffer from the “boosting” phenomenon that can affect the TST, as there is no injection of immunogenic substances into the body. Consequently, with our T-SPOT.TB test, two-step testing for new hires, which entails four visits, is not required and pre-hire screening can be condensed to a single visit. |
|
• |
The combination of our T-SPOT.TB test’s greater accuracy and its logistical benefits means that the adoption of our T-SPOT.TB test can improve patient care while reducing costs for institutions. |
The TST is often considered to be “cheap,” as the PPD reagent and other materials used in the test typically cost less than $5 per test. However, the cost of the TST itself is only one element of the total cost involved when conducting a TB screening program or TB control strategy. Substantial costs beyond the materials cost of the TST test include additional costs associated with: (i) false-negatives and false-positives to the TST; (ii) individuals who fail to return within the prescribed period; and (iii) implementing and maintaining training programs for healthcare workers who administer and read TST tests.
Several studies have been published investigating the costs or cost-effectiveness of a TB screening program using the TST and in comparison to our T-SPOT.TB test. We believe the following two studies are informative in demonstrating how expensive the TST actually is to implement and how deploying our T-SPOT.TB test in preference to the TST can be a more cost-effective solution when implementing TB screening programs.
|
• |
Infection Control and Hospital Epidemiology (Lambert et al., 2003). This CDC-led study sought to determine the annual costs of implementing and maintaining TST screening programs for healthcare workers at hospitals and health departments. The authors concluded that compliance with the CDC guidelines regarding TB infection control may require a substantial investment in personnel time, effort and commitment. The costs of running a TST program were found to be between $41 and $362 per healthcare worker for hospitals and between $172 and $264 per healthcare worker for health departments. The materials cost of the TST itself amounted to less than 1.5% of the total cost of the screening program in all the studied institutions. |
|
• |
Journal of Occupational and Environmental Medicine: The SWITCH study (Wrighton-Smith et al., 2012). The SWITCH study, conducted at The Johns Hopkins Healthcare System and Medical School, was conceived to systematically identify and then measure all the costs of screening healthcare workers using either a TST or an IGRA (specifically, our T-SPOT.TB test). The key study findings were that administering a TST testing program costs $73.20 per person screened, $90.80 per new hire, and $63.42 per annual screen. Use of an IGRA for employee health testing was found to be cost saving, with an IGRA test cost of $54.83 or less per test, and to result in higher screening completion rates due to the elimination of the need for a second visit to interpret the TST. Dr. Peter Wrighton-Smith, our Chief Executive Officer, contributed as an author and scientific collaborator in this study. |
Although primarily designed for use in detecting LTBI, our test can also be used to assist in the diagnosis of active TB disease, particularly in suspected cases where conventional diagnostic methods such as chest x-ray or sputum smear are inconclusive. Because infection is a pre-requisite for disease, ruling out LTBI can aid physicians in diagnosing a different disease or condition. Our test has been included in guidelines in several countries for this purpose, such as those from the Netherlands, France, Ireland and Italy.
Our strategy
Our near-term objective is to increase adoption of our T-SPOT.TB test for screening and detecting persons infected with LTBI. Our longer-term objective is to leverage our proprietary T-SPOT technology platform, immunology domain expertise and regulatory experience to cost-effectively introduce other high-value immunology-based diagnostic tests. To achieve these objectives, our strategy is to:
|
• |
Accelerate our penetration into proven market segments in the United States. We intend to selectively invest in our direct sales and customer service teams to increase our capacity to fully cover the hospital and public health segments, which have primarily supported our success to date. In addition, we expect to build upon our marketing and medical education programs to increase awareness and understanding of the advantages of our T-SPOT.TB test over the TST, including by leveraging scientific publications, such as the SWITCH study results. |
|
• |
Expand into other market segments in the United States. We intend to increase our presence in other market segments where feasible, including physicians’ offices, universities, chronic care facilities and the military. |
|
• |
Expand our sales presence outside the United States. We intend to make investments to expand our direct sales presence, particularly in Europe and Japan. In addition, we intend to establish a presence in select additional geographies to accelerate test adoption in countries where we already have regulatory approval. |
|
• |
Expand our addressable market outside the United States. We intend to continue to invest in opening up new markets by gaining additional regulatory approvals. In addition, we intend to continue to invest to develop markets in which we already have regulatory approval through generating the data to yield supportive guidelines and reimbursement. |
|
• |
Launch new diagnostic tests. We plan to leverage our proprietary T-SPOT technology platform, domain expertise in immunology, lab and commercial infrastructure, regulatory experience and customer relationships to launch new immunology-based diagnostic tests. |
Regulatory approvals and clinical validation
Our T-SPOT.TB test is approved for commercial sale in over 50 countries. Key geographies where we have regulatory approval include:
|
• |
The United States. We obtained PMA for our T-SPOT.TB test from the FDA in 2008. Since 2008, an additional ten PMA supplements have been approved, including supplements relating to manufacturing improvements and label extensions, such as those that enable overnight shipment of blood samples. |
|
• |
Europe. We obtained a CE mark in 2004, which allows us to sell our T-SPOT.TB test in Europe as well as other countries that accept the CE mark. |
|
• |
China. We obtained approval for our T-SPOT.TB test from China’s State Food and Drug Administration, or the SFDA, in 2010. |
|
• |
Japan. We obtained approval for our T-SPOT.TB test from the Ministry of Health, Labour and Welfare, or MHLW, in 2012. |
Two key metrics measured by the regulatory bodies responsible for approving our T-SPOT.TB test are sensitivity, a measure of how many test positives there are in a population known to be infected, and specificity, a measure of how many test negatives there are in a population known to be uninfected. The following is a chart showing the performance of our T-SPOT.TB test in studies conducted in certain key geographies:
|
Country/Region (trial size) |
Sensitivity (%) |
Specificity (%) |
||||||
|
United States (2,355 subjects) |
95.6 | % | 97.1 | % | ||||
|
Europe (180 subjects) |
98.8 | % | 100 | % | ||||
|
China (1,333 subjects) |
95.3 | % | Not applicable* | |||||
|
Japan (212 subjects) |
97.5 | % | 99.1 | % | ||||
|
* |
Specificity data are not available in the Chinese study because the design of the studies focused on active TB disease, for which specificity is not a relevant metric. In China, the positive and negative predictive values for the diagnosis of active TB disease were 95.4% and 93.9%, respectively. |
These data, which were generated in controlled studies under strict regulatory standards, demonstrate that our T-SPOT.TB test is able to detect TB infection with high accuracy. In addition, our T-SPOT.TB test has also been validated in approximately 350 peer-reviewed publications in scientific journals.
Guidelines
We believe that clinical guidelines, which are recommendations issued by national medical societies or public health bodies, are a driving factor in a clinician’s decision to use a specific diagnostic test. Our T-SPOT.TB test is included in clinical guidelines for TB screening in 17 countries, including the United States, several European countries, and Japan.
Guidelines typically refer to our T-SPOT.TB test generically as an IGRA. Guidelines generally incorporate one of four common approaches: (1) a two-step approach in which TST is administered and subsequently followed by an IGRA, either when the TST is negative (to increase sensitivity, mainly in immunocompromised individuals) or when the TST is positive (to increase specificity, mainly in BCG-vaccinated individuals); (2) either TST or IGRA, but not both; (3) IGRA and TST together (to increase sensitivity); and (4) IGRA only, replacing the TST.
In recent years, the use of IGRAs has been increasingly recommended. For example, key recommendations contained in the CDC’s 2010 guidelines are as follows:
|
• |
An IGRA may be used in place of a TST in all situations in which the CDC recommends TST as an aid in diagnosing TB. |
|
• |
An IGRA is preferred for testing persons from groups that historically have low rates of returning to have TSTs read. |
|
• |
An IGRA is preferred for testing persons who have received BCG (as a vaccine or for cancer therapy). |
|
• |
A TST is preferred for testing children under the age of five, though use of an IGRA in conjunction with a TST has been advocated by some experts to increase diagnostic sensitivity in this age group. |
|
• |
An IGRA or a TST may be used without preference to test recent contacts of persons known or suspected to have active TB disease, with special considerations for follow-up testing. IGRAs offer the possibility of detecting M. tuberculosis infection with greater specificity than with a TST. Also, unlike TSTs, IGRAs do not boost subsequent test results and can be completed following a single patient visit. |
We believe that these guidelines (and similar national guidelines outside the United States) allow us to access the vast majority of the current TST market and assert the superiority of an IGRA in significant segments of the market.
Market segments and revenue mix
We have a geographically diversified business. In 2013, 55% of our revenue was derived outside the United States and 45% inside the United States.
Our U.S. business derived 96%, 95% and 94%% of revenue from our service offering (as opposed to kit sales) for the years ended December 31, 2013, 2012, and 2011, respectively. The growth in our service offering reflects our experience that U.S. customers prefer to send out for IGRA tests than run them in-house. We categorize the U.S. market into four main areas:
|
• |
Hospital based-testing. We estimate that there are 7.0 million tests performed in hospitals in the United States each year. This test volume is made up primarily of testing of hospital employees, although there is also some in-patient and out-patient testing of high-risk patient groups. Testing in this segment is primarily non-reimbursed, with the test costs borne by institutional budgets. Consequently, test pricing results from direct negotiation with each institution. Our current average selling price is approximately $50 per test for this segment. We therefore believe that this segment has a total annual value of approximately $350 million. |
|
• |
Public health departments. We estimate that there are 1.1 million tests performed by public health departments across the United States each year. This test volume is made up of testing contacts of infectious TB patients, testing of refugees and other immigrants and testing conducted in public health clinics, which covers testing for a wide variety of purposes. Testing in this segment is primarily non-reimbursed and thus subject to negotiated prices, although there are some testing populations in this segment that are covered by government payors. We currently collect approximately $45 per test for this segment. We therefore believe that this segment has a total annual value of approximately $50 million. |
|
• |
Physicians’ offices and clinics. We estimate that there are 7.3 million tests performed in physicians’ offices and clinics across the United States each year. This test volume is made up of testing of various high-risk groups, including HIV patients, rheumatology patients and those undergoing immunosuppressive treatment regimens. Testing for these patients is typically reimbursed by Medicare, Medicaid and third-party commercial payors. We have limited experience with billing these payors, but based on our Medicare national limitation amount of $102 per test, we believe that we may be able to collect as much as $75 to $95 per test performed in this segment. Taking the mid-point of this estimate, this segment could have a potential annual value of approximately $620 million. |
|
• |
Other. We estimate that each year there are 6.4 million tests performed in various other settings, including military installations, correctional facilities and universities and schools. This test volume is made up of testing various groups, including military personnel, prisoners and prison workers, foreign-born students and residents and workers in long-term care homes. Reimbursement coverage and mechanisms vary based on the tested population. Because of our limited experience in this segment to date, we cannot currently estimate the potential annual value of this segment. |
Currently, we are primarily focused on, and derive the majority of our U.S. revenue from, the hospital and public health segments.
Our business outside the United States represents a total potential market of over 28 million tests annually and we currently sell to customers in 49 countries. Ninety percent, 83% and 84% of our revenue from outside the United States came from sales of kits and associated accessories, as opposed to service offering revenue, for the years ended December 31, 2013, 2012 and 2011, respectively. We, either directly or through our distributors, sell our testing kits primarily to hospital laboratories and commercial testing laboratories that perform the tests and provide test results to the ordering clinicians. Test prices are negotiated with each of our customers.
Funding and reimbursement
The funding and reimbursement structures for LTBI testing vary among countries, as discussed in more detail below.
United States
In the hospital and public health segments, TB testing programs are funded primarily from institutional budgets. We receive payment from these institutions according to our pre-negotiated prices. For other segments of the U.S. market (notably, for example, the physicians’ office segment) third-party reimbursement from governmental payors and/or private insurers is often available to cover the cost of our T-SPOT.TB test.
CPT codes are used by payors to identify services provided to patients and determine the appropriate level of reimbursement for such services. As such, obtaining a CPT code for a particular service facilitates payment to the provider. We applied for and were successful in obtaining a unique CPT code to cover our T-SPOT.TB test (code 86481), which became effective in January 2011. The reimbursement amount of this code was initially linked to CPT code 86480. We appealed this decision on the basis that our T-SPOT.TB test uses a different methodology and that this leads to differentiated clinical outcomes to the test covered under code 86480. Our appeal was successful and in January 2012 the reimbursement amount for code 86481 was increased by 22%. The current CMS national limitation amount for 86481 is $102. We have a national coverage determination for our CPT code 86481 from Medicare, which means we are able to obtain Medicare reimbursement nationally. Individual state agencies establish reimbursement levels for Medicaid. Our T-SPOT.TB test is currently reimbursed by Medicaid in 45 states and the District of Columbia, and our Oxford Diagnostic Laboratories®, or ODL®, facility is an enrolled provider with Medicaid in 37 states. We submit claims to these federal insurance programs and also to private insurers as an out of network laboratory. Based on our limited experience to date, we believe that our code is covered by most private insurers.
There are a number of other segments of the U.S. TB screening market, such as correctional facilities, military personnel, university students and chronic care facility residents. We believe that funding varies within and among these segments, encompassing both funding from institutional budgets and from third-party payors.
Outside the United States
Although outside the United States we primarily negotiate pricing directly with our customers, our prices are influenced to some degree by the mechanism and level of funding our customers receive for performing LTBI testing. The funding mechanisms for selected countries are explained below.
Japan. IGRAs are listed on the clinical lab fee schedule in Japan (code D015-25), which attracts a reimbursement level of approximately $60 per test based on foreign currency exchange rates as of December 31, 2013. We believe that this reimbursement code covers all patient testing done in hospitals and clinics. There also exists a mechanism to partially reimburse public health entities for IGRA testing from central government funds.
China. In China, test pricing is regulated by provincial government bodies. These bodies determine the price at which a test can be charged to the test recipient. To date, pricing approval has been granted for our T-SPOT.TB test in five provinces with test pricing of approximately $115 per test based on foreign currency exchange rates as of December 31, 2013. We believe that certain hospitals (e.g., military hospitals) fall outside of this formal pricing approval, in which case the test is funded from hospital budgets. Similarly, in provinces where no pricing approval exists, hospitals may still purchase and perform our T-SPOT.TB test, but testing must be funded using the hospitals’ pre-existing resources.
United Kingdom. No formal centralized reimbursement mechanism for diagnostic tests exists in the United Kingdom. Instead, the testing is funded from institutional budgets whether we sell kits or our service offering.
Germany. Outpatient testing is covered in Germany under the “EBM” reimbursement system. A code for IGRAs was established in January 2011 (Code 32670), which qualifies for reimbursement of approximately $80 per test based on foreign currency exchange rates as of December 31, 2013. In addition, the cell-purification step inherent in our T-SPOT.TB test methodology can also attract approximately an additional $14 per test in reimbursement. Testing that is not eligible for EBM reimbursement (e.g., inpatient testing and public health testing) is typically funded from institutional budgets.
Sales, marketing and distribution
We currently market our T-SPOT.TB test directly in the United States, Northern Europe and Japan. Outside of these territories, we have contracted with third-party distributors. In countries where we have a direct presence, we use a combination of sales managers, sales representatives, customer service staff and technical experts to interact with clinicians, nurses, administrative staff, laboratories and other groups who are involved in the implementation of TB screening programs. Our goal is to educate these groups about the medical, logistical and economic benefits of switching from the TST to our T-SPOT.TB test. Our customer service staff and technical experts are also involved in the practical training of customers to perform and order our T-SPOT.TB test as well as answering customer questions. These teams are supported by marketing activities, which include advertising, medical education, attendance at scientific meetings and other awareness-raising activities.
Under our flexible business model, we currently offer our T-SPOT.TB test in either an in vitro diagnostic kit or a service format. In the former, we sell test kits and associated accessories to laboratories for them to perform the testing themselves. In the latter, we have established clinical testing laboratories in the United States and the United Kingdom, where we perform our T-SPOT.TB test on samples sent to us by customers. In these markets, we have found that many customers prefer to send samples to us rather than perform their own analysis on-site. We market our service offering under the name Oxford Diagnostic Laboratories, or ODL.
Our ODL service is typically comprised of the following steps:
|
• |
We provide our customers with pre-paid sample packaging for shipping samples back to our laboratories for analysis. |
|
• |
The customer draws a blood sample and places it in our sample packs, along with a completed test requisition form. |
|
• |
The sample is picked up by our designated courier (although customers can also drop off samples themselves to courier locations) and shipped overnight. |
|
• |
When the package arrives at our ODL facilities, we unpack and enter the sample data into our laboratory information system, or LIS. The LIS assists us in sample processing and tracking and provides various automation options for result delivery and invoicing. |
|
• |
We process the sample and, once the test is complete, we report the results back to the customer and submit an invoice to the customer or, in certain cases, to a patient’s insurance provider. We have various mechanisms for customers to order and receive their results according to their preference, including fax, encrypted e-mail, web-portal or an interface with their electronic medical records system. |
Our approximately 35,000 square foot U.S. ODL facility is located in Memphis, Tennessee, approximately ten miles from the FedEx global headquarters and sorting facility. We use FedEx as our courier for samples in the United States and have negotiated discounted shipment rates that our customers are able to take advantage of via our pre-paid sample shipment packs. We believe that our location gives our laboratory the competitive advantage of being able to access almost all parts of the continental United States with a patient-to-lab time of typically less than 20 hours. In addition, we believe it gives us market access and convenience advantages because customers can use our service wherever there is a FedEx pick-up or drop-off location. Further, as we typically receive the majority of our packages from FedEx’s sort facility at 4 a.m., Memphis time, each morning we are able to achieve turnaround times that we believe are substantially quicker than other competing laboratories. Our U.S. ODL facility is College of American Pathologists accredited and has obtained the necessary Clinical Laboratory Improvement Amendments, or CLIA, registrations to accept samples from all 50 states.
Our U.K. ODL facility is located within our manufacturing facility in Abingdon, England. We use DX, which is the same courier used by U.K. National Health Service institutions, as our primary courier in the United Kingdom. Our U.K. lab is accredited to the ISO17025 quality standard. See “—Laboratory certification, accreditation and licensing” below.
Our technology platform
T cells are a central component of the human body’s immune system, and are involved in the control and progression of many medical conditions, including certain types of infectious diseases, cancers and autoimmune diseases. Our proprietary T-SPOT technology platform allows us to efficiently measure marker-specific T cell responses at a single-cell level and thereby inform the diagnosis, prognosis and monitoring of patients with immunologically controlled diseases. By measuring T cells, we can provide additional data to clinicians that are not available through existing methods, such as molecular diagnostics. For example, LTBI cannot be diagnosed by a molecular test.
We employ a proprietary quantitative method to detect antigen-specific effector T cells releasing interferon-gamma. Interferon-gamma is a principal immune messenger molecule, called a cytokine, released by effector T cells. Our technology is designed to selectively measure responses from this subtype of T cells because they are primarily present when active, replicating pathogens are inside the body, as opposed to other T cell subtypes that may be present long after an infection has been cleared from the body. For diagnosis and monitoring applications, it is more relevant to be able to measure the immune response associated with the current disease rather than the immune response associated only with past, cleared exposure.
Additionally, we have developed a patented method for enabling the processing of blood samples after they have been shipped overnight. This method involves the removal of contaminating granulocytes from the shipped sample to rejuvenate it prior to processing. Granulocytes are a normal component of whole blood. However, once blood is removed from the body, granulocytes start to progressively decay, which can cause contamination of the T cell containing white blood cell, or WBC, components used in T cell assays. In addition, decaying granulocytes release chemicals that can suppress cytokine secretion by T cells, further reducing test sensitivity. By removing granulocytes prior to starting an assay, we restore the sample to the same composition and function as a fresh sample. To further the commercialization of this technology, we use our T-Cell Xtend reagent in conjunction with our assay methodology. The T-Cell Xtend reagent is an antibody complex that binds granulocyte cells to red blood cells, thereby ensuring that they do not contaminate the WBC components used in our assay. By using the T-Cell Xtend reagent, we can test blood samples that have been shipped and/or stored for up to 32 hours before processing commences.
Our T-Cell Xtend reagent addresses the significant process limitation inherent in some laboratory tests that require a fresh blood sample for the assay. When this requirement exists, the diagnostic test may not be accessible for many subjects unless a local laboratory is available and able to quickly process the sample. An alternative approach is sometimes employed in which blood samples are carefully frozen before shipment to a laboratory. We believe this approach is impractical in regular clinical use, particularly when a large volume of samples is involved, and reduces sample quality. Our solution, the T-Cell Xtend reagent, addresses this problem without the need for freezing the blood. Specifically, our solution does not require the customer to do anything to process blood samples prior to shipment as the T-Cell Xtend reagent is added to the sample when it arrives in the laboratory. This approach is practical for routine clinical use and has the ability to significantly broaden the potential market for certain diagnostic tests.
We also employ proprietary manufacturing processes and protocols designed to cost-effectively and reliably produce key elements of our T-SPOT technology, including the process for coating microtiter plates with interferon-gamma antibodies and our quality control testing procedures. Further, we have developed proprietary methods designed to achieve rapid throughput in assay performance. These methods involve harvesting WBC components from whole blood and specific protocols related to the use of automation in the assay process.
The principles of our T-SPOT assay system, incorporating our T-Cell Xtend reagent, are shown in Figure 1.1 below, using blood as the body fluid in the example. The process starts with a blood sample, from which WBC components (specifically Peripheral Blood Mononuclear Cells, or PBMCs) containing T cells are separated, washed and counted. A pre-determined number of WBCs and antigens specific to the disease or condition of interest are then added to the wells of a microtiter plate to which antibodies to interferon-gamma, or IFN-g, are bound. The test is based on the principle that the T cells of an individual who carries an active infection will respond to the antigens and secrete interferon-gamma. The secretion of interferon-gamma by the T cells of the subject is captured by the anti-interferon-gamma antibodies coated to the floor of each well. The numbers of individual reacting T cells are enumerated through visualizing the footprint of each T cell by this secretion of interferon-gamma.
Figure 1.1: Principles of our T-SPOT assay system
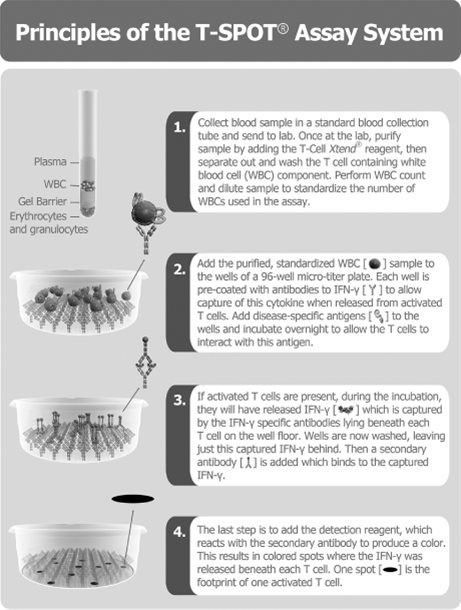
Key features of this assay method that give it technical advantages over other platforms for measuring antigen-specific T cells include:
|
• |
Ability to ship blood samples overnight. We believe our intellectual property position and our T-Cell Xtend reagent give us an advantage in that we can ship blood overnight for T cell measurement assays. We believe this allows for much easier adoption of our technology, as customers do not need to go through labor-intensive freezing protocols prior to shipping samples and widespread access to the test can be accomplished without the need for a suitable local lab to run the test. In addition, overnight shipment allows the centralization of samples in a single testing facility, such as our ODL facilities, which can yield cost savings through economies of scale and gives us the advantage of direct relationships with the individuals and organizations who order the tests. |
|
• |
Low background noise. The use of our T-Cell Xtend reagent, plus the separation and washing of WBCs prior to performing the test, ensure that the subsequent steps of the process start with a purified sample. Our assay system therefore has a low background noise that is essential for the detection of weaker responses, which is critical in many applications, including screening for TB. |
|
• |
Standardization. We standardize the number of WBCs added to each well, which ensures that variations in WBC numbers, such as those caused by disease or immunosuppression, are eliminated prior to starting the assay. This is particularly relevant in populations with lower numbers of WBCs, such as HIV patients and other immunosuppressed groups. In addition, standardization of the number of WBCs is important to establish a stable baseline against which to validly compare longitudinal measurements within an individual. This standardization is thus important for disease monitoring indications. |
|
• |
High analytical sensitivity. Our analytical method measures responses at a single-cell level, which, in combination with the two steps above, provides high analytical sensitivity. As a result, we are able to reliably detect specific T cells at frequencies of 1 per 50,000 WBCs or less. |
|
• |
Designed to be incorporated in standard clinical practice. The sample collection process is designed to be easy to perform in a wide variety of clinical settings using a standard blood draw. By using industry-standard sample collection procedures, we believe our T-SPOT.TB test and subsequent assays we develop using our T-SPOT platform will be accessible to a wide variety of customers. |
In addition to its technical advantages, our T-SPOT technology can be applied to diagnose and monitor a variety of diseases and conditions. First, by altering the target-specific antigen used in our T-SPOT assay, we can direct our technology platform to detection of different diseases or conditions where T cell function is involved. Second, our proprietary methods can be used to visualize cytokines other than interferon-gamma. Third, our methodology can be and has been successfully applied to other body fluids that contain T cells. This provides us the ability to detect T cell responses not just in the bloodstream, but also from T cells that have migrated to sites of disease.
As scientific knowledge increases regarding the potential utility of measuring T cell function to inform disease diagnosis and outcomes, we expect to have further opportunities to develop tests for diseases and conditions that are governed by an immunological response. We believe our technology platform will provide us with significant competitive advantages in this effort and enable us to become a leader in the field of immunology diagnostics.
Research and development
Our research and development efforts are focused on developing new diagnostic tests that use our quantitative T cell measurement technology.
We believe that we have assembled experienced research and development teams across our sites with the scientific talent needed to develop new products that leverage our technology platform and immunology expertise. We believe that our experience in developing assays based on our T-SPOT method will allow us to conceive and develop assays and validate multiple tests on our platform. Our initial product, our T-SPOT.TB test, was developed, validated and commercialized within 18 months. Initially, we intend to focus our research and development efforts on potential tests for which the antigens are known, which eliminates the lead time required for antigen discovery.
We are currently investigating multiple opportunities to develop additional diagnostic tests, including assays that would help transplant physicians better manage patients at risk of rejection and infection. Because the antigens in this context are largely known, reducing the lead time required for antigen discovery, we believe that we may be able to develop tests for use in the transplant market more quickly and with less development risk. In addition, because we already have sales penetration in hospitals where transplant centers are generally located, we believe that we may be able to efficiently build upon our existing sales and marketing infrastructure in order to introduce tests in this market. Given that intensive patient monitoring is required in the first few years post-surgery, we believe that this can be a significant market for us. We believe our market opportunity in the transplant segment could be as high as $500 million annually.
Our research and development expenses were $2.1 million, $1.9 million, and $1.8 million for the years ended December 31, 2013, 2012, and 2011, respectively.
Intellectual property
We seek to secure and maintain protection of the proprietary aspects of our technology platform and of our existing and planned products. We rely on a combination of patents, trademarks, trade secret and other intellectual property laws, and confidentiality, license and invention assignment agreements and other contracts to protect our intellectual property rights. In addition, we have developed substantial knowledge in the field of immunology diagnostics including proprietary methods that we believe provides us with a significant advantage relative to potential competitors.
The intellectual property relating to our T-SPOT.TB test that we own or license includes 13 issued U.S. patents, more than 20 issued patents in other jurisdictions, 3 pending U.S. patent applications and 4 pending patent applications in other jurisdictions, as well as registered trademarks, proprietary manufacturing processes and protocols, and proprietary methods directed towards achieving rapid throughput in assay performance.
Our owned and licensed patents
The table below identifies the patents and pending patent applications we own or to which we have license rights that relate to our T-SPOT.TB test.
|
Patent and patent |
Form of rights(2) |
Expected |
General description of subject matter | |||
|
US 7,575,870, US 8,617,821, US 14/090,221*, EP 941478, JP 4094674, AU 728357, CA 2,272,881 |
Owned(3) |
November 2017 |
Methods, including use of ELISPOT technique, to detect and quantify in vitro effector T cells that respond to pathogen specific antigen stimulation with the release of interferon-gamma | |||
|
EP 2084508, CN 10105293224, US 13/253,598*, JP 2009-530943*, AU 2007303994*, CA 2,665,205*, IN 2165/DELNP/2009* |
Owned |
October 2027 |
Methods of improving stored blood sample stability by removing granulocytes | |||
|
US 7,115,361 |
Owned(3) |
December 2019 |
Method and kit for detecting TB specific T cells following stimulation with antigen peptides | |||
|
US 7,632,646, US 7,901,898, US 8,216,795, US 8,507,211 US 13/940,758*, EP 1144447, JP 4633931, ZA 2001-3356 |
Owned(3) |
November 2019 |
Composition, method and kit for diagnosis of TB using peptides from ESAT-6 | |||
|
US 6,290,969, US 6,338,852, US 8,084,042, EP 1203817, JP 4324597, CN 1200147, AU 727602, CA 2,653,566, ZA 9607394, and a number of other countries |
In-licensed from Statens Serum Institut |
September 2015 (US) August 2016 (other jurisdictions) |
Composition and method of making an isolated polynucleotide of TB specific protein CFP10 | |||
|
US 5,955,077, EP 706571, AU 682879, CA 2,165,949, NZ 267984 |
In-licensed from Statens Serum Institut |
September 2016 (US) July 2014 (other jurisdictions) |
Composition and sequences of TB polypeptide antigen ESAT-6 and uses in diagnosis of TB | |||
|
US 7,579,141, US 8,021,832, EP 1214088, JP 4820489, AU 773268, CA 2,372,583 |
In-licensed from Rutgers, The State University of New Jersey |
May 2020 |
Methods of in vitro diagnosis utilizing the T cell response to CFP10 to distinguish between exposure to TB and BCG vaccination |
|
* |
Reflects pending patent applications |
|
(1) |
Where we have rights to patents granted by the European Patent Office, or the EPO, the patents have been validated in numerous countries in Europe, which vary by specific patent but typically include at least the United Kingdom, Germany and France. |
|
(2) |
For a discussion of the terms of the licenses referenced in this table, please see “—Our license and assignment agreements” below. |
|
(3) |
These patents were assigned to us by Isis Innovation Limited in November 2013. For a discussion of our ongoing payment obligations to Isis Innovation Limited and other rights related to these patents, please see “---Our license and assignment agreements” below. |
Many of the patent rights we own or in-license have claims directed to the use of ESAT-6 and/or CFP10 to detect Mycobacterium tuberculosis. We believe that these are the most important TB-specific antigens and we include peptides from both of these in our T-SPOT.TB test. We also believe that using an ELISPOT technique for an IGRA enhances its accuracy and suitability for use in testing individuals with compromised immune systems. Our T-SPOT.TB test employs this technique.
The first two patent groups listed in the table above also have potential applications beyond the TB field. The core technology patents, which we own, contain claims to methods of measuring marker-specific effector T cell responses at a single-cell level. These methods cover the measurement of intracellular pathogens by detecting, through a quantitative method using an ELISPOT technique, the in vitro release of cytokines by antigen-specific effector T cells. These measurements can inform the diagnosis, prognosis and monitoring of patients with immunologically controlled diseases or conditions, such as infectious diseases, cancers and autoimmune diseases.
The inventions claimed in our patents and patent applications relating to removal of granulocytes from stored blood samples may also have applications in relation to other diseases, conditions or situations where blood samples cannot be tested soon after the blood draw. This proprietary method to improve the stability of stored blood enables our service offering as it allows for overnight shipment of blood samples.
We have also licensed certain patent rights from three parties that we believe may assist us to develop future diagnostic tests, particularly in the transplant field. The expected expiration dates of these patents range from March 2018 for three issued U.S. patents to which we have non-exclusive rights to May 2027 for pending patent applications to which we have exclusive rights for in vitro diagnostics measuring immune status in humans related to organ transplantation, graft versus host disease and autoimmune disease. We can give no assurance that any of our current or future research and development programs will result in the development and validation of any diagnostic test.
Our license and assignment agreements
We currently rely upon two license agreements, referenced in the table above, to obtain rights under certain patents that we believe may be necessary to make, use and sell our T-SPOT.TB test. We may in the future rely, at least in part, upon licensing agreements with third parties to obtain patent rights and transfers of technology, information and know-how to enable us to take advantage of research work already completed, including potentially the identification of antigens useful for measuring disease conditions. We believe such licensing arrangements have enabled us, and may in the future enable us, to reduce the amount of time we need to develop and validate new diagnostic tests.
We have royalty obligations under each of our license agreements and also have payment obligations, measured in part based our sales levels, under the terms of the assignment agreement by which we acquired rights to certain of the patents we currently own. For ease of presentation in this Annual Report, we include all payments measured by sales levels as royalty obligations. Royalty obligations exist regardless of the format in which we offer our test (i.e., a kit format or a service format). Our royalty obligations are calculated on our net sales, the definition of which varies by agreement and typically results in a lower effective royalty rate on our service revenue than on sales of our kits. Currently, our aggregate royalty burden under all license and assignment agreements, as a percentage of gross product and service revenue, is in the low double digits. Under one of our license agreements, we are responsible for paying, or contributing to, patent prosecution and maintenance costs. Both of the license agreements related to our T-SPOT.TB test and our assignment agreement impose diligence obligations on us. These obligations include certain requirements relating to the pursuit of clinical development and commercialization of licensed products in various markets worldwide. We believe we are in compliance with such obligations.
Isis Innovation Limited (Isis)
In connection with our initial public offering, we entered into an assignment agreement with Isis, pursuant to which various patents we previously licensed from Isis were assigned to us. We have ongoing obligations under the assignment agreement to make payments to Isis until the patents expire and to continue to extend license rights to the University of Oxford, its employees, students, agents and appointees to use the technology for academic and research purposes. Our rights under the patents assigned to us by Isis are subject to various grants of license rights, including (i) a license back to Isis to maintain a pre-existing license for research use only, (ii) a pre-existing grant to a third party of non-exclusive rights under the patents covering a field of two infectious diseases, (iii) a pre-existing grant to a third party of non-exclusive rights under the patents limited to the licensee’s internal use to monitor vaccine response, and (iv) a pre-existing grant to a third party of non-exclusive rights under some of the patents with the right to sublicense, limited to use with ESAT-6 and CFP10 antigens, and excluding use of the ELISPOT technique for diagnosis and monitoring of TB infection, disease or therapy. We do not believe this third party has granted any sublicense rights as of December 31, 2013.
The amount we pay to Isis for our royalty obligation is equal to a royalty rate in the low single digits and we expect this rate to be reduced for certain of our sales after the expiration of certain specified patents, which we believe will be in late 2017. Our aggregate royalty obligation payments to Isis through December 31, 2013 have been $0.8 million. Through 2014, we may be required to make minimum annual royalty payments of $0.2 million. Our royalty obligations to Isis will cease when there are no valid patent claims still in force.
Statens Serum Institut (SSI)
We entered into our current license agreement with SSI in 2009, replacing an original license agreement from 2003. The current license agreement has been amended by one supplement entered into in 2010.
Pursuant to the agreement, SSI granted us an exclusive, worldwide, royalty-bearing license with the right to sublicense, to certain patents to use certain antigens in a diagnostic kit for in vitro diagnosis of TB in humans using an ELISPOT-based detection of interferon-gamma producing T cells using any fluid sample other than whole blood in the diagnostic assay. We have not granted any sublicenses under this license.
Previously, we made a number of milestone payments due under the license to SSI, although no future milestone payments are required. We pay royalties in the Euro currency at a rate between 10-20% of net sales, as defined in the agreement, subject to minimum annual royalty payments, which vary by territory. Through 2019, we may be required to make minimum royalty payments for three territories in aggregate amounts of $3.7 million, $4.4 million, and $3.0 million. The license agreement provides that royalty obligations continue after the expiration date of licensed patents for a period of four years at a single digit royalty rate. Our aggregate payments to SSI through December 31, 2013 for milestones and royalties, including minimum royalties, have been $7.8 million.
Our license agreement expires, unless earlier terminated, five years after the expiration of the last to expire of individual licensed patents listed as part of the agreement at the effective date in 2003. SSI may terminate the agreement if we, or any future sublicensees, challenge the licensed patents or other SSI intellectual property covered by the agreement. The agreement provides that either party may terminate for material uncured breach by the other party or for certain bankruptcy or insolvency events involving the other party. SSI may also terminate the exclusivity of the license and cease licensing improvements to us if we engage in certain activities related to the development or commercialization of a diagnostic test for latent tuberculosis that does not incorporate any of the licensed diagnostic antigens and which competes with research into, development of or commercialization of the intellectual property rights licensed to us.
Rutgers, The State University of New Jersey (Rutgers)
We entered into our license agreement with Rutgers in 2006 and it has been amended four times, in 2009, 2011, 2012 and 2013. Pursuant to the agreement, Rutgers granted us an exclusive license to certain patents to manufacture and commercialize kits for in vitro diagnostic assays relating to TB other than in the ELISA format. Our license is royalty-bearing, worldwide, with the right to sublicense. We have not granted any sublicenses under this license. Rutgers has reserved the right to grant one additional license to this technology, limited to an ELISA format. To date, we do not believe Rutgers has entered into any such license.
We must make semi-annual royalty payments to Rutgers. Although the agreement contains minimum royalty obligations, the amount of royalties due based on our actual sales has exceeded the minimum for a number of years and we expect our obligations will continue to exceed the minimum for the duration of our royalty obligations. We pay a royalty rate in the low single digits. Our aggregate payments to Rutgers through December 31, 2013 for signing fees, annual fees, milestones and royalties, including minimum royalties, have been $1.7 million. Our royalty rate may be reduced, depending on the outcome of an European patent office, or EPO, opposition appeal and could also be reduced if Rutgers grants another license to the technology covering an ELISA format. See “Risk factors—Risks related to our intellectual property.” Our royalty obligations to Rutgers will cease when there are no valid patent claims still in force covering licensed products or assays. Previously, we made a number of other payments to Rutgers for license issue fees, annual license fees and milestone payments. No such future payments are required under the license.
Rights under the agreement expire on the last to expire of the licensed patents or the abandonment of all patent applications related to the licensed patent rights. We may terminate the license by advance written notice. Either party may terminate the license for material uncured breach by the other party. Rutgers may terminate the license if a court or administrative body finds it liable or culpable due to our performance, or the performance of any future sublicensee, unless we agree to indemnify it from damages resulting from the decision. Our license rights terminate automatically if any bankruptcy, insolvency or similar proceedings are instituted by or against us (subject to reinstatement if the matter is removed within a specified time frame).
Trademarks and other protection
The trademarks we employ in our TB screening business include T-SPOT, T-Cell Xtend, Oxford Diagnostic Laboratories, ODL, the Oxford Immunotec logo and our laboratory logo. We have obtained registrations in the United States for T-SPOT, T-Cell Xtend, Oxford Diagnostic Laboratories and the Oxford Immunotec logo. We have also obtained or are seeking registrations for certain of these trademarks in other jurisdictions, including the United Kingdom, the European Community, Japan and China. We have also secured numerous domain name registrations.
We have a policy of requiring all our employees to sign agreements that obligate them to maintain in confidence all confidential information they receive during the course of their employment, except in certain circumstances. Substantially all of our employees are also bound by invention assignment obligations, which provide that rights to all inventions and other types of intellectual property, whether or not patentable, conceived by them during the course of employment are assigned to us. We seek to enter into similar confidentiality and invention assignment agreements with our consultants.
Our proprietary processes
There are several areas in which we have developed proprietary approaches to manufacturing that we believe provide a competitive advantage not only with respect to our T-SPOT.TB test, but also for future tests we may develop on our T-SPOT technology platform. It is essential to the performance of ELISPOT tests used to detect the release of interferon-gamma from stimulated T cells that the microtiter plates used in the test be smoothly coated with the proper amount of interferon-gamma antibodies. For volume manufacturing, these coated plates must also meet stringent shelf life requirements. Our plate-coating process meets these criteria and cost-effectively provides reliable results. We have also developed a proprietary approach to conducting conformance testing and validation as part of our quality control processes. We believe this approach results in significant cost savings for us without sacrificing our compliance with either good manufacturing practices or our own high standards.
As part of our T-SPOT.TB test, we use a proprietary formulation of peptides which we believe is important to the accuracy of our test. Further, we have devoted substantial time and resources to the development of processes and techniques that have resulted in cost reductions in our test manufacture and in assay performance in our service laboratories. In our ODL facilities, we have streamlined the workflow process in our laboratories to allow for rapid throughput, which reduces labor costs and reduces the time we take to provide test results to our customers. In addition, we have developed and validated automated solutions to portions of the assay process, including proprietary protocols for maximizing efficiencies garnered from the automation equipment. These methods are useful in our T-SPOT.TB test, and will be applicable to future blood-based tests we may develop using our T-SPOT platform. We believe the manufacturing process and assay performance efficiencies we have developed and employ could not easily or quickly be developed by others.
Manufacturing and laboratory facilities
Our T-SPOT.TB test is generally manufactured by us from materials we obtain from a limited number of suppliers. We manufacture our product at our U.K. corporate headquarters in Abingdon, England, where we currently lease approximately 8,566 square feet of laboratory space, including the space dedicated to product manufacturing. Our manufacturing facility is certified to ISO 13485 and ISO 90001. The lease on this facility expires in 2019 and our current rent for the laboratory space is $328,000 annually, which is subject to change.
We operate two diagnostic testing laboratories, one in the United States and one in the United Kingdom, where we process samples sent to us by our customers who choose the service format of our T-SPOT.TB test offering. Our U.S. laboratory facility is located in Memphis, TN, where we currently lease approximately 34,560 square feet of space. The lease on this facility expires in 2016. Our current rent under this lease is $167,760 annually and is subject to annual increases. Our U.K. laboratory is part of the leased space used for manufacturing of our T-SPOT.TB test, as described above.
Key supplier relationships
Generally, we believe our relationships with our key suppliers to be good.
Mabtech AB. We entered into a manufacturing agreement with Mabtech AB, or Mabtech, in 2003 and the agreement was amended in 2010 and 2011. We entered into a separate purchase agreement with Mabtech in 2010, which was amended in 2013. Pursuant to the manufacturing agreement, Mabtech supplies us with antibody-coated membrane plates, using plates we purchase from another supplier and provide to Mabtech. These antibody-coated membrane plates are a component of our T-SPOT.TB test. We provide rolling forecasts of our anticipated purchases and portions of those forecasts become binding orders. We receive pricing discounts based on the volume of our purchases.
The manufacturing agreement expires, unless earlier terminated, on December 31, 2016. Either party may terminate by providing written notice to the other in the event of a material uncured breach by the other party, a liquidation, insolvency or bankruptcy proceeding involving the other party or cessation in trading by the other party.
Pursuant to the purchase agreement, Mabtech supplies the antibodies used to coat the membrane plates and for the detection procedure in our T-SPOT.TB test. We provide rolling forecasts of our anticipated purchases and portions of those forecasts become binding orders. We receive pricing discounts based on the volume of our purchases. We have agreed to purchase these antibodies exclusively from Mabtech, although our exclusivity obligations may cease in the event Mabtech raises prices by more than a certain percentage over a defined period of time and declines to match a competitive third-party quotation for the antibodies.
The purchase agreement expires, unless earlier terminated, on December 31, 2018. Either party may terminate by providing written notice to the other in the event of a material uncured breach by the other party, a liquidation, insolvency, or bankruptcy proceeding involving the other party or cessation in trading by the other party.
EMD Millipore Corporation. We entered into a supply agreement with EMD Millipore Corporation, or Millipore, in 2009, which was amended in 2013 and 2014. Pursuant to this agreement, Millipore supplies us with the membrane plates used in our T-SPOT.TB test. We provide rolling forecasts of our anticipated purchases and portions of those forecasts become binding orders. We receive pricing discounts based on the size of our orders. The agreement expires, unless earlier terminated, on December 31, 2018. Each party has the right to terminate in the event of a material uncured default by the other party.
MicroCoat Biotechnologie GmbH. Pursuant to our 2010 supply agreement with MicroCoat Biotechnologie GmbH, or MicroCoat, MicroCoat performs antibody coating on membrane plates using plates and antibodies we supply. Under the supply agreement, we provide rolling forecasts of our anticipated purchases and portions of those forecasts become binding orders. We receive pricing discounts based on the size of our orders. These antibody-coated plates are a component of our T-SPOT.TB test.
The agreement expires, unless earlier terminated, on December 31, 2015, subject to automatic renewals for additional one-year periods in the absence of specified notice by either party. Each party has the right to terminate in the event of a material uncured breach by the other party, or in the event of a bankruptcy or insolvency proceeding involving the other party.
StemCell Technologies, Inc. We entered into a supply agreement with StemCell Technologies, Inc., or StemCell, in 2008, which was amended in 2011. Pursuant to this agreement, StemCell supplies us with a product that can be used in performing an assay with our T-SPOT.TB test.
We have the exclusive right to market this product for use in association with ELISPOT tests to detect and/or quantify T-cells for use in the in vitro diagnosis, prognosis and/or clinical monitoring of infectious diseases (including tuberculosis) and non-infectious diseases and medical conditions, except our rights in China and India are non-exclusive. StemCell retains the right to sell this product for use in other applications and in our non-exclusive territories. We are obligated to use commercially reasonable efforts to promote sales of the product for the applications to which we have exclusive rights.
We paid a signing fee in the amount of $0.1 million and milestone payments in the aggregate amount of $0.2 million. We are not obligated to make additional milestone payments. We are obligated to pay an annual exclusivity fee during the term of the agreement, creditable against certain future purchases. The aggregate amount of exclusivity fees due under the agreement is, absent early termination, $1.8 million. Our product purchases exceeded the amount of the exclusivity fee in 2013 and we expect we will continue to exceed this minimum. We receive pricing discounts based on our quarterly orders. We have also agreed to make StemCell our supplier of choice for certain types of products, subject to performance obligations of StemCell, and we are generally obligated to acquire all of our requirements for such products from StemCell.
The agreement expires, unless earlier terminated, on January 30, 2018, but will continue indefinitely thereafter in the absence of specified notice by either party. Each party may terminate for material uncured breach, the insolvency or bankruptcy of the other party or the cessation of trading by or dissolution of the other party. If we terminate the agreement for other reasons prior to January 30, 2018, we may be obligated to pay a termination fee of up to $0.5 million to the extent that we have not previously made other payments for the signing fee, milestone payments and actual product purchases in excess of this amount. Based on our payments to date, we do not expect to incur any termination fee if we terminate the agreement.
Life Technologies Corporation. We entered into a supply and reseller agreement with Life Technologies Corporation, or Life Tech, in 2013, pursuant to which we purchase and resell a product that can be used in performing an assay with our T-SPOT.TB test. We have minimum annual purchase obligations under this agreement, as well as obligations to purchase certain amounts based on our forecasts. The agreement expires, unless earlier terminated, on January 1, 2017. Either party may terminate for a material uncured breach, the insolvency or bankruptcy of the other party, if one of our twelve-month forecasts does not reflect any anticipated purchases of product or if we purchase no product during a consecutive twelve-month period.
Key customer relationships
Shanghai Fosun Long March Medical Science Co. Ltd. We have a distribution agreement with Shanghai Fosun Long March Medical Science Co. Ltd., or Fosun, pursuant to which Fosun distributes our products in China. Under the distribution agreement, Fosun serves as our exclusive distributor in a territory consisting of the People’s Republic of China, including Macau Special Administrative Regions, and also serves as our non-exclusive distributor in Hong Kong. Fosun commits to using its best efforts to promote, sell and distribute our products in the territory in compliance with our policies and procedures and applicable law. The agreement imposes certain annual minimum purchase obligations at agreed upon pricing and covers our products, as well as other accessories which may be used in conjunction with our products. Fosun is obligated to refrain from dealing in any products in the territory which would be competitive with ours through a period extending 12 months after the termination of the agreement.
The agreement expires on January 1, 2021. Either party may terminate the agreement for a material uncured breach or in the event of bankruptcy or an equivalent winding up of the other party’s business. We may terminate the agreement if Fosun does not meet the minimum purchase requirements, for late payment or if Fosun undergoes a change in control.
Riken Genesis Co., Ltd. We sell our T-SPOT.TB test to a Japanese importer, Riken Genesis Co., Ltd., or Riken, which also serves as our marketing authorization holder in Japan, a position required by Japanese regulatory authorities. We entered into a marketing authorization holder agreement with Riken in 2011 and it was amended in 2013. Pursuant to this agreement, Riken provides services for importation into Japan. We paid an initiation fee to Riken in the amount of ¥200,000, or approximately $2,000. We pay Riken a flat monthly fee in the amount of ¥150,000, or approximately $1,500, and also pay a single-digit commission based on the prices at which end users purchase our products. The initial agreement with Riken had a one-year term and automatically renews for additional one-year periods in the absence of specified notice by either party. Either party may terminate for a material uncured breach or in the event of bankruptcy, insolvency or similar proceedings of the other party.
Competitive tests and our advantages
Our T-SPOT.TB test competes primarily with the TST. In the United States, there are two brands of PPD for the TST: Aplisol® (manufactured by JHP Pharmaceuticals, Inc.)3 and Tubersol® (manufactured by Sanofi Pasteur Limited)4. Outside the United States, we believe the dominant brand worldwide is Tuberculin PPD RT 23 SSI (manufactured by the Statens Serum Institut, Denmark).
Other than the TST, our principal competitor is the QuantiFERON®5-TB Gold In-Tube test, or QFN. As this test also measures interferon-gamma release, QFN is, like our own test, sometimes referred to generically as an IGRA.
We have been competing with QFN, or prior versions of this test, since the inception of our company. Based on our experience, we believe that we have several performance advantages over QFN, including:
|
• |
In our pivotal clinical trials conducted in the United States, our T-SPOT.TB test was shown to be unaffected by immune-suppression. The U.S. package insert for the QFN test notes that QFN has not been extensively evaluated in immunosuppressed populations and that indeterminate results may be related to immunosuppressed status of the patient. We believe this is an important differentiating factor in patient populations with weakened immune systems, such as those on biologic therapies, corticosteroid or other immunosuppressive treatments, those with HIV and those undergoing dialysis or organ transplantation. |
|
• |
In the FDA pivotal trials in the United States, our T-SPOT.TB test was shown to have clinical sensitivity exceeding 95%. In the clinical trials for QFN reported in its U.S. package insert, that test was shown to have overall sensitivity of 89%. We believe this allows us to differentiate our test based on accuracy. |
|
• |
Our test requires only a single tube of blood collected in a ubiquitous heparin blood tube. In contrast, QFN requires the use of three specialist antigen-coated blood collection tubes, either at the time of the blood draw or later. We believe this gives us a reliability and simplicity advantage. |
|
• |
By using the T-Cell Xtend reagent with our T-SPOT.TB test, we have up to 32 hours to get a blood sample to a processing laboratory, as compared with QFN where blood must be incubated within 16 hours. We believe this significant time advantage gives our test greater flexibility over blood collection windows, as the processing of the blood is less time critical. Our test also allows for the overnight shipment of blood samples without imposing additional processing steps on the customer. |
In addition to the performance advantages we believe we have over QFN, we have developed and implemented the ability to offer our test as a service in the United States and the United Kingdom. The advantages of offering our test as a service include:
|
• |
We are in direct contact with the individuals and organizations ordering our test via our ODL service offering. We believe this level of direct engagement provides us market insights and marketing opportunities not available to the manufacturer of QFN. |
|
• |
Our test’s availability is not limited by whether or not a suitable laboratory exists local to the customer. As a result, we believe we can offer testing with more convenient access times to a more diverse set of customers. |
|
• |
We offer our customers access to our laboratory service seven days a week. |
|
• |
We offer a rapid and consistent test turnaround time, which we believe is typically faster than that offered by other laboratories running QFN. |
|
• |
Our ODL customers require minimal set-up and training in order to access the test because our service allows our customers to package the test samples in our pre-paid shipper boxes. This development reduces on-boarding time and maximizes simplicity for the customer. |
|
• |
We are well positioned to offer additional services to our customers over and above providing a test result. We believe that this advantage allows us the ability to generate additional revenue and increase switching costs for customers. |
3 Aplisol is a registered trademark of JHP Pharmaceuticals Inc.
4 Tubersol is a registered trademark of Sanofi Pasteur Limited.
5 QuantiFERON is a registered trademark of Qiagen N.V.
As a result of clinical and service advantages, we have been able to negotiate a higher average selling price for our service than when selling test kits. We believe this advantage provides us a larger addressable market than is available through selling QFN kits, as our revenue potential from the same testing volume is higher. We believe that this will also enable us to achieve a higher absolute profit per test. However, to the extent that national and regional laboratories offer QFN as a service, we may also face competition from them in our service offering.
The benchmark reimbursement for our T-SPOT.TB test is higher than for QFN in the United States, with CMS reimbursement of $102 per test for CPT code 86481 as opposed to CMS reimbursement of $85 per test for CPT code 86480. We believe that this higher reimbursement provides us with pricing and access advantages in certain segments of the U.S. market.
Government regulation
Federal Food, Drug, and Cosmetic Act
In the United States, in vitro diagnostics are regulated by the FDA as medical devices under the Federal Food, Drug, and Cosmetic Act, or FDCA.
Marketing pathways
There are two regulatory pathways to receive authorization to market in vitro diagnostic devices, or IVDs: a 510(k) premarket notification and a PMA. The FDCA establishes a risk-based standards for determination the pathway for which a particular IVD device is eligible.
The information that must be submitted to the FDA in order to obtain clearance or approval to market a new medical device varies depending on how the medical device is classified by the FDA. Medical devices are classified into one of three classes on the basis of the controls necessary to reasonably ensure their safety and effectiveness. Class I devices are subject to general controls, including labeling and adherence to the FDA’s quality system regulation, which establishes device-specific good manufacturing practices. Class II devices are subject to general controls and special controls, including performance standards and post-market surveillance. Class III devices are subject to these requirements as well as to premarket approval. Most Class I devices are exempt from premarket submissions to the FDA; most Class II devices require the submission of a 510(k) premarket notification to the FDA; and Class III devices require submission of a PMA application. Our T-SPOT.TB test is a Class III device.
Premarket approval. The PMA process, by which we received marketing authorization for our T-SPOT.TB test in 2008, is complex, costly and time consuming. A PMA application must be supported by detailed and comprehensive scientific evidence, including clinical data, to demonstrate the safety and efficacy of the medical device for its intended purpose. If the device is determined to present a “significant risk,” the sponsor may not begin a clinical trial until it submits an investigational device exemption, or IDE, to the FDA and obtains approval from the FDA to begin the trial. After the PMA application is submitted, the FDA has 45 days to make a threshold determination that the application is sufficiently complete to permit a substantive review. If the application is complete, the FDA will accept it for filing. The FDA is subject to a non-binding performance goal review time for a PMA application of 180 days from the date of filing, although in practice this review time is often longer. Questions from the FDA, requests for additional data and referrals to advisory committees may delay the process considerably. Indeed, the total process may take several years and there is no guarantee that the PMA application will ever be approved. Even if approved, the FDA may limit the indications for which the device may be marketed. The FDA may also request additional clinical data as a condition of approval or after the PMA is issued. Any changes to the medical device may require a supplemental PMA application to be submitted and approved. Since we received initial PMA application approval of our T-SPOT.TB test in 2008, the FDA has granted approval for ten supplemental PMA applications for our T-SPOT.TB test, including supplements relating to the use of our T-Cell Xtend reagent with our T-SPOT.TB test.
Post-marketing regulations and controls
Under the medical device regulations, the FDA regulates quality control and manufacturing procedures by requiring us to demonstrate and maintain compliance with the quality system regulation, which sets forth the FDA’s current good manufacturing practices requirements for medical devices. The FDA monitors compliance with the quality system regulation and current good manufacturing practices requirements by conducting periodic inspections of manufacturing facilities. FDA inspections in the United States are typically unannounced. FDA inspections outside the United States are coordinated with the companies being inspected. Violations of applicable regulations noted by the FDA during inspections of our manufacturing facilities could adversely affect the continued marketing of our tests.
The FDA also enforces post-marketing controls that include the requirement to submit medical device reports to the agency when a manufacturer becomes aware of information suggesting that any of its marketed products may have caused or contributed to a death, serious injury or serious illness or any of its products has malfunctioned and that a recurrence of a malfunction would likely cause or contribute to a death or serious injury or illness. The FDA relies on medical device reports to identify product problems and utilizes these reports to determine, among other things, whether it should exercise its enforcement powers. The FDA also enforces the requirement that manufacturers submit reports of recalls and field actions to the FDA if the actions are initiated to reduce a risk to health posed by the device or to remedy a violation of the FDCA that may present a risk to health. The FDA may also require post-market surveillance studies for specified devices.
FDA regulations also govern, among other things, the preclinical and clinical testing, manufacture, distribution, labeling and promotion of medical devices. In addition to compliance with good manufacturing practices and medical device reporting requirements, we are required to comply with the FDCA’s general controls, including establishment registration, device listing and labeling requirements. If we fail to comply with any requirements under the FDCA, we could be subject to, among other things, fines, injunctions, civil penalties, recalls or product corrections, total or partial suspension of production, denial of premarket notification clearance or approval of products, rescission or withdrawal of clearances and approvals, and criminal prosecution. We cannot assure you that any final FDA policy, once issued, or future laws and regulations concerning the manufacture or marketing of medical devices will not increase the cost and time to market of new or existing tests. If we fail to comply with these FDA regulations or guidelines, we may be subject to warnings from, or enforcement action by, the FDA.
International medical device regulations
International marketing of medical devices is subject to foreign government regulations, which vary substantially from country to country. The European Commission is the legislative body responsible for directives with which manufacturers selling medical products in the European Union and the European Economic Area, or EEA, must comply. The European Union includes most of the major countries in Europe, while other countries, such as Switzerland, are part of the EEA and have voluntarily adopted laws and regulations that mirror those of the European Union with respect to medical devices. The European Union has adopted directives that address regulation of the design, manufacture, labeling, clinical studies and post-market vigilance for medical devices, including IVDs. Devices that comply with the requirements of a relevant directive, including the IVD Directive (Directive 98/79 EC), will be entitled to bear the CE conformity marking, indicating that the device conforms to the essential requirements of the applicable directives and, accordingly, can be marketed throughout the European Union and EEA.
Outside of the European Union, regulatory pathways for the marketing of medical devices vary greatly from country to country. In many countries, local regulatory agencies conduct an independent review of IVD medical devices prior to granting marketing approval. For example, in China, approval by the SFDA, must be obtained prior to marketing an IVD medical device. In Japan, approval by the MHLW following review by the Pharmaceuticals and Medical Devices Agency, or the PMDA is required prior to marketing an IVD. The process in such countries may be lengthy and require the expenditure of significant resources, including the conduct of clinical trials. In other countries, the regulatory pathway may be shorter and/or less costly. The timeline for the introduction of new IVD medical devices is heavily impacted by these various regulations on a country-by-country basis, which may become more lengthy and costly over time.
Our T-SPOT.TB test has been approved for sale in over 50 countries, including in Europe, China, and Japan. Our T-SPOT.TB test obtained a CE mark in 2004, SFDA approval in China in 2010 and MHLW approval in Japan in 2012.
In China, regulatory authorization for the marketing of medical devices must be periodically renewed. We are currently in the process of re-registration of our T-SPOT.TB test in China and expect to secure renewed marketing approval before our current authorization expires at the end of August 2014.
Laboratory certification, accreditation and licensing
As a company engaged in the diagnostic testing business, we are required to maintain certain federal and state licenses, certificates and permits.
United States. In the United States, Clinical Laboratories Improvement Amendments of 1988, or CLIA, imposes requirements relating to test processes, personnel qualifications, facilities and equipment, record keeping, quality assurance and participation in proficiency testing, which involves comparing the results of tests on specimens that have been specifically prepared for our laboratory to the known results of the specimens. The CLIA requirements also apply as a condition for participation by clinical laboratories under the Medicare program. Under the CLIA regulations, the complexity of the tests performed determines the level of regulatory control. United States Department of Health and Human Services, or HHS, classifies our T-SPOT.TB test as a high-complexity test. As a result, we must employ more experienced and highly educated personnel, as well as additional categories of employees.
HHS, or an organization to which HHS delegates authority, verifies compliance with CLIA standards through periodic on-site inspections. Sanctions for failure to meet these certification, accreditation and licensure requirements include suspension or revocation of the certification, accreditation or license, as well as imposition of plans to correct deficiencies, injunctive actions and civil and criminal penalties. If HHS should remove or suspend our CLIA certificate, we would be forced to cease performing testing at our laboratory in Memphis, Tennessee.
We are also accredited by the College of American Pathologists, or CAP. The CAP Laboratory Accreditation Program is an internationally recognized program that utilizes teams of practicing laboratory professionals as inspectors, and accreditation by CAP can often be used to meet CLIA and state certification requirements.
United Kingdom. Our laboratory located in the United Kingdom operates under accreditation by the United Kingdom Accreditation Service, or UKAS, for the International Standard: ISO 17025:2005 (General requirements for the competence of testing and calibration laboratories). Compliance with this standard is required to maintain accreditation and the continued use of the UKAS logo on our laboratory documentation. National Health Service (NHS)-based customers require that the testing services they procure operate to an accredited quality management system, which is evidenced by the UKAS accreditation. Therefore, a failure to maintain this accreditation could cause us to lose a substantial majority of our U.K. service business.
HIPAA and other privacy laws
U.S. Health Insurance Portability and Accountability Act, or HIPAA, established for the first time in the United States comprehensive protection for the privacy and security of health information. The HIPAA standards apply to three types of organizations, or Covered Entities: health plans, healthcare clearing houses, and healthcare providers that conduct certain healthcare transactions electronically. Covered Entities and their Business Associates, as defined in HIPAA, must have in place administrative, physical, and technical standards to guard against the misuse of individually identifiable health information. Because we are a healthcare provider and we conduct certain healthcare transactions electronically, we are currently a Covered Entity, and we must have in place the administrative, physical, and technical safeguards required by HIPAA, the Health Information Technology for Economic and Clinical Health Act, or HITECH, and their implementing regulations. Additionally, some state laws impose privacy protections more stringent than HIPAA. We may conduct other activities that may implicate HIPAA, such as conducting clinical studies or entering into specific kinds of relationships with a Covered Entity or a Business Associate of a Covered Entity.
If we or our operations are found to be in violation of HIPAA, HITECH or their implementing regulations, we may be subject to penalties, including civil and criminal penalties, fines, and exclusion from participation in U.S. federal or state health care programs, and the curtailment or restructuring of our operations. HITECH increased the civil and criminal penalties that may be imposed against Covered Entities, their Business Associates and possibly other persons, and gave state attorneys general new authority to file civil actions for damages or injunctions in federal courts to enforce the federal HIPAA laws and seek attorney’s fees and costs associated with pursuing federal civil actions.
Our activities must also comply with other applicable privacy laws. For example, there are also international privacy laws that impose restrictions on the access, use, and disclosure of health information. All of these laws may impact our business. Our failure to comply with these privacy laws or significant changes in the laws could significantly impact our business and our future plans.
U.S. federal and state billing and fraud and abuse laws
Although only a small portion of our U.S. diagnostics business currently involves payment by third-party payors, including government payors, we are subject to numerous laws governing billing for health care services.
Antifraud laws / overpayments. As participants in federal and state healthcare programs, we are subject to numerous federal and state anti-fraud and abuse laws. Prohibitions under some of these laws include:
|
• |
the submission of false claims or false information to government programs; |
|
• |
deceptive or fraudulent conduct; |
|
• |
excessive or unnecessary services or services at excessive prices; and |
|
• |
defrauding private sector health insurers. |
We could be subject to substantial penalties for violations of these laws, including denial of payment, obligation to issue refunds, suspension of payments from Medicare, Medicaid or other federal healthcare programs and exclusion from participation in the federal healthcare programs, as well as civil and criminal penalties and imprisonment. One of these statutes, the False Claims Act, is a key enforcement tool used by the government to combat healthcare fraud.
Numerous federal and state agencies enforce anti-fraud and abuse laws. In addition, private insurers may bring private actions. In some circumstances, private whistleblowers are authorized to bring fraud suits on behalf of the government against providers and are entitled to receive a portion of any final recovery.
U.S. federal and state “anti-kickback” and “self-referral” restrictions
Anti-kickback statute. The federal Anti-Kickback Statute prohibits persons from knowingly and willfully soliciting, receiving, offering or paying remuneration, directly or indirectly, to induce either the referral of an individual, or the furnishing, recommending, or arranging for a good or service, for which payment may be made under a federal healthcare program, such as the Medicare and Medicaid programs. The term “remuneration” is not defined in the federal Anti-Kickback Statute and has been broadly interpreted to include anything of value, including for example, gifts, discounts, the furnishing of supplies or equipment, credit arrangements, payments of cash, waivers of payment, ownership interests and providing anything at less than its fair market value.
Many states have also adopted laws similar to the federal Anti-Kickback Statute, some of which apply to the referral of patients for healthcare items or services reimbursed by any source, not only the Medicare and Medicaid programs, and do not contain identical safe harbors.
If we or our operations are found to be in violation of any of the laws described above or any other governmental regulations that apply to us, we may be subject to penalties, including civil and criminal penalties, damages, fines, exclusion from participation in U.S. federal or state health care programs, and the curtailment or restructuring of our operations. We may also be subject to similar foreign laws and regulations.
Self-referral law. We are subject to a federal “self-referral” law, commonly referred to as the “Stark” law, which provides, unless a specific exception applies, that physicians who, personally or through a family member, have ownership interests in or compensation arrangements with a laboratory are prohibited from making a referral to that laboratory for laboratory tests reimbursable by Medicare, and also prohibits laboratories from submitting a claim for Medicare payments for laboratory tests referred by physicians who, personally or through a family member, have ownership interests in or compensation arrangements with the testing laboratory.
We are subject to comparable state laws, some of which apply to all payors regardless of source of payment, and do not contain identical exceptions to the Stark law. The self-referral laws may cause some physicians who would otherwise use our laboratory to use other laboratories for their testing. Providers are subject to sanctions for claims submitted for each service that is furnished based on a referral prohibited under the federal self-referral laws. These sanctions include denial of payment, obligation to issue refunds, civil monetary payments and exclusion from participation in federal healthcare programs and civil monetary penalties. They may also include penalties for applicable violations of the False Claims Act, which may require payment of up to three times the actual damages sustained by the government, plus civil penalties of up to $5,500 to $11,000 for each separate false claim.
U.S. health care reform
In March 2010, the Patient Protection and Affordable Care Act of 2010, as amended by the Healthcare and Education Affordability Reconciliation Act of 2010, or the PPACA, was enacted, which includes measures that have or will significantly change the way healthcare is financed by both governmental and private insurers. The Physician Payment Sunshine Act, enacted as part of PPACA, and its implementing regulations require medical device manufacturers to track certain financial arrangements with physicians and teaching hospitals, including any “transfer of value” made or distributed to such entities, as well as any investment interests held by physicians and their immediate family members. Manufacturers are required to report this information to CMS. Various states have also implemented regulations prohibiting certain financial interactions with healthcare professionals and/or mandating public disclosure of such financial interactions. We may incur significant costs to comply with such laws and regulations now or in the future.
Other laws
We are also subject to numerous U.S. federal, state and local laws as well as international laws relating to such matters as safe working conditions, manufacturing practices, environmental protection, fire hazard control, and transportation and disposal of blood and hazardous or potentially hazardous substances. We may incur significant costs to comply with such laws and regulations now or in the future.
Employees
As of December 31, 2013, we had 157 employees. None of our employees is represented by a labor union. However, we have one employee in Belgium covered under a collective bargaining agreement. We have not experienced any work stoppages and we believe our employee relations are good.
Environmental matters
Our operations require the use of hazardous materials, which, among other matters, subjects us to a variety of federal, state, local and foreign environmental, health and safety laws, regulations and permitting requirements, including those relating to the handling, storage, transportation and disposal of biological and hazardous materials and wastes. The primary hazardous materials we handle or use include human blood samples and solvents. Some of the regulations under the current regulatory structure provide for strict liability, holding a party liable for contamination at currently and formerly owned, leased and operated sites and at third-party sites without regard to fault or negligence. We could be held liable for damages and fines as a result of our, or others’, operations or activities should contamination of the environment or individual exposure to hazardous substances occur. We could also be subject to significant fines for failure to comply with applicable environmental, health and safety requirements. We cannot predict how changes in laws or development of new regulations will affect our business operations or the cost of compliance.
Available Information
Access to our Annual Report on Form 10-K, Quarterly Reports on Form 10-Q, Current Reports on Form 8-K, and amendments to these reports filed with or furnished to the Securities and Exchange Commission, or SEC, may be obtained through the investor section of our website at www.oxfordimmunotec.com as soon as reasonably practical after we electronically file or furnish these reports. We do not charge for access to and viewing of these reports. Information in the investor section and on our website is not part of this Annual Report on Form 10-K or any of our other securities filings unless specifically incorporated herein by reference. In addition, the public may read and copy any materials that we file with the SEC at the SEC’s Public Reference Room at 100 F Street, NE, Washington, D.C. 20549. The public may obtain information on the operation of the Public Reference Room by calling the SEC at 1-800-SEC-0330. Also, our filings with the SEC may be accessed through the SEC’s website at www.sec.gov. All statements made in any of our securities filings, including all forward-looking statements or information, are made as of the date of the document in which the statement is included, and we do not assume or undertake any obligation to update any of those statements or documents unless we are required to do so by law.
Corporate information
Oxford Immunotec Global PLC was incorporated in England and Wales in 2013. On October 2, 2013, we completed a scheme of arrangement under the laws of England and Wales, or the Scheme of Arrangement, pursuant to which equity holders exchanged their equity interests in Oxford Immunotec Limited for equity interests in Oxford Immunotec Global PLC. Prior to the Scheme of Arrangement, our business was conducted by Oxford Immunotec Limited and its consolidated subsidiaries. Oxford Immunotec Limited, a private limited company, was incorporated in England and Wales in 2002. Following the Scheme of Arrangement, our business has been conducted by Oxford Immunotec Global PLC and its consolidated subsidiaries, including Oxford Immunotec Limited. Our principal executive offices are located at 94C Innovation Drive, Milton Park, Abingdon, OX14 4RZ, United Kingdom, and our telephone number is +44 (0) 1235 442 780. Our internet website is www.oxfordimmunotec.com. The information on, or that can be accessed through, our website is not part of this Annual Report on Form 10-K.
Item 1A. Risk Factors
Risks related to our business.
We have a history of losses and anticipate that we will incur continued losses for at least the next few years. We cannot be certain that we will achieve or sustain profitability.
We were founded in 2002 and to date we have engaged primarily in development, clinical testing and marketing of our T-SPOT.TB test. We have never been profitable. For the fiscal years ended December 31, 2013, 2012, and 2011, we had net losses of $8.7 million, $14.9 million, and $13.1 million, respectively, and we had an accumulated deficit at December 31, 2013 of $99.7 million. Substantially all of our operating losses in these periods resulted from costs incurred in connection with sales and marketing of our T-SPOT.TB test, general and administrative costs associated with our operations and our research and development programs. Additionally, as a result of our anticipated future significant expenses relating to expansion of our sales and marketing capabilities, further commercialization of our T-SPOT.TB test, and research and development, we expect to continue to incur significant operating losses for at least the next few years, even though we generate revenue from our T-SPOT.TB test. Because of the numerous risks and uncertainties associated with developing and commercializing diagnostic products, we are unable to predict the magnitude of these future losses. Our historic losses, combined with expected future losses, have had and will continue to have an adverse effect on our cash resources, shareholders’ deficit and working capital. We expect our research and development expenses to be substantial for at least the next few years as we work to develop other product candidates based on our T-SPOT technology.
Our ability to become profitable depends upon our ability to generate revenue. In 2004, we began to generate revenue from the sale and marketing of our T-SPOT.TB test, but we may not be able to generate sufficient revenue to attain profitability. Our ability to generate profits on sales of our T-SPOT.TB test is subject to market acceptance in market segments we currently serve as well as in new market segments and new geographies. In addition, we may be compelled to sell our T-SPOT.TB test at lower prices if, for example, our customers or prospective customers are unwilling to pay for our tests at current pricing levels or as a result of increased competition generally. Any price erosion would impede our ability to generate revenue. If we are unable to generate sufficient revenue, we will not become profitable and may be unable to continue operations without continued funding.
We are currently a single-product company that is heavily dependent on the successful further commercialization of our T-SPOT.TB test and, if we encounter delays or difficulties in the further commercialization of this product, our business could be harmed.
Our success is heavily dependent upon the successful further commercialization of our T-SPOT.TB test. Our business could be materially harmed if we encounter difficulties in the further commercialization of this product, including, among others: failure to achieve sufficient market acceptance by hospitals and public health departments as well as physicians, third-party payors and others in the medical community; the inability to compete with other diagnostic methods, including the TST; the inability to maintain and expand our sales, marketing and distribution networks; the inability to manage anticipated growth; the inability to obtain and/or maintain necessary regulatory approvals; and the inability to effectively protect our intellectual property.
The commercial success of our T-SPOT.TB test will depend upon the degree of market acceptance by hospitals and public health departments, as well as physicians and others in the medical community.
Our T-SPOT.TB test may not gain sufficient market acceptance by hospitals and public health departments. If this product does not achieve an adequate level of acceptance by such customer groups, we may not generate enough revenue to become profitable. The degree of market acceptance of our T-SPOT.TB test will depend on a number of factors, including:
|
• |
clinical guidelines relative to the screening for, and diagnosis and monitoring of, TB infection; |
|
• |
the efficacy and potential advantages of our T-SPOT.TB test over alternative tests; |
|
• |
the willingness of our target customers to accept and adopt our T-SPOT.TB test; |
|
• |
the ability to offer attractive pricing for our T-SPOT.TB test; |
|
• |
the strength of marketing and distribution support and the timing of market introduction of competitive products; and |
|
• |
outcomes from clinical studies and other publicity concerning our T-SPOT.TB test or competing products. |
Our efforts to educate physicians and other members of the medical community on the benefits of our T-SPOT.TB test may require significant resources and may never be successful. Such efforts to educate the marketplace may require more resources than are required by conventional technologies marketed by our competitors. In particular, continuing to gain market acceptance for our T-SPOT.TB test in nascent markets could be challenging. In certain markets, including, for example, Japan and China, our potential for future growth is difficult to forecast. If we were to incorrectly forecast our ability to penetrate these markets, expenditures that we make may not result in the benefits that we expect, which could harm our results of operations. Moreover, in the event that our T-SPOT.TB test is the subject of guidelines, clinical studies or scientific publications that are unhelpful or damaging, or otherwise call into question the benefits of our T-SPOT.TB test, we may have difficulty in convincing prospective customers to adopt our test.
The success of our T-SPOT.TB test depends on the continued demand for diagnostic products for tuberculosis.
Even if we achieve market acceptance, our success will depend on continued demand for diagnostic products for tuberculosis. Tuberculosis screening policies could change such that tests are conducted less frequently or in fewer instances. For example, healthcare institutions facing increased cost control requirements could determine to reduce employee testing. In addition, various institutions or governing bodies may decide that the incidence of TB has dropped sufficiently within their screening population so as to permit reduced testing (e.g., U.S. military guidelines were recently updated such that testing may now be required in fewer instances than under previous guidelines). If there are widespread testing policy changes that substantially reduce testing in the markets we serve, our business could be materially and adversely affected.
New market opportunities may not develop as quickly as we expect, limiting our ability to market and sell our T-SPOT.TB test successfully.
We intend to take steps to increase the presence of our T-SPOT.TB test in new markets both in the United States and outside the United States. We believe these opportunities will take substantial time to develop or mature and we cannot be certain that these market opportunities will develop as we expect. The future growth and success of our T-SPOT.TB test in these markets depends on many factors beyond our control, including recognition and acceptance by the scientific community in that market and the prevalence and costs of competing methods of tuberculosis screening. If the markets for our T-SPOT.TB test do not develop as we expect, our business may be adversely affected.
Our T-SPOT.TB test competes with other diagnostic testing methods that may be more widely accepted than our test, and may compete with new diagnostic tests that may be developed by others in the future, which could impair our ability to maintain and grow our business and remain competitive.
The clinical diagnostics market is highly competitive, and we must be able to compete effectively against existing and future competitors in order to be successful. In selling our T-SPOT.TB test, we compete primarily with existing diagnostic technologies, particularly the TST, which is widely used as a test for diagnosing tuberculosis. In addition, we compete with QFN which, like our T-SPOT.TB test, employs an interferon-gamma release assay, or IGRA, method for diagnosing tuberculosis. If we are unable to differentiate our diagnostic tests from those of our competitors, our business may be materially and adversely affected. In addition, improvements in these technologies or the development of new technologies for diagnosing tuberculosis and the introduction of products that compete with our T-SPOT.TB test could adversely impact our ability to sell our T-SPOT.TB test or the sales price of the test. This could impact our ability to market our test and/or secure a distribution partner, both of which could have a substantial impact on the value of our T-SPOT.TB test.
We also face competition in the development, manufacture, marketing and commercialization of diagnostic products from a variety of other sources, such as academic institutions, government agencies, research institutions and other life sciences companies. These competitors are working to develop and market other diagnostic tests, systems, products and other methods of detecting, preventing or reducing tuberculosis.
Among the many experimental diagnostics being developed around the world, there may be diagnostics unknown to us that may compete with our T-SPOT.TB test. Many of our potential competitors have much greater capital resources, manufacturing, research and development resources and production facilities than we do. Competitors with greater resources may be able to offer tests and/or services at prices at which we are unable to compete and more quickly develop improvements than we are. Many of them may also have more experience than we have in preclinical testing and clinical trials of new diagnostic tests.
In our service offering, we also may face competition from commercial laboratories, including large national and regional laboratories, which may be able to offer access to TB testing. These laboratories may have perceived advantages over our solution, including phlebotomy services, established payor relationships and dedicated courier services. For example, as we seek to further penetrate the physicians’ office segment of the U.S. market, we may find that physicians have established relationships with commercial laboratories that offer physicians additional services, such as phlebotomy, and a wider range of available laboratory tests that a physician may choose to order in addition to a TB test. Further, some commercial laboratories may be able to offer their services at lower cost to physicians’ patients due to the reimbursement arrangements these laboratories may have established with third-party payors. These factors may make it difficult for us to convince physicians to use our test and service offering.
The markets for our T-SPOT.TB test are subject to changing technology, new product introductions and product enhancements, and evolving industry standards. The introduction or enhancement of products embodying new technology or the emergence of new industry standards could render existing products obsolete or result in short product life cycles or our inability to sell our T-SPOT.TB test without offering a significant discount.
If we are unable to maintain and expand our network of direct sales representatives and independent distributors, we may not be able to generate anticipated sales.
We have limited experience marketing and selling our T-SPOT.TB test. Our operating results are directly dependent upon the sales and marketing efforts of not only our employees, but also our independent distributors. We expect our direct sales representatives and independent distributors to develop long-lasting relationships with the providers they serve. If our direct sales representatives or independent distributors fail to adequately promote, market and sell our product, our sales could significantly decrease.
We face significant challenges and risks in managing our geographically dispersed sales and distribution network and retaining the individuals who make up that network. If a substantial number of our direct sales representatives were to leave us within a short period of time, or if a substantial number of our independent distributors were to cease to do business with us within a short period of time, our sales could be adversely affected. If any significant independent distributor were to cease to distribute our product, our sales could be adversely affected. In such a situation, we may need to seek alternative independent distributors or increase our reliance on our direct sales representatives, which may not prevent our sales from being adversely affected. If a direct sales representative or independent distributor were to depart and be retained by one of our competitors, we may be unable to prevent them from helping competitors solicit business from our existing customers, which could further adversely affect our sales. Because of the intense competition for their services, we may be unable to recruit additional qualified independent distributors or to hire additional qualified direct sales representatives to work with us. We may also not be able to enter into agreements with them on favorable or commercially reasonable terms, if at all. Failure to hire or retain qualified direct sales representatives or independent distributors would prevent us from expanding our business and generating sales. See “—Certain of our customers account for a significant portion of our revenue.”
As we launch new products and increase our sales, marketing and distribution efforts with respect to our T-SPOT.TB test, we will need to expand the reach of our sales, marketing and distribution networks. Our future success will depend largely on our ability to continue to hire, train, retain and motivate skilled direct sales representatives and independent distributors with significant technical knowledge in various areas. New hires require training and take time to achieve full productivity. If we fail to train new hires adequately, or if we experience high turnover in our sales force in the future, we cannot be certain that new hires will become as productive as may be necessary to maintain or increase our sales.
If we are unable to expand our sales and marketing capabilities domestically and internationally, we may not be able to effectively commercialize our product, which would adversely affect our business, results of operations and financial condition.
Health insurers and other third-party payors may decide not to cover, or may discontinue reimbursing, our T-SPOT.TB test or any other diagnostic tests we may develop in the future, or may provide inadequate reimbursement, which could jeopardize our ability to expand our business.
Although for many of our current customers, including those in the hospital and public health segments, the cost of screening their employees for tuberculosis is not reimbursable, our business is somewhat impacted, and in the future may be more greatly impacted, by the level of reimbursement from third-party payors. In the United States, the regulatory process allows diagnostic tests to be marketed regardless of any coverage determinations made by payors. For new diagnostic tests, each third-party payor makes its own decision about which tests it will cover, how much it will pay and whether it will continue reimbursing the test. Clinicians may order diagnostic tests that are not reimbursed by third-party payors if the patient is willing to pay for the test without reimbursement, but coverage determinations and reimbursement levels and conditions are important to the commercial success of a diagnostic product.
CMS establishes reimbursement payment levels and coverage rules for Medicare. CMS currently covers our T-SPOT.TB test. If CMS were to place significant restrictions on the use of our tests, reduce payment amounts or eliminate coverage altogether, our ability to generate revenue from our diagnostic tests could be limited. For example, payment for diagnostic tests furnished to Medicare beneficiaries is made based on a fee schedule set by CMS. Payments under these fee schedules have decreased in recent years and may decrease further in the future.
In addition, state Medicaid plans and private commercial payors establish rates and coverage rules independently. As a result, the coverage determination process is often a time-consuming and costly process that requires us to provide scientific and clinical support for the use of our tests to each payor separately, with no assurance that coverage or adequate reimbursement will be obtained. Even if one or more third-party payors decides to reimburse for our tests, that payor may reduce utilization or stop or lower payment at any time, which could reduce our revenue. We cannot predict whether or when third-party payors will cover our tests or offer adequate reimbursement to make them commercially attractive. Clinicians may decide not to order our tests if inadequate third-party payments result in additional costs to the patient.
We are also subject to foreign reimbursement schemes in the international markets we serve, including Germany, Switzerland, France and Japan. Decisions by health insurers or other third-party payors in these markets not to cover, or to discontinue reimbursing could materially and adversely affect our business.
Billing complexities associated with obtaining payment or reimbursement for our tests may negatively affect our revenue, cash flow and profitability.
Although third-party payors accounted for only 4% of our total revenue for the year ended December 31, 2013, we currently rely in part, and may in the future more heavily rely, on obtaining third-party payment or reimbursement for our test. Billing for diagnostic tests is complex. We or our customers receive payment from individual patients and from a variety of payors, such as commercial insurance carriers, including managed care organizations and governmental programs, primarily Medicare and Medicaid in the United States. Each payor typically has different billing requirements, and the billing requirements of many payors have become increasingly stringent.
Among the factors complicating our billing of, and obtaining payment through, third-party payors are:
|
• |
disputes among payors as to which party is responsible for payment; |
|
• |
disparity in coverage among various payors; |
|
• |
disparity in information and billing requirements among payors; |
|
• |
incorrect or missing billing information, which is required to be provided by the ordering physician; and |
|
• |
payments may be sent directly to patients rather than to us. |
These billing complexities, and the related uncertainty in obtaining payment for our tests, could negatively affect our revenue, cash flow and profitability.
If we do not achieve, sustain or successfully manage our anticipated growth, our business and growth prospects may be harmed.
We have experienced significant revenue growth in a relatively short period of time. We may not achieve similar growth rates in future periods. Investors should not rely on our operating results for any prior periods as an indication of our future operating performance. If we are unable to maintain adequate revenue growth, our financial results could suffer and our share price could decline. Furthermore, growth will place significant strains on our management and our internal systems and processes, as well as potentially those of our suppliers.
Further development and commercialization of our T-SPOT.TB test and other diagnostic product candidates will require us to expand our sales, marketing and distribution networks. If we cannot effectively manage our expanding operations and our costs, we may not be able to continue to grow or we may grow at a slower pace and our business could be adversely affected.
We depend upon a limited number of suppliers, and certain components of our product may only be available from a sole source or limited number of suppliers.
Our T-SPOT.TB test is generally assembled by us from supplies we obtain from a limited number of suppliers. Critical components required to assemble our tests may only be available from a sole or limited number of component suppliers. For example, we source key components of our T-SPOT.TB test from EMD Millipore Corporation, Stemcell Technologies Inc., Mabtech AB, MicroCoat Biotechnologie GmbH and Life Technologies Corporation, any of whom would be difficult to replace. Even if the key components that we source are available from other parties, the time and effort involved in obtaining any necessary regulatory approvals for substitutes could impede our ability to replace such components timely or at all. The loss of a sole or key supplier would impair our ability to deliver products to our customers in a timely manner and would adversely affect our sales and operating results and negatively impact our reputation. Our business would also be harmed if any of our suppliers could not meet our quality and performance specifications and quantity and delivery requirements.
Certain of our customers account for a significant portion of our revenue.
We sell our T-SPOT.TB test through a direct sales force in the United States, certain European countries and Japan. In Japan, while we maintain end-user relationships through our direct sales force, we sell through a single importer of record, Riken. In other parts of the world, we sell through distributors. For example, in China, we sell through a single distributor, Fosun. For the year ended December 31, 2013, sales to Fosun and through Riken together accounted for 28% of our total revenue, with Fosun accounting for 16%. In the event that either of these customers or any other significant customer substantially reduces its purchases of our products, particularly if this occurs without adequate advance notice to enable us to secure alternate importation or distribution arrangements, our results of operations could be materially and adversely affected.
We or our suppliers may experience development or manufacturing problems or delays that could limit the growth of our revenue or increase our losses.
We may encounter unforeseen situations in the manufacture and assembly of our T-SPOT.TB test that would result in delays or shortfalls in our production. Our suppliers may also face similar delays or shortfalls. In addition, our or our suppliers’ production processes and assembly methods may have to change to accommodate any significant future expansion of our manufacturing capacity, which may increase our or our suppliers’ manufacturing costs, delay production of our product, reduce our product margin and adversely impact our business. If we are unable to keep up with demand for our product by successfully manufacturing and shipping our product in a timely manner, our revenue could be impaired, market acceptance for our product could be adversely affected and our customers might instead purchase our competitors’ products. In addition, developing manufacturing procedures for new products would require developing specific production processes for those products. Developing such processes could be time consuming, and any unexpected difficulty in doing so can delay the introduction of a product.
We currently perform our tests for our service offering exclusively in one laboratory facility in the United States and one laboratory in the United Kingdom. If these or any future facilities or our equipment were damaged or destroyed, or if we experience a significant disruption in our operations for any reason, our ability to continue to operate our business could be materially harmed.
We currently perform our T-SPOT.TB test for our service offering in the United States exclusively in a single laboratory facility in Memphis, Tennessee, and in the United Kingdom exclusively in a single laboratory facility in Abingdon, England. If these or any future facilities were to be damaged, destroyed or otherwise unable to operate, whether due to fire, floods, hurricanes, storms, tornadoes, other natural disasters, employee malfeasance, terrorist acts, power outages, or otherwise, or if performance of our laboratories is disrupted for any other reason, we may not be able to perform our tests or generate test reports as promptly as our customers expect, or possibly not at all. Building or finding a replacement facility could be difficult, expensive and time consuming and any new laboratory would need to satisfy the various certification, accreditation and licensing requirements to which our current laboratory facilities are subject, including, for example, CLIA requirements in the United States. If we are unable to perform our tests or generate test reports within a timeframe that meets our customers’ expectations, our business, financial results and reputation could be materially harmed.
As of December 31, 2013, we maintain insurance coverage totaling $6.5 million against damage to our property and equipment and an additional $22 million to cover business interruption and research and development restoration expenses, subject to deductibles and other limitations. If we have underestimated our insurance needs with respect to an interruption, or if an interruption is not subject to coverage under our insurance policies, we may not be able to cover our losses. Even if we cover our losses, our business, financial results and reputation could be materially harmed.
We may require substantial additional resources to fund our operations. We may not be able to obtain additional capital resources on favorable terms and if we cannot find additional capital resources, we may have difficulty operating our business. Raising additional capital may also cause dilution to our existing shareholders.
As of December 31, 2013, we had cash and cash equivalents of $76.5 million and working capital of $77.9 million. We believe we have sufficient resources to fund our projected operations for at least the next few years. However, changing circumstances may cause us to consume capital significantly faster or slower than we currently anticipate. We have based these estimates on assumptions that may prove to be wrong, and we could exhaust our available financial resources sooner than we currently anticipate. In order to fund our strategic plans, we may need to enter into a strategic collaboration or raise additional capital. We may seek to raise additional capital through the issuance of equity or debt securities in the public or private markets, or through a collaborative arrangement or sale of assets. Additional financing opportunities may not be available to us, or if available, may not be on favorable terms. Further, to the extent that we raise additional capital through the sale of equity or convertible debt securities, the ownership interest of our shareholders will be diluted, and the terms may include liquidation or other preferences that adversely affect the rights of our shareholders. Our future capital requirements will depend on many factors, including revenue generated from the sale of our T-SPOT.TB test, margins, operating expenses and our ability to control costs associated with our operations, and the costs of filing, prosecuting, maintaining, defending and enforcing any patent claims and other intellectual property rights. The availability of additional capital will also depend on many factors, including the market price of our ordinary shares and the availability and cost of additional equity capital from existing and potential new investors, our ability to retain the listing of our ordinary shares on The NASDAQ Global Market and general economic and industry conditions affecting the availability and cost of capital.
Debt financing, if available, may involve agreements that include covenants limiting or restricting our ability to take specific actions such as incurring additional debt, making capital expenditures or declaring dividends. If we raise additional funds through collaboration, strategic alliance and licensing arrangements with third parties, we may have to relinquish valuable rights to our technologies or product candidates beyond the rights we have already relinquished, or grant licenses on terms that are not favorable to us.
Failure in our information technology or storage systems could significantly disrupt our operations and our research and development efforts, which could adversely impact our revenue, as well as our research, development and commercialization efforts.
Our ability to execute our business strategy depends, in part, on the continued and uninterrupted performance of our information technology, or IT, systems, which support our operations, including our LIS, our billing system, and our customer interfaces. Due to the sophisticated nature of the technology we use in our laboratories and our complex billing procedures, we are substantially dependent on our IT systems. IT systems are vulnerable to damage from a variety of sources, including telecommunications or network failures, malicious human acts and natural disasters. Moreover, despite network security and back-up measures, some of our servers are potentially vulnerable to physical or electronic break-ins, computer viruses and similar disruptive problems. Despite the precautionary measures we have taken to prevent unanticipated problems that could affect our IT systems, sustained or repeated system failures that interrupt our ability to generate and maintain data, and in particular to operate our LIS and billing system, could adversely affect our ability to operate our business. Any interruption in the operation of our LIS or billing system, due to IT system failures, part failures or potential disruptions in the event we are required to relocate our IT systems within our facility or to another facility could have an adverse effect on our operations.
We rely on courier delivery services to transport samples to our facilities for testing. If these delivery services are disrupted, our business and customer satisfaction could be negatively impacted.
Customers in the United States and the United Kingdom ship samples to us by air and ground express courier delivery service for testing in our Memphis, Tennessee and Abingdon, England facilities. If we suffer from disruptions in delivery service, whether due to bad weather, natural disaster, terrorist acts or threats, or for other reasons, we may be unable to provide timely services to customers or at all. As a result, such disruptions could materially and adversely affect our financial results and our reputation.
Because our business relies heavily on international operations and revenue, changes in currency exchange rates and our need to convert currencies may negatively affect our financial condition and results of operations.
Our business relies heavily on our operations outside the United States. For the year ended December 31, 2013, 55% of our total revenue was derived from sales outside the United States. Because we currently operate in three major regions of the world (the United States, Europe and rest of world, or Europe & ROW, and Asia), our revenue is denominated in multiple currencies. Sales in the United States are denominated in U.S. Dollars. Sales in China are denominated in U.S. Dollars and sales in Japan are denominated in Yen but, in each case, these sales are made by our U.K.-based legal entity where the Pound Sterling is the functional currency. As a result, these sales are subject to remeasurement into Pounds Sterling and then translation into U.S. Dollars when we consolidate our financial statements. Sales in Europe are denominated primarily in the Pound Sterling and Euro. As we grow Europe & ROW sales outside the United Kingdom and the European Union countries whose national currency is the Euro, or the Euro Zone, we will be subject to exchange rate risk from additional currencies. As a result, our exchange rate exposure may change over time as our business practices evolve and could result in increased costs or reduced revenue and could affect our actual cash flow. Changes in the relative values of currencies occur regularly and, in some instances, may have a significant impact on our operating results. We cannot predict with any certainty changes in currency exchange rates or the degree to which we can effectively mitigate these risks.
Our future success depends on our ability to successfully develop, obtain clearance or approval for and commercialize new products.
Our future success partially depends on our ability to successfully develop and market new products. Our ability to develop any of these products is dependent on a number of factors, including funding availability to complete development efforts, our ability to develop products that adequately detect or measure the targeted function, condition or disease, our ability to secure required FDA or other regulatory clearance or approval and our ability to obtain licenses to necessary third-party intellectual property. We may encounter problems in the development phase for our products, which can result in substantial setbacks and delays or abandonment of further work on the potential product. There can be no assurance that we will not encounter such setbacks with the products in our pipeline, or that funding from outside sources and our revenue will be sufficient to bring any future product to the point of commercialization.
Even if we are successful in developing new products and securing regulatory approval to market them, we may not be able to achieve marketplace acceptance for our new products or generate significant revenue from their sale. As with our current T-SPOT.TB test, the success of any future products will depend upon the degree of market acceptance by physicians, hospitals, third-party payors and others in the medical community. Achieving market acceptance will require us to expend substantial time and resources to educate physicians and other members of the medical community on the benefits of any new product we develop and we may never be successful in gaining market acceptance of our new products. There can be no assurance that the products we seek to develop will work effectively in the marketplace, or that we will be able to produce them on an economical basis.
We may seek to grow our business through acquisitions of or investments in new or complementary businesses, products or technologies, and the failure to manage acquisitions or investments, or the failure to integrate them with our existing business, could have a material adverse effect on us.
From time to time we expect to consider opportunities to acquire or make investments in other technologies, products and businesses that may enhance our capabilities, complement our current products or expand the breadth of our product offerings, markets or customer base. Potential and completed acquisitions and strategic investments involve numerous risks, including:
|
• |
problems assimilating the purchased technologies, products or business operations; |
|
• |
issues maintaining uniform standards, procedures, controls and policies; |
|
• |
unanticipated costs associated with acquisitions; |
|
• |
diversion of management’s attention from our core business; |
|
• |
adverse effects on existing business relationships with suppliers and customers; |
|
• |
risks associated with entering new markets in which we have limited or no experience; |
|
• |
potential loss of key employees of acquired businesses; and |
|
• |
increased legal and accounting compliance costs. |
Any acquisitions we undertake could be expensive and time consuming, and may disrupt our ongoing business and prevent management from focusing on our operations. If we are unable to manage acquisitions or investments, or integrate any acquired businesses, products or technologies effectively, our business, results of operations and financial condition may be materially adversely affected.
Our business could suffer if we lose the services of, or are unable to attract and retain, key members of our senior management, key advisors or other personnel.
We are dependent upon the continued services of key members of our senior management and a limited number of key advisors and personnel. In particular, we are highly dependent on the skills and leadership of our Chief Executive Officer, Dr. Peter Wrighton-Smith, and the other members of management named in the “Management” section elsewhere in this Annual Report. The loss of any one of these individuals could disrupt our operations or our strategic plans. Additionally, our future success will depend on, among other things, our ability to continue to hire and retain the necessary qualified scientific, technical, sales, marketing and managerial personnel, for whom we compete with numerous other companies, academic institutions and organizations. The loss of members of our management team, key advisors or personnel, or our inability to attract or retain other qualified personnel or advisors, could have a material adverse effect on our business, results of operations and financial condition. Although all members of our senior management team have entered into agreements that restrict their ability to compete with us for a period of time after the end of their employment, we may be unable to enforce such restrictive covenants at all or for a sufficient duration of time to prevent members of our management team from competing with us.
Our ability to use net operating losses to offset future taxable income may be subject to substantial limitations.
As of December 31, 2013, our available U.S. federal net operating losses, or NOLs, totaled $49.7 million and U.S. state loss carryforwards totaled $45.1 million. The amount of these NOLs remains subject to review and possible adjustment by the Internal Revenue Service and state revenue authorities, as applicable. NOLs may become subject to an annual limitation if there is a cumulative change in the ownership interest of significant shareholders (or certain shareholder groups) over a three-year period in excess of 50%, in accordance with rules established under Section 382 of the Internal Revenue Code of 1986, as amended, or the Code, and similar state rules (we refer to each as an ownership change). Such an ownership change could limit the amount of historic NOLs that can be utilized annually to offset future taxable income. The amount of this annual limitation is determined based on the value of the Company immediately prior to the ownership change. We have completed several financings since our inception, as well as our IPO of our shares, that may have resulted in one or more ownership changes under this definition. If we are deemed to have undergone an ownership change by virtue of these transactions, we may not be able to utilize a material portion of our NOLs even if we attain profitability. Future changes in our share ownership, some of which are outside of our control, could result in additional ownership changes for purposes of these rules. We are unable to predict future ownership changes or the way an ownership change could limit the use of our NOLs.
Risks related to regulatory and other legal issues.
If we fail to comply with extensive regulations of domestic and international regulatory authorities, sales of our T-SPOT.TB test in new markets and the development and commercialization of any new product candidates could be delayed or prevented.
Our T-SPOT.TB test is, and any new product candidates will be, subject to extensive government regulations related to development, testing, manufacturing and commercialization in the United States and other countries before we can sell in these markets. The process of obtaining and complying with FDA and other governmental regulatory approvals and regulations is costly, time consuming, uncertain and subject to unanticipated delays. Securing regulatory approval for a new product, in the United States and many other countries, typically requires several years. Despite the time and expense exerted, regulatory approval is never guaranteed. We may not be able to obtain FDA or other required regulatory approval and market any further products we may develop during the time we anticipate, or at all. We also are subject to the following risks and obligations, among others:
|
• |
regulators may refuse to approve an application if they believe that applicable regulatory criteria are not satisfied; |
|
• |
regulators may require additional testing for safety and effectiveness; |
|
• |
regulators may interpret data from clinical studies in different ways than we interpret them; |
|
• |
if regulatory approval of a product is granted, the approval may be limited to specific indications or limited with respect to its distribution; and |
|
• |
regulators may change their approval policies and/or adopt new regulations that affect our ability to secure approvals for new products, which would decrease the chance we would be able to commercialize new diagnostic tests. |
In addition, some international jurisdictions, such as China where we are currently involved in the re-registration process, require periodic recertification. Even if we obtain initial certifications from regulatory bodies, we may lose certification after a periodic review. Failure to maintain requisite certifications from regulatory bodies would adversely affect our ability to generate future revenue and operating income.
If we or our suppliers fail to comply with ongoing regulatory requirements, or if we experience unanticipated problems with our products, these products could be subject to restrictions or withdrawal from the market.
Any product for which we obtain marketing approval in the United States or in international jurisdictions, along with the manufacturing processes, post-approval clinical data and promotional activities for such product, will be subject to continual review and periodic inspections by the FDA and other regulatory bodies. Furthermore, our suppliers may be subject to similar regulatory oversight, and may not currently be or may not continue to be in compliance with applicable regulatory requirements. Failure by us or one of our suppliers to comply with statutes and regulations administered by the FDA and other regulatory bodies, or failure to take adequate action in response to any observations, could result in, among other things, any of the following enforcement actions:
|
• |
warning letters or untitled letters; |
|
• |
fines and civil penalties; |
| • | unanticipated expenditures for corrective actions; |
|
• |
delays in approving, or refusal to approve, our products; |
|
• |
withdrawal or suspension of approval by the FDA or other regulatory bodies; |
|
• |
product recall or seizures; |
|
• |
interruption of production; |
|
• |
operating restrictions; |
|
• |
injunctions; and |
|
• |
criminal penalties. |
If any of these actions were to occur, it could harm our reputation and could cause our product sales and profitability to suffer.
Any regulatory approval of a product may also be subject to limitations on the indicated uses for which the product may be marketed. If the FDA or another regulatory body determines that our promotional materials, training or other activities constitute promotion of an unapproved use, it could request that we cease or modify our training or promotional materials or subject us to regulatory enforcement actions. It is also possible that other federal, state or foreign enforcement authorities might take action if they consider our training or promotional materials to constitute promotion of an unapproved use, which could result in significant fines or penalties under applicable statutory authorities, such as laws prohibiting false claims for reimbursement.
Additionally, we may be required to conduct costly post-market testing, and we will be required to report adverse events and malfunctions related to our products. Later discovery of previously unknown problems with our products, including unanticipated adverse events or adverse events of unanticipated severity or frequency, manufacturing problems, or failure to comply with regulatory requirements may result in restrictions on such products or manufacturing processes, withdrawal of the products from the market, voluntary or mandatory recalls, fines, suspension of regulatory approvals, product seizures, injunctions or the imposition of civil or criminal penalties.
Furthermore, the FDA and various other authorities will inspect our facilities and those of our suppliers from time to time to determine whether we are in compliance with regulations relating to the manufacture of diagnostic products, including regulations concerning design, manufacture, testing, quality control, product labeling, distribution, promotion and record-keeping practices. A determination that we are in material violation of such regulations could lead to the imposition of civil penalties, including fines, product recalls, product seizures or, in extreme cases, criminal sanctions.
If we are unable to comply with the requirements of CLIA and state laws governing clinical laboratories or if we are required to expend significant additional resources to comply with these requirements, the success of our business could be threatened.
HHS has classified our T-SPOT.TB test as a high-complexity test under CLIA. Under CLIA, personnel requirements for laboratories conducting high-complexity tests are more stringent than those applicable to laboratories performing less complex tests. As a result of these personnel requirements, we must employ more experienced or more highly educated personnel and additional categories of employees, which increases our operating costs. If we fail to meet CLIA requirements, HHS or state agencies could require us to cease our T-SPOT.TB testing or other testing subject to CLIA that we may develop in the future. Continued compliance with CLIA requirements may cause us to incur significant expenses and potentially lose revenue in doing so. Moreover, new interpretations of current regulations or future changes in regulations under CLIA may make it difficult or impossible for us to comply with our CLIA classification, which would significantly harm our business.
Many states in which our physician and laboratory clients are located, such as New York, have laws and regulations governing clinical laboratories that are more stringent than federal law and may apply to us even if we are not located, and do not perform our T-SPOT.TB test, in that state. We may also be subject to additional licensing requirements as we expand our sales and operations into new geographic areas, which could impair our ability to pursue our growth strategy.
We may potentially be subject to product liability claims.
The testing, manufacturing and marketing of medical diagnostic tests such as our T-SPOT.TB test entail an inherent risk of product liability claims. Further, providing clinical testing services entails a risk of claims for errors or omissions made by our laboratory staff. Potential liability claims may exceed the amount of our insurance coverage or may be excluded from coverage under the terms of the policy. As of December 31, 2013, we had product liability insurance of $16.1 million. Our existing insurance will have to be increased in the future if we are successful at introducing new diagnostic products and this will increase our costs. Under certain of our customer and license agreements, we have agreed to provide indemnification for product liability claims arising out of the use of our T-SPOT.TB test. In the event that we are held liable for a claim or for damages exceeding the limits of our insurance coverage, we may be required to make substantial payments.
Regardless of merit or eventual outcome, liability claims may result in:
|
• |
decreased demand for our product and product candidates; |
|
• |
injury to our reputation; |
|
• |
costs of related litigation; |
|
• |
substantial monetary awards to patients and others; |
|
• |
loss of revenue; and |
|
• |
the inability to commercialize our products and product candidates. |
Any of these outcomes may have an adverse effect on our consolidated results of operations, financial condition and cash flows, and may increase the volatility of our share price.
Our inadvertent or unintentional failure to comply with the complex government regulations concerning privacy of medical records could subject us to fines and adversely affect our reputation.
The U.S. federal privacy regulations limit use or disclosure of protected health information, without written patient authorization, to purposes of payment, treatment or healthcare operations (as defined under HIPAA) except for disclosures for various public policy purposes and other permitted purposes outlined in the privacy regulations. The privacy regulations provide for significant fines and other penalties for wrongful use or disclosure of protected health information, including potential civil and criminal fines and penalties.
We have policies and practices that we believe make us compliant with the privacy regulations. Nevertheless, the documentation and process requirements of the privacy regulations are complex and subject to interpretation. Failure to comply with the privacy regulations could subject us to sanctions or penalties, loss of business and negative publicity.
The HIPAA privacy regulations establish a “floor” of minimum protection for patients as to their medical information and do not supersede state laws that are more stringent. Therefore, we are required to comply with both HIPAA privacy regulations and various state privacy laws. Although the HIPAA statute and regulations do not expressly provide for a private right of action, we could incur damages under state laws to private parties for the wrongful use or disclosure of confidential health information or other private personal information. Internationally, virtually every jurisdiction in which we operate has established its own data security and privacy legal framework with which we or our customers must comply, including the Data Protection Directive established in the European Union. We may also need to comply with varying and possibly conflicting privacy laws and regulations in other jurisdictions. As a result, we could face regulatory actions, including significant fines or penalties, adverse publicity and possible loss of business.
We maintain sensitive data on our computer networks, including certain personal information regarding our customers. We may face threats to our networks from unauthorized access, security breaches and other system disruptions. Despite our security measures, our infrastructure may be vulnerable to attacks by hackers or other disruptive problems. Any such security breach may compromise information stored on our networks and may result in significant data losses or theft of our customers’ personally identifiable information. A cybersecurity breach could hurt our reputation by adversely affecting the perception of customers and potential customers of the security of their orders and personal information. In addition, a cybersecurity attack could result in other negative consequences, including disruption of our internal operations, increased cyber security protection costs, lost revenue, regulatory actions or litigation.
Our use of biological and hazardous materials and wastes requires us to comply with regulatory requirements, including environmental, health and safety laws, regulations and permitting requirements and subjects us to significant costs and exposes us to potential liabilities.
The handling of materials used in the diagnostic testing process involves the controlled use of biological and hazardous materials and wastes. The primary hazardous materials we handle or use include human blood samples and solvents. Our business and facilities and those of our suppliers are subject to federal, state, local and foreign laws and regulations relating to the protection of human health and the environment, including those governing the use, manufacture, storage, handling and disposal of, and exposure to, such materials and wastes. In addition, under some environmental laws and regulations, we could be held responsible for costs relating to any contamination at our past or present facilities and at third-party waste disposal sites even if such contamination was not caused by us. A failure to comply with current or future environmental laws and regulations, including the failure to obtain, maintain or comply with any required permits, could result in severe fines or penalties. Any such expenses or liability could have a significant negative impact on our business, results of operations and financial condition. In addition, we may be required to incur significant costs to comply with regulatory requirements in the future.
Our relationships with customers and third-party payors will be subject to applicable anti-kickback, fraud and abuse and other healthcare laws and regulations, which could expose us to criminal sanctions, civil penalties, contractual damages, reputational harm and diminished profits and future earnings.
Healthcare providers, physicians and third-party payors play a primary role in the recommendation and ordering of any product candidates, including our T-SPOT.TB test, for which we obtain marketing approval. Our arrangements with third-party payors and customers may expose us to broadly applicable fraud and abuse and other healthcare laws and regulations that may constrain the business or financial arrangements and relationships through which we market, sell and distribute our product. Restrictions under applicable federal and state healthcare laws and regulations include the following:
|
• |
The U.S. federal healthcare anti-kickback statute prohibits, among other things, persons from knowingly and willfully soliciting, offering, receiving or providing remuneration, directly or indirectly, in cash or in kind, to induce or reward either the referral of an individual for, or the purchase, order or recommendation of, any good or service, for which payment may be made under federally funded healthcare programs such as Medicare and Medicaid. This statute has been broadly interpreted to apply to manufacturer arrangements with prescribers, purchasers and formulary managers, among others. Several other countries, including the United Kingdom, have enacted similar anti-kickback, fraud and abuse, and healthcare laws and regulations. |
|
• |
The U.S. federal False Claims Act imposes criminal and civil penalties against individuals or entities for knowingly presenting, or causing to be presented, to the federal government, claims for payment that are false or fraudulent or making a false statement to avoid, decrease or conceal an obligation to pay money to the federal government. |
|
• |
HIPAA imposes criminal and civil liability for executing a scheme to defraud any healthcare benefit program and also imposes obligations, including mandatory contractual terms, with respect to safeguarding the privacy, security and transmission of individually identifiable health information. HIPAA also imposes criminal liability for knowingly and willfully falsifying, concealing or covering up a material fact or making any materially false statement in connection with the delivery of or payment for healthcare benefits, items or services. |
|
• |
The federal Physician Payment Sunshine Act requirements under the PPACA require manufacturers of drugs, devices, biologics and medical supplies to report to HHS information related to payments and other transfers of value made to or at the request of covered recipients, such as physicians and teaching hospitals, and physician ownership and investment interests in such manufacturers. Payments made to physicians and research institutions for clinical trials are included within the ambit of this law. Certain state laws and regulations also require the reporting of certain items of value provided to health care professionals. |
|
• |
Analogous state laws and regulations, such as state anti-kickback and false claims laws, may apply to sales or marketing arrangements and claims involving healthcare items or services reimbursed by non-governmental third-party payors, including private insurers. |
Efforts to ensure that our business arrangements with third parties will comply with applicable healthcare laws and regulations involve substantial costs. We may be subject to qui tam litigation brought by private individuals on behalf of the government under the U.S. False Claims Act, which would include claims for up to treble damages. Additionally, it is possible that governmental authorities will conclude that our business practices may not comply with current or future statutes, regulations or case law involving applicable fraud and abuse or other healthcare laws and regulations. If our operations are found to be in violation of any of these laws or any other governmental regulations that may apply to us, we may be subject to significant civil, criminal and administrative penalties, damages, fines, exclusion from government funded healthcare programs, such as Medicare and Medicaid, and the curtailment or restructuring of our operations. Exclusion, suspension and debarment from government funded healthcare programs would significantly impact our ability to commercialize, sell or distribute any product. If any of the physicians or other providers or entities with whom we expect to do business are found to be not in compliance with applicable laws, they may be subject to criminal, civil or administrative sanctions, including exclusions from government funded healthcare programs.
We are subject to the U.K. Bribery Act, the U.S. Foreign Corrupt Practices Act and other anti-corruption laws, as well as export control laws, customs laws, sanctions laws and other laws governing our operations. If we fail to comply with these laws, we could be subject to civil or criminal penalties, other remedial measures, and legal expenses, which could adversely affect our business, results of operations and financial condition.
Our operations are subject to anti-corruption laws, including the U.K. Bribery Act 2010, or Bribery Act, the U.S. Foreign Corrupt Practices Act, or FCPA, and other anti-corruption laws that apply in countries where we do business. The Bribery Act, FCPA and these other laws generally prohibit us and our employees and intermediaries from bribing, being bribed or making other prohibited payments to government officials or other persons to obtain or retain business or gain some other business advantage. We and our commercial partners operate in a number of jurisdictions that pose a high risk of potential Bribery Act or FCPA violations, and we participate in collaborations and relationships with third parties whose actions could potentially subject us to liability under the Bribery Act, FCPA or local anti-corruption laws. In addition, we cannot predict the nature, scope or effect of future regulatory requirements to which our international operations might be subject or the manner in which existing laws might be administered or interpreted.
We are also subject to other laws and regulations governing our international operations, including regulations administered by the governments of the United Kingdom and the United States, and authorities in the European Union, including applicable export control regulations, economic sanctions on countries and persons, customs requirements and currency exchange regulations, collectively referred to as the Trade Control laws.
There is no assurance that we will be completely effective in ensuring our compliance with all applicable anti-corruption laws, including the Bribery Act, the FCPA or other legal requirements, including Trade Control laws. If we are not in compliance with the Bribery Act, the FCPA and other anti-corruption laws or Trade Control laws, we may be subject to criminal and civil penalties, disgorgement and other sanctions and remedial measures, and legal expenses, which could have an adverse impact on our business, financial condition, results of operations and liquidity. Likewise, any investigation of any potential violations of the Bribery Act, the FCPA, other anti-corruption laws or Trade Control laws by U.K., U.S. or other authorities could also have an adverse impact on our reputation, our business, results of operations and financial condition.
Healthcare reform measures could hinder or prevent the commercial success of our diagnostic tests.
In March 2010, President Obama signed into law a legislative overhaul of the U.S. healthcare system, the PPACA, which may have far-reaching consequences for most healthcare companies, including diagnostic companies like us. For example, if reimbursement for our diagnostic tests is substantially less than we or our clinical laboratory customers expect, our business could be materially and adversely impacted.
Regardless of the impact of the PPACA on us, the U.S. government and other governments have shown significant interest in pursuing healthcare reform and reducing healthcare costs. Any government-adopted reform measures could cause significant pressure on the pricing of healthcare products and services, including our T-SPOT.TB test, in the United States and internationally, as well as the amount of reimbursement available from governmental agencies and other third-party payors.
Risks related to our intellectual property.
We may be unable to protect or obtain proprietary rights that we utilize or intend to utilize.
In developing, manufacturing and using our T-SPOT.TB test, we employ a variety of proprietary and patented technologies, including technologies we license from third parties. We have licensed, and expect to continue to license, various other technologies and methods. We cannot provide any assurance that the intellectual property rights that we own or license provide protection from competitive threats or that we would prevail in any challenge mounted to our intellectual property rights. In addition, we cannot provide any assurances that we will be successful in obtaining and retaining licenses or proprietary or patented technologies in the future.
We are unable to predict whether any of our currently pending or future patent applications will result in issued patents, or how long it may take for such patents to be issued. Further, we cannot predict whether other parties will challenge any patents issued or licensed to us or that courts or administrative agencies will hold our patents or the patents we license to be valid and enforceable. We may not be successful in defending challenges made against our patents and patent applications. Any successful third-party challenge to our patents could result in the unenforceability or invalidity of such patents. Both the patent application process and the process of managing patent disputes can be time consuming and expensive.
The patent positions of life sciences companies can be highly uncertain and involve complex legal and factual questions for which important legal principles remain unresolved. No consistent policy regarding the breadth of claims allowed in such companies’ patents has emerged to date in the United States. Furthermore, in the biotechnology field, courts frequently render opinions that may affect the patentability of certain inventions or discoveries and the patent positions of companies engaged in development and commercialization of certain diagnostic tests. Various courts, including the U.S. Supreme Court, have recently rendered decisions that impact the scope of patentability of certain inventions or discoveries relating to genomic diagnostics. These decisions generally stand for the proposition that inventions that recite laws of nature are not themselves patentable unless they have sufficient additional features that provide practical assurance that the processes are genuine inventive applications of those laws rather than patent drafting efforts designed to monopolize the law of nature itself. What constitutes a “sufficient” additional feature is uncertain. While we do not generally rely on gene sequence patents, this evolving case law in the United States may adversely impact our ability to obtain new patents and may facilitate third-party challenges to our existing owned and licensed patents.
Changes in either the patent laws or in interpretations of patent laws in the United States or other countries may diminish the value of our intellectual property rights. We cannot predict the breadth of claims that may be allowed or enforced in patents we own or in those to which we have license rights. For example:
|
• |
the inventor might not have been the first to make the inventions covered by patents we rely on; |
|
• |
the inventor or his assignee might not have been the first to file patent applications for the claimed inventions; |
|
• |
others may independently develop similar or alternative products and technologies or duplicate our product and technologies; |
|
• |
it is possible that the patents we own or license may not provide us with any competitive advantages, or may be challenged and invalidated by third parties; |
|
• |
any patents we obtain or license may expire before, or shortly after, the products and services relating to such patents are commercialized; |
|
• |
we may not develop additional proprietary products and technologies that are patentable; and |
|
• |
the patents of others may have an adverse effect on our business. |
In particular, in September 2011, the U.S. Congress passed the Leahy-Smith America Invents Act, or the AIA, which became effective in March 2013. The AIA reforms U.S. patent law in part by changing the standard for patent approval for certain patents from a “first to invent” standard to a “first to file” standard and developing a post-grant review system. It is too early to determine what the effect or impact the AIA will have on the operation of our business and the protection and enforcement of our intellectual property. However, the AIA and its implementation could increase the uncertainties and costs surrounding the prosecution of our patent applications and the enforcement or defense of our issued patents, all of which could have a material adverse effect on our business and financial condition.
Some patent applications in the United States may be maintained in secrecy until the patents are issued, other patent applications in the United States and many foreign jurisdictions are not published until eighteen months after filing, and publications in the scientific literature often lag behind actual discoveries. We therefore cannot be certain that others have not filed patent applications for technology covered by issued patents or pending applications that we own or license or that we or our licensors, as applicable, were the first to invent the technology (pre-AIA) or first to file (post-AIA). Our competitors may have filed, and may in the future file, patent applications covering technology similar or the same as ours. Any such patent application may have priority over patent applications that we own or license and could further require us to obtain rights to such technologies in order to carry on our business. If another party has filed a U.S. patent application on inventions similar or the same as those that we own or license, we or our licensors may have to participate in an interference or other proceeding in the U.S. Patent and Trademark Office, or PTO, or a court to determine priority of invention in the United States, for pre-AIA applications and patents. For post-AIA applications and patents, we or our licensors may have to participate in a derivation proceeding to resolve disputes relating to inventorship. The costs of these proceedings could be substantial, and it is possible that such efforts would be unsuccessful, resulting in a loss of our U.S. patent position with respect to such inventions.
Some of our competitors may be able to sustain the costs of complex patent disputes and litigation more effectively than we can because they have substantially greater resources. In addition, any uncertainties resulting from the initiation and continuation of any disputes or litigation could have a material adverse effect on our ability to raise the funds necessary to continue our operations.
In addition to pursuing patents on our technology, we seek to protect our intellectual property and proprietary technology by entering into intellectual property assignment agreements with our employees, consultants and third party collaborators. See “—We may be unable to adequately prevent disclosure of trade secrets and other proprietary information.”
Our intellectual property rights may not be sufficient to protect our competitive position and to prevent others from manufacturing, using or selling competing products.
The scope of our owned and licensed intellectual property rights may not be sufficient to prevent others from manufacturing, using or selling competing tests. For example, our intellectual property position depends in part on intellectual property that we license from third parties. However, many of the key patents we license are expected to expire by 2020. In addition, while many of the licenses we have been granted are exclusive, such rights may be limited to a narrowly defined field of use. As a result, our competitors may have obtained or be able to obtain a license to the same intellectual property in a closely related field of use. Finally, we have also granted sublicenses to third parties under certain of the intellectual property that we license. Such sublicenses may allow third parties or their licensees to market a TB test that would otherwise infringe upon such intellectual property.
Moreover, competitors could purchase our product and attempt to replicate some or all of the competitive advantages we derive from our development efforts, willfully infringe our intellectual property rights, design around our protected technology or develop their own competitive technologies that fall outside of our intellectual property rights. If our intellectual property is not adequately protected so as to protect our market against competitors’ products and methods, our competitive position could be adversely affected, as could our business.
We depend on certain technologies that are licensed or sublicensed to us. We do not control these technologies and any loss of our rights to them could prevent us from selling our product.
We rely on licenses in order to be able to use various proprietary technologies that are material to our business. For example, we licensed technology relating to the use of the ELISPOT technique, which forms part of the core platform of our T.SPOT technology, from Isis Innovation Limited, and we license the use of other patents to protect our T-SPOT.TB product from the Statens Serum Institut and Rutgers. While the patents that we licensed from Isis have been assigned to us, we still have certain obligations to Isis, including an obligation to pay royalties. See “Business—Intellectual property— Our license and assignment agreements.” Otherwise, we do not own the patents that underlie these licenses. Our rights to use these technologies and employ the inventions claimed in the licensed patents are subject to the continuation of and our compliance with the terms of those licenses.
In some cases, we do not control the prosecution, maintenance or filing of the patents to which we hold licenses. Enforcement of our licensed patents or defense of any claims asserting the invalidity of these patents is often subject to the control or cooperation of our licensors. We cannot be certain that our licensors will prosecute, maintain, enforce and defend the licensed patent rights in a manner consistent with the best interests of our business. We also cannot be certain that drafting or prosecution of the licensed patents and patent applications by the licensors have been or will be conducted in compliance with applicable laws and regulations, will result in valid and enforceable patents and other intellectual property rights, or that any issued patents or patents that may issue in the future will provide any competitive advantage.
Certain of our licenses contain provisions that allow the licensor to terminate the license upon specific conditions. Our rights under each of the licenses are subject to our continued compliance with the terms of the license, including certain diligence, disclosure and confidentiality obligations and the payment of royalties and other fees. If we were found to be in breach of any of our license agreements, in certain circumstances our licensors may take action against us, including termination of the applicable license. Because of the complexity of our product and the patents we have licensed, determining the scope of the license and related obligations can be difficult and can lead to disputes between us and the licensor. An unfavorable resolution of such a dispute could lead to an increase in the royalties payable pursuant to the license or termination of the license. If a licensor believed we were not paying the royalties due under the license or were otherwise not in compliance with the terms of the license, the licensor may have the right to terminate the license or, in certain circumstances, to convert an exclusive license to a non-exclusive one. If such an event were to occur, the value of our product or product candidates could be materially adversely affected, we might be barred from producing and selling some or all of our products and may be subject to other liabilities.
In addition to the above risks, certain of our licensors do not own certain intellectual property included in the license, but instead have licensed such intellectual property from a third party, and have granted us a sub-license. As a result, the actions of our licensors or of the ultimate owners of the intellectual property may affect our rights to use our sublicensed intellectual property, even if we are in compliance with all of the obligations under our license agreements. For example, one of our licenses comprises a sublicense to us of certain patent rights owned by a third party that is not our direct licensor. If our licensors were to fail to comply with their obligations under the agreements pursuant to which they obtain the rights that are sublicensed to us, or should such agreements be terminated or amended, our ability to produce and sell our product and product candidates may be materially harmed. Finally, the legal issues surrounding the treatment of intellectual property licenses in bankruptcy proceedings are complex and may vary from jurisdiction to jurisdiction. We therefore cannot provide assurance that we would not lose some or all of our rights under a license if the applicable licensor was involved in such proceedings.
We may become involved in disputes relating to our intellectual property rights, and may need to resort to litigation in order to defend and enforce our intellectual property rights. In addition, we could face claims that our activities or the manufacture, use or sale of our products infringe the intellectual property rights of others, which could cause us to pay substantial damages or licensing fees and limit our ability to sell some or all of our products and services.
Extensive litigation regarding patents and other intellectual property rights has been common in the medical diagnostics industry. Litigation may be necessary to assert infringement claims, enforce patent rights, protect trade secrets or know-how and determine the enforceability, scope and validity of certain proprietary rights. Litigation may even be necessary to resolve disputes of inventorship or ownership of proprietary rights. The defense and prosecution of intellectual property lawsuits, PTO interference or derivation proceedings, and related legal and administrative proceedings (e.g., a reexamination) in the U.S. and internationally involve complex legal and factual questions. As a result, such proceedings are costly and time consuming to pursue, and their outcome is uncertain.
Even if we prevail in such a proceeding, the remedy we obtain may not be commercially meaningful or adequately compensate us for any damages we may have suffered. If we do not prevail in such a proceeding, our patents could potentially be declared to be invalid, unenforceable or narrowed in scope, or we could otherwise lose valuable intellectual property rights. Similar proceedings involving the intellectual property we license could also have an impact on our business. For example, the scope of one of the European patents that we license from Rutgers, The State University of New Jersey, was recently narrowed as a result of a third party opposition proceeding before the European Patent Office. The decision is currently under appeal and the outcome of that appeal may adversely affect our competitive position. Further, if any of our other owned or licensed patents are declared invalid, unenforceable or narrowed in scope, our competitive position could be adversely affected.
In addition, our research, development and commercialization activities, including our T-SPOT.TB test, may infringe or be claimed to infringe patents or other intellectual property rights owned by other parties. Certain of our competitors and other companies have substantial patent portfolios, and may attempt to use patent litigation as a means to obtain a competitive advantage or to extract licensing revenue. The risks of being involved in such litigation may also increase as we gain greater visibility as a public company and as we gain commercial acceptance of our products and move into new markets and applications for our products. For example, we are aware of an issued U.S. patent owned by a third party which claims technology that may be relevant to our T-SPOT.TB test. We believe this patent is invalid and/or unenforceable, and we therefore challenged the validity of the patent through an ex parte reexamination proceeding before the PTO. Although the validity of the patent was upheld in that proceeding, we continue to believe that the patent is invalid and/or unenforceable based in part on information we discovered after the PTO’s decision in the reexamination proceeding. Nevertheless, if the patent holder were to pursue an infringement claim against us and we were unable to either negotiate acceptable license terms or otherwise resolve the matter, we could incur substantial expense to defend a claim, we could be ordered to pay substantial damages for infringement, and we could be enjoined from future conduct that would infringe the patent, which may include the making, using and selling of our T-SPOT.TB test in the United States. There may also be patents and patent applications that are relevant to our technologies or tests that we are not aware of. For example, certain relevant patent applications may have been filed but not published. If such patents exist, or if a patent issues on any of such patent applications, that patent could be asserted against us. In addition to patent infringement claims, we may also be subject to other claims relating to the violation of intellectual property rights, such as claims that we have misappropriated trade secrets or infringed third party trademarks.
Regardless of merit or outcome, our involvement in any litigation, interference or other administrative proceedings could cause us to incur substantial expense and could significantly divert the efforts of our technical and management personnel. Any public announcements related to litigation or interference proceedings initiated or threatened against us could cause our share price to decline. An adverse determination, or any actions we take or agreements we enter into in order to resolve or avoid disputes, may subject us to the loss of our proprietary position or to significant liabilities, or require us to seek licenses that may include substantial cost and ongoing royalties. Licenses may not be available from third parties, or may not be obtainable on satisfactory terms. An adverse determination or a failure to obtain necessary licenses may restrict or prevent us from manufacturing and selling our products and offering our services. These outcomes could materially harm our business, financial condition and results of operations.
We may not be able to adequately protect our intellectual property outside of the United States.
The laws of some foreign countries do not protect intellectual property rights to the same extent as the laws of the United States, and many companies have encountered significant problems in protecting and defending such rights in foreign jurisdictions. The legal systems of certain countries, particularly certain developing countries, do not favor the enforcement of patents and other intellectual property protection, particularly those relating to biotechnology, which could make it difficult for us to stop the infringement of our licensed and owned patents. For example, we are aware that third parties, particularly in China, are currently selling TB diagnostic products that we believe are covered by certain patents we license. We do not know whether our licensor will take all necessary steps to enforce its patent rights in China or whether it will obtain effective relief to stop the sale of products that infringe on its patent rights. Proceedings to enforce our patent rights in foreign jurisdictions could result in substantial cost and divert our efforts and attention from other aspects of our business. Additionally, prosecuting and maintaining intellectual property (particularly patent) rights are very costly endeavors, and for these and other reasons we may not pursue or obtain patent protection in all major markets. We do not know whether legal and government fees will increase substantially and therefore are unable to predict whether cost may factor into our global intellectual property strategy.
In addition to the risks associated with patent rights, the laws in some foreign jurisdictions may not provide protection for our trade secrets and other intellectual property. If our trade secrets or other intellectual property are misappropriated in foreign jurisdictions, we may be without adequate remedies to address these issues. Additionally, we also rely on confidentiality and assignment of invention agreements to protect our intellectual property in foreign jurisdictions. These agreements may provide for contractual remedies in the event of misappropriation, but we do not know to what extent, if any, these agreements and any remedies for their breach, will be enforced by a foreign court. In the event our intellectual property is misappropriated or infringed upon and an adequate remedy is not available, our future prospects will likely diminish. The sale of products that infringe our intellectual property rights, particularly if such products are offered at a lower cost, could negatively impact our ability to achieve commercial success and may materially and adversely harm our business.
Our failure to secure trademark registrations could adversely affect our business and our ability to market our product and product candidates.
Our trademark applications in the United States and any other jurisdictions where we may file may not be allowed for registration, and our registered trademarks may not be maintained or enforced. During trademark registration proceedings, we may receive rejections. Although we are given an opportunity to respond to those rejections, we may be unable to overcome such rejections. In addition, in the PTO and in corresponding foreign agencies, third parties are given an opportunity to oppose pending trademark applications and to seek to cancel registered trademarks. Opposition or cancellation proceedings may be filed against our applications and/or registrations, and our applications and/or registrations may not survive such proceedings. Failure to secure such trademark registrations in the United States and in foreign jurisdictions could adversely affect our business and our ability to market our product and product candidates.
Obtaining and maintaining our patent protection depends upon compliance with various procedural, document submission, fee payment and other requirements imposed by governmental patent agencies, and our patent protection could be reduced or eliminated for non-compliance with these requirements.
The PTO and various foreign governmental patent agencies require compliance with a number of procedural, documentary, fee payment and other provisions during the patent prosecution process and following the issuance of a patent. There are situations in which noncompliance with these requirements can result in abandonment or lapse of a patent or patent application, resulting in partial or complete loss of patent rights in the relevant jurisdiction. In such an event, competitors might be able to enter the market earlier than would otherwise have been the case if our patent were in force.
We may be unable to adequately prevent disclosure of trade secrets and other proprietary information, or the misappropriation of the intellectual property we regard as our own.
We rely on trade secrets to protect our proprietary know-how and technological advances, particularly where we do not believe patent protection is appropriate or obtainable. Nevertheless, trade secrets are difficult to protect. We rely in part on confidentiality agreements with our employees, consultants, third party collaborators and other advisors to protect our trade secrets and other proprietary information. These agreements generally require that the other party to the agreement keep confidential and not disclose to third parties all confidential information developed by the party or made known to the party by us during the course of the party’s relationship with us. These agreements may not effectively prevent disclosure of confidential information and may not provide an adequate remedy in the event of unauthorized disclosure of confidential information. Monitoring unauthorized disclosure is difficult, and we do not know whether the steps we have taken to prevent such disclosure are, or will be, adequate. If we were to seek to pursue a claim that a third party had illegally obtained and was using our trade secrets, it would be expensive and time consuming, and the outcome would be unpredictable. Further, courts outside the United States may be less willing to protect trade secrets. In addition, others may independently discover our trade secrets and proprietary information. Costly and time-consuming litigation could be necessary to enforce and determine the scope of our proprietary rights. In addition, our trade secrets and proprietary information may be misappropriated as a result of breaches of our electronic or physical security systems in which case we may have no legal recourse. Failure to obtain, or maintain, trade secret protection could enable competitors to use our proprietary information to develop products that compete with our product or cause additional, material adverse effects upon our competitive business position.
We may be subject to claims that our employees have wrongfully used or disclosed alleged trade secrets of their former employers.
As is common in the medical diagnostics industry, we employ individuals who were previously employed at other medical diagnostics companies, including our competitors or potential competitors. We may be subject to claims that these employees or we have inadvertently or otherwise used or disclosed trade secrets or other proprietary information of their former employers. Litigation may be necessary to defend against these claims. Even if we are successful in defending against these claims, litigation could result in substantial costs and be a distraction to management.
Risks related to our ordinary shares.
We are eligible to be treated as an emerging growth company and we cannot be certain that the reduced disclosure requirements applicable to emerging growth companies will not make our ordinary shares less attractive to investors.
We are an emerging growth company, as defined in the JOBS Act. For as long as we continue to be an emerging growth company, we may take advantage of exemptions from various reporting requirements that are applicable to other public companies that are not emerging growth companies, including (1) not being required to comply with the auditor attestation requirements of Section 404 of the Sarbanes-Oxley Act of 2002, or the Sarbanes-Oxley Act, (2) reduced disclosure obligations regarding executive compensation in our periodic reports and proxy statements and (3) exemptions from the requirements of holding a nonbinding advisory vote on executive compensation and shareholder approval of any golden parachute payments not previously approved. We could be an emerging growth company for up to five years following our IPO, although certain circumstances could cause us to lose that status earlier, including if the market value of our ordinary shares held by non-affiliates exceeds $700.0 million as of any June 30 in any fiscal year before that time or if we have total annual gross revenue of $1.0 billion or more during any fiscal year before that time, in which cases we would no longer be an emerging growth company as of the following December 31 or, if we issue more than $1.0 billion in non-convertible debt during any three-year period before that time, we would cease to be an emerging growth company immediately. We cannot predict if investors will find our ordinary shares less attractive because we may rely on these exemptions. If some investors find our ordinary shares less attractive as a result, there may be a less active trading market for our ordinary shares and our share price may be more volatile.
Under the JOBS Act, emerging growth companies can also delay adopting new or revised accounting standards until such time as those standards apply to private companies. We have irrevocably elected not to avail ourselves of this exemption from new or revised accounting standards and, therefore, will be subject to the same new or revised accounting standards as other public companies that are not emerging growth companies.
Our share price may be volatile.
Like other early-stage medical diagnostic companies, the market price of our ordinary shares may be volatile. The factors below may also have a material adverse effect on the market price of our ordinary shares:
|
• |
fluctuations in our results of operations; |
|
• |
our ability to enter new markets; |
|
• |
negative publicity; |
|
• |
changes in securities or industry analyst recommendations regarding our company, the sectors in which we operate, the securities market generally and conditions in the financial markets; |
|
• |
regulatory developments affecting our industry; |
|
• |
announcements of studies and reports relating to our products or those of our competitors; |
|
• |
changes in economic performance or market valuations of our competitors; |
|
• |
actual or anticipated fluctuations in our quarterly results; |
|
• |
conditions in the industries in which we operate; |
|
• |
announcements by us or our competitors of new products, acquisitions, strategic relations, joint ventures or capital commitments; |
|
• |
additions to or departures of our key executives and employees; |
|
• |
fluctuations of exchange rates; |
|
• |
release or expiry of lock-up or other transfer restrictions on our outstanding ordinary shares; and |
|
• |
sales or perceived sales of additional shares of our ordinary shares. |
In addition, the equity markets have recently experienced significant volatility, particularly with respect to the securities of life sciences companies. The volatility of the securities of life sciences companies often does not relate to the operating performance of those companies. As we operate in a single industry, we are especially vulnerable to these factors to the extent that they affect our industry or our products, or to a lesser extent our markets. In the past, securities class action litigation has often been initiated against companies following periods of volatility in their stock price. This type of litigation could result in substantial costs and divert our management’s attention and resources, and could also require us to make substantial payments to satisfy judgments or to settle litigation.
Substantial future sales of our ordinary shares in the public market, or the perception that these sales could occur, could cause the price of our ordinary shares to decline.
Additional sales of our ordinary shares in the public market, or the perception that these sales could occur, could cause the market price of our ordinary shares to decline. Most of our ordinary shares that were issued prior to our initial public offering are subject to a lock-up period, which we expect will expire on May 22, 2014 Any or all of these shares may be released prior to expiration of the lock-up period at the discretion of the lead underwriters for our initial public offering. Subsequent to the expiration of the lockup or earlier release of shares by the lead underwriters, these shares will be available for sale subject to volume and other restrictions as applicable under Rule 144 under the Securities Act, or Rule 144. To the extent any of these shares are sold into the market, particularly in substantial quantities, the market price of our ordinary shares could decline.
We do not intend to pay cash dividends on our ordinary shares in the foreseeable future.
We have never paid dividends on ordinary shares and do not anticipate paying any cash dividends on our ordinary shares in the foreseeable future. Under English law, any payment of dividends would be subject to relevant legislation and our articles of association, which provide that all dividends must be approved by our Board of Directors and, in some cases, our shareholders, and may only be paid from our distributable profits available for the purpose, determined on an unconsolidated basis.
Our institutional investors and management own a significant percentage of our ordinary shares and will be able to exercise significant influence over matters subject to shareholder approval.
Our executive officers, directors and several investment funds, together with their respective affiliates, beneficially owned a substantial percentage of our shares. We expect that these shareholders will be able to exert a significant degree of influence over our management and affairs and over matters requiring shareholder approval, including the election of our Board of Directors and approval of significant corporate transactions. This concentration of ownership could have the effect of entrenching our management and/or our Board of Directors, delaying or preventing a change in our control or otherwise discouraging a potential acquirer from attempting to obtain control of us, which in turn could have a material and adverse effect on the fair market value of our ordinary shares.
We incur increased costs as a result of being a public company whose ordinary shares are publicly traded in the United States and our management must devote substantial time to public company compliance programs.
As a public company, we have incurred and will continue to incur significant legal, insurance, accounting and other expenses that we did not incur as a private company. We intend to continue to invest resources to comply with evolving laws, regulations and standards, and this investment will result in increased general and administrative expenses and may divert management’s time and attention. If our efforts to comply with new laws, regulations and standards differ from the activities intended by regulatory or governing bodies due to ambiguities related to practice, regulatory authorities may initiate legal proceedings against us and our business may be harmed. Our insurance costs have increased, particularly for directors and officers liability insurance. Such costs may further increase in the future, and we may be required to accept reduced coverage or incur substantially higher costs to obtain coverage. These factors could also make it more difficult for us to attract and retain qualified members of our Board of Directors, particularly to serve on our audit committee and remuneration committee, and qualified executive officers.
Pursuant to Section 404 of the Sarbanes-Oxley Act, or Section 404, we are required to furnish a report by our management on our internal control over financial reporting, and, once we cease to be an emerging growth company, will be required to include an attestation report on internal control over financial reporting issued by our independent registered public accounting firm. We cannot assure you that there will not be material weaknesses or significant deficiencies in our internal controls in the future.
Our ordinary shares are listed on The NASDAQ Global Market, but we cannot guarantee that we will be able to satisfy the continued listing standards going forward.
Although our ordinary shares are listed on The NASDAQ Global Market, we cannot ensure that we will be able to satisfy the continued listing standards of The NASDAQ Global Market going forward. If we cannot satisfy the continued listing standards going forward, The NASDAQ Stock Market may commence delisting procedures against us, which could result in our ordinary shares being removed from listing on The NASDAQ Global Market. If our ordinary shares were to be delisted, the liquidity of our ordinary shares could be adversely affected and the market price of our ordinary shares could decrease. Delisting could also adversely affect our shareholders’ ability to trade or obtain quotations on our shares because of lower trading volumes and transaction delays. These factors could contribute to lower prices and larger spreads in the bid and ask price for our ordinary shares. You may also not be able to resell your shares at or above the price you paid for such shares or at all.
English law and provisions in our articles of association may have anti-takeover effects that could discourage an acquisition of us by others, even if an acquisition would be beneficial to our shareholders, and may prevent attempts by our shareholders to replace or remove our current management.
Certain provisions of English law and our articles of association may have the effect of delaying or preventing a change in control of us or changes in our management. For example, English law and our articles of association include provisions that:
|
• |
create a classified Board of Directors whose members serve staggered three-year terms; |
|
• |
prohibit shareholder action by written resolution; |
|
• |
establish an advance notice procedure for shareholder approvals to be brought before an annual meeting of our shareholders, including proposed nominations of persons for election to our Board of Directors; and |
|
• |
provide that vacancies on our Board of Directors may be filled only by a majority of directors then in office, even though less than a quorum. |
These provisions, alone or together, could delay or prevent hostile takeovers and changes in control or changes in our management. See also “—Provisions in the U.K. City Code on Takeovers and Mergers may have anti-takeover effects that could discourage an acquisition of us by others, even if an acquisition would be beneficial to our shareholders.”
Our holding company structure makes us dependent on the operations of our subsidiaries to meet our financial obligations.
We are a public limited company organized under the laws of England and Wales and have no significant assets other than our interest in Oxford Immunotec Limited. As a result, we rely exclusively upon payments, dividends and distributions from our direct and indirect subsidiaries for our cash flows. Our ability to pay dividends to our shareholders is dependent on the ability of our subsidiaries to generate sufficient net income and cash flows to pay upstream dividends and make loans or loan repayments.
Risks related to being an English company listing ordinary shares.
U.S. investors may have difficulty enforcing civil liabilities against our company, our directors or members of senior management.
We are incorporated under the laws of England and Wales. The rights of holders of our ordinary shares are governed by English law, including the provisions of the Companies Act 2006, and by our articles of association. These rights differ in certain respects from the rights of shareholders in typical U.S. corporations organized in Delaware. Many of our directors and officers reside outside the United States, and a substantial portion of our assets and all or a substantial portion of the assets of such persons are located outside the United States. As a result, it may be difficult for you to serve legal process on us or our directors and executive officers or have any of them appear in a U.S. court. The United States and the United Kingdom do not currently have a treaty providing for the recognition and enforcement of judgments, other than arbitration awards, in civil and commercial matters. The enforceability of any judgment of a U.S. federal or state court in the United Kingdom will depend on the laws and any treaties in effect at the time, including conflicts of laws principles (such as those bearing on the question of whether a U.K. court would recognize the basis on which a U.S. court had purported to exercise jurisdiction over a defendant). In this context, there is doubt as to the enforceability in the United Kingdom of civil liabilities based solely on the federal securities laws of the United States. In addition, awards for punitive damages in actions brought in the United States or elsewhere may be unenforceable in the United Kingdom. An award for monetary damages under the U.S. securities laws would likely be considered punitive if it did not seek to compensate the claimant for loss or damage suffered and was intended to punish the defendant.
Provisions in the U.K. City Code on Takeovers and Mergers may have anti-takeover effects that could discourage an acquisition of us by others, even if an acquisition would be beneficial to our shareholders.
The U.K. City Code on Takeovers and Mergers, or the Takeover Code, applies, among other things, to an offer for a public company whose registered office is in the United Kingdom (or the Channel Islands or the Isle of Man) and whose securities are not admitted to trading on a regulated market in the United Kingdom (or the Channel Islands or the Isle of Man) if the company is considered by the Panel on Takeovers and Mergers, or the Takeover Panel, to have its place of central management and control in the United Kingdom (or the Channel Islands or the Isle of Man). This is known as the “residency test.” The test for central management and control under the Takeover Code is different from that used by the U.K. tax authorities. Under the Takeover Code, the Takeover Panel will determine whether we have our place of central management and control in the United Kingdom by looking at various factors, including the structure of our Board of Directors, the functions of the directors and where they are resident.
If at the time of a takeover offer the Takeover Panel determines that we have our place of central management and control in the United Kingdom, we would be subject to a number of rules and restrictions, including but not limited to the following: (1) our ability to enter into deal protection arrangements with a bidder would be extremely limited; (2) we might not, without the approval of our shareholders, be able to perform certain actions that could have the effect of frustrating an offer, such as issuing shares or carrying out acquisitions or disposals; and (3) we would be obliged to provide equality of information to all bona fide competing bidders.
If we are a passive foreign investment company, U.S. investors in our ordinary shares could be subject to adverse U.S. federal income tax consequences.
The rules governing passive foreign investment companies, or PFICs, can have adverse effects for U.S. federal income tax purposes. The tests for determining PFIC status for a taxable year depend upon the relative values of certain categories of assets and the relative amounts of certain kinds of income. We do not believe that we are currently a PFIC, and we do not anticipate becoming a PFIC in the foreseeable future. Notwithstanding the foregoing, the determination of whether we are a PFIC depends on the particular facts and circumstances (such as the valuation of our assets, including goodwill and other intangible assets) and may also be affected by the application of the PFIC rules, which are subject to differing interpretations. The fair market value of our assets is expected to depend, in part, upon (a) the market price of our ordinary shares and (b) the composition of our income and assets, which will be affected by how, and how quickly, we spend any cash that is raised in any financing transaction. In light of the foregoing, no assurance can be provided that we are not currently a PFIC or that we will not become a PFIC in any future taxable year.
If we are a PFIC, U.S. holders of our ordinary shares would be subject to adverse U.S. federal income tax consequences, such as ineligibility for any preferred tax rates on capital gains or on actual or deemed dividends, interest charges on certain taxes treated as deferred, and additional reporting requirements under U.S. federal income tax laws and regulations. Whether or not U.S. holders of our ordinary shares make a timely qualified electing fund, or QEF, election or mark-to-market election may affect the U.S. federal income tax consequences to U.S. holders with respect to the acquisition, ownership and disposition of our ordinary shares and any distributions such U.S. holders may receive. Investors should consult their own tax advisors regarding all aspects of the application of the PFIC rules to our ordinary shares.
U.S. holders of 10% or more of the voting power of our ordinary shares may be subject to U.S. federal income taxation at ordinary income tax rates on undistributed earnings and profits.
There is a risk that we will be classified as a controlled foreign corporation, or CFC, for U.S. federal income tax purposes. We will generally be classified as a CFC if more than 50% of our outstanding shares, measured by reference to voting power or value, are owned (directly, indirectly or by attribution) by “U.S. Shareholders.” For this purpose, a “U.S. Shareholder” is any U.S. person that owns directly, indirectly or by attribution, 10% or more of the voting power of our outstanding shares. If we are classified as a CFC, a U.S. Shareholder may be subject to U.S. income taxation at ordinary income tax rates on all or a portion of our undistributed earnings and profits attributable to “subpart F income” and may also be subject to tax at ordinary income tax rates on any gain realized on a sale of ordinary shares, to the extent of our current and accumulated earnings and profits attributable to such shares. The CFC rules are complex and U.S. Shareholders of the ordinary shares are urged to consult their own tax advisors regarding the possible application of the CFC rules to them in their particular circumstances.
Item 1B. Unresolved Staff Comments
None.
Item 2. Properties
Our U.K. corporate headquarters and operations, including our laboratory facility, are located in Abingdon, England, where we currently lease approximately 5,963 square feet of office space and 8,566 square feet of lab and manufacturing space. The leases on these facilities expire in 2019. Our current rents under these leases are $251,000 annually for the office and $328,000 annually for the lab, which are subject to change.
Our U.S. corporate headquarters is located in Marlborough, Massachusetts, where we currently lease approximately 14,541 square feet of office space. The lease on this facility expires in 2018. Our current rent under this lease is $269,080 annually, subject to annual increases. Our U.S. laboratory facility is located in Memphis, Tennessee, where we currently lease approximately 34,560 square feet of space. The lease on this facility expires in 2016. Our current rent under this lease is $167,760 annually, subject to annual increases.
We believe that our current facilities are suitable and adequate to meet our current needs and that suitable additional or substitute space will be available to accommodate future growth of our business.
Item 3. Legal Proceedings
We are not currently a party to any pending legal proceedings that we believe will have a material adverse effect on our business or financial condition. However, we may be subject to various claims and legal actions arising in the ordinary course of business from time to time.
Item 4. Mine Safety Disclosures
Not applicable.
PART II
Item 5. Market for Registrant’s Common Equity, Related Stockholder Matters and Issuer Purchases of Equity Securities
Market Information
Our ordinary shares trade on the NASDAQ Global Market under the symbol “OXFD”. Our ordinary shares were initially listed on November 22, 2013. The price range per share reflected in the table below is the high and low sales prices of our ordinary shares as reported by NASDAQ (rounded to the nearest penny) for the period presented.
|
Year ended December 31, 2013 | ||||||||||
|
High |
Low | |||||||||
|
Fourth quarter (from inception on November 22, 2013) |
$ | 20.06 | $ | 13.58 | ||||||
Shareholders
On March 21, 2014, there were 6 shareholders of record of our ordinary shares. This number does not include shareholders for whom shares were held in a “nominee” or “street” name. On March 21, 2014, the last reported sale price per share of our ordinary shares on The NASDAQ Global Market was $20.30.
Dividends
We have never declared or paid cash dividends on our ordinary shares. We currently intend to retain all available funds and any future earnings, if any, to fund the development and expansion of our business and we do not anticipate paying any cash dividends in the foreseeable future. Any future determination as to the declaration and payment of dividends, if any, will be made at the discretion of our Board of Directors and will depend on then existing conditions, including our results of operations, financial conditions, contractual restrictions, capital requirements, business prospects and other factors our Board of Directors may deem relevant. Under English law, we may pay dividends only out of our accumulated, realized profits, so far as not previously utilized by distribution or capitalization, less our accumulated, realized losses, so far as not previously written off in a reduction or reorganization of capital duly made. Because we are a holding company and have no direct operations, we will only be able to pay dividends from our available cash on hand and any funds we receive from our subsidiaries.
The following graph compares the cumulative total shareholder return on our ordinary shares with that of the Nasdaq Composite Index and the S&P Smallcap 600 Healthcare Index. The comparison assumes that $100.00 was invested at the close of market on November 22, 2013 in our ordinary shares or on October 31, 2013 in the Nasdaq Composite Index and the S&P Smallcap 600 Healthcare Index, and assumes reinvestment of dividends, if any. The performance graph is based on historical results and is not intended to suggest future performance.
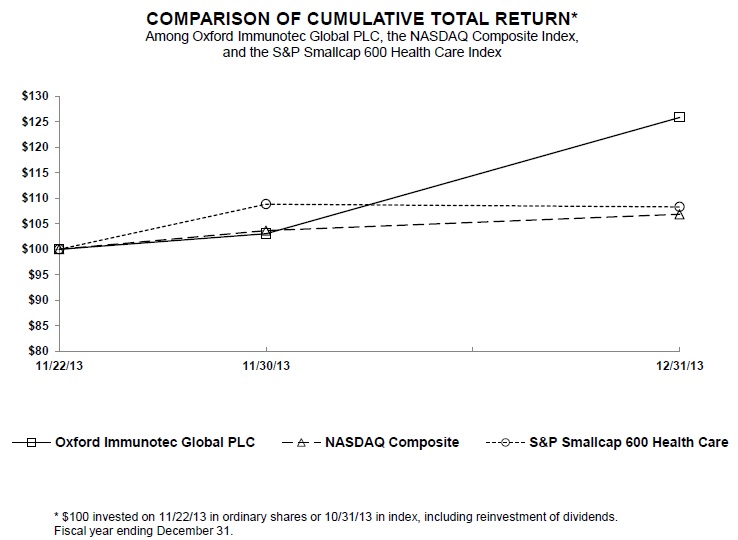
This performance graph is being furnished pursuant to SEC rules and will not be incorporated by reference into any filing under the Securities Act or the Exchange Act except to the extent we specifically incorporate it by reference.
Recent Sale of Unregistered Securities
Financing transactions.
In November 2013, prior to closing of the Company’s initial public offering, the Company undertook a 1 for 6.705 reverse share split of its outstanding ordinary shares, which resulted in a proportional decrease in the number of ordinary shares outstanding as well as appropriate adjustments to outstanding A ordinary shares, preferred ordinary shares, warrants and options. After the reverse share split and immediately prior to the Company’s IPO, all outstanding preferred ordinary shares converted into ordinary shares. The nominal value of the ordinary shares was adjusted from £0.001 to £0.006705 per share. Prior period share and per share amounts have been adjusted to reflect the reverse share split.
In October 2013, the Company issued a convertible promissory note in the amount of $5.0 million to Fosun Industrial Co., Ltd., (the Fosun Note). The Fosun Note paid interest at 8% per annum.
In the event of an IPO, the Fosun Note principal and accrued interest would automatically convert to ordinary shares at a 10% discount to the IPO offering price. Fosun also had an option to elect, prior to July 1, 2014, to require the Company to create and then convert the Fosun Note to H preferred ordinary shares or pay in full all principal and interest outstanding on or before July 1, 2016. In the event of an IPO, the shares would be subjected to restrictions prohibiting sale or transfer of more than one-third of the shares each year for the first three years following the offering.
The feature which required automatic conversion upon an IPO was a redemption feature that met the definition of an embedded derivative requiring bifurcation from the Fosun Note. The Company determined there was no initial fair market value of the liability.
In connection with the Company’s IPO in November 2013, the Fosun Note and interest of approximately $50,000 converted into 467,551 of the Company’s ordinary shares at a price per share which reflected a 10% discount to the IPO offering price of $12.00 per share. Upon conversion of the Fosun Note to ordinary shares, the derivative liability terminated. In connection with the IPO the Company marked the embedded derivative to market and recorded a $561,000 loss on the change in the fair value of the instrument.
As of January 2013, we had issued 2,469,747 Series G preferred ordinary shares at a price of $11.40 per share for aggregate consideration of approximately $28 million to certain of our shareholders, including each of the investment funds identified in the section under the heading “Principal shareholders,” in our registration statement on Form S-1 (File No. 333-191737), whom we refer to collectively as our “institutional investors,” and Mr. Sandberg. The issuance occurred in two tranches; in June 2012, we issued 1,503,330 G preferred ordinary shares and in January 2013, we issued 966,417 G preferred ordinary shares.
In February 2012, we entered into a convertible loan facility, pursuant to which we borrowed an aggregate of $4 million from certain of our shareholders. In connection with this loan facility, we issued 61,296 ordinary shares and 183,896 F preferred ordinary shares to the lenders as payment for a facility fee associated with the loan. As of June 2012, all lenders had converted their notes into G preferred ordinary shares in connection with the financing described above.
Beginning in 2009, we consummated a series of financing transactions that involved the issuance of ordinary shares and F preferred ordinary shares for a total of $26 million. The financing occurred in three tranches, with the first tranche closing in July 2009. The second tranche occurred in April 2010 and, in connection therewith, we issued a total of 275,849 ordinary shares and 827,547 F preferred ordinary shares at a price per unit (consisting of one-third of an ordinary share and one F preferred ordinary share) of $10.876, for aggregate consideration of $9 million to certain of our shareholders. The third tranche occurred in February 2011 and, in connection therewith, we issued 306,499 ordinary shares and 919,497 F preferred ordinary shares at a price per unit (consisting of one-third of an ordinary share and one F preferred ordinary share) of $10.876, for aggregate consideration of $10 million.
These issuances were exempt from registration under the Securities Act pursuant to Rule 506 or Section 4(a)(2) as transactions by an issuer not involving any public offering.
Warrants.
In 2013, we issued a warrant to purchase 15,791 shares at $0.80 per share to a lender in connection with a credit facility. That warrant expires May 25, 2023. In 2012, we issued a warrant to purchase 3,682 shares at $0.07 per share to a lender in connection with a credit facility. That warrant expires on February 2, 2019.
These issuances were exempt from registration under the Securities Act pursuant to Rule 506 or Section 4(a)(2) as transactions by an issuer not involving any public offering.
Option grants and exercises.
From January 1, 2013 through December 31, 2013, we granted options to purchase a total of 312,198 ordinary shares to employees at a weighted-average price of $5.12 per share. During the same period, we issued 201,459 ordinary shares upon the exercise of options to purchase such shares at a weighted-average price of $0.12 per share.
In 2012, we granted options to purchase a total of 686,125 ordinary shares to employees at a weighted-average price of $0.60 per share. During the same period, we issued 9,378 ordinary shares upon the exercise of options to purchase such shares at a weighted-average price of $0.13 per share.
In 2011, we granted options to purchase a total of 53,740 ordinary shares to employees at a weighted-average price of $0.25 per share. During the same period, we issued 4,459 ordinary shares upon the exercise of options to purchase such shares at a weighted-average price of $0.10 per share.
From October 1, 2010 to December 31, 2010, we granted options to purchase a total of 60,752 ordinary shares to employees at a weighted-average price of $0.27 per share. During the same period, we issued 447 ordinary shares upon the exercise of options to purchase such ordinary shares at a weighted-average price of $0.11 per share.
These option grants and the issuances of ordinary shares upon exercise of such options were exempt from registration under the Securities Act pursuant to Rule 701 and Section 4(a)(2) as transactions by an issuer pursuant to certain compensatory benefit plans and not involving any public offering.
Scheme of arrangement.
On October 2, 2013, our equity holders exchanged their equity interests in Oxford Immunotec Limited for equity interests in Oxford Immunotec Global PLC pursuant to a Scheme of Arrangement under the laws of England and Wales. The issuance was an exchange transaction exempt from registration under the Securities Act pursuant to Section 3(a)(10).
Use of Proceeds from Initial Public Offering
On November 21, 2013, our registration statement on Form S-1 (File No. 333-191737) was declared effective by the Securities and Exchange Commission for our IPO pursuant to which we sold an aggregate of 6,164,000 ordinary shares at a price to the public of $12.00 per share. Net proceeds from the IPO were approximately $63.9 million, after deducting underwriting discounts and commissions and offering expenses. There has been no material change in the planned use of proceeds from our IPO as described in our final prospectus filed with the SEC on November 25, 2013 pursuant to Rule 424(b).
Item 6. Selected Consolidated Financial Data
The following tables summarize our consolidated financial and other data. The consolidated statements of operations data for the years ended December 31, 2013, 2012, and 2011 and the consolidated balance sheet data as of December 31, 2013 and 2012 have been derived from our audited consolidated financial statements appearing elsewhere in this Annual Report on Form 10-K. We derived the consolidated balance sheet data as of December 31, 2011 from our audited consolidated financial statements not included in this Annual Report on Form 10-K. We derived the consolidated statement of operations data for the years ended December 31, 2010 and 2009 and the consolidated balance sheet data as of December 31, 2010 and 2009 from our unaudited consolidated financial statements not included in this Annual Report on Form 10-K.
On October 2, 2013, we completed a scheme of arrangement under the laws of England and Wales, or the Scheme of Arrangement, which was approved by the High Court of Justice in England and Wales. Prior to the Scheme of Arrangement, our business was conducted by Oxford Immunotec Limited and its consolidated subsidiaries. Following the Scheme of Arrangement, our business has been conducted by Oxford Immunotec Global PLC and its consolidated subsidiaries, including Oxford Immunotec Limited.
We have prepared the unaudited consolidated financial information presented below on the same basis as our audited consolidated financial statements. The unaudited consolidated financial information includes all adjustments, consisting only of normal recurring adjustments that are necessary for a fair presentation of our financial position and results of operations for these periods. Our historical results are not necessarily indicative of the results that may be expected in the future. You should read the following selected financial data together with “Management’s discussion and analysis of financial condition and results of operations” and our financial statements and accompanying notes included elsewhere in this Annual Report on Form 10-K. The selected financial data in this section are not intended to replace our financial statements and the accompanying notes.
|
Year ended December 31, |
||||||||||||||||||||
|
(in thousands, except share and per share data) (unaudited) |
2013 (1) | 2012 | 2011 | 2010 | 2009 | |||||||||||||||
|
Consolidated statement of operations data: |
||||||||||||||||||||
|
Revenue |
$ | 38,784 | $ | 20,685 | $ | 12,641 | $ | 7,741 | $ | 4,308 | ||||||||||
|
Cost of revenue |
18,600 | 12,424 | 8,417 | 4,871 | 2,310 | |||||||||||||||
|
Gross profit |
20,184 | 8,261 | 4,224 | 2,870 | 1,998 | |||||||||||||||
|
Operating expenses: |
||||||||||||||||||||
|
Research and development |
2,146 | 1,947 | 1,780 | 1,938 | 2,596 | |||||||||||||||
|
Sales and marketing |
13,270 | 11,177 | 10,536 | 9,375 | 6,507 | |||||||||||||||
|
General and administrative |
12,119 | 8,068 | 5,232 | 5,050 | 5,679 | |||||||||||||||
|
Total operating expenses |
27,535 | 21,192 | 17,548 | 16,363 | 14,782 | |||||||||||||||
|
Loss from operations |
(7,351 | ) | (12,931 | ) | (13,324 | ) | (13,493 | ) | (12,784 | ) | ||||||||||
|
Other (expense) income |
(1,221 | ) | (2,103 | ) | 101 | 1,500 | (565 | ) | ||||||||||||
|
Loss before income taxes |
(8,572 | ) | (15,034 | ) | (13,223 | ) | (11,993 | ) | (13,349 | ) | ||||||||||
|
Income tax expense (benefit) |
92 | (151 | ) | (119 | ) | (147 | ) | (256 | ) | |||||||||||
|
Net loss |
$ | (8,664 | ) | $ | (14,883 | ) | $ | (13,104 | ) | $ | (11,846 | ) | $ | (13,093 | ) | |||||
|
Net loss per share attributable to ordinary shareholders, basic and diluted |
$ | (2.26 | ) | $ | (8.44 | ) | $ | (10.78 | ) | $ | (14.76 | ) | $ | (44.98 | ) | |||||
|
Weighted-average shares used to compute net loss attributable to ordinary shareholders, basic and diluted |
3,830,837 | 1,763,728 | 1,215,532 | 802,561 | 291,071 | |||||||||||||||
|
Supplemental financial metric: |
||||||||||||||||||||
|
Adjusted EBITDA (2) |
$ | (5,717 | ) | $ | (12,131 | ) | $ | (12,519 | ) | $ | (11,019 | ) | $ | (12,083 | ) | |||||
|
As of December 31, |
||||||||||||||||||||
|
2013 |
2012 |
2011 |
2010 |
2009 |
||||||||||||||||
|
Consolidated Balance Sheet Data: |
||||||||||||||||||||
|
Cash and cash equivalents |
$ | 76,494 | $ | 12,578 | $ | 2,334 | $ | 6,644 | $ | 9,056 | ||||||||||
|
Total assets |
92,744 | 25,483 | 9,639 | 11,547 | 13,527 | |||||||||||||||
|
Total liabilities |
11,992 | 8,534 | 4,413 | 3,371 | 2,796 | |||||||||||||||
|
Total shareholders’ equity |
80,752 | 16,949 | 5,226 | 8,176 | 10,731 | |||||||||||||||
|
Shares outstanding: |
||||||||||||||||||||
|
Preferred ordinary shares |
— | 7,301,371 | 5,614,128 | 4,694,631 | 3,867,084 | |||||||||||||||
|
Ordinary shares |
17,255,267 | 2,153,974 | 1,266,544 | 955,460 | 420,261 | |||||||||||||||
|
(1) |
Net loss includes $1.9 million of accounting and auditing costs related to our registration statement on Form S-1, filed in connection with our IPO, as described in Note 1, Description of business and significant accounting policies –“Initial public offering, reorganization, reverse share split and conversion,” to the Consolidated Financial Statements included elsewhere in this Annual Report on Form 10-K. |
|
(2) |
Adjusted EBITDA is a non-GAAP financial measure that we calculate as profit (loss), adjusted for tax expense (benefit), unrealized exchange fluctuations, interest expense, interest income, depreciation and amortization, share-based compensation, and loss on change in fair value of warrants and derivative instrument. We believe that Adjusted EBITDA provides useful information to investors and analysts in understanding and evaluating our operating results in the same manner as our management and Board of Directors. Our presentation of Adjusted EBITDA is not made in accordance with U.S. GAAP, and our computation of Adjusted EBITDA may vary from others in the industry. Our use of Adjusted EBITDA has limitations as an analytical tool, and you should not consider it in isolation or as a substitute for analysis of our results as reported under U.S. GAAP. For example, Adjusted EBITDA does not reflect the impact of earnings or charges resulting from matters that we consider not to be indicative of our ongoing operations. |
The following table presents a reconciliation of net loss, the most comparable U.S. GAAP financial measure, to Adjusted EBITDA for each of the periods indicated:
|
Year ended December 31, |
||||||||||||||||||||
|
(in thousands) (unaudited) |
2013 |
2012 |
2011 |
2010 |
2009 |
|||||||||||||||
|
Reconciliation of net loss to adjusted EBITDA |
||||||||||||||||||||
|
Net loss |
$ | (8,664 | ) | $ | (14,883 | ) | $ | (13,104 | ) | $ | (11,846 | ) | $ | (13,093 | ) | |||||
|
Income tax expense (benefit) |
92 | (151 | ) | (119 | ) | (147 | ) | (256 | ) | |||||||||||
|
Interest income |
(1 | ) | (1 | ) | (1 | ) | (5 | ) | (8 | ) | ||||||||||
|
Interest expense |
329 | 1,478 | 4 | 23 | 40 | |||||||||||||||
|
Depreciation and amortization |
1,392 | 801 | 630 | 586 | 569 | |||||||||||||||
|
EBITDA |
(6,852 | ) | (12,756 | ) | (12,590 | ) | (11,389 | ) | (12,748 | ) | ||||||||||
|
Reconciling items: |
||||||||||||||||||||
|
Share-based compensation expense |
140 | 79 | 125 | 261 | 171 | |||||||||||||||
|
Unrealized exchange gains (losses) |
155 | 546 | (54 | ) | 109 | 494 | ||||||||||||||
|
Loss on change in fair value of warrants |
279 | — | — | — | — | |||||||||||||||
|
Loss on change in fair value of derivative instrument |
561 | — | — | — | — | |||||||||||||||
|
Adjusted EBITDA |
$ | (5,717 | ) | $ | (12,131 | ) | $ | (12,519 | ) | $ | (11,019 | ) | $ | (12,083 | ) | |||||
Item 7. Management’s Discussion and Analysis of Financial Condition and Results of Operations
You should read the following discussion and analysis of our financial condition and results of operations in conjunction with our consolidated financial statements and the related notes to those statements included elsewhere in this Annual Report on Form 10-K. In addition to our historical consolidated financial information, the following discussion contains forward-looking statements that reflect our plans, estimates, beliefs and expectations. Our actual results and the timing of events could differ materially from those discussed in these forward-looking statements. Factors that could cause or contribute to these differences include those discussed below and elsewhere in this Annual Report on Form 10-K, particularly in Part I, Item 1A, “Risk Factors.”
Overview
We are a global, commercial-stage diagnostics company committed to improving patient care by providing advanced, innovative tests in the field of immunology. Our proprietary T-SPOT technology platform allows us to measure the responses of specific immune cells, known as T cells, to inform the diagnosis, prognosis and monitoring of patients with immunologically controlled diseases.
The initial product we have developed using our T-SPOT technology platform is our T-SPOT.TB test, which is used to test for LTBI.
We have incurred significant losses from inception and as of December 31, 2013 had an accumulated deficit of $99.7 million. We anticipate that our operating losses will continue for the next few years as we continue to invest to grow our customer base. Our revenue for the year ended December 31, 2013 was $38.8 million, for the year ended December 31, 2012 was $20.7 million, and for the year ended December 31, 2011 was $12.6 million. Our net loss for the year ended December 31, 2013 was $8.7 million, for the year ended December 31, 2012 was $14.9 million, and for the year ended December 31, 2011 was $13.1 million.
On October 2, 2013, we completed a Scheme of Arrangement, which was approved by the High Court of Justice in England and Wales. Prior to the Scheme of Arrangement, our business was conducted by Oxford Immunotec Limited and its consolidated subsidiaries. Following the Scheme of Arrangement, our business has been conducted by Oxford Immunotec Global PLC and its consolidated subsidiaries, including Oxford Immunotec Limited. The financial information presented in this Annual Report on Form 10-K includes the results of Oxford Immunotec Limited and its consolidated subsidiaries for the period prior to the completion of the Scheme of Arrangement, as well as the results of Oxford Immunotec Global PLC and its consolidated subsidiaries for the period after completion of the Scheme of Arrangement.
On November 21, 2013, our initial public offering, or IPO, was declared effective by the Securities and Exchange Commission. Net proceeds from the IPO were approximately $63.9 million, after deducting underwriting discounts and commissions and estimated offering expenses.
Financial operations overview
Revenue
We generate revenue from sales associated with our T-SPOT technology platform via our direct sales force and also through distributors. Our T-SPOT.TB test is our first commercialized product based on this platform.
Revenue mix
We currently offer our T-SPOT.TB test in either an in vitro diagnostic kit or a service format. In the former, we sell test kits and associated accessories to distributors for resale and directly to institutions and laboratories that perform TB testing. In the latter, we have established clinical testing laboratories in the United States and the United Kingdom, where we perform our T-SPOT.TB test on samples sent to us by customers. In these markets, we have found that many customers prefer to send samples to us rather than perform their own analysis on-site.
Our U.S. business derived 96%, 95% and 94% of revenue from our service offering for the years ended December 31, 2013, 2012, and 2011, respectively, which reflects our experience that U.S. customers prefer to send IGRA tests out for processing and analysis rather than run them in-house. For the majority of our U.S. customers in the hospital and public health segments, TB testing programs are funded primarily from institutional budgets. We receive payment from these customers according to our pre-negotiated prices. For other segments of the U.S. market (notably, for example, the physicians’ office segment) third-party reimbursement is often available to cover the cost of our T-SPOT.TB test.
Outside the United States, we derived 90%, 83% and 84% of our revenue from the sale of our in vitro diagnostic kits and associated accessories for the years ended December 31, 2013, 2012, and 2011, respectively. For the majority of our customers outside the United States, we primarily negotiate pricing directly with our customers, and our prices are influenced to some degree by the mechanism and level of funding our customers receive for performing testing.
|
Year ended December 31, |
||||||||||||
|
(in thousands) |
2013 |
2012 |
2011 |
|||||||||
|
Revenue |
||||||||||||
|
Product |
$ | 19,905 | $ | 9,080 | $ | 6,281 | ||||||
|
Service |
18,879 | 11,605 | 6,360 | |||||||||
|
Total revenue |
$ | 38,784 | $ | 20,685 | $ | 12,641 | ||||||
Revenue by geography
We sell our T-SPOT.TB test through our own sales force in the United States, certain European countries and Japan. We sell through distributors in other parts of the world. We intend to expand our sales force globally and establish additional distributor relationships outside of our direct markets to better access international markets.
The following table reflects product revenue by geography (United States, Europe and rest of world, or Europe & ROW, and Asia) and as a percentage of total product revenue, based on the billing address of our customers.
|
Year ended December 31, |
||||||||||||||||||||||||
|
(in thousands, except percentages) |
2013 |
2012 |
2011 |
|||||||||||||||||||||
|
Revenue |
||||||||||||||||||||||||
|
United States |
$ | 17,345 | 45 | % | $ | 10,366 | 50 | % | $ | 5,604 | 44 | % | ||||||||||||
|
Europe & ROW |
7,157 | 18 | % | 6,530 | 32 | % | 5,587 | 44 | % | |||||||||||||||
|
Asia |
14,282 | 37 | % | 3,789 | 18 | % | 1,450 | 12 | % | |||||||||||||||
|
Total revenue |
$ | 38,784 | 100 | % | $ | 20,685 | 100 | % | $ | 12,641 | 100 | % | ||||||||||||
Our revenue is denominated in multiple currencies. Sales in the United States and China are denominated in U.S. Dollars. Sales in Europe & ROW are denominated primarily in the Pound Sterling and the Euro. Sales in Japan are denominated in Yen. Our expenses are generally denominated in the currencies in which our operations are located, which is primarily in the United States, the United Kingdom and Japan. We operate globally and therefore changes in foreign currency exchange rates may become material to us in the future due to factors beyond our control.
Cost of revenue and operating expenses
Cost of revenue and gross margin
Cost of revenue consists of direct labor expenses, including employee benefits and share-based compensation expenses, overhead expenses, material costs, cost of laboratory supplies, freight costs, royalties paid under license agreements, U.S. medical device excise tax and depreciation of laboratory equipment and leasehold improvements. During the years ended December 31, 2013, 2012, and 2011, our cost of revenue represented 48%, 60%, and 67%, respectively, of our total revenue.
|
Year ended December 31, |
||||||||||||
|
(in thousands) |
2013 |
2012 |
2011 |
|||||||||
|
Cost of revenue |
||||||||||||
|
Product |
$ | 8,475 | $ | 4,329 | $ | 2,955 | ||||||
|
Service |
10,125 | 8,095 | 5,462 | |||||||||
|
Total cost of revenue |
$ | 18,600 | $ | 12,424 | $ | 8,417 | ||||||
Our gross profit represents total revenue less the cost of revenue, and gross margin is gross profit expressed as a percentage of total revenue. Our gross margins were 52%, 40% and 33%, respectively, for the years ended December 31, 2013, 2012, and 2011. We expect our overall cost of revenue to increase in absolute U.S. Dollars as we continue to increase our volume of kits manufactured and tests performed. However, we also believe that we can achieve certain efficiencies in our manufacturing and laboratory operations, through these increased volumes, that could help maintain or improve our overall margins.
Research and development expenses
Our research and development efforts are focused on developing multiple new diagnostic tests that use our quantitative T cell measurement technology, including assays that would help transplant physicians better manage patients at risk of rejection and infection.
Our research and development expenses include those costs associated with performing research, development, clinical and regulatory activities and validating improvements to our technology and processes for the purposes of enhancing product performance. Research and development expenses include personnel-related expenses, including share-based compensation, fees for contractual and consulting services, travel costs, laboratory supplies, amortization, depreciation, rent, insurance, repairs and maintenance. We expense all research and development costs as incurred.
Given the relatively small size of our research and development staff and the limited number of active projects at any given time, we have found that, to date, it has been effective for us to manage our research and development activities on a departmental basis. Accordingly, we do not require employees to report their time by project nor do we allocate our research and development costs to individual projects.
During the years ended December 31, 2013, 2012, and 2011, our research and development expenses represented 6%, 9%, and 14%, respectively, of our total revenue.
Sales and marketing expenses
Our sales and marketing expenses include costs associated with our sales organization, including our direct sales force and sales management, and our marketing and customer service personnel. These expenses consist principally of salaries, commissions, bonuses and employee benefits for these personnel, including share-based compensation, as well as travel costs related to sales, marketing and customer service activities, marketing and medical education activities and overhead expenses. We expense all sales and marketing costs as incurred.
During the years ended December 31, 2013, 2012, and 2011, our sales and marketing expenses represented 34%, 54% and 83%, respectively, of our total revenue. We expect our sales and marketing costs to increase in absolute U.S. Dollars, as we expand our sales force, increase our geographic presence, and increase marketing and medical education to drive awareness and adoption of our current T-SPOT.TB test and future products.
General and administrative expenses
Our general and administrative expenses include costs for our executive, accounting and finance, legal, corporate development, IT and human resources functions. These expenses consist principally of salaries, bonuses and employee benefits for the personnel included in these functions, including share-based compensation and travel costs, professional services fees, such as consulting, audit, tax and legal fees, costs related to our Board of Directors, general corporate costs, overhead expenses, and bad debt expense. We expense all general and administrative expenses as incurred.
During the years ended December 31, 2013, 2012, and 2011, our general and administrative expenses represented 31%, 39% and 41%, respectively, of our total revenue. We expect that our general and administrative expenses will increase, primarily due to the costs of operating as a public company, such as additional legal, accounting, and corporate governance expenses, including expenses related to compliance with the Sarbanes-Oxley Act, directors’ and officers’ insurance premiums, and investor relations expenses.
Other income (expense)
Other income (expense) primarily consists of interest income, interest expense and exchange fluctuations. Interest income consists of interest earned on our cash and cash equivalents. During the years ended December 31, 2013, 2012, and 2011, this income has not been material, although we expect our interest income to increase in future periods as we invest the unused portion of the net proceeds of our IPO in short-term, interest-bearing, investment-grade instruments or other securities pending application of such proceeds to the uses set forth in our registration statement on Form S-1.
Interest expense consisted primarily of interest expense on our loan balances and the amortization of debt discounts and debt issuance costs. We amortize debt issuance costs over the life of the loan and report them as interest expense in our statements of operations. We repaid the borrowings under our credit facility with Comerica Bank in May 2013 and entered into a new term loan and revolving line of credit with Square 1 Bank. This loan was repaid and the credit facility cancelled in December 2013, following our IPO. We had no debt at December 31, 2013. See “– Liquidity and capital resources – Sources of funds – Credit facilities.”
Monetary assets and liabilities that are denominated in foreign currencies are remeasured at the period-end closing rate with resulting unrealized exchange fluctuations. Realized exchange fluctuations result from the settlement of transactions in currencies other than the functional currencies of our businesses. The functional currencies of our businesses are U.S. Dollars, Pounds Sterling, and Yen, depending on the entity.
Results of operations
Comparison of years ended December 31, 2013 and 2012
The following table sets forth, for the periods indicated, the amounts of certain components of our statements of operations and the percentage of total revenue represented by these items, showing period-to-period changes.
|
Year ended December 31, |
||||||||||||||||||||||||
|
2013 |
2012 |
Change |
||||||||||||||||||||||
|
(in thousands, except percentages) |
Amount |
% of |
Amount |
% of revenue |
Amount |
% |
||||||||||||||||||
|
Revenue: |
||||||||||||||||||||||||
|
Product |
$ | 19,905 | 51 | % | $ | 9,080 | 44 | % | $ | 10,825 | 119 | % | ||||||||||||
|
Service |
18,879 | 49 | % | 11,605 | 56 | % | 7,274 | 63 | % | |||||||||||||||
|
Total revenue |
38,784 | 100 | % | 20,685 | 100 | % | $ | 18,099 | 87 | % | ||||||||||||||
|
Cost of revenue: |
||||||||||||||||||||||||
|
Product |
8,475 | 22 | % | 4,329 | 21 | % | 4,146 | 96 | % | |||||||||||||||
|
Service |
10,125 | 26 | % | 8,095 | 39 | % | 2,030 | 25 | % | |||||||||||||||
|
Total cost of revenue |
18,600 | 48 | % | 12,424 | 60 | % | 6,176 | 50 | % | |||||||||||||||
|
Gross profit |
20,184 | 52 | % | 8,261 | 40 | % | 11,923 | 144 | % | |||||||||||||||
|
Operating expenses: |
||||||||||||||||||||||||
|
Research and development |
2,146 | 6 | % | 1,947 | 9 | % | 199 | 10 | % | |||||||||||||||
|
Sales and marketing |
13,270 | 34 | % | 11,177 | 54 | % | 2,093 | 19 | % | |||||||||||||||
|
General and administrative |
12,119 | 31 | % | 8,068 | 39 | % | 4,051 | 50 | % | |||||||||||||||
|
Total operating expenses |
27,535 | 71 | % | 21,192 | 102 | % | 6,343 | 30 | % | |||||||||||||||
|
Loss from operations |
(7,351 | ) | (19 | )% | (12,931 | ) | (63 | )% | 5,580 | (43 | )% | |||||||||||||
|
Interest expense, net |
(328 | ) | (1 | )% | (1,477 | ) | (7 | )% | 1,149 | (78 | )% | |||||||||||||
|
Foreign exchange losses |
(423 | ) | (1 | )% | (626 | ) | (3 | )% | 203 | (32 | )% | |||||||||||||
|
Other expense |
(470 | ) | (1 | )% | — | 0 | % | (470 | ) |
N/A |
||||||||||||||
|
Loss before income taxes |
(8,572 | ) | (22 | )% | (15,034 | ) | (73 | )% | 6,462 | (43 | )% | |||||||||||||
|
Income tax expense (benefit) |
92 | 0 | % | (151 | ) | (1 | )% | 243 | (161 | )% | ||||||||||||||
| Net loss | $ | (8,664 | ) | (22 | )% | $ | (14,883 | ) | (72 | )% | $ | 6,219 | (42 | )% | ||||||||||
Revenue
Revenue increased by 87% to $38.8 million for the year ended December 31, 2013 compared to $20.7 million for the same period in 2012. This increase in revenue was due to an increase in volumes across all the regions where we sell our test. U.S. revenue grew by 67% driven by growth of $2.8 million from existing customers and $4.2 million from the addition of new customers as a result of an increased focus on selling to larger institutional accounts. Asia revenue grew by $10.5 million due to $3.0 million higher revenue in China and $7.5 million higher revenue in Japan where our T-SPOT.TB test was launched in the fourth quarter of 2012. We have seen significant demand for the test since its launch in Asia. Europe & ROW revenue growth was 10% over the same period in 2012.
|
Year ended December 31, |
Change |
|||||||||||||||
|
(in thousands, except percentages) |
2013 |
2012 |
Amount |
% |
||||||||||||
|
Revenue |
||||||||||||||||
|
Product |
$ | 19,905 | $ | 9,080 | $ | 10,825 | 119 | % | ||||||||
|
Service |
18,879 | 11,605 | 7,274 | 63 | % | |||||||||||
|
Total revenue |
$ | 38,784 | $ | 20,685 | $ | 18,099 | 87 | % | ||||||||
|
Year ended December 31, |
Change |
|||||||||||||||
|
(in thousands, except percentages) |
2013 |
2012 |
Amount |
% |
||||||||||||
|
Revenue |
||||||||||||||||
|
United States |
$ | 17,345 | $ | 10,366 | $ | 6,979 | 67 | % | ||||||||
|
Europe & ROW |
7,157 | 6,530 | 627 | 10 | % | |||||||||||
|
Asia |
14,282 | 3,789 | 10,493 | 277 | % | |||||||||||
|
Total revenue |
$ | 38,784 | $ | 20,685 | $ | 18,099 | 87 | % | ||||||||
Cost of revenue and gross margin
Cost of revenue increased by 50% to $18.6 million for the year ended December 31, 2013 from $12.4 million in the same period in 2012. This increase in cost of revenue was due to the increased volume of kits sold and an increase in volume of tests sold through our laboratories in the United States and the United Kingdom. Gross margin increased to 52% in 2013 from 40% in 2012. The gross margin percent improvement was attributable to a reduction in material costs per test and efficiency from increased volume in our manufacturing operations. In 2012, we incurred costs related to the start-up of our new laboratory in Memphis, Tennessee and in late 2012 and early 2013, we incurred extra costs related to running two labs. In the first quarter of 2013, we consolidated our U.S. laboratory operations in Memphis, Tennessee and closed our Marlborough, Massachusetts laboratory. Operating a single laboratory in the United States has already yielded significant operating leverage that has also led to improving margins.
|
Year ended December 31, |
Change |
|||||||||||||||
|
(in thousands, except percentages) |
2013 |
2012 |
Amount |
% |
||||||||||||
|
Cost of revenue |
||||||||||||||||
|
Product |
$ | 8,475 | $ | 4,329 | $ | 4,146 | 96 | % | ||||||||
|
Service |
10,125 | 8,095 | 2,030 | 25 | % | |||||||||||
|
Total cost of revenue |
$ | 18,600 | $ | 12,424 | $ | 6,176 | 50 | % | ||||||||
Research and development expenses
Research and development expenses increased by 10% to $2.1 million for the year ended December 31, 2013 from $1.9 million for the same period in 2012. This increase was primarily related to development project expenses and to the establishment of a technical team in the United States to improve processes efficiency and reduce costs in our U.S. laboratory operations. As a percentage of total revenue, research and development expenses decreased to 6% for the year ended December 31, 2013 from 9% for the same period in 2012.
Sales and marketing expenses
Sales and marketing expenses increased 19% to $13.3 million for the year ended December 31, 2013 from $11.2 million for the same period in 2012. The increase reflects an increase in sales personnel and in personnel-related costs for higher commissions on increased sales and for hiring of sales, marketing, administrative and technical support personnel in our office in Japan. As a percentage of total revenue, sales and marketing expenses decreased to 34% for the year ended December 31, 2013 from 54% for the same period in 2012.
General and administrative expenses
General and administrative expenses increased by 50% to $12.1 million for the year ended December 31, 2013 from $8.1 million for the same period in 2012. The increase was due to accounting and auditing costs in the third and fourth quarters of 2013 related to our public offering in the fourth quarter of 2013 and increases in personnel-related costs associated with increases in our legal, accounting and finance, IT, corporate development and human resources headcount, and consulting costs to support our growth. As a percentage of total revenue, general and administrative expenses decreased to 31% for the year ended December 31, 2013 from 39% for the same period in 2012.
Interest expense, net
Interest expense, net was $0.3 million for the year ended December 31, 2013 as compared to $1.5 million in the same period in 2012. The 2013 expense consisted primarily of interest expense on our term debt and revolving credit facilities. We repaid the borrowings under our credit facility with Comerica Bank in May 2013 and entered into a new term loan and revolving line of credit with Square 1 Bank. This loan was repaid and the credit facility cancelled in December 2013, following our IPO. See “– Liquidity and capital resources – Sources of funds – Credit facilities.” The 2012 expense included interest on a revolving line of credit and a $1.3 million loan discount that was recorded as interest expense, related to a 2012 convertible bridge loan agreement with then-existing investors.
Comparison of years ended December 31, 2012 and 2011
The following table sets forth, for the periods indicated, the amounts of certain components of our statements of operations and the percentage of total revenue represented by these items, showing period-to-period changes.
|
Year ended December 31, |
||||||||||||||||||||||||
|
2012 |
2011 |
Change |
||||||||||||||||||||||
|
(in thousands, except percentages) |
Amount |
% of |
Amount |
% of |
Amount |
% |
||||||||||||||||||
|
Revenue: |
||||||||||||||||||||||||
|
Product |
$ | 9,080 | 44 | % | $ | 6,281 | 50 | % | $ | 2,799 | 45 | % | ||||||||||||
|
Service |
11,605 | 56 | % | 6,360 | 50 | % | 5,245 | 82 | % | |||||||||||||||
|
Total revenue |
20,685 | 100 | % | 12,641 | 100 | % | 8,044 | 64 | % | |||||||||||||||
|
Cost of revenue: |
||||||||||||||||||||||||
|
Product |
4,329 | 21 | % | 2,955 | 23 | % | 1,374 | 47 | % | |||||||||||||||
|
Service |
8,095 | 39 | % | 5,462 | 43 | % | 2,633 | 48 | % | |||||||||||||||
|
Total cost of revenue |
12,424 | 60 | % | 8,417 | 67 | % | 4,007 | 48 | % | |||||||||||||||
|
Gross profit |
8,261 | 40 | % | 4,224 | 33 | % | 4,037 | 96 | % | |||||||||||||||
|
Operating expenses: |
||||||||||||||||||||||||
|
Research and development |
1,947 | 9 | % | 1,780 | 14 | % | 167 | 9 | % | |||||||||||||||
|
Sales and marketing |
11,177 | 54 | % | 10,536 | 83 | % | 641 | 6 | % | |||||||||||||||
|
General and administrative |
8,068 | 39 | % | 5,232 | 41 | % | 2,836 | 54 | % | |||||||||||||||
|
Total operating expenses |
21,192 | 102 | % | 17,548 | 139 | % | 3,644 | 21 | % | |||||||||||||||
|
Loss from operations |
(12,931 | ) | (63 | )% | (13,324 | ) | (105 | )% | 393 | (3 | )% | |||||||||||||
|
Interest expense, net |
(1,477 | ) | (7 | )% | (3 | ) | 0 | % | (1,474 | ) | — | |||||||||||||
|
Foreign exchange (losses) gains |
(626 | ) | (3 | )% | 28 | 0 | % | (654 | ) | — | ||||||||||||||
|
Other income |
— | 0 | % | 76 | 1 | % | (76 | ) | (100 | )% | ||||||||||||||
|
Loss before income taxes |
(15,034 | ) | (73 | )% | (13,223 | ) | (105 | )% | (1,811 | ) | 14 | % | ||||||||||||
|
Income tax benefit |
(151 | ) | (1 | )% | (119 | ) | (1 | )% | (32 | ) | 27 | % | ||||||||||||
|
Net loss |
$ | (14,883 | ) | (72 | )% | $ | (13,104 | ) | (104 | )% | $ | (1,779 | ) | 14 | % | |||||||||
Revenue
Revenue increased by 64% to $20.7 million for the year ended December 31, 2012 compared to $12.6 million for the year ended December 31, 2011. This increase in revenue was due to an increase in volume across all the regions where we sell our test. U.S. revenue grew by 85%, driven by growth of $2.7 million from existing customers and $1.6 million from the addition of new customers. Asia revenue grew by $2.3 million or 161% due to increased uptake of our T-SPOT.TB test in China since its launch in 2010. Europe & ROW revenue growth was 17% led by strong growth in our U.K. laboratory service volume.
|
Year ended |
Change |
|||||||||||||||
|
(in thousands, except percentages) |
2012 |
2011 |
Amount |
% |
||||||||||||
|
Revenue |
||||||||||||||||
|
Product |
$ | 9,080 | $ | 6,281 | $ | 2,799 | 45 | % | ||||||||
|
Service |
11,605 | 6,360 | 5,245 | 82 | % | |||||||||||
| Total revenue | $ | 20,685 | $ | 12,641 | $ | 8,044 | 64 | % | ||||||||
|
Year ended |
Change |
|||||||||||||||
|
(in thousands, except percentages) |
2012 |
2011 |
Amount |
% |
||||||||||||
|
Revenue |
||||||||||||||||
|
United States |
$ | 10,366 | $ | 5,604 | $ | 4,762 | 85 | % | ||||||||
|
Europe & ROW |
6,530 | 5,587 | 943 | 17 | % | |||||||||||
|
Asia |
3,789 | 1,450 | 2,339 | 161 | % | |||||||||||
|
Total revenue |
$ | 20,685 | $ | 12,641 | $ | 8,044 | 64 | % | ||||||||
Cost of revenue and gross margin
Cost of revenue increased by 48% to $12.4 million for the year ended December 31, 2012 from $8.4 million for the same period in 2011. This increase in cost of revenue was due to an increase in volume of tests ordered by our customers. In addition, we incurred costs related to the start-up of our new laboratory in Memphis, Tennessee and incurred extra costs related to running two labs until our Marlborough, Massachusetts lab was closed in the first quarter of 2013. Gross margin increased to 40% for the year ended December 31, 2012 from 33% for the same period in 2011. The gross margin percentage improvement resulted from an increase in volume of kits manufactured, reduction in material costs and leverage related to the significant increase in test volume processed through our U.S. laboratory operations.
|
Year ended |
Change |
|||||||||||||||
|
(in thousands, except percentages) |
2012 |
2011 |
Amount |
% |
||||||||||||
|
Cost of Revenue |
||||||||||||||||
|
Product |
$ | 4,329 | $ | 2,955 | $ | 1,374 | 46 | % | ||||||||
|
Service |
8,095 | 5,462 | 2,633 | 48 | % | |||||||||||
| Total cost of revenue | $ | 12,424 | $ | 8,417 | $ | 4,007 | 48 | % | ||||||||
Research and development expenses
Research and development expenses increased by 9% to $1.9 million for the year ended December 31, 2012 from $1.8 million in the same period in 2011. The increase was primarily related to cost improvement activities. As a percentage of total revenue, research and development expenses decreased to 9% for the year ended December 31, 2012 from 14% for the same period in 2011.
Sales and marketing expenses
Sales and marketing expenses increased 6% to $11.2 million for the year ended December 31, 2012 from $10.5 million for the same period in 2011. The increase was primarily due to an increase in personnel-related costs associated with the opening our sales office in Japan and the addition of sales representatives in the United States. As a percentage of total revenue, sales and marketing expenses decreased to 54% for the year ended December 31, 2012 from 83% for the same period in 2011.
General and administrative expenses
General and administrative expenses increased by 54% to $8.1 million for the year ended December 31, 2012 from $5.2 million in the same period last year. The increase was primarily due to the addition of 12 key management and professional positions in our accounting and finance, legal, IT and human resources departments, and other related costs to support our growth. As a percentage of total revenue, general and administrative expenses decreased to 39% for the year ended December 31, 2012 from 41% for the same period in 2011.
Interest expense, net
Interest expense, net was $1.5 million for the year ended December 31, 2012 as compared to $3,000 for the same period in 2011. The 2012 expense included interest on a revolving line of credit and a $1.3 million loan discount that was recorded as interest expense, related to a 2012 convertible bridge loan agreement with then-existing investors. The 2011 expense was for interest on capitalized leases.
Liquidity and capital resources
Sources of funds
Since our inception, we have incurred significant net losses and negative cash flows from operations. For the year ended December 31, 2013 we had a net loss of $8.7 million and used $5.6 million of cash for operating activities. As of December 31, 2013, we had an accumulated deficit of $99.7 million. We incurred a net loss of $14.9 million and used $14.4 million of cash for operating activities for the year ended December 31, 2012.
As of December 31, 2013, we had cash and cash equivalents of $76.5 million. Prior to our initial public offering in November 2013, we financed our operations principally through private placements of convertible preferred ordinary shares and convertible debt, borrowings from our credit facilities, and revenue from the sale of our tests. Through September 2013, we had raised $110 million in gross proceeds through private placements of convertible preferred ordinary shares and convertible debt. On November 21, 2013, our registration statement for the initial public offering, or IPO, was declared effective by the Securities and Exchange Commission. We sold 6,164,000 ordinary shares, at an initial public offering price of $12.00 per share, which included the exercise in full by the underwriters of their option to purchase up to 804,000 additional ordinary shares. Net proceeds from the IPO were approximately $63.9 million, after deducting underwriting discounts and commissions and offering expenses.
Credit facilities
In February 2012 we entered into a loan and security agreement with Comerica Bank that provided for borrowings of up to $3.0 million initially through February 2013 and extended through May 2013. In February 2012, we borrowed $1.5 million under the credit facility. Interest accrued daily on the outstanding balance at the prime rate plus 1.5%, with a minimum of the Daily Adjusting LIBOR rate plus 2.5% per annum. The loan was secured by substantially all of our assets. This loan was repaid in May 2013.
In May 2013, we entered into a new loan and security agreement with Square 1 Bank consisting of a term loan and a revolving line of credit, and repaid the loan from Comerica Bank. The Square 1 Bank loan was secured by substantially all of our assets. Tranche A of the term loan, which was borrowed at closing, was for $6.0 million. The revolving line of credit allowed us to borrow up to $5.0 million, had a maturity date of May 24, 2015 and bore interest at 1.75% above the prime rate or 5.0% per annum, whichever was greater. The term loan was repaid and the revolving line of credit cancelled in December 2013, following the completion of our IPO.
Convertible promissory note
In October 2013, the Company issued a convertible promissory note in the amount of $5.0 million to Fosun Industrial Co., Ltd., (the Fosun Note). The Fosun Note paid interest at 8% per annum.
In the event of an IPO, the Fosun Note principal and accrued interest would automatically convert to ordinary shares at a 10% discount to the IPO offering price. Fosun also had an option to elect, prior to July 1, 2014, to require the Company to create and then convert the Fosun Note to H preferred ordinary shares or pay in full all principal and interest outstanding on or before July 1, 2016. In the event of an IPO, the shares would be subjected to restrictions prohibiting sale or transfer of more than one-third of the shares each year for the first three years following the offering.
The feature which required automatic conversion upon an IPO was a redemption feature that met the definition of an embedded derivative requiring bifurcation from the Fosun Note. The Company determined there was no initial fair market value of the liability.
In connection with the Company’s IPO in November 2013, the Fosun Note and interest of approximately $50,000 converted into 467,551 of the Company’s ordinary shares at a price per share which reflected a 10% discount to the IPO offering price of $12.00 per share. Upon conversion of the Fosun Note to ordinary shares, the derivative liability terminated. In connection with the IPO the Company marked the embedded derivative to market and recorded a $561,000 loss on the change in the fair value of the instrument.
Summary of cash flows
Cash flows for the years ended December 31, 2013 and 2012
Operating activities
Net cash used in operating activities was $5.6 million during the year ended December 31, 2013, which included a net loss of $8.7 million, non-cash items of $2.1 million, and a net decrease in operating assets less liabilities of $1.0 million. The non-cash items consisted of depreciation and amortization expense of $1.1 million, a $0.6 million loss on change in fair value of a derivative instrument, a $0.3 million loss on change in fair value of warrants, and share-based compensation expense of $0.1 million. We had a net cash inflow of $1.0 million from changes in operating assets and liabilities during the period. The significant items in the changes in operating assets and liabilities included an increase in accounts payable and accrued expenses of $3.4 million, a decrease in accounts receivable of $0.6 million, and an increase in deferred income of $0.6 million, partially offset by an increase in inventory of $2.8 million and an increase in prepaid expenses and other assets of $0.9 million. The increase in accounts payable and accrued expenses was primarily related to higher operating expenses due to growth in our business. The decrease in accounts receivable reflects the timing of significant payments from our Asian customers. The increase in deferred income relates to the growth in sales to our Japanese importer. Inventory has been increasing in anticipation of growing revenue. The increase in prepaid expenses and other assets reflects increased value added tax (VAT) receivables in the United Kingdom and increased deferred cost of revenue due to increased sales in Japan.
Net cash used in operating activities was $14.4 million during the year ended December 31, 2012, which included net loss of $14.9 million and non-cash items of $2.4 million and a net increase in operating assets less liabilities of $1.9 million . The non-cash items consisted primarily of a $1.4 million loan discount that was recorded as interest expense related to the 2012 convertible bridge note agreement, depreciation and amortization expense of $0.8 million and share-based compensation expense of $0.1 million. We also had a net cash outflow of $1.9 million from changes in operating assets and liabilities during the period. The significant items in the changes in operating assets and liabilities included an increase in accounts receivable of $3.1 million and an increase in inventory of $1.0 million offset by an increase in accrued expenses of $1.6 million and an increase in deferred revenue of $0.8 million. The increase in accounts receivable and inventory was due primarily to the growth in our revenue. The increase in accrued expenses was primarily related to increases in accrued employee related expenses and accrued royalties. The increase in deferred revenue relates to the growth in sales to our Japanese importer.
Investing activities
Net cash used in investing activities was $1.8 million and $1.9 million for the years ended December 31, 2013 and 2012, respectively. These amounts related primarily to purchases of property and equipment and intangible assets, and a change in restricted cash pledged as security in connection with our facilities leases.
Financing activities
Net cash provided by financing activities was $70.7 million during the year ended December 31, 2013, consisting primarily of $63.9 million raised in our IPO, after deducting underwriting discounts and commissions, and offering expenses.
Net cash provided by financing activities was $26.2 million during the year ended December 31, 2012, consisting primarily of $12.7 million in proceeds from the first tranche of the G preferred ordinary share financing, $8.1 million of proceeds received in advance related to the second tranche of the G preferred ordinary share financing, $4.0 million in proceeds from the 2012 convertible bridge notes and $1.5 million from borrowings under the Comerica Bank loan.
Cash flows for the years ended December 31, 2012 and 2011
Operating activities
Net cash used in operating activities was $14.4 million during the year ended December 31, 2012, which included net loss of $14.9 million and non-cash items of $2.4 million. The non-cash items consisted primarily of a $1.4 million loan discount that was recorded as interest expense related to the 2012 convertible bridge note agreement, depreciation and amortization expense of $0.8 million and share-based compensation expense of $0.1 million. We also had a net cash outflow of $1.9 million from changes in operating assets and liabilities during the period. The significant items in the changes in operating assets and liabilities included an increase in accounts receivable of $3.1 million and an increase in inventory of $1.0 million offset by an increase in accrued expenses of $1.6 million and an increase in deferred revenue of $0.8 million. The increase in accounts receivable and inventory was due primarily to the growth in our revenue. The increase in accrued expenses was primarily related to increases in accrued employee related expenses and accrued royalties. The increase in deferred revenue relates to the commencement of sales to our Japanese importer in 2012.
Net cash used in operating activities was $12.7 million during the year ended December 31, 2011, which included a net loss of $13.1 million, non-cash items of $0.9 million and $0.4 million of net cash outflow from changes in operating assets and liabilities during the period. The non-cash items consisted primarily of $0.6 million in depreciation and amortization. The change in operating assets and liabilities was primarily driven by an increase in our accounts receivable of $1.0 million as a result of the growth in our revenue, and an increase in inventory of $0.3 million offset by increases in accounts payable and accrued expenses of $0.5 million and $0.4 million, respectively, to support our growth.
Investing activities
Net cash used in investing activities was $1.9 million and $1.6 million for the years ended December 31, 2012 and 2011, respectively. These amounts related primarily to purchases of property and equipment of $1.5 million and $1.2 million for the years ended December 31, 2012 and 2011, respectively, related to the expansion of our manufacturing and laboratory facilities in the United States and the United Kingdom. In addition, restricted cash pledged as security related to our facilities leases increased by $0.3 million and $0.4 million for the years ended December 31, 2012 and 2011, respectively.
Financing activities
Net cash provided by financing activities was $26.2 million during the year ended December 31, 2012, consisting primarily of $12.7 million in proceeds from the first tranche of the G preferred ordinary share financing, $8.1 million of proceeds received in advance related to the second tranche of the G preferred ordinary share financing, $4.0 million in proceeds from the 2012 convertible bridge notes and $1.5 million from borrowings under the Comerica Bank loan.
Net cash provided by financing activities was $9.9 million during the year ended December 31, 2011, consisting of $10.0 million in proceeds from the third tranche of the F preferred ordinary share financing, reduced by $0.1 million for payments on a revolving line of credit.
Operating and capital expenditure requirements
We have not achieved profitability on a quarterly or annual basis since our inception and we expect to incur net losses in the future. We expect that our operating expenses will increase as we continue to invest to grow our customer base, expand our marketing and distribution channels, hire additional employees and increase product development expenditures.
Additionally, as a public company, we incur significant audit, legal and other expenses that we did not incur as a private company. We believe that our existing capital resources will be sufficient to fund our operations for the next few years.
Our future capital requirements will depend on many factors, including:
|
• |
Our ability to continue to penetrate our existing market and new markets in the United States; |
|
• |
The costs and timing of further expansion of our sales and marketing efforts; |
|
• |
Our ability to penetrate existing markets outside the United States and enter and develop new geographies; |
|
• |
The progress that we make in developing new products based on our platform technology; |
|
• |
The percentage of sales that are reimbursed by payors and our ability to collect our accounts receivable; |
|
• |
Our ability to generate cash from operations; and |
|
• |
The acquisition of businesses or technologies that we may undertake. |
Contractual obligations
We have contractual obligations for non-cancelable facilities leases, equipment leases and purchase commitments. Purchase commitments include future minimum royalty, license, and exclusivity payments to be paid under our license agreements with third parties for access to certain technologies. The following table reflects a summary of our contractual obligations as of December 31, 2013.
|
Payments due by period |
||||||||||||||||||||
|
(in thousands) |
Total |
Less than |
1-3 |
3-5 |
More than |
|||||||||||||||
|
Operating lease obligations |
$ | 4,874 | $ | 973 | $ | 1,969 | $ | 1,655 | $ | 277 | ||||||||||
|
Purchase commitments |
11,470 | 1,937 | 3,808 | 3,808 | 1,917 | |||||||||||||||
|
Total |
$ | 16,344 | $ | 2,910 | $ | 5,777 | $ | 5,463 | $ | 2,194 | ||||||||||
Critical accounting policies and significant judgments and estimates
We have prepared our consolidated financial statements in accordance with U.S. GAAP. Our preparation of these consolidated financial statements requires us to make estimates, assumptions and judgments that affect the reported amounts of assets, liabilities, expenses and related disclosures at the date of the consolidated financial statements, as well as revenue and expenses during the reporting periods. We evaluate our estimates and judgments on an ongoing basis. We base our estimates on historical experience and on various other factors that we believe are reasonable under the circumstances, the results of which form the basis for making judgments about the carrying value of assets and liabilities that are not readily apparent from other sources. Actual results could therefore differ materially from these estimates under different assumptions or conditions.
While our significant accounting policies are described in more detail in Note 1 to our consolidated financial statements included in this Annual Report on Form 10-K, we believe the following accounting policies to be critical to the judgments and estimates used in the preparation of our financial statements.
Revenue recognition and accounts receivable
We derive revenue from the sale of our T-SPOT.TB diagnostic test to a broad range of customers including hospitals, public health departments, commercial testing laboratories, importers and distributors. We offer our T-SPOT.TB test in either an in vitro diagnostic kit or a service format.
Revenue from tests is generally paid directly by the customer and is recognized on the accrual basis when the following revenue recognition criteria are met: (1) persuasive evidence that an arrangement exists; (2) the kit has been shipped or delivered or, in the case of tests performed in our laboratory, when final results have been reported to the customer; (3) the price is fixed or determinable; and (4) collectability is reasonably assured.
In the United States, we also generate revenue from payments that are received from a variety of third-party payors, including government programs (Medicare and Medicaid) and commercial insurance companies, each with different billing requirements. Revenue from tests paid by third-party payors is recognized on an accrual basis based on our historical collection experience.
For kits sold in Japan, we recognize revenue after delivery to the wholesaler and when the wholesaler receives a firm order from its customer at which point our price becomes determinable.
Accounts receivable are primarily amounts due from hospitals, public health departments, commercial testing laboratories, distributors and universities in addition to third party payors such as commercial insurance companies (including managed care organizations), government programs (Medicare and Medicaid in the United States) and individual patients.
Accounts receivable are reported net of an allowance for uncollectible accounts. The process of estimating the collection of accounts receivable involves significant assumptions and judgments. Specifically, the accounts receivable allowance is based on management’s analysis of current and past due accounts, collection experience in relation to amounts billed, channel mix, any specific customer collection issues that have been identified and other relevant information. Our provision for uncollectible accounts is recorded as bad debt expense and included in general and administrative expenses. Although we believe amounts provided are adequate, the ultimate amounts of uncollectible accounts receivable could be in excess of the amounts provided.
Income taxes
We account for income taxes under the asset and liability method, which requires, among other things, that deferred income taxes be provided for temporary differences between the tax basis of our assets and liabilities and their financial statement reported amounts. In addition, deferred tax assets are recorded for the future benefit of utilizing NOLs and research and development credit carryforwards. A valuation allowance is established when necessary to reduce deferred tax assets to the amount expected to be realized.
We follow the accounting guidance for uncertainties in income taxes, which prescribes a recognition threshold and measurement process for recording uncertain tax positions taken, or expected to be taken, in a tax return in the financial statements. Additionally, the guidance also prescribes the derecognition, classification, accounting in interim periods and disclosure requirements for uncertain tax positions. We accrue for the estimated amount of taxes for uncertain tax positions if it is more likely than not that we would be required to pay such additional taxes. An uncertain tax position will not be recognized if it has less than a 50% likelihood of being sustained. We did not have any accrued interest or penalties associated with any unrecognized tax positions, and there were no such interest or penalties recognized during the years ended December 31, 2013, 2012, or 2011.
Share-based compensation
Share-based compensation includes grants of options to purchase ordinary shares. Currently, we maintain one share incentive plan pursuant to which we may grant options to purchase our ordinary shares, restricted shares, restricted share units, and other share-based awards to our employees, directors and officers. This incentive plan is called the Oxford Immunotec Global PLC 2013 Share Incentive Plan, or the 2013 Plan. In addition, we maintain the 2008 Amended and Restated Stock Incentive Plan, or the 2008 Plan. No new share grants or awards will be made under the 2008 Plan.
We measure the cost of equity-settled transactions with employees by reference to the fair value of the equity instruments at the date on which they are granted. Estimating fair value for share-based payment transactions requires determining the most appropriate valuation model, which is dependent on the terms and conditions of the grant. This estimate also requires determining the most appropriate inputs to the valuation model, including the expected life of the award, volatility and dividend yield, and making certain assumptions about the award. We describe the assumptions and models that we use to estimate the fair value for share-based payment transactions in our financial statements included with this Annual Report on Form 10-K.
Our share-based compensation expense is as follows:
|
Year ended December 31, |
||||||||||||
|
2013 |
2012 |
2011 |
||||||||||
|
Cost of revenue |
$ | 5 | $ | 2 | $ | 4 | ||||||
|
General and administrative |
108 | 55 | 85 | |||||||||
|
Research and development |
1 | 4 | 4 | |||||||||
|
Sales and marketing |
26 | 18 | 32 | |||||||||
|
Total share-based compensation expense |
$ | 140 | $ | 79 | $ | 125 | ||||||
We use the Black-Scholes option pricing model to value the share option awards. The Black-Scholes option pricing model requires the input of subjective assumptions, including assumptions about the expected life of share-based payment awards and share price volatility. In addition, when we were a private company, one of the most subjective inputs into the Black-Scholes option pricing model was the estimated fair value of our ordinary shares. Due to the lack of an adequate history of a public market for the trading of our ordinary shares and a lack of adequate company specific historical and implied volatility data, we have based our estimate of expected volatility on the historical volatility of a group of similar companies that are publicly traded. For these analyses, we have selected companies with comparable characteristics to ours including enterprise value, risk profiles, position within the industry, and with historical share price information sufficient to meet the expected life of the share-based awards. We compute the historical volatility data using the daily closing prices for the selected companies' shares during the equivalent period of the calculated expected term of our share-based awards. We will continue to apply this process until a sufficient amount of historical information regarding the volatility of our own share price becomes available.
We determine the expected term for share option grants to employees based on the “simplified” method prescribed under Staff Accounting Bulletin Topic 14: Share-based Payments. Under this approach, the weighted-average expected life is presumed to be the average of the vesting term and the contractual term of the option. The risk-free interest rate is a weighted-average assumption equivalent to the expected term based on the United States Treasury yield curve in effect as of the date of grant. The assumptions used in calculating the fair value of the share-based payment awards represent our best estimate and involve inherent uncertainties and the application of our judgment. As a result, if factors change and we use different assumptions, share-based compensation expense could be materially different in the future.
For the years ended December 31, 2013, 2012, and 2011, we calculated the fair value of share options granted under the Plan using the Black-Scholes option pricing model with the following assumptions:
|
Year ended December 31, |
||||||||||||
|
2013 |
2012 |
2011 |
||||||||||
|
Expected dividend yield (%) |
— | — | — | |||||||||
|
Expected volatility (%) |
47.78 | 49.43 | 53.87 | |||||||||
|
Risk-free interest rate (%) |
1.38 | 1.03 | 1.75 | |||||||||
|
Expected life of option (years) |
6.22 | 6.25 | 6.25 | |||||||||
In accordance with Financial Accounting Standards Board, Accounting Standards Codification 718, Compensation—Stock Compensation, we recognize expense based on the share option grant’s pre-defined vesting schedule over the requisite service period using the straight-line method for all employee share options. In addition to the assumptions used to calculate the fair value of the share options, we are required to estimate the expected forfeiture rate of all share-based awards and only recognize expense for those awards expected to vest. The estimation of the number of share awards that will ultimately vest requires judgment, and to the extent actual results or updated estimates differ from our current estimates, such amounts will be recorded as a cumulative adjustment in the period in which estimates are revised. We consider multiple factors when estimating expected forfeitures, including employee position and historical employee turnover data. During the period in which the share options vest, we will record additional expense if the actual forfeiture rate is lower than the estimated forfeiture rate and a recovery of expense if the actual forfeiture rate is higher than estimated.
Off-balance sheet arrangements
We do not have any relationships with unconsolidated entities or financial partnerships, such as entities often referred to as structured finance or special purpose entities, which would have been established for the purpose of facilitating off-balance sheet arrangements or for any other contractually narrow or limited purpose.
Recent accounting pronouncements
We have considered recent accounting pronouncements and determined that they are either not applicable to our business or that no material effect is expected on the consolidated financial statements as a result of future adoption.
Under the U.S. Jumpstart our Business Startups Act, or the JOBS Act, emerging growth companies that become public can delay adopting new or revised accounting standards until such time as those standards apply to private companies. We irrevocably elected not to avail ourselves of this exemption from new or revised accounting standards and, therefore, we are subject to the same new or revised accounting standards as other public companies that are not emerging growth companies.
Item 7A. Quantitative and Qualitative Disclosures About Market Risk
As of December 31, 2013, we had cash and cash equivalents of $76.5 million, and restricted cash of $0.4 million. Restricted cash primarily consists of amounts pledged as security for our facility leases in the United States.
We are exposed to market risks in the ordinary course of our business. These market risks are principally limited to interest rate fluctuations, capital market fluctuations, and foreign currency exchange rate fluctuations, as discussed below.
Interest rate fluctuations
Changes in the general level of U.S. and European interest rates expose the Company to interest rate risk. These changes could affect our interest income and interest expense. Based on our cash and cash equivalents at December 31, 2013, if interest rates went either up or down one percentage point, this could change our interest income by approximately $0.8 million per annum.
Capital market fluctuations
Our cash and cash equivalents are invested in interest-bearing savings and money market accounts. We do not enter into investments for trading or speculative purposes. Due to the conservative nature of our investment portfolio, which is predicated on capital preservation of investments with short term maturities, we do not believe capital market fluctuations would have a material effect on the fair market value of our portfolio.
Foreign currency exchange rate fluctuations
We are exposed to foreign exchange rate risk. Because we currently operate in three major regions of the world: the United States, Europe & ROW, and Asia, our revenue is denominated in multiple currencies. About 45% of our sales are in the United States, which are denominated in U.S. Dollars. Sales in China are denominated in U.S. Dollars but these sales are made by our United Kingdom-based subsidiary where the Pound Sterling is the functional currency. As a result, these sales are subject to remeasurement into Pounds Sterling and then translation into U.S. Dollars when we consolidate our financial statements. Sales in Europe are denominated primarily in the Pound Sterling and Euro. As we grow Europe & ROW sales outside the United Kingdom and the Euro Zone, we will be subject to risk from additional currencies. Sales in Japan are denominated in Yen, and our sales in Japan, which started in late 2012, grew significantly in 2013.
Our expenses are generally denominated in the currencies in which our operations are located, which is primarily in the United States, the United Kingdom and Japan.
As we continue to grow our business outside the United States, our results of operations and cash flows will be subject to fluctuations due to changes in foreign currency exchange rates, which could harm our business in the future. To date, we have not entered into any foreign currency hedging contracts although we may do so in the future.
Item 8. Financial Statements and Supplementary Data
The information required by this item may be found beginning on page F-1 of this Annual Report on Form 10-K with the exception of the unaudited consolidated quarterly operations data, which is presented below. We have prepared the consolidated quarterly operations data on a consistent basis with the audited consolidated financial statements included elsewhere in this Annual Report on Form 10-K. In the opinion of management, the quarterly consolidated operations data reflects all necessary adjustments, consisting only of normal recurring adjustments, necessary for a fair presentation of these data. Historical results are not necessarily indicative of the results to be expected in future periods, and the results for a quarterly period are not necessarily indicative of the operating results for a full year. This information should be read in conjunction with the consolidated financial statements included elsewhere in this Annual Report Form 10-K.
|
Three Months Ended |
||||||||||||||||
|
(in thousands, except share and per share data) (unaudited) |
March 31, |
June 30, |
September 30, |
December 31, |
||||||||||||
|
Revenue: |
||||||||||||||||
|
Product |
$ | 4,121 | $ | 5,790 | $ | 4,977 | $ | 5,017 | ||||||||
|
Service |
3,558 | 4,364 | 5,749 | 5,208 | ||||||||||||
|
Total revenue |
$ | 7,679 | $ | 10,154 | $ | 10,726 | $ | 10,225 | ||||||||
|
Gross profit |
$ | 3,312 | $ | 5,287 | $ | 5,795 | $ | 5,790 | ||||||||
|
Net loss |
$ | (1,201 | ) | $ | (954 | ) | $ | (3,181 | ) | $ | (3,328 | ) | ||||
|
Net loss per share attributable to ordinary shareholders—basic and diluted |
$ | (0.56 | ) | $ | (0.41 | ) | $ | (1.36 | ) | $ | (0.38 | ) | ||||
|
Weighted-average shares used to compute net loss attributable to ordinary shareholders—basic and diluted |
2,154,285 | 2,331,006 | 2,331,990 | 8,721,880 | ||||||||||||
|
Three Months Ended |
||||||||||||||||
|
(in thousands, except share and per share data) (unaudited) |
March 31, |
June 30, |
September 30, |
December 31, |
||||||||||||
|
Revenue: |
||||||||||||||||
|
Product |
$ | 2,225 | $ | 2,199 | $ | 2,383 | $ | 2,273 | ||||||||
|
Service |
2,449 | 2,712 | 3,438 | 3,006 | ||||||||||||
|
Total revenue |
$ | 4,674 | $ | 4,911 | $ | 5,821 | $ | 5,279 | ||||||||
|
Gross profit |
$ | 1,946 | $ | 1,903 | $ | 2,434 | $ | 1,978 | ||||||||
|
Net loss |
$ | (2,927 | ) | $ | (4,034 | ) | $ | (3,633 | ) | $ | (4,289 | ) | ||||
|
Net loss per share attributable to ordinary shareholders—basic and diluted |
$ | (2.29 | ) | $ | (2.76 | ) | $ | (1.82 | ) | $ | (1.99 | ) | ||||
|
Weighted-average shares used to compute net loss attributable to ordinary shareholders—basic and diluted |
1,275,776 | 1,460,008 | 2,001,008 | 2,153,826 | ||||||||||||
|
(1) |
Net loss includes $1.2 million and $0.6 million of accounting and auditing costs related to our Initial Public Offering (IPO) for the three months ended September 30, 2013 and December 31, 2013, respectively. |
Our revenue fluctuates from quarter to quarter as a result of a number of factors, many of which are outside our control. Our service revenue has historically been strong in the third quarter as a result of a concentration of testing in the United States related to college students returning to school, while the fourth quarter has historically been weaker due to the holiday periods and decreased screening activity in hospitals as they focus on other priorities. Additionally, we see fluctuation in our product revenue from quarter to quarter, due to ordering patterns, particularly relating to our large distributor customers. As a result of such factors, we expect to continue to see seasonality and quarter-to-quarter variations in our revenue.
Item 9. Changes in and Disagreements with Accountants on Accounting and Financial Disclosure
There have been no changes in or disagreements with accountants on accounting and financial disclosure matters in the last fiscal year.
Item 9A. Controls and procedures
(a) Evaluation of disclosure controls and procedures
Our management, with the participation of our Chief Executive Officer and Chief Financial Officer, has evaluated the effectiveness of our disclosure controls and procedures (as defined in Exchange Act Rules 13a-15(e) and 15d-15(e)) as of the end of the period covered by this Form 10-K. Based on such evaluation, our Chief Executive Officer and Chief Financial Officer have concluded that our disclosure controls and procedures were effective to ensure that information required to be disclosed by us in the reports that we file or submit under the Exchange Act is recorded, processed, summarized and reported, within the time periods specified in the SEC’s rules and forms, and is accumulated and communicated to our management, including our Chief Executive and Chief Financial Officers, or persons performing similar functions, as appropriate to allow timely decisions regarding required disclosure.
(b) Management’s report on internal control over financial reporting
The Annual Report on Form 10-K does not include a report of management’s assessment regarding internal control over financial reporting or an attestation report of our independent registered public accounting firm due to a transition period established by the rules of the SEC for newly public companies.
(c) Changes in internal control over financial reporting
There have been no changes to our internal control over financial reporting (as defined in Rules 13a-15(f) and 15d-15(f) under the Exchange Act) during the period covered by this Annual Report on Form 10-K that have materially affected, or are reasonably likely to materially affect, our internal control over financial reporting.
Item 9B. Other information
None.
PART III
Item 10. Directors, Executive Officers and Corporate Governance
The information required under this item is incorporated herein by reference to our definitive proxy statement pursuant to Regulation 14A, to be filed with the Commission not later than 120 days after the close of our fiscal year ended December 31, 2013.
Item 11. Executive Compensation
The information required under this item is incorporated herein by reference to our definitive proxy statement pursuant to Regulation 14A, to be filed with the Commission not later than 120 days after the close of our fiscal year ended December 31, 2013.
Item 12. Security Ownership of Certain Beneficial Owners and Management and Related Stockholder Matters
The information required under this item is incorporated herein by reference to our definitive proxy statement pursuant to Regulation 14A, to be filed with the Commission not later than 120 days after the close of our fiscal year ended December 31, 2013.
Item 13. Certain Relationships and Related Transactions and Director Independence
The information required under this item is incorporated herein by reference to our definitive proxy statement pursuant to Regulation 14A, to be filed with the Commission not later than 120 days after the close of our fiscal year ended December 31, 2013.
Item 14. Principal Accounting Fees and Services
The information required under this item is incorporated herein by reference to our definitive proxy statement pursuant to Regulation 14A, to be filed with the Commission not later than 120 days after the close of our fiscal year ended December 31, 2013.
PART IV
Item 15. Exhibits, Financial Statement Schedules
|
(a) |
1. |
Financial Statements |
As part of this Annual Report on Form 10-K, the consolidated financial statements are listed in the accompanying index to financial statements on page F-1.
|
2. |
Financial Statement Schedules |
All schedules have been omitted because they are not required, not applicable, not present in amounts sufficient to require submission of the schedule, or the required information is otherwise included.
|
|
3. |
Exhibit Index |
The following is a list of exhibits filed as part of this Annual Report on Form 10-K:
|
Exhibit |
Description of exhibit |
|
3.1 |
Articles of Association of the Registrant (Filed as Exhibit 3.1 of Amendment No. 5 to our Registration Statement on Form S-1 (File No. 333-191737) on November 8, 2013 and incorporated herein by reference.) |
|
4.1 |
Form of Ordinary Shares Certificate (Filed as Exhibit 3.2 of Amendment No. 5 to our Registration Statement on Form S-1 (File No. 333-191737) on November 8, 2013 and incorporated herein by reference.) |
|
4.2 |
Registration Rights Agreement |
|
4.3 |
Warrant to Purchase Ordinary Shares, issued to Comerica Bank |
|
4.4 |
Warrant to Purchase Ordinary Shares, issued to Square 1 Bank |
|
10.1+ |
License Agreement dated July 27, 2005 between Isis Innovation Limited and Oxford Immunotec Limited (Filed as Exhibit 10.1 of our Registration Statement on Form S-1 (File No. 333-191737) on October 15, 2013 and incorporated herein by reference.) |
|
10.2+ |
2006 Deed of Variation to License Agreement between Isis Innovation Limited and Oxford Immunotec Limited (Filed as Exhibit 10.2 of our Registration Statement on Form S-1 (File No. 333-191737) on October 15, 2013 and incorporated herein by reference.) |
|
|
|
|
10.3+ |
Letter Agreement Amendment dated December 13, 2012 to License Agreement between Isis Innovation Limited and Oxford Immunotec Limited (Filed as Exhibit 10.3 of our Registration Statement on Form S-1 (File No. 333-191737) on October 15, 2013 and incorporated herein by reference.) |
|
10.4++ |
Assignment dated November 20, 2013 between Isis Innovation Limited and Oxford Immunotec Limited |
|
10.5+ |
License and Supply Agreement dated December 22, 2009 between Statens Serum Institut and Oxford Immunotec Limited (Filed as Exhibit 10.4 of Amendment No. 1 of our Registration Statement on Form S-1 (File No. 333-191737) on October 25, 2013 and incorporated herein by reference.) |
|
10.6 |
Supplement dated November 9, 2010 to License and Supply Agreement between Statens Serum Institut and Oxford Immunotec Limited (Filed as Exhibit 10.5 of Amendment No. 1 of our Registration Statement on Form S-1 (File No. 333-191737) on October 25, 2013 and incorporated herein by reference.) |
|
10.7+ |
License Agreement dated June 30, 2006 between Rutgers, The State University of New Jersey and Oxford Immunotec Limited (Filed as Exhibit 10.6 of our Registration Statement on Form S-1 (File No. 333-191737) on October 15, 2013 and incorporated herein by reference.) |
| Exhibit number |
Description of exhibit |
|
10.8+ |
First Amendment dated July 1, 2009 to License Agreement between Rutgers, The State University of New Jersey and Oxford Immunotec Limited (Filed as Exhibit 10.7 of our Registration Statement on Form S-1 (File No. 333-191737) on October 15, 2013 and incorporated herein by reference.) |
|
10.9+ |
Second Amendment dated January 6, 2011 to License Agreement between Rutgers, The State University of New Jersey and Oxford Immunotec Limited (Filed as Exhibit 10.8 of our Registration Statement on Form S-1 (File No. 333-191737) on October 15, 2013 and incorporated herein by reference.) |
|
10.10 |
Third Amendment dated December 20, 2012 to License Agreement between Rutgers, The State University of New Jersey and Oxford Immunotec Limited (Filed as Exhibit 10.9 of our Registration Statement on Form S-1 (File No. 333-191737) on October 15, 2013 and incorporated herein by reference.) |
|
10.11+ |
Fourth Amendment dated April 24, 2013 to License Agreement between Rutgers, The State University of New Jersey and Oxford Immunotec Limited (Filed as Exhibit 10.10 of our Registration Statement on Form S-1 (File No. 333-191737) on October 15, 2013 and incorporated herein by reference.) |
|
10.12+ |
Supply Agreement dated December 17, 2010 between MicroCoat Biotechnologie GmbH and Oxford Immunotec Limited (Filed as Exhibit 10.11 of our Registration Statement on Form S-1 (File No. 333-191737) on October 15, 2013 and incorporated herein by reference.) |
|
10.13+ |
Purchase Agreement dated February 6, 2010 between Mabtech AB and Oxford Immunotec Limited (Filed as Exhibit 10.12 of our Registration Statement on Form S-1 (File No. 333-191737) on October 15, 2013 and incorporated herein by reference.) |
|
10.14+ |
Amendment to Purchase Agreement dated September 10, 2013 between Mabtech AB and Oxford Immunotec Limited (Filed as Exhibit 10.13 of our Registration Statement on Form S-1 (File No. 333-191737) on October 15, 2013 and incorporated herein by reference.) |
|
10.15+ |
Manufacturing Agreement dated August 26, 2003 between Mabtech AB and Oxford Immunotec Limited (Filed as Exhibit 10.14 of our Registration Statement on Form S-1 (File No. 333-191737) on October 15, 2013 and incorporated herein by reference.) |
|
10.16 |
First Amendment dated January 1, 2010 to Manufacturing Agreement between Mabtech AB and Oxford Immunotec Limited (Filed as Exhibit 10.15 of our Registration Statement on Form S-1 (File No. 333-191737) on October 15, 2013 and incorporated herein by reference.) |
|
10.17 |
Second Amendment dated May 24, 2011 to Manufacturing Agreement between Mabtech AB and Oxford Immunotec Limited (Filed as Exhibit 10.16 of our Registration Statement on Form S-1 (File No. 333-191737) on October 15, 2013 and incorporated herein by reference.) |
|
10.18+ |
Supply Agreement dated January 1, 2009 between EMD Millipore Corporation and Oxford Immunotec Ltd (Filed as Exhibit 10.17 of our Registration Statement on Form S-1 (File No. 333-191737) on October 15, 2013 and incorporated herein by reference.) |
|
10.19+ |
First Amendment to Supply Agreement dated September 27, 2013 between EMD Millipore Corporation and Oxford Immunotec Limited (Filed as Exhibit 10.18 of our Registration Statement on Form S-1 (File No. 333-191737) on October 15, 2013 and incorporated herein by reference.) |
|
10.20++ |
Second Amendment to Supply Agreement dated March 25, 2014 between EMD Millipore Corporation and Oxford Immunotec Limited |
|
10.21+ |
Supply Agreement dated January 31, 2008 between StemCell Technologies, Inc. and Oxford Immunotec Limited (Filed as Exhibit 10.19 of our Registration Statement on Form S-1 (File No. 333-191737) on October 15, 2013 and incorporated herein by reference.) |
|
Exhibit |
Description of exhibit |
|
10.22+ |
Amendment dated October 26, 2011 to Supply Agreement between StemCell Technologies, Inc. and Oxford Immunotec Limited (Filed as Exhibit 10.20 of our Registration Statement on Form S-1 (File No. 333-191737) on October 15, 2013 and incorporated herein by reference.) |
|
10.23+ |
Supply and Reseller Agreement dated August 12, 2013 between Life Technologies Corporation and Oxford Immunotec Limited (Filed as Exhibit 10.21 of our Registration Statement on Form S-1 (File No. 333-191737) on October 15, 2013 and incorporated herein by reference.) |
|
10.24+ |
Distributorship Agreement dated October 8, 2013 among Shanghai Fosun Long March Medical Science Co. Ltd., Shanghai Xin Chang Medical Device Co. Ltd. and Oxford Immunotec Limited (Filed as Exhibit 10.24 of our Registration Statement on Form S-1 (File No. 333-191737) on October 15, 2013 and incorporated herein by reference.) |
|
10.25+ |
Marketing Authorization Holder Agreement dated July 29, 2011 between Riken Genesis Co., Ltd. and Oxford Immunotec Limited (Filed as Exhibit 10.25 of our Registration Statement on Form S-1 (File No. 333-191737) on October 15, 2013 and incorporated herein by reference.) |
|
10.26+ |
Amendment to Marketing Authorization Holder Agreement dated September 1, 2013 between Riken Genesis Co., Ltd. and Oxford Immunotec Limited (Filed as Exhibit 10.26 of our Registration Statement on Form S-1 (File No. 333-191737) on October 15, 2013 and incorporated herein by reference.) |
|
10.27 |
Lease Agreement dated September 30, 2008 among MEPC Milton Park No. 1 Limited, MEPC Milton Park No. 2 Limited and Oxford Immunotec Limited, relating to Milton Park Units 115B and D (Filed as Exhibit 10.27 of our Registration Statement on Form S-1 (File No. 333-191737) on October 15, 2013 and incorporated herein by reference.) |
|
10.28 |
Lease Agreement dated August 8, 2007 among MEPC Milton Park No. 1 Limited, MEPC Milton Park No. 2 Limited and Oxford Immunotec Limited, relating to Milton Park Unit 94C (Filed as Exhibit 10.28 of our Registration Statement on Form S-1 (File No. 333-191737) on October 15, 2013 and incorporated herein by reference.) |
|
10.29 |
Deed of Variation dated December 23, 2009 to Lease Agreement among MEPC Milton Park No. 1 Limited, MEPC Milton Park No. 2 Limited and Oxford Immunotec Limited, relating to Milton Park Unit 94C and Units 115B and D (Filed as Exhibit 10.29 of our Registration Statement on Form S-1 (File No. 333-191737) on October 15, 2013 and incorporated herein by reference.) |
|
10.30 |
Deed of Variation dated May 4, 2012 to Lease Agreement among MEPC Milton Park No. 1 Limited, MEPC Milton Park No. 2 Limited and Oxford Immunotec Limited, relating to Milton Park Units 115B and D (Filed as Exhibit 10.30 of our Registration Statement on Form S-1 (File No. 333-191737) on October 15, 2013 and incorporated herein by reference.) |
|
10.31 |
Deed of Variation dated May 4, 2012 to Lease Agreement among MEPC Milton Park No. 1 Limited, MEPC Milton Park No. 2 Limited and Oxford Immunotec Limited, relating to Milton Park Unit 94C (Filed as Exhibit 10.31 of our Registration Statement on Form S-1 (File No. 333-191737) on October 15, 2013 and incorporated herein by reference.) |
|
10.32 |
Office Lease Agreement dated March 1, 2013 between Normandy Nickerson Road, LLC and Oxford Immunotec, Inc. (Filed as Exhibit 10.32 of our Registration Statement on Form S-1 (File No. 333-191737) on October 15, 2013 and incorporated herein by reference.) |
|
10.33 |
Lease Agreement dated October 17, 2011 between OMC Investment Venture and Oxford Immunotec, Inc. (Filed as Exhibit 10.33 of our Registration Statement on Form S-1 (File No. 333-191737) on October 15, 2013 and incorporated herein by reference.) |
|
10.34 |
Amended and Restated 2008 Stock Incentive Plan (Filed as Exhibit 10.35 of our Registration Statement on Form S-1 (File No. 333-191737) on October 15, 2013 and incorporated herein by reference.) |
| Exhibit number |
Description of exhibit |
|
10.35 |
Form of Incentive Stock Option Award for executive officers under the Amended and Restated 2008 Stock Incentive Plan (Filed as Exhibit 10.36 of our Registration Statement on Form S-1 (File No. 333-191737) on October 15, 2013 and incorporated herein by reference.) |
|
10.36 |
Form of Non-Statutory Stock Option Award for Non-Executive Directors under the Amended and Restated 2008 Stock Incentive Plan (Filed as Exhibit 10.37 of our Registration Statement on Form S-1 (File No. 333-191737) on October 15, 2013 and incorporated herein by reference.) |
|
10.37 |
Form of Enterprise Management Incentive Stock Option Agreement for Chief Executive Officer under the Amended and Restated 2008 Stock Incentive Plan (Filed as Exhibit 10.38 of our Registration Statement on Form S-1 (File No. 333-191737) on October 15, 2013 and incorporated herein by reference.) |
|
10.38 |
Oxford Immunotec Global PLC 2013 Share Incentive Plan (Filed as Exhibit 10.39 of Amendment No. 6 of our Registration Statement on Form S-1 (File No. 333-191737) on November 14, 2013 and incorporated herein by reference.) |
|
10.39 |
Oxford Immunotec Global PLC Incentive Plan (Filed as Exhibit 10.40 of Amendment No. 2 to our Registration Statement on Form S-1 (File No. 333-191737) on November 4, 2013 and incorporated herein by reference.) |
|
10.40 |
Form of Restricted Share Award Certificate under the Oxford Immunotec Global PLC 2013 Share Incentive Plan for officers resident in the United Kingdom (Filed as Exhibit 10.1 of our Form 8-K on March 6, 2014 and incorporated herein by reference.) |
|
10.41 |
Form of Restricted Share Award Certificate under the Oxford Immunotec Global PLC 2013 Share Incentive Plan for officers resident in the United States (Filed as Exhibit 10.2 of our Form 8-K on March 6, 2014 and incorporated herein by reference.) |
|
10.42 |
Form of CSOP award certificate under the Oxford Immunotec Global PLC 2013 Share Incentive Plan for officers resident in the United Kingdom (Filed as Exhibit 10.3 of our Form 8-K on March 6, 2014 and incorporated herein by reference.) |
|
10.43 |
Form of unapproved option under the Oxford Immunotec Global PLC 2013 Share Incentive Plan for officers resident in the United Kingdom (Filed as Exhibit 10.4 of our Form 8-K on March 6, 2014 and incorporated herein by reference.) |
|
10.44 |
Form of stock option agreement under the Oxford Immunotec Global PLC 2013 Share Incentive Plan for officers resident in the United States (Filed as Exhibit 10.5 of our Form 8-K on March 6, 2014 and incorporated herein by reference.) |
|
10.45 |
Service Agreement dated October 21, 2002 between Oxford Immunotec Limited and Peter Wrighton-Smith, as amended through 2013 |
|
10.46 |
Amended and Restated Employment Agreement dated October 1, 2013 between Oxford Immunotec, Inc. and Jeff R. Schroeder (Filed as Exhibit 10.42 of our Registration Statement on Form S-1 (File No. 333-191737) on October 15, 2013 and incorporated herein by reference.) |
|
10.47 |
Amended and Restated Employment Agreement dated October 1, 2013 between Oxford Immunotec, Inc. and Richard M. Altieri (Filed as Exhibit 10.43 of our Registration Statement on Form S-1 (File No. 333-191737) on October 15, 2013 and incorporated herein by reference.) |
|
10.48 |
Form of Deed of Indemnity for Directors (Filed as Exhibit 10.44 of Amendment No. 5 to our Registration Statement on Form S-1 (File No. 333-191737) on November 8, 2013 and incorporated herein by reference.) |
|
10.49 |
Form of Deed of Indemnity for Officers (Filed as Exhibit 10.45 of Amendment No. 5 to our Registration Statement on Form S-1 (File No. 333-191737) on November 8, 2013 and incorporated herein by reference.) |
|
Exhibit |
Description of exhibit |
|
10.50 |
Form of Non-Executive Director Appointment Letter (Filed as Exhibit 10.46 of Amendment No. 2 to our Registration Statement on Form S-1 (File No. 333-191737) on November 4, 2013 and incorporated herein by reference.) |
|
10.51 |
Oxford Immunotec Global PLC Management Incentive Compensation Plan for Fiscal Years 2012 and 2013 (Filed as Exhibit 10.47 of Amendment No. 2 to our Registration Statement on Form S-1 (File No. 333-191737) on November 4, 2013 and incorporated herein by reference.) |
|
10.52 |
Form of Director Stock Option Award under Oxford Immunotec Global PLC Share Incentive Plan (Filed as Exhibit 10.48 of Amendment No. 5 to our Registration Statement on Form S-1 (File No. 333-191737) on November 8, 2013 and incorporated herein by reference.) |
|
10.53 |
Deed of Novation of Agreement for Services dated November 8, 2013 by and among Oxford Immunotec Limited, Oxford Immunotec Global PLC and Peter Wrighton-Smith (Filed as Exhibit 10.49 of Amendment No. 5 to our Registration Statement on Form S-1 (File No. 333-191737) on November 8, 2013 and incorporated herein by reference.) |
|
|
|
|
21.1 |
List of Subsidiaries (Filed as Exhibit 21.1 of our Registration Statement on Form S-1 (File No. 333-191737) on October 15, 2013 and incorporated herein by reference.) |
|
23.1 |
Consent of Ernst & Young LLP |
|
24.1 |
Power of Attorney executed by Directors and Officers (included on signature page) |
|
31.1 |
Certification of Principal Executive Officer pursuant to Section 302 of the Sarbanes-Oxley Act of 2002 |
|
31.2 |
Certification of Principal Financial Officer pursuant to Section 302 of the Sarbanes-Oxley Act of 2002 |
|
32 |
Certification of Principal Executive Officer and Principal Financial Officer pursuant to Section 906 of the Sarbanes-Oxley Act of 2002 |
|
+ |
Confidential treatment has been granted with respect to certain portions of this exhibit. Omitted portions have been submitted separately to the Securities and Exchange Commission. |
|
++ |
Confidential treatment has been requested with respect to certain portions of this exhibit. Omitted portions have been submitted separately to the Securities and Exchange Commission. |
Signatures
Pursuant to the requirements of Section 13 or 15(d) of the Securities Exchange Act of 1934, the registrant has duly caused this report to be signed on its behalf by the undersigned, thereunto duly authorized, in Abingdon, England, on March 27, 2014.
|
OXFORD IMMUNOTEC GLOBAL PLC | |
|
By: |
/s/ Peter Wrighton-Smith, Ph.D. |
|
Peter Wrighton-Smith, Ph.D. | |
|
Chief Executive Officer and Director | |
Power of Attorney
KNOW ALL PERSONS BY THESE PRESENTS, that each person whose signature appears below constitutes and appoints Peter Wrighton-Smith, Ph.D., Richard M. Altieri, and Patricia Randall, and each of them, as his or her true and lawful attorneys-in-fact and agents, with full power of substitution and resubstitution, for him or her and in his or her name, place and stead, in any and all capacities, to sign any and all amendments to this Annual Report on Form 10-K, and to file the same, with all exhibits thereto, and other documents in connection therewith, with the Securities and Exchange Commission, granting unto said attorneys-in-fact and agents, and each of them, full power and authority to do and perform each and every act and thing requisite and necessary to be done in connection therewith, as fully to all intents and purposes as he or she might or could do in person, hereby ratifying and confirming that all said attorneys-in-fact and agents, or any of them or their or his or her substitute or substitutes, may lawfully do or cause to be done by virtue hereof.
Pursuant to the requirements of the Securities Exchange Act of 1934, this report has been signed below by the following persons on behalf of the registrant on March 27, 2014 in the capacities indicated below.
|
Signature |
Title |
Date | ||
|
/s/ Peter Wrighton-Smith, Ph.D. |
Chief Executive Officer and Director |
March 27, 2014 | ||
| Peter Wrighton-Smith, Ph.D. | (Principal Executive Officer) | |||
|
/s/ Richard M. Altieri |
Chief Financial Officer |
March 27, 2014 | ||
| Richard M. Altieri | (Principal Financial and Accounting Officer) | |||
|
/s/ Richard A. Sandberg |
Chairman of the Board of Directors |
March 27, 2014 | ||
| Richard A. Sandberg | ||||
|
/s/ Stephen L. Spotts |
Director |
March 27, 2014 | ||
| Stephen L. Spotts | ||||
|
/s/ Nigel A. Pitchford, Ph.D. |
Director |
March 27, 2014 | ||
| Nigel A. Pitchford, Ph.D. | ||||
|
/s/ Michael Steinmetz, Ph.D. |
Director |
March 27, 2014 | ||
| Michael Steinmetz, Ph.D. | ||||
|
/s/ Vijay Lathi |
Director |
March 27, 2014 | ||
| Vijay Lathi | ||||
|
/s/ Herm Rosenman |
Director |
March 27, 2014 | ||
| Herm Rosenman | ||||
|
/s/ Richard M. Altieri |
Authorized Representative in the United States |
March 27, 2014 | ||
| Richard M. Altieri | ||||
Oxford Immunotec Global PLC
Index to financial statements
Audited consolidated financial statements
|
|
Page | |
|
Report of independent registered public accounting firm |
F-2 |
|
|
Consolidated balance sheets as of December 31, 2013 and 2012 |
F-3 |
|
|
Consolidated statements of operations for the years ended December 31, 2013, 2012, and 2011 |
F-4 |
|
|
Consolidated statements of other comprehensive loss for the years ended December 31, 2013, 2012, and 2011 |
F-5 |
|
|
Consolidated statements of shareholders’ equity for the years ended December 31, 2013, 2012, and 2011 |
F-6 |
|
|
Consolidated statements of cash flows for the years ended December 31, 2013, 2012, and 2011 |
F-7 |
|
|
Notes to the consolidated financial statements |
F-9 |
|
Report of independent registered public accounting firm
The Board of Directors and Shareholders of Oxford Immunotec Global PLC:
We have audited the accompanying consolidated balance sheets of Oxford Immunotec Global PLC as of December 31, 2013 and 2012, and the related consolidated statements of operations, other comprehensive loss, shareholders’ equity, and cash flows for each of the three years in the period ended December 31, 2013. These financial statements are the responsibility of the Company’s management. Our responsibility is to express an opinion on these financial statements based on our audits.
We conducted our audits in accordance with the standards of the Public Company Accounting Oversight Board (United States). Those standards require that we plan and perform the audit to obtain reasonable assurance about whether the financial statements are free of material misstatement. We were not engaged to perform an audit of the Company’s internal control over financial reporting. Our audits included consideration of internal control over financial reporting as a basis for designing audit procedures that are appropriate in the circumstances, but not for the purpose of expressing an opinion on the effectiveness of the Company’s internal control over financial reporting. Accordingly, we express no such opinion. An audit also includes examining, on a test basis, evidence supporting the amounts and disclosures in the financial statements, assessing the accounting principles used and significant estimates made by management, and evaluating the overall financial statement presentation. We believe that our audits provide a reasonable basis for our opinion.
In our opinion, the financial statements referred to above present fairly, in all material respects, the consolidated financial position of Oxford Immunotec Global PLC at December 31, 2013 and 2012, and the consolidated results of its operations and its cash flows for each of the three years in the period ended December 31, 2013, in conformity with U.S. generally accepted accounting principles.
/s/ Ernst & Young LLP
Reading, United Kingdom
March 27, 2014
Oxford Immunotec Global PLC
Consolidated balance sheets
(in thousands, except share and per share data)
|
December 31, |
||||||||
|
2013 |
2012 |
|||||||
|
Assets |
||||||||
|
Current assets: |
||||||||
|
Cash and cash equivalents |
$ | 76,494 | $ | 12,578 | ||||
|
Restricted cash |
87 | 387 | ||||||
|
Accounts receivable, net |
4,754 | 5,400 | ||||||
|
Inventory |
5,450 | 3,073 | ||||||
|
Prepaid expenses and other |
2,242 | 1,342 | ||||||
|
Total current assets |
89,027 | 22,780 | ||||||
|
Restricted cash, non-current |
362 | 287 | ||||||
|
Property and equipment, net |
2,964 | 2,249 | ||||||
|
Intangible assets, net |
331 | 107 | ||||||
|
Other assets |
60 | 60 | ||||||
|
Total assets |
$ | 92,744 | $ | 25,483 | ||||
|
Liabilities and shareholders’ equity |
||||||||
|
Current liabilities: |
||||||||
|
Accounts payable |
$ | 2,310 | $ | 1,754 | ||||
|
Accrued expenses |
6,936 | 3,962 | ||||||
|
Deferred income |
1,540 | 908 | ||||||
|
Revolving line of credit |
— | 1,548 | ||||||
|
Current portion of loans payable |
170 | 79 | ||||||
|
Taxes payable |
177 | 140 | ||||||
|
Total current liabilities |
11,133 | 8,391 | ||||||
|
Long-term portion of loans payable |
563 | 143 | ||||||
|
Other liabilities |
296 | — | ||||||
|
Total liabilities |
11,992 | 8,534 | ||||||
|
Commitments and contingencies (Note 17) |
||||||||
|
Shareholders’ equity: |
||||||||
|
Convertible preferred ordinary shares: |
||||||||
|
A preferred ordinary shares, £0.006705 nominal value; 134,708 shares authorized, 134,706 shares issued and outstanding at December 31, 2012. |
— | 2 | ||||||
|
B preferred ordinary shares, £0.006705 nominal value; 53,992 shares authorized, 53,992 shares issued and outstanding at December 31, 2012. |
— | 1 | ||||||
|
D preferred ordinary shares, £0.006705 nominal value; 520,275 shares authorized, 487,222 shares issued and outstanding at December 31, 2012. |
— | 5 | ||||||
|
E preferred ordinary shares, £0.006705 nominal value; 4,772,557 shares authorized, 2,547,496 shares issued and outstanding at December 31, 2012. |
— | 33 | ||||||
|
F preferred ordinary shares, £0.006705 nominal value; 2,982,848 shares authorized, 2,574,575 shares issued and outstanding at December 31, 2012. |
— | 26 | ||||||
|
G preferred ordinary shares, £0.006705 nominal value; 3,728,560 shares authorized, 1,503,330 shares issued and outstanding at December 31, 2012. |
— | 16 | ||||||
|
Ordinary shares, £0.006705 nominal value; 25,189,285 and 16,432,475 shares authorized at December 31, 2013 and 2012, respectively, 17,255,267 and 2,153,974, shares issued and outstanding at December 31, 2013 and 2012, respectively. |
188 | 24 | ||||||
|
Subscription of G preferred ordinary shares |
— | 8,075 | ||||||
|
Additional paid-in capital |
183,967 | 103,380 | ||||||
|
Accumulated deficit |
(99,655 | ) | (90,991 | ) | ||||
|
Accumulated other comprehensive loss |
(3,748 | ) | (3,622 | ) | ||||
|
Total shareholders’ equity |
80,752 | 16,949 | ||||||
|
Total liabilities and shareholders’ equity |
$ | 92,744 | $ | 25,483 | ||||
See accompanying notes to these consolidated financial statements.
Oxford Immunotec Global PLC
Consolidated statements of operations
(in thousands, except share and per share data)
|
Year ended December 31, |
||||||||||||
|
2013 |
2012 |
2011 |
||||||||||
|
Revenue |
||||||||||||
|
Product |
$ | 19,905 | $ | 9,080 | $ | 6,281 | ||||||
|
Service |
18,879 | 11,605 | 6,360 | |||||||||
|
Total revenue |
38,784 | 20,685 | 12,641 | |||||||||
|
Cost of revenue |
||||||||||||
|
Product |
8,475 | 4,329 | 2,955 | |||||||||
|
Service |
10,125 | 8,095 | 5,462 | |||||||||
|
Total cost of revenue |
18,600 | 12,424 | 8,417 | |||||||||
|
Gross profit |
20,184 | 8,261 | 4,224 | |||||||||
|
Operating expenses: |
||||||||||||
|
Research and development |
2,146 | 1,947 | 1,780 | |||||||||
|
Sales and marketing |
13,270 | 11,177 | 10,536 | |||||||||
|
General and administrative |
12,119 | 8,068 | 5,232 | |||||||||
|
Total operating expenses |
27,535 | 21,192 | 17,548 | |||||||||
|
Loss from operations |
(7,351 | ) | (12,931 | ) | (13,324 | ) | ||||||
|
Other (expense) income: |
||||||||||||
|
Interest expense, net |
(328 | ) | (1,477 | ) | (3 | ) | ||||||
|
Foreign exchange (losses) gains |
(423 | ) | (626 | ) | 28 | |||||||
|
Other (expense) income |
(470 | ) | — | 76 | ||||||||
|
Loss before income taxes |
(8,572 | ) | (15,034 | ) | (13,223 | ) | ||||||
|
Income tax expense (benefit) |
92 | (151 | ) | (119 | ) | |||||||
|
Net loss |
$ | (8,664 | ) | $ | (14,883 | ) | $ | (13,104 | ) | |||
|
Net loss per share attributable to ordinary shareholders—basic and diluted |
$ | (2.26 | ) | $ | (8.44 | ) | $ | (10.78 | ) | |||
|
Weighted-average shares used to compute net loss attributable to ordinary shareholders—basic and diluted |
3,830,837 | 1,763,728 | 1,215,532 | |||||||||
See accompanying notes to these consolidated financial statements.
Oxford Immunotec Global PLC
Consolidated statements of other comprehensive loss
(in thousands)
|
Year ended December 31, |
||||||||||||
|
2013 |
2012 |
2011 |
||||||||||
|
Net loss |
$ | (8,664 | ) | $ | (14,883 | ) | $ | (13,104 | ) | |||
|
Other comprehensive (loss) income, net of taxes: |
||||||||||||
|
Foreign currency translation adjustment, net of taxes |
(126 | ) | 345 | 47 | ||||||||
|
Other comprehensive (loss) income, net of taxes |
(126 | ) | 345 | 47 | ||||||||
|
Total comprehensive loss |
$ | (8,790 | ) | $ | (14,538 | ) | $ | (13,057 | ) | |||
See accompanying notes to these consolidated financial statements.
Oxford Immunotec Global PLC
Consolidated statements of shareholders’ equity
(in thousands)
|
Convertible preferred ordinary shares |
||||||||||||||||||||||||||||||||||||||||||||||||
|
A |
B |
D |
E |
F |
G |
Ordinary |
Subscription |
Additional |
Accumulated |
Accumulated other |
Total |
|||||||||||||||||||||||||||||||||||||
|
Balance at December 31, 2010 |
$ | 2 | $ | 1 | $ | 5 | $ | 33 | $ | 15 | $ | — | $ | 11 | $ | — | $ | 75,126 | $ | (63,004 | ) | $ | (4,014 | ) | $ | 8,175 | ||||||||||||||||||||||
|
Exercise of share options |
— | — | — | — | — | — | — | — | 2 | — | — | 2 | ||||||||||||||||||||||||||||||||||||
|
Issuance of F preferred ordinary shares |
— | — | — | — | 10 | — | — | — | 9,968 | — | — | 9,978 | ||||||||||||||||||||||||||||||||||||
|
Issuance of ordinary shares |
— | — | — | — | — | — | 3 | — | — | — | — | 3 | ||||||||||||||||||||||||||||||||||||
|
Share-based compensation expense |
— | — | — | — | — | — | — | — | 125 | — | — | 125 | ||||||||||||||||||||||||||||||||||||
|
Other comprehensive income |
— | — | — | — | — | — | — | — | — | — | 47 | 47 | ||||||||||||||||||||||||||||||||||||
|
Net loss |
— | — | — | — | — | — | — | — | — | (13,104 | ) | — | (13,104 | ) | ||||||||||||||||||||||||||||||||||
|
Balance at December 31, 2011 |
$ | 2 | $ | 1 | $ | 5 | $ | 33 | $ | 25 | $ | — | $ | 14 | $ | — | $ | 85,221 | $ | (76,108 | ) | $ | (3,967 | ) | $ | 5,226 | ||||||||||||||||||||||
|
Issuance of ordinary shares—anti-dilution |
— | — | — | — | — | — | 9 | — | (9 | ) | — | — | — | |||||||||||||||||||||||||||||||||||
|
Issuance of F preferred ordinary shares in connection with debt financing |
— | — | — | — | 1 | — | 1 | — | 1,314 | — | — | 1,316 | ||||||||||||||||||||||||||||||||||||
|
Subscription of G preferred ordinary shares |
— | — | — | — | — | — | — | 8,075 | — | — | — | 8,075 | ||||||||||||||||||||||||||||||||||||
|
Issuance of G preferred ordinary shares, net of financing costs |
— | — | — | — | — | 16 | — | — | 16,685 | — | — | 16,701 | ||||||||||||||||||||||||||||||||||||
|
Interest on convertible notes settled with G preferred ordinary shares |
— | — | — | — | — | — | — | — | 90 | — | — | 90 | ||||||||||||||||||||||||||||||||||||
|
Share-based compensation expense |
— | — | — | — | — | — | — | — | 79 | — | — | 79 | ||||||||||||||||||||||||||||||||||||
|
Other comprehensive income |
— | — | — | — | — | — | — | — | — | — | 345 | 345 | ||||||||||||||||||||||||||||||||||||
|
Net loss |
— | — | — | — | — | — | — | — | — | (14,883 | ) | — | (14,883 | ) | ||||||||||||||||||||||||||||||||||
|
Balance at December 31, 2012 |
$ | 2 | $ | 1 | $ | 5 | $ | 33 | $ | 26 | $ | 16 | $ | 24 | $ | 8,075 | $ | 103,380 | $ | (90,991 | ) | $ | (3,622 | ) | $ | 16,949 | ||||||||||||||||||||||
|
Exercise of share options |
— | — | — | — | — | — | 1 | — | 21 | — | — | 22 | ||||||||||||||||||||||||||||||||||||
|
Issuance of G preferred ordinary shares, net of financing costs |
— | — | — | — | — | 11 | — | (8,075 | ) | 11,006 | — | — | 2,942 | |||||||||||||||||||||||||||||||||||
|
Conversion of preferred ordinary shares in connection with initial public offering |
(2 | ) | (1 | ) | (5 | ) | (33 | ) | (26 | ) | (27 | ) | 94 | — | — | — | — | — | ||||||||||||||||||||||||||||||
|
Ordinary shares issued in connection with initial public offering, net of offering costs |
— | — | — | — | — | — | 67 | — | 63,812 | — | — | 63,879 | ||||||||||||||||||||||||||||||||||||
|
Ordinary shares issued upon conversion of note payable and accrued interest |
— | — | — | — | — | — | 2 | — | 5,608 | — | — | 5,610 | ||||||||||||||||||||||||||||||||||||
|
Share-based compensation expense |
— | — | — | — | — | — | — | — | 140 | — | — | 140 | ||||||||||||||||||||||||||||||||||||
|
Other comprehensive loss |
— | — | — | — | — | — | — | — | — | — | (126 | ) | (126 | ) | ||||||||||||||||||||||||||||||||||
|
Net loss |
— | — | — | — | — | — | — | — | — | (8,664 | ) | — | (8,664 | ) | ||||||||||||||||||||||||||||||||||
|
Balance at December 31, 2013 |
$ | — | $ | — | $ | — | $ | — | $ | — | $ | — | $ | 188 | $ | — | $ | 183,967 | $ | (99,655 | ) | $ | (3,748 | ) | $ | 80,752 | ||||||||||||||||||||||
See accompanying notes to these consolidated financial statements.
Oxford Immunotec Global PLC
Consolidated statements of cash flows
(in thousands)
|
Year ended December 31, |
||||||||||||
|
2013 |
2012 |
2011 |
||||||||||
|
Cash flows from operating activities |
||||||||||||
|
Net loss |
$ | (8,664 | ) | $ | (14,883 | ) | $ | (13,104 | ) | |||
|
Adjustments to reconcile net loss to net cash used in operating activities: |
||||||||||||
|
Depreciation and amortization |
1,101 | 801 | 630 | |||||||||
|
Share-based compensation expense |
140 | 79 | 125 | |||||||||
|
Loss on change in fair value of warrants |
279 | — | — | |||||||||
|
Loss on change in fair value of derivative instrument |
561 | — | — | |||||||||
|
(Gain) loss on disposal of property and equipment |
(1 | ) | 71 | 128 | ||||||||
|
Noncash interest expense |
— | 1,425 | 4 | |||||||||
|
Changes in operating assets and liabilities: |
||||||||||||
|
Accounts receivable, net |
637 | (3,103 | ) | (1,042 | ) | |||||||
|
Inventory |
(2,808 | ) | (1,045 | ) | (316 | ) | ||||||
|
Prepaid expenses and other assets |
(881 | ) | (333 | ) | 66 | |||||||
|
Accounts payable |
483 | 196 | 455 | |||||||||
|
Accrued expenses |
2,947 | 1,608 | 445 | |||||||||
|
Deferred income |
587 | 814 | (48 | ) | ||||||||
|
Net cash used in operating activities |
(5,619 | ) | (14,370 | ) | (12,657 | ) | ||||||
|
Cash flows from investing activities |
||||||||||||
|
Purchases of property and equipment |
(1,809 | ) | (1,482 | ) | (1,238 | ) | ||||||
|
Proceeds on sales of property and equipment |
22 | — | — | |||||||||
|
Purchases of intangible assets |
(205 | ) | (79 | ) | (1 | ) | ||||||
|
Change in restricted cash |
225 | (315 | ) | (359 | ) | |||||||
|
Net cash used in investing activities |
(1,767 | ) | (1,876 | ) | (1,598 | ) | ||||||
|
Cash flows from financing activities |
||||||||||||
|
Proceeds from revolving line of credit |
— | 1,500 | — | |||||||||
|
Proceeds from convertible note |
4,842 | 4,000 | — | |||||||||
|
Proceeds received in advance of share issuance |
— | 8,075 | — | |||||||||
|
Proceeds from issuance of ordinary shares |
63,879 | — | 3 | |||||||||
|
Proceeds from issuance of preferred ordinary shares |
2,942 | 12,701 | 9,978 | |||||||||
|
Proceeds from exercise of share options |
22 | 1 | 2 | |||||||||
|
Proceeds from term loan |
6,582 | — | — | |||||||||
|
Payments on loan |
(6,068 | ) | (60 | ) | (102 | ) | ||||||
|
Payments on revolving line of credit |
(1,500 | ) | — | — | ||||||||
|
Net cash provided by financing activities |
70,699 | 26,217 | 9,881 | |||||||||
|
Effect of exchange rate changes on cash and cash equivalents |
603 | 273 | 64 | |||||||||
|
Net increase (decrease) in cash and cash equivalents, excluding restricted cash |
63,916 | 10,244 | (4,310 | ) | ||||||||
|
Cash and cash equivalents at beginning of year |
12,578 | 2,334 | 6,644 | |||||||||
|
Cash and cash equivalents at end of year |
$ | 76,494 | $ | 12,578 | $ | 2,334 | ||||||
See accompanying notes to these consolidated financial statements.
Oxford Immunotec Global PLC
Consolidated statements of cash flows (continued)
(in thousands)
|
Year ended December 31, |
||||||||||||
|
2013 |
2012 |
2011 |
||||||||||
|
Supplemental disclosures |
||||||||||||
|
Cash paid for interest |
$ | 240 | $ | 81 | $ | — | ||||||
|
Cash paid (received) for taxes |
70 | (281 | ) | (184 | ) | |||||||
|
Noncash investing and financing activities |
||||||||||||
|
Interest on convertible notes settled with G preferred ordinary shares |
$ | — | $ | 90 | $ | — | ||||||
|
F preferred ordinary shares issued with convertible notes |
— | 1,316 | — | |||||||||
|
Convertible notes converted into G preferred ordinary shares |
— | 4,000 | — | |||||||||
|
Fair value of warrant issued with convertible note |
296 | — | — | |||||||||
|
Conversion of note and accrued interest into ordinary shares |
5,049 | — | — | |||||||||
See accompanying notes to these consolidated financial statements.
1. Description of business and significant accounting policies
Description of business
The Company is a global, commercial-stage diagnostics company committed to improving patient care by providing advanced, innovative tests in the field of immunology. The Company’s proprietary T-SPOT technology platform allows it to measure the responses of specific immune cells (T cells) to inform the diagnosis, prognosis and monitoring of patients with immunologically controlled diseases. Substantially all of the Company’s revenue is currently derived from the sale of its T-SPOT.TB test, which is sold in two formats: an in vitro diagnostic kit format (allowing customers to perform the test at their own institutions), and a service format (in which the Company performs the test on samples sent by customers to the Company’s own laboratory facilities). The Company sells its T-SPOT.TB test through a direct sales force in the United States, certain European countries and Japan. The Company sells through distributors in other parts of the world.
Initial public offering, reorganization, reverse share split and conversion
On November 21, 2013, the registration statement for the Company’s initial public offering, or IPO, was declared effective by the Securities and Exchange Commission. The Company sold 6,164,000 ordinary shares, at an initial public offering price of $12.00 per share, which included the exercise in full by the underwriters of their option to purchase up to 804,000 additional ordinary shares. Net proceeds from the IPO were $63.9 million, after deducting underwriting discounts and commissions and offering expenses.
On October 2, 2013, the Company completed a scheme of arrangement under the laws of England and Wales, or the Scheme of Arrangement, which was approved by the High Court of Justice in England and Wales. All holders of ordinary shares, preferred ordinary shares, options and warrants exchanged their interests in Oxford Immunotec Limited for identical interests in Oxford Immunotec Global PLC. As a result of this exchange, Oxford Immunotec Global PLC is now the parent company of Oxford Immunotec Limited.
In November 2013, prior to closing of the Company’s initial public offering, the Company undertook a 1 for 6.705 reverse share split of its outstanding ordinary shares, which resulted in a proportional decrease in the number of ordinary shares outstanding as well as appropriate adjustments to outstanding A ordinary shares, preferred ordinary shares, warrants and options. After the reverse share split and immediately prior to the Company’s IPO, all outstanding preferred ordinary shares converted into ordinary shares. The nominal value of the ordinary shares was adjusted from £0.001 to £0.006705 per share. Prior period share and per share amounts have been adjusted to reflect the reverse share split.
Basis of presentation, accounting principles and principles of consolidation
The accompanying consolidated financial statements have been prepared in conformity with accounting principles generally accepted in the United States of America (U.S. GAAP), and include the financial statements of Oxford Immunotec Global PLC, a company incorporated in England and Wales and its wholly-owned subsidiaries, collectively referred to as the Company. The financial statements include the results of Oxford Immunotec Limited and its consolidated subsidiaries for the period prior to the completion of the Scheme of Arrangement, as well as the results of Oxford Immunotec Global PLC and its consolidated subsidiaries for the period after completion of the Scheme of Arrangement. All intercompany accounts and transactions have been eliminated upon consolidation.
Use of estimates
The preparation of consolidated financial statements in conformity with U.S. GAAP requires management to make estimates and assumptions that affect the reported amounts of assets and liabilities at the date of the consolidated financial statements and that affect the reported amounts of revenue and expenditures during the reporting periods. Actual results could differ from those estimates and assumptions used.
Foreign currency translation
The functional currency for Oxford Immunotec Global PLC is the U.S. Dollar. The functional currency for the Company’s operating subsidiaries are the Pound Sterling for Oxford Immunotec Limited, the U.S. Dollar for Oxford Immunotec Inc., and the Yen for Oxford Immunotec K.K. Revenue and expenses of foreign operations are translated into U.S. Dollars at the average rates of exchange during the year. Assets and liabilities of foreign operations are translated into U.S. Dollars at year-end rates. The Company reflects resulting translation gains or losses in accumulated other comprehensive income, which is a component of shareholders’ equity. The Company does not record tax provisions or benefits for the net changes in foreign currency translation adjustments, as the Company intends to permanently reinvest undistributed earnings in its foreign subsidiaries.
Realized and unrealized foreign currency transaction gains or losses, arising from exchange rate fluctuations on balances denominated in currencies other than the functional currencies, are included in “Other (expense) income” in the consolidated statements of operations.
Revenue recognition
The Company derives product revenue from the sale of its T-SPOT.TB diagnostic test kits and related accessories to a broad range of customers including hospitals, public health departments, commercial testing laboratories, importers and distributors.
Product revenue is generally paid directly by the customer and is recognized on an accrual basis when the following revenue recognition criteria are met: (1) persuasive evidence that an arrangement exists; (2) the product has been shipped or delivered in accordance with the shipping terms of the arrangement; (3) the price is fixed or determinable and known at time of shipment; and (4) collectability is reasonably assured.
For products sold in Japan, the price only becomes determinable upon the wholesaler receiving a firm order from its customer and, as a result, this is when the Company recognizes revenue for such sales.
No product return rights are extended to customers of the Company.
The Company derives service revenue from its diagnostic laboratories in the United States and in the United Kingdom where the Company performs its T-SPOT.TB test on samples sent by customers to its laboratory facilities.
Service revenue in the United Kingdom and revenue from direct bill customers in the United States are recognized on an accrual basis when the following revenue recognition criteria are met: (1) persuasive evidence that an arrangement exists; (2) when the diagnostic result has been delivered; (3) the price is fixed or determinable; and (4) collectability is reasonably assured. This service revenue is referred to as “direct-bill” sales because the Company receives payment directly from the ordering entity.
In the United States, the Company also generates revenue from payments that are received from a variety of third-party payors, including government programs (Medicare and Medicaid) and commercial insurance companies, each with different billing requirements. Revenue from tests paid by third-party payors is recognized on an accrual basis based on the Company’s historical collection experience.
Taxes assessed by governmental authorities on revenue, including sales and value added taxes, are recorded on a net basis (excluded from revenue) in the consolidated statements of operations.
Cost of revenue: cost of product and cost of service
Cost of product revenue consists primarily of costs incurred in the production process, including costs of raw materials and components, assembly labor and overhead, quality costs, royalties paid under licensing agreements, the U.S. medical device excise tax and packaging and delivery costs.
Cost of service revenue consists primarily of costs incurred in the operation of the Company’s diagnostic laboratories including labor and overhead, kit costs, quality costs, consumables used in the testing process and packaging and delivery costs.
Shipping and handling
The Company does not normally bill its service customers for shipping and handling charges. Charges relating to inbound and outbound freight costs are incurred by the Company and recorded within cost of service.
The Company generally bills product customers for shipping and handling and records the customer payments as product revenue. The associated costs are recorded as cost of product sold.
Cash and cash equivalents
The Company maintains its available cash balances in cash, U.S. government money market funds, and bank savings accounts in the United States, United Kingdom, Germany, and Japan. The Company maintains deposits in government insured financial institutions in excess of government insured limits. Management believes that the Company is not exposed to significant credit risk due to the financial position of the depository institutions in which those deposits are held.
Restricted cash
As of December 31, 2013 and 2012, U.S. bank balances totaling $0.4 million were pledged as security for the Company’s office and laboratory space operating leases.
As of December 31, 2013, the Company has restricted cash in the amount of less than $0.1 million pledged as collateral for procurement cards issued by a U.S. commercial bank.
As of December 31, 2012, $0.3 million was held in an U.S. escrow account; these funds were released in February 2013.
Accounts receivable
Accounts receivable are primarily amounts due from hospitals, public health departments, commercial testing laboratories, distributors and universities in addition to third-party payors such as commercial insurance companies and government programs (Medicare and Medicaid).
Accounts receivable are reported net of an allowance for uncollectible accounts. The process of estimating the collection of accounts receivable involves significant assumptions and judgments. Specifically, the accounts receivable allowance is based on management’s analysis of current and past due accounts, collection experience and other relevant information. The Company’s provision for uncollectible accounts is recorded as a bad debt expense and included in general and administrative expenses. Although the Company believes amounts provided are adequate, the ultimate amounts of uncollectible accounts receivable could be in excess of the amounts provided.
Inventory
Inventory consists of finished goods and raw materials. The Company does not maintain work in progress balances as the nature of the manufacturing process does not allow for test kits to be left in a partially manufactured state. Inventory is removed at cost. Inventory is stated at the lower of cost or market. Cost is determined by the actual cost of components by batch plus estimated labor and overhead costs per unit. Market value is based on an estimated selling price less any costs expected to be incurred to completion and sale. The Company reviews the components of its inventory on a periodic basis for excess, obsolete or impaired inventory, and records a reserve for the identified items. At December 31, 2013 and 2012, the Company determined no inventory reserve was required.
Property and equipment
Property and equipment are stated at cost. Property and equipment includes specialized shipping containers provided to customers, in the United States, for transporting samples to its laboratory for testing. Property and equipment financed under capital leases are initially recorded at the present value of minimum lease payments at the inception of the lease.
Depreciation is calculated using the straight-line method over the estimated useful lives of the assets. Property and equipment under capital leases and leasehold improvements are amortized using the straight-line method over the shorter of the lease term or estimated useful life of the asset. Depreciable lives range from three to ten years for laboratory equipment, office equipment and furniture and fixtures and three years for software and specialized shipping containers.
Impairment of long-lived assets
The Company evaluates its long-lived assets for impairment whenever events or changes in circumstances indicate that the carrying amount of an asset may be impaired, and assesses their recoverability based upon anticipated future cash flows. If changes in circumstances lead the Company to believe that any of its long-lived assets may be impaired, the Company will (a) evaluate the extent to which the remaining book value of the asset is recoverable by comparing the future undiscounted cash flows estimated to be associated with the asset to the asset’s carrying amount and (b) write-down the carrying amount to market value to the extent necessary. There has been no impairment of long-lived assets to date.
Intangible assets
Intangible assets include technology licenses which are capitalized and amortized over estimated useful lives (generally five to ten years) using the straight-line method. The weighted-average useful life is 8.8 years. On an ongoing basis, the Company assesses the recoverability of its intangible assets by determining its ability to generate undiscounted future cash flows sufficient to recover the unamortized balances over the remaining useful lives. Intangible assets determined to be unrecoverable are expensed in the period in which the determination is made.
Derivative financial instruments
The Company does not use derivative instruments to hedge exposures to cash flow, market, interest rate or foreign currency risks.
The Company reviews the terms of the shares and warrants it issues and its convertible promissory notes to determine whether there are embedded derivative instruments, including embedded conversion options, which are required to be bifurcated and accounted for separately as derivative financial instruments. In circumstances where the host instrument contains more than one embedded derivative instrument, including the conversion option, that is required to be bifurcated, the bifurcated derivative instruments are accounted for as a single, compound derivative instrument.
Bifurcated embedded derivatives are initially recorded at fair value and are then revalued at each reporting date with changes in the fair value reported as other income or expense. When equity instruments contain embedded derivative instruments that are to be bifurcated and accounted for as liabilities, the total proceeds received are first allocated to the fair value of all the bifurcated derivative instruments. The remaining proceeds, if any, are then allocated to the host instruments themselves, usually resulting in those instruments being recorded at a discount from their face value.
Fair value of financial instruments
The Company measures certain financial assets and liabilities at fair value based on the price that would be received for an asset or paid to transfer a liability in the principal or most advantageous market for the asset or liability in an orderly transaction between market participants. As of December 31, 2013 and 2012, the Company’s financial instruments consist of cash and cash equivalents, accounts receivable, prepaid expenses, and other accounts payable, accrued expenses, ordinary share warrants, and loans payable. As of December 31, 2012, the Company’s financial instruments also included a revolving line of credit. See Note 2, “Fair value measurement,” to these consolidated financial statements for further information on the fair value of the Company’s financial instruments.
Research and development expenses
Research and development expenses include all costs associated with the development of the Company’s T-SPOT technology platform and potential future products including new diagnostic tests that utilize the T-SPOT technology platform and are charged to expense as incurred. Research and development expenses include direct costs and an allocation of indirect costs, including amortization, depreciation, rent, supplies, insurance, and repairs and maintenance.
Income taxes
The Company accounts for income taxes under the asset and liability method, which requires, among other things, that deferred income taxes be provided for temporary differences between the tax basis of the Company’s assets and liabilities and its financial statement reported amounts. In addition, deferred tax assets are recorded for the future benefit of utilizing net operating losses and research and development credit carryforwards. A valuation allowance is established when necessary to reduce deferred tax assets to the amount expected to be realized.
The Company adheres to the accounting guidance for uncertainties in income taxes, which prescribes a recognition threshold and measurement process for recording in the financial statements uncertain tax positions taken, or expected to be taken, in a tax return. The Company accrues for the estimated amount of taxes for uncertain tax positions if it is more likely than not that the Company would be required to pay such additional taxes. An uncertain tax position will not be recognized if it has less than a 50% likelihood of being sustained. The Company does not have any accrued interest or penalties associated with any unrecognized tax positions for the years ended December 31, 2013 and 2012.
Share-based compensation
The Company accounts for share-based compensation arrangements with employees, officers and directors by recognizing compensation expense based on the grant date fair value of share-based transactions in the consolidated financial statements.
Share-based compensation costs are based on the fair value of the underlying option calculated using the Black-Scholes option-pricing model on the date of grant for share options and recognized as expense on a straight-line basis over the requisite service period. Determining the appropriate fair value model and related assumptions requires judgment, including estimating share price volatility, expected term and forfeiture rates. The expected volatility rates are estimated based on the actual volatility of comparable public companies over a historical period equal in length to the expected term. The expected terms represent the average time that options are expected to be outstanding based on the midpoint between the vesting date and the end of the contractual term of the award. Forfeitures are estimated at the time of grant and revised, if necessary, in subsequent periods if actual forfeitures differ from those estimates. The Company has not paid dividends and does not anticipate paying cash dividends in the foreseeable future and, accordingly, uses an expected dividend yield of zero. The risk-free interest rate is based on the rate of U.S. Treasury securities with maturities consistent with the estimated expected term of the awards.
The cumulative expense recognized for share-based transactions at each reporting date until the vesting date reflects the extent to which the vesting period has expired and the Company’s best estimate of the number of equity instruments that will ultimately vest. The charge or credit for a period represents the movement in cumulative expense recognized as at the beginning and end of that period. No expense is recognized for awards that do not ultimately vest.
Where the terms of an equity award are modified, the minimum expense recognized is the expense as if the terms had not been modified if the original terms of the award are met. An additional expense is recognized for any modification that increases the total fair value of the share-based compensation, or is otherwise beneficial to the employee as measured at the date of modification.
Where a share-based compensation award is cancelled, it is treated as if it had vested on the date of cancellation, and any expense not yet recognized for the award is recognized immediately. However, if a new award is substituted for the cancelled award, and designated as a replacement award on the date it is granted, the cancelled and new awards are treated as if they were a modification of the original award, as described in the previous paragraph.
Upon exercise, share options are redeemed for newly issued ordinary shares.
Segment reporting
The Company operates in one operating segment. The Company’s chief operating decision maker (the CODM), its chief executive officer, manages the Company’s operations on an integrated basis for the purposes of allocating resources. When evaluating the Company’s financial performance, the CODM reviews separate revenue information for the Company’s product and service offerings and for each country, while all other financial information is on a combined basis. While the Company’s principal operations and decision-making functions are located in both the United States and United Kingdom, the CODM makes decisions on a global basis. Accordingly, the Company has determined that it operates in a single reporting segment.
Basic and diluted net loss per ordinary share
Earnings or net loss attributable to ordinary shareholders for the period, after deduction of preferred ordinary share preferences, are allocated between the ordinary shareholders and preferred ordinary shareholders based on their respective rights to receive dividends. Basic and diluted net loss per ordinary share is determined by dividing net loss applicable to ordinary shareholders by the weighted-average number of ordinary shares outstanding during the period. As the Company reports net losses, outstanding share options, warrants and preferred ordinary shares, have not been included in the calculation of diluted net loss attributable to ordinary shareholders per share because to do so would be anti-dilutive. Accordingly, the numerator and the denominator used in computing both basic and diluted net loss per share for each period are the same. Since the Company’s participating preferred ordinary shares were not contractually required to share in the Company’s losses, in applying the two-class method to compute basic net loss per share, no allocation was made to preferred ordinary shares if a net loss existed. Prior period share and per share amounts have been adjusted to reflect the reverse share split.
Ordinary share warrant policy
Warrants to purchase the Company’s ordinary shares are classified as equity unless otherwise required. Warrants issued with a down round provision, whereby the exercise price would be adjusted downward in the event that additional ordinary shares of the Company or securities exercisable, convertible or exchangeable for the Company’s ordinary shares are issued at a price less than the exercise price, and are recorded as a liability and marked to market each reporting period until they are exercised, expire or otherwise extinguished. Changes in the liability during each reporting period are recorded in other (expense) income.
Recent accounting pronouncements
The Company has considered recent accounting pronouncements and concluded that they are either not applicable to the business, or that no material effect is expected on the consolidated financial statements as a result of future adoption.
Concentration of risks
The Company derives product revenue from the sale of its T-SPOT.TB diagnostic test kits and related accessories to a broad range of customers including: hospitals, public health departments, commercial testing laboratories, importers and distributors. Importers and distributors sell to third parties including end-user customers in specific territories.
In the year ended December 31, 2013, the Company had two product customers that represented more than 10% of the Company’s annual revenue. The Company’s Chinese distributor, Shanghai Fosun Long March Medical Science Co. Ltd., or Fosun, represented 16% of annual revenue and the Company’s Japanese importer, Riken Genesis Co., Ltd. represented 12% of annual revenue. The loss of either of these product customers could have a material impact on the Company’s operating results.
In October 2013, the Company issued a convertible promissory note in the amount of $5.0 million to Fosun Industrial Co., Ltd., (the Fosun Note). The Fosun Note paid interest at 8% per annum.
In the event of an IPO, the Fosun Note principal and accrued interest would automatically convert to ordinary shares at a 10% discount to the IPO offering price. Fosun also had an option to elect, prior to July 1, 2014, to require the Company to create and then convert the Fosun Note to H preferred ordinary shares or pay in full all principal and interest outstanding on or before July 1, 2016. In the event of an IPO, the shares would be subjected to restrictions prohibiting sale or transfer of more than one-third of the shares each year for the first three years following the offering.
The feature which required automatic conversion upon an IPO was a redemption feature that met the definition of an embedded derivative requiring bifurcation from the Fosun Note. The Company determined there was no initial fair market value of the liability.
In connection with the Company’s IPO in November 2013, the Fosun Note and interest of approximately $50,000 converted into 467,551 of the Company’s ordinary shares at a price per share which reflected a 10% discount to the IPO offering price of $12.00 per share. Upon conversion of the Fosun Note to ordinary shares, the derivative liability terminated. In connection with the IPO the Company marked the embedded derivative to market and recorded a $561,000 loss on the change in the fair value of the instrument.
Initial Public Offering (IPO) Costs
Incremental costs incurred that were directly attributable to the November 2013 offering of securities were deferred and deducted from the related proceeds of the offering, and the net amount recorded as contributed shareholders’ equity in the period when such shares were issued. As at December 31, 2013, the Company had deducted $10.1 million from the related net proceeds of the offering for underwriting and other fees. Other costs incurred in the offering of $1.9 million (which are principally related to audit and accounting expenses) in the year ended December 31, 2013, were expensed as incurred and are included in general and administrative expenses.
2. Fair value measurement
As a basis for determining the fair value of certain of the Company’s financial instruments, the Company utilizes a three-tier value hierarchy, which prioritizes the inputs used in measuring fair value as follows:
Level I—Observable inputs such as quoted prices in active markets for identical assets or liabilities.
Level II—Observable inputs, other than Level I prices, such as quoted prices for similar assets or liabilities, quoted prices in markets that are not active or other inputs that are observable or can be corroborated by observable market data for substantially the full term of the assets or liabilities.
Level III—Unobservable inputs that are supported by little or no market activity and that are significant to the fair value of the assets or liabilities.
This hierarchy requires the Company to use observable market data, when available, and to minimize the use of unobservable inputs when determining fair value. The carrying amount of certain of the Company’s financial instruments, including cash, accounts receivable, prepaid expenses and other assets, accounts payable, and accrued expenses approximate fair value due to their short maturities.
The Company’s financial instruments that are measured at fair value on a recurring basis consist only of cash equivalents and the ordinary share warrant liability. Assets and liabilities measured at fair value are classified in their entirety based on the lowest level of input that is significant to the fair value measurement. The Company’s assessment of the significance of a particular input to the entire fair value measurement requires management to make judgments and consider factors specific to the asset or liability.
The following table presents information about the Company’s assets and liabilities that are measured at fair value on a recurring basis for the periods presented and indicates the fair value hierarchy of the valuation techniques it utilized to determine such fair value. In general, fair values determined by Level 1 inputs utilize quoted prices (unadjusted) in active markets for identical assets or liabilities. Fair values determined by Level 2 inputs utilize data points that are observable such as quoted prices, interest rates, and yield curves. Fair values determined by Level 3 inputs are unobservable data points for the asset or liability, and include situations where there is little, if any, market activity for the asset or liability.
|
Fair Value Measurements at December 31, 2013 Using |
||||||||||||||||
|
(in thousands) |
December 31, |
Quoted Prices in for |
Significant |
Significant |
||||||||||||
|
Liabilities: |
||||||||||||||||
|
Ordinary share warrants |
$ | 296 | $ | — | $ | — | $ | 296 | ||||||||
|
Total |
$ | 296 | $ | — | $ | — | $ | 296 | ||||||||
In May 2013, the Company entered a loan and security agreement with a commercial bank that provided for an initial borrowing of $6.0 million and, subject to the achievement of certain revenue milestones, the ability to borrow an additional $1.0 million in January 2014. The Company also received access to a $5.0 million revolving line of credit. The Company concurrently issued a warrant to purchase up to 15,791 ordinary shares of the Company at an exercise price of $0.80 per share. Due to the lack of market quotes relating to the Company’s ordinary share warrants, the fair value of the warrants was determined at December 31, 2013 using the Black-Scholes model, which is based on Level 3 inputs. As of December 31, 2013, inputs used in the Black-Scholes model include the Company’s share price as of that date of $19.38, exercise price of $0.80 per ordinary share, expected volatility of 48.6%, risk free interest rate of 2.6%, remaining expected term of approximately 9.4 years, and no dividends. The assumptions used may change as the underlying sources of these assumptions and market conditions change. Based on this calculation, the Company recorded other non-operating income of $279,000 during the year ended December 31, 2013, resulting in a warrant liability of $296,000 at December 31, 2013. In December 2013, the Company repaid the loan in full and cancelled the line of credit.
The Company did not have any financial liabilities carried at fair value as of December 31, 2012.
The following table provides a summary of changes in the fair value of the Company's Level 3 financial liabilities for the year ended December 31, 2013 (in thousands):
|
Balance – beginning |
$ | — | ||
|
Initial fair value of warrants at issuance in May 2013 |
17 | |||
|
Change in fair value of warrant liability |
279 | |||
|
Balance at December 31, 2013 |
$ | 296 |
3. Accounts receivable
Accounts receivable, net, consists of the following as of:
|
December 31, |
||||||||
|
(in thousands) |
2013 |
2012 |
||||||
|
Accounts receivable |
$ | 4,919 | $ | 5,544 | ||||
|
Less allowance for uncollectible accounts receivable |
(165 | ) | (144 | ) | ||||
|
Accounts receivable, net |
$ | 4,754 | $ | 5,400 | ||||
Activity for the allowance for uncollectible accounts receivable is as follows:
|
December 31, |
||||||||||||
|
(in thousands) |
2013 |
2012 |
2011 |
|||||||||
|
Balance at beginning of period |
$ | (144 | ) | $ | (200 | ) | $ | (46 | ) | |||
|
Provision for bad debt expense |
(124 | ) | — | (154 | ) | |||||||
|
Write-off, net of recoveries |
103 | 56 | — | |||||||||
|
Balance at end of period |
$ | (165 | ) | $ | (144 | ) | $ | (200 | ) | |||
4. Inventory
Inventory consisted of the following as of:
|
December 31, |
||||||||
|
(in thousands) |
2013 |
2012 |
||||||
|
Raw materials |
$ | 2,866 | $ | 857 | ||||
|
Finished goods |
2,584 | 2,216 | ||||||
|
Inventory, net |
$ | 5,450 | $ | 3,073 | ||||
5. Property and equipment, net
Property and equipment, net consists of the following as of:
|
December 31, |
||||||||
|
(in thousands) |
2013 |
2012 |
||||||
|
Laboratory equipment |
$ | 2,072 | $ | 1,926 | ||||
|
Leasehold improvements |
2,029 | 1,184 | ||||||
|
Office equipment, furniture and fixtures |
2,025 | 1,319 | ||||||
|
Software |
692 | 493 | ||||||
|
Specialized shipping containers |
294 | 338 | ||||||
|
Construction in progress |
— | 149 | ||||||
|
Property and equipment |
7,112 | 5,409 | ||||||
|
Less accumulated depreciation |
(4,148 | ) | (3,160 | ) | ||||
|
Property and equipment, net |
$ | 2,964 | $ | 2,249 | ||||
For the years ended December 31, 2013, 2012, and 2011, the Company recorded depreciation expense of $1.0 million, $0.7 million, and $0.6 million, respectively. Depreciation expense includes amortization of capital leases.
Depreciable lives range from three to ten years for laboratory equipment, office equipment, leasehold improvements, and furniture and fixtures and three years for software and specialized shipping containers.
For the years ended December 31, 2013 and 2012, there were no material capital leases, disposals or retirements.
6. Intangible assets
The Company’s intangible assets consist of in-licensed intellectual property, principally technology licenses. During the year ended December 31, 2012, the Company entered into a new license agreement under which it capitalized $0.1 million. During the year ended December 31, 2013, the Company capitalized a $0.2 million fee related to the assignment of certain patents to it by Isis Innovation Limited (Isis) in November 2013. The licenses are being amortized over the estimated remaining useful lives of the underlying license agreements, which range from 4 to 10 years. For the years ended December 31, 2013, 2012, and 2011, the Company recorded amortization expense of $43,000, $30,000, and $30,000, respectively.
Intangible assets as of December 31, 2013 and 2012 consist of the following:
|
December 31, |
||||||||
|
(in thousands) |
2013 |
2012 |
||||||
|
Gross carrying value |
$ | 878 | $ | 626 | ||||
|
Accumulated amortization |
(547 | ) | (519 | ) | ||||
|
Intangible assets, net |
$ | 331 | $ | 107 | ||||
7. Prepaid expenses
Prepaid expenses consist of the following as of:
|
December 31, |
||||||||
|
(in thousands) |
2013 |
2012 |
||||||
|
Payroll and other taxes |
$ | 776 | $ | 228 | ||||
|
Prepaid insurance |
489 | 309 | ||||||
|
Deferred cost of revenue |
501 | 247 | ||||||
|
Property costs |
163 | 151 | ||||||
|
Expense reimbursement, potential acquisition |
— | 250 | ||||||
|
Other prepaid expenses |
313 | 157 | ||||||
|
Total prepaid expenses |
$ | 2,242 | $ | 1,342 | ||||
8. Accrued expenses
Accrued expenses consist of the following as of:
|
December 31, |
||||||||
|
(in thousands) |
2013 |
2012 |
||||||
|
Employee related expenses |
$ | 2,766 | $ | 1,863 | ||||
|
Royalties |
2,064 | 1,090 | ||||||
|
Accrued IPO costs |
845 | — | ||||||
|
Rent |
366 | 296 | ||||||
|
Inventory |
293 | 87 | ||||||
|
Professional services |
99 | 250 | ||||||
|
Other accrued expenses |
503 | 376 | ||||||
|
Total accrued expenses |
$ | 6,936 | $ | 3,962 | ||||
9. Borrowings
In February 2012 the Company entered into a secured credit facility with a commercial bank that provided for borrowings of up to $3.0 million originally through February 2013 and extended through May 2013. In February 2012 the Company borrowed $1.5 million under the credit facility. Interest accrued daily on the outstanding balance at the prime rate plus 1.5% per annum, with a minimum of the Daily Adjusting LIBOR rate plus 2.5% per annum. The credit facility was secured by substantially all assets of the Company. The total amount outstanding on the facility as of December 31, 2012 was $1.5 million. As of December 31, 2012 the Company was in compliance with all financial and non-financial covenants under this credit facility. The loan was re-paid in full on May 24, 2013.
In connection with this credit facility, the Company issued a warrant to purchase up to 3,682 ordinary shares of the Company at an exercise price of $0.06705 per ordinary share. The warrant became exercisable immediately upon entering the secured credit facility and expires in February 2019. The fair value of the warrant was $3,000 at the date of grant and was determined by applying the Black-Scholes option pricing model, using the following assumptions:
|
Fair value |
Valuation technique |
Assumption |
Input value |
|||||||
|
Warrant liability ($ in thousands) |
$ | 3 |
Black-Scholes option pricing model |
Expected volatility |
37.6 | % | ||||
|
Estimated fair value of ordinary share |
$ | 0.14 | ||||||||
|
Exercise price |
$ | 0.01 | ||||||||
|
Expected term (yrs) |
3 | |||||||||
|
Dividend yield |
0.0 | % | ||||||||
|
Risk-free interest rate |
0.37 | % | ||||||||
In February 2012, the Company entered into an unsecured convertible note agreement with existing investors allowing the Company to borrow a total of $4.0 million. The Company issued unsecured convertible notes (the 2012 Notes) in two separate tranches of $3.0 million and $1.0 million in March 2012 and April 2012, respectively. The 2012 Notes matured four months after funding. The 2012 Notes bore interest at 10% per annum and interest was payable upon redemption or conversion.
Concurrently with the issuance of each tranche of the 2012 Notes the Company was obligated to pay the holders of the 2012 Notes a facility fee, payable in F preferred units, which consists of one F preferred ordinary share and one-third of an ordinary share per unit. The number of F Preferred Units issued was equal to 50% of the nominal amount of each tranche of the 2012 Notes, divided by $1.622, with no fractional shares issued. 137,922 F preferred ordinary shares and 45,973 ordinary shares were issued in connection with the March 2012 tranche and 45,974 F preferred ordinary shares and 15,324 ordinary shares were issued in connection with the April 2012 tranche. The fair value of the F Preferred Units on the dates of issuance totaled approximately $2.0 million. The proceeds from the 2012 Notes were allocated to the 2012 Notes and F Preferred Units based on the relative fair value of each on the issuance dates. The F Preferred Units were recorded as a discount to the 2012 Notes carrying value of $1.3 million to be amortized to interest expense over the term of the 2012 Notes.
The 2012 Notes were (1) automatically convertible upon the consummation of a qualifying equity fundraising into the class of shares to be issued to investors participating in the fundraising at the price per share at which such shares would be offered, (2) automatically convertible upon the consummation of a non-qualifying equity fundraising into either the class of shares to be issued to investors participating in the fundraising at the price per share at which such shares would be offered or F Preferred Units at a price of $10.876 per unit, as elected by holders of at least 65% of the nominal amount of outstanding notes, or (3) convertible into F Preferred Units at a price of $10.876 per unit, at the option of the holders of at least 65% of the nominal amount of outstanding notes upon the consummation of a debt fundraising.
The feature which required automatic conversion upon a qualifying or non-qualifying equity fundraising is a redemption feature that meets the definition of an embedded derivative and requires bifurcation from the 2012 Notes. The derivative was recorded as a liability with a corresponding discount to the 2012 Notes’ carrying value at its fair value of $0.1 million. The discount was amortized to interest expense over the term of the 2012 Notes.
The feature which provided for the optional conversion upon the consummation of a debt fundraising represents a beneficial conversion feature. Because the beneficial conversion feature was contingent upon a future debt fundraising that was not certain to occur, the beneficial conversion feature was not recognized in these financial statements until the contingency was resolved. In June 2012 the Company closed the first tranche of the G preferred ordinary share financing round. Both tranches of the 2012 Notes were converted into a total of 350,923 shares of G preferred ordinary shares. In a conversion of a convertible bond pursuant to the original conversion terms the debt was settled in exchange for equity and no gain or loss was recognized on conversion. At the conversion date the discount on the borrowing was fully amortized. The redemption feature was adjusted to its fair value of zero upon conversion and the liability was reduced to this amount with an offsetting adjustment to interest expense.
In May 2013, the Company entered a loan and security agreement with a commercial bank that provided for an initial borrowing of $6.0 million and, subject to the achievement of certain revenue milestones, the ability to borrow an additional $1.0 million in January 2014. The Company also received access to a $5.0 million revolving line of credit. The Company concurrently issued a warrant to purchase up to 15,791 ordinary shares of the Company at an exercise price of $0.80 per share. The loan was secured by the substantially all assets of the Company. Interest accrued daily on the outstanding balance at the prime rate plus 2.75%, with a minimum 6.0% per annum. The loan agreement contained certain restrictions on the Company, including restrictions on additional indebtedness, dispositions, dividend payments and future loans. The term loan was repaid and the credit facility was cancelled in December 2013, following our IPO. In addition, the bank released the Company from the security interest in its assets. In conjunction with the termination of the term loan and the credit facility, $142,000 of deferred loan costs were expensed. The warrant became exercisable upon issuance and expires in May 2023. The proceeds from the loan were first allocated to the warrant based upon the estimated fair value as of the issuance date, with the residual proceeds allocated to the term loan. This warrant was issued with a down-round provision whereby the exercise price would be adjusted downward in the event that additional ordinary shares or securities exercisable, convertible or exchangeable for the Company’s existing ordinary shares were issued at a price less than the exercise price. Therefore, the fair value of this warrant was recorded as a liability in the consolidated balance sheet and is marked to market at each reporting period end until it is exercised or expires or is otherwise extinguished. The fair value of the warrant was recorded as a liability upon issuance with a corresponding discount on the borrowing of $17,000 to be amortized to interest expense over the term of the loan. The estimated fair value of the warrants at December 31, 2013 was $296,000. The change in the estimated fair value of the warrants during the period ended December 31, 2013 was recorded as a component of other (expense) income in the consolidated statement of operations. The fair value was derived by applying the following assumptions:
|
Fair value |
Valuation technique |
Assumption |
Input |
|||||||
|
Warrant liability ($ in thousands) |
$ | 296 |
Black-Scholes option pricing model |
Expected volatility |
48.6 | % | ||||
|
Estimated fair value of ordinary share |
$ | 19.38 | ||||||||
|
Exercise price |
$ | 0.80 | ||||||||
|
Expected term (yrs) |
9.4 | |||||||||
|
Dividend yield |
0 | % | ||||||||
|
Risk-free interest rate |
2.64 | % | ||||||||
In June 2013, in conjunction with the lease for 14,541 square feet of office space in Marlborough, Massachusetts, the Company received a payment of $581,640 from the landlord, representing approximately 80% of the cost to build-out the facility. In accordance with Financial Accounting Standards Board, Accounting Standards Codification 840, Leases, this reimbursement was recorded as a liability in loans payable and is being amortized over the life of the lease. At December 31, 2013, $100,000 is included in the balance sheet in current portion of loans payable and $466,000 is included in long-term portion of loans payable.
In October 2013, the Company issued a convertible promissory note in the amount of $5.0 million to Fosun Industrial Co., Ltd., (the Fosun Note). The Fosun Note paid interest at 8% per annum.
In the event of an IPO, the Fosun Note principal and accrued interest would automatically convert to ordinary shares at a 10% discount to the IPO offering price. Fosun also had an option to elect, prior to July 1, 2014, to require the Company to create and then convert the Fosun Note to H preferred ordinary shares or pay in full all principal and interest outstanding on or before July 1, 2016. In the event of an IPO, the shares would be subjected to restrictions prohibiting sale or transfer of more than one-third of the shares each year for the first three years following the offering.
The feature which required automatic conversion upon an IPO was a redemption feature that met the definition of an embedded derivative requiring bifurcation from the Fosun Note. The Company determined there was no initial fair market value of the liability.
In connection with the Company’s IPO in November 2013, the Fosun Note and interest of approximately $50,000 converted into 467,551 of the Company’s ordinary shares at a price per share which reflected a 10% discount to the IPO offering price of $12.00 per share. Upon conversion of the Fosun Note to ordinary shares, the derivative liability terminated. In connection with the IPO the Company marked the embedded derivative to market and recorded a $561,000 loss on the change in the fair value of the instrument.
The Company has restricted cash in the amount of less than $0.1 million pledged as collateral for procurement cards issued by the commercial bank.
10. Share capital
As of December 31, 2013, the Company had 17,255,267 ordinary shares outstanding. In addition, there were a total of 1,359,014 options and a total of 19,473 warrants outstanding as of December 31, 2013.
a. Preferred ordinary shares
Just prior to the Company’s IPO in November 2013, all preferred ordinary shares were converted to ordinary shares on a one for one basis.
The following is a summary of the Company’s preferred ordinary shares as of December 31, 2012:
|
Preferred shares authorized |
Preferred ordinary |
|||||||
|
A preferred ordinary |
134,708 | 134,706 | ||||||
|
B preferred ordinary |
53,992 | 53,992 | ||||||
|
D preferred ordinary |
520,275 | 487,222 | ||||||
|
E preferred ordinary |
4,772,557 | 2,547,496 | ||||||
|
F preferred ordinary |
2,982,848 | 2,574,575 | ||||||
|
G preferred ordinary |
3,728,560 | 1,503,330 | ||||||
| 12,192,940 | 7,301,321 | |||||||
In February 2011 the Company issued 306,499 ordinary shares and 919,498 F preferred ordinary shares for consideration of $10 million cash in the third and final tranche of the F preferred ordinary share financing round.
The Company issued 137,922 F preferred ordinary shares and 45,973 ordinary shares in March 2012 and 45,974 F preferred ordinary shares and 15,324 ordinary shares in April 2012 in the form of F Preferred Units as a financing fee for the Company’s $4 million issuance of the 2012 Notes.
In June 2012, the Company issued 1,495,464 G preferred ordinary shares for consideration of $17 million in the first tranche of the G preferred ordinary share financing round. The Company issued an additional 7,882 G preferred ordinary shares in June 2012 as payment of interest on the 2012 Notes.
On December 31, 2012, the Company held $8.1 million in cash received from investors related to the closing of the second and final tranche of the G preferred ordinary share financing round, which was recorded in shareholders’ equity. On January 4, 2013, the remaining cash was received from investors and the Company issued 966,417 G preferred ordinary shares to complete the second and final tranche of the G preferred ordinary share financing, raising a total of $11.0 million.
The rights, preferences and privileges of the Company’s A preferred ordinary shares, B preferred ordinary shares, D preferred ordinary shares, E preferred ordinary shares, F preferred ordinary shares and G preferred ordinary shares (collectively, the preferred ordinary shares) were as follows:
Voting and consent rights—The preferred ordinary shares in issue ranked pari passu with regards to voting rights. Holders of preferred ordinary shares were entitled to vote on all matters and were entitled to the number of votes equal to the number of ordinary shares into which each preferred ordinary share was then convertible. The consent of the holders of at least 60% of the E, F, and G preferred ordinary shares outstanding (taken together as a single class) was required for certain corporate actions including a deemed liquidation event, sale of all or a substantial portion of the Company’s assets or the creation of any debt of the Company in excess of $2,000,000. The approval of the holders of G preferred ordinary shares was required for any amendment or change to the Company’s articles of association that would be disproportionately adverse to the holders of G preferred ordinary shares and not similarly adverse to the rights of the holders of the other preferred ordinary shares and for the creation of any security convertible into a security having rights, preferences or privileges senior to the G preferred ordinary shares.
Liquidation rights—Upon the liquidation of the Company, including certain transactions deemed to be a liquidation, the holders of G preferred ordinary shares and, as a separate class, the holders of F preferred ordinary shares had a liquidation preference to all other holders of preferred ordinary shares and ordinary shares, in an amount equal to, in the case of the G preferred ordinary shares, 1.25 times the original issue price of $11.399 per share, and, in the case of the F preferred ordinary shares, 1.50 times the original issue price of $8.153 per share. The liquidation preference for each of the holders of the G preferred ordinary shares and the F preferred ordinary shares was limited to 50% of the assets or sale amount available for distribution. In the event that the assets or sale amount was insufficient to make such distributions to the holders of G preferred ordinary shares and F preferred ordinary shares separately, then the holders of G preferred ordinary shares and F preferred ordinary shares would have participated, within their own classes, pro rata to their respective shareholdings of G preferred ordinary shares and F preferred ordinary shares, respectively. In the event that 50% of the assets or sale amount available for distribution was sufficient to satisfy one but not the other of the G preferred ordinary share preference and the F preferred ordinary share preference, separately, then any undistributed amount of assets or sale amount would be distributed to either the holders of G preferred ordinary shares or F preferred ordinary shares, as the case may be.
Subsequent to the payments of the liquidation preferences of the G preferred ordinary shares and the F preferred ordinary shares, each holder of E preferred ordinary shares would receive an amount equal to the aggregate amount paid by such holder for such shares, which was $17.54 for the shares acquired in the first tranche in October 2007, $17.54 for the shares acquired in the second tranche in August 2008 and £0.006705 for the shares acquired pursuant to cashless exercise of warrants issued in October 2007.
After the payments of the liquidation preferences to holders of G preferred ordinary shares, F preferred ordinary shares and E preferred ordinary shares in full, the remaining assets or sale amount would generally be paid, depending on the amount available for distribution, to holders of all shares based on their respective preferences or, if no preferences are applicable, to all holders on an as-converted basis.
Transfer restrictions—The preferred ordinary shares could have been transferred to any person with the prior consent in writing of holders of shares entitled to cast 90% of the votes exercisable at a general meeting of the Company. The preferred ordinary shares could have been transferred at any time, without prior consent, to certain parties including, where the shares were held by individual members, to certain privileged relations and family trusts; where the shares were held by a company, to a member of the same group as such company; where the shares were held by an investment manager, to a participant or partner in or member of an investment fund which is managed by such investment manager, an investment fund whose business is managed by the investment manager, any other investment manager who manages the business of the investment fund in respect of which the shares are held, or any other person if required by a regulatory authority; where the shares were held by an investment fund, to a participant or partner in or member of such investment fund, any other investment fund whose business is managed by the same investment manager, or the investment manager who manages the business of the investment fund; where the shares were held by trustees under an employee trust, to the new trustees of that employee trust on any change of trustees or to any beneficiary of that employee trust.
Anti-dilution rights—In the event of a relevant issue of securities at a price which, in the case of the G preferred ordinary shares, was less than the original issue price of $11.399 per share, the Company would have been required to issue to each holder of G preferred ordinary shares such number of ordinary shares as would result in such holder of G preferred ordinary shares holding such number of shares as would be held if the aggregate original issue price of $11.399 per share in respect of all G preferred ordinary shares then held by such holder was applied wholly in subscribing for the new shares at the weighted-average subscription price in respect of the relevant issue. In the event of a relevant issuance of securities at a price which, in the case of the F preferred ordinary shares and E preferred ordinary shares, was less than the original issue price of $8.153 per share, the Company would have been required to issue to each holder of E preferred ordinary shares and each holder of F preferred ordinary shares, with the exception of holders of F preferred ordinary shares who received such shares pursuant to the issuance of F preferred units, such number of ordinary shares as would result in such holders holding such number of shares as would be held if the aggregate original issue price of $8.153 per share in respect of all shares then held by such holder was applied wholly in subscribing for the new shares at the weighted-average subscription price in respect of the relevant issue. In June 2012, the anti-dilution rights resulted in the issuance of 817,761 ordinary shares to the holders of the E preferred ordinary shares. The transaction did not result in the recognition of a beneficial conversion feature as the effective conversion price of the shares exceeded the fair value of the ordinary shares at the date of issuance. Other than the issuance of share capital the transaction did not have accounting implications. In the event that additional shares had been issued as a result of the anti-dilution rights the Company would have recorded the issuance of share capital and assessed whether a beneficial conversion feature or other accounting implications were present. The anti-dilution rights did not preclude the classification of the shares as permanent equity.
Conversion—Upon a conversion, each preferred ordinary share would automatically be converted to, re-designated as, and ranked pari passu with the ordinary shares then in issue immediately prior to and conditional upon a qualified listing on a one-for-one basis. Each preferred ordinary share was convertible into one ordinary share at any time at the holder’s request.
The Company classified its convertible preferred ordinary shares as permanent equity, as they did not contain redemption rights or other terms that would require classification outside of permanent equity.
b. Ordinary shares
On November 21, 2013, the registration statement for the Company’s initial public offering, or IPO, was declared effective by the Securities and Exchange Commission. The Company sold 6,164,000 ordinary shares, at an initial public offering price of $12.00 per share, which included the exercise in full by the underwriters of their option to purchase up to 804,000 additional ordinary shares. Net proceeds from the IPO were approximately $63.9 million, after deducting underwriting discounts and commissions and estimated offering expenses. Following the Company’s IPO, the Company now has one class of ordinary shares authorized. As of December 31, 2013, there were 25,189,285 ordinary shares authorized and 17,255,267 ordinary shares issued and outstanding.
As of December 31, 2012, the Company had three classes of ordinary shares, which had identical rights, as detailed below.:
|
Ordinary authorized |
Ordinary shares |
|||||||
|
Ordinary shares |
16,405,667 | 2,142,080 | ||||||
|
A ordinary shares |
11,894 | 11,894 | ||||||
|
D ordinary shares |
14,914 | — | ||||||
| 16,432,475 | 2,153,974 | |||||||
11. Share option and equity incentive plans
Since 2003, the Company has issued share options to incentivize employees and directors providing services to the Company. The Company currently maintains two equity compensation plans, the Amended and Restated 2008 Stock Incentive Plan and the 2013 Share Incentive Plan.
In February 2010, the Company adopted an Amended and Restated 2008 Stock Incentive Plan (the 2008 Plan) which provides for the grant of share options, restricted shares, restricted share units (RSUs) and other share-based awards to employees, officers, directors and consultants of the Company. The Plan reserves ordinary shares equal to 14.6% of the fully diluted share capital of the Company on an as converted basis. With the adoption of the 2013 Share Incentive Plan, the Company is no longer authorized to grant awards under the 2008 Plan.
In February 2010, in order to further incentivize employees, the Company offered all option holders of the 2008 Plan the opportunity to reduce the exercise price of their existing options through a tender offer. As part of this offer, the option holder had to agree to the cancellation of their existing share options and the reissuance of new share options under the 2008 Plan. Additional compensation cost resulting from the tender offer was approximately $14,000, of which approximately $8,000 was recognized during 2010 and approximately $6,000 was recognized over a maximum remaining vesting period of three years.
In November 2013, in connection with the Company’s IPO, the Company adopted the 2013 Share Incentive Plan (the 2013 Plan) which provides for the grant of share options, restricted shares, RSUs and other share-based awards to employees, officers, directors and consultants of the Company. The 2013 Plan authorizes the Company to grant up to 2,684,563 ordinary shares with such amount automatically increasing annually on each January 1st from January 1, 2015 to January 1, 2023 by 4% of the number of shares outstanding on the close of business of the immediately preceding December 31st , provided that the Board of Directors may limit the increase to a smaller amount or to no increase in any given year. At December 31, 2013, there were 2,603,664 shares available for future issuance under the 2013 Plan.
Under both the 2008 Plan and the 2013 Plan, share options have been granted to employees, officers and directors who provide services to the Company. Options generally vest based on the grantee’s continued service with the Company during a specified period following grant or, in rare instances, based on the achievement of performance or other conditions as determined by the Board of Directors, and expire after ten years. Awards to employees generally vest monthly over a four year period; however, the vesting percentage remains 0% until the second anniversary of the vesting start date of the employee’s first option award under the 2008 Plan and the second anniversary of the employee’s date of hire under the 2013 Plan. The expense recognized during the year related to share-based compensation transactions was as follows:
|
Year ended December 31, |
||||||||||||
|
(in thousands) |
2013 |
2012 |
2011 |
|||||||||
|
Cost of revenue |
$ | 5 | $ | 2 | $ | 4 | ||||||
|
General and administrative |
108 | 55 | 85 | |||||||||
|
Research and development |
1 | 4 | 4 | |||||||||
|
Sales and marketing |
26 | 18 | 32 | |||||||||
|
Total share-based compensation |
$ | 140 | $ | 79 | $ | 125 | ||||||
Prior to the Company’s IPO in November 2013, the Company engaged a third-party consultant to assist the Board of Directors in the determination of the estimated fair market value of the Company’s ordinary shares. The share price was determined by the Board of Directors using contemporaneous valuations. In certain instances, the valuation was delivered after the date the options were granted, but was retrospective to an earlier date specified in the valuation report.
Transactions in the Company’s shares completed by independent investors represented the best indication of fair value of the securities. In addition, new rounds of venture capital financing, which reflected the expectations of independent investors with respect to the Company’s future performance, usually provided a good indication of the fair value of the ordinary shares. In this case, the fair value of the ordinary shares, was derived based on the price paid by the venture capital investors for the preferred ordinary shares, taking into account the differences in various rights and liquidation preferences between ordinary shares and the preferred ordinary shares. This is also known as the back-solve approach. In cases where there were no transactions or new financings, the use of a discounted cash flow analysis and guideline public firm multiples, adjusted for unique characteristics of the Company, were used as accepted methodologies.
The fair value of the options was estimated at the grant date using the Black-Scholes option pricing model, taking into account the terms and conditions upon which options are granted. The fair value of the options is amortized on a straight-line basis over the requisite service period of the awards. The weighted-average grant date fair value per share relating to share options granted under the Plan during the years ended December 31, 2013, 2012, and 2011 was $3.04, $0.27, and $0.13, respectively.
The fair value of each option granted under the Plan has been calculated on the date of grant using the following assumptions:
|
2013 |
2012 |
2011 |
||||||||||
|
Expected dividend yield (%) |
— | — | — | |||||||||
|
Expected volatility (%) |
47.78 | 49.43 | 53.87 | |||||||||
|
Risk-free interest rate (%) |
1.38 | 1.03 | 1.75 | |||||||||
|
Expected life of option (years) |
6.22 | 6.25 | 6.25 | |||||||||
|
Weighted-average share price ($) |
5.86 | 0.60 | 0.26 | |||||||||
|
Weighted-average exercise price ($) |
4.97 | 0.60 | 0.26 | |||||||||
|
Model used |
Black-Scholes Model |
Black-Scholes Model |
Black-Scholes Model |
|||||||||
Expected dividend yield: The Company has not paid and does not anticipate paying any dividends in the foreseeable future.
Risk-free interest rate: The Company determined the risk-free interest rate by using a weighted-average equivalent to the expected term based on the U.S. Treasury yield curve in effect as of the date of grant.
Expected volatility: As the Company operated as a private company until November 2013, there is not sufficient historical volatility for the expected term of the options. Therefore, the Company used an average share price volatility over a historical period equal in length to the expected term, based on an analysis of reported data for a peer group of comparable companies which were selected based upon industry similarities. The Company intends to continue to use comparable companies in its volatility factor calculation until a sufficient amount of historical information regarding the volatility of its own share price becomes available.
Expected term (in years): Expected term represents the period that the Company’s share option grants are expected to be outstanding. As the Company operated as a private company until November 2013, there is not sufficient historical share data to calculate the expected term of the options. Therefore, the Company elected to utilize the “simplified” method to value share option grants. Under this approach, the weighted-average expected life is presumed to be the average of the vesting term and the contractual term of the option.
Forfeitures are estimated at the time of grant and revised, if necessary, in subsequent periods if actual forfeitures differ from estimates. The Company estimates forfeitures based on historical termination behavior. For the years ended December 31, 2013, 2012, and 2011, a forfeiture rate of 5% was applied.
The following table illustrates the number of ordinary shares and weighted-average exercise prices (WAEP) of, and movements in, share options during the year:
|
Number of ordinary shares |
WAEP in $ |
|||||||
|
Outstanding as of January 1, 2012 |
783,750 | $ | 0.13 | |||||
|
Granted |
686,125 | 0.60 | ||||||
|
Exercised |
(9,378 | ) | 0.13 | |||||
|
Forfeited |
(13,690 | ) | 0.27 | |||||
|
Outstanding as of December 31, 2012 |
1,446,807 | 0.36 | ||||||
|
Exercisable as of December 31, 2012 |
536,167 | $ | 0.13 | |||||
|
Outstanding as of January 1, 2013 |
1,446,807 | $ | 0.36 | |||||
|
Granted |
312,198 | 5.12 | ||||||
|
Exercised |
(201,459 | ) | 0.12 | |||||
|
Forfeited |
(198,532 | ) | 0.24 | |||||
|
Outstanding as of December 31, 2013 |
1,359,014 | 1.50 | ||||||
|
Vested or expected to vest as of December 31, 2013 |
1,320,922 | $ | 1.48 | |||||
|
Exercisable as of December 31, 2013 |
597,174 | $ | 0.37 | |||||
As of December 31, 2013, there was $0.9 million of total unrecognized compensation cost related to non-vested share-based compensation arrangements granted under the share option plan. That cost is expected to be recognized over a weighted-average period of 1.79 years.
A summary of options outstanding and exercisable as of December 31, 2013, follows:
|
Total options outstanding |
Total options exercisable |
|||||||||||||||||
|
Exercise prices $ |
Number of options |
Weighted-average |
Number of options |
Weighted-average |
||||||||||||||
|
$0.00 |
- | $1.00 | 1,235,767 | 589,273 | ||||||||||||||
|
$1.01 |
- | $5.00 | 42,348 | 7,901 | ||||||||||||||
|
$15.00 |
- | $20.00 | 80,899 | — | ||||||||||||||
| 1,359,014 | 8.10 | 597,174 | 7.24 | |||||||||||||||
The aggregate intrinsic value of all share options outstanding under the Plan as of December 31, 2013 and 2012 is $24.8 million and $0.5 million, respectively. The aggregate intrinsic value of share options that were fully vested under the Plan as of December 31, 2013 is $11.7 million.
During the years ended December 31, 2013, 2012, and 2011, current and former employees of the Company exercised a total of 201,459, 9,378, and 4,459 share options, respectively, resulting in total proceeds of $24,000 during the year ended December 31, 2013 and less than $1,000 for the years ended December 31, 2012 and 2011. The intrinsic value of share options exercised during the years ended December 31, 2013, 2012, and 2011 was $3.9 million, $6,000, and $1,000, respectively. In accordance with Company policy, the shares were issued from a pool of shares reserved for issuance under the Plan described above.
A summary of the activity of the Company’s unvested share options is as follows:
|
Number of shares |
Weighted-average grant |
|||||||
|
Balance as of December 31, 2012 |
911,015 | $ | 0.20 | |||||
|
Granted |
312,198 | 3.04 | ||||||
|
Vested |
(404,203 | ) | 0.11 | |||||
|
Forfeited |
(57,170 | ) | 0.22 | |||||
|
Balance as of December 31, 2013 |
761,840 | 1.43 | ||||||
The total fair value of shares vested for the years ended December 31, 2013, 2012, and 2011 was $42,000, $12,000, and $7,000, respectively.
In June 2012, the Company established the Incentive Bonus Plan for Holders of Company Share Options, or the Incentive Bonus Plan, to establish a retention bonus pool to provide incentives for employees to continue service through the closing of certain major corporate transactions. Generally, participants in the Incentive Bonus Plan would have received an amount equal to 11% of the value of the “total consideration” in a corporate transaction (defined as the amount available to shareholders and participants after payment of all expenses relating to the corporate transaction) as a result of (a) their holdings of ordinary shares acquired as a result of the exercise of their options or otherwise pursuant to one of the Company’s equity incentive plans taken together with (b) the payment to be made pursuant to the Incentive Bonus Plan. The 11% value was subject to downward adjustment for additional equity capital raises following the completion of the G preferred ordinary share financing. By its terms, the Incentive Bonus Plan automatically terminated upon completion of the Company’s IPO.
12. Net loss per share
The following table provides a reconciliation of the numerator and denominator used in computing basic and diluted net loss per share:
|
Year ended December 31, |
||||||||||||
|
($ in thousands) |
2013 |
2012 |
2011 |
|||||||||
|
Numerator: |
||||||||||||
|
Net loss attributable to ordinary shareholders |
$ | (8,664 | ) | $ | (14,883 | ) | $ | (13,104 | ) | |||
|
Denominator: |
||||||||||||
|
Weighted-average ordinary shares outstanding-basic |
3,830,837 | 1,763,728 | 1,215,532 | |||||||||
|
Dilutive effect of ordinary share equivalents resulting from ordinary share options, ordinary share warrants and preferred ordinary shares (as converted) |
— | — | — | |||||||||
|
Weighted-average ordinary shares outstanding-diluted |
3,830,837 | 1,763,728 |
|
1,215,532 | ||||||||
The following numbers of outstanding ordinary share options, ordinary share warrants and preferred ordinary shares (on an “as converted to ordinary shares” basis) were excluded from the computation of diluted net loss per share for the periods presented because their effect would have been anti-dilutive:
|
Year ended December 31, |
||||||||||||
|
2013 |
2012 |
2011 |
||||||||||
|
Options to purchase ordinary shares |
1,252,790 | 1,129,657 | 285,881 | |||||||||
|
Ordinary share warrant |
19,473 | 3,682 | — | |||||||||
|
Preferred ordinary shares (as converted) |
— | 7,301,371 | 5,614,128 | |||||||||
13. Related party transactions
Until November 20, 2013, the Company licensed certain intellectual property from Isis, a wholly owned subsidiary of the University of Oxford. The Chancellor, Master and Scholars of the University of Oxford owned 219,002 ordinary shares of the Company at December 31, 2013, and 69,830 ordinary shares and 149,172 preferred ordinary shares of the Company at December 31, 2012. On November 20, 2013, Isis assigned certain intellectual property rights that had been subject to the license to the Company. The Company continues to have the obligation to make payments to Isis measured in part based on sales levels. In the years ended December 31, 2013, 2012, and 2011, the Company made payments in respect of intellectual property and patent maintenance related to the patents licensed from and assigned to the Company by Isis in the amounts of $0.6 million, $0.3 million, and $0.2 million, respectively. Accounts payable in respect of these arrangements at December 31, 2013 and 2012 were $0.4 million and $0.3 million, respectively.
The Company purchases inventory from Mabtech AB, a shareholder that owned 57,018 ordinary shares of the Company at December 31, 2013, and 7,624 ordinary shares and 49,393 preferred ordinary shares of the Company at December 31, 2012. In the years ended December 31, 2013, 2012, and 2011 the Company made payments to Mabtech AB in the amount of $3.0 million, $1.7 million, and $1.2 million, respectively. Accounts payable in respect of these arrangements at December 31, 2013 and 2012 were immaterial.
In October 2013, the Company issued a convertible promissory note in the amount of $5.0 million to Fosun Industrial Co., Ltd., (the Fosun Note). The Fosun Note paid interest at 8% per annum.
In the event of an IPO, the Fosun Note principal and accrued interest would automatically convert to ordinary shares at a 10% discount to the IPO offering price. Fosun also had an option to elect, prior to July 1, 2014, to require the Company to create and then convert the Fosun Note to H preferred ordinary shares or pay in full all principal and interest outstanding on or before July 1, 2016. In the event of an IPO, the shares would be subjected to restrictions prohibiting sale or transfer of more than one-third of the shares each year for the first three years following the offering.
The feature which required automatic conversion upon an IPO was a redemption feature that met the definition of an embedded derivative requiring bifurcation from the Fosun Note. The Company determined there was no initial fair market value of the liability.
In connection with the Company’s IPO in November 2013, the Fosun Note and interest of approximately $50,000 converted into 467,551 of the Company’s ordinary shares at a price per share which reflected a 10% discount to the IPO offering price of $12.00 per share. Upon conversion of the Fosun Note to ordinary shares, the derivative liability terminated. In connection with the IPO the Company marked the embedded derivative to market and recorded a $561,000 loss on the change in the fair value of the instrument.
Revenue on sales to Fosun subsequent to the issuance of the promissory note was $1.3 million. The balance of accounts receivable from Fosun at December 31, 2013 was immaterial. At December 31, 2013, Fosun held 467,551 of the Company’s ordinary shares.
14. Income taxes
The components of loss before income taxes are as follows for the years ended December 31:
|
(in thousands) |
2013 |
2012 |
2011 |
|||||||||
|
Domestic (United Kingdom) |
$ | 4,915 | $ | (2,754 | ) | $ | (3,776 | ) | ||||
|
Foreign (United States) |
(13,487 | ) | (12,280 | ) | (9,447 | ) | ||||||
|
Loss before income taxes |
$ | (8,572 | ) | $ | (15,034 | ) | $ | (13,223 | ) | |||
The components for the income tax expense (benefit) are as follows for the years ended December 31:
|
(in thousands) |
2013 |
2012 |
2011 |
|||||||||
|
Current: |
||||||||||||
|
Federal |
$ | — | $ | — | $ | — | ||||||
|
UK |
— | (173 | ) | (145 | ) | |||||||
|
Japan |
47 | — | — | |||||||||
|
State |
45 | 22 | 26 | |||||||||
|
Total current provision |
92 | (151 | ) | (119 | ) | |||||||
|
Deferred: |
||||||||||||
|
Federal |
— | — | — | |||||||||
|
UK |
— | — | — | |||||||||
|
State |
— | — | — | |||||||||
|
Total deferred benefit |
— | — | — | |||||||||
| $ | 92 | $ | (151 | ) | $ | (119 | ) | |||||
Deferred income taxes reflect the net tax effect of temporary differences between the carrying amount of assets and liabilities for financial reporting purposes and the amounts used for income tax purposes.
The Company’s effective income tax rate differs from the statutory domestic (United Kingdom) income tax rate as follows for the years ended December 31:
|
2013 |
2012 |
2011 |
||||||||||
|
Income tax rate |
23.3 |
% |
20.0 |
% |
20.0 |
% | ||||||
|
U.K. research and development credit |
— | 1.1 | 1.1 | |||||||||
|
Other |
(0.6 |
) |
(0.3 |
) |
(0.5 |
) | ||||||
| Effect of foreign tax rate differential | 16.9 | 15.9 | 11.0 | |||||||||
|
Valuation allowance |
(40.6 |
) |
(35.7 |
) |
(30.7 |
) | ||||||
|
Effective income tax rate |
(1.0 |
)% |
1.0 |
% |
0.9 |
% | ||||||
The Company is headquartered in the United Kingdom and the effective U.K. corporate tax rate for the year ended December 31, 2013 was 23.3%. For the years ended December 31, 2012 and 2011, the corporate tax rate was 20%. The U.S. federal corporate tax rate was 34% for the years ended December 31, 2013, 2012, and 2011.
Significant components of the Company’s deferred tax assets are as follows for the years ended December 31:
|
(in thousands) |
2013 |
2012 |
||||||
|
Deferred tax assets: |
||||||||
|
Long term deferred tax assets: |
||||||||
|
U.S. federal net operating losses |
$ | 16,897 | $ | 12,939 | ||||
|
State net operating loss (net of federal) |
1,659 | 1,700 | ||||||
|
U.K. net operating loss |
7,408 | 7,733 | ||||||
|
Share options |
112 | 120 | ||||||
|
Accrued expenses |
233 | 160 | ||||||
|
Other |
127 | 97 | ||||||
|
Short term deferred tax assets: |
||||||||
|
Accrued expenses |
373 | 250 | ||||||
|
Other assets |
9 | — | ||||||
|
Total deferred tax assets |
26,818 | 22,999 | ||||||
|
Valuation allowance |
(26,413 | ) | (22,929 | ) | ||||
|
Total deferred tax assets |
$ | 405 | $ | 70 | ||||
|
Deferred tax liabilities: |
||||||||
|
Long term deferred tax liabilities: |
||||||||
|
Other assets |
$ | (405 | ) | $ | (70 | ) | ||
|
Cumulative translation adjustment |
— | — | ||||||
|
Total deferred tax liabilities |
$ | (405 | ) | $ | (70 | ) | ||
For the years ended December 31, 2013 and 2012, the Company had United Kingdom Net Operating Losses (U.K. NOLs) of $37.0 million and $38.7 million, respectively. U.S. federal net operating loss carryforwards for the years ended December 31, 2013 and 2012 were $49.7 million and $38.1 million, respectively. U.S. State net operating loss carryforwards for the years ended December 31, 2013 and 2012 were $45.1 million and $32.9 million, respectively.
The U.S. federal and state net operating loss carryforwards begin to expire in 2027 and 2014, respectively and the U.K. NOLs can be carried forward indefinitely.
For financial reporting purposes, a valuation allowance has been recognized to offset the deferred tax assets related to the carryforwards. The utilization of the loss carryforwards to reduce future income taxes will depend on the Company’s ability to generate sufficient taxable income prior to the expiration of the loss carryforwards. To date the Company has incurred significant operating losses. In addition, the maximum annual use of net operating losses and research credit carryforwards is limited in certain situations where changes occur in share ownership.
The following table reflects the rollforward of the Company’s valuation allowance:
|
(in thousands) |
2013 |
2012 |
2011 |
|||||||||
|
Beginning of year (January 1) |
$ | 22,929 | $ | 17,556 | $ | 13,503 | ||||||
|
Increase in valuation allowance |
3,484 | 5,373 | 4,053 | |||||||||
|
End of year (December 31) |
$ | 26,413 | $ | 22,929 | $ | 17,556 | ||||||
The Company reviewed its historical tax filings and tax positions and has determined no material uncertain tax positions exist at December 31, 2013 and 2012. The Company continues to monitor its tax filings and positions.
The Company generates research and development credits in the United Kingdom which are refundable if a current year loss is incurred. In the United Kingdom for the year ended December 31, 2012, the Company has been reimbursed $0.2 million, for research and development tax credits. These are recorded as a reduction against income tax expense.
15. Intellectual property—license agreements
The Company entered into three license agreements by which it has secured certain patent rights that are necessary to make, use and sell the T-SPOT.TB test. One of these license agreements, with Isis, was terminated in connection with the assignment by Isis to the Company of certain intellectual property rights in November 2013. The Company has ongoing obligations to make certain payments to Isis while the assigned patents remain in force in certain countries. The Company’s existing license agreements related to its T-SPOT.TB test, as well as its previous license from Isis, are generally exclusive in the stated field, cover a worldwide territory, are royalty-bearing and give the Company the right to grant sublicenses. The Company has minimum royalty obligations under each existing license agreement, which continue so long as patents licensed under the agreement remain unexpired. The minimum contractual royalty payments, including ongoing minimum payment obligations to Isis, after December 31, 2013 and 2012 are set forth in the commitments and contingencies table in Note 17, “Commitments and contingencies” to these consolidated financial statements.
The Company incurs royalties under each existing license agreement, has incurred royalties under the Isis license agreement, and will incur continuing payment obligations to Isis that are treated as royalties in these financial statements, based on its product and service revenue. The aggregate royalty expense relating to the three license agreements amounted to $3.7 million, $2.4 million, and $1.5 million for the years ended December 31, 2013, 2012, and 2011, respectively. The Company paid other license-related expenses, including patent prosecution expenses, milestone payments and assignment fees due to these licensors, amounting to $0.3 million, $0.1 million, and $0.1 million for the years ended December 31, 2013, 2012, and 2011, respectively. The aggregate royalty rate paid by the Company in the years ended December 31, 2013, 2012, and 2011, as a percentage of the gross product and service revenue of the Company, was 10%, 11%, and 12%, respectively.
16. Employee benefit plans
In the United States, the Company has adopted a defined contribution plan (the U.S. Plan) which qualifies under Section 401(k) of the Internal Revenue Code. All U.S. employees of the Company who have attained 21 years of age are eligible for participation in the U.S. Plan upon employment. The effective date of the U.S. Plan was January 1, 2008. Under the U.S. Plan, participating employees may defer up to the Internal Revenue Service annual contribution limit. The Company does not match employee contributions.
In the United Kingdom, the Company has adopted a defined contribution plan (the U.K. Plan) which qualifies under the rules established by HM Revenue & Customs. The U.K. Plan allows all U.K. employees to contribute a minimum of 5% of salary with no maximum limit. The contribution is matched by the Company, up to a maximum of 5% of salary. The Company paid $0.4 million in matching contributions in each of the years ended December 31, 2013, 2012, and 2011 to the U.K. Plan.
17. Commitments and contingencies
Operating leases
At December 31, 2013, the Company leases facilities under four non-cancelable operating leases, with terms that expire between 2016 and 2019. The Company leases office, laboratory and manufacturing space in Abingdon, U.K., which leases are due to expire on June 11, 2019. On March 1, 2013, the Company signed a five year lease for its U.S. corporate headquarters in Marlborough, Massachusetts. During June 2013, the Company moved into this facility and vacated the old facility prior to lease expiration on June 30, 2013. The new lease term runs from June 2013 to October 2018. Annual lease costs are approximately $0.3 million. The Company leases laboratory space in Memphis, Tennessee, which lease is due to expire on December 31, 2016. For property in the United States, the Company has bank balances pledged as security as described in Note 1, “Description of business and significant accounting policies—Restricted cash” to these consolidated financial statements.
Future minimum lease payments required under the non-cancelable operating leases in effect as of December 31, 2013 are as follows:
|
(in thousands) |
December 31, |
|||
|
Year 1 |
$ | 973 | ||
|
Year 2 |
981 | |||
|
Year 3 |
988 | |||
|
Year 4 |
849 | |||
|
Year 5 |
806 | |||
|
Thereafter |
277 | |||
|
Total minimum lease payments |
$ | 4,874 | ||
Rent expense is calculated on a straight-line basis over the term of the lease. Rent expense recognized under operating leases totaled $0.7 million, $0.7 million, and $0.6 million for the years ended December 31, 2013, 2012, and 2011, respectively.
As of December 31, 2013, the Company has an outstanding letter of credit in the amount of $0.3 million that serves as security with the landlord of its Memphis, Tennessee location and expires on December 31, 2015. This letter of credit is securitized by restricted cash. In addition, the Company has an outstanding letter of credit in the amount of $0.1 million that serves as security with the landlord of its Marlborough, Massachusetts location and expires on December 31, 2016. This letter of credit is securitized by restricted cash.
Purchase commitments
The Company has license agreements with third parties that provide for minimum royalty, license, and exclusivity payments to be paid by the Company for access to certain technologies. In addition, the Company pays royalties as a percent of revenue as described in Note 15, “Intellectual property—License agreements” to these consolidated financial statements.
Future minimum payments required under the license agreements in effect as of December 31, 2013 are as follows:
|
(in thousands) |
December 31, |
|||
|
Year 1 |
$ | 1,937 | ||
|
Year 2 |
1,904 | |||
|
Year 3 |
1,904 | |||
|
Year 4 |
1,904 | |||
|
Year 5 |
1,904 | |||
|
Thereafter |
1,917 | |||
|
Total minimum license payments |
$ | 11,470 | ||
The Company has outstanding purchase obligations to its suppliers in the amount of $3.3 million as of December 31, 2013.
Legal contingencies
The Company is subject to claims and assessments from time to time in the ordinary course of business. The Company does not believe that any such matters, individually or in the aggregate, will have a material adverse effect on the Company’s business, financial condition, results of operations or cash flows.
Indemnification
In the normal course of business, the Company enters into contracts and agreements that contain a variety of representations and warranties and provide for general indemnification. The Company’s exposure under these agreements is unknown because it involves claims that may be made against the Company in the future, but that have not yet been made. To date, the Company has not paid any claims or been required to defend any action related to its indemnification obligations. However, the Company may record charges in the future as a result of these indemnification obligations.
In accordance with its articles of association, the Company has indemnification obligations to its officers and directors for certain events or occurrences, subject to certain limits, while they are serving at the Company’s request in such capacity. There have been no claims to date, and the Company has director and officer insurance that may enable it to recover a portion of any amounts paid for future potential claims.
18. Geographic revenue and long-lived assets distribution
The Company was domiciled in the United Kingdom and operated in three geographies: the United States, Europe and the Rest of the World (ROW), and Asia. Revenue and long-lived assets for the years ended December 31, 2013, 2012, and 2011 are shown in the following table:
|
Revenue |
Long-lived assets |
|||||||||||||||||||
|
Year ended December 31, |
Year ended December 31, |
|||||||||||||||||||
|
(in thousands) |
2013 |
2012 |
2011 |
2013 |
2012 |
|||||||||||||||
|
United States |
$ | 17,345 | $ | 10,366 | $ | 5,604 | $ | 2,496 | $ | 1,742 | ||||||||||
|
United Kingdom |
2,795 | 2,466 | 1,800 | 360 | 314 | |||||||||||||||
|
Europe & ROW (excluding United Kingdom) |
4,362 | 4,064 | 3,787 | — | — | |||||||||||||||
|
Europe & ROW |
7,157 | 6,530 | 5,587 | 360 | 314 | |||||||||||||||
|
Asia |
14,282 | 3,789 | 1,450 | 108 | 193 | |||||||||||||||
|
Total |
$ | 38,784 | $ | 20,685 | $ | 12,641 | $ | 2,964 | $ | 2,249 | ||||||||||
19. 2012 and 2013 acquisition activity
During November 2012 the Company entered into an agreement to acquire the assets of another corporation. As part of the process, in December 2012 the Company deposited $0.3 million in an escrow account with an escrow agent that was recorded as restricted cash on the balance sheet as of December 31, 2012.
In January 2013 the Company’s agreement to purchase the assets was terminated and, in connection therewith the Company received the $0.3 million cash held in escrow. In February 2013 the Company received a breakup fee in the amount of $0.2 million, which was recorded in other income, and authorized expense reimbursements of $0.3 million, recorded as an offset to the related general and administrative expenses.
20. Memphis, Tennessee grant
During November 2013, the State of Tennessee paid $86,000 to the Company for a FastTrack Job Training Assistance program grant, related to the hiring of employees at the Company’s laboratory facility in Memphis, Tennessee. The proceeds from the grant were recorded as other income.
During May 2013, the Economic Development Growth Engine (EDGE) Industrial Development Board of the city of Memphis and county of Shelby, Tennessee paid $100,000 to the Company for the reimbursement of business and project expenses related to the establishment of its laboratory facility in Memphis, Tennessee. The proceeds from the grant were recorded as deferred income and are being recognized as a component of other income on a straight-line basis over the estimated useful life of the underlying assets.
21. Subsequent event
Effective March 3, 2014, the Remuneration Committee of the Board of Directors approved grants to employees for 360,901 share options and 254,700 restricted shares from the Oxford Immunotec Global PLC 2013 Share Incentive Plan. These grants were issued to employees in the first quarter of 2014.
F-30