Attached files
| file | filename |
|---|---|
| 8-K - 8-K - TOYS R US INC | d700659d8k.htm |
 March 26,
2014 Exhibit 99.1 |
| Forward-Looking Statements
2
This presentation and the documents incorporated by reference contain
“forward-looking” statements within the meaning of the federal securities
laws, and such statements are intended to be covered by the safe harbors created thereby. These
forward-looking statements reflect our current views with respect to, among other
things, our operations and financial performance. All statements herein or therein that are not historical facts,
including statements about our beliefs or expectations, are forward-looking statements. We
generally identify these statements by words or phrases, such as
“anticipate,” “estimate,” “plan,” “project,” “expect,” “believe,” “intend,” “foresee,” “forecast,” “will,” “may,” “outlook” or
the negative version of these words or other similar words or phrases. These statements
discuss, among other things, our strategy, store openings, integration and remodeling,
the development, implementation and integration of our Internet business, conversion rate improvements, future financial or
operational performance, including future revenue and profits, projected sales or earnings per
share for certain periods, comparable store net sales from one period to another, cost
savings, results of store closings and restructurings, outcome or impact of pending or threatened litigation, domestic
or international developments, amount and allocation of future capital expenditures, growth
initiatives, inventory levels, cost of goods, selection and type of merchandise,
marketing positions, implementation of safety standards, future financings, estimates regarding future effective tax rates, and
other goals and targets and statements of the assumptions underlying or relating to any such
statements. These statements are subject to risks, uncertainties and other factors, including, among
others, the seasonality of our business, competition in the retail industry, changes in
our product distribution mix and distribution channels, general economic factors in the United States and other countries in
which we conduct our business, consumer spending patterns, live birth trends, our ability to
implement our strategy, marketing strategies, the availability of adequate financing,
access to trade credit, changes in consumer preferences, our dependence on key vendors for our merchandise,
political and other developments associated with our international operations, costs of goods
that we sell, labor costs, transportation costs, domestic and international events
affecting the delivery of toys and other products to our stores, product safety issues including product recalls, the existence
of adverse litigation, changes in laws that impact our business, our substantial level of
indebtedness and related debt-service obligations, restrictions imposed by
covenants in our debt agreements and other risks, uncertainties and factors set forth under Item 1A entitled “RISK FACTORS” of
Toys“R”Us, Inc.’s Annual Report on Form 10-K for the fiscal year ended
February 2, 2013 and its other reports and documents filed with the Securities and
Exchange Commission. In addition, we typically earn a disproportionate part of our annual operating earnings in the fourth quarter as a result of
seasonal buying patterns and these buying patterns are difficult to forecast with certainty.
These factors should not be construed as exhaustive and should be read in conjunction
with the other cautionary statements that are included in those reports and documents. We believe that all forward-
looking statements are based on reasonable assumptions when made; however, we caution that it
is impossible to predict actual results or outcomes or the effects of risks,
uncertainties or other factors on anticipated results or outcomes and that, accordingly, one should not place undue reliance on
these statements. Forward-looking statements speak only as of the date they were made, and
we undertake no obligation to update these statements in light of subsequent events or
developments unless required by the Securities and Exchange Commission’s rules and regulations. Actual
results may differ materially from anticipated results or outcomes discussed in any
forward-looking statement. |
 1.
Introduction
2.
Diagnosis
3.
TRU Transformation
3 |
 Fully
transform the CUSTOMER EXPERIENCE Develop
high
performing
and
highly
focused
TEAMS
Collaborate with BUSINESS PARTNERS to drive
differentiation, innovation and value
Continue to keep kids safe and help them in times of
need in
OUR COMMUNITIES
Position the business for growth and return for
INVESTORS
4
THE TOY AND JUVENILE PRODUCTS AUTHORITY AND
DEFINITIVE DESTINATION FOR KID FUN,
GIFT-GIVING SOLUTIONS AND PARENTING SERVICES |
 1.
Introduction
2.
Diagnosis
3.
TRU Transformation
5 |
 TOYS“R”US HAS UNIQUE
BRAND STRENGTHS
6 |
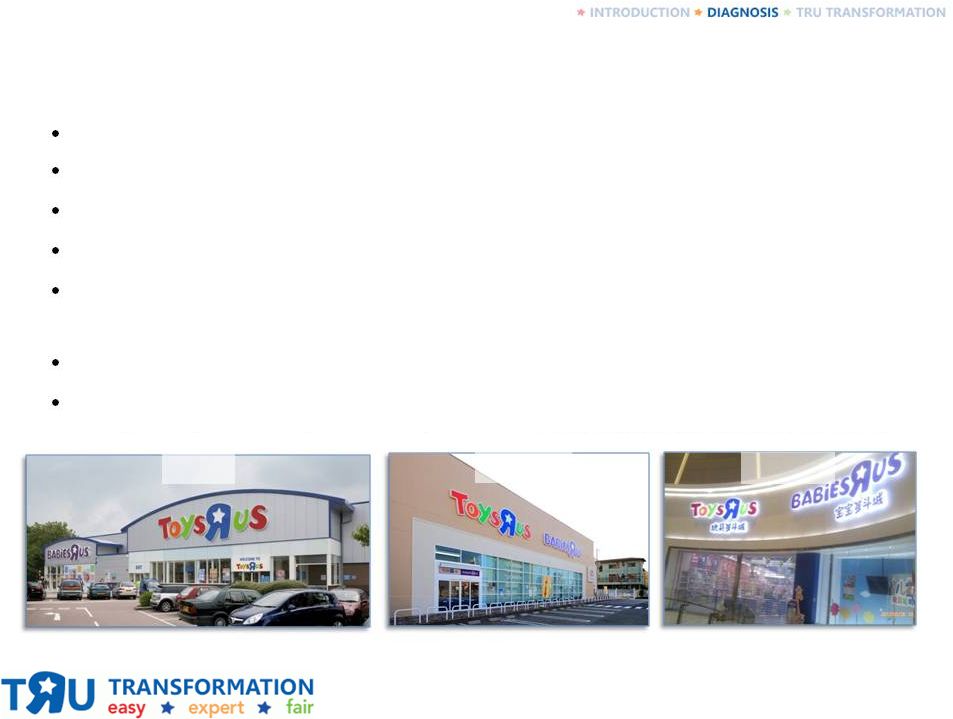 TOYS“R”US IS ONE OF THE MOST RECOGNIZED
RETAIL BRANDS IN THE WORLD
Recognized as one of the most valuable global brands¹
Net sales of $12.5 billion (FY ‘13)
Balanced global presence; over 1,700 stores in 36 countries
Broad year-round selection of toy and juvenile items
3,900 active vendor relationships with a growing assortment of exclusive
brands
Leading omnichannel capabilities
Long 65+ year history of serving families = STRONG BRAND
RECOGNITION Japan
1
The Brand Finance Global 500 (2013)
7
China
U.K. |
 8
Owned international business accounts for 39%
of total annual sales
STRONG INTERNATIONAL PRESENCE DRIVEN BY
GROWTH IN CHINA
*License
**Joint Venture in which we hold approx. 70% ownership
As of March 5, 2014
TRU Asia JV:
150 Stores |
 TOYS“R”US HAS STRONG STORE PROFITABILITY
9
98%
of
862
1
stores
were 4-wall EBITDA
positive during FY2013
•
58% owned or ground leased
94% of 635
1,2
stores
were 4-wall EBITDA
positive during FY2013
•
17% owned or ground leased
International
U.S.
1
Includes Long Term Express and Outlets, excludes stores that were not open during the full
12-month time frame 2
Does not include Licensed Stores |
 TOYS“R”US HAS A STRONG AND LOYAL
CUSTOMER BASE
18M
active members and
growing
70%
of sales are done with
these customers
18M
registrants to-date
73%
of all moms surveyed by
TheBump.com register at
Babies“R”Us
Internal Sources
U.S. Programs
Nearly 11 Million Active Members in Similar Loyalty Programs in
Countries Around the World
10 |
 TOYS“R”US HAS A BASE OF $1.2 BILLION IN
GLOBAL
INTERNET
SALES
FROM
WHICH
TO
GROW
•
Launched mobile-optimized
websites and dedicated apps for iOS
and Android:
o
Canada
o
China
o
France
o
Germany
o
Spain
o
Japan
o
Australia
o
Portugal
o
Austria
o
Switzerland
o
Netherlands
o
U.K.
o
Poland (2014)
•
Site enhancements made in U.S. in
2013 already benefitting
international markets
Now in 13 Countries
and 8 Languages
$1.2
BILLION
11
5 Year CAGR of 15%
498
578
602
782
1,005
1,129
1,157
2007
2008
2009
2010
2011
2012
2013 |
 GLOBAL
e-COMMERCE SALES Leveraging Omnichannel Initiatives Provides Growth
Opportunities and Efficiencies in Cost and Inventory
Omnichannel includes: In-Store Pick Up, Ship to Store, Ship from Store, U.K. Click and
Collect 12
Traditional DC Fulfillment
Omnichannel
Traditional
DC
Fulfillment
Omnichannel
$498
$578
$602
$782
$1,005
$1,129
$1,157
1%
2007
2008
2009
2010
2011
2012
2013
31%
22%
15% |
 TOYS“R”US HAS
WELL-ESTABLISHED VENDOR
RELATIONSHIPS
•
Able to provide vendors with a year-round distribution outlet for the
broadest assortment of their products in the U.S. and abroad
13 |
 TOYS“R”US BUSINESS
PERFORMANCE IN 2013
WAS DISAPPOINTING
14 |
 DIAGNOSIS: MACRO 15 |
 RECENT BIRTH RATE DECLINES HAVE IMPACTED BOTH THE TOY AND JUVENILE
BUSINESSES U.S. birth rate has declined significantly since 2007
Source for actuals: CDC/NCHS, National Vital Statistics System
3.1%
1.2%
(1.6%)
(2.8%)
(3.2%)
(1.1%)
(0.0%)
(0.9%)
(4.0%)
(3.0%)
(2.0%)
(1.0%)
0.0%
1.0%
2.0%
3.0%
4.0%
2006
2007
2008
2009
2010
2011
2012
6 Months
June 2013
16 |
 U.S. TOY
INDUSTRY SALES HAVE BEEN RELATIVELY FLAT
Source: The NPD Group/ U.S. Toy Consumer Tracking Service as published by the Toy Industry
Association, Inc. Note: Includes Action Figures/Accessories/Role Play, Arts &
Crafts, Building Sets, Dolls, Games/Puzzles, Infant/Preschool, Youth Electronics,
Outdoor & Sports Toys, Plush, Vehicles, All Other Toys 17
$21.6
$22.0
$22.1
$16.0
$17.0
$18.0
$19.0
$20.0
$21.0
$22.0
$23.0
$24.0
2011
2012
2013
+0.3% |
 THE RAPID GROWTH OF ONLINE SHOPPING CONTINUES…
Estimated annual U.S. e-commerce retail sales
increased 17% in 2013 vs. 2012
Source: Retail Indicators Branch, U.S. Census Bureau; last revised February 18, 2014.
3Q 2013 is a revised estimate;4Q 2013 is a preliminary estimate.
18
$112
+23.6%
$135
+20.2%
$140
+4.2%
$143
+1.7%
$166
+16.2%
$193
+16.4%
$224
+16.3%
$263
+17.0%
$0
$50
$100
$150
$200
$250
$300
2006
2007
2008
2009
2010
2011
2012
2013E |
 DIAGNOSIS: INTERNAL EXECUTION
ISSUES
19 |
 Company does
lead competitors on some metrics… 20
Strong
Weak
NEWEST ITEMS
Strong
Weak
“HOT”
TOYS
LEADER
Competitor #3
Competitor #2
Competitor #3
Competitor #1
Strong
Weak
FRIENDLY* EMPLOYEES
LEADER
Competitor #2
*Competitor #3: N/A
LEADER
Competitor #1
Measured U.S. customer perception / Source: Cambridge Group
Competitor #1
and #2
TOYS“R”US HAS BIG OPPORTUNITIES TO IMPROVE CUSTOMER
RELATIONSHIPS
AND
BECOME
A
MORE
CUSTOMER-CENTRIC
BUSINESS |
 …but has
much room to improve TOYS“R”US HAS BIG OPPORTUNITIES
TO IMPROVE CUSTOMER RELATIONSHIPS
AND
BECOME
A
MORE
CUSTOMER-CENTRIC
BUSINESS
21
Strong
Weak
FAST CHECKOUT
LEADER
Competitor #1
Competitor #3
Competitor #2
Strong
Weak
ORGANIZED SHELVES*
Strong
Weak
EASY RETURNS
LEADER
LEADER
Competitor #1
Competitor #2
Competitor #3
Competitor #2
Competitor #1
Measured U.S. customer perception / Source: Cambridge Group
*Competitor #3: N/A |
 TOYS“R”US HAS NOT MOVED FAST ENOUGH TO MAKE IMPORTANT
INVESTMENTS TO IMPROVE ONLINE SHOPPING OPERATIONS
Measured U.S. customer perception / Source: Cambridge Group
Strong
Weak
LEADER
ASSORTMENT
Strong
Weak
SITE DESIGN / NAVIGATION /
MOBILE APP PERFORMANCE
Strong
Weak
SHIPPING
LEADER
LEADER
Competitor #3
Competitor #2
Competitor #1
Competitor #3
Competitor #2
Competitor #1
Competitor #3
Competitor #2
Competitor #1
22 |
 TOYS“R”US HAS A PRICE PERCEPTION CHALLENGE
Measured customer perception of:
Source: Cambridge Group
23
Coupons
Frequent promotions
Sales/discounts
Price Match Guarantee
Fair prices |
 TOYS“R”US HAS A BIG OPPORTUNITY TO DELIVER A
BETTER IN-STOCK EXPERIENCE
Strong
Weak
LEADER
ALWAYS IN STOCK
24
Source: Cambridge Group |
 U.S. MARGINS
HAVE BEEN PRESSURED DUE TO EXCESSIVE
PROMOTIONAL ACTIVITY AND POOR INVENTORY MANAGEMENT
Note: 2013 excludes the impact of the $51 million domestic reserve
25
34.8%
34.8%
34.3%
35.4%
33.3%
35.9%
36.6%
38.0%
38.3%
38.7%
30.0%
32.0%
34.0%
36.0%
38.0%
40.0%
42.0%
FY2009
FY2010
FY2011
FY2012
FY2013
Domestic
International |
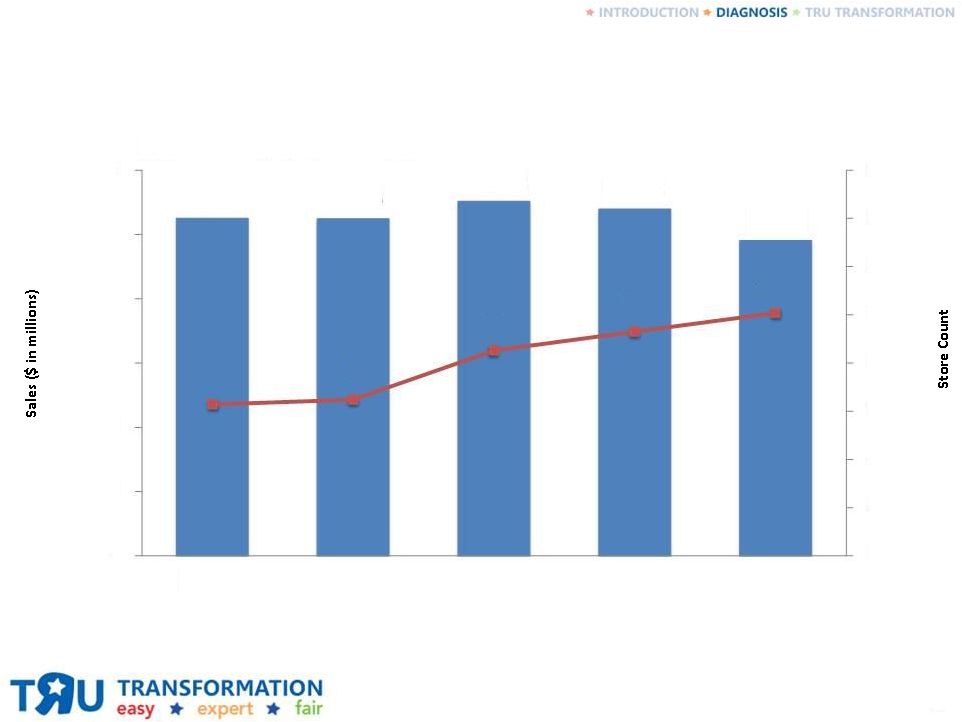 INTERNATIONAL
BUSINESS HAS BEEN SOFT, OFFSET BY STRONG GROWTH IN CHINA
In FY2013, we opened 24 new stores in China, bringing our total store count
to 53. Note: Express stores with a cumulative lease term of at least two years are
included in our overall store count 26
$5,251
$5,243
$5,516
$5,394
$4,905
514
524
626
665
704
200
300
400
500
600
700
800
900
1,000
$-
$1,000
$2,000
$3,000
$4,000
$5,000
$6,000
FY2009
FY2010
FY2011
FY2012
FY2013
In USD$
at each year's actual fx |
 GLOBAL SG&A
COST STRUCTURE HAS NOT FLEXED DOWN CONSIDERING DECLINING SALES GROWTH AND COMP
PERFORMANCE Note: SG&A excludes one-time items. See the Appendix for a summary
of the adjustments. 27
$3,699
$3,865
$3,975
$4,003
$3,925
27.3%
27.9%
28.6%
29.6%
31.3%
20.0%
22.0%
24.0%
26.0%
28.0%
30.0%
32.0%
34.0%
36.0%
38.0%
40.0%
FY2009
FY2010
FY2011
FY2012
FY2013
$1,000
$1,500
$2,000
$2,500
$3,000
$3,500
$4,000
$4,500 |
 AFTER RECORD
HIGHS, EBITDA HAS DECLINED FOUR YEARS IN A ROW
28
Note: 2005-2013 represents Adjusted EBITDA (Refer to prior SEC filings for the
reconciliation of adjustments); Toys Japan not consolidated prior to 2006, Japan 2005
EBITDA of $35M net of royalties $0
$200
$400
$600
$800
$1,000
$1,200
79
81
83
85
87
89
91
93
95
97
99
01
03
05
07
09
11
13 |
 THE COMPANY
HAS NO SIGNIFICANT NEAR-TERM
DEBT
MATURITIES
Other
Excludes North American ABL, European and Australian ABL, Japan Committed Credit Lines, and
Uncommitted Credit Lines related to the Asia JV Other
As of February 1, 2014
Delaware
Term Loan
(B1)
Delaware
HY Notes
Toys“R”
Us, Inc.
Notes
Delaware
Term Loan
(B2 & B3)
Toys“R”
Us, Inc.
Notes
Propco I
Term
Loan
Propco II
Notes
UK Real
Estate
Loans
29
Recently completed the successful refinancing of our $1.85 billion senior secured revolving
credit facility
-
500
1,000
1,500
2014
2015
2016
2017
2018
2019
2020+ |
 TO SUM IT UP,
WE HAVE FOUR BIG ISSUES TO
FIX…
•
Customer Experience
•
Price Perception
•
Inventory Management
Disciplines
•
Right-Sized Cost Base
30
…AND THEY ARE IN OUR CONTROL TO FIX
|
 1.
Introduction
2.
Diagnosis
3.
TRU Transformation
31 |
 MISSION
WE BRING JOY
INTO THE
LIVES OF OUR CUSTOMERS
THE TOY AND JUVENILE PRODUCTS AUTHORITY AND
DEFINITIVE DESTINATION FOR KID FUN, GIFT-GIVING
SOLUTIONS AND PARENTING SERVICES
32 |
 GUIDING
PRINCIPLES EASY
EXPERT
FAIR
TO SHOP
IN THE TOY AND
BABY CATEGORIES
PRICES
33 |
 The BROADEST SELECTION OF PRODUCTS to help kids and
babies develop, learn, have fun and be safe
The EASIEST PLACE TO RESEARCH AND FIND SOLUTIONS
throughout the journey of parenthood
The BEST RESOURCE FOR
CHILDREN’S GIFT-GIVING
OCCASIONS
FAIR PRICES
EXPERT SERVICE AND UNIQUE SERVICES
The ability to shop WHENEVER, WHEREVER AND HOWEVER
YOU WANT
CUSTOMER PROMISE
34 |
 THE 3 PILLARS OF OUR 2014 STRATEGY
35
TRANSFORM THE
CUSTOMER EXPERIENCE
DEVELOP HIGH-PERFORMING,
HIGHLY ENGAGED, DIVERSE TALENT
BECOME FIT FOR GROWTH
2
1
3 |
 TRANSFORM THE
IN-STORE SHOPPING EXPERIENCE Put the customer at the
center of decisions; solve
any problems with
immediacy; leverage
consumer insights
Be the true specialist –
add store labor in key
areas to drive sales
and improve service
Improve in-stocks and
speed of checkout
Improve execution
of in-store
initiatives
Better tailor
messaging to
customers to
ensure relevancy
1
2
3
4
5
Reduce clutter and
introduce better
store signage
6
36
Clean up existing stores to
be fit for growth; improve
navigation
7 |
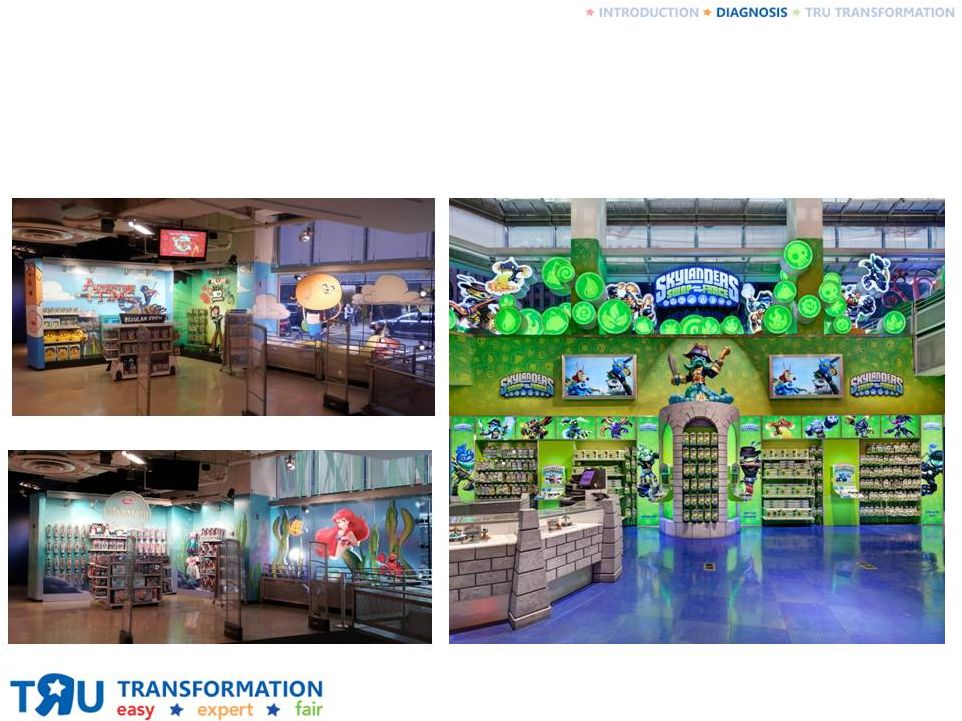
 DEVELOP STORE OF
THE FUTURE Slow store growth in the U.S. as work is done to fix current store base
Identify and test
future store
concepts
Deliver fun and
exciting experiences
in stores across the
company
Leverage
Side-by-Side
learnings
1
2
3
37
Reimagine
opportunities for
merchandising,
adjacencies
and space
4 |
 OPTIMIZE
e-COMMERCE EXPERIENCE Continue to
improve in-store
pick up
integration
Improve inventory
accuracy and
order status
communication
Reduce load times
online and on
mobile app
Improve
Ship from Store
execution
1
2
3
4
38 |
 CREATE
MEANINGFUL CUSTOMER RELATIONSHIPS THROUGH
LOYALTY AND TARGETED MARKETING PROGRAMS
•
Strengthen Rewards“R”Us to build stronger relationships with
loyal customer base and create a more compelling offering
•
Translate program into a true competitive advantage
•
Improve content relevancy to provide targeted messaging based
on purchase history
•
Transition portion of marketing spend to emerging media channels
•
Maintain and accelerate Registry by:
–
Strengthening Registry incentive offering
–
Enhancing digital and omnichannel offerings as they relate to Registry
–
Introducing new services to guide the Registry creation and
maintenance process
39 |
 IMPROVE
PRICE PERCEPTION
Source: Cambridge Group
•
SIMPLIFY AND OPTIMIZE PROMOTIONAL ACTIVITY
•
BETTER COMMUNICATE PRICE MATCH GUARANTEE
40
Strong
Weak
LEADER
FAIR PRICES I CAN TRUST
Competitor #2
Competitor #3
Competitor #1
Strong
Weak
LEADER
PRICE MATCHING
Competitor #2
Competitor #3
Competitor #1 |
 DEVELOP CLEAR
PRICING STRATEGY AND SIMPLIFY
PROMOTIONAL OFFERS
41
Printed Ad
In-Store |
 PUT DISCIPLINES
BACK INTO INVENTORY MANAGEMENT AND INTO GROWING OPERATING MARGINS
42
FY-2006
FY-2007
FY-2008
FY-2009
FY-2010
FY-2011
FY-2012
FY-2013
U.S. Inventory Turnover |
 LEVERAGE
BUSINESS PARTNER RELATIONSHIPS TO DRIVE CATEGORY LEADERSHIP
AND TRUE DIFFERENTIATION IN PRODUCTS AND SERVICES
In-Store Events
43
Exclusive Products
Store Services |
 DEPLOY CAPITAL
TO DRIVE KEY INITIATIVES U.S. Real Estate Maintenance
International Growth
Global e-Commerce
Supply Chain
44
Global Information Technology |
 45
•
Identify substantial cost and working capital savings opportunities through
process and operating model improvements
•
Focus areas include:
•
Supply Chain
•
Marketing
•
Merchandising
•
Store Operations
•
e-Commerce
•
Maintenance
•
Logistics
•
Procurement
•
IT
•
Finance
APPROPRIATELY SCALE COST STRUCTURE AND SG&A THROUGH
EXPENSE CONTROL AND PROCESS IMPROVEMENT |
 DEVELOP HIGH-PERFORMING AND HIGHLY
FOCUSED TEAMS
4
5
Culture & Engagement
Create and sustain a culture of high
engagement so we can attract and retain
top talent
1
Organizational Structure
Review organizational structure and roles
and responsibilities within key functions
2
Strengthen Talent
Create infrastructure that will ensure we
consistently assess and develop talent
3
Productivity Tracking
Create and sustain culture of accountability
by establishing a more robust goal-setting
process
46
Training
Drive sales and service training and develop
proper organizational structure to improve
performance and profitability in stores
6
Rewards & Recognition
Enhance our ability to hire and retain great talent
by rewarding those behaviors and results that
truly impact the performance of the business |
 Focus for
2014 will be to make changes and strengthen the THIS
WILL TAKE TIME – PROGRESS WILL BE STEADY
47
Execute Flawlessly
Streamline
the
Organization
With
Recalibrated
Performance
Expectations
Right
Size
the
Cost
Structure
Control
Expenses
and
Improve
Processes
Become Easier to Do Business With
Make Progress on FAIR Prices
Improve Store Conditions
Provide a Better Customer Experience
in-store and online and become a
customer-centric company
Focused metrics: Slow Sales Decline; Stabilize Cash Flow; Improve EBITDA
foundation
of
the
company
so
revenue
and
profits
can
grow
in
2015 and beyond
,
, |
 48
|
 CUSTOMER
PROMISE 49
The BROADEST SELECTION OF PRODUCTS
to help kids and
babies develop, learn, have fun and be safe
The EASIEST PLACE TO RESEARCH AND FIND SOLUTIONS
throughout the journey of parenthood
The BEST RESOURCE FOR
CHILDREN’S GIFT-GIVING
OCCASIONS
FAIR PRICES
EXPERT SERVICE AND UNIQUE SERVICES
The ability to shop WHENEVER, WHEREVER AND HOWEVER
YOU WANT |
 APPENDIX
|
 RECONCILIATION
FROM REPORTED SG&A TO SG&A EXCLUDING ONE-TIME ITEMS
$ in millions
FY2009
FY2010
FY2011
FY2012
FY2013
Reported SG&A
3,730
$
3,942
$
4,029
$
4,041
$
4,010
$
Litigation expense
-
23
8
1
23
Sponsors’ management and advisory fees
15
20
20
21
22
Prior period adjustments
-
16
-
-
17
Compensation expense
-
6
1
2
7
Restructuring
5
3
3
2
-
Certain legal and accounting transaction costs
-
-
6
6
1
Acquisition costs
-
-
4
-
-
Severance
5
4
7
-
13
Store closure costs
6
5
5
6
2
SG&A excluding one-time items
3,699
$
3,865
$
3,975
$
4,003
$
3,925
$ |
 March 26,
2014 |