Attached files
| file | filename |
|---|---|
| 8-K - 8-K - ENDEAVOUR INTERNATIONAL CORP | d699961d8k.htm |
 Howard Weil
Energy Conference
March 27, 2014
Exhibit 99.1 |
 2
This is an oral presentation which is accompanied by slides. Investors are urged
to review our SEC filings. This presentation contains certain
forward-looking statements regarding various oil and gas
discoveries,
oil
and
gas
exploration,
development
and
production
activities,
anticipated
and
potential
production and flow rates; anticipated revenues; the economic potential of
properties and estimated exploration costs. Accuracy of the projections
depends on assumptions about events that change over time and is thus
susceptible to periodic change based on actual experience and new developments.
Endeavour cautions readers that it assumes no obligation to update or publicly
release any revisions to the projections in this presentation and, except
to the extent required by applicable law, does not intend to update or
otherwise revise the projections. Important factors that might cause future results to differ from
these projections include: variations in the market prices of oil and natural gas;
drilling results; access to equipment and oilfield services; unanticipated
fluctuations in flow rates of producing wells related to mechanical,
reservoir
or
facilities
performance;
oil
and
natural
gas
reserves
expectations;
the
ability
to
satisfy future cash obligations and environmental costs; and general exploration
and development risks and hazards.
The Securities and Exchange Commission permits oil and gas companies in their
filings with the SEC to disclose
only
proved
reserves
that
a
company
has
demonstrated
by
actual
production
or
conclusive
formation tests to be economically and legally producible under existing economic
and operating conditions.
SEC
guidelines
prohibit
the
use
in
filings
of
terms
such
as
“probable,”
“possible,”
P2
or
P3
and
“non-proved”
reserves, reserves “potential”
or “upside”
or other descriptions of volumes of reserves
potentially recoverable through additional drilling or recovery techniques.
These estimates are by their nature more speculative than estimates of
proved reserves and accordingly are subject to greater risk of being
actually realized by the company. Certain statements should be regarded as “forward-looking”
statements within the meaning of the securities laws. These statements speak only
as of the date made. Such statements are subject to assumptions, risk and
uncertainty. Actual results or events may vary materially.
The
estimates
of
recoverable
resources
per
well
and
completed
well
costs
included
herein
are
based upon other typical results in these shale plays and may not be indicative of
actual results. |
 3
Endeavour at a Glance
Distinctive Portfolio
•
Exceptional operating margins from three core assets
•
Brent crude oil and European natural gas exposure
•
Developing U.S. resource plays at very low cost
Strong Production Growth
•
All three U.K. developments on-line
•
Rochelle
–
Gas
with
associated
condensate
•
Alba
–
Brent
priced
oil
•
Bacchus
–
Brent
priced
oil
•
2013
physical
production
volumes
increased
to
9,922
boepd
–
a
126%
increase
year-over-year
•
2013
Adjusted
EBITDA
increased
to
$203.3
million
–
a
157%
increase
year-over-year
•
4
th
quarter average daily production of 12,422 boepd
2014 Focus
•
Growth in production
•
Maintaining operational margins in existing asset base
•
Reduce G&A
•
Repay debt and reduce cost of capital
•
Accelerate
value
capture
from
existing
portfolio
–
Rossini
in
the
U.K.,
the
Piceance
Basin
and
Pennsylvania Marcellus in the U.S.
Stock Symbol
New York Stock Exchange
END
London Stock Exchange
ENDV
Market Capitalization
$158.3 million
Common Shares Outstanding
50.5 million
Proved & Probable Reserves
40.1 MMBOE
Key Figures |
 Endeavour’s Growing Resource Base
Asset base has become
increasingly more oil levered
87% of proved and probable
(2P) gas reserves are in the U.K.
Reserve growth
Production growth
Production has grown over time
with significant contribution
increases from the North Sea
(Mboe/d)
4
(MMboe/d)
2.9
1.1
5.5
8.6
1.2
2.3
2.4
1.3
4.1
3.4
7.9
9.9
2010
2011
2012
2013
6.8
18.2
18.7
22.7
25.7
23.5
61%
Oil
19.3
20.7
25.0
22.3
21.5
16.6
39%
Gas
26.1
38.9
43.7
45.0
47.2
40.1
100%
2008
2009
2010
2011
2012
83% U.K. gas
2013 |
 Production Sold Into Higher-Valued European Markets
Crude oil
Natural gas
Average spread over the period: $6.21
5
Average spread over the period: $14.34
$2
$4
$6
$8
$10
$12
$14
$16
Henry Hub
UK NBP
$75
$85
$95
$105
$115
$125
WTI
Brent |
 Reserve Valuation
Pro forma net asset valuation
(1)
Excluding monetary production payment of $162 million.
($ in millions)
6
$1,531
$773
$883
(1)
$848
(1)
2P and 3P PV-10
1P PV-10
Total debt
Net debt
$2,309
(as of 12/31/13) |
 Production volume up 27% year-over-year
Increasing production in higher valued commodity markets
Brent and U.K. NBP prices have averaged ~$108.46 and ~$10.63, respectively for 2013$$$$ Significant Proved Reserves and Production
2012
Production
Volumes
2013
Production
Volumes
7
Full Year = 7,868
Full Year = 10,017
78%
5%
12%
78%
2%
30%
US Gas
US Oil
UK Gas
UK Oil |
 Historical Financials Summary
($ in millions)
($ in millions)
($ in millions)
Average
Daily
Production
(boepd)
Revenue
Adjusted
EBITDAX
Capital
Expenditures
8
$37.6
$25.1
$129.9
$203.3
2010
2011
2012
2013
4,115
3,382
7,868
10,017
2010
2011
2012
2013
$71.7
$60.1
$219.1
$337.7
2010
2011
2012
2013
$92.0
$165.1
$246.9
$223.7
2010
2011
2012
2013 |
 Attractive Margins and Expense Structure
9
$106.00
Cash Operating Expense
Operating Cash Flow
$9.00
$97.00
NBP Spot
Cash Operating Expense
Operating Cash Flow
$106.00
Cash Operating Expense
Operating Cash Flow
$20.00
$86.00
Note:
Cash operating expense is midpoint of management estimates.
Brent Spot
Brent Spot
$1.50
$11.00
Alba
Bacchus
Rochelle
$9.50
9
$/boe
$/boe
$/mcfe |
 2013
Accomplishments Sale of 50% of upstream and midstream
assets in the Pennsylvania Marcellus and
formed a joint venture with Samson
Exploration, LLC.
•
Partnership plans to complete the three
previously drilled and cased horizontal
Marcellus wells
•
Tied into third-party pipeline that allows
firm capacity of up to 10 Mmcf/d, with
potential for future expansion
JV delivers the capital necessary for the
next phase of development in the core
Daniel Field area in Cameron County
Rochelle field on production
Third Bacchus production well
completed in July
Entered into a monetary production
payment for $125 million in Q1 2013 for a
portion of production from Alba field,
increasing liquidity to fund the
development program
•
Expanded the agreement in August and
December to $175 million
Entered into a forward sale agreement in
February 2013 for $22.5 million fully
delivered in July 2013
•
Entered into a subsequent forward sale
agreement in September 2013 for $22.5
million, which is expected to be fully
delivered in March 2014
Closed the London office and
consolidated technical teams in
Aberdeen, Scotland
•
$15 million to $20 million of annual cash
savings expected
Discovered by Endeavour in 2012
Significant upside and prospectivity in
adjacent Endeavour operated acreage
10
Operations
Samson Joint Venture
Rossini |
 Current Assets |
 Overview of Endeavour’s U.K. Assets
12
Bacchus
Enoch
Columbus
Bittern
Alba
Rochelle
Current Production
Development Projects |
 The
field is a Lower Cretaceous reservoir at 9,900 ft
•
Good quality Britannia Kopervik turbidite sands
•
3-way stratigraphic trap
Flowing gas with associated condensate
•
Both wells have produced at rates of over 70 million
cubic feet of gas per day, with an additional ~ 3,000
boepd of liquids
Production from the wells will exceed the
allocated capacity at the Scott Platform
Rochelle
Jurassic
discovery
–
Rossini
•
P50
reserves
potential
of
35
–
80
MMBOE
Rochelle Overview -
Blocks 15/26b, 15/26c and 15/27
13
Endeavour WI:
44%
Operator:
Nexen (41% WI)
Partner:
Premier Oil (15% WI)
Online:
October 2013
Rossini
Rochelle
Ravel
Mostyn |
 Bacchus
-
Block
22/06a
Central
North
Sea
14
Reservoir is formed by shallow marine Fulmar
sandstones of Upper Jurassic age
Current
production
at
~
10,000
bopd*
gross
for
the field
Water injection introduced into the field in
second quarter of 2014
Oil exported to Forties Pipeline System
3-D seismic survey completed to pursue
expansion of the Bacchus area
Endeavour WI:
30%
Operator:
Apache (50% WI)
Partner:
First Oil (20% WI)
Bacchus
Forties
* As of date March 5, 2014 |
 Alba
Field Overview - Block 16/26a
Late
Eocene
reservoir
at
~6,200ft
depth
450ft water depth
35 Platform and subsea wells
Oil exported by tanker
Annual infield drilling campaign of
2 -
4 wells
•
First well completed in March and the
second well is expected to be on line in the
summer
15
Endeavour WI:
25.68%
Operator:
Chevron (23.37% WI)
Partners:
Statoil (17% WI)
Mitsui (13% WI)
Centrica (12.65% WI)
Enquest (8% WI)
Discovered/1
st
Production
1984/1994
Alba
Britannia |
 High
Quality Exploration in Core Central North Sea Area Net Unrisked Contingent
Prospective Resources: 376 MMboe
28 Licences (12 Endeavour operated)
Own 105 kilometers of 3D seismic in this core area
History of success bidding in the Licensing
Rounds with a focus on high quality acreage close
to infrastructure
•
28
th
Licensing Round in April 2014
Select Prospects:
Rochelle
Jurassic
-
Rossini
•
Oil prospect
Ravel & Mostyn prospects
•
Low risk R-Block area oil prospects
Buffalo prospect
•
Rochelle analogue
Mabry prospect
Exploration Portfolio in Core Central North Sea
Prospects, Discoveries and Licences
16 |
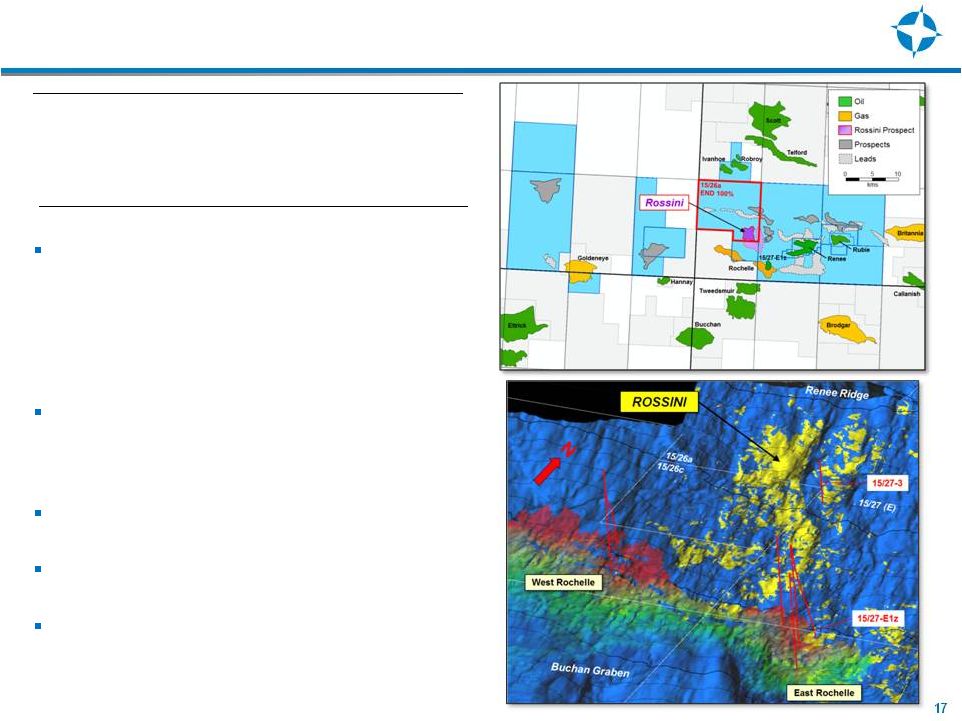 R-Block
Exploration
Opportunities
-
Rossini
Rossini was discovered by Endeavour in 2012
•
A large majority of the prospect sits in block
15/26a, where Endeavour has a 100% working
interest and is the operator
•
P50
reserves
potential
of
35
–
80
MMBOE
Field
lies
close
to
existing
infrastructure
,
but
may be large enough for stand-alone
development
Plan to drill in the first half of 2015
460ft
water
depth
and
normally
pressured
Significant upside and prospectively in
adjacent Endeavour operated acreage
Blocks:
15/26a, 15/26c, 15/27
Reservoir:
Upper Jurassic Galley Sandstone
Expected Fluid Type:
Oil Prone
Working Interest
50%-100%
17 |
 US
Onshore Assets 18
Oil
Gas
Mixed
Heath
Marcellus
Building Portfolio
Niobrara/Frontier
Haynesville
US Q4 2013 Totals
442,600 gross / 109,000 net acres
Average of 6 MMCFe/D net production |
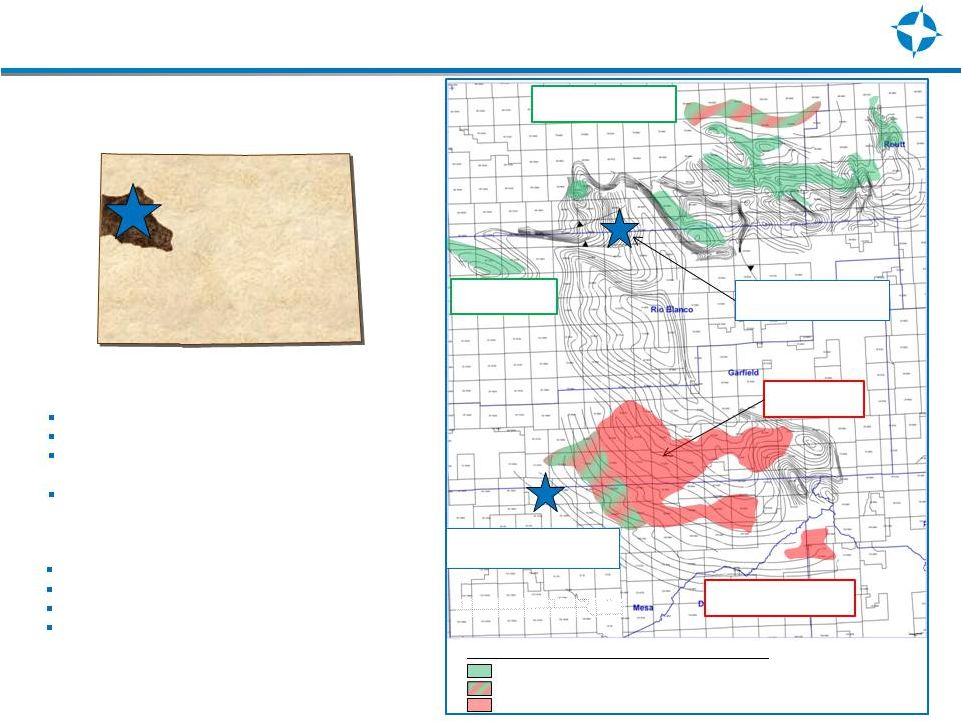 Endeavour -
NW Colorado Niobrara Opportunity
Pursuing liquids-rich, stacked Niobrara/Frontier
plays in the Piceance Basin, NW Colorado
Piceance
Basin
Colorado
Rangely Niobrara
15 mmbo
Buck Peak Niobrara trend
20-30 mmbo
Encana’s Orchard
Niobrara gas development
WPX 16mmcf/d
Niobrara well
Wiley Prospect
Pilot drilled, cored 7/13
Hunter-Garvey Prospect
Cored pilot 9/13
NBRR
Petroleum
System:
Proven
HC
productive
areas
Oil window
Wet gas window
Dry gas window
19
25,000 gross / 17,000 net ac
Gas + liquids play via multi-stage fracs
Identified key wells with volatile oil maturity in brittle,
over-pressured rock
Captured lands just downdip into wet gas window
15,000 gross / 11,000 net ac F/I
Volatile oil play
Targeted structure with open fractures
Frontier Ss ‘carrier bed’
to enhance production
Play 1:
Wiley (3-5N –
97W)
Play 2:
Hunter/Garvey (8S –
100-101W)
Structure on top Rollins Ss, c.i. 500’ |
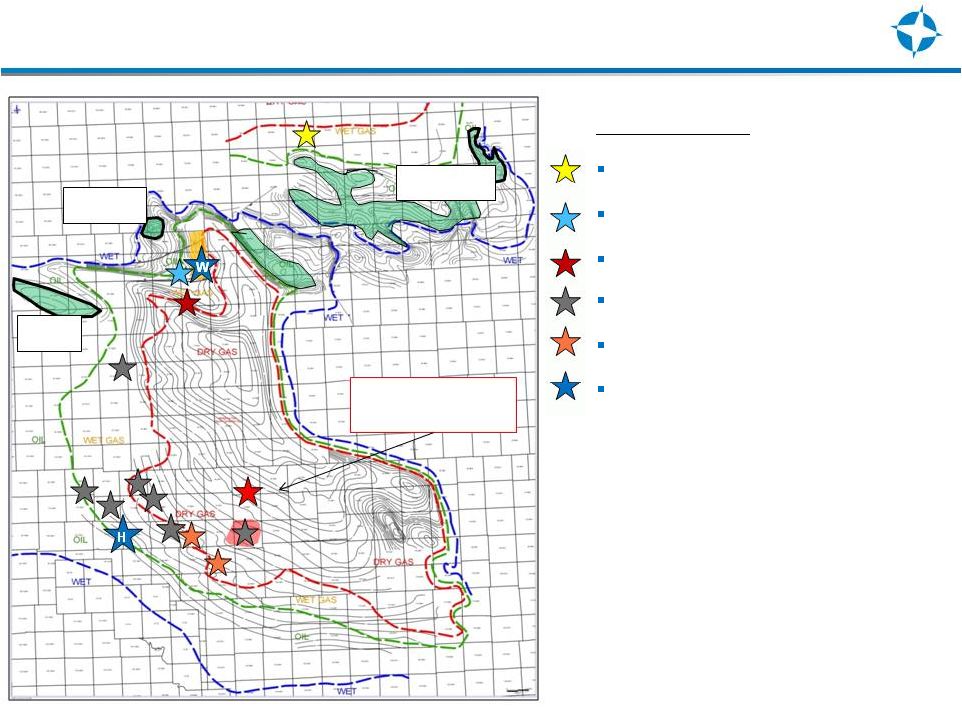 Piceance
Basin
Niobrara
-
Industry
Activity
(Structure on top Rollins Ss, c.i. 500’)
WPX 16 mmcf/d
Niobrara well
20
H
Area Participants
Axia / Oxy
Mesa/WPX
Whiting
Encana
Black Hills
Endeavour Project Areas
•
Wiley (W) and Hunter/Garvey (H)
Buck Peak trend
20-30 mmbo
Winter Valley
80 mbo
Rangely
15 mmbo |
 Marcellus Industry Activity in END Play Area
21
Daniel
END
EOG Seneca Ultra
PGE/Exxon
Reported Marcellus EURs 6 –
8+ Bcf
•
Seneca –
N. Cameron County
•
5500’
laterals, 37-stage fracs
•
IP’s 7-
11 mmcf/d
•
EUR’s 6-8 BCF
•
Targeting < $6-7mm CWC’s (full
pad development)
•
EOG/Seneca –
Northern Clearfield Co.
•
Recent IP’s 7-9+ mmcf/d
•
PGE/Exxon –
SE McKean County
•
5000’
–
7600’
laterals
•
IP’s 6-9 mmcf/d
Seneca Geneseo
Seneca Utica well
EOG
PGE long laterals
7000+’
5000+’
Isopach of Marcellus Shale, c.i. = 50’
Seneca 6-8 BCF |
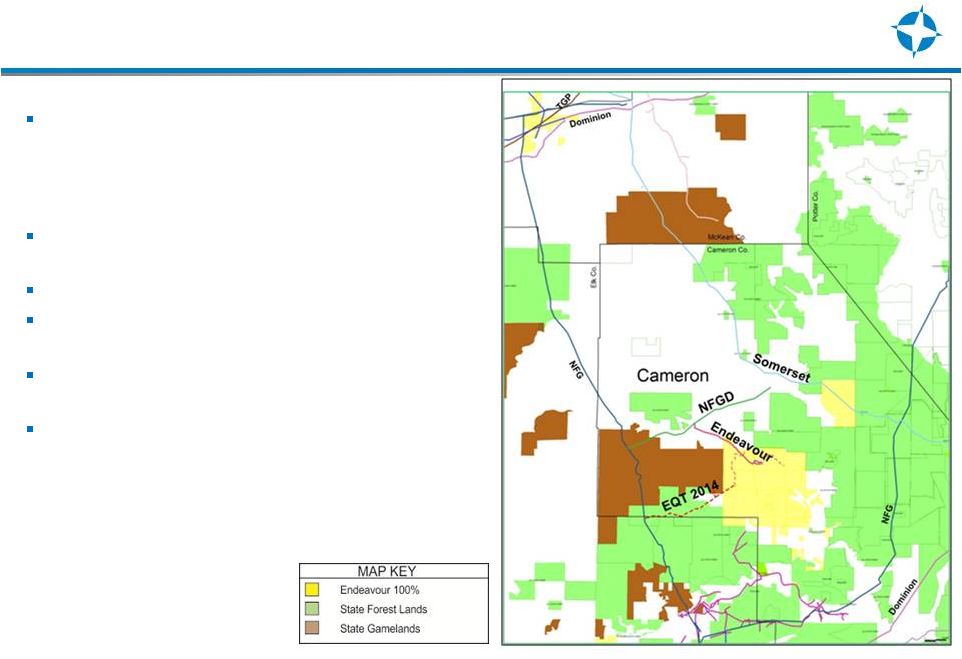 Pennsylvania Marcellus Assets
In October 2013, closed a 50% sale / joint
venture with Samson Exploration, LLC
•
Provides development capital for Daniel
Project ‘proof of concept’
27,000 net acres (majority held by
production), END-operated
400-600+ BCFe net resource potential
1 TCF potential including adjacent state
lands
5 producing wells with 3 horizontal wells
waiting on completion
10 MMCF/D of take-away capacity on the
EQT line available by mid-year
22 |
 Financial Overview |
 2014
Direct Capital Expenditure Budget 24
U.S.
Other
Colorado
Alba
U.K.
Other
2014
Direct
CapEx
=
$60
million
-
$80
million
•
U.K.
=
$40
million
-
$55
million
•
U.S.
=
$20
million
-
$25
million
Decommissioning costs for IVRR, Renee and Rubie fields = $50 million
|
 25
Pro Forma Debt Maturity Schedule
Convertible Notes due 2016 ($18.51 per share conversion price)
Convertible Bonds due 2016 ($16.52 per share conversion price)
Senior Notes due 2018
Senior Secured First Lien Term Loan due 2017
Convertible Notes due 2017 ($4.66 per share conversion price)
$135
$125
$554
$78
$12.5
$0
$100
$200
$300
$400
$500
2014
2015
2016
2017
2018 |
 Focus
for 2014 26
Improve and maintain production
Control capex spending
Deleverage
Pursue exploitation of exploration inventory through joint ventures with
like minded partners |
 LSE:ENDV
NYSE:END
www.endeavourcorp.com
INVESTOR CONTACT:
Darcey Matthews
Director of Investor Relations
713.307.8711
darcey.matthews@endeavourcorp.com |