Attached files
| file | filename |
|---|---|
| 8-K - CURRENT REPORT OF MATERIAL EVENTS OR CORPORATE CHANGES - NABORS INDUSTRIES LTD | a14-8832_18k.htm |
| EX-99.1 - EX-99.1 - NABORS INDUSTRIES LTD | a14-8832_1ex99d1.htm |
Exhibit 99.2
|
|
Howard Weil 42nd Annual Energy Conference March 24-26, 2014 |
|
|
Forward-Looking Statements We often discuss expectations regarding our markets, demand for our products and services, and our future performance in our annual and quarterly reports, press releases, and other written and oral statements. Such statements, including statements in this document incorporated by reference that relate to matters that are not historical facts are “forward-looking statements” within the meaning of the safe harbor provisions of Section 27A of the Securities Act of 1933 and Section 21E of the Securities Exchange Act of 1934. These “forward-looking statements” are based on our analysis of currently available competitive, financial and economic data and our operating plans. They are inherently uncertain, and investors must recognize that events and actual results could turn out to be significantly different from our expectations. You should consider the following key factors when evaluating these forward-looking statements: • fluctuations in worldwide prices and demand for natural gas, natural gas liquids and crude oil; • fluctuations in levels of natural gas, natural gas liquids and crude oil exploration and development activities; • fluctuations in the demand for our services; • the existence of competitors, technological changes and developments in the oilfield services industry; • the existence of operating risks inherent in the oilfield services industry; • the existence of regulatory and legislative uncertainties; • the possibility of changes in tax laws; • the possibility of political instability, war or acts of terrorism in any of the countries in which we do business; and • general economic conditions including the capital and credit markets. Our businesses depend, to a large degree, on the level of spending by oil and gas companies for exploration, development and production activities. Therefore, a sustained increase or decrease in the price of natural gas, natural gas liquids or crude oil, which could have a material impact on exploration and production activities, could also materially affect our financial position, results of operations and cash flows. The above description of risks and uncertainties is by no means all inclusive, but is designed to highlight what we believe are important factors to consider. 2 |
|
|
Company Profile 3 |
|
|
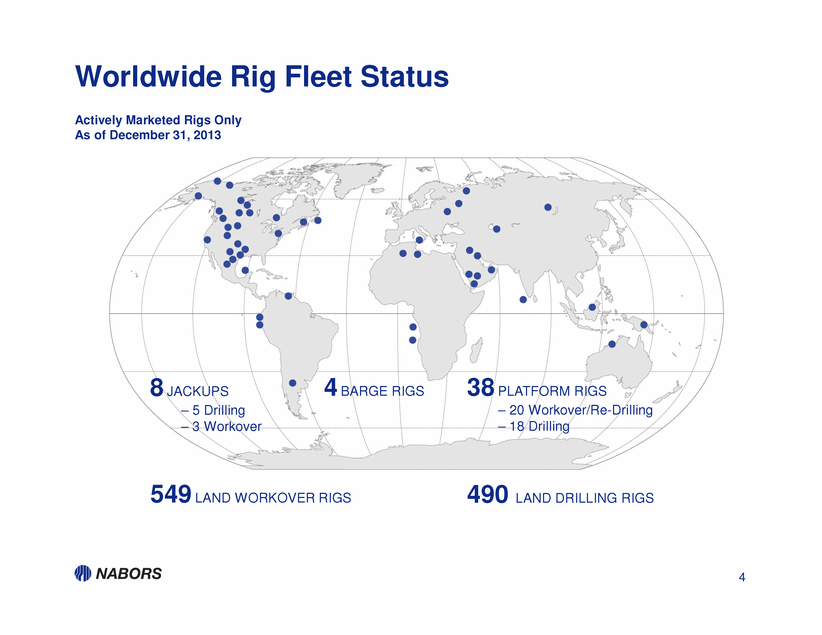
549LAND WORKOVER RIGS 8JACKUPS – 5 Drilling – 3 Workover 490 LAND DRILLING RIGS 4BARGE RIGS 38PLATFORM RIGS – 20 Workover/Re-Drilling – 18 Drilling Worldwide Rig Fleet Status Actively Marketed Rigs Only As of December 31, 2013 4 |
|
|
$0 $500,000 $1,000,000 $1,500,000 $2,000,000 $2,500,000 $0 $10 $20 $30 $40 $50 $60 EBITDA Stock Price Nabors’ Historical Stock Price Focused on re-establishing historical valuation Consensus EBITDA 5 |
|
|
2Q12 Refocusing of Businesses Strategic Plan > Streamlining the business > Enhancing operational excellence > Driving technology and innovation > Strengthening customer alignment > Improving balance sheet quality and flexibility 6 |
|
|
(1) Includes announced new build commitments (2) Revenue excludes other reconciling items Streamlining the Business > Drilling & Rig Services – U.S. Lower 48 – 286 rigs(1) – U.S. Offshore – 24 rigs – Alaska – 19 rigs – Canada – 64 rigs – International – 157 rigs – Other Rig Services • Canrig (top drives, rig automation software) • Ryan (directional drilling) > Completion & Production Services – Completion Services • 805k HHP • Coiled tubing, cementing, wireline – Production Services • 552 rigs • 1,431 trucks • 5,312 frac tanks • 26 SWD’s 2013 Revenue – $6.3 bn(2) U.S. Drilling 30% Canada 6% International 23% Other Rig Services 8% Completion Services 17% Production Services 16% Two Business Lines Completion & Production Services Drilling & Rig Services 7 |
|
|
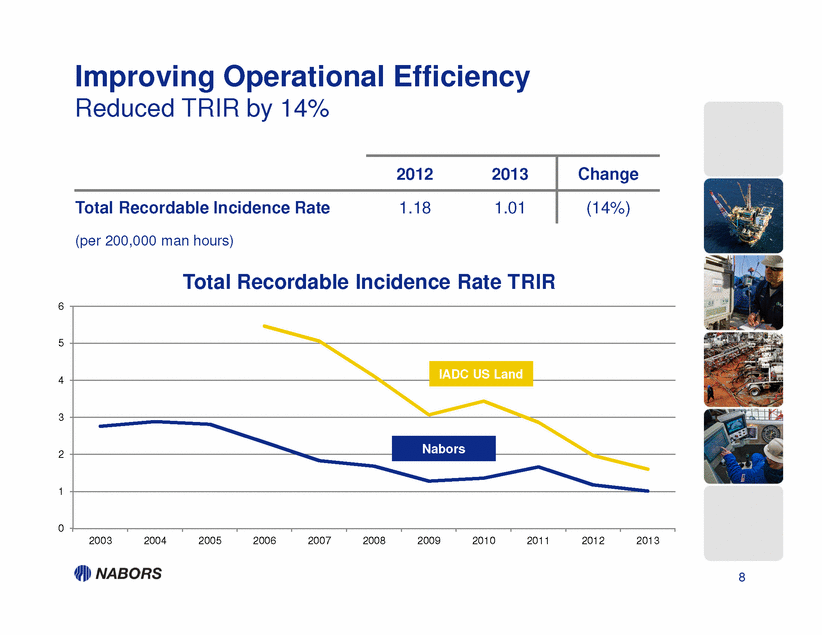
0 1 2 3 4 5 6 2003 2004 2005 2006 2007 2008 2009 2010 2011 2012 2013 Total Recordable Incidence Rate TRIR Improving Operational Efficiency Reduced TRIR by 14% 2012 2013 Change Total Recordable Incidence Rate 1.18 1.01 (14%) (per 200,000 man hours) IADC US Land Nabors 8 |
|
|
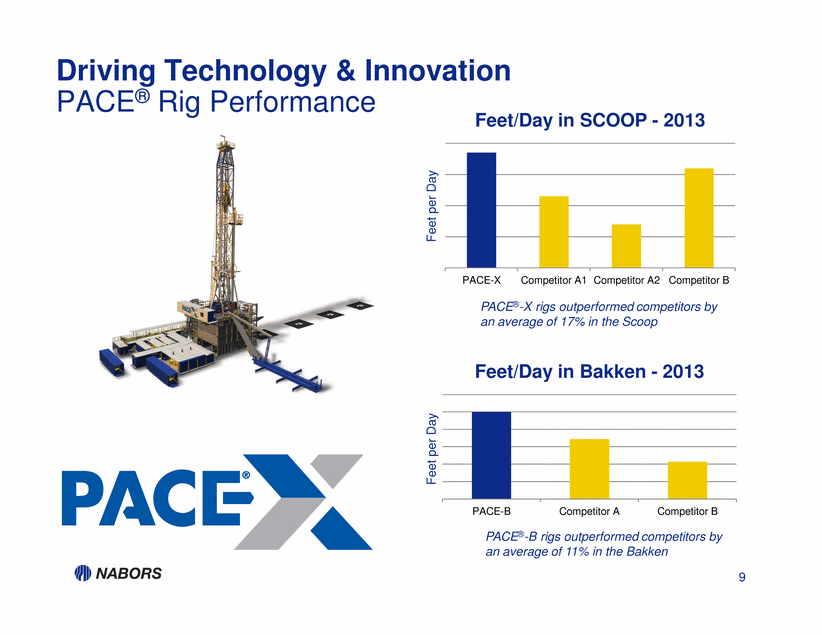
Driving Technology & Innovation PACE® Rig Performance PACE-X Competitor A1 Competitor A2 Competitor B Feet/Day in SCOOP - 2013 PACE-B Competitor A Competitor B Feet/Day in Bakken - 2013 PACE®-X rigs outperformed competitors by an average of 17% in the Scoop PACE®-B rigs outperformed competitors by an average of 11% in the Bakken Feet per Day Feet per Day 9 |
|
|
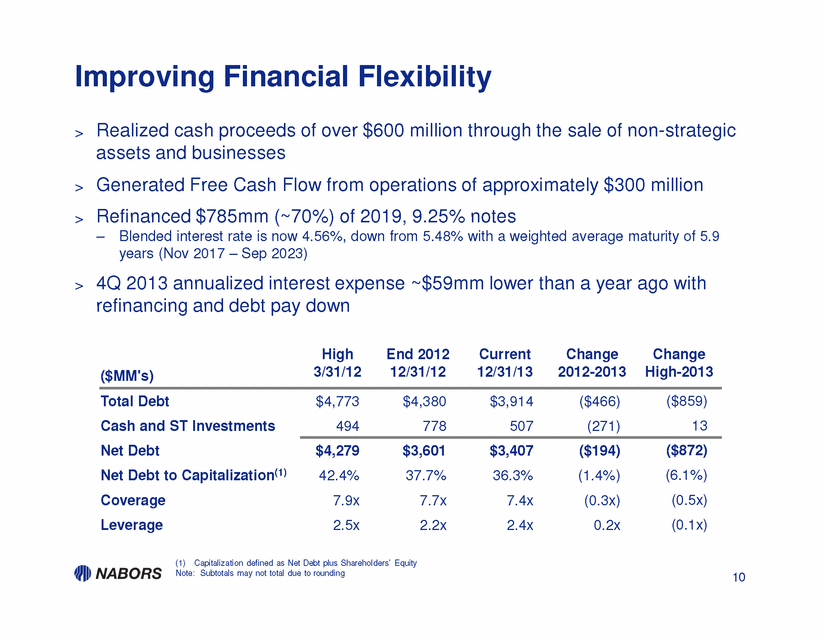
Improving Financial Flexibility > Realized cash proceeds of over $600 million through the sale of non-strategic assets and businesses > Generated Free Cash Flow from operations of approximately $300 million > Refinanced $785mm (~70%) of 2019, 9.25% notes – Blended interest rate is now 4.56%, down from 5.48% with a weighted average maturity of 5.9 years (Nov 2017 – Sep 2023) > 4Q 2013 annualized interest expense ~$59mm lower than a year ago with refinancing and debt pay down (1) Capitalization defined as Net Debt plus Shareholders’ Equity Note: Subtotals may not total due to rounding High 3/31/12 End 2012 12/31/12 Current 12/31/13 Change 2012-2013 Change High-2013 ($MM's) Total Debt $4,773 $4,380 $3,914 ($466) ($859) Cash and ST Investments 494 778 507 (271) 13 Net Debt $4,279 $3,601 $3,407 ($194) ($872) Net Debt to Capitalization(1) 42.4% 37.7% 36.3% (1.4%) (6.1%) Coverage 7.9x 7.7x 7.4x (0.3x) (0.5x) Leverage 2.5x 2.2x 2.4x 0.2x (0.1x) 10 |
|
|
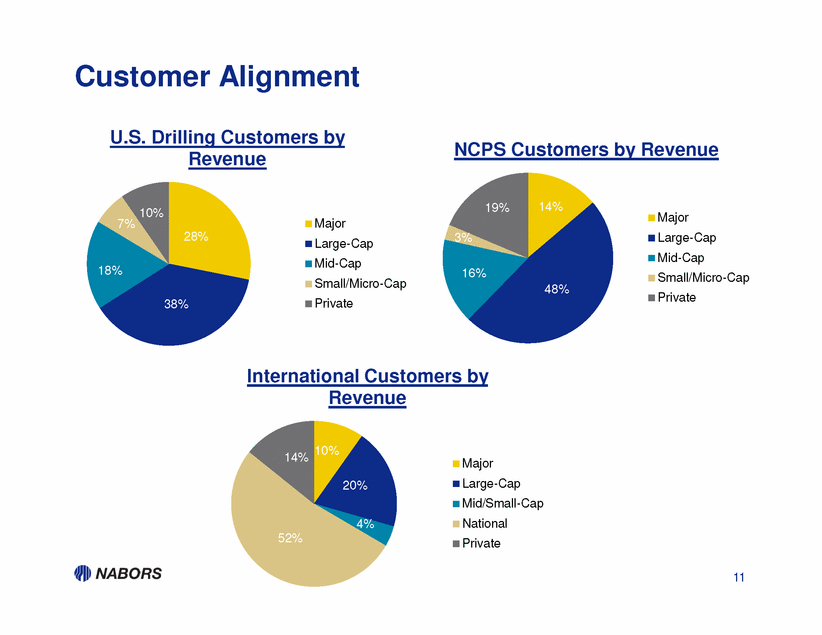
Customer Alignment 11 28% 38% 18% 7% 10% U.S. Drilling Customers by Revenue Major Large-Cap Mid-Cap Small/Micro-Cap Private 14% 48% 16% 3% 19% NCPS Customers by Revenue Major Large-Cap Mid-Cap Small/Micro-Cap Private 10% 20% 4% 52% 14% International Customers by Revenue Major Large-Cap Mid/Small-Cap National Private |
|
|
Macro Outlook: Rig Demand Growth 1 |
|
|
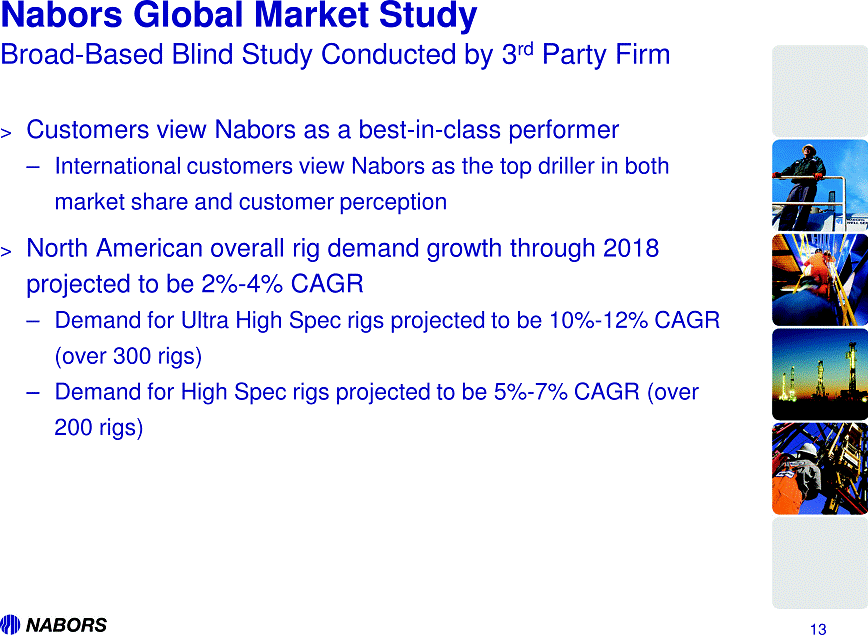
Nabors Global Market Study Broad-Based Blind Study Conducted by 3rd Party Firm > Customers view Nabors as a best-in-class performer – International customers view Nabors as the top driller in both market share and customer perception > North American overall rig demand growth through 2018 projected to be 2%-4% CAGR – Demand for Ultra High Spec rigs projected to be 10%-12% CAGR (over 300 rigs) – Demand for High Spec rigs projected to be 5%-7% CAGR (over 200 rigs) 2 |
|
|
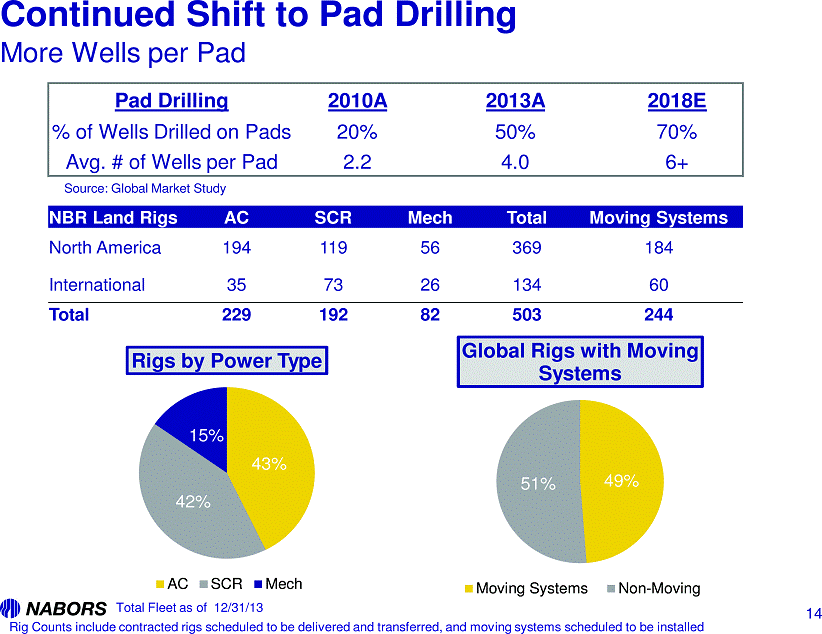
Continued Shift to Pad Drilling More Wells per Pad Pad Drilling 2010A 2013A 2018E % of Wells Drilled on Pads 20% 50% 70% Avg. # of Wells per Pad 2.2 4.0 6+ Rig Counts include contracted rigs scheduled to be delivered and transferred, and moving systems scheduled to be installed 49% 51% Global Rigs with Moving Systems Moving Systems Non-Moving 43% 42% 15% Rigs by Power Type AC SCR Mech Total Fleet as of 12/31/13 NBR Land Rigs AC SCR Mech Total Moving Systems North America 194 119 56 369 184 International 35 73 26 134 60 Total 229 192 82 503 244 3 Source: Global Market Study |
|
|
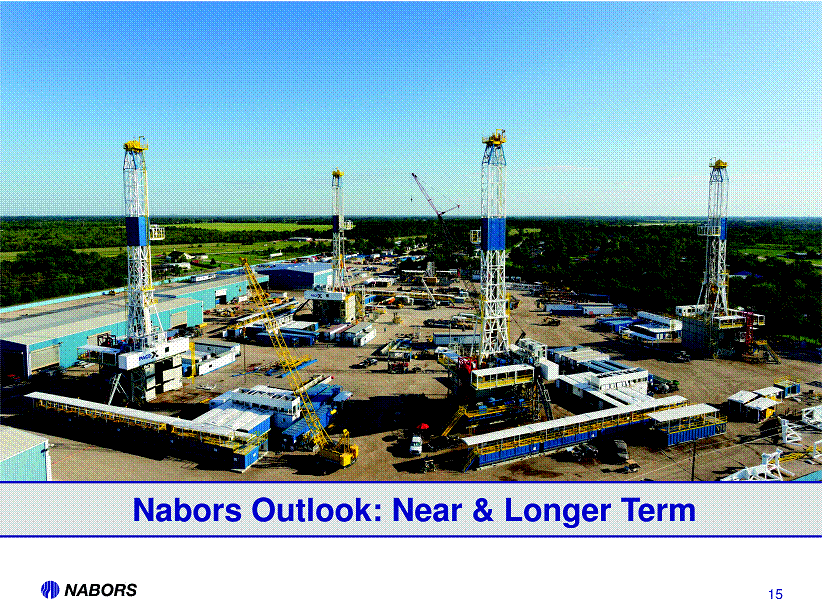
Nabors Outlook: Near & Longer Term 4 |
|
|
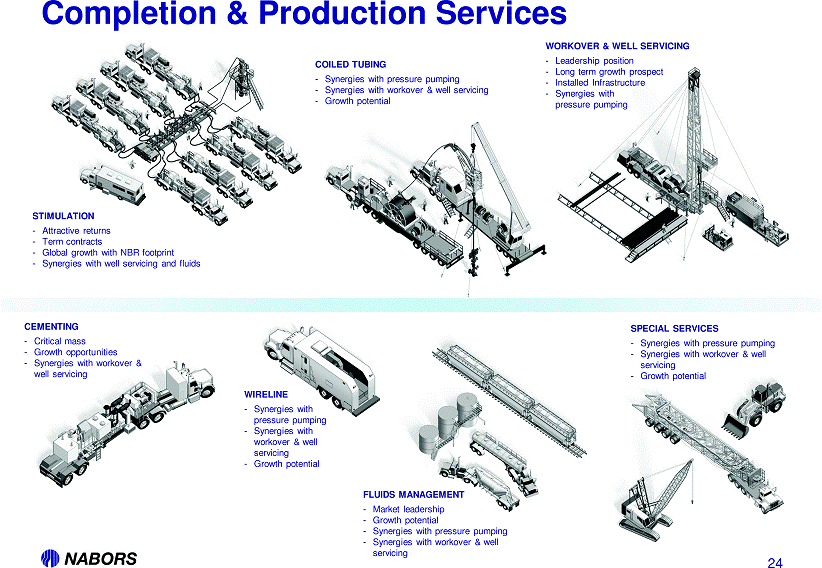
Completion & Production Services STIMULATION - Attractive returns - Term contracts - Global growth with NBR footprint - Synergies with well servicing and fluids COILED TUBING - Synergies with pressure pumping - Synergies with workover & well servicing - Growth potential WORKOVER & WELL SERVICING - Leadership position - Long term growth prospect - Installed Infrastructure - Synergies with pressure pumping CEMENTING - Critical mass - Growth opportunities - Synergies with workover & well servicing FLUIDS MANAGEMENT - Market leadership - Growth potential - Synergies with pressure pumping - Synergies with workover & well servicing SPECIAL SERVICES - Synergies with pressure pumping - Synergies with workover & well servicing - Growth potential WIRELINE - Synergies with pressure pumping - Synergies with workover & well servicing - Growth potential 5 |
|
|
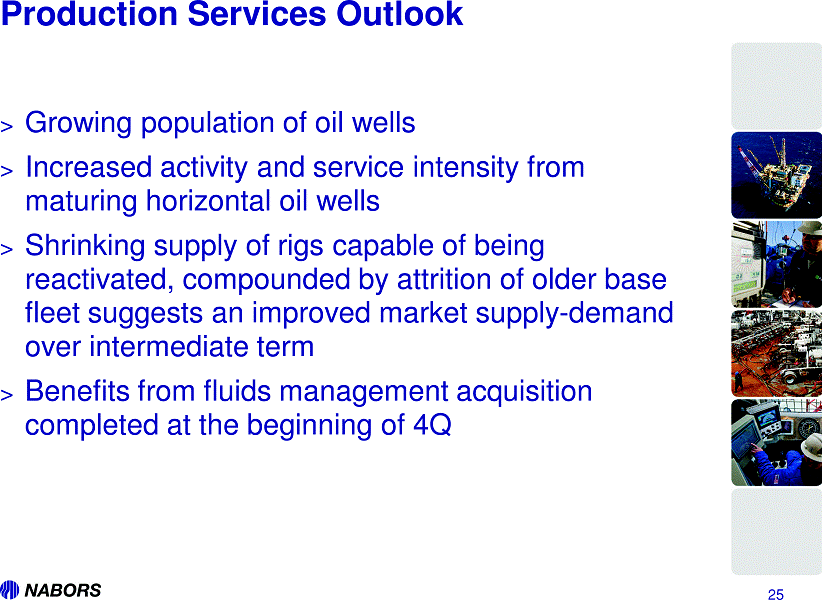
Production Services Outlook > Growing population of oil wells > Increased activity and service intensity from maturing horizontal oil wells > Shrinking supply of rigs capable of being reactivated, compounded by attrition of older base fleet suggests an improved market supply-demand over intermediate term > Benefits from fluids management acquisition completed at the beginning of 4Q 6 |
|
|
Production Services Rates and Hours $0 $100 $200 $300 $400 $500 $600 $700 0 100,000 200,000 300,000 400,000 500,000 600,000 700,000 800,000 900,000 1,000,000 2010 2011 2012 2013 Workover & Well Servicing Rig Rates & Hours Rig Hours Rig Rate $0 $20 $40 $60 $80 $100 $120 $140 0 500,000 1,000,000 1,500,000 2,000,000 2,500,000 2010 2011 2012 2013 Fluid Hauling Rates & Hours Truck Hours Truck Rate 7 |
|
|
Completion Services Outlook > Punishing weather in 1Q has greatly constrained our ability to work in Northern operating areas > 1Q operating results worse than expected > Beyond the winter weather, outlook improving > Expiring take-or-pay pressure pumping contracts rolled off with the new year > Near-term pumping calendar is relatively full > Increasing conviction that market has bottomed with near-term price stability and improving utilization, longer term supply-demand balance emerging 8 |
|
|
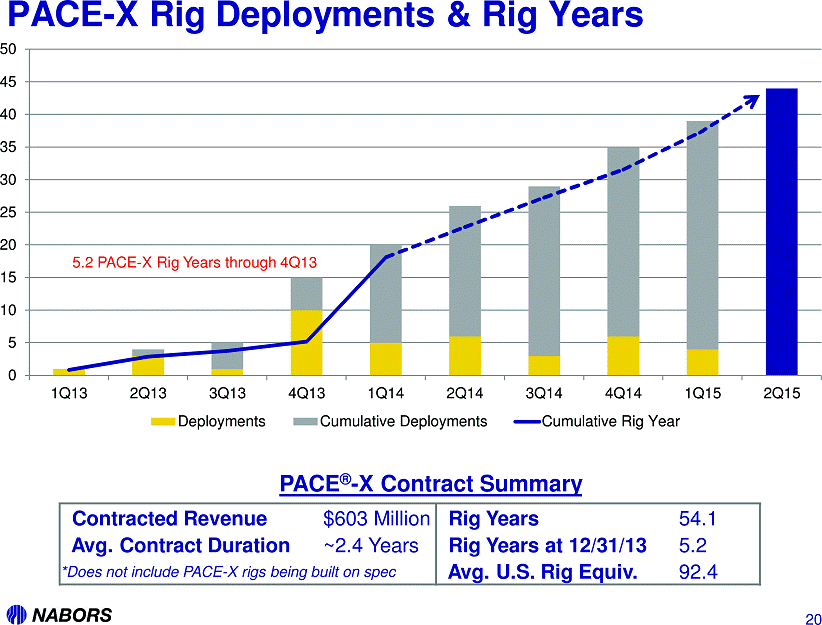
PACE-X Rig Deployments & Rig Years 0 5 10 15 20 25 30 35 40 45 50 1Q13 2Q13 3Q13 4Q13 1Q14 2Q14 3Q14 4Q14 1Q15 2Q15 Deployments Cumulative Deployments Cumulative Rig Year 5.2 PACE-X Rig Years through 4Q13 PACE®-X Contract Summary Contracted Revenue $603 Million Rig Years 54.1 Avg. Contract Duration ~2.4 Years Rig Years at 12/31/13 5.2 *Does not include PACE-X rigs being built on spec Avg. U.S. Rig Equiv. 92.4 1 |
|
|
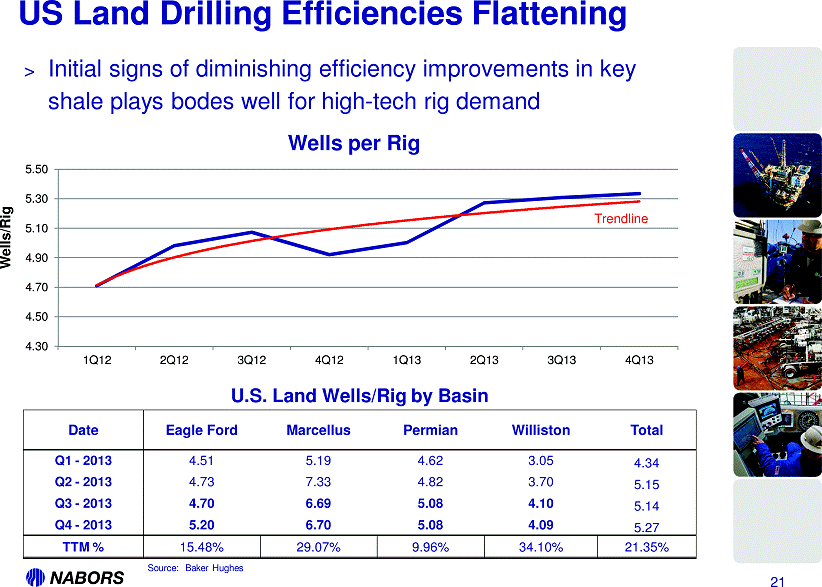
US Land Drilling Efficiencies Flattening > Initial signs of diminishing efficiency improvements in key shale plays bodes well for high-tech rig demand Source: Baker Hughes U.S. Land Wells/Rig by Basin Date Eagle Ford Marcellus Permian Williston Total Q1 - 2013 4.51 5.19 4.62 3.05 4.34 Q2 - 2013 4.73 7.33 4.82 3.70 5.15 Q3 - 2013 4.70 6.69 5.08 4.10 5.14 Q4 - 2013 5.20 6.70 5.08 4.09 5.27 TTM % 15.48% 29.07% 9.96% 34.10% 21.35% Wells/Rig 4.30 4.50 4.70 4.90 5.10 5.30 5.50 1Q12 2Q12 3Q12 4Q12 1Q13 2Q13 3Q13 4Q13 Wells per Rig Trendline 2 |
|
|
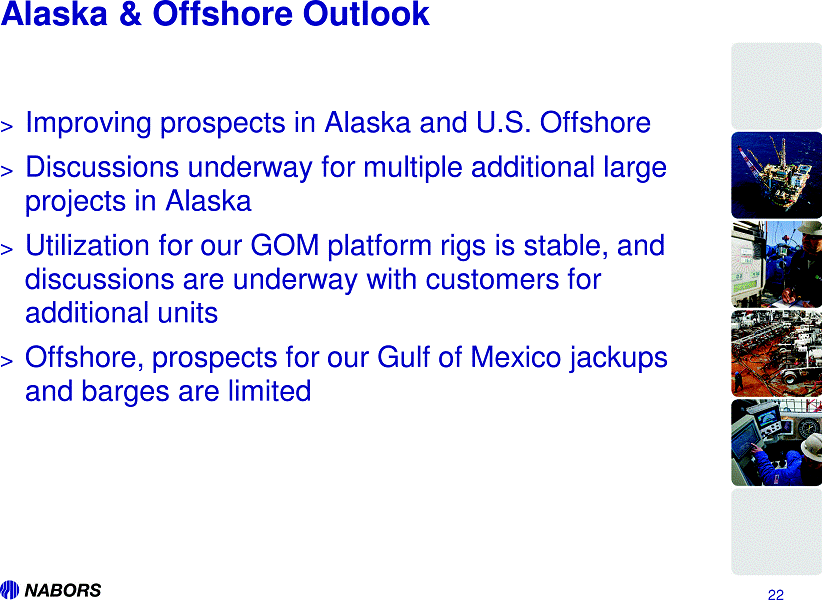
Alaska & Offshore Outlook > Improving prospects in Alaska and U.S. Offshore > Discussions underway for multiple additional large projects in Alaska > Utilization for our GOM platform rigs is stable, and discussions are underway with customers for additional units > Offshore, prospects for our Gulf of Mexico jackups and barges are limited 3 |
|
|
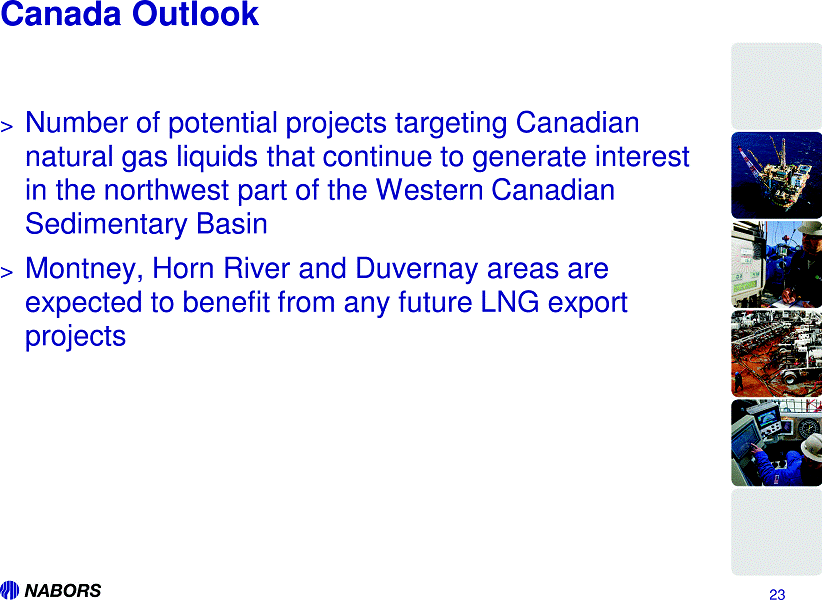
Canada Outlook > Number of potential projects targeting Canadian natural gas liquids that continue to generate interest in the northwest part of the Western Canadian Sedimentary Basin > Montney, Horn River and Duvernay areas are expected to benefit from any future LNG export projects 4 |
|
|
Completion & Production Services STIMULATION - Attractive returns - Term contracts - Global growth with NBR footprint - Synergies with well servicing and fluids COILED TUBING - Synergies with pressure pumping - Synergies with workover & well servicing - Growth potential WORKOVER & WELL SERVICING - Leadership position - Long term growth prospect - Installed Infrastructure - Synergies with pressure pumping CEMENTING - Critical mass - Growth opportunities - Synergies with workover & well servicing FLUIDS MANAGEMENT - Market leadership - Growth potential - Synergies with pressure pumping - Synergies with workover & well servicing SPECIAL SERVICES - Synergies with pressure pumping - Synergies with workover & well servicing - Growth potential WIRELINE - Synergies with pressure pumping - Synergies with workover & well servicing - Growth potential 5 |
|
|
Production Services Outlook > Growing population of oil wells > Increased activity and service intensity from maturing horizontal oil wells > Shrinking supply of rigs capable of being reactivated, compounded by attrition of older base fleet suggests an improved market supply-demand over intermediate term > Benefits from fluids management acquisition completed at the beginning of 4Q 6 |
|
|
Production Services Rates and Hours $0 $100 $200 $300 $400 $500 $600 $700 0 100,000 200,000 300,000 400,000 500,000 600,000 700,000 800,000 900,000 1,000,000 2010 2011 2012 2013 Workover & Well Servicing Rig Rates & Hours Rig Hours Rig Rate $0 $20 $40 $60 $80 $100 $120 $140 0 500,000 1,000,000 1,500,000 2,000,000 2,500,000 2010 2011 2012 2013 Fluid Hauling Rates & Hours Truck Hours Truck Rate 7 |
|
|
Completion Services Outlook > Punishing weather in 1Q has greatly constrained our ability to work in Northern operating areas > 1Q operating results worse than expected > Beyond the winter weather, outlook improving > Expiring take-or-pay pressure pumping contracts rolled off with the new year > Near-term pumping calendar is relatively full > Increasing conviction that market has bottomed with near-term price stability and improving utilization, longer term supply-demand balance emerging 8 |
|
|
Completion Services Outlook Horizontal Rig Count driving HHP Usage 9 10,000,000 10,500,000 11,000,000 11,500,000 12,000,000 12,500,000 13,000,000 13,500,000 1,000 1,020 1,040 1,060 1,080 1,100 1,120 1,140 1,160 1,180 1,200 3Q11 4Q11 1Q12 2Q12 3Q12 4Q12 1Q13 2Q13 3Q13 4Q13 Source: BHI Rig Counts & PacWest Est. HHP Usage Horizontal Rig Count Estimated HHP Usage Horizontal Rig Count |
|
|
Summary: Why Nabors? > Clear Path to Improving Performance – Contract visibility – Bottoming out of U.S. Land – Visible upside in other drilling segments – Strong demographic in Well Servicing – Appearance of market bottom in Pressure Pumping > Unmatched Global Position and Opportunity Set – Largest fleet of land drilling rigs in the world: 544 – 2nd largest fleet of workover and well servicing rigs in North America: 522 – 6th largest stimulation fleet in North America – Workforce of nearly 29,000 representing 75 nationalities in 25 countries > Technological & Operational Leadership 10 |

