Attached files
| file | filename |
|---|---|
| 8-K - CURRENT REPORT OF MATERIAL EVENTS OR CORPORATE CHANGES - LRR Energy, L.P. | a14-8933_18k.htm |
Exhibit 99.1
|
|
LRR Energy, L.P. March 25, 2014 Red Lake Field Tour |
|
|
This presentation contains "forward-looking statements" — that is, statements related to future events. Forward-looking statements are based on the current expectations of LRR Energy and include any statement that does not directly relate to a current or historical fact. In this context, forward-looking statements often address expected future business and financial performance, and often contain words such as "may," "predict," "pursue," "expect," "estimate," "project," "plan," "believe," "intend," "achievable," "anticipate," "target," "continue," "potential," "should," "could" and other similar words. Forward-looking statements in this presentation relate to, among other things, LRR Energy's expectations regarding future results, production volumes, lease operating expenses and capital expenditures. Actual results and future events could differ materially from those anticipated or implied in such statements. Forward-looking statements involve certain risks and uncertainties, and ultimately may not prove to be accurate. These risks and uncertainties include, among other things, a decline in oil, natural gas or NGL prices, the risk and uncertainties involved in producing oil and natural gas, competition in the oil and natural gas industry, governmental regulations and other factors. Actual results could differ materially from those anticipated or implied in the forward-looking statements due to the factors described under the captions "Risk Factors" in LRR Energy's Annual Report on Form 10-K for the year ended December 31, 2013 and LRR Energy's subsequent filings with the Securities and Exchange Commission. All forward-looking statements speak only as of the date of this presentation. Other than required under the securities laws, LRR Energy does not intend to update or revise any forward-looking statements, whether as a result of new information, future events or circumstances, changes in expectations or otherwise. All forward-looking statements are qualified in their entirety by this cautionary statement. Forward Looking Statements LRR Energy, L.P. |
|
|
LRE Property Summary LRR Energy, L.P. Reserves based on Third Party Runs using 12/31/13 SEC Pricing BY PRODUCT 2013 Proved Reserve Characteristics BY CATEGORY BY AREA LRE Total Permian Basin Mid-Continent Gulf Coast 55% 35% 10% Permian Basin Mid-Continent Gulf Coast Q4 2013 Production (Boe/d) 6,522 Proved Reserves (MMBoe) (1) 30.1 % Proved Developed 88% % Liquids 49% Total Proved Reserve Life (R/P) 12.6 Producing Wells (gross) 1,168 Total Development Opportunities (gross) 511 % Operated By Total Proved Reserves 84% 71% 17% 12% PDP PDNP PUD |
|
|
LRE 2014 Capital Budget LRR Energy, L.P. Oil-weighted capital budget of $34 million $22 million allocated to the Red Lake field 36 drill wells, including 19 Red Lake drill wells Estimated average new well rate of return ~30-35% 32 recompletes / workovers (100% Red Lake) Estimated average recompletion rate of return ~70-75% 18 non-production projects, including 1 SWD project, 1 facility upgrade, 14 P&A projects and 2 other projects Area Project 69% 31% Permian Basin Mid-Continent 79% 2% 19% Drilling Non-Production Recompletes & Other |
|
|
Lime Rock’s History in the Permian LRR Energy, L.P. 2006 2007 2008 2009 2010 2011 2012 2013 2014 LRR acquires Red Lake I LRR acquires Pecos Slope LRR acquires Red Lake II LRR acquires Corral Canyon LRR acquires East Artesia I LRE IPO LRR acquires Cowden East LRR sells Corral Canyon to LRE LRR acquires Fullerton LRR acquires Tex-Mex April 2006 – Initial Red Lake Acquisition Lime Rock Resources acquired 49% WI from a private Midland-based seller Non-operator position 80 producing wells, 52 drilling locations May 2008 Lime Rock Resources acquired remaining 51% of WI from same seller Took over operations November 2011 Red Lake and other assets contributed to LRE through IPO Since initial acquisition, LRR and LRE have drilled 123 Red Lake wells and have a remaining inventory of 95 proved locations Inventory surpassed original estimates due to down spacing, new fracture technologies and Lower Yeso development Red Lake Field History LRR sells Cowden East |
|
|
LRE / LRR Permian Basin Overview LRR Energy, L.P. Permian Basin LRR Energy (LRE) Lime Rock Resources (LRR) (2) Proved Reserves (MMBoe) (1) 16.5 (55% of total) 22.6 (59% of Fund II total) % PDP / PDNP / PUD 62% / 21% / 17% 64% / 8% / 27% % Oil / % Gas / % NGL 51% / 32% / 17% 60% / 24% / 17% Q4 2013 Production (Boe/d) 3,621 (56% of total) 3,801 (84% of Fund II total) Proved R/P Ratio 12.5 years 16.3 years Lime Rock Operated 94% Producing Wells 662 gross (533 net) Development Projects 388 gross (305 net) Acres 152,711 gross (124,369 net) Reserves based on Third Party Runs using 12/31/13 SEC Pricing Pro forma for announced acquisitions and divestitures for Fund II subsequent to 12/31/13 Key LRE field areas: Red Lake, Pecos Slope, Corral Canyon Key LRR field areas: East Artesia, Fullerton, Tex-Mex Combined Permian presence provides operating and cost synergies LRE Field Office LRR Field Office LRE Properties Permian Basin |
|
|
Lime Rock 2014 Permian Development Activity(1) LRR Energy 2014 Capital Budget of $23.4 million Drill 21 (19 at Red Lake) wells in 2014 (7 drilled YTD) Recomplete 31 Red Lake wells (11 completed YTD) Refrac 1 Red Lake well (0 completed YTD) Lime Rock Resources (Fund II) 2014 Capital Budget of $51 million (plan to drill 45 wells) LRR Energy, L.P. Includes drilling, recompletes and plugging and abandoning costs |

|
|
Red Lake Field Largest LRE field, predominantly oil Located in Eddy County, New Mexico 34% of total proved reserves(1) and 38% of total Q4 2013 production 223 gross (186 net) producing wells 99% LRE Operated Sweet and sour oil with casing head gas Low permeability carbonate reservoirs Nearly all production via primary recovery Multi year development program LRR Energy, L.P. Reserves based on Third Party Runs using 12/31/13 SEC Pricing Proved Reserves (1) Chaves Eddy Lea 59% 17% 24% Oil Gas NGL 51% 24% 25% PDP PDNP PUD |
|
|
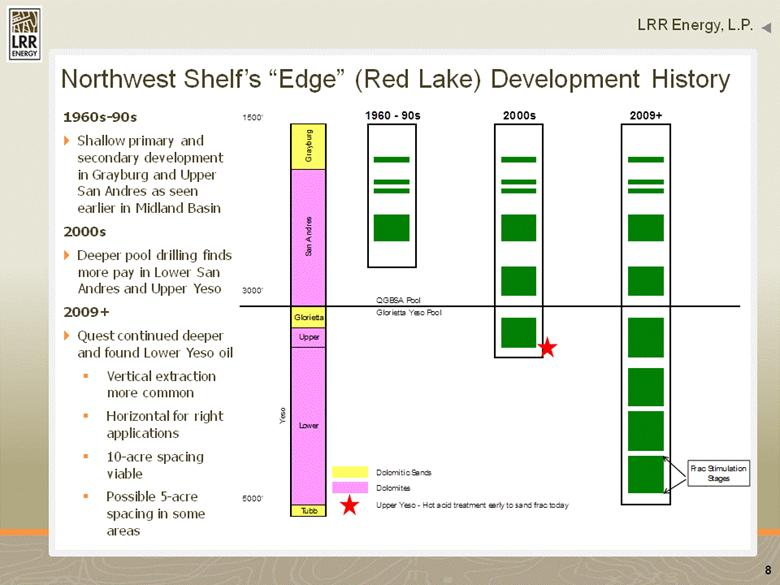
Northwest Shelf’s “Edge” (Red Lake) Development History LRR Energy, L.P. 1960s-90s Shallow primary and secondary development in Grayburg and Upper San Andres as seen earlier in Midland Basin 2000s Deeper pool drilling finds more pay in Lower San Andres and Upper Yeso 2009+ Quest continued deeper and found Lower Yeso oil Vertical extraction more common Horizontal for right applications 10-acre spacing viable Possible 5-acre spacing in some areas 1500' 1960 - 90s 2000s 2009+ 3000' QGBSA Pool Glorietta Yeso Pool Dolomitic Sands Dolomites 5000' Tubb Upper Yeso - Hot acid treatment early to sand frac today Yeso Grayburg San Andres Glorietta Upper Lower Frac Stimulation Stages |
|
|
Red Lake Field Exploitation Under Lime Rock Management LRR Energy, L.P. Lime Rock took over operations LRE acquires Red Lake 10,000 100,000 1,000,000 1,000 10,000 100,000 Gross Gas (MCFPM) Gross Oil (BOPM) Oil (BOPM) Gas (MCFPM) 2006 2007 2008 2009 2010 2011 2012 2013 2014 YTD Total Wells Drilled 10 5 10 20 18 15 16 29 6 129 Recompletions 7 3 9 16 12 3 10 28 11 99 Refracs 0 0 0 0 0 10 3 1 0 14 |
|
|
Red Lake Field – Flaring Update LRR Energy, L.P. Red Lake Production Plot Flaring which began in July 2012 due to Frontier plant compression limitations has decreased since Frontier installed additional compression in November 2013 (see plot below) No issues thus far with obtaining flare permits from regulatory agencies Several gas processors are looking to expand into area (mid-2015) 0 1,000 2,000 3,000 4,000 5,000 6,000 Jul-12 Oct-12 Jan-13 Apr-13 Jul-13 Oct-13 Jan-14 Gas (MCFPD) Net Gas Production Net Gas Sales |

|
|
2012 2013 New Well Avg. 30 Day IP (Boe/d): 101 102 Red Lake Field – Significant Inventory of Drilling Opportunities LRR Energy, L.P. Epoch/Series/ Stage Ochoan Guadalupian Leonardian Wolfcampian Virgilian Missourian Desmoinesian Atokan Morrowan Time (M.Y.) 251 302 NW Shelf New Mexico Dewey Lake Ruster Salado Castile Upper San Andres Artesia Group Tansill Yates Seven Rivers Queen Grayburg Lower San Andres Glorieta Paddock Blinebry Tubb Drinkard Yeso Abo Wolfcamp Cisco Canyon Strawn Atoka Morrow Red Lake Drilling History 2014 Red Lake Capital Plan New Wells Recompletes Projects: 19 32 Average Gross EUR (MBoe): 56.3 33.4 Average Gross Cost ($MM): $1.275 $0.216 F&D ($/Boe): $18.50 $10.19 Average 30 Day IP (Boe/d): 65 25 Average Rate of Return(1): ~30% ~70% New Wells Recompletes Projects: 95 114 Total Proved Inventory Assumes flat pricing of $90.00/Bbl for oil and $4.00/Mcf for gas |

|
|
Red Lake Logistics Map LRR Energy, L.P. Oil is sold to Sunoco, Holly-Frontier, Philips 66, Occidental Gas is sold to Frontier ~55% of saltwater is disposed into LRE operated wells Legacy CG State Solt Alamo H2O Flood Eddy Humble Judah Red Lake Quantum Saltwater Disposal Wells LRE Operated Third Party Operated |