Attached files
| file | filename |
|---|---|
| 8-K - 8-K - CARBO CERAMICS INC | d698578d8k.htm |
 ....provides
industry leading technology for Production Enhancement and Environmental Services
Howard Weil 42
nd
Annual Energy Conference
New Orleans, Louisiana
March 25, 2014
Exhibit 99.1 |
 The Private
Securities Litigation Reform Act of 1995 provides a "safe harbor" for forward-looking
statements.
Any
written
or
oral
statements
made
by
the
Company
or
on
behalf
of
the
Company
in
conjunction
with this presentation may include forward-looking statements which reflect the Company's
current views with respect to future events and financial performance. These
forward-looking statements are subject to certain risks and uncertainties that
could cause actual results to differ materially from such statements. This document
contains forward-looking statements within the meaning of the Private Securities Litigation Reform
Act of 1995 concerning, among other things, the Company's prospects, developments and business
strategies for its operations, all of which are subject to certain risks, uncertainties
and assumptions. These risks and uncertainties include, but are not limited to, changes
in overall economic conditions, changes in the cost of raw materials and natural gas
used in manufacturing our products, changes in demand and prices charged for our
products, changes in the demand for, or price of, oil and natural gas, risks of increased competition,
technological, manufacturing, distribution and product development risks, loss of key
customers, changes in government regulations, foreign and domestic political and
legislative risks, the risks of war and international and
domestic
terrorism,
risks
associated
with
foreign
operations
and
foreign
currency
exchange
rates
and
controls,
weather-related
risks
and
other
risks
and
uncertainties
described
in
our
publicly
available
filings
with
the
Securities
and
Exchange
Commission.
The
words
"believe,”
"expect,”
"anticipate,”
"project"
and
similar
expressions identify forward-looking statements.
Participants are cautioned not to place undue reliance on these forward-looking
statements, each of which speaks
only
as
of
the
date
the
statement
was
made.
The
Company
undertakes
no
obligation
to
publicly
update
or
revise
any
forward-looking
statements,
whether
as
a
result
of
new
information,
future
events
or
otherwise,
except as required by law.
Forward Looking Statements |
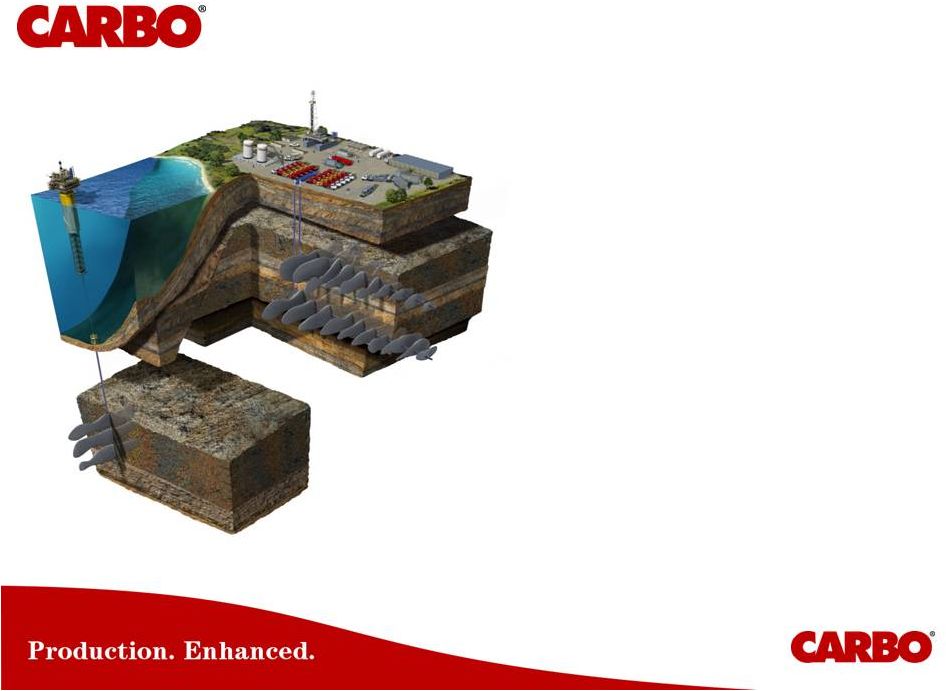
 Production
Enhancement Environmental Services
....provides industry leading technology for: |
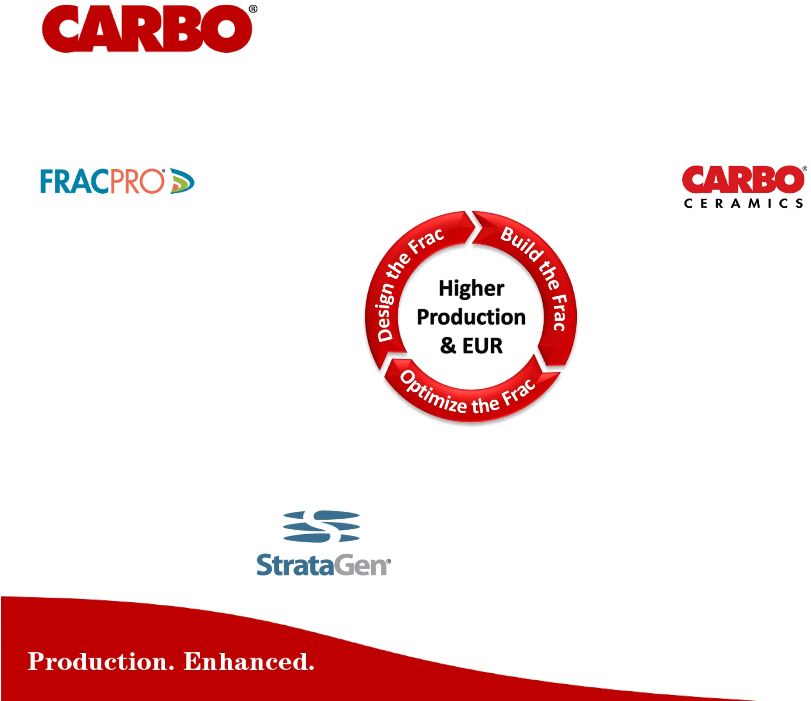
 “We increase
well Production and EUR through our Design, Build, and Optimize the Frac
workflow”
The value we create, is lower F&D costs and a higher
Recovery Factor
Well Cost $
Increased Production & EUR
Lower F&D ($/BOE)
=
TM |
 •
Frac Conductivity &
Durability
•
Production Assurance
•
Production Intelligence
•
Flow Enhancement
•
Well Site Supervision
•
Frac Diagnostics & Optimization
•
Field Development Optimization
•
Reservoir & Formation Analysis
•
Frac Design
•
Economic Optimization
•
Reservoir Performance
•
Post Job Analysis
….a leading production enhancement company |
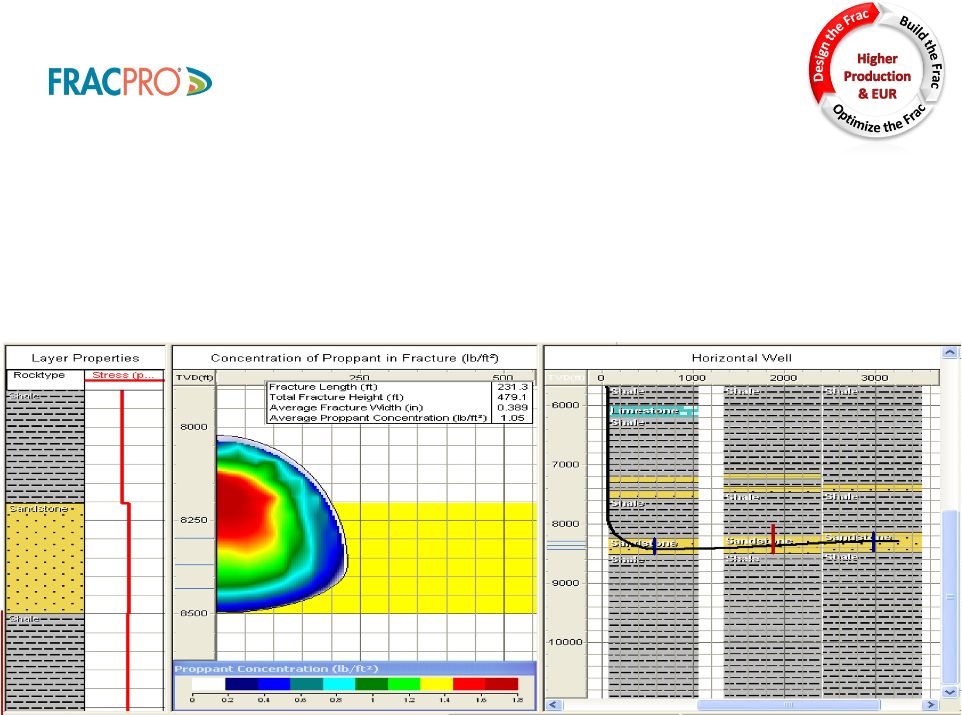 •
Is the industry’s most widely used hydraulic fracturing design software,
clients include E&P Operators, Service Companies, Universities
•
Provides Frac Design, Economic Optimization, Reservoir Performance and
Post
Job
Analysis.
Ties
all
the
information
together
during
the
frac
process. |
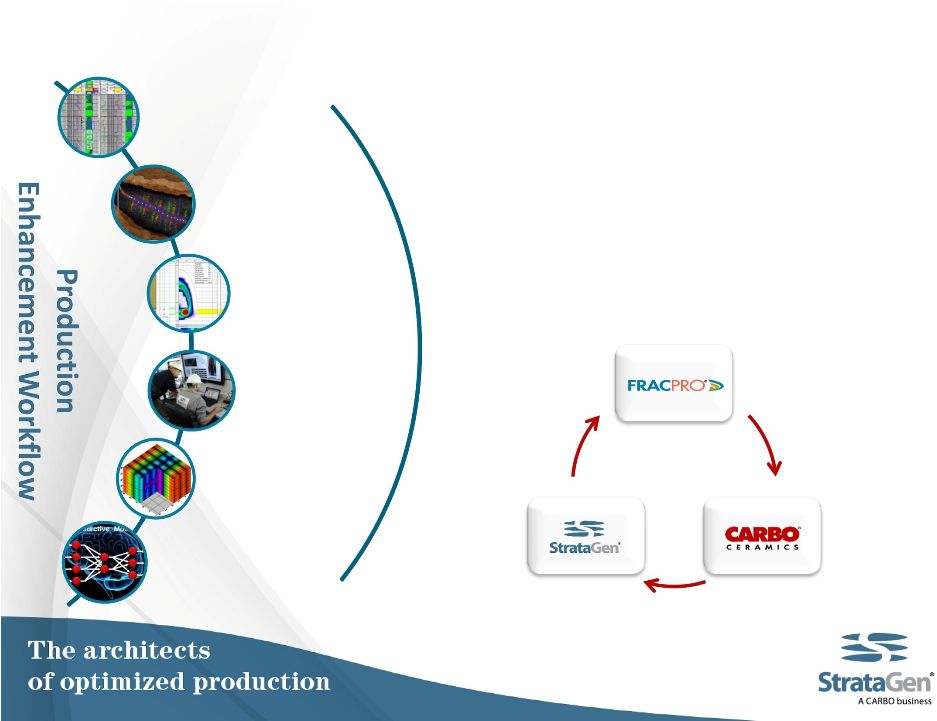 Reservoir
Fracture
Fracture
Design
Design
Production
Production
Completion
Completion
Best practices
Best practices
Execution
Execution
•
Experienced, industry experts working
in Unconventional Reservoirs
•
Provide technical consulting from
Well-site to Office to Full Field
Analysis
•
Integrating leading Technology to
increase well Production & EUR |
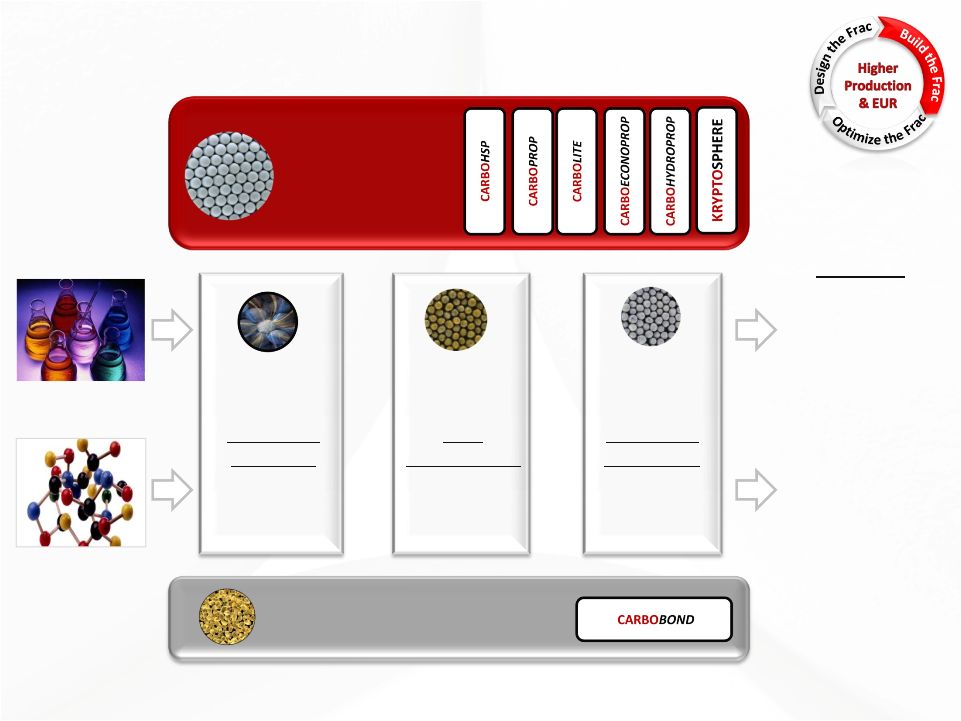 Proppant
Delivered Technology Platforms “More Space to Flow”
Higher
EUR
Production
IRR
Ceramics
Production
Assurance
Flow
Enhancement
Production
Intelligence
Proppant
Delivered
Proppant
Delivered
Proppant
Delivered
Resin Coated Products |
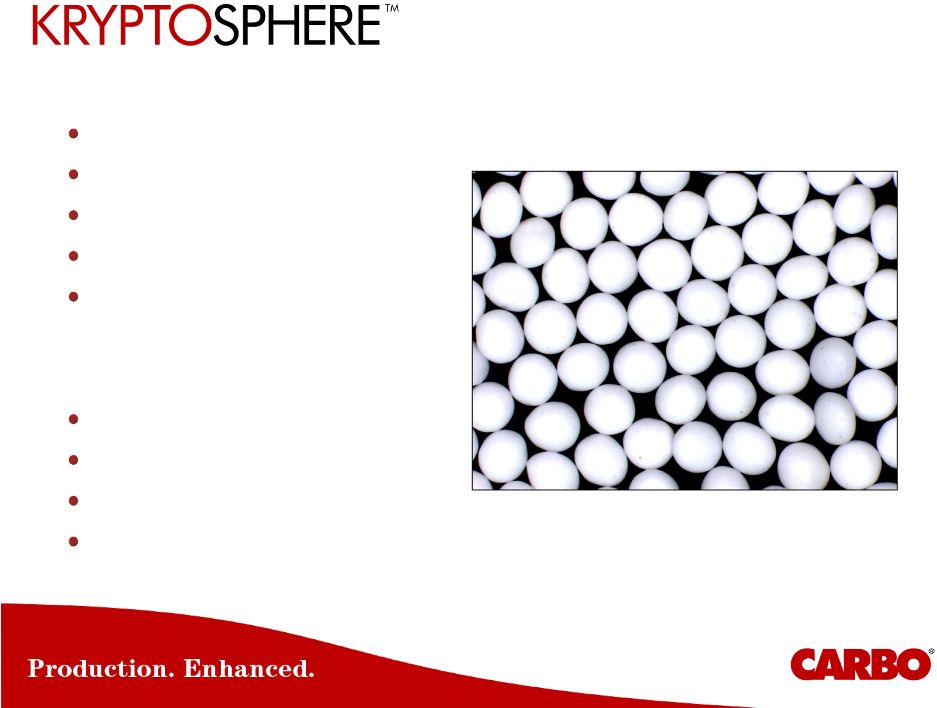
 Ultra-conductive ultra-high strength
proppant technology
Developed for deep wells and
ultra-high stress formations |
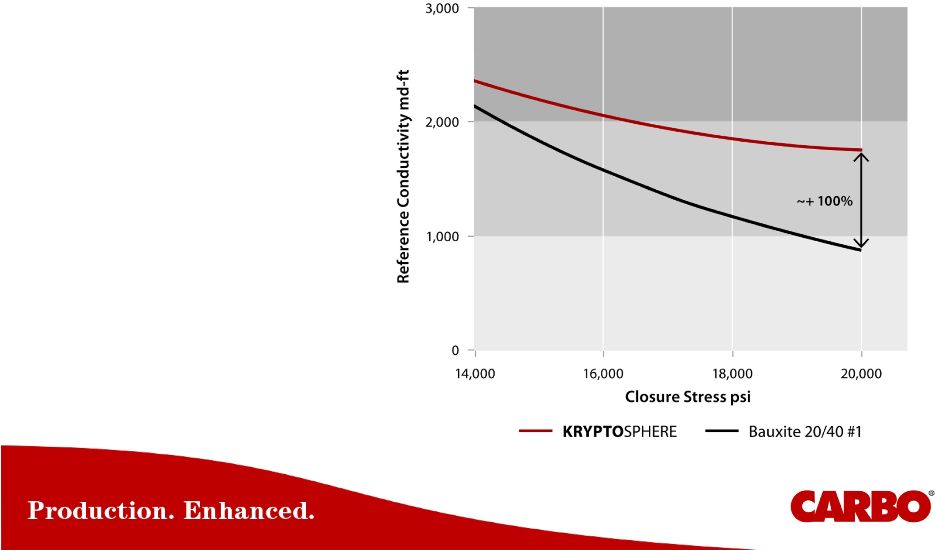 More
conductivity 100% more baseline
conductivity |
 Plant
produced proppant grains Precision-Engineered
More Space to Flow
More strength
More durability
More uniformity
More roundness
More smoothness
More flow space
More uniform flow paths
More long-term conductivity
More production, increased
EUR and superior IRR |
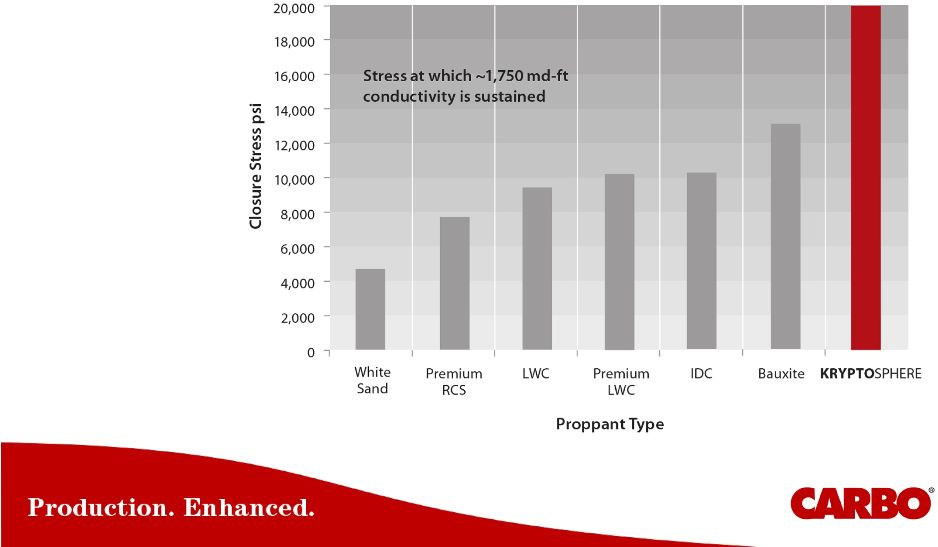 Highest
Conductivity Proppant in the Industry Outstanding
performance
under pressure |
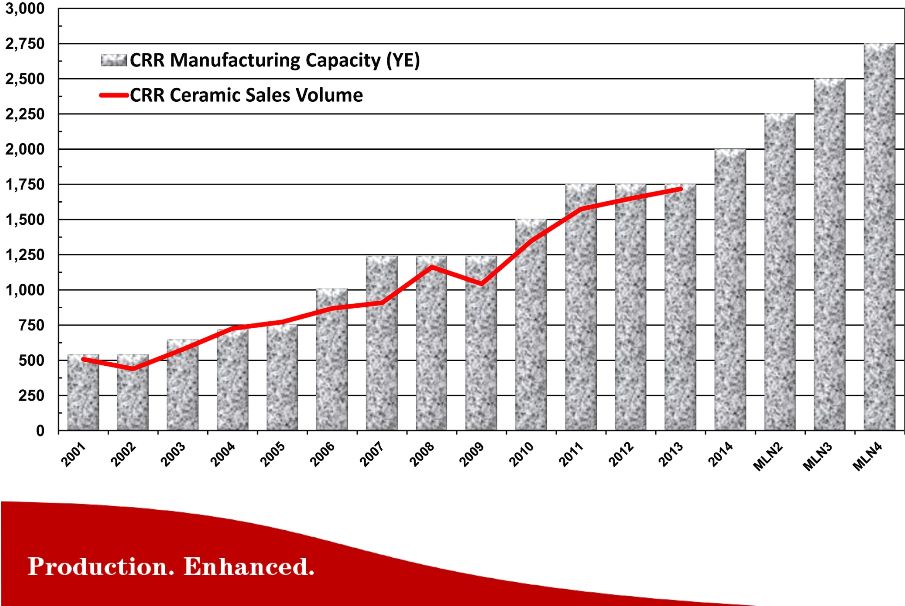 Lbs
(Millions) Millen Line 1 est completion near end of Q2-2014
Millen Line 2 est completion near end of H1-2015
Environmental permits obtained for all 4 Millen lines
Ceramic Proppant Sales vs Capacity |
 “Proppant
is one of the biggest factors in determining Production and EUR in fracture
stimulated wells. It is important that E&P
Operators know what Proppant is being used
in their wells. Make sure you are getting the
Conductivity and Quality you are paying for.”
Proppant Conductivity and Quality in the industry |
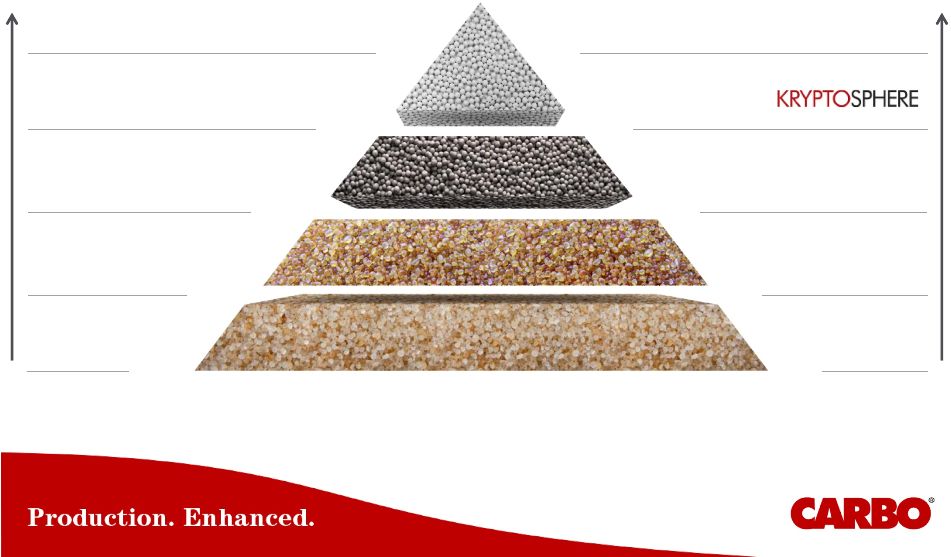 15
Hierarchy of Proppant Conductivity
Highest Conductivity
Highest Production, EUR, ROI
Ceramic -
Engineered product
Ultra-high strength
Mono-size and spherical
High strength
Uniform size and shape
Thermal resistant
Medium strength
Irregular size and shape
Low strength
Irregular size and shape
Sand -
Naturally occurring product
Conductivity
=
Permeability
of
the
frac
x
width
of
the
frac
=
K
x
W
Ultra-conductive Ceramic
Tier 1 –
High conductivity
Ceramic
Tier 2 –
Medium conductivity
Resin-coated Sand
Tier 3 –
Low conductivity
Sand
Chart prepared by and
property of CARBO
frac
frac |
 The
Stakeholders -
E&P Operators, Service Companies, Royalty
Owners, State Agencies…..
•
•
Industry Awareness of Low Quality Chinese Ceramics
………are becoming more aware of the losses to well
Production and EUR that can occur when using low quality,
low
conductivity
Chinese
ceramic
proppants,
or
other
low
quality proppants, and the subsequent loss of revenue
………are becoming more aware of the need to test Proppant
and know what they are paying for. CARBO is committed to
quality and testing –
everyday. |
 Proppant
Quality Matters in Well Production As
an
E&P
Operator
investing
$4M
–
$12M
on
a
well,
how
much
Production
&
EUR
are
you
sacrificing
by
using
low
quality
Chinese
ceramic
proppant?
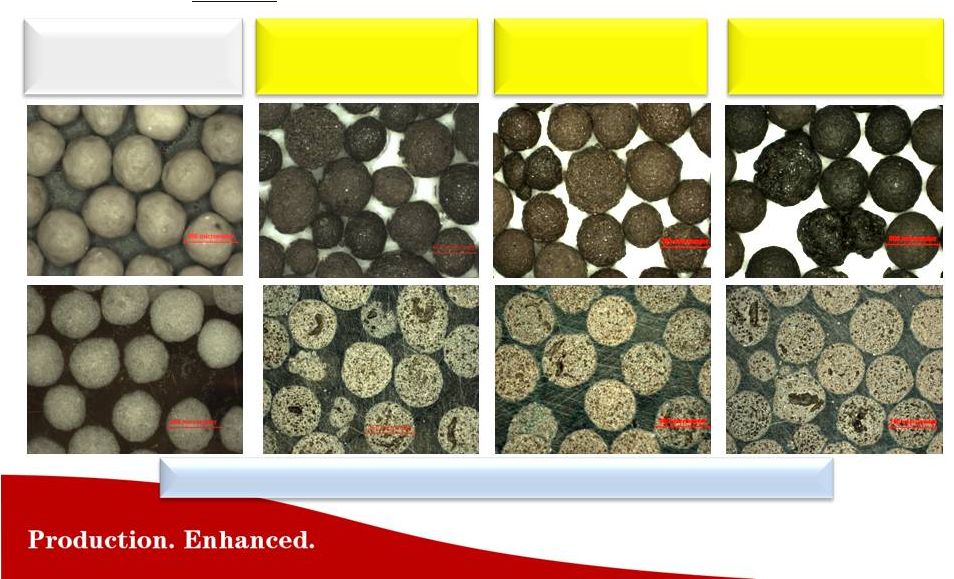
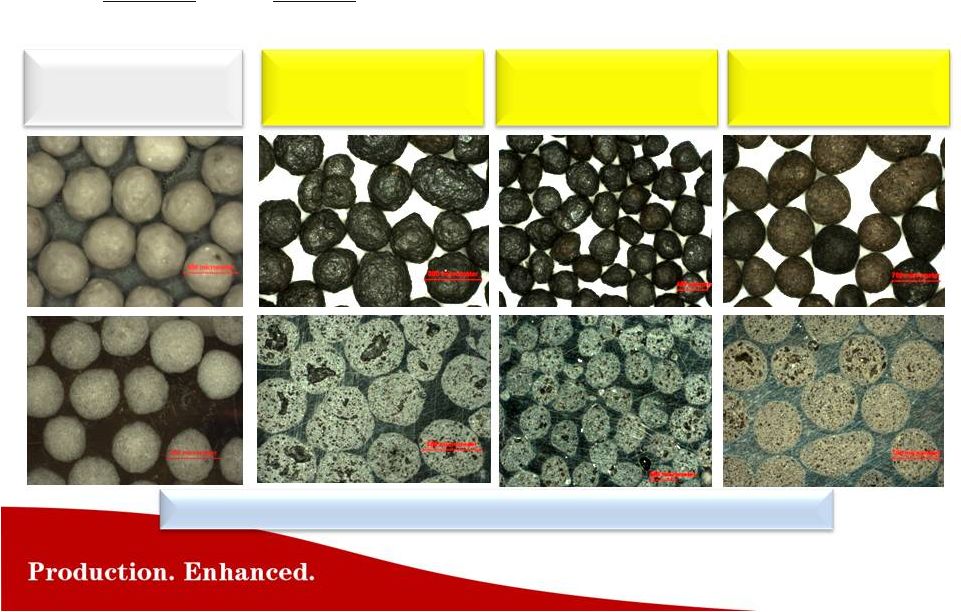
Chinese 20/40
IDC # 1C
Chinese 20/40
IDC # 2C
Chinese 20/40
IDC # 3C
Field Samples #1, #2, #3 taken in North Dakota from 3 Chinese Suppliers
Bottom Row Represents Whole Pellet Cross Sections
Production & EUR Loss
due to Poor Quality:
•
Irregular Size &
Shape reducing
flowrates
•
Rough Surface
reducing flowrates
•
High Internal Porosity
leads to Low
Strength & Crushing
as Closure Stress
Increases
•
All lead to Reduced
Frac Conductivity |
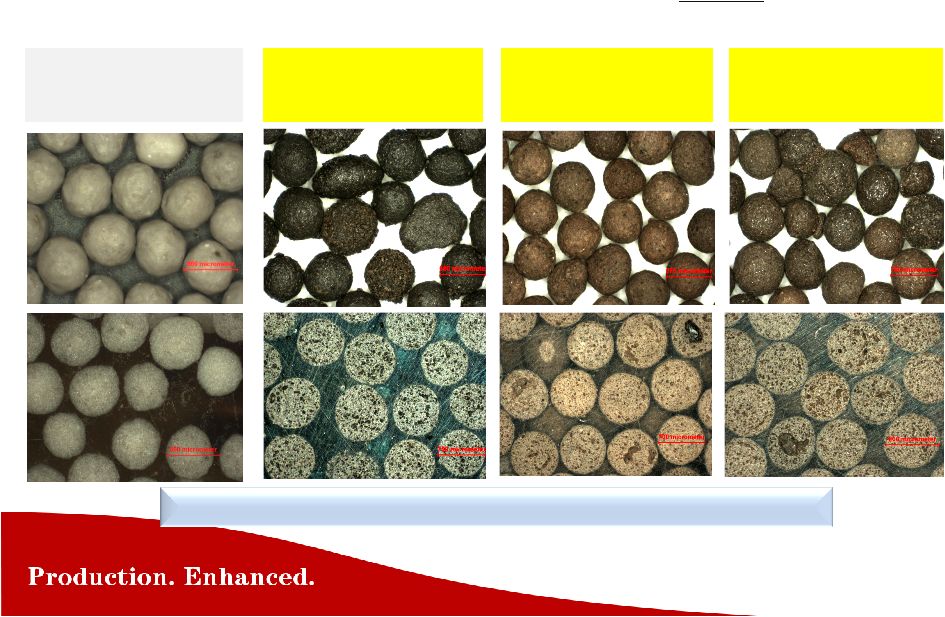
 CARBO vs Low
Quality Chinese Ceramic Chinese 20/40
IDC # 1C
CARBOLITE
20/40
Chinese 20/40
IDC # 2C
Chinese 20/40
IDC # 3C
Bottom Row Represents Whole Pellet Cross Sections
Field Samples #1, #2, #3 taken in North Dakota from 3 Chinese Suppliers
Comparison of three field samples from North Dakota from low quality, low
Conductivity
Chinese
ceramic
proppant
suppliers,
compared
to
CARBOLITE
: |
 CARBO vs Low
Quality Chinese Ceramic Chinese 20/40
IDC # 4C
CARBOLITE
20/40
Chinese 20/40
IDC # 5C
Chinese 20/40
IDC # 6C
Three
more
field
samples
of
low
quality,
low
Conductivity
Chinese
ceramic
proppant
suppliers,
compared
to
CARBOLITE
:
Bottom Row Represents Whole Pellet Cross Sections
Field Samples #4, #5, #6 taken in North Dakota from 3 more Chinese Suppliers
|
 CARBO vs
Brazilian & Russian Ceramic Brazilian 20/40
LDC # B1
CARBOLITE
20/40
Two Brazilian
& one Russian
field samples of low quality, low Conductivity
lightweight
ceramic
proppant
suppliers,
compared
to
CARBOLITE
:
Bottom Row Represents Whole Pellet Cross Sections
Field Samples #B1 taken in South Texas;
#B2, #R1 taken in North Dakota
Brazilian 20/40
LDC # B2
Russian 20/40
LDC # R1 |
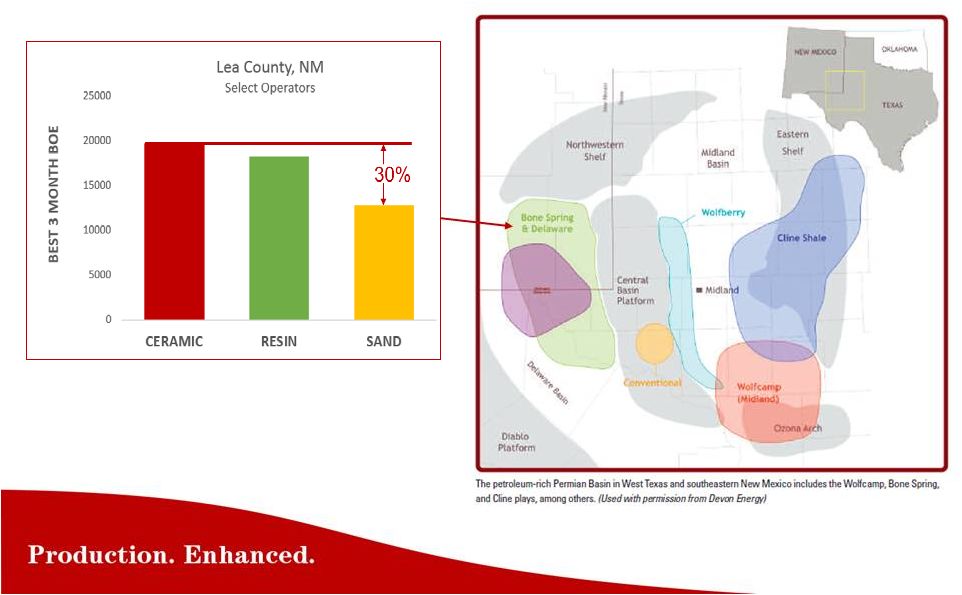
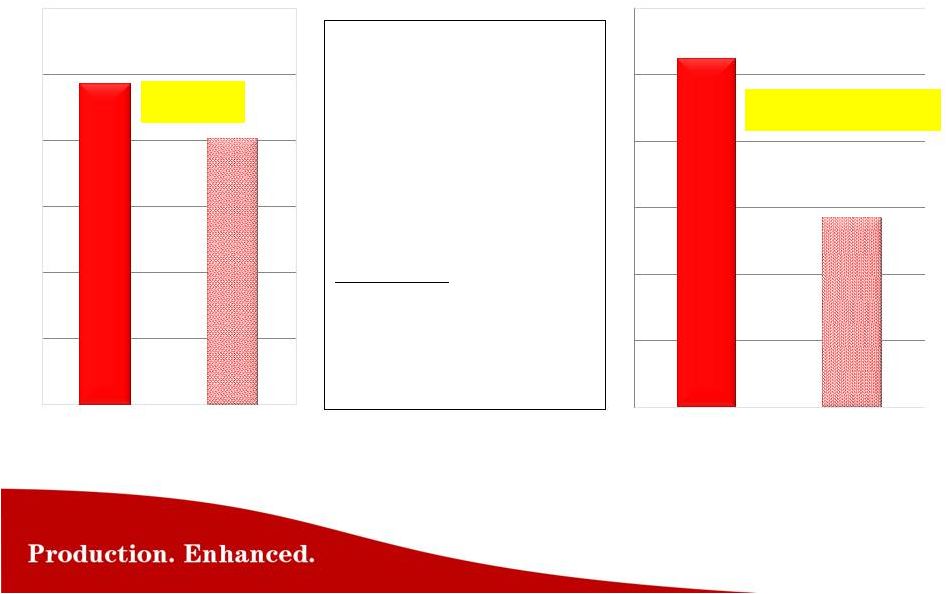 21
+20%
Bakken Operator
CARBO
vs Chinese
+120,000 bbl
30 Day Cum Oil
*EUR
*Operator projected EUR
6 wells with
CARBOECONOPROP low density
ceramic (LDC) 4 wells with Chinese
intermediate density
ceramic (IDC)
Frac Design
(per well)
~ 24 stages
~ 3 million lbs
Average
ECONOPROP
Average
Chinese
IDC
Average
ECONOPROP
Average
Chinese IDC |
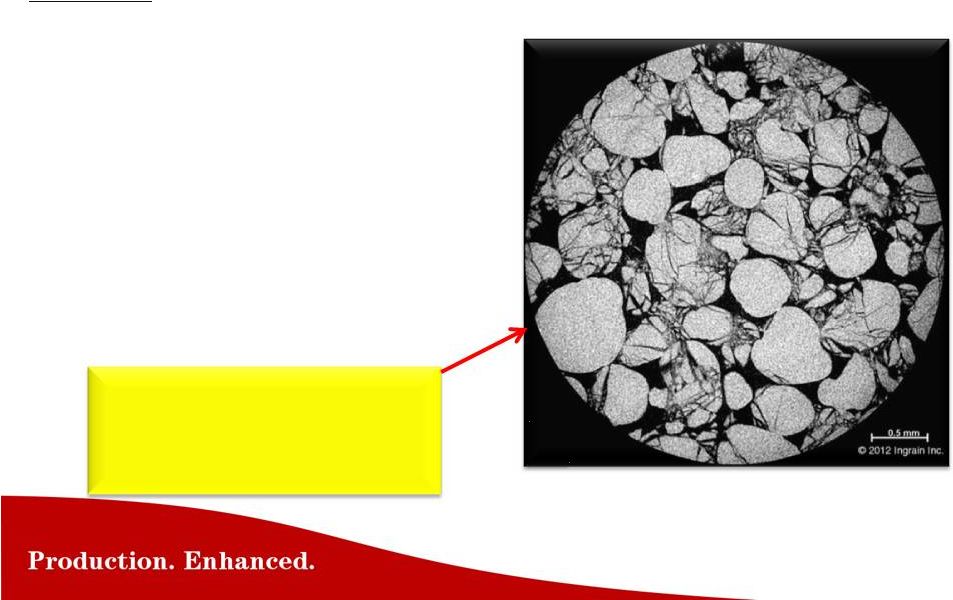 Effects of
Pressure and Temperature on Sand
Northern White Sand 20/40
Sand Crushes into fine particles
Conductivity = only 215 md-ft
Conditions:
•
Loss of frac width
•
Particles plug flow channels
•
Leads to loss of Conductivity
•
9,000
psi,
250 F
•
Flowing 2% KCL for 30 days
•
Cross sections of Proppant pack shown
•
At 9,000 psi, the Sand experienced
severe crushing and the conductivity
was only 215 md-ft
x
y |
 Effects of
Sand Crushing at Higher Pressure W
frac
Less W
frac
White Sand
@6,000 psi stress
White Sand
@12,000 psi stress
Crushing reduces frac width and the “Space to Flow”
….most wells are conductivity limited with Sand |
 Ceramic vs Sand
- Realistic* Conductivity
(20/40 mesh) Bakken Stress
Range Eagle Ford Stress Range
*Reduced
Baseline
conductivity
by
60%
for
the
effects
of
non-darcy flow, multi-phase flow, gel damage, etc.
Md-ft
Md-ft
Closure Stress (psi)
Haynesville Stress Range
0
500
1,000
1,500
2,000
2,500
3,000
3,500
0
500
1,000
1,500
2,000
2,500
3,000
3,500
6,000
8,000
10,000
12,000
14,000
Ceramic -
CARBOLITE
Sand -
White |
 “Over 150
SPE papers have been written documenting the benefits of increased
conductivity on well Production and EUR.
Generally, the payout on the additional
Proppant
investment
is
less
than
2
-
6
months,
and increases Production and EUR in a range of
20% to 100%.”
Case Histories |
 Ceramic
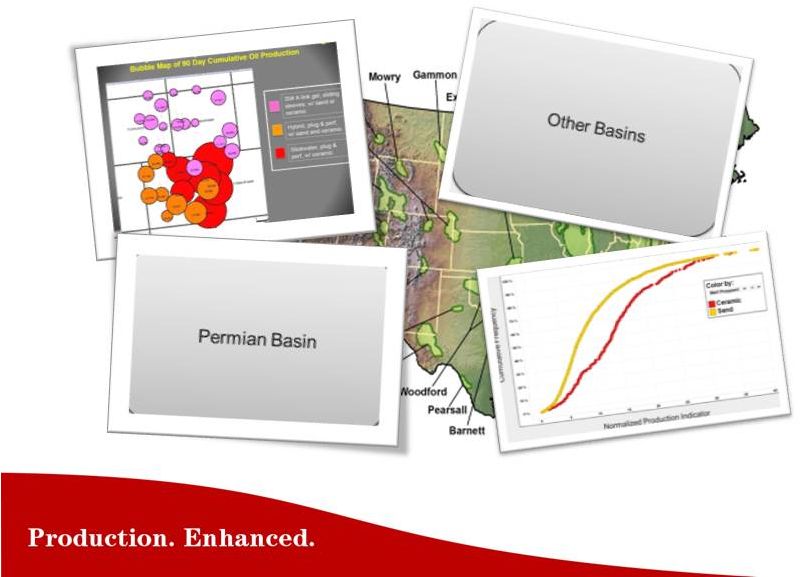
Success Grows Into Key Basins |
 50,000’
view
1,000’
view
Ground view
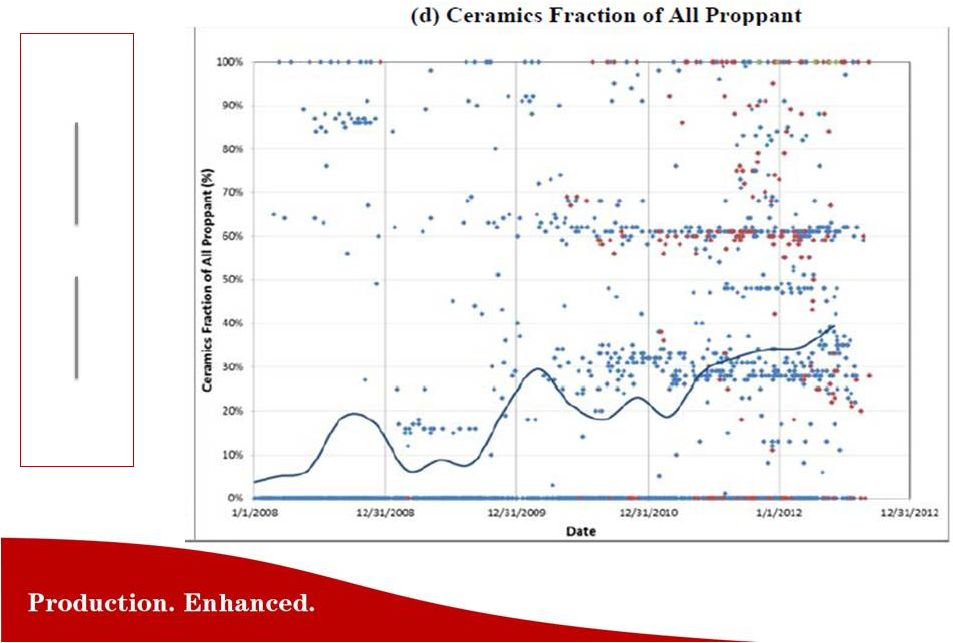
Bakken
Ceramic
Proppant
Growth
Continues
SPE Paper 163827–
Liberty Resources |
 SPE
Paper
163827–
Liberty
Resources
Feb 2013 @ SPE Hydraulic Fracturing Conference by Dr M. Pearson
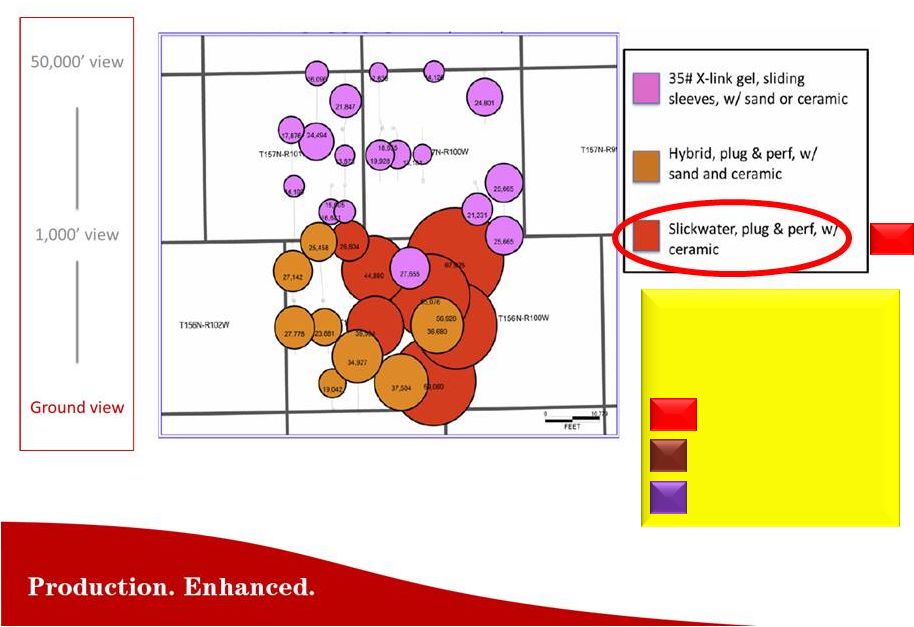
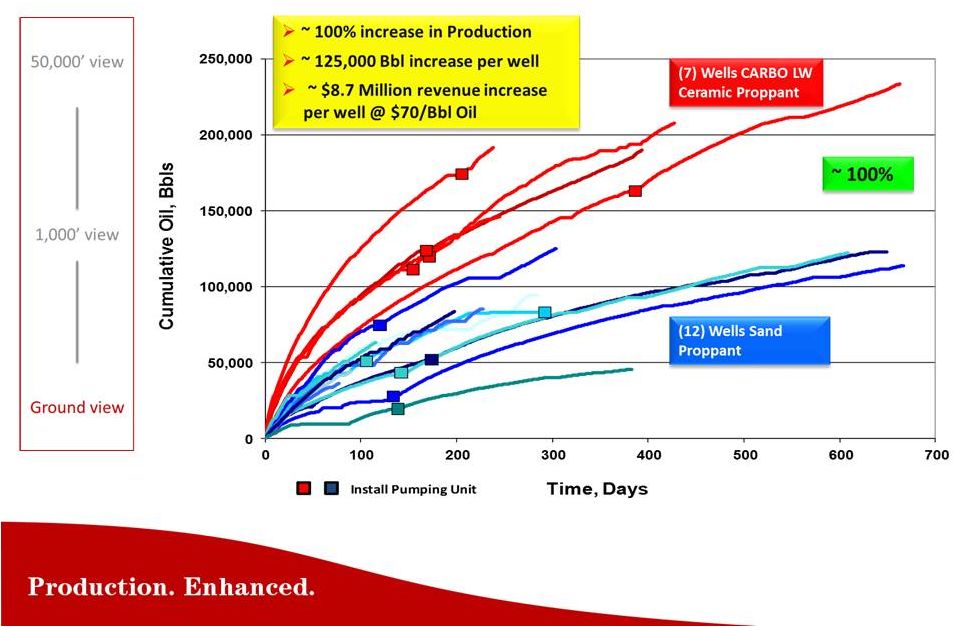
37 Wells from Williams County
90 Day Production Bubble-Plot
Liberty
Resources
wells
(RED)
49,100 BBLs
29,100 BBLs
19,100 BBls
LR
LR
Bakken ( Liberty Resources )
outperform
offset
wells |
 Bakken (
Statoil / Brigham Exploration ) SPE
Paper
134595
&
146376
–
Brigham
Exp/Statoil |
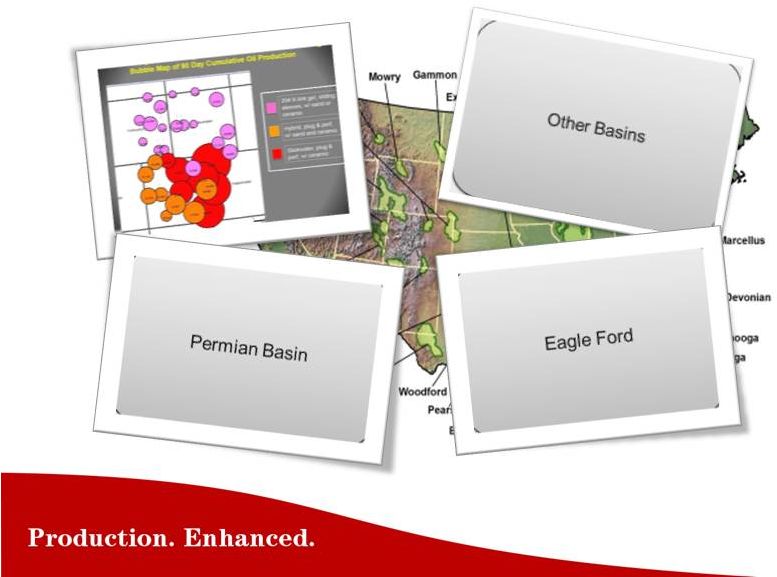 Ceramic
Success Grows Into Key Basins |
 50,000’
view
1,000’
view
Ground view
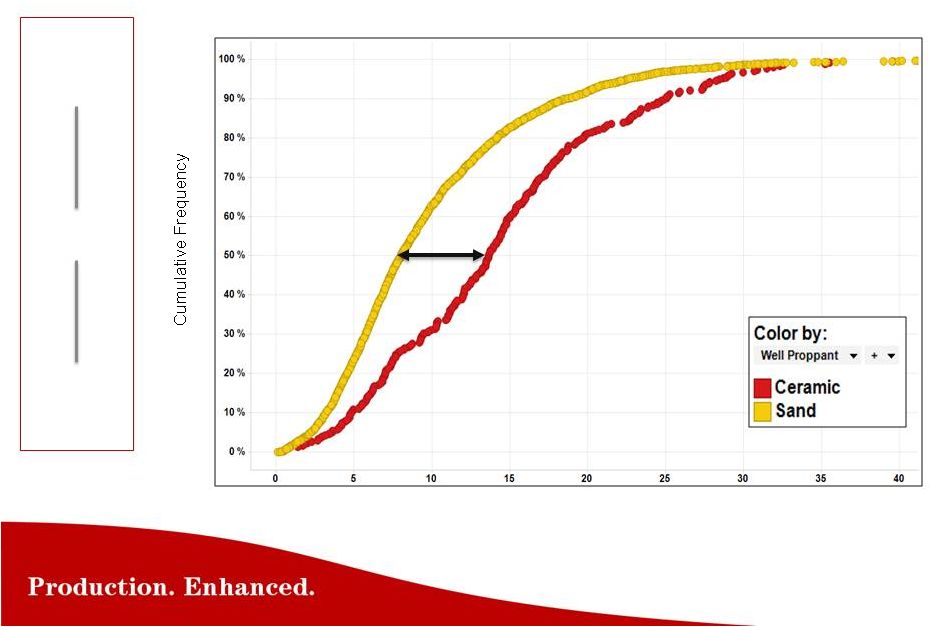
Eagle Ford (4,000 wells*)
* Public data : Unknown proppant type not included
in analysis: Ceramic proppant verified through
internal CARBO data
*NPI = Best 3 Months Production/Perforated Lateral Length = BOE/Ft
(BOE/Ft)
Ceramic completions offer a
20% -
60% improvement
Normalized Production Indicator* |
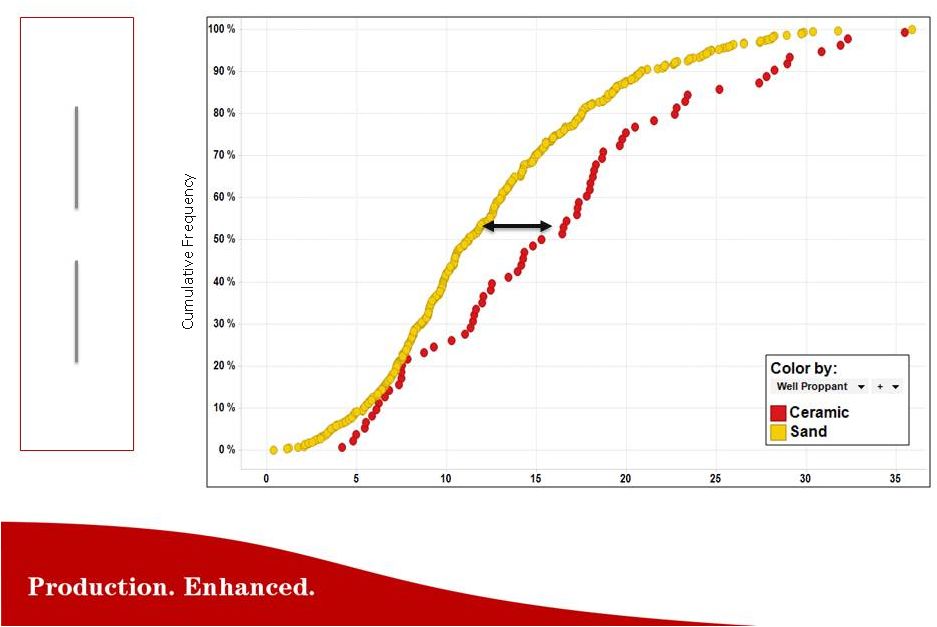 Karnes County
(600 wells*) 50,000’
view
1,000’
view
Ground view
* Public data : Unknown proppant type not
included in analysis: Ceramic proppant verified
through internal CARBO data
Normalized Production Indicator
*NPI = Best 3 Months Production/Perforated Lateral Length = BOE/Ft
(BOE/Ft)
Ceramic completions offer a
20% -
40% improvement |
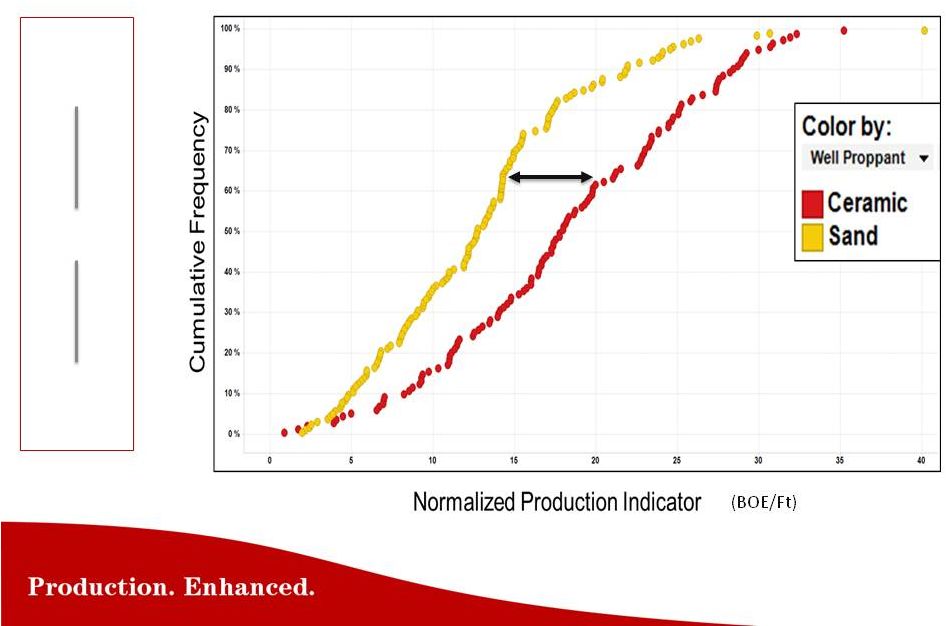 Karnes County
Operator (300* wells) 50,000’
view
1,000’
view
Ground view
* Public data : Unknown proppant type not included
in analysis: Ceramic proppant verified through
internal CARBO data
*NPI = Best 3 Months Production/Perforated Lateral Length = BOE/Ft
(BOE/Ft)
Ceramic
completions offer
a 30% -
50%
improvement |
 Ceramic
Success Grows Into Key Basins |
 Permian Basin
Bone Spring * Public data : Unknown proppant type not included
in analysis: Ceramic proppant verified through
internal CARBO data |
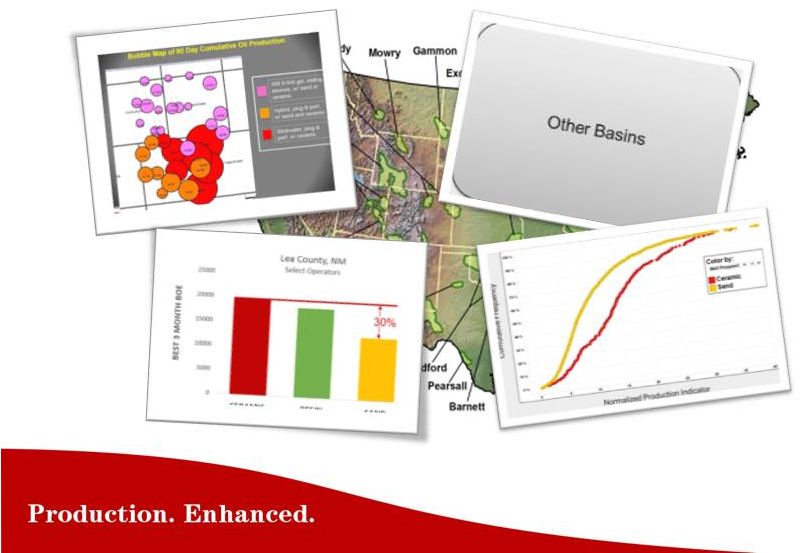 Ceramic
Success Grows Into Key Basins |
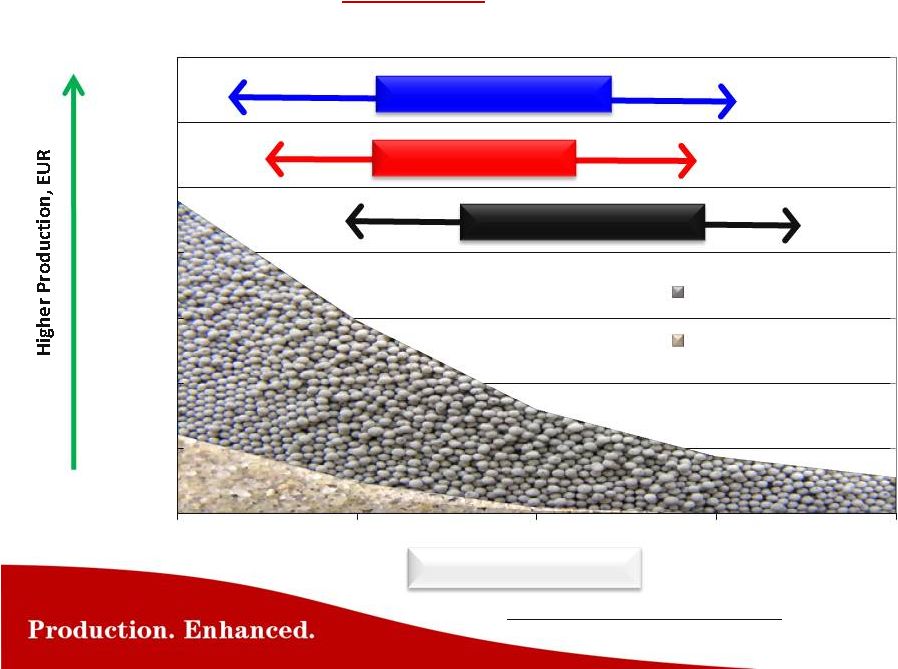
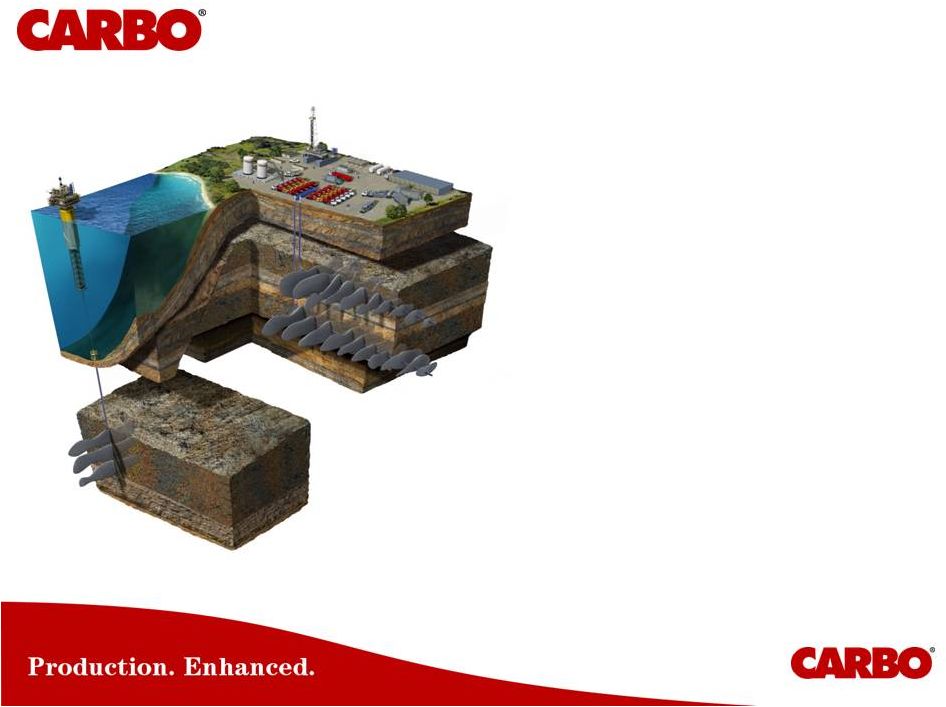
 How to
Increase the Recovery Factor •
In horizontal wells in resource plays, there are two critical factors
that determine the level of economic success
1.) Creating large reservoir contact area, through multiple, transverse frac stages
2.) Building
high
conductivity,
durable
fracs
with
a
“life-of-the-well”
flow
channel
•
The majority of fracs today are complex (non-planar), and
conductivity limited……….they need more conductivity
•
Total F&D costs could be reduced by drilling a smaller number of
effectively stimulated wells……….versus drilling more infill wells
on smaller spacing
Proved by well testing, limited effective drainage areas, refracs, lab testing of proppants,
infill drilling
High pressure losses within the frac caused by limited conductivity, constricts
Production |
 Page
2-19 |
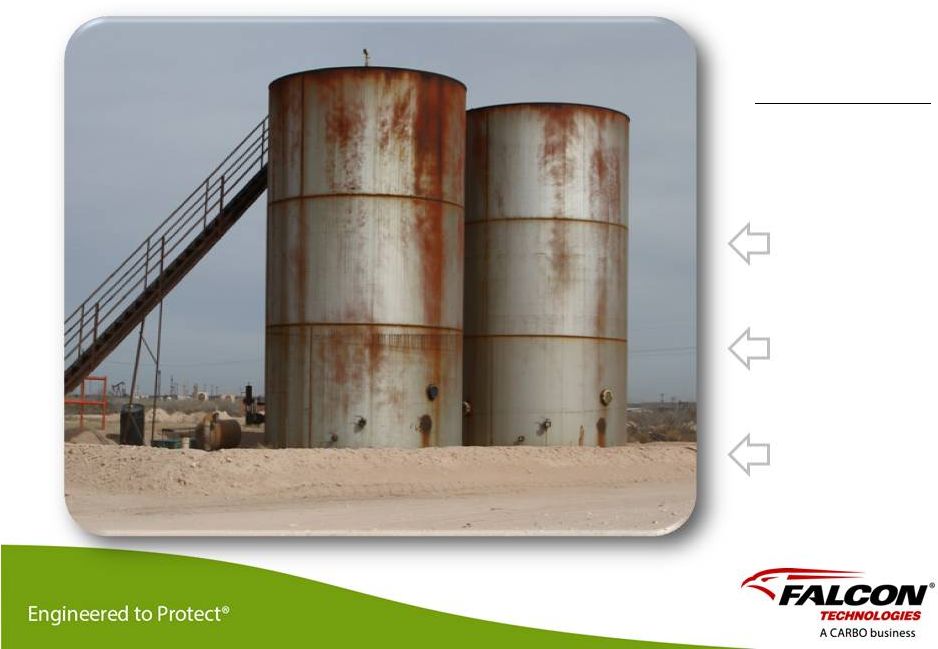 We take
customers from high risk containments Un-lined,
permeable dirt
berm
Tanks sitting on
pea gravel &
corroding
Un-lined tanks
corroding inside
& outside
High risk for spills
& higher LOE: |
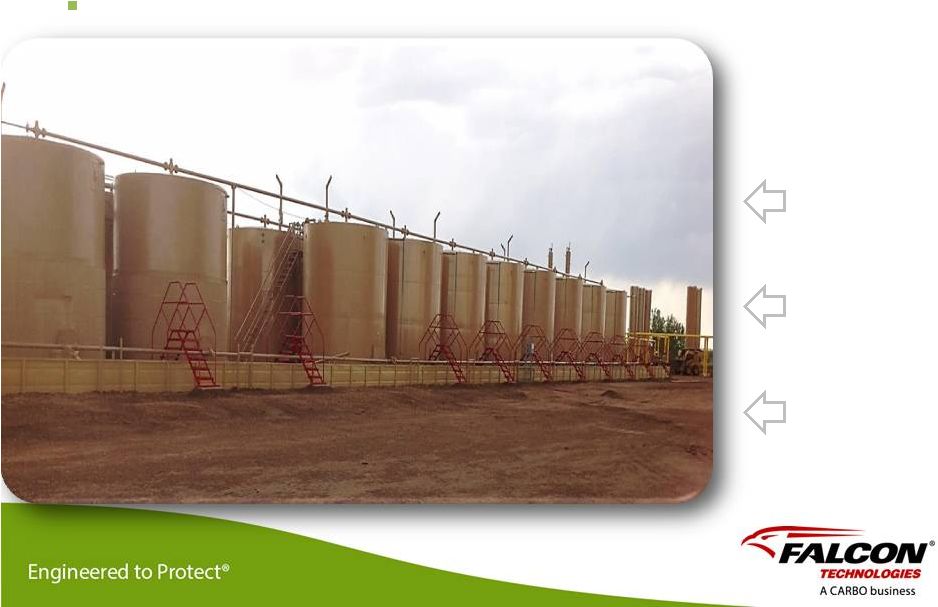 To
industry-leading environmental protection Lined
containment,
impermeable
Tank bases
prevent
corrosion
Lined tanks,
prevents
corrosion
Minimize risk
for spills &
lower LOE:
More than 6,000 installations, with 100% environmental success |
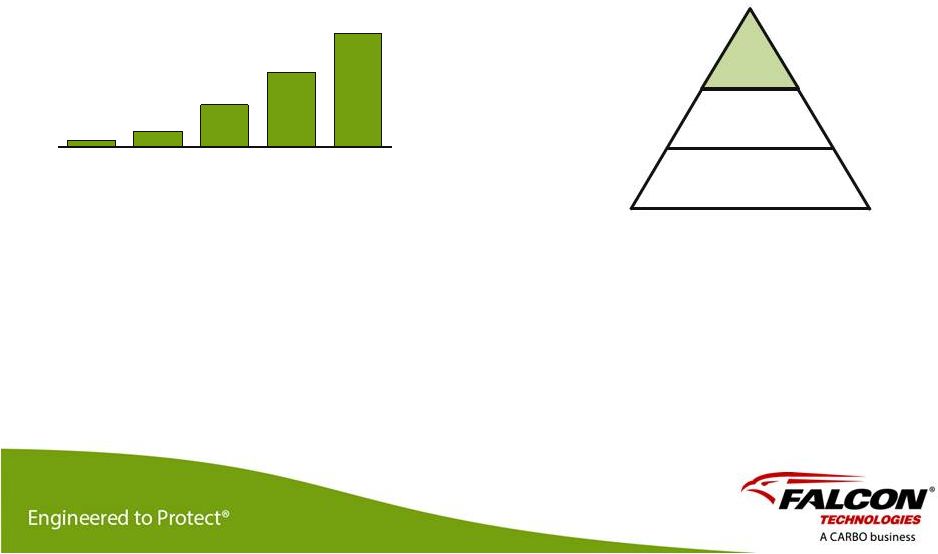 Client Base is
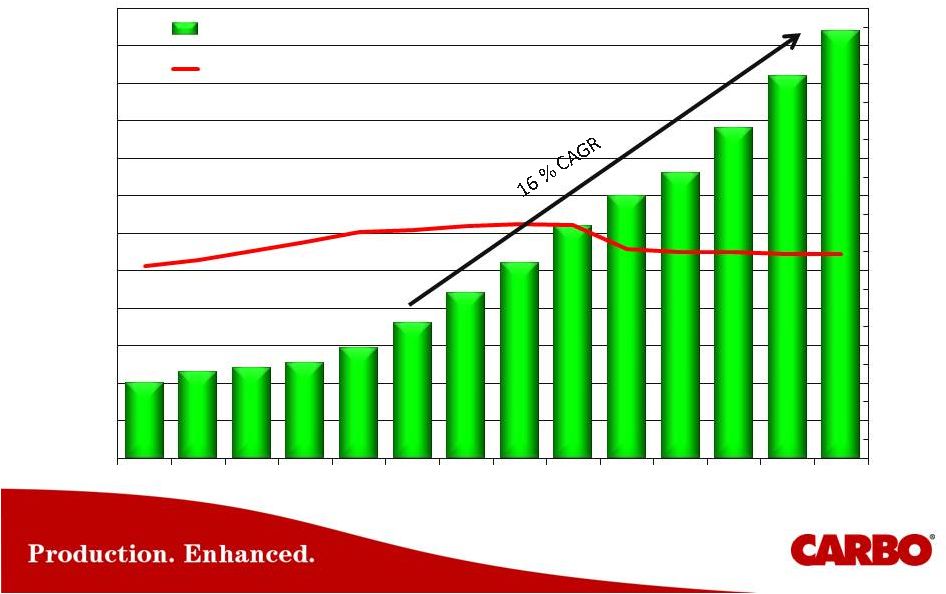
Growing & Market will Change Market Segments
Polymer
Coatings
HDPE
Liners
Dirt Berm
Client Growth, 2009-2013
2010
2012
2011
2009
2013
11
25
68
119
178
We believe the industry and the regulatory
bodies will continue to gain awareness of
the high environmental spill risks associated
with dirt berms and HDPE (plastic)
containments
•
Dirt Berms will likely continue to
be
“regulated”
out
We continue to push growth through:
•
Environmental Stewardship message
•
Business Risk Reduction message
•
Geographic Expansion
•
New Products
Falcon |
 Finance
|
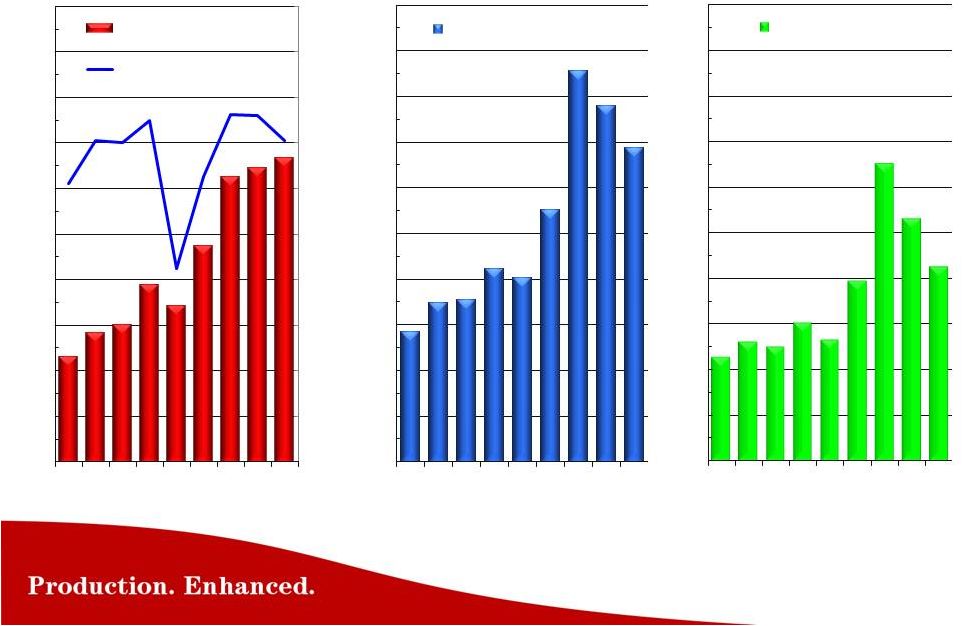 CARBO
Financials * Cash from operations is equal to net
income plus depreciation and
amortization and non-cash stock
compensation
231
284
300
388
342
473
626
646
667
0
300
600
900
1,200
1,500
1,800
2,100
2,400
2,700
3,000
$0
$100
$200
$300
$400
$500
$600
$700
$800
$900
$1,000
05
06
07
08
09
10
11
12
13
Revenue $M
NAM Total Rigcount
57
70
71
84
80
110
171
156
138
$0
$20
$40
$60
$80
$100
$120
$140
$160
$180
$200
05
06
07
08
09
10
11
12
13
Cash From Operations $M
45
52
50
60
53
79
130
106
85
$0
$20
$40
$60
$80
$100
$120
$140
$160
$180
$200
05
06
07
08
09
10
11
12
13
Net Income $M |
 CARBO
Financials Cash Flow Per Share = Cash from operations
(= net income plus depreciation and
amortization and non-cash stock based
compensation)/diluted shares
1.88
2.14
2.02
2.46
2.27
3.40
5.62
4.59
3.67
$0.00
$1.00
$2.00
$3.00
$4.00
$5.00
$6.00
$7.00
$8.00
$9.00
05
06
07
08
09
10
11
12
13
Earnings Per Share
231
284
300
388
342
473
626
646
667
$0
$100
$200
$300
$400
$500
$600
$700
$800
$900
05
06
07
08
09
10
11
12
13
Revenue $M
2.33
2.88
2.91
3.57
3.47
4.80
7.43
6.80
6.02
$0.00
$1.00
$2.00
$3.00
$4.00
$5.00
$6.00
$7.00
$8.00
$9.00
05
06
07
08
09
10
11
12
13
Cash Flow Per Share |
 Dividends
Increased - 13 Years
$ Per Share
Shares -
Millions
$0.20
$0.23
$0.24
$0.25
$0.29
$0.36
$0.44
$0.52
$0.62
$0.70
$0.76
$0.88
$1.02
$1.14
12
14
16
18
20
22
24
26
28
30
32
34
36
$0.00
$0.10
$0.20
$0.30
$0.40
$0.50
$0.60
$0.70
$0.80
$0.90
$1.00
$1.10
$1.20
00
01
02
03
04
05
06
07
08
09
10
11
12
13
Dividend Amount Paid Per Share Per Year
Shares Outstanding |
 Industry Factors
First Quarter of 2014
Activity quarter-to-date impacted by harsh weather conditions in the Bakken
and northern regions of NAM.
Railroads’
operational
issues
and
congestion
have
severely
impacted
the
distribution of Proppant
Fracturing well-site activity has been negatively impacted by the cold
weather
Anticipate ceramic proppant volumes will be somewhat below fourth
quarter 2013 ceramic proppant volumes
We remain positive on activity levels and our ceramic proppant demand for
Q2 and the balance of the year
Full Year 2014 |
 Create value by
lowering E&P Operators F&D costs and increasing the Recovery Factor
Differentiate by continuing to develop industry leading technology
Grow our client’s knowledge of
CARBO
as the leading Production
Enhancement company focused on fracs, with technologies that make oil
& gas wells produce better and increase recovery (EUR)
Stress to E&P the investment benefits of making informed decisions on
Design-Build-Optimize
Fracs,
that
strikes
a
balance
of
EUR
with
AFE
Grow Falcon Technologies through product development to address
industry environmental needs, and geographical expansion.
Continue to grow cashflow and build an enduring Company
Summary |
 ....provides
industry leading technology for Production Enhancement and Environmental Services
Howard
Weil
42
nd
Annual
Energy
Conference
New Orleans, Louisiana
March 25, 2014 |
 Cash Flow
from Operations Reconciliation $ in 000s
Results from Continuing Operations
2005
2006
2007
2008
2009
2010
2011
2012
2013
Net Income
45,463
$
52,245
$
49,641
$
60,405
$
52,810
$
78,716
$
130,136
$
105,933
$
84,886
$
Plus: depreciation and amortization
10,935
15,630
19,895
24,638
24,905
27,728
36,015
44,893
47,472
Plus: non-cash stock compensation
-
2,311
1,709
2,052
2,571
3,812
4,719
5,335
5,837
Cash Flow from Continuing Operations
56,398
$
70,186
$
71,245
$
87,095
$
80,286
$
110,256
$
170,870
$
156,161
$
138,195
$
Weighted Average Shares Oustanding
24,177
24,400
24,451
24,418
23,112
22,977
23,012
22,969
22,957
Cash Flow Per Share
2.33
$
2.88
$
2.91
$
3.57
$
3.47
$
4.80
$
7.43
$
6.80
$
6.02
$
For The Years Ended Dec 31
Cash from operations is equal to net income plus depreciation and amortization and non-cash
stock compensation |