Attached files
| file | filename |
|---|---|
| EXCEL - IDEA: XBRL DOCUMENT - NiMin Energy Corp. | Financial_Report.xls |
| EX-32.1 - EX-32.1 - NiMin Energy Corp. | d675158dex321.htm |
| EX-31.1 - EX-31.1 - NiMin Energy Corp. | d675158dex311.htm |
| EX-31.2 - EX-31.2 - NiMin Energy Corp. | d675158dex312.htm |
Table of Contents
UNITED STATES
SECURITIES AND EXCHANGE COMMISSION
Washington, D.C. 20549
FORM 10-K
ANNUAL REPORT PURSUANT TO SECTION 13 OR 15(d) OF THE
SECURITIES EXCHANGE ACT OF 1934
For the fiscal year ended December 31, 2013
Commission file number: 000-54162

(Exact name of registrant as specified in its charter)
| Canada | 61-1606563 | |
| (State or other jurisdiction of incorporation or organization) |
(I.R.S. Employer Identification No.) | |
| 1160 Eugenia Place, Suite 100, Carpinteria, California USA 93013 |
Tel: 805.566.2900 Fax: 805.566.2917 | |
| (Address of principal executive offices) | (Registrant’s telephone number, including area code) | |
Securities registered or to be registered pursuant to Section 12(b) of the Act.
| Title of each class |
Name of each exchange on which registered | |
| N/A | N/A |
Securities registered or to be registered pursuant to Section 12(g) of the Act.
| Title of each class |
| Common Shares, no par value |
Indicate by check mark if the registrant is a well-known seasoned issuer, as defined in Rule 405 of the Securities Act. ¨ Yes x No
Indicate by check mark if the registrant is not required to file reports pursuant to Section 13 or 15(d) of the Securities Exchange Act of 1934. ¨ Yes x No
Indicate by check mark whether the registrant (1) has filed all reports required to be filed by Section 13 or 15(d) of the Securities Exchange Act of 1934 during the preceding 12 months (or for such shorter period that the registrant was required to file such reports), and (2) has been subject to such filing requirements for the past 90 days. x Yes ¨ No
Indicate by check mark whether the registrant has submitted electronically and posted on its corporate web site, if any, every Interactive Data File required to be submitted and posted pursuant to Rule 405 of Regulation S-T (§232.405 of this chapter) during the preceding 12 months (or for such shorter period that the registrant was required to submit and post such files). ¨ Yes ¨ No
Indicate by check mark if disclosure of delinquent filers pursuant to Item 405 of Regulation S-K is not contained herein, and will not be contained, to the best of the registrant’s knowledge, in definitive proxy or information statements incorporated by reference on Part III of this Form 10-K or any amendment to this Form10-K. x
Indicate by check mark whether the registrant is a large accelerated filer, an accelerated filer, or a non-accelerated filer. See definition of “accelerated filer and large accelerated filer” in Rule 12b-2 of the Exchange Act. (Check one):
| Large accelerated filer ¨ | Accelerated filer ¨ | Non-accelerated filer x |
Indicate by check mark whether the registrant is a shell company (as defined in Rule 12b-2 of the Exchange Act). ¨ Yes x No
The aggregate market value of the voting and non-voting common equity held by non-affiliates as of December 31, 2013, based on the closing sales price of the Common Shares on the NEX of Cdn$0.07 per Common Share was Cdn$4,888,408.
The number of Common Shares, without par value, outstanding on March 24, 2014, was 69,834,396.
Table of Contents
NIMIN ENERGY CORP.
FORM 10-K ANNUAL REPORT
| Page | ||||||
| Introduction | 3 | |||||
| Glossary of Terms | 4 | |||||
| PART I | ||||||
| Items 1. | Business | 7 | ||||
| Item 1A. | Risk Factors | 9 | ||||
| Item 1B. | Unresolved Staff Comments | 9 | ||||
| Item 2. | Properties | 9 | ||||
| Item 3. | Legal Proceedings | 9 | ||||
| Item 4. | Mine Safety Disclosure | 9 | ||||
| PART II | ||||||
| Item 5. | Market for Registrant’s Common Equity, Related Stockholder Matters and Issuer Purchases of Equity Securities | 10 | ||||
| Item 6. | Selected Financial Data | 12 | ||||
| Item 7. | Management Discussion and Analysis of Financial Condition and Results of Operation | 15 | ||||
| Item 8. | Financial Statements and Supplementary Data | 23 | ||||
| Item 9. | Controls and Procedures | 24 | ||||
| PART III | ||||||
| Item 10. | Directors, Executive Officers and Corporate Governance | 25 | ||||
| Item 11. | Executive Compensation | 31 | ||||
| Item 12. | Security Ownership of Certain Beneficial Owners and Management and Related Stockholders Matters | 42 | ||||
| Item 13. | Certain Relationships and Related Transactions, and Director Independence | 43 | ||||
| Item 14. | Principal Accountant Fees and Services | 44 | ||||
| PART IV | ||||||
| Item 15. | Exhibits and Financial Statement Schedules | 45 | ||||
| Signatures | 48 | |||||
2
Table of Contents
Note Regarding Forward-Looking Information
This Annual Report on Form 10-K contains certain forward-looking information, which is based upon the current internal expectations, estimates, projections, assumptions and beliefs of NiMin, as of the date of such statements or information. Words such as “plan,” “expect,” “project,” “intend,” “believe,” “anticipate,” “estimate,” “may,” “will,” “potential,” “proposed,” and other similar words, or statements that certain events or conditions “may” or “will” occur, are intended to identify forward-looking information. These statements are not guarantees of future performance and involve known and unknown risks, uncertainties and other factors that may cause actual results or events to differ materially from those anticipated in the forward-looking information. By its nature, forward-looking information involves numerous assumptions, known and unknown risks and uncertainties, both general and specific, that contribute to the possibility that the predictions, forecasts, projections and other forward-looking information will not occur. Such forward-looking information in this Annual Report speaks only as of the date of this Annual Report.
Although NiMin believes that the expectations reflected in the forward-looking information are reasonable, there can be no assurance that such expectations will prove to be correct. NiMin cannot guarantee future results, levels of activity, performance or achievements.
Statements made in this Report regarding the payment of additional liquidating distributions and of the timing of the dissolution are forward-looking statements. Such forward-looking statements are subject to a number of risks and uncertainties, and there can be no assurance that the expectations reflected in those statements will be realized or achieved. Such risks and uncertainties include, without limitation, possible contingent liabilities and other obligations arising from the sale of the Company’s properties and previous operation of its business; and risks associated with the liquidation and dissolution of the Company, including, without limitation, settlement of the Company’s liabilities and the actual timing of the liquidating distributions and dissolution.
The above summary of assumptions and risks related to forward-looking information has been provided in this Annual Report in order to provide readers with a more complete perspective on the future operations of the Company. Readers are cautioned that this information may not be appropriate for other purposes. The forward-looking information contained in this Annual Report is expressly qualified by the cautionary statements provided for herein. NiMin is not under any duty to update any of the forward-looking information after the date of this Annual Report or to conform such statements or information to actual results or to changes in the expectations of NiMin except as otherwise required by applicable laws.
3
Table of Contents
In this document, unless the context otherwise requires, the following terms shall have the meanings set out below:
“Board” means the board of directors of NiMin.
“Cdn$” means Canadian dollars, the lawful currency of Canada.
“CMD” means Combined Miscible Drive for Heavy Oil Production, NiMin’s patented process for the extraction of heavy oil.
“Code” means the United States Internal Revenue Code of 1986, as amended.
“Common Shares” means the common stock in the capital of the Company subsequent to the completion of the Consolidation.
“Common Stock” means shares of common stock in the capital of Legacy.
“Computershare” means Computershare Trust Company of Canada.
“Consolidation” means the consolidation of common stock of NiMin based on the Consolidation Ratio.
“DD&A” means depreciation, depletion, amortization and accretion expense.
“Exchange Act” means the Securities Exchange Act of 1934, as amended.
“G&A” means general and administrative expenses.
“Legacy” means Legacy Energy, Inc.
“Lender” means CLMG Corp., an administrative agent, and Beal Bank Nevada, as lender, under the Senior Loan.
“MD&A” means the Management Discussion and Analysis and Analysis of Financial Condition and Results of Operation included in this Annual Report as Item 7.
“NI 52-110” means National Instrument 52-110 – Audit Committees, of the Canadian Securities Administrators.
“NiMin” or the “Company” means NiMin Energy Corp.
“OTC-BB” means the electronic quotation system operated by the Financial Industry Regulatory Authority, Inc. in the United States.
“OTCQX” means the electronic quotation system operated by OTC Markets Group, Inc. in the United States.
“Person” includes an individual, partnership, association, body corporate, trustee, executor, administrator or legal representative.
“PLC” means private lending company.
“Preferred Shares” means the preferred shares in the capital of NiMin.
“Private Placement” means the private placement completed in September 1, 2011, in respect to the offering of Units.
“Regulation S” means Regulation S under the U.S. Securities Act.
“Registration Statement” means the registration statement on Form 20-F filed with the U.S Securities and Exchange Commission pursuant to section 12 (d) or (g) of the Securities Exchange Act of 1934 to register securities of foreign issuers.
4
Table of Contents
“SEDAR” means the System for Electronic Document Analysis and Retrieval in Canada.
“SEC” means the U.S Securities and Exchange Commission.
“Senior Loan” means the credit agreement entered into on June 30, 2010, between Legacy and the Lender.
“Texas Capital” means Texas Capital Bank, N.A.
“Texas Credit Agreement” means the credit agreement entered into between Legacy and Texas Capital, pursuant to which Texas Capital agreed to provide up to $50 million in loans to Legacy for use in connection with the development of Legacy’s oil and natural gas properties.
“TSX” means the Toronto Stock Exchange.
“TSXV” means the TSX Venture Exchange Inc.
“U.S. Person” has the meaning ascribed thereto under Regulation S of the U.S. Securities Act.
“U.S. Securities Act” means the United States Securities Act of 1933, as amended.
“Unit” means one unit of NiMin, comprised of one Unit Share and one Warrant.
“Unit Share” means one Common Share issued as part of a Unit.
“Warrant” means one Common Share purchase warrant of the Company, which, together with one Unit Share, comprises a Unit.
“Wyoming Assets” means the fields located in the state of Wyoming which the Company previously held a 97% weighted average working interest and was the operator from December 2009 – June 2012.
5
Table of Contents
ABBREVIATIONS
| Crude Oil and Natural Gas Liquids |
Natural Gas | |||||||
| Bbl | barrel | Mcf | thousand cubic feet | |||||
| boe | barrels of oil equivalent of natural gas and crude oil, unless otherwise indicated | |||||||
Production information is commonly reported in units of barrel of oil equivalent. A boe conversion ratio of 6 Mcf: 1 Bbl is based on an energy equivalency conversion method primarily applicable at the burner tip and does not represent a value equivalency at the wellhead. For purposes of calculating mixed company production, natural gas has been converted to a barrel of oil equivalent using a conversion rate of six thousand cubic feet being equal to one barrel of oil (6 Mcf: 1Bbl).
GLOSSARY OF TECHNICAL TERMS
| WTI | West Texas Intermediate, also known as Texas Light Sweet – a type of light crude oil used as a benchmark in oil pricing |
Financial and Other Information
In this Annual Report, unless otherwise specified, all dollar amounts are expressed in US Dollars (“$”). In this Annual Report, when we provide information as of the date of this Annual Report, we mean as of March 24, 2014.
6
Table of Contents
| ITEMS 1. | BUSINESS |
NiMin Energy Corp. (“NiMin,” “we” or the “Company”) was an oil and gas company engaged in the acquisition, development and production of oil and gas properties in the United States until June 30, 2012, when we ceased to have oil and gas operations.
The annual and special meeting (the “Special Meeting”) of holders of Common Shares (“Shareholders”) was held on June 26, 2012. At the Special Meeting, in addition to annual items of business, Shareholders were asked to consider and vote on, among other things, special resolutions approving the proposed sale of all or substantially all of the Company’s assets (the “Sale of Assets”) including those assets held by NiMin’s wholly-owned subsidiary, Legacy Energy Inc. (“Legacy”) pursuant to purchase and sale agreements for its Wyoming based oil and gas assets (“Wyoming Assets”) and California, based oil and gas assets (“California Assets”).
At the Special Meeting, the Shareholders were also asked to consider and vote on the voluntary liquidation and dissolution of the Company pursuant to the laws of the Business Corporations Act (Alberta) (the “Winding Up”) and the distribution to Shareholders of the net proceeds of the Sale of Assets (less the settlement of obligations of Legacy), and cash on hand, as part of such liquidation and dissolution after satisfaction of all liabilities of the Company, by way of a reduction of the stated capital of the Common Shares.
Both the Sale of Assets and the Winding Up were approved by the Shareholders at the Special Meeting. In order for the Company to complete the Winding Up, the appropriate corporate steps were required to be taken for the dissolution and liquidation of Legacy which dissolution was filed in Delaware on September 17, 2012. Pursuant to the approval of the Sale of Assets, Legacy proceeded with the sale of the Wyoming Assets and the California Assets, as more particularly described below.
On June 28, 2012, Legacy completed its previously announced sale of its Wyoming Assets to BreitBurn Operating L.P., a wholly-owned subsidiary of BreitBurn Energy Partners L.P. (“BreitBurn”), for total cash consideration of approximately $93 million, being the original purchase price of approximately $98 million less approximately $5 million adjusted to account for preliminary purchase price adjustments. On August 30, 2012, Legacy completed its final settlement with BreitBurn and received approximately $2.3 million based on the final purchase price adjustments.
On June 29, 2012, Legacy completed its previously announced sale of its California Assets to Southern San Joaquin Production, LLC, for total cash consideration of approximately $26 million, being the original purchase price of approximately $27 million, less approximately $1 million, adjusted to account for preliminary purchase price adjustments. Pursuant to the terms of the purchase and sale agreement, $3 million of the $26 million purchase price paid on closing was deposited with an escrow agent until December 28, 2012, in connection with various indemnities contained therein. On August 30, 2012, Legacy completed its final settlement with Southern San Joaquin Production LLC and received $347,938 based on the final purchase price adjustments. On December 28, 2012, the $3 million was released to NiMin from the escrow account.
The Winding Up and the dissolution and liquidation of Legacy contemplates the orderly disposition of the assets, the orderly discharge of all outstanding liabilities, including all outstanding debt, and after the establishment of appropriate reserves, the distribution of cash to Shareholders in installments.
On September 24, 2012, the Board declared an initial distribution to Shareholders of $1.01 per Common Share in connection with the Winding Up. The distribution was made as a return of capital to Shareholders of record at the close of business on October 9, 2012, and the stated capital of the Company was reduced accordingly. The distribution of $70,532,740 was paid on October 22, 2012.
On October 10, 2012, Nimin voluntarily delisted the Common Shares from the TSX after the close of trading on October 22, 2012, and its listing was transferred to the NEX, a separate board of the TSX Venture Exchange (“NEX”), effective as of opening of the market on October 23, 2012. From October 23, 2012, and onwards until the time that is on or about the date of dissolution, the Common Shares trade on NEX under the symbol “NNN.H”.
As a result of the Shareholders’ approval of the Winding Up, the liquidation basis of accounting was adopted effective June 30, 2012. This basis of accounting is considered appropriate when, among other things, liquidation of a company is imminent and the net realizable values of assets are reasonably determinable. Under this basis of accounting, assets are valued at their net realizable values and liabilities are stated at their estimated settlement amounts. Further, all costs of liquidation are accrued as of December 31, 2013. Financial information presented as of and subsequent to June 30, 2012, includes a Consolidated Statement of Net Assets and a Consolidated Statement of Changes in Net Assets in Liquidation, as required under the liquidation basis of accounting. Financial information included for periods ending prior to June 30, 2012, is presented under the going concern basis of accounting.
7
Table of Contents
Data for the statement of operations is not presented for 2013 because using the liquidation basis of accounting, net income(loss) is no longer reported.
Effective February 1, 2013, the Legacy Energy Liquidating Trust, a Delaware statutory trust (the “Liquidating Trust”), was established to provide for the transfer of certain assets of Legacy to the Liquidating Trust in order to satisfy any future unknown claims against Legacy following its dissolution and liquidation.
NiMin determined that the appropriate amount to fund the Liquidating Trust to meet unknown claims and the ongoing obligations of the Liquidating Trust was $250,000, which was funded on November 1, 2013. NiMin sold the beneficial ownership interests in the Liquidating Trust along with the patents in the CMD process and rights to an overriding royalty on non-producing properties to Pacific Oil and Gas LLC, a company owned by two directors of NiMin, for aggregate proceeds of $1,000 in order to complete the dissolution and liquidation of NiMin.
Management
Our corporate headquarters are located at 1160 Eugenia Place, Suite 100, Carpinteria, California. As of December 31, 2013, the Company had no employees but has retained five consultants to serve as Chief Executive Officer, Chief Financial Officer, Corporate Controller and two accounting consultants. We also utilized the services of independent contractors to perform various other services.
Available Information
We file or furnish annual, quarterly and current reports, proxy statements and other documents with the SEC under the Exchange Act. The public may read and copy any materials that we file or furnish with the SEC at the SEC’s Public Reference Room at 100 F Street, N.E., Washington, D.C. 20549. The public may obtain information on the operation of the Public Reference Room by calling the SEC at 1-800-SEC-0330. Also, the SEC maintains a website that contains reports, proxy and information statements, and other information regarding issuers, including us, that file or furnish electronically with the SEC. The public can obtain any documents that we file with the SEC at www.sec.gov.
We also make available free of charge through our website, www.niminenergy.com, our Annual Report on Form 10-K, Quarterly Reports on Form 10-Q, Current Reports on Form 8-K and, if applicable, amendments to those reports filed or furnished pursuant to Section 13(a) of the Exchange Act as soon as reasonably practicable after we electronically file such material with, or furnish it to, the SEC.
8
Table of Contents
The amount and timing of the final liquidating distribution to our Shareholders are subject to risks. These risks include those described below and may include additional risks and uncertainties not presently known to us. The amount and timing of the final liquidating distribution to our Shareholders could be materially adversely affected by any of these risks. These risks should be read in conjunction with the other information in this Annual Report.
The final liquidating distribution to Shareholders may be less than we currently estimate. In this Annual Report, we have estimated our net assets in liquidation and our net assets in liquidation per outstanding share, pursuant to requirements for liquidation accounting. These estimates will be affected by factors which may be outside of our control, including unforeseen contingent liabilities arising out of the sale of our properties or the previous conduct of our business and expenses we incur prior to the liquidation and dissolution of the Company. We have accrued for various expenses including professional fees and other costs related to the liquidation, and in the event the Company is not dissolved within the timeframe we have estimated, or if we encounter unforeseen circumstances that increase these fees and costs from our current estimates, the amount available for distribution to Shareholders will be less.
The dissolution of the Company could take longer than we currently anticipate. Before the Company can be dissolved, the Board will need to make provision for the satisfaction of all of the Company’s known and unknown liabilities. If any of these actions take longer than anticipated, the Company’s costs could increase, which would decrease the amount of cash available for distribution, and could delay or limit the Company’s ability to make the final distribution to Shareholders.
| ITEM 1.B. | UNRESOLVED STAFF COMMENTS |
Not applicable.
| ITEM 2. | PROPERTIES |
Following the completion of the sale of our Wyoming Assets and our California Assets, we have no other material oil and gas properties. We currently lease our office space, through the final dissolution of NiMin.
| ITEM 3. | LEGAL PROCEEDINGS |
We are not aware of any claims which could have a material impact to our financial statements, and we do not know of any material proceedings contemplated by governmental authorities. We are not aware of any material proceedings to which any director, officer or any of our affiliates, any owner of record or beneficially of more than five percent of any class of our voting securities, or any associate of any such director, officer, our affiliates, or security holder, is a party adverse to us or our consolidated subsidiary or has a material interest adverse to us or our consolidated subsidiary.
| ITEM 4. | MINE SAFETY DISCLOSURE |
Not applicable.
9
Table of Contents
ITEM 5. MARKET FOR REGISTRANT’S COMMON EQUITY, RELATED STOCKHOLDER MATTERS AND ISSUER PURCHASES OF EQUITY SECURITIES
The Common Shares were listed on the TSX under the trading symbol “NNN” on September 4, 2009, and began trading on September 8, 2009.
The Common Shares were voluntarily delisted from the Toronto Stock Exchange (“TSX”) after the close of trading on October 22, 2012 and its listing was transferred to the NEX, a separate board of the TSX Venture Exchange, effective as of market open on October 23, 2012. From and after October 23, 2012, NiMin’s Common Shares trade on the NEX under the symbol “NNN.H”.
The following table sets forth the reported high and low prices and the trading volume for the Common Shares on the TSX for the prior fiscal year and subsequently on the NEX for the two most recent fiscal years as reported by a public source we consider reliable.
Trading Prices on TSX
| High (Cdn$) | Low (Cdn$) | Volume | ||||||||||
| October 1 to 22, 2012 |
1.09 | 1.06 | 541,056 | |||||||||
| 3rd Quarter 2012 |
1.08 | 0.97 | 18,122,612 | |||||||||
| 2nd Quarter 2012 |
1.05 | 0.75 | 23,183,507 | |||||||||
| 1st Quarter 2012 |
1.04 | 0.63 | 6,806,670 | |||||||||
Trading Prices on NEX
| High (Cdn$) | Low (Cdn$) | Volume | ||||||||||
| 4th Quarter 2013 |
0.08 | 0.06 | 2,234,467 | |||||||||
| 3rd Quarter 2013 |
0.09 | 0.07 | 309,742 | |||||||||
| 2nd Quarter 2013 |
0.11 | 0.07 | 490,228 | |||||||||
| 1st Quarter 2013 |
0.12 | 0.10 | 581,360 | |||||||||
| October 23 to December 31, 2012 |
0.11 | 0.09 | 2,710,687 | |||||||||
The Common Shares were traded on the OTC-BB under the symbol NEYYF beginning March 11, 2011.
The following table sets forth the reported high and low prices and the trading volume for the Common Shares on the OTC-BB for the most recent fiscal year as reported by a public source we consider reliable.
Trading Prices on OTC-BB
| High ($) | Low ($) | Volume | ||||||||||
| 4th Quarter 2013 |
0.08 | 0.06 | 5,162,300 | |||||||||
| 3rd Quarter 2013 |
0.09 | 0.07 | 640,200 | |||||||||
| 2nd Quarter 2013 |
0.10 | 0.06 | 3,881,300 | |||||||||
| 1st Quarter 2013 |
0.12 | 0.10 | 1,013,700 | |||||||||
10
Table of Contents
The Company’s Common Shares were traded on the OTCQX under the symbol NEYYF beginning October 22, 2009.
The Common Shares were subsequently delisted from the OTCQX effective Monday, July 23, 2012.
The following table sets forth the reported high and low prices and the trading volume for the Common Shares on the OTCQX for the fiscal year 2012 as reported by a public source we consider reliable.
Trading Prices on OTCQX
| High ($) | Low ($) | Volume | ||||||||||
| July 1 to 22, 2012 |
1.01 | 0.96 | 3,568,430 | |||||||||
| 2nd Quarter 2012 |
1.05 | 0.76 | 6,791,237 | |||||||||
| 1st Quarter 2012 |
1.03 | 0.62 | 2,681,038 | |||||||||
As of March 24, 2014, there were 69,834,396 Common Shares outstanding.
Liquidating Distribution Policy
On September 24, 2012, the Board declared an initial distribution to Shareholders of $1.01 per Common Share in connection with the Winding Up. The distribution was made as a return of capital to Shareholders of record at the close of business on October 9, 2012, and the stated capital of the Company was reduced accordingly. The distribution of $70,532,740 was paid on October 22, 2012.
Additional liquidating distributions are subject to a number of risks and uncertainties. Such risks and uncertainties include, without limitation, possible contingent liabilities and post-closing indemnification and other obligations arising from the sale of the Company’s properties; and risks associated with the liquidation and dissolution of the Company, including, without limitation, settlement of the Company’s liabilities in dissolution, the amount of income earned on the Company’s cash and cash equivalents and short-term investments during the liquidation period, and the actual timing of the liquidating distributions. The Board will need to make provision for the satisfaction of all of the Company’s known and unknown liabilities, which could substantially delay or limit the Company’s ability to make distribution in full to Shareholders.
Disposition of Common Shares
Generally, a US Holder will only be subject to tax under the ITA in respect of any capital gain realized on a disposition of Common Shares if, at the time of disposition, the Common Share is, or is deemed to be, “taxable Canadian property” (as defined in the ITA), and not “treaty-protected property” (as so defined), of the US Holder.
The Common Shares generally should not constitute taxable Canadian property of a US Holder provided that the Common Share did not at any time during the 60-month period preceding the disposition, directly or indirectly derive more than 50% of its fair market value from, or from any combination of, (i) real or immoveable property situated in Canada, (ii) “Canadian resource property” (as defined in the ITA), (iii) “timber resource property” (as so defined), and (iv) options in respect of, or interests in, or for civil law rights in, any of the properties listed in items (i) to (iii), whether or not such properties exist, and the Common Share is not otherwise deemed to be taxable Canadian property.
A Common Share should generally constitute treaty-protected property of a US Holder provided that, at the time of its disposition, any income or gain arising from the disposition would be exempt from Canadian federal income tax under the Treaty. The Treaty provides that a gain derived from the disposition by a resident of the United States of a share of a company that is a resident of Canada for the purposes of the Treaty generally will not be taxable in Canada unless the value of the share derives principally from the real property situated in Canada.
11
Table of Contents
A US Holder’s capital gain (or capital loss) from an actual or deemed disposition of a Common Share that is taxable Canadian property and is not treaty-protected property will generally be the amount, by which the US Holder’s proceeds of disposition exceed (or are exceeded by) the aggregate of the adjusted cost base of the Common Share and any reasonable costs of disposition. The US Holder will be required to include one half of any capital gain so arising (“taxable capital gain”) in the US Holder’s taxable income earned in Canada for the year of disposition, and will be entitled to deduct one half of any capital loss (“allowable capital loss”) so arising from taxable capital gains realized in the year on dispositions of taxable Canadian property that are not treaty-protected property and, to the extent not so deductible against such taxable capital gains realized in any of the three preceding taxation years or any subsequent taxation year, in the circumstances and to the extent described in the ITA.
US Holders should consult their own tax advisors regarding whether or not their Common Shares may be taxable Canadian property or treaty-protected property.
Dividends
The Company will be required to withhold Canadian federal income tax (“Withholding Tax”) from any dividend that is, or is deemed to be, paid to a US Holder on the US Holder’s Common Shares. The rate of Withholding Tax under the ITA is 25% of the gross amount of the dividend, but should generally be reduced to 15% for the US Holders under the Treaty.
| ITEM 6. | SELECTED FINANCIAL DATA |
The selected financial data of the Company for the period ended June 30, 2012, and the fiscal year ended December 31, 2011, has been derived from the audited annual consolidated financial statements of the Company. The information contained in the selected financial data is qualified in its entirety by reference to the Company’s consolidated financial statements and related notes included in ITEM 8 – Financial Statements, and should be read in conjunction with such financial statements and with the information appearing in ITEM 7. – MD&A. The audited financial statements have been prepared in accordance with generally accepted accounting principles in the United States (“U.S. GAAP”).
In addition, as a result of the Shareholders’ approval of the Winding Up of the Company, the liquidation basis of accounting was adopted effective June 30, 2012. This basis of accounting is considered appropriate when, among other things, liquidation of a company is imminent and the net realizable values of assets are reasonably determinable. Under this basis of accounting, assets are valued at their net realizable values and liabilities are stated at their estimated settlement amounts. Further, all expected costs of liquidation are accrued as of December 31, 2013. Financial information presented below as of and subsequent to June 30, 2012, include a Consolidated Statement of Changes in Net Assets in Liquidation, as required under the liquidation basis of accounting.
12
Table of Contents
Selected Financial Data
| Six months ended June 30, 2012 ($) |
Year ended December 31, 2011 ($) |
|||||||
| Revenues |
10,985,590 | 24,305,685 | ||||||
| Production expense |
(4,257,619 | ) | (11,565,565 | ) | ||||
| Gain (loss) on derivative contracts |
189,507 | (753,053 | ) | |||||
| General & administrative expenses |
(6,043,260 | ) | (7,894,479 | ) | ||||
| Liquidation related expenses |
(7,537,423 | ) | — | |||||
| Interest income |
10,673 | 44,595 | ||||||
| Interest expense |
(6,443,178 | ) | (5,406,133 | ) | ||||
| Foreign exchange gain (loss) |
(438 | ) | (26,101 | ) | ||||
| Other |
(22,818 | ) | (196,649 | ) | ||||
| Other reclamation costs |
(659,115 | ) | — | |||||
| Gain on sale of oil & gas properties and equipment |
46,280,232 | — | ||||||
| DD&A |
(1,697,361 | ) | (3,507,669 | ) | ||||
| Change in fair value of warrants |
235,134 | 1,062,208 | ||||||
| Change in fair value of options |
296,519 | 707,513 | ||||||
|
|
|
|
|
|||||
| Income (loss) before income taxes |
31,336,443 | (3,229,648 | ) | |||||
| Income tax expense |
2,478,263 | — | ||||||
|
|
|
|
|
|||||
| Net income (loss) |
28,858,180 | (3,229,648 | ) | |||||
|
|
|
|
|
|||||
| Net income (loss) per share - basic and diluted |
0.41 | (0.05 | ) | |||||
| December 31, 2011 ($) |
||||||||
| Working Capital (Deficiency) |
(2,628,937 | ) | ||||||
| Stockholders’ equity |
46,984,363 | |||||||
| Long-term Debt |
31,950,000 | |||||||
| Total Assets |
90,519,375 | |||||||
| Dividends |
— | |||||||
| Common Stock |
108,758,460 | |||||||
| Number of Shares Outstanding |
69,834,396 | |||||||
13
Table of Contents
NiMin Energy Corp.
Consolidated Statement of Changes in Nets Assets in Liquidation as of December 31, 2013 (Liquidation Basis)
(Expressed in U.S. dollars)
| Net Assets in Liquidation as of June 30, 2012 |
$ | 77,914,536 | ||
| Increase (decrease) to net assets: |
||||
| Cash distribution to shareholders from July 1, 2012 to December 31, 2012 |
(70,532,740 | ) | ||
| Investment income from July 1, 2012 to December 31, 2012 |
56,213 | |||
| Tax Adjustment from July 1, 2012 to December 31, 2012 |
1,019,447 | |||
| Adjustments to assets from July 1, 2012 to December 31, 2012 |
(55,927 | ) | ||
| Adjustments to liquidation accruals from July 1, 2012 to December 31, 2012 |
(528,868 | ) | ||
| Costs incurred from July 1, 2012 to December 31, 2012 |
(85,255 | ) | ||
| Foreign exchange adjustment from July 1, 2012 to December 31, 2012 |
49,512 | |||
|
|
|
|||
| Net decrease to net assets: |
(70,077,618 | ) | ||
|
|
|
|||
| Net Assets in Liquidation as of December 31, 2012 |
$ | 7,836,918 | ||
|
|
|
|||
| Increase (decrease) to net assets: |
||||
| Adjustments to assets from January 1, 2013 to December 31, 2013 |
(28,689 | ) | ||
| Adjustments to liquidation accruals from January 1, 2013 to December 31, 2013 |
(2,847,920 | ) | ||
| Foreign exchange adjustment from January 1, 2013 to December 31, 2013 |
(57,122 | ) | ||
|
|
|
|||
| Net decrease to net assets: |
(2,933,731 | ) | ||
|
|
|
|||
| Net Assets in Liquidation as of December 31, 2013 |
$ | 4,903,187 | ||
|
|
|
|||
See accompanying notes to consolidated financial statements.
14
Table of Contents
ITEM 7. MANAGEMENT’S DISCUSSION AND ANALYSIS OF FINANCIAL CONDITION AND RESULTS OF OPERATION
The following management’s discussion and analysis (“MD&A”) should be read in conjunction with the “Selected Consolidated Financial Information” in Item 6 above and our historical consolidated financial statements and the accompanying notes included elsewhere in this Annual Report on Form 10-K.
In this MD&A, unless otherwise specified, all dollar amounts are expressed in US Dollars (“$”).
FORWARD-LOOKING INFORMATION
This MD&A contains certain forward-looking information, which is based upon the current internal expectations, estimates, projections, assumptions and beliefs of NiMin, as of the date of such statements or information. Words such as “plan,” “expect,” “project,” “intend,” “believe,” “anticipate,” “estimate,” “may,” “will,” “potential,” “proposed,” and other similar words, or statements that certain events or conditions “may” or “will” occur, are intended to identify forward-looking information. These statements are not guarantees of future performance and involve known and unknown risks, uncertainties and other factors that may cause actual results or events to differ materially from those anticipated in the forward-looking information. By its nature, forward-looking information involves numerous assumptions, known and unknown risks and uncertainties, both general and specific, that contribute to the possibility that the predictions, forecasts, projections and other forward-looking information will not occur. Such forward-looking information in this MD&A speaks only as of the date of this Annual Report.
Although NiMin believes that the expectations reflected in the forward-looking information are reasonable, there can be no assurance that such expectations will prove to be correct. NiMin cannot guarantee future results, levels of activity, performance or achievements.
Statements made in this MD&A regarding the payment of additional liquidating distributions and of the timing of the dissolution are forward-looking statements. Such forward-looking statements are subject to a number of risks and uncertainties, and there can be no assurance that the expectations reflected in those statements will be realized or achieved. Such risks and uncertainties include, without limitation, possible contingent liabilities and other obligations arising from the sale of the Company’s properties and previous operation of its business; and risks associated with the liquidation and dissolution of the Company, including, without limitation, settlement of the Company’s liabilities and the actual timing of the liquidating distributions and dissolution.
BOE Presentation
Barrels of oil equivalent (“boe”) may be misleading, particularly if used in isolation. A boe conversion ratio of six thousand cubic feet of natural gas (“mcf”): one barrel of oil (“bbl”) is based on an energy equivalency conversion method primarily applicable at the burner tip and does not represent a value equivalency at the wellhead.
Overview
NiMin Energy Corp. (“NiMin”, “we” or the “Company”) was an oil and gas company engaged in the acquisition, development and production of oil and gas properties in the United States until June 30, 2012, when we ceased to have oil and gas operations.
The annual and special meeting (the “Special Meeting”) of holders of Common Shares (“Shareholders”) was held on June 26, 2012. At the Special Meeting, in addition to annual items of business, Shareholders were asked to consider and vote on, among other things, special resolutions approving the proposed sale of all or substantially all of the Company’s assets (the “Sale of Assets”) including those assets held by NiMin’s wholly-owned subsidiary, Legacy pursuant to purchase and sale agreements with respect to its Wyoming based oil and gas assets (“Wyoming Assets”) and California based oil and gas assets (“California Assets”).
At the Special Meeting, the Shareholders were also asked to consider and vote on the voluntary liquidation and dissolution of the Company pursuant to the laws of the Business Corporations Act (Alberta) (the “Winding Up”) and the distribution to Shareholders of the net proceeds of the Sale of Assets (less the settlement of obligations of Legacy), and cash on hand, as part of such liquidation and dissolution after satisfaction of all liabilities of the Company, by way of a reduction of the stated capital of the Common Shares.
15
Table of Contents
Both the Sale of Assets and the Winding Up were approved by the Shareholders at the Special Meeting. In order for the Company to complete the Winding Up, the appropriate corporate steps were required to be taken for the dissolution and liquidation of Legacy which dissolution was filed in Delaware on September 17, 2012. Pursuant to the approval of the Sale of Assets, Legacy proceeded with the sale of the Wyoming Assets and the California Assets all as more particularly described below.
On June 28, 2012, Legacy completed its previously announced sale of its Wyoming Assets to BreitBurn Operating L.P., a wholly-owned subsidiary of BreitBurn Energy Partners L.P. (“BreitBurn”), for total cash consideration of approximately $93 million, being the original purchase price of approximately $98 million less, approximately $5 million adjusted to account for preliminary purchase price adjustments. On August 30, 2012, Legacy completed its final settlement with BreitBurn and received approximately $2.3 million based on the final purchase price adjustments.
On June 29, 2012, Legacy completed its previously announced sale of its California Assets to Southern San Joaquin Production, LLC for total cash consideration of approximately $26 million, being the original purchase price of approximately $27 million, less approximately $1 million adjusted to account for preliminary purchase price adjustments. Pursuant to the terms of the purchase and sale agreement, $3 million of the $26 million purchase price paid on closing was deposited with an escrow agent until December 28, 2012, in connection with various indemnities contained therein. On August 30, 2012, Legacy completed its final settlement with Southern San Joaquin Production LLC and received $347,938 based on the final purchase price adjustments. On December 28, 2012, the $3 million was released to NiMin from the escrow account.
The Winding Up and the dissolution and liquidation of Legacy contemplates the orderly disposition of the assets, the orderly discharge of all outstanding liabilities, including all outstanding debt, and after the establishment of appropriate reserves, the distribution of cash to Shareholders in installments.
On September 24, 2012, the Board declared an initial distribution to Shareholders of $1.01 per Common Share in connection with the Winding Up. The distribution was made as a return of capital to Shareholders of record at the close of business on October 9, 2012, and the stated capital of the Company was reduced accordingly. The distribution of $70,532,740 was paid on October 22, 2012.
Upon settlement of all liabilities of the Company, the Company intends to distribute the net proceeds of the liquidation and dissolution of the Company to Shareholders in one final distribution occurring in mid-year 2014.
On October 10, 2012, Nimin voluntarily delisted the Common Shares from the TSX after the close of trading on October 22, 2012, and its listing was transferred to the NEX, a separate board of the TSX Venture Exchange (“NEX”), effective as of opening of the market on October 23, 2012. From October 23, 2012, and onwards until the time that is on or about the date of dissolution, the Common Shares will trade on the NEX under the symbol “NNN.H”.
As a result of the Shareholders’ approval of the Winding Up, the liquidation basis of accounting was adopted effective June 30, 2012. This basis of accounting is considered appropriate when, among other things, liquidation of a company is imminent and the net realizable values of assets are reasonably determinable. Under this basis of accounting, assets are valued at their net realizable values and liabilities are stated at their estimated settlement amounts. Further, all costs of liquidation are accrued as of December 31, 2013. Financial information presented as of and subsequent to June 30, 2012, includes a Consolidated Statement of Net Assets and a Consolidated Statement of Changes in Net Assets in Liquidation, as required under the liquidation basis of accounting. Financial information included for periods ending prior to June 30, 2012, is presented under the going concern basis of accounting.
Data for the statement of operations is not presented for 2013 because using the liquidation basis of accounting, net income(loss) is no longer reported.
16
Table of Contents
RESULTS OF OPERATIONS AND FINANCIAL CONDITION
Results of Operations ----
Period from January 1, 2012 to December 31, 2012 and for the year ended December 31, 2011.
Crude oil and natural gas sales
Given that the sale of Wyoming Assets and California Assets closed on June 28, 2012 and June 29, 2012, respectively, the associated revenues are included in revenues and expenses for the period ended June 30, 2012. However, the purchase and sale agreements provide adjustments to the purchase price be made related to revenues and operating expenses for the period of April 1, 2012 through the closing date of the sale of the properties. As such, the purchase price of the sale of the properties in June 2012 was adjusted for revenues and operating expenses for the period of April 1 through closing date of the sale of the properties.
For the six months ended June 30, 2012, the Company recorded gross revenues of $13.78 million. Given the Sale of Assets during the second quarter of 2012, the Company did not have any oil and gas revenues during the six months ended December 31, 2012.
For the year ended December 31, 2011, the Company recorded gross revenues of $30.95 million.
Crude Oil Derivative Contracts
Commodity price risk was the risk that the future cash flows will fluctuate as a result of changes in commodity prices. Commodity prices for crude oil and natural gas are impacted by world economic events that dictate the levels of supply and demand.
In January of 2010, the Company entered into a derivative financial contract for 7,500 barrels of WTI crude oil production per month at a fixed rate of $85.10 per barrel until December 2012.
On December 20, 2010, we agreed to economically hedge the future sales of 125 barrels of NYMEX WTI crude oil per day at a fixed price of $90.40 starting January 1, 2011, for a period of 12 months and 250 barrels of NYMEX WTI crude oil per day at a fixed price of $90.40 starting January 1, 2012, for a period of 12 months.
On November 11, 2011, we entered into a swap contract to minimize the variability in cash flows due to price movements in crude oil. We agreed to economically hedge the future sales of 100 barrels of NYMEX WTI crude oil per day at a fixed price of $96.75 starting January 1, 2012, for a period of 12 months.
We did not designate our derivative financial instruments as hedging instruments for accounting purposes and, as a result, we recognized the current change in a derivative’s fair value in earnings. On December 31, 2011, we recognized $976,929 as a derivative liability on crude oil derivative contracts.
For the year ended December 31, 2011, the change in derivative contracts included a realized loss of $1.12 million and an unrealized gain of $365,109.
During the second quarter of 2012, the Company terminated and settled all derivative contracts as of May 17, 2012, and at December 31, 2013, did not carry derivative contracts on the balance sheet.
For the six months ended June 30, 2012, the Company’s change in derivative contracts included a realized gain of $189,507.
17
Table of Contents
Royalties
California
The Company paid a crude oil production fee (“Production Fee”) consisting of 100% of the first 635.10 barrels of crude oil produced per month which commenced in 2008 and declined at a rate of 5.5% each year.
For the six months ended June 30, 2012, we recorded royalties in California in the amount of $1.31 million.
For the year ended December 31, 2011, we recorded royalties in California in the amount of $2.19 million.
Louisiana
Royalties related to Louisiana production varied by property. Effective December 1, 2011, the Company sold all of its producing interest in Louisiana and no royalties were recorded for the six months ended June 30, 2012.
For the year ended December 31, 2011, we recorded $842,900 in royalties representing an average rate of 29.56.
Wyoming
For the six months ended June 30, 2012, we recorded $1.47 million in royalties in Wyoming representing an average rate of 16.12%.
For the year ended December 31, 2011, we recorded $3.62 million in royalties in Wyoming representing an average rate of 17.67%.
Operating Costs
For the six months ended June 30, 2012, the Company incurred operating costs in the amount of $4.26 million and $996,327 in severance taxes.
For the year ended December 31, 2011, we incurred operating costs in the amount of $11.57 million.
Operating costs included severance taxes paid in Louisiana and Wyoming. There was no severance tax in the state of California. Severance taxes in Louisiana consist of 12.5% on gross oil sales and $0.164 per Mcf of gas sales. For the year ended December 31, 2011, we recorded $2.36 million in severance taxes.
General and Administrative Expenses (“G&A”)
For the six months ended June 30, 2012, we recorded G&A expense, excluding stock based compensation (“SBC”), of $3.75 million.
For the year ended December 31, 2011, we recorded G&A expense, excluding SBC of $5.29 million.
Following the approval of the Winding Up, all outstanding unvested options became automatically vested and the Company recognized the remaining grant date fair value of approximately $1.7 million in the current period.
For the six months ended June 30, 2012, we recorded SBC in the amount of $2.29 million.
For the year ended December 31, 2011, we recorded SBC in the amount of $2.61 million.
For the six months ended June 30, 2012, we recorded liquidation related expenses of $7.54 million primarily related to accrued professional fees, and severance and payroll related payments.
18
Table of Contents
Depreciation, Depletion, Amortization and Accretion Expense (“DD&A”)
We followed the full-cost method of accounting and all costs included in proved properties and all future development costs along with our total proved reserves determine the period’s depletion cost.
For the six months ended June 30, 2012, we recorded DD&A in the amount of $1.70 million.
For the year ended December 31, 2011, we recorded DD&A in the amount of $3.51 million.
Change in Fair Value of Warrants and Options
The exercise price of certain warrants was denominated in Canadian dollars, which was not the functional currency of the Company. As a result, these warrants were classified as a liability on the balance sheet and recorded at their fair value at the end of each period and the change in fair value recognized in earnings.
During the year ended December 31, 2012, none of the issued warrants were exercised, and due to the pending liquidation, the Company valued the warrants based on the expected cash distribution to Shareholders as this represents management’s best estimate of the value of the underlying equity instruments as of December 31, 2012. As the warrants have an exercise price greater than the expected cash distribution to Shareholders, the value of the warrants were determined to approximate zero. As a result, a gain of $235,134 was recognized in earnings during the six months ended June 30, 2012. As a result of the approval of the Winding Up in July 2012, 2,188,970 of unexercised warrants were terminated, leaving 96,930 warrants outstanding related to Krescent Energy Partners LLC.
During the year ended December 31, 2011, 5,354,800 warrants were exercised. At December 31, 2011, the fair value of the warrant liability was $235,134, with a gain of $1.06 million recognized in earnings during the year ended December 31, 2011.
The exercise price of 2.70 million stock options relating to former employees that transitioned to a consulting role was denominated in Canadian dollars, which was not the functional currency of the Company (which was the U.S. dollar). As a result, the applicable 2.20 million vested options were classified as a liability on the balance sheet and recorded at their fair value at the end of each period with the change in fair value recognized in earnings. Following the approval of the Winding Up, all outstanding unvested options became automatically vested and the Company recognized the remaining grant date fair value of approximately $1.7 million in the current period.
As a result of the approval of the Winding Up of the Company, the Company valued the stock options based on the expected cash distribution to Shareholders as this represents management’s best estimate of the valuation of the underlying equity instruments as of June 30, 2012. As the stock options at June 30, 2012, had an exercise price greater than the expected cash distribution to Shareholders, the value of the stock options were determined to approximate zero. Further, a gain of $296,519 was recognized in earnings during the six months ended June 30, 2012. In addition, all stock options were terminated in July 2012.
Interest Income and Expense
For the six months ended June 30, 2012, we recorded interest expense of $6.44 million ($3.49 million non-cash) related to the Senior Loan.
For the year ended December 31, 2011, we recorded interest expense of $5.41 million ($906,569 non-cash) related to the Senior Loan. The amortization of debt issuance cost related to the Short-term Loan and Senior Loan was included in interest expense.
As part of the Winding Up, on June 28, 2012, the Company prepaid the entire amount of the Senior Loan and as a result, a prepayment penalty of 2% representing $707,705 was applied in addition to the accrued interest of $1,118,853 and principal of $36,000,000. The remaining unamortized debt issuance cost of $3.23 million related to the Senior Loan was included in current period interest expense.
For the six months ended June 30, 2012, we recorded interest income in the amount of $10,673.
For the year ended December 31, 2011, we recorded interest income in the amount of $44,595.
19
Table of Contents
Income Tax
In October 2012, the Company paid $1.80 million, for Federal U.S. and California purposes, relating to taxable gains resulting from the sale of its oil and gas properties in 2012. The Federal U.S. taxable income for regular income tax purposes was fully reduced by net operating loss carryforwards of $63,362,738. The Company’s deferred tax assets were previously subject to full valuation allowance.
On May 6, 2013, the Company received a refund for U.S. income taxes of $327,174 resulting from an overpayment of income taxes in 2012. The Company generated additional net operating losses during the year ended December 31, 2013, but deferred tax assets have been recorded at their net realizable value of $0 under the liquidation basis of accounting.
Foreign Currency Exchange
Our foreign exchange expense was derived from our cash balances denominated in Canadian dollars. For the six months ended June 30, 2012, we recorded a foreign exchange loss of $438.
For the year ended December 31, 2011, we recorded a foreign exchange loss of $26,101.
Liquidity and Capital Resources
Upon settlement of all liabilities of the Company, the Company will distribute the net proceeds of the liquidation and dissolution of the Company to Shareholders remaining. NiMin’s wholly-owned subsidiary, Legacy Energy, Inc., a Delaware company, dissolved in accordance with the laws of Delaware on September 17, 2012.
The Board declared an initial distribution to Shareholders of $1.01 per Common Share in connection with the Winding Up of NiMin. The distribution was made as a return of capital to Shareholders of record at the close of business on October 9, 2012, and the stated capital of the Company was reduced accordingly. The distribution was paid on October 22, 2012.
The amount and timing of any subsequent distributions to Shareholders will depend on a number of factors, several of which cannot be determined at this time, including the ultimate amount of our known, unknown, and contingent liabilities. As a result, the amount of cash remaining following completion of our liquidation and dissolution could vary from our current estimates.
Financial information presented as of and subsequent to June 30, 2012, includes a Consolidated Statement of Net Assets and a Consolidated Statement of Changes in Net Assets in Liquidation, as required under the liquidation basis of accounting. Overall net assets in liquidation decreased from $77,914,536 at June 30, 2012 to $7,836,918 at December 31, 2012. The decrease was primarily related to a cash distribution to Shareholders of $70,532,740, changes in liquidation accruals related to professional fees and payroll of $1,192,227 and asset retirement obligations of $163,850. Furthermore, an increase in net assets was related to a tax adjustment of $1,019,447 and changes to accrued liabilities of $982,589. The remaining change in net assets related to investment income, adjustments to assets, costs incurred, and adjustments to other liquidation accruals during the six month period.
In addition, overall net assets in liquidation decreased from $7,836,918 at December 31, 2012, to $4,903,187 at December 31, 2013. The decrease primarily resulted from changes in liquidation accruals related to professional fees of $2,181,582, asset retirement obligations of $339,341, and adjustments to other liquidation accruals of $326,997. The remaining decrease in net assets related to uncollectable accounts receivable of $28,689, and change in net and foreign exchange adjustments of $57,122 during the twelve month period.
The numbers reflected in the statement of net assets and the estimated $0.07 net assets in liquidation per outstanding share include management estimates made as of December 31, 2013, for the next six months, the estimated remaining period for dissolution and winding up. They do not necessarily reflect the final dollars that may be available to the Company for distribution to Shareholders. Any distribution amounts can only be calculated upon completion of all the dispositions, discharges and determinations of reserves.
20
Table of Contents
Off-Balance Sheet Arrangements
We had no off-balance sheet arrangements during the year ended December 31, 2013.
Critical Accounting Policies, Estimates and Liquidation Form of Accounting
Management’s Discussion and Analysis of Financial Condition and Results of Operations are based upon our consolidated financial statements, which have been prepared in accordance with accounting principles generally accepted in the United States. The preparation of these financial statements requires us to make estimates and judgments that affect the reported amounts of assets, liabilities, sales and expenses, and related disclosure of contingent assets and liabilities. We base our estimates on historical experience and on various other assumptions that are believed to be reasonable under the circumstances, the results of which form the basis for making judgments about the carrying values of assets and liabilities that are not readily apparent from other sources. Actual results may differ from these estimates under different assumptions or conditions. The Company adopted the liquidation basis of accounting effective June 30, 2012. This basis of accounting is considered appropriate when, among other things, liquidation of a company is imminent and the net realizable values of assets are reasonably determinable. Under this basis of accounting, assets are valued at their net realizable values and liabilities are stated at their estimated settlement amounts. The Company will continue to incur operating costs from December 31, 2013, through the liquidation of the Company. On a regular basis, we evaluate our assumptions, judgments and estimates as they may have a significant impact on our reported net assets in liquidation based on the most recent information available to us, and when necessary make changes accordingly. Actual costs and income may differ from our estimates, which might reduce net assets available in liquidation to be distributed to Shareholders.
In preparing financial statements, we make informed judgments and estimates that affect the reported amounts of assets and liabilities as of the date of the financial statements and affect the reported amounts of revenues and expenses during the reporting period.
On an ongoing basis, we review estimates, including those related to the impairment of long-lived assets, contingencies and income taxes. Changes in facts and circumstances may result in revised estimates and actual results may differ from these estimates.
Pre-Liquidation Accounting Policies
Crude Oil and Natural Gas Properties
We accounted for our crude oil and natural gas producing activities under the full-cost method of accounting. Accordingly, all costs incurred in the acquisition, exploration, and development of proved crude oil and natural gas properties, including the costs of abandoned properties, dry holes, geological and geophysical costs, and annual lease rentals, were capitalized. All general corporate costs were expensed as incurred. Sales or other dispositions of crude oil and natural gas properties were accounted for as adjustments to capitalized costs with no gain or loss recorded unless such sale would alter the relationship between pool cost and reserves.
Depletion and Depreciation
Depletion of crude oil and natural gas properties was computed under the unit-of-production method where by the ratio of production to proved reserves, after royalties, determined the proportion of depletable costs to be expensed in each period. Costs associated with unevaluated properties were excluded from the full-cost pool until a determination was made whether proved reserves can be attributable to the related properties. Unevaluated properties were evaluated at least annually to determine whether the costs incurred should have been classified to the full-cost pool and thereby subject to amortization. A significant reduction in our proved reserves may have resulted in an accelerated depletion rate.
Reserves were determined by an independent reserves engineering firm. Volumes were converted to equivalent units using the ratio of one barrel of oil to six thousand cubic feet of natural gas.
Depreciation of equipment was provided for on a straight-line basis over the useful life (5 to 10 years) of the asset.
Impairment of oil and gas properties
We performed a full-cost ceiling test on proved crude oil and natural gas properties in which the capitalized costs were not allowed to exceed their related estimated future net revenues of proved reserves discounted at 10%, net of tax considerations. Costs associated with unevaluated properties were excluded from the full-cost pool until a determination was made whether proved reserves can be attributable to the related properties. Unevaluated properties were evaluated at least annually to determine whether the costs incurred should have been classified to the full-cost pool and thereby subject to amortization. A significant reduction in our proved reserves may have resulted in a full cost ceiling limitation.
21
Table of Contents
Equipment was reviewed for impairment whenever events or changes in circumstances indicate such impairment may have occurred. An impairment was recognized when the estimated undiscounted future net cash flows of an asset was less than its carrying value. If an impairment occurred, the carrying value of the impaired asset was reduced to fair value.
Asset Retirement Obligations
We recognized a liability for the present value of all legal obligations associated with the retirement of tangible, long-lived assets and capitalized an equal amount as a cost of the asset. The cost associated with the abandonment obligation was included in the computation of depreciation, depletion, amortization and accretion. The liability accreted until we settle the obligation. We used a credit-adjusted risk-free interest rate in its calculation of asset retirement obligations (“ARO”).
Revisions to the original estimated liability would have resulted in an increase or decrease to the ARO liability and related capitalized costs. Actual costs incurred upon settlement of the asset retirement obligation were charged against the obligation to the extent of the liability recorded.
Estimates for future abandonment and reclamation costs were based on historical costs to abandon and reclaim similar sites, taking current costs into consideration. The liability was based on our net interest in the respective sites.
Income Tax
Deferred tax assets and liabilities are recognized for the future tax consequences attributable to differences between the financial statement carrying amounts of existing assets and liabilities and their respective tax bases. Deferred tax assets and liabilities are measured using enacted tax rates expected to apply to taxable income in the years in which those temporary differences are expected to be recovered or settled. The effect on deferred tax assets and liabilities of a change in enacted tax rates is recognized in income in the period that includes the enactment date.
We do not have any unrecognized tax benefits other than those for which a valuation allowance has been provided thereon. Our policy is that we recognize interest and penalties accrued on any unrecognized tax benefits as a component of income tax expense. We did not have any accrued interest or penalties associated with any unrecognized tax benefits, nor were any tax-related interest expense recognized during 2013, 2012 or 2011.
Commodity and Derivative Instruments
Derivative instruments were recognized as either assets or liabilities in the balance sheet at fair value. The accounting for changes in the fair value of derivative instruments depended on their intended use and resulting hedge designation. For derivative instruments designated as hedges, the changes in fair value were recorded in the balance sheet as a component of accumulated other comprehensive income (loss). Changes in the fair value of derivative instruments not designated as hedges were recorded as a gain or loss on derivative contracts in the consolidated statements of operations. We did not designate its derivative financial instruments as hedging instruments and, as a result, recognized the change in a derivative’s fair value currently in earnings.
Fair value measurements
We categorized our assets and liabilities that were measured at fair value, based on the priority of the inputs to the valuation techniques. The three levels of the fair value measurement hierarchy were as follows:
Level 1: Unadjusted quoted prices in active markets that were accessible at the measurement date for identical, unrestricted assets or liabilities.
Level 2: Quoted prices in markets that were not active, or inputs which were observable, either directly or indirectly, for substantially the full term of the asset or liability.
Level 3: Measured based on prices or valuation models that required inputs that were both significant to the fair value measurement and less observable for objective sources (i.e. supported by little or no market activity).
22
Table of Contents
Financial assets and liabilities were classified based on the lowest level of input that was significant to the fair value measurement. Our assessment of the significance of a particular input to the fair value measurement required judgment, which may affected the valuation of the fair value of assets and liabilities and their placement within the fair value hierarchy levels. The Company considered active markets as those in which transactions for the assets or liabilities occur in sufficient frequency and volume to provide pricing information on an ongoing basis. For assets and liabilities carried at fair value, the Company measured fair value under the following levels:
| Financial Instrument |
Level | |||
| Cash and cash equivalents |
Level 1 | |||
| Restricted investments |
Level 1 | |||
| Long-term debt |
Level 2 | |||
| Commodity derivative |
Level 2 | |||
| Warrants and options |
Level 3 | |||
Stock-Based Compensation
We measured and recognized compensation expense for all share-based payment awards, including employee stock options, based on estimated fair values. The value of the portion of the award that was ultimately expected to vest was recognized as an expense on a straight-line basis over the requisite vesting period. We estimated the fair value of stock option awards on the date of grant using an option-pricing model. We used the Black-Scholes Model as its method of valuation for share-based awards. Our determination of fair value of share-based payment awards on the date of grant using the Black-Scholes Model was affected by NiMin’s stock price, as well as assumptions regarding a number of subjective variables. These variables included, but are not limited to, our expectation of NiMin’s stock price volatility over the term of the awards, as well as actual and projected exercise and forfeiture activity. The fair value of options granted to consultants, to the extent unvested due to required services not having been fully performed, was determined on subsequent reporting dates.
Foreign Currency Transactions
The consolidated financial statements are presented and measured in U.S. dollars, as substantially all of our operations are located in the United States of America. Transactions and balances using Canadian dollars are expressed in U.S. dollars whereby monetary assets and liabilities are expressed at the period end exchange rate, non-monetary assets and liabilities are expressed at historical exchange rates, and revenue and expenses are expressed at the average exchange rate for the period. Foreign exchange gains and losses are included in the consolidated statements of operations.
| ITEM 8. | FINANCIAL STATEMENTS AND SUPPLEMENTARY DATA |
Our financial statements are stated in U.S. Dollars and are prepared in accordance with U.S. generally accepted accounting principles (GAAP).
The financial statements and notes thereto required under Item 8 of this annual report are attached hereto and found immediately following the signature page of this Form 10K annual report.
23
Table of Contents
| ITEM 9. | CONTROLS AND PROCEDURES |
| (a) | Disclosure Controls and Procedures |
Our Chief Executive Officer (“CEO”) and Chief Financial Officer (“CFO”) conducted an evaluation regarding the effectiveness of the design and operation of the Company’s disclosure control and procedures, as defined in Rules 13a-15(e) and 15d-15(e) under the Securities and Exchange Act of 1934 (“Exchange Act”) as of the end of the period covered by this annual report on Form 10-K.
Based on the evaluation, management concluded that as of December 31, 2013, the Company’s disclosure controls and procedures continue to be ineffective because of the material weaknesses as described in Management’s Report on Internal Control over Financial Reporting.
| (b) | Management’s Report on Internal Control over Financial Reporting |
Management of the Company is responsible for establishing and maintaining adequate internal control over financial reporting as defined in rule 13a-15(f) and 15d-15(f) under the Exchange Act. Internal control over financial reporting is a process designed by, or under the supervision of, the CEO and CFO, to provide reasonable assurance regarding the reliability of financial reporting and the preparation of financial statements for external purposes in accordance with generally accepted accounting principles. Internal controls over financial reporting includes those policies and procedures that (i) pertain to the maintenance of records which in reasonable detail accurately and fairly reflect the transactions and disposition of the Company’s assets; (ii) provide reasonable assurance that transactions are recorded as necessary to permit preparation of financial statements in accordance with generally accepted accounting principles, and that receipts and expenditures of the Company are being made in accordance with authorizations of management and directors of the issuer; and (iii) provide reasonable assurance regarding prevention or timely detection of unauthorized acquisition, use, or disposition of the Company’s assets that could have a material effect on the Company’s consolidated financial statements.
Because of its inherent limitations, internal control over financial reporting may not prevent or detect misstatements. Also, projections of any evaluation of effectiveness to future periods are subject to the risk that controls may become inadequate because of changes in conditions, or that the degree of compliance with the policies or procedures may deteriorate.
A material weakness is a deficiency, or a combination of deficiencies in internal control over financial reporting, such that there is a reasonable possibility that a material misstatement of the company’s annual or interim financial statements will not be prevented or detected on a timely basis.
In evaluating the effectiveness of the Company’s internal control over financial reporting as of December 31, 2013, management used the criteria established in the Internal Control – Integrated Framework issued by the Committee of Sponsoring Organizations of the Treadway Commission (“COSO”). Based on the criteria established by COSO, management (with the participation of the CEO and the CFO) identified the following material weaknesses in the Company’s internal control over financial reporting as of December 31, 2013, which arose from the limited number of number of staff at the Company and the inability to achieve proper segregation of duties:
| • | The Company lacked effective controls for ensuring the accuracy of reporting over significant account balances, including the review, approval, and documentation of related transactions and account reconciliations. |
As a result of these material weaknesses, management concluded that the Company did not maintain effective internal control over financial reporting as of December 31, 2013, based on the criteria established in Internal Control – Integrated Framework issued by COSO.
| (c) | Changes in Internal Control Over Financial Reporting |
There were no changes in the Company’s internal control over financial reporting during the year ended December 31, 2013, that have materially affected or are reasonably likely to materially affect, the Company’s internal control over financial reporting.
24
Table of Contents
| ITEM 10. | DIRECTORS, EXECUTIVE OFFICERS AND CORPORATE GOVERNANCE |
Directors and Executive Officers
Set forth below is information regarding each of the executive officers of NiMin and each member of the Board as of March 24, 2014:
| Name |
Positions |
Age | Date First Elected or Appointed a Director or Officer | |||
| Clarence Cottman III (1) | Chairman, Chief Executive Officer and Director |
58 | September 2009 | |||
| Jonathan S. Wimbish | Chief Financial Officer | 43 | September 2009 | |||
| Brian E. Bayley (1) (3)(4) | Director | 61 | September 2009 | |||
| William Gumma(2)(3) | Director | 66 | June 2011 | |||
| W.A. (Alf) Peneycad(1)(2)(3)(4) | Director | 67 | September 2009 | |||
| Robert L. Redfearn(2)(3) (4) | Director | 79 | September 2009 |
Notes:
| (1) | Member of the corporate governance committee. |
| (2) | Member of the reserves committee. |
| (3) | Member of the compensation committee. |
| (4) | Member of the audit committee. |
Clarence Cottman III
Chairman, CEO and Director
Clarence Cottman III is Chairman, CEO, and Director of NiMin. Mr. Cottman has over 30 years of experience in the oil and gas industry with a focus on joint ventures, acquisitions and project development. He was on the Advisory Board to Nanes Balkany Partners, a hedge fund investor in small publicly traded energy companies. Mr. Cottman has held various senior management positions at Etrion Corporation (formerly PetroFalcon Corporation), Benton Oil & Gas and Sun E&P. He has negotiated numerous oil and gas contracts and arranged multiple energy financings in both North America and overseas. He holds a BA from Rochester Institute of Technology and an MBA from the University of Rhode Island. Mr. Cottman is a Certified Professional Landman. The Board believes that Mr. Cottman’s expertise and experience in the oil and gas industry is valuable to the Board.
Jonathan S. Wimbish, CFA
Chief Financial Officer
Jonathan Wimbish, CFA is Chief Financial Officer for NiMin. Prior to joining Legacy in 2007, which became a wholly-owned subsidiary of NiMin in 2009, Mr. Wimbish was a Portfolio Manager, Managing Director and Co-Founder of Marketus, LLC, an equity-based hedge fund management company. He managed all energy investments from its founding in 2002. Mr. Wimbish was also a Managing Director and Portfolio Manager at ING Furman Selz Asset Management and Analyst with Husic Capital. He began his career at MasterCard International and held roles of increasing responsibility including; Internal Auditor and Manager of Strategic Planning. Mr. Wimbish holds a BA in Economics from UCLA, an MBA from Columbia Business School and is a CFA Charterholder.
25
Table of Contents
Brian E. Bayley
Director
Brian E. Bayley holds an MBA from Queen’s University. Mr. Bayley has been the President of Ionic Management Corp. (private management company) since December 1996; Previously held the following positions with Sprott Resource Lending Corp., publicly traded (TSX and NYSE-Amex) lending company to resource issuers): Director from June 2003 to July 2013; Resource Lending Advisor from Sept. 2010 to June 2013; President and Chief Executive Officer from May 2009 to September 2010; Co-Chairman from January 2008 to May 2009; Chief Executive Officer from June 2003 to March 2008: and President from June 2003 to January 2008. He has also served as a director and/or officer of several other public companies. The Board believes that Mr. Bayley’s experience and his independence from management make him a valuable member of the Board.
William Gumma
Director
Bill Gumma has over 30 years of oil and gas experience, and has been responsible for worldwide exploration and production activities, including pioneering projects in the United States, Russia, and Venezuela. Since 2010, Mr. Gumma has been the Managing Director at Chisholm Partners, LLC, an independent energy resource development company. From June 2003 until September 2009, Mr. Gumma served as President and CEO of PetroFalcon Corporation, now Etrion Corporation, a natural resource company formerly focused on oil and gas operations in Venezuela. He also worked in both engineering and exploration capacities at Shell USA and Amoco Oil Co. Additionally, Mr. Gumma served as Chief Geophysicist-International for Maxus Energy Corp. and as an executive officer and Director for Benton Oil and Gas Co., now Harvest Natural Resources. Mr. Gumma holds a Bachelor of Science degree in engineering from the Colorado School of Mines and a Master of Science degree in geophysics from Oregon State University. The Board believes that Mr. Gumma’s expertise and experience in the oil and gas industry is valuable to the Board.
W.A. (Alf) Peneycad
Director
Alfred Peneycad is a graduate of Queen’s University Law School. He serves as a director of several public companies, including Parex Resources Inc., a Calgary-based oil and gas company with operations in Colombia and Trinidad & Tobago. Mr. Peneycad retired from Petro-Canada where he served as Vice-President, General Counsel and Chief Compliance Officer. Mr. Peneycad spent 28 years at Petro-Canada and while there, played a lead role in the acquisition of several major companies in Canada, the US and internationally. The Board believes that Mr. Peneycad’s experience and his independence from management make him a valuable member of the Board.
Robert L. Redfearn
Director
Robert L. Redfearn is a graduate of Tulane University (B.B.A., J.D.), specializing in oil and gas related law. In 1979, Mr. Redfearn became a founding partner of Simon, Peragine, Smith & Redfearn, L.L.P., where he represents clients in mergers of business and acquisitions of oil and gas properties, financing, complex litigation and arbitrations related to oil and gas, environmental concerns and banking and securities. Prior to founding Simon, Peragine, Smith & Redfearn, L.L.P., Mr. Redfearn was an attorney at Deutsch, Kerrigan and Stiles, a New Orleans based law firm, where his practice centered around the oil and gas industry. Mr. Redfearn was employed in the legal department of Humble Oil & Refining Company (now Exxon Corporation). The Board believes that Mr. Redfearn’s experience and his independence from management make him a valuable member of the Board.
26
Table of Contents
Corporate Governance
General
The Board recognizes that effective corporate governance is an essential element for the effective and efficient operation of the Company. The Company strives to ensure that its corporate governance policies and practices provide for effective stewardship of the Company. The Company’s corporate governance practices are the responsibility of the Board and the Board has delegated certain responsibilities to develop and monitor the Companys’ corporate governance practices to the Corporate Governance Committee.
This Statement of Corporate Governance Practices sets out the Board’s corporate governance practices pursuant to National Instrument 58-101 - Disclosure of Corporate Governance Practices (“NI 58-101”) and National Policy 58-201 - Corporate Governance Guidelines (“NP 58-201”). The Company’s corporate governance practices are generally consistent with the practices and guidelines set out in NI 58-101 and NP 58-201.
Board of Directors
The Board, which is responsible for supervising the management of the business and affairs of the Company, is currently comprised of five (5) directors. The majority of the members of the Board are independent within the meaning of NI 58-101, other than Clarence Cottman III, the Chairman of the Board and the CEO of the Company.
The Board facilitates its exercise of independent supervision over management by ensuring that a majority of directors qualify as independent directors pursuant to NI 58-101 and by establishing committees which are comprised of a majority of independent directors and in the case of the Audit Committee, is comprised entirely of independent directors.
The following table sets forth the directors of the Company who are presently directors of other reporting issuers (or equivalent).
| Name of Director |
Name of Other Issuers | |
| Brian E. Bayley | Kramer Capital Corp. Cypress Hills Resource Corp. Eurasian Minerals Inc. Kirkland Lake Gold Inc. American Vanadium Corp. TransAtlantic Petroleum Corp. Bearing Resources Ltd. Kramer Capital Corp. Legend Gold Corp. | |
| W.A. (Alf) Peneycad | Parex Resources Inc. Canadian Wireless Trust R Split III Corp. | |
If required, independent directors meet without members of management present during the course of each regularly scheduled Board meeting, but, in any case, not less than four times per year.
As noted above, the Chair of the Board (“Chair”) is not an independent director. While the Board has no formal procedures in place to provide leadership to its independent directors, the Chair ensures that the independent directors have appropriate opportunities to discuss issues at each Board meeting, question executive officers, management and others regarding any and all matters of importance to the Board and the Corporation.
27
Table of Contents
Board of Leadership
Clarence Cottman III serves as the Chairman and Chief Executive Officer of NiMin. The Board has not deemed it necessary to separate the positions of Chairman and Chief Executive Officer or name a lead independent director because the Board values Mr. Cottman’s business acumen, industry knowledge, ethics and leadership as Chairman and because NiMin’s independent directors under its existing board leadership structure have been diligent in their oversight responsibility with respect to management. This oversight includes actively advising and providing direction to management, reviewing and approving management’s strategic plans and business objectives, and overseeing NiMin’s financial performance and compliance with legal and regulatory obligations. Additionally, the independent directors meet, from time to time as they deem appropriate, without management in attendance at both the Board and committee levels.
Audit Committee
The Audit Committee is a committee of the Board established for the purpose of overseeing the accounting and financial reporting process of the Company and annual external audits of the consolidated financial statements. The Audit Committee held 4 meetings in 2013.
Audit Committee Charter
The Audit Committee has set out, in a written policy, its responsibilities and composition requirements in fulfilling its oversight in relation to the Company’s internal accounting standards and practices, financial information, accounting systems and procedures. The Audit Committee charter is provided in Appendix A attached hereto.
Composition of the Audit Committee
The Audit Committee consists of Brian E. Bayley (Chair), W. A. (Alf) Peneycad, and Robert L. Redfearn. All members of the Audit Committee have been determined to be independent and all members are considered to be financially literate. A member of an Audit Committee is independent if the member has no direct or indirect material relationship with the Company which could, in the view of the Board, reasonably interfere with the exercise of a member’s independent judgment. An individual is financially literate if he/she has the ability to read and understand a set of financial statements that present a breadth of complexity of accounting issues that are generally comparable to the breadth and complexity of the issues that can reasonably be expected to be raised by the Company’s financial statements. Mr. Bayley is considered to be the Audit Committee Financial Expert within the meaning of the SEC rules and regulations.
Relevant Education and Experience of Audit Committee Members
Brian E. Bayley
Brian E. Bayley holds an MBA from Queen’s University. Mr. Bayley has been the President of Ionic Management Corp. (private management company) since December 1996; Previously held the following positions with Sprott Resource Lending Corp., publicly traded (TSX and NYSE-Amex) lending company to resource issuers): Director from June 2003 to July 2013; Resource Lending Advisor from Sept. 2010 to June 2013; President and Chief Executive Officer from May 2009 to September 2010; Co-Chairman from January 2008 to May 2009; Chief Executive Officer from June 2003 to March 2008: and President from June 2003 to January 2008. He has also served as a director and/or officer of several other public companies.
W. A. (Alf) Peneycad
Alfred Peneycad is a graduate of Queen’s University Law School. He serves as a director of several public companies, including Parex Resources Inc., a Calgary-based oil and gas company with operations in Colombia and Trinidad & Tobago. Mr. Peneycad retired from Petro-Canada where he served as Vice-President, General Counsel and Chief Compliance Officer. Mr. Peneycad spent twenty-eight (28) years at Petro-Canada and while there, played a lead role in the acquisition of several major companies in Canada, the US and internationally.
28
Table of Contents
Robert L. Redfearn
Robert L. Redfearn is a graduate of Tulane University (B.B.A., J.D.), specializing in oil and gas related law. Prior to joining Deutsch, Kerrigan and Stiles, a New Orleans based law firm, where his practice centered around the oil and gas industry and included representation of clients in mergers of businesses and acquisitions of oil and gas properties, financings, complex litigation and arbitrations related to oil and gas, environmental concerns, and banking and securities, Mr. Redfearn was employed in the legal department of Humble Oil & Refining Company (now Exxon Corporation). In 1979, Mr. Redfearn became a founding partner of Simon, Peragine, Smith & Redfearn, L.L.P., where he continues his representation of clients as reflected above.
Reliance on the Exemption in Subsection 3.3(2) or Section 3.6
At no time since the commencement of the Company’s most recently completed financial year has the Company relied on the exemptions in Subsection 3.3(2) or Section 3.6 of National Instrument 52-110 – Audit Committees (“NI 52-110”)
Reliance on Section 3.8
At no time since commencement of the Company’s most recently completed financial year has the Company relied on Section 3.8 of NI 52-110.
Audit Committee Oversight
At no time since the commencement of the Company’s most recently completed financial year was a recommendation of the Audit Committee to nominate or compensate an external auditor not adopted by the Board.
Pre-Approval Policies and Procedures
The Audit Committee approves the engagement terms for all audit and non-audit services to be provided by the Company’s accountants before such services are provided to the Company or any of its subsidiaries.
The Audit Committee approved one hundred percent (100%) of the services provided to the Company and its subsidiaries described in “External Auditor Service Fees (By Category)” below.
Auditors Use of Non-Permanent Employees
None of the hours expended by KPMG LLP on its engagement to audit the Company’s financial statements for the fiscal year ended December 31, 2013, were performed by persons other than full-time permanent employees of KPMG LLP.
Audit Committee Report
The Audit Committee has reviewed and discussed the audited financial statements for the fiscal year ended December 31, 2013, with management and with KPMG LLP, the Company’s independent accountants. The Audit Committee has also discussed with KPMG LLP the matters required to be discussed by Statement on Auditing Standards No. 61, as amended (AICPA, Professional Standards, Vol. 1. AU section 380), as adopted by the Public Company Accounting Oversight Board in Rule 3200T. The Audit Committee received from KPMG LLP the written disclosures and the letter required by applicable requirements of the Public Company Accounting Oversight Board regarding KPMG LLP’s communications with the Audit Committee concerning independence, and has discussed with KPMG LLP its independence from the Company.
Based on the review and discussions referred to above, the Audit Committee recommended to the Board that the audited financial statements for the year ended December 31, 2013, be included in the Company’s Annual Report on Form 10-K for the year ended December 31, 2013, filed with the SEC.
29
Table of Contents
| Submitted by the Audit Committee of the Board | ||
| Brian E. Bayley (Chair) | ||
| W. A. (Alf) Peneycad | ||
| Robert L. Redfearn | ||
Corporate Governance Committee
The Corporate Governance Committee is responsible for making recommendations to the Board concerning the overall governance of the Company and assists the Board in the discharge of the Board’s duties with respect to the adopting and compliance with the Code of Business Conduct and Ethics, mandates, position descriptions and all other governance polices of the Company. Included in its mandate is the responsibility to develop the Company’s approach to governance issues, set corporate governance guidelines for the Board and assume responsibility for administration of the Company’s response to those guidelines for the determination of conflicts of interest. During 2013, the Corporate Governance Committee held no meetings. The corporate governance matters of the Company were addressed by the entire board to ensure that matters of corporate governance were addressed where necessary.
Compensation Committee
The Compensation Committee is responsible for determining the overall compensation strategy of the Company and administering the Company’s executive compensation program. As part of its mandate, the Compensation Committee approves the appointment and remuneration of the Company’s executive officers, including the Company’s Named Executive Officers identified in the Summary Compensation Table. The Compensation Committee is also responsible for reviewing the Company’s compensation policies and guidelines generally. See, “Statement of Executive Compensation – Compensation Discussion and Analysis – Compensation Governance”.
Code of Ethics
The Board has adopted a Code of Business Conduct and Ethics (“Code of Conduct”) applicable to directors, officers, employees and consultants of the Company. A copy of the Code of Conduct is provided to each of the above persons. A copy of the Code of Conduct can be found on www.sedar.com.
Nomination of Directors
The Board, acting as a whole, is responsible for proposing new nominees to the Board and for assessing the performance of directors on an ongoing basis. Factors considered for nominees include an appropriate mix of skills, knowledge and experience in business and a history of achievement. Directors are required to have available time to devote to the duties of the Board. The majority of directors comprising the Board must qualify as independent directors. The Board has not appointed a nominating committee to assess the effectiveness of the Board as a whole, the Committees and the contribution of individual directors, provided however, from time to time the Chairman of the Board surveys the Board to provide feedback on the effectiveness of the Board, following which the Chairman recommends changes to enhance the performance of the Board based on the survey feedback. The Board also reviews the composition and size of the Board and tenure of directors in advance of annual general meetings when directors are most commonly elected by the Company’s shareholders, as well as when individual directors indicate that their terms may end or that their status may change. The Board takes into account the number of directors required to carry out the duties of the Board effectively, and to maintain a diversity of view and experience. The Board will evaluate candidates recommended by the shareholders in the same manner as candidates recommended by other sources, using criteria, if any, developed and approved by the Board, from time to time.
Compensation
The Compensation Committee, comprised solely of independent directors, is responsible for providing recommendations to the Board in respect of: (i) compensation policies for senior management and directors of the Company; (ii) human resource policies and practices; and (iii) incentive and perquisite plans. The Compensation Committee has the ability to engage independent advisors in order to fulfill its mandate. The Company’s compensation package is comprised primarily of salary, cash incentive bonuses and the ability to participate in the Stock Option Plan. See the description following the heading “Executive Compensation – Compensation Discussion and Analysis”.
30
Table of Contents
Assessment of Directors
The process of assessing Board effectiveness is carried out through an informal process of engagement and dialogue between the Chair and the individual directors. Also the Board monitors the adequacy of information given to directors, the communications between the Board and management and the strategic direction and processes of the Board and its Committees in order to satisfy itself that the Board, its Committees and its individual directors are performing effectively. A formal assessment process may be considered if the size of the Board is expanded.
| ITEM 11. | EXECUTIVE COMPENSATION |
Statement of Executive Compensation – Compensation Discussion and Analysis
Compensation Committee Report
The Compensation Committee has reviewed and discussed the Compensation Discussion and Analysis section of this report with management. Based on such review and discussions, the Compensation Committee recommended to the Board that the Compensation Discussion and Analysis be included in this report.
| COMPENSATION COMMITTEE | ||
| Brian E. Bayley | ||
| William Gumma | ||
| W. A. Peneycad | ||
| Robert L. Redfearn (Chair) | ||
Overview
The Compensation Committee is responsible for determining the overall compensation strategy of the Company, administering the Company’s executive compensation program, making recommendations to the Board regarding compensation including incentive and equity-based compensation, reviewing and approving corporate goals and objectives relevant to the Chief Executive Officer, for proposals for the compensation of the executive officers, management and directors, for evaluations of performance to determine compensation, for employee benefit and retirement plans and all other matters related to compensation. The Compensation Committee is also responsible for reviewing the Company’s compensation policies and guidelines generally.
In connection with the Winding Up, all employees were terminated and the Company entered into consulting arrangements with Messrs. Cottman and Wimbish to provide services to the Company through dissolution.
Objectives of Compensation Program
Prior to the Winding Up, it was the objective of the executive compensation program to attract and retain highly qualified and experienced individuals to serve as executive officers and to align incentive compensation to performance and shareholder value. It was the goal of the Compensation Committee to endeavor to ensure that the compensation of executive officers was sufficiently competitive to achieve the objectives of the executive compensation program. The Compensation Committee gave consideration to the Company’s long-term interests and quantitative financial objectives, as well to the qualitative aspects of the individual’s performance and achievements. This objective of the consulting compensation arrangement was to ensure the continued services of key former employees through the final dissolution of the Company.
Risks of Compensation Policies and Practices
Prior to the Winding Up, the Company’s compensation program was designed to provide executive officers incentives for the achievement of near-term and long-term objectives, without motivating them to take unnecessary risk. As part of its review and
31
Table of Contents
discussion of executive compensation, the Compensation Committee noted the following facts that discourage the Company’s executives from taking unnecessary or excessive risk: (i) the Company’s operating strategy and related compensation philosophy; (ii) the effective balance, in each case, between cash and equity mix, near-term, and long-term focus, corporate and individual performance, and financial and non-financial performance; and (iii) the Company’s approach to performance evaluation and compensation provides greater rewards to an executive officer achieving both short-term and long-term agreed upon objectives. Based on this review, the Compensation Committee believed that the Company’s total executive compensation program did not encourage executive officers to take unnecessary or excessive risk.
Role of Executive Officers in Compensation Decisions
Prior to the Winding Up, the Compensation Committee received and reviewed recommendations of the Chief Executive Officer (and President, as applicable) relating to the general compensation structure and policies and programs for the Company and the salary and benefit levels for the executive officers.
Elements of Compensation
Prior to the Winding Up, the executive compensation program was comprised of three (3) principal components: base salaries, cash bonuses and stock options which are, collectively, designed to provide a combination of cash and equity–based compensation to effectively retain and motivate the executive officers to achieve the corporate goals and objectives. These elements contained both short-term incentives comprised of cash payments by way of base salaries and bonuses and long-term incentives by way of equity-based compensation. Other components of the executive compensation program included perquisites and other personal benefits. Each component of the executive compensation program is addressed separately below.
The amount for each element of the Company’s executive compensation program was determined based upon compensation levels provided by the Company’s competitors as well as upon the discretion of the Board, as described below. Each element of the Company’s executive compensation program contributed to an overall compensation package, which was designed to provide both short-term and long-term financial incentives to the executive officers and to thereby assist the Company to successfully implement its strategic plans. The Compensation Committee annually assessed how each element fits into the overall compensation package.
Compensation Committee Interlocks and Insider Participation
The Compensation Committee is comprised of Messrs. Redfearn (Chair), Bayley, Gumma, and Peneycad, none of whom are employees or current or former officers of the Company, or had any relationship with the Company required to be otherwise disclosed herein.
Compensation Governance
The policies and practices adopted by the Board to determine compensation of the Company’s executive officers and directors is described under “Statement of Executive Compensation – Compensation Discussion and Analysis” and “Director Compensation” respectively.
The Compensation Committee is comprised of four independent directors (being Messrs. Redfearn (Chair), Bayley, Gumma and Peneycad). The skills and experience of each Committee member in executive compensation that is relevant to his responsibilities and the making of decisions on the suitability of the Company’s compensation policies and practices are as follows:
| Robert L. Redfearn, Chair | Mr. Redfearn has a breadth of experience as a director and officer and has addressed compensation matters for companies’ executive officers. |
32
Table of Contents
| Brian E. Bayley | Mr. Bayley has served as a director of numerous public companies and is currently a director of two (2) TSX listed companies, serving on the Compensation Committee of one of those companies. Mr. Bayley has worked with compensation consultants and advisors in designing and implementing compensation programs for executive officers of public companies. | |
| William Gumma | Mr. Gumma has a breadth of experience as a director and officer and has experience setting compensation at one other public company. | |
| W. A. (Alf) Peneycad | Mr. Peneycad has been an independent businessman since 2006. Previously, Mr. Peneycad was Vice President, General Counsel and Chief Compliance Officer for Petro-Canada from 2003 to 2006, and Vice President, General Counsel and Corporate Secretary of Petro-Canada prior to 2003. Mr. Peneycad attended the Institute of Corporate Directors receiving an ICD.D designation. Mr. Peneycad is a director for several other Canadian public companies including Parex Resources Inc., Canadian Wireless Trust, and R Split III Corp. where he holds positions on the Audit, Finance, Corporate Governance and Human Resource Committees. Mr. Peneycad currently serves as the Chairman of the Corporate Governance and Compensation Committee for Parex Resources Inc. | |
The Compensation Committee is responsible for determining the overall compensation strategy of the Company and administering the Company’s executive compensation program. As part of its mandate, the Compensation Committee approves the appointment and remuneration of the Company’s executive officers, including the Company’s Named Executive Officers identified in the Summary Compensation Table. The Compensation Committee is also responsible for reviewing the Company’s compensation policies and guidelines generally.
Base Salaries
Prior to the Winding Up, salaries for executive officers were reviewed annually based on corporate and personal performance and on individual levels of responsibility and were set to be competitive with industry levels. Salaries of the executive officers were not determined based on benchmarks or a specific formula. Consideration was given to compensation packages that may have been available to such executive officers from other employment opportunities and commercially available data on salaries disclosed by competitors and peers. The Compensation Committee would submit its recommendation to the Board as to salary of the Chief Executive Officer and as applicable, the President. The Compensation Committee considered, and, if thought appropriate, also submitted to the Board recommendations for salaries for the other executive officers based on those salaries recommended by the Chief Executive Officer and as applicable, the President. As stated above, base salaries were established to be competitive in order to attract and retain highly qualified and experienced individuals.
Bonus and Bonus Goals
For 2011 performance, Mr. Dobson received a cash bonus of $50,000, or 25% of his base salary, for accomplishing the operational goals. During 2011, none of the financial goals were achieved and Messrs. Cottman and Wimbish did not receive bonuses. During 2012, none of the financial goals were achieved and no bonuses were paid. No bonuses were paid during 2013.
Stock Option Plan
The Compensation Committee also administered the incentive stock option plan that was designed to provide a long-term incentive that was aligned with shareholder value. The Compensation Committee made recommendations to the Board regarding the number of
33
Table of Contents
options to be granted to each executive officer based on the level of responsibility and experience of the individual, the performance of the individual and the number of stock options previously granted to the individual. The Compensation Committee regularly reviewed and where appropriate adjusted the number of options granted to executive officers. The Compensation Committee set the number of options as appropriate designed to attract and retain qualified and talented executive officers. Other than set forth above, recommendations with respect to the payment of bonuses were not based on a specific formula or benchmarks. No options were granted during 2013.
Perquisites and Other Components
Prior to the Winding Up, other components of compensation included perquisites and personal benefits as determined by the Compensation Committee and recommended to the Board that were consistent with the overall compensation strategy. There was no specific formula or benchmarks for assessing how perquisites or personal benefits were utilized in the total compensation package. The Company does not provide any pension or retirement benefits to its executive officers.
Severance and Consulting Payments
On January 24, 2012, the Board decided not to renew the employment contract of Dr. Sven Hagen, President, as a means to streamline management. Effective January 24, 2012, Dr. Hagen was no longer a director or officer of the Company or Legacy. In connection therewith, the Company and Dr. Hagen entered into a separation agreement dated January 24, 2012 pursuant to which the Company agreed to provide Dr. Hagen with the following severance benefits:
| • | Aggregate severance of $120,000, payable in equal monthly installments during 2012; |
| • | Monthly reimbursement of health and dental insurance premiums in the amount of $1,414.26 through September 15, 2012; and |
| • | Accelerated vesting of 400,001 options, with an exercise price of Cdn $1.25 that would have otherwise vested on September 4, 2012. |
Messrs. Cottman and Wimbish were employed by Legacy under employment agreements dated April 29, 2008, amended January 1, 2009 and December 12, 2011, respectively. Mr. Dobson was employed by Legacy under an employment contract dated January 1, 2012. These agreements specified base salaries of at least $200,000 per annum. These employment agreements included change of control provisions which entitled the executives to receive severance payments in connection with the Sale of Assets. The severance payments were equal to three (3) times the executive’s base salary in the case of Messrs. Cottman and Wimbish and two (2) times the executive’s base salary in the case of Mr. Dobson. The executives were also entitled to receive continued coverage, for a period of not more than two (2) years in all employer life, accidental death, medical and dental insurance plans.
The following table sets forth the amounts paid to each of the Named Executive Officers as a result of a change of control upon consummation of the Sale of Assets.
| Name |
Severance(1) ($) |
Other (2) ($) |
Total ($) |
|||||||||
| Clarence Cottman III |
750,000 | 140,885 | 890,885 | |||||||||
| Jonathan S. Wimbish |
660,000 | 119,932 | 779,932 | |||||||||
| D. Scott Dobson |
440,000 | 51,923 | 491,923 | |||||||||
Notes:
| (1) | The base salary for Messrs. Cottman, Wimbish, and Dobson was $250,000, $220,000 and $220,000 respectively, at the time of the Sale of Assets. The severance amount listed in the table above, represent (3) times such base salary for Messrs. Cottman and Wimbish and (2) times such base salary for Mr. Dobson. |
| (2) | The “Other” amount listed above represents the payment of tax-adjusted health, dental and life insurance benefits for Messrs. Cottman, Wimbish, and Dobson for the two (2) years, and unused vacation and sick days. |
34
Table of Contents
Following the completion of the Sale of Assets, and in connection with the Winding Up, all employees of Legacy were terminated, and the Board of Directors approved retention of Messrs. Cottman and Wimbish as consultants to complete the dissolution and liquidation of Legacy and the Winding Up. Messrs. Cottman and Wimbish are being paid $20,833 and $18,333 per month respectively. One half of this monthly fee was paid from August 2012 through December 2013. The remaining half will be paid out in one lump sum upon the Winding Up of the Company. The consulting fees are equivalent to the base salary each was receiving prior to the Sale of Assets.
| Name |
Deferred Compensation ($) |
|||
| Clarence Cottman III |
239,580 | |||
| Jonathan S. Wimbish |
210,830 | |||
Performance Graph
The following graph compares the percentage change in the cumulative shareholder return over the last three (3) years of the (post-consolidated) Common Shares of the Company (assuming a Cdn$100 investment was made on January 1, 2011) and the cumulative total return of the S&P/TSX Composite Index.
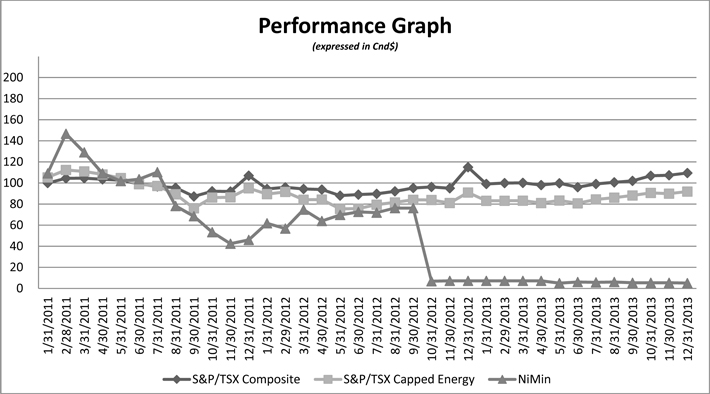
35
Table of Contents
ASSUMES $100 INVESTED ON JANUARY 1, 2011
ASSUMES DIVIDEND REINVESTED
FISCAL YEAR END DECEMBER 31, 2013
(Expressed in Canadian dollars)
| 12/31/2011 | 12/31/2012 | 12/31/2013 | ||||||||||
| NiMin Energy Corp. |
46 | 7 | (1) | 5 | ||||||||
| S&P/TSX Composite |
107 | 115 | 109 | |||||||||
| S&P/TSX Capped Energy |
95 | 91 | 92 | |||||||||
Notes:
| (1) | This reflects the initial distribution to Shareholders paid in October 2012. |
As described above under the “Compensation Discussion and Analysis - Elements of Compensation”, the Company’s executive compensation program consisted of a combination of cash and equity based compensation. When determining compensation, the Compensation Committee and the Board considered a number of factors, one of which was corporate performance. As a result there is no direct correlation between the trend shown in the performance graph and the trend in compensation to executive officers reported over the same period.
Option Based Awards
For a description of the process that the Company used to grant option-based awards to executive officers including the role of the Compensation Committee, see the description under “Statement of Executive Compensation – Compensation Discussion and Analysis – Elements of Compensation”.
Summary Compensation
Securities legislation requires the disclosure of compensation received by each “Named Executive Officer” of the Company for the most recently completed financial year. “Named Executive Officer” is defined by the legislation to mean (i) each of Chief Executive Officer and Chief Financial Officer of the Company (ii) each of the Company’s three (3) most highly compensated executive officers, or the three (3) most highly compensated individuals acting in a similar capacity, other than the Chief Executive Officer and Chief Financial Officer, at the end of the most recently completed financial year and whose total compensation exceeds Cdn $150,000, and (iii) any additional individual for whom disclosure would have been provided under (ii) but for the fact that the individual was not serving as an executive officer of the Company at the end of the most recently completed financial year end of the Company.
“Executive Officer” is defined by the legislation to mean (i) the chair, vice-chair or president of the Company, (ii) a vice-president of the Company in charge of a principal business unit, division or function including sales, finance or production, or (iii) an individual performing a policy-making function in respect of the Company.
The following table sets forth a summary of all compensation for services paid during the financial years ended December 31, 2013, 2012 and 2011, for Clarence Cottman III, Chief Executive Officer (“CEO”) (appointed in September 2009), Dr. E. Sven Hagen, former President (appointed in September 2009 and resigned January 24, 2012), Jonathan S. Wimbish, Chief Financial Officer (“CFO”) (appointed in September 2009), and D. Scott Dobson, former Chief Operating Officer (“COO”) (appointed Vice President of Operations in January 2011 and promoted to COO in September 2011) and resigned in August, 2012 (collectively, the “Named Executive Officers” for the years set out therein).
36
Table of Contents
SUMMARY COMPENSATION TABLE
| Option-based awards ($) |
Non-equity incentive plan compensation ($) |
|||||||||||||||||||||||||||||
| Name and principal position |
Year | Salary ($) |
Share- based awards ($) |
Options Granted(1)(2) ($) |
Replacement Options ($) |
Annual incentive plans(6) |
Long term incentive plans |
Pension value ($) |
All other compensation ($)(7)(8) |
Total compensation ($) |
||||||||||||||||||||
| Clarence Cottman III(3)(7) CEO |
2013 2012 |
|
Nil 145,833 |
|
Nil Nil |
|
Nil Nil |
|
Nil Nil |
|
Nil Nil Nil |
|
Nil Nil |
Nil Nil |
|
124,998(8) 942,968(8) |
|
|
124,998 1,088,801 |
| ||||||||||
| Dr. E. Sven Hagen(3) (4) President |
2012 2011 |
|
Nil 240,155 |
|
Nil Nil |
|
Nil Nil |
|
Nil Nil |
|
Nil Nil |
|
Nil Nil |
Nil Nil |
|
132,726 14,868 |
(8)
|
|
132,726 255,023 |
| ||||||||||
| Jonathan S. Wimbish(3) CFO |
2013 2012 |
|
Nil 128,333 |
|
Nil Nil |
|
Nil Nil |
|
Nil Nil |
|
Nil Nil Nil |
|
Nil Nil |
Nil Nil |
|
109,998(8) 825,765(8) |
|
|
109,998 954,098 |
| ||||||||||
| D. Scott Dobson(5) COO |
2012 2011 |
|
128,333 204,605 |
|
Nil Nil |
|
Nil 275,658 |
|
Nil Nil |
|
Nil 50,000 |
|
Nil Nil |
Nil Nil |
|
509,923 8,187 |
(8)
|
|
638,256 538,450 |
| ||||||||||
Notes:
| (1) | The value of the option-based awards represents the fair value, on the date of grant, of awards under the Stock Option Plan of the Company. The grant date fair value has been calculated using the Black-Scholes Model and reflects assumptions for risk-free interest rate, expected life, expected stock price volatility and expected dividend yield. (See Consolidated Financial Statements – Note 10.) All options were terminated in July 2012. |
| (2) | The 2011 stock option were awarded in Canadian dollars and exercise prices are also in Canadian dollars. The $ figures are based on an exchange rate as at January 10, 2011 of Cdn $1.00 = $1.006, January 25, 2011 of Cdn $1.00 = $1.0053 and November 23, 2011 of Cdn $1.00 = $0.959. All options were terminated in July 2012. |
| (3) | Appointed as a Named Executive Officer of the Company on September 4, 2009, in connection with completion of the Legacy Acquisition. Dr. Hagen resigned as an officer and director of the Company on January 24, 2012. |
| (4) | Dr. Hagen also served as a director of the Company for the years listed. All of the compensation paid to Mr. Cottman and Dr. Hagen relate to their positions as Named Executive Officers and none of their compensation relates to their roles as directors. |
| (5) | Mr. Dobson was named COO on September 1, 2011. Previously, Mr. Dobson served as Vice President of Operations. Mr. Dobson was named Vice President of Operations in January, 2011. He previously served as Operations Manager. Mr. Dobson resigned in August, 2012. |
| (6) | In 2012, Mr. Dobson was paid a cash bonus of $50,000 for achievement of the performance goals established under the 2011 bonus plan. |
| (7) | Includes perquisites and benefits including Company paid premiums for health, dental and life insurance. |
| (8) | Includes severance and consulting compensation as follows: |
| 2013 |
||||||||
| Severance | Consulting | |||||||
| Mr. Cottman |
$ | Nil | $ | 124,998 | ||||
| Mr. Wimbish |
$ | Nil | $ | 109,998 | ||||
| 2012 |
||||||||
| Severance | Consulting | |||||||
| Mr. Cottman |
$ | 890,885 | $ | 52,083 | ||||
| Dr. Hagen |
$ | 132,726 | $ | Nil | ||||
| Mr. Wimbish |
$ | 779,932 | $ | 45,832 | ||||
| Mr. Dobson |
$ | 491,923 | $ | 18,000 | ||||
37
Table of Contents
Incentive Plan Awards
The table below supplements the Summary Compensation Table by providing additional information about plan-based compensation for the financial year ended December 31, 2013.
| Name |
Grant Date |
Estimated Future Payouts Under Non-Equity Incentive Plan Awards |
Estimated Future Payouts Under Equity Incentive Plan Awards |
All Other Stock Awards: Number of Shares of Stock |
All Other Option Awards: Number of Securities Underlying Options |
Exercise or Base Price of Option Awards Cdn $ |
Grant Date Fair Value of Stock and Option Awards $ | |||||||||||||||||||||||||||||
| Threshold $ |
Target $ |
Maximum $ |
Threshold | Target | Maximum | |||||||||||||||||||||||||||||||
| Clarence Cottman, III |
— | — | — | — | — | — | — | |||||||||||||||||||||||||||||
| Jonathan S. Wimbish |
— | — | — | — | — | — | — | |||||||||||||||||||||||||||||
Outstanding Share-Based Awards and Option-Based Awards
The following table sets forth information in respect of all share-based awards and option-based awards outstanding at the end of the financial year ended December 31, 2013, to the Named Executive Officers of the Company.
Outstanding Share-Based Awards and Option-Based Awards
| Option-based Awards | Share-based Awards | |||||||||||||
| Name |
Number of securities underlying unexercised options(6) (#) |
Option exercise price Cdn ($) |
Option expiration date(6) |
Value of unexercised in-the-money options(1) ($) |
Number of shares or units of shares that have not vested (#) |
Market or payout value of share-based awards that have not vested ($) | ||||||||
| Clarence Cottman III(2)(5) CEO |
Nil | Nil | Nil | — | Nil | Nil | ||||||||
| Dr. E. Sven Hagen(2)(3)(5) President |
Nil | Nil | Nil | — | Nil | Nil | ||||||||
| Jonathan S. Wimbish(2) CFO |
Nil | Nil | Nil | — | Nil | Nil | ||||||||
| D. Scott Dobson(4) COO |
Nil | Nil | Nil | — | Nil | Nil | ||||||||
Notes:
| (1) | The closing market price of the Common Shares on December 31, 2013, being the last trading day in the 2013 calendar year, was Cdn $0.07. |
| (2) | Appointed as a Named Executive Officer of the Company on September 4, 2009, in connection with completion of the Legacy Acquisition. |
| (3) | Dr. Hagen resigned as President and a director on January 24, 2012. |
| (4) | Mr. Dobson was named COO on September 1, 2011. Previously, Mr. Dobson served as Vice President of Operations. Mr. Dobson was named Vice President of Operations in January, 2011. He previously served as Operations Manager. Mr. Dobson resigned in August, 2012. |
| (5) | Mr. Cottman and Dr. Hagen also served as directors of the Company during the financial year ended December 31, 2012. All of the compensation paid to Mr. Cottman and Dr. Hagen relate to their positions as Named Executive Officers and none of their compensation relates to their roles as directors. |
| (6) | All options were terminated in July 2012. |
38
Table of Contents
Incentive Plan Awards – Value Vested or Earned During the Year
The following table sets forth information in respect of the value vested or earned during the Company’s financial year ended December 31, 2013, of option-based awards, share-based awards and non-equity incentive plan compensation for Named Executive Officers of the Company.
Value Vested or Earned of Incentive Plan Awards
during the Financial Year Ended December 31, 2013
| Name |
Option-based awards – Value vested during the year ($) |
Share-based awards – Value vested during the year ($) |
Non-equity incentive plan compensation – Value earned during the year ($) | |||
| Clarence Cottman III(1)(3) CEO |
Nil | Nil | Nil | |||
| Dr. E. Sven Hagen(1)(3) President |
Nil | Nil | Nil | |||
| Jonathan S. Wimbish(1) CFO |
Nil | Nil | Nil | |||
| D. Scott Dobson(2) COO |
Nil | Nil | Nil |
Notes:
| (1) | Appointed as a Named Executive Officer of the Company on September 4, 2009, in connection with completion of the Legacy Acquisition. |
| (2) | Mr. Dobson was named COO on September 1, 2011. Previously, Mr. Dobson served as Vice President of Operations. Mr. Dobson was named Vice President of Operations in January, 2011. He previously served as Operations Manager. Mr. Dobson resigned in August, 2012. |
| (3) | Mr. Cottman and Dr. Hagen also served as directors of the Company during the financial year ended December 31, 2012. All of the compensation paid to Mr. Cottman and Dr. Hagen relate to their positions as Named Executive Officers and none of their compensation relates to their roles as directors. |
None of the Named Executive Officers exercised any vested option-based awards during 2013 and all options were terminated in July 2012.
Pension Plan Benefits
Defined Benefit Plans Table
The Company does not have a pension or retirement plan.
Deferred Compensation Plans
The Company does not have a deferred compensation plan.
Director Compensation
The Compensation Committee reviews and makes recommendations to the Board with respect to compensation of the Board and committee members. Directors who are employees of the Company receive no compensation for service as members of the Board. Directors who are not also employees (“Non-Employee Directors”) are entitled to receive compensation.
From time to time Non-Employee Directors are also granted options. Pursuant to our policies, we also reimburse our directors for reasonable expenses incurred in the performance of their duties, including reimbursement for air travel and hotel expenses.
39
Table of Contents
Director Compensation Table
The following table sets forth information in respect of all amounts of compensation provided to the directors during the Company’s financial year ended December 31, 2013.
| Name |
Fees earned ($) |
Share- based awards ($) |
Option- based awards ($) |
Non-equity incentive plan compensation ($) |
Pension value ($) |
All other compensation ($) |
Total ($) |
|||||||||||||
| Brian E. Bayley(1) |
45,000 | — | Nil | Nil | Nil | Nil | 45,000 | |||||||||||||
| W. A. (Alf) Peneycad(1) |
45,000 | — | Nil | Nil | Nil | Nil | 45,000 | |||||||||||||
| Robert L. Redfearn(1) |
45,000 | — | Nil | Nil | Nil | Nil | 45,000 | |||||||||||||
| William Gumma(2) |
45,000 | — | Nil | Nil | Nil | Nil | 45,000 | |||||||||||||
Notes:
| (1) | Appointed as a director of the Company on September 4, 2009, in connection with the completion of the Legacy Acquisition. |
| (2) | Elected as a director of the Company on June 24, 2011. |
Outstanding Share-Based Awards and Option-Based Awards
The following table sets forth information in respect of all share-based awards and option-based awards outstanding at the end of the financial year ended December 31, 2013, to the directors of the Company.
Outstanding Share-Based Awards and Option-Based Awards
at the end of the Financial Year Ended December 31, 2013
| Option-based Awards | Share-based Awards | |||||||||||
| Name |
Number of securities underlying unexercised options(5) (#) |
Option exercise price (Cdn$) |
Option expiration date(4) |
Value of unexercised in-the-money options (Cdn $)(1) |
Number of shares or units of shares that have not vested (#) |
Market or payout value of share-based awards that have not vested ($) | ||||||
| Brian E. Bayley(2) |
Nil | Nil | Nil | — | Nil | Nil | ||||||
| W. A. (Alf) Peneycad(2) |
Nil | Nil | Nil | — | Nil | Nil | ||||||
| Robert L. Redfearn(2) |
Nil | Nil | Nil | — | Nil | Nil | ||||||
| William Gumma(3) |
Nil | Nil | Nil | — | Nil | Nil | ||||||
Notes:
| (1) | The closing market price of the Common Shares on December 31, 2013, being the last trading day of the 2013 calendar year, was Cdn $0.07. |
| (2) | Appointed as a director of the Company on September 4, 2009, in connection with the completion of the Legacy Acquisition. |
| (3) | Elected as a director of the Company on June 24, 2011. |
| (4) | All options were terminated in July 2012. |
Incentive Plan Awards – Value Vested or Earned During the Year
The following table sets forth information in respect of the value vested or earned during financial year ended December 31, 2013, of option-based awards, share-based awards and non-equity incentive plan compensation for directors of the Company.
40
Table of Contents
Value Vested or Earned of Incentive Plan Awards
during the Financial Year Ended December 31, 2013
| Name(3) |
Option-based awards – ($) |
Share-based awards – year ($) |
Non-equity incentive plan earned during the year ($) | |||
| Brian E. Bayley(1) |
Nil | Nil | Nil | |||
| W. A. (Alf) Peneycad(1) |
Nil | Nil | Nil | |||
| Robert L. Redfearn(1) |
Nil | Nil | Nil | |||
| William Gumma(2) |
Nil | Nil | Nil |
Notes:
| (1) | Appointed director of the Company on September 4, 2009, in connection with the completion of the Legacy Acquisition. |
| (2) | Elected as a director of the Company on June 24, 2011. |
| (3) | Compensation for Mr. Cottman, CEO and a director of the Company, and Dr. Hagen, formerly a President and a director of the Company, during the Company’s financial year ended December 31, 2013, has been previously provided under “Summary Compensation”. |
Securities Authorized for Issuance Under Equity Compensation Plans
The following table sets forth information as at December 31, 2013, with respect to the Company’s compensation plans under which equity securities of the Company are authorized for issuance.
| Plan Category | Number of securities to be issued upon exercise of outstanding options, warrants and rights |
Weighted-average exercise price of outstanding options, warrants and rights ($) |
Number of securities remaining available for future issuance under equity compensation plans (excluding securities reflected in column (a)) | |||
| Equity compensation plans approved by securityholders |
Nil | Nil | Nil | |||
| Equity compensation plans not approved by securityholders |
Nil | Nil | Nil | |||
| Total |
Nil | Nil | Nil |
Stock Option Plan
As of December 31, 2013, no options issued pursuant to the Stock Option Plan were outstanding. No options were granted during 2013 and all options were terminated in July 2012.
Indebtedness of Directors and Executive Officers
The aggregate indebtedness to the Company of all officers, directors, employees and any former officers, directors and employees of the Company outstanding as at December 31, 2013, was zero.
Financial Instruments
The Company does not have a policy that would prohibit a Named Executive Officer or director from purchasing financial instruments, including prepaid variable forward contracts, equity swaps, collars or units of exchange funds, that are designed to hedge or offset a decrease in market value of equity securities granted as compensation or held, directly or indirectly, by the Named Executive Officer or director. However, management is not aware of any Named Executive Officer or director purchasing such an instrument.
41
Table of Contents
ITEM 12. SECURITY OWNERSHIP OF CERTAIN BENEFICIAL OWNERS AND MANAGEMENT AND RELATED STOCKHOLDERS MATTERS
The following table sets forth information as of the date of the Annual Report with respect to the beneficial ownership of Common Shares held by each person known by the Company to beneficially own or exercise control or direction over, directly or indirectly, more than five percent (5%) of the voting rights attached to all outstanding Common Shares, each of the Company’s directors and all executive officers and directors as a group.
Except as otherwise noted, information in the following table is as of March 24, 2014. The number of shares beneficially owned by each person or entity is calculated pursuant to rules promulgated by the SEC. Under those rules, a person or entity is considered to beneficially own all shares for which the person or entity has sole or shared voting or dispositive power, and all shares that the person or entity has the right to acquire within 60 days after March 24, 2014.
| Name and Address of Beneficial Owner |
Number of Shares Beneficially Owned(1) |
Percentage of Common Stock Outstanding(2) |
||||||
| 5% Stockholders(3) |
||||||||
| Indaba Capital Management, LLC |
10,942,757 | 15.67 | % | |||||
| One Letterman Drive |
||||||||
| Building D, Suite DM700 |
||||||||
| San Francisco, CA 94129 |
||||||||
| Credit Suisse (Canada) |
6,999,700 | 10.02 | % | |||||
| Citigroup Global Markets Inc. |
4,757,000 | 6.81 | % | |||||
| Executive Officers & Directors(5) |
||||||||
| Clarence Cottman, III(4) |
2,153,400 | 3.08 | % | |||||
| Jonathan S. Wimbish(4) |
533,242 | * | ||||||
| Brian E. Bayley(4) |
155,000 | * | ||||||
| W.A. Peneycad(4) |
130,000 | * | ||||||
| Robert L. Redfearn(4) |
173,000 | * | ||||||
| William Gumma(4) |
67,150 | * | ||||||
| All executive officers and directors as a group (6 persons)(4) |
3,211,792 | 4.59 | % | |||||
| * | Represents less than 1% of the class. |
| (1) | The inclusion of any Common Shares deemed beneficially owned does not constitute an admission of beneficial ownership of those shares. Unless otherwise indicated, each person or entity has sole voting or dispositive power with respect to the Common Shares identified as being beneficially owned by that person or entity. |
| (2) | Percentage ownership calculations are based on 69,834,396 common shares outstanding as of March 24, 2014. Any shares that a person or entity has the right to acquire within 60 days after March 24, 2014, are deemed to be outstanding for the purpose of calculating the percentage of outstanding common shares owned by that person or entity, but not for the purpose of calculating the percentage ownership of any other person or entity. |
| (3) | The information as to the Common Shares beneficially owned, controlled or directed, not being within the knowledge of the Company, has been obtained by the Company from publicly disclosed information and/or furnished by the shareholder listed above as of March 24, 2014. |
| (4) | Represents only Common Shares owned. |
| (5) | The executive officers and directors hold this position as of the date of this Annual report. |
42
Table of Contents
Transactions by the Company’s Directors and Executive Officers
There have been no transactions in Common Shares by directors and executive officers of NiMin within the sixty (60) days prior to the date of this report.
Section 16(a) Beneficial Ownership Reporting Compliance
Section 16(a) of the Securities Exchange Act of 1934 requires our directors and executive officers, persons who beneficially own more than ten percent of a registered class of our equity securities, and certain other persons to file reports of ownership and changes in ownership on Forms 3, 4 and 5 with the Securities and Exchange Commission (“SEC”), and to furnish the Company with copies of the forms. Our directors, executive officers and greater than ten percent beneficial owners filed timely all such required reports during 2013.
| ITEM 13. | CERTAIN RELATIONSHIPS AND RELATED TRANSACTIONS, AND DIRECTOR INDEPENDENCE |
Each director and officer who has a material interest of any kind in any existing or proposed transaction or agreement with the Company is required to abide by the disclosure requirements set out in Section 120 of the “Business Corporations Act (Alberta) (“ABCA”)”, and must comply with the steps set out in the Company’s Code of Conduct, including: (a) disclosing the nature and extent of his or her interest to the Board at the meeting at which a proposed contract or transaction in which the director or officer has an interest is first considered or at the first meeting after the director or officer becomes interested; (b) upon the request of the Board upon it being advised of the conflict, excusing him or herself from all Board or Committee deliberations in respect of the existing or proposed transaction or agreement; (c) abstaining from voting in respect of the existing or proposed transaction or agreement in which the director or officer has a material interest; and (d) abiding by all of the requirements set out in section 120 of the ABCA.
Furthermore, directors, officers, management and employees of the Company are not permitted to take steps contrary to the best interests of the Company and each member of management and employees shall conduct their business affairs in a manner that ensures their private or personal interests do not conflict with the interests of the Company, including conflicts relating to personal, financial or other gain. Prior to acknowledging compliance with the Company’s Code of Conduct, and at any time when a conflict arises, directors, officers, management and employees are required to report in writing their existing or potential conflicts of interest to the Chairman of the Corporate Governance Committee.
Management, with the assistance of advisors, sought potential purchasers of the beneficial interests of the Liquidating Trust, the patents for the CMD process and the right to an existing overriding royalty on non-producing properties (“Remaining Assets’). Ultimately Management and its advisors concluded that they could not find an arm’s length purchaser for the Remaining Assets. Management and the Board considered the requirements of the dissolution of NiMin and management introduced a proposed non-arm’s length purchaser for the Remaining Assets. Pacific Oil and Gas LLC is a private company owned by Clancy Cottman and Bill Gumma, two directors of the Company. The Board discussed the attributes of this potential purchase and sale. The Independent members of the Board confirmed with management that the terms of the purchase and sale and the assets/liabilities to be placed within the Liquidating Trust and the Remaining Assets were the same as had been presented to arm’s length potential purchasers. Management also confirmed that no additional benefits would accrue to the non-arm’s length purchaser that had not been made available to other potential purchasers. The Company sold the Remaining Assets to Pacific Oil and Gas LLC for aggregate proceeds of $1,000.
In addition thereto, the Company has adopted a disclosure policy to ensure the communications to the investing public about the Company are timely, factual and accurate and broadly disseminate in accordance with applicable legal and regulatory requirements, and an insider trading and reporting policy in order to summarize the insider trading restrictions to which directors, officers, consultants and employees of the Company are under applicable securities legislation, and to provide a policy governing investments in the Company shares and the reporting thereof which is consistent with applicable legislation and the goals of the Company and a whistleblower protection policy with respect to the reporting of violation of accounting and auditing irregularities, ethics violations or other violations.
Furthermore the Board considers that fiduciary duties placed on individual directors pursuant to corporate legislation and common law, and the conflict of interest provisions under corporate legislation which restricts an individual director’s participation in decisions of the Board in which the director has an interest, also ensure that the Board operates independently of management and in the best interests of shareholders.
43
Table of Contents
| ITEM 14. | PRINCIPAL ACCOUNTING FEES AND SERVICES |
External Auditor Service Fees (By Category)
The following table discloses the fees billed to the Company by KPMG LLP, its external auditor during the last two (2) financial years:
| Financial Year Ended | Audit Fees(1) ($) |
Audited Related Fees(2) ($) |
Tax Fees(3) ($) |
All Other Fees(4) ($) | ||||
| 2013 2012 |
170,000 475,500 |
— — |
70,738 155,356 |
— — |
Notes:
| (1) | Total Audit Fees for the financial years ended 2013 and 2012, were $170,000 and $475,000, respectively, which included liquidation accounting fees related to the dissolution of the Company. |
| (2) | The aggregate fees billed for assurance and related services that are reasonably related to the performance of the audit or review of the Company’s financial statements and are not disclosed in the “Audit Fees” column. |
| (3) | The aggregate fees billed for tax compliance, tax advice and tax planning services. |
| (4) | The aggregate fees billed for professional services other than those listed in the other three (3) columns. |
Reliance on certain exemptions
During the most recently completed financial year, the Company has not relied on the exemptions in Section 2.4, 3.2, 3.4 and 3.5 or an exemption from NI 52-110.
44
Table of Contents
| ITEM 15. | EXHIBITS AND FINANCIAL STATEMENT SCHEDULES |
EXHIBITS
| 3.1 | Articles of Incorporation of NiMin Energy Corp., as amended*. | |
| 3.2 | Bylaws of NiMin Energy Corp*. | |
| 4.1 | Form of Share Certificate of Common Shares of NiMin Energy Corp*. | |
| 10.1 | Agreement and Plan of Merger by and among NiMin Capital Corp., NiMin Merger Co. and Legacy Energy, Inc. dated as of July 17, 2009*. | |
| 10.2 | Credit Agreement by and among Legacy Energy, Inc., NiMin Energy Corp., CLMG Corp., and Certain Lenders, dated as of June 30,2010*. | |
| 10.3 | 2009 Stock Option Plan, effective September 4, 2009*. | |
| 10.4 | Form of Stock Option Agreement*. | |
| 10.5 | Warrant Indenture between NiMin Capital Corp. and Computershare Trust Company of Canada dated August 28, 2009*. | |
| 10.6 | Employment Agreement by and between Legacy Energy, Inc. and Clarence Cottman, III dated as of April 29, 2008*. | |
| 10.7 | Amendment to Employment Agreement by and between Legacy Energy, Inc. and Clarence Cottman III dated as of January 1, 2009*. | |
| 10.8 | Employment Agreement by and between Legacy Energy, Inc. and E. Sven Hagan dated as of April 29, 2008*. | |
| 10.9 | Amendment to Employment Agreement by and between Legacy Energy, Inc. and E. Sven Hagan dated as of January 1, 2009*. | |
| 10.10 | Employment Agreement by and between Legacy Energy, Inc. and Jonathan S. Wimbish dated as of April 29, 2008*. | |
| 10.11 | Amendment to Employment Agreement by and between Legacy Energy, Inc. and Jonathan S. Wimbish dated as of January 1, 2009*. | |
| 10.12 | Employment Agreement by and between Legacy Energy, Inc. and Rick McGee dated as of April 29, 2008*. | |
| 10.13 | Amendment to Employment Agreement by and between Legacy Energy, Inc. and Rick McGee dated as of January 1, 2009*. | |
| 10.14 | Credit Agreement between Legacy Energy, Inc. and Texas Capital Bank, N.A. dated June 23, 2008*. | |
| 10.15 | Second Amended and Restated Schedule to the ISDA 1992 Master Agreement between BP Corporation North America, Inc. and Legacy Energy, Inc. dated June 30, 2010*. | |
| 10.16 | CPC Escrow Agreement among NiMin Capital Corp., Computershare Trust Company of Canada and each of the Securityholders named in the Escrow Agreement, dated as of September 27, 2007*. | |
| 10.17 | Intercreditor Agreement among BP Corporation North America, Inc., Legacy Energy, Inc., NiMin Energy Corp., and CLMG Corp. dated as of June 30, 2010*. | |
| 10.18 | Guaranty Agreement by NiMin Energy Corp. in favor of BP Corporation North America, Inc. dated June 30, 2010*. | |
| 10.19 | Wyoming Loan*. | |
| 10.20 | Purchase and Sale Agreement by and between Vernon E. Faulconer, Inc., and Legacy Energy, Inc. Dated November 10, 2009*. | |
| 10.21 | Agency Agreement dated effective April 29, 2010 among NiMin, Legacy and Thomas Weisel Partners Canada, Inc.* | |
| 10.22 | ISDA Master Agreement between B.P. Corporation North America, Inc. and Legacy dated April 1, 2009*. | |
45
Table of Contents
| 10.23 | Amended and Restated Schedule to the ISDA Master Agreement between BP Corporation North America, Inc., and Legacy, dated January 4, 2010*. | |
| 10.24 | Purchase and Sale Agreement among Legacy Energy, Inc., NiMin Energy Corp. and Southern San Joaquin Production, LLC dated April 26, 2012** | |
| 10.25 | Purchase and Sale Agreement among Legacy Energy, Inc., NiMin Energy Corp. and Breitburn Operating L.P. dated April 24, 2012*** | |
| 10.26 | First Amendment to Credit Agreement dated as of May 18, 2012 by and among Legacy Energy, Inc., NiMin Energy Corp., CLMG Corp., as administrative agent and the lenders party to the Credit Agreement dated as of June 30, 2010**** | |
| 21.1 | List of Subsidiaries*. | |
| 31.1 | Certification of Chief Executive Officer Pursuant to Section 302 of the Sarbanes-Oxley Act of 2002. | |
| 31.2 | Certification of Chief Financial Officer Pursuant to Section 302 of the Sarbanes-Oxley Act of 2002. | |
| 32.1 | Certification of Chief Executive Officer and Chief Financial Officer Pursuant to Section 906 of the Sarbanes-Oxley Act of 2002. | |
101.INS: XBRL Instance Document
101.SCH: XBRL Taxonomy Extension Schema Document
101.CAL: XBRL Taxonomy Extension Calculation Linkbase Document
101.DEF: XBRL Taxonomy Extension Definition Linkbase Document
101.LAB: XBRL Taxonomy Extension Label Linkbase Document
101PRE: XBRL Taxonomy Extension Presentation Linkbase Document
| * | Incorporated by reference to Exhibits to the Company’s Registration Statement (file No.000-54162). |
| ** | Incorporated by reference to Exhibit 10.1 to the Company’s Current Report on Form 8-K filed on May 2, 2012. |
| *** | Incorporated by reference to Exhibit 10.1 to the Company’s Current Report on Form 8-K filed on April 30, 2012. |
| **** | Incorporated by reference to Exhibit 10.1 to the Company’s Current Report on Form 8-K filed on May 24, 2012 |
46
Table of Contents
WHERE TO FIND ADDITIONAL INFORMATION
Additional financial information is contained in the Company’s financial statements and management’s discussion and analysis for its most recently completed financial year. Additional information relating to the Company may be found on SEDAR at www.sedar.com or the Company’s website at www.niminenergy.com.
Additional copies of this Annual Report, the materials listed in the preceding paragraph, any interim financial statements which have been issued by the Company and any other document incorporated herein by reference will be available upon request by contacting the Company at its offices at 1160 Eugenia Place, Suite 100, Carpinteria, California 90313, Phone: (805) 566-2900 or Fax: (805) 566-2917.
47
Table of Contents
Pursuant to the requirements of Section 13 or 15(d) of the Securities Exchange Act of 1934, the registration has duly caused this report to be signed on its behalf by the undersigned, thereunto duly authorized.
| NIMIN ENERGY CORP. |
| (Registrant) |
| By: /S/ CLARENCE COTTMAN III |
| Chief Executive Officer |
| Date: March 24, 2014 |
Pursuant to the requirements of the Securities Exchange Act of 1934, this report has been signed below by the following persons on behalf of the registrant and in the capacities and on the dates indicated.
| By: |
/s/ CLARENCE COTTMAN III |
Chief Executive Officer |
March 24, 2014 | |||
| By: | /s/ JONATHAN WIMBISH | Chief Financial Officer & Principal Accounting Officer |
March 24, 2014 | |||
| By: | /s/ BRIAN BAYLEY | Director | March 24, 2014 | |||
| By: | /s/ WILLIAM GUMMA | Director | March 24, 2014 | |||
| By: | /s/ W. ALF PENEYCAD | Director | March 24, 2014 | |||
| By: | /s/ ROBERT REDFEARN | Director | March 24, 2014 | |||
48
Table of Contents
Consolidated Financial Statements of
NIMIN ENERGY CORP.
As at and for the years ended December 31, 2013, 2012 and 2011
Expressed in US dollars
49
Table of Contents
REPORT OF INDEPENDENT REGISTERED PUBLIC ACCOUNTING FIRM
The Board of Directors and Stockholders
NiMin Energy Corp.:
We have audited the accompanying consolidated statement of net assets in liquidation (liquidation basis) of NiMin Energy Corp. and subsidiary (the Company) as of December 31, 2013 and 2012, and the related consolidated statement of changes in net assets in liquidation (liquidation basis) for the year ended December 31, 2013 and for the period June 30, 2012 through December 31, 2012. We have also audited the consolidated statements of operations and comprehensive loss, stockholders’ equity, and cash flows for the period of January 1, 2012 through June 30, 2012 and the year ended December 31, 2011. These consolidated financial statements are the responsibility of the Company’s management. Our responsibility is to express an opinion on these consolidated financial statements based on our audits.
We conducted our audits in accordance with the standards of the Public Company Accounting Oversight Board (United States). Those standards require that we plan and perform the audit to obtain reasonable assurance about whether the financial statements are free of material misstatement. The Company is not required to have, nor were we engaged to perform, an audit of its internal control over financial reporting. Our audits included consideration of internal control over financial reporting as a basis for designing audit procedures that are appropriate in the circumstances, but not for the purpose of expressing an opinion on the effectiveness of the Company’s internal control over financial reporting. Accordingly, we express no such opinion. An audit also includes examining, on a test basis, evidence supporting the amounts and disclosures in the financial statements. An audit also includes assessing the accounting principles used and significant estimates made by management, as well as evaluating the overall financial statement presentation. We believe that our audits provide a reasonable basis for our opinion.
As described in Note 1 to the consolidated financial statements, the shareholders of NiMin Energy Corp. approved a plan of liquidation on June 26, 2012. As a result, the Company changed its basis of accounting effective June 30, 2012, from the going-concern to a liquidation basis.
In our opinion, the consolidated financial statements referred to above present fairly, in all material respects, the consolidated net assets in liquidation (liquidation basis) as of December 31, 2013 and 2012, the consolidated changes in net assets in liquidation for the year ended December 31, 2013, and for the period of June 30, 2012 to December 31, 2012, and the results of their operations and cash flows for the period from January 1, 2012 to June 30, 2012, and the year ended December 31, 2011, in conformity with U.S. generally accepted accounting principles.
/s/ KPMG LLP
Los Angeles, California
March 24, 2014
50
Table of Contents
NiMin Energy Corp.
Consolidated Statements of Net Assets as of December 31, 2013 and December 31, 2012 (Liquidation Basis)
(Expressed in U.S. dollars)
| 2013 | 2012 | |||||||
| Assets | ||||||||
| Current assets: |
||||||||
| Cash and cash equivalents |
$ | 6,864,806 | $ | 9,657,306 | ||||
| Other accounts receivable |
7,515 | 60,129 | ||||||
| Income tax receivable |
329,185 | |||||||
|
|
|
|
|
|||||
| Total assets |
$ | 6,872,321 | $ | 10,046,620 | ||||
|
|
|
|
|
|||||
| Liabilities | ||||||||
| Current liabilities: |
||||||||
| Accounts payable |
$ | 91,645 | $ | 71,654 | ||||
| Accrued professional fees related to liquidation |
1,691,940 | 1,481,470 | ||||||
| Other costs related to liquidation |
185,549 | 452,717 | ||||||
| Asset retirement obligations |
— | 203,861 | ||||||
|
|
|
|
|
|||||
| Total liabilities |
$ | 1,969,134 | $ | 2,209,702 | ||||
|
|
|
|
|
|||||
| Net assets in liquidation (Note 2) |
$ | 4,903,187 | $ | 7,836,918 | ||||
|
|
|
|
|
|||||
| Net assets in liquidation per outstanding share |
$ | 0.07 | $ | 0.11 | ||||
See accompanying notes to consolidated financial statements.
51
Table of Contents
NiMin Energy Corp.
Consolidated Statements of Operations and Comprehensive Loss (Going Concern Basis)
For the six months ended June 30, 2012 and the year ended December 31, 2011
(Expressed in U.S. dollars)
| Six Months Ended June 30, 2012 |
2011 | |||||||
| Crude oil and natural gas revenues |
$ | 10,985,590 | $ | 24,305,685 | ||||
| Expenses: |
||||||||
| Operating costs |
4,257,619 | 11,565,565 | ||||||
| General and administrative |
6,043,260 | 7,894,479 | ||||||
| Liquidation related expenses |
7,537,423 | — | ||||||
| Depreciation, depletion, amortization, and accretion |
1,697,361 | 3,507,669 | ||||||
| (Gain)/Loss on crude oil derivative contract |
(189,507 | ) | 753,053 | |||||
|
|
|
|
|
|||||
| 19,346,156 | 23,720,766 | |||||||
|
|
|
|
|
|||||
| Income (loss) before other items |
(8,360,566 | ) | 584,919 | |||||
|
|
|
|
|
|||||
| Interest income |
10,673 | 44,595 | ||||||
| Interest expense |
(6,443,178 | ) | (5,406,133 | ) | ||||
| Foreign exchange gain (loss) |
(438 | ) | (26,101 | ) | ||||
| Change in fair value of options |
296,519 | 707,513 | ||||||
| Change in fair value of warrants |
235,134 | 1,062,208 | ||||||
| Other |
(22,818 | ) | (196,649 | ) | ||||
| Other reclamation costs |
(659,115 | ) | — | |||||
| Gain on sale of oil & gas properties and equipment |
46,280,232 | — | ||||||
|
|
|
|
|
|||||
| 39,697,009 | (3,814,567 | ) | ||||||
|
|
|
|
|
|||||
| Income (loss) before taxes |
31,336,443 | (3,229,648 | ) | |||||
| Income tax expense |
2,478,263 | — | ||||||
|
|
|
|
|
|||||
| Net income (loss) and comprehensive income (loss) |
28,858,180 | (3,229,648 | ) | |||||
|
|
|
|
|
|||||
| Basic and diluted income/(loss) per share |
$ | 0.41 | $ | (0.05 | ) | |||
|
|
|
|
|
|||||
See accompanying notes to consolidated financial statements.
52
Table of Contents
NiMin Energy Corp.
Consolidated Statements of Cash Flows (Going Concern Basis)
For six months ended June 30, 2012 and the years ended December 31, 2011
(Expressed in U.S. dollars)
| Six Months Ended June 30, 2012 |
2011 | |||||||
| Cash flows from operating activities: |
||||||||
| Net lncome (loss) |
$ | 28,858,180 | $ | (3,229,648 | ) | |||
| Adjustments to reconcile net lncome (loss) by (used in) operating activities: |
||||||||
| Depreciation, depletion, amortization, and accretion |
1,697,361 | 3,507,669 | ||||||
| Change in fair value of options |
(296,519 | ) | (707,513 | ) | ||||
| Change in fair value of warrants |
(235,134 | ) | (1,062,208 | ) | ||||
| Gain on sale of oil & gas properties |
(46,377,296 | ) | — | |||||
| Stock-based compensation |
2,289,568 | 2,605,892 | ||||||
| Unrealized (gain) loss on crude oil derivative contracts |
82,731 | (365,109 | ) | |||||
| Write down of fixed assets |
97,064 | — | ||||||
| Non-cash interest expense |
3,497,867 | 906,569 | ||||||
| (Increase) decrease in assets: |
||||||||
| Trade accounts receivable |
1,061,589 | (1,307,337 | ) | |||||
| Prepaid expenses |
311,922 | (49,712 | ) | |||||
| Crude oil inventory |
149,553 | 91,822 | ||||||
| Other assets |
1,797 | |||||||
| Increase (decrease) in liabilities: |
||||||||
| Accounts payable and accrued liabilities |
7,850,251 | (1,105,344 | ) | |||||
| Asset retirement obligation |
659,114 | — | ||||||
|
|
|
|
|
|||||
| Net cash provided by (used in) operating activities |
(353,750 | ) | (713,122 | ) | ||||
|
|
|
|
|
|||||
| Cash flows from investing activities: |
||||||||
| Purchase of and expenditures on crude oil and natural gas properties |
(1,579,255 | ) | (18,044,984 | ) | ||||
| Divestiture of crude and natural gas properties |
— | 1,000,000 | ||||||
| Sale of oil & gas properties |
119,245,819 | — | ||||||
| Purchase of equipment |
— | (68,564 | ) | |||||
|
|
|
|
|
|||||
| Increase in restricted investments |
(3,143,741 | ) | 19,208 | |||||
|
|
|
|
|
|||||
| Net cash provided by (used in) investing activities |
114,522,823 | (17,094,340 | ) | |||||
| Cash flows from financing activities: |
||||||||
| Repayment of long-term debt |
(36,000,000 | ) | — | |||||
| Repurchase of options |
(29,108 | ) | — | |||||
| Exercise of warrants and options |
— | 8,521,761 | ||||||
| Proceeds from issuance of common shares (net of costs) |
— | 3,606,725 | ||||||
|
|
|
|
|
|||||
| Net cash provided by (used in) financing activities |
(36,029,108 | ) | 12,128,486 | |||||
|
|
|
|
|
|||||
| Change in cash and cash equivalents during the period |
78,139,965 | (5,678,976 | ) | |||||
| Cash and cash equivalents at beginning of the period |
3,811,028 | 9,490,005 | ||||||
|
|
|
|
|
|||||
| Cash and cash equivalents at end of the period |
$ | 81,950,993 | $ | 3,811,029 | ||||
|
|
|
|
|
|||||
| Supplemental disclosure of cash flow information: |
||||||||
| Cash paid for interest |
$ | 2,945,444 | $ | 4,500,000 | ||||
See accompanying notes to consolidated financial statements.
53
Table of Contents
NiMin Energy Corp.
Consolidated Statements of Stockholders’ Equity (Going Concern Basis)
For th six months ended June 30, 2012 and the year ended December 31, 2011
(Expressed in U.S. dollars)
| Common Stock | ||||||||||||||||||||
| Shares | Amount | Additional Paid in Capital |
Accumulated Deficit |
Total Stockholders’ Equity |
||||||||||||||||
| Balance at December 31, 2010 |
61,690,977 | 93,107,905 | $ | 9,861,010 | $ | (70,891,787 | ) | $ | 32,077,128 | |||||||||||
|
|
|
|
|
|
|
|
|
|
|
|||||||||||
| Exercise of options |
29,999 | 59,411 | (21,022 | ) | 38,389 | |||||||||||||||
| Exercise of warrants |
5,354,800 | 8,483,372 | — | 8,483,372 | ||||||||||||||||
| Reclassified from warrant liability |
4,258,164 | — | 4,258,164 | |||||||||||||||||
| Reclassified to options liability |
(1,025,463 | ) | 169,804 | (855,659 | ) | |||||||||||||||
| Issuance of common stock |
2,758,620 | 3,166,057 | 844,488 | 4,010,545 | ||||||||||||||||
| Stock issuance cost |
(316,449 | ) | (87,371 | ) | (403,820 | ) | ||||||||||||||
| Stock-based compensation expense |
2,605,892 | 2,605,892 | ||||||||||||||||||
| Net loss |
— | (3,229,648 | ) | (3,229,648 | ) | |||||||||||||||
|
|
|
|
|
|
|
|
|
|
|
|||||||||||
| Balance at December 31, 2011 |
69,834,396 | $ | 108,758,460 | $ | 12,177,534 | $ | (73,951,631 | ) | $ | 46,984,363 | ||||||||||
|
|
|
|
|
|
|
|
|
|
|
|||||||||||
| Options repurchased |
(29,108 | ) | (29,108 | ) | ||||||||||||||||
| Reclassified to options liability |
(188,467 | ) | (188,467 | ) | ||||||||||||||||
| Stock-based compensation expense |
2,289,568 | 2,289,568 | ||||||||||||||||||
| Net Income |
28,858,180 | 28,858,180 | ||||||||||||||||||
|
|
|
|
|
|
|
|
|
|
|
|||||||||||
| Balance at June 30, 2012 |
69,834,396 | $ | 108,729,352 | $ | 14,278,635 | $ | (45,093,451 | ) | $ | 77,914,536 | ||||||||||
|
|
|
|
|
|
|
|
|
|
|
|||||||||||
See accompanying notes to consolidated financial statements.
54
Table of Contents
NiMin Energy Corp.
Consolidated Statement of Changes in Nets Assets in Liquidation as of December 31, 2013 (Liquidation Basis)
(Expressed in U.S. dollars)
| Net Assets in Liquidation as of June 30, 2012 |
$ | 77,914,536 | ||
| Increase (decrease) to net assets: |
||||
| Cash distribution to shareholders from July 1, 2012 to December 31, 2012 |
(70,532,740 | ) | ||
| Investment income from July 1, 2012 to December 31, 2012 |
56,213 | |||
| Tax Adjustment from July 1, 2012 to December 31, 2012 |
1,019,447 | |||
| Adjustments to assets from July 1, 2012 to December 31, 2012 |
(55,927 | ) | ||
| Adjustments to liquidation accruals from July 1, 2012 to December 31, 2012 |
(528,868 | ) | ||
| Costs incurred from July 1, 2012 to December 31, 2012 |
(85,255 | ) | ||
| Foreign exchange adjustment from July 1, 2012 to December 31, 2012 |
49,512 | |||
|
|
|
|||
| Net decrease to net assets: |
(70,077,618 | ) | ||
|
|
|
|||
| Net Assets in Liquidation as of December 31, 2012 |
$ | 7,836,918 | ||
|
|
|
|||
| Increase (decrease) to net assets: |
||||
| Adjustments to assets from January 1, 2013 to December 31, 2013 |
(28,689 | ) | ||
| Adjustments to liquidation accruals from January 1, 2013 to December 31, 2013 |
(2,847,920 | ) | ||
| Foreign exchange adjustment from January 1, 2013 to December 31, 2013 |
(57,122 | ) | ||
|
|
|
|||
| Net decrease to net assets: |
(2,933,731 | ) | ||
|
|
|
|||
| Net Assets in Liquidation as of December 31, 2013 |
$ | 4,903,187 | ||
|
|
|
|||
See accompanying notes to consolidated financial statements.
55
Table of Contents
NiMin Energy Corp.
Notes to Consolidated Financial Statements
(Expressed in U.S. dollars)
| 1 | Description of the Business |
NiMin Energy Corp. (the “Company” or “NiMin”) was incorporated under the name NiMin Capital Corp. under the Business Corporations Act (Alberta) on May 31, 2007. The Company changed its name to NiMin Energy Corp. on September 3, 2009, and consolidated its shares on the basis of one new post-consolidation share (“Common Shares”) for each three existing Common Shares.
The principal business of the Company was conducted through its wholly owned subsidiary, Legacy Energy, Inc. (“Legacy”), a Delaware company that was engaged in the exploration, development, and production of crude oil and natural gas properties in the states of California and Wyoming until the sale of its assets in June 2012.
The annual and special meeting (the “Special Meeting”) of holders (“Shareholders”) of Common Shares of the Company (“Common Shares”) was held on June 26, 2012. At the Special Meeting, in addition to annual items of business, Shareholders were asked to consider and vote on, among other things, special resolutions approving the proposed sale of all or substantially all of the Company’s assets (the “Sale of Assets”) including those assets held by NiMin’s wholly-owned subsidiary, Legacy, pursuant to purchase and sale agreements with respect to its Wyoming based assets and California based assets.
At the Special Meeting, the Shareholders were also asked to consider and vote on the voluntary winding up and dissolution of the Company pursuant to the laws of the Business Corporations Act (Alberta) (the “Winding Up”) and the distribution to Shareholders of the net proceeds of the Sale of Assets (less the settlement of obligations of Legacy) and cash on hand, as part of such liquidation and dissolution after satisfaction of all liabilities of the Company, by way of a reduction of the stated capital of the Common Shares of the Company.
Both the Sale of Assets and the Winding Up were approved by the Shareholders at the Special Meeting. In order for the Company to complete the Winding Up, the appropriate corporate steps were required to be taken for the dissolution and liquidation of Legacy. Pursuant to the approval of the Sale of Assets, Legacy proceeded with the sale of the Wyoming oil and gas assets and the California oil and gas assets all as more particularly described below.
On June 28, 2012, Legacy completed its previously announced sale of its assets in Wyoming’s Big Horn Basin (the “Wyoming Assets”) to BreitBurn Operating L.P., a wholly-owned subsidiary of BreitBurn Energy Partners L.P. (NASDAQ: BBEP “BreitBurn”), for total cash consideration of approximately $93 million, being the original purchase price of approximately $98 million less approximately $5 million adjusted to account for preliminary purchase price adjustments. On August 30, 2012, Legacy completed its final settlement with BreitBurn and received approximately $2.3 million based on the final purchase price adjustments.
On June 29, 2012, Legacy completed its previously announced sale of its assets in California’s San Joaquin Basin (the “California Assets”) to Southern San Joaquin Production, LLC for total cash consideration of approximately $26 million, being the original purchase price of approximately $27 million, less approximately $1 million adjusted to account for preliminary purchase price adjustments. Pursuant to the terms of the purchase and sale agreement, $3 million of the $26 million purchase price paid on closing had been deposited with an escrow agent until December 28, 2012 in connection with various indemnities contained therein. On August 30, 2012, Legacy completed its final settlement with Southern San Joaquin Production LLC and received $347,938 based on the final purchase price adjustments. On December 28, 2012, the $3 million was released to NiMin from the escrow account.
The Winding Up and the dissolution and liquidation of Legacy contemplates the orderly disposition of the assets, the orderly discharge of all outstanding liabilities, including all outstanding debt, and after the establishment of appropriate reserves, the distribution of cash to Shareholders in installments.
56
Table of Contents
NiMin Energy Corp.
Notes to Consolidated Financial Statements
(Expressed in U.S. dollars)
On September 24, 2012, the Board declared an initial distribution to Shareholders of $1.01 per Common Share. The distribution was made as a return of capital to Shareholders of record at the close of business on October 9, 2012, and the stated capital of the Company was reduced accordingly. The distribution of $70,532,740 was paid on October 22, 2012.
Upon settlement of all liabilities of the Company, the Company intends to distribute the remaining net proceeds of the liquidation and dissolution of the Company to Shareholders in one final distribution occurring in mid-year 2014.
NiMin’s wholly-owned subsidiary, Legacy Energy, Inc., a Delaware company, dissolved in accordance with the laws of Delaware on September 17, 2012.
Nimin voluntarily delisted its Common Shares from the Toronto Stock Exchange (“TSX”) after the close of trading on October 22, 2012, the date on which NiMin’s initial distribution was “payable” and its listing was transferred to the NEX, a separate board of the TSX Venture Exchange, effective as of opening of the market on October 23, 2012. From October 23, 2012, and onwards until the time that is on or about the date of dissolution, NiMin’s Common Shares trade on the NEX under the symbol “NNN.H”.
The Company announced that the Common Shares of the Company were delisted from the OTCQX effective July 23, 2012.
| 2 | Basis of Presentation |
The consolidated financial statements have been prepared in accordance with accounting principles generally accepted in the
United States (“U.S.GAAP”) and include the accounts of the Company, its wholly-owned subsidiary and the Company’s
proportionate interest in Joint Interest Activities. All inter-company balances and transactions have been eliminated upon consolidation.
As a result of the Shareholders’ approval of the Winding Up of the Company, the liquidation basis of accounting was adopted effective June 30, 2012. This basis of accounting is considered appropriate when, among other things, liquidation of a company is imminent and the net realizable values of assets are reasonably determinable. Under this basis of accounting, assets are valued at their net realizable values and liabilities are stated at their estimated settlement amounts. Further, all expected costs of liquidation are accrued as of December 31, 2013. Financial information presented as of and subsequent to June 30, 2012, includes a Consolidated Statement of Net Assets and a Consolidated Statement of Changes in Net Assets in Liquidation, as required under the liquidation basis of accounting. Financial information included for periods ending prior to June 30, 2012, is presented under the going concern basis of accounting.
Given that the respective property sales transactions closed on June 28, 2012, and June 29, 2012, the associated revenues are included in revenues and expenses for the period ended June 30, 2012. However, the purchase and sale agreements provide adjustments to the purchase price be made related to revenues and operating expenses for the period of April 1, 2012 through the closing date of the sale of the properties. As such, the purchase price of the sale of the properties in June 2012 was adjusted for revenues and operating expenses for the period of April 1 through closing date of the sale of the properties.
These consolidated financial statements of the Company are presented in U.S dollars.
The conversion to liquidation basis of accounting requires management to make significant estimates and judgments in order to record assets at estimated net realizable value and liabilities at estimated settlement amounts.
A statement of operations is not presented for the year ended December 31, 2013, due to the liquidation basis of accounting. Instead, a statement of changes in net assets has been reported.
57
Table of Contents
NiMin Energy Corp.
Notes to Consolidated Financial Statements
(Expressed in U.S. dollars)
Accrued Cost of Liquidation
Under the liquidation basis of accounting, the Company has accrued for the estimated costs to be incurred in liquidation, as follows:
| Accrued Liquidation Costs |
Balances as of June 30, 2012 |
Adjustments to accrual |
Payments | Balances as of December 31, 2012 |
||||||||||||
| Lease obligation |
$ | 62,943 | $ | — | $ | (62,943 | ) | $ | — | |||||||
| Professional fees |
3,964,723 | 908,005 | (3,391,258 | ) | 1,481,470 | |||||||||||
| Payroll related costs |
3,009,757 | 34,222 | (3,043,979 | ) | — | |||||||||||
| Other |
500,000 | 136,564 | (183,847 | ) | 452,717 | |||||||||||
|
|
|
|
|
|
|
|
|
|||||||||
| Total |
$ | 7,537,423 | $ | 1,078,791 | $ | (6,682,027 | ) | $ | 1,934,187 | |||||||
|
|
|
|
|
|
|
|
|
|||||||||
| Accrued Liquidation Costs |
Balances as of December 31, 2012 |
Adjustments to accrual |
Payments | Balances as of December 31, 2013 |
||||||||||||
| Professional fees |
$ | 1,481,470 | $ | 2,181,580 | $ | (1,971,110 | ) | $ | 1,691,940 | |||||||
| Other |
452,717 | 326,997 | (594,165 | ) | 185,549 | |||||||||||
|
|
|
|
|
|
|
|
|
|||||||||
| Total |
$ | 1,934,187 | $ | 2,508,577 | $ | (2,565,275 | ) | $ | 1,877,489 | |||||||
|
|
|
|
|
|
|
|
|
|||||||||
The Company will continue to incur operating costs through the liquidation of the Company (the “Liquidation Period”). On a regular basis, we evaluate our assumptions, judgments and estimates that can have a significant impact on our reported net assets in liquidation based on the most recent information available to us, and when necessary make changes accordingly. Actual costs and income may differ from our estimates, which might reduce net assets available in liquidation to be distributed to Shareholders.
The Winding Up continues to be assessed and the exact amount and timing of further distribution(s) to Shareholders can only be determined upon completion of the orderly disposition of assets and orderly discharge of all liabilities. Once management of the Company has completed those required steps, current estimates will be revised to reflect actual numbers. The numbers reflected in the statement of net assets and the estimated $0.07 net assets in liquidation per outstanding share include management estimates made as of December 31, 2013, and do not necessarily reflect the final dollars that may be available to the Company for distribution to Shareholders. Any distribution amounts can only be calculated upon completion of all the dispositions, discharges and determinations of reserves.
| 3 | Pre-Liquidation Accounting Policies |
| a. | Crude Oil and Natural Gas Properties and Equipment |
The Company accounts for its crude oil and natural gas producing activities under the full-cost method of accounting. Accordingly, all costs incurred in the acquisition, exploration, and development of proved crude oil and natural gas properties, including the costs of abandoned properties, dry holes, geological and geophysical costs, and annual lease rentals, were capitalized. All general corporate costs were expensed as incurred. Sales or other dispositions of crude oil and natural gas properties were accounted for as adjustments to capitalized costs with no gain or loss recorded unless such sale would significantly alter the relationship between pool cost and reserves.
58
Table of Contents
NiMin Energy Corp.
Notes to Consolidated Financial Statements
(Expressed in U.S. dollars)
| b. | Depletion and Depreciation |
Depletion of crude oil and natural gas properties was computed under the unit-of-production method whereby the ratio of production to proved reserves, after royalties, determined the proportion of depletable costs to be expensed in each period. Costs associated with unevaluated properties were excluded from the full-cost pool until a determination was made whether proved reserves can be attributable to the related properties. Unevaluated properties were evaluated at least annually to determine whether the costs incurred should have been classified to the full-cost pool and thereby subject to amortization. Reserves were determined by an independent reserves engineering firm. Volumes were converted to equivalent units using the ratio of one barrel of oil to six thousand cubic feet of natural gas. A significant reduction in our proved reserves may result in an accelerated depletion rate.
Depreciation of equipment was provided for on a straight-line basis over the useful life (5 to 10 years) of the asset.
| c. | Impairment of Long-lived Assets |
The Company performed a full-cost ceiling test on proved crude oil and natural gas properties in which the capitalized costs were not allowed to exceed their related estimated future net revenues of proved reserves discounted at 10%, net of tax considerations. When calculating reserves, the Company conformed to SEC rules under “Modernization of Oil and Gas Reporting” for pricing and used constant prices which were adopted by the SEC in December of 2008.
Equipment was reviewed for impairment whenever events or changes in circumstances indicate such impairment may have occurred. Impairment was recognized when the estimated undiscounted future net cash flows of an asset were less than its carrying value. A significant reduction in our proved reserves have resulted in a full cost ceiling limitation. If an impairment occurred, the carrying value of the impaired asset was reduced to fair value.
| d. | Revenue Recognition |
Petroleum and natural gas sales were recognized as revenue when the commodities were delivered and title has passed to the purchasers and collection was reasonably assured.
| e. | Joint Interest Activities |
Certain of the Company’s exploration, development and production activities were conducted jointly with other entities and accordingly the consolidated financial statements reflect only the Company’s proportionate interest in such activities.
| f. | Asset Retirement Obligations |
The Company recognized a liability for the present value of all legal obligations associated with the retirement of tangible, long-lived assets and capitalized an equal amount as a cost of the asset. The cost associated with the abandonment obligation was included in the computation of depreciation, depletion, amortization and accretion. The liability accreted until the Company settles the obligation. The Company uses a credit-adjusted risk-free interest rate in its calculation of asset retirement obligations (“ARO”).
59
Table of Contents
NiMin Energy Corp.
Notes to Consolidated Financial Statements
(Expressed in U.S. dollars)
Revisions to the original estimated liability would have resulted in an increase or decrease to the ARO liability and related capitalized costs. Actual costs incurred upon settlement of the asset retirement obligation were charged against the obligation to the extent of the liability recorded.
Estimates for future abandonment and reclamation costs were based on historical costs to abandon and reclaim similar sites, taking currents costs into consideration. The liability was based on the Company’s net interest in the respective sites.
| g. | Crude Oil Inventory |
Unsold crude oil production was carried in inventory at the lower of cost, generally applied on a first-in, first-out (“FIFO”) basis, or net realizable value, and included costs incurred to bring the inventory to its existing condition.
| h. | Use of Estimates |
In preparing financial statements, management makes informed judgments and estimates that affect the reported amounts of assets and liabilities as of the date of the financial statements and affect the reported amounts of revenues and expenses during the reporting period.
The amounts recorded for the depletion and depreciation of property and equipment, the accretion expense associated with the asset retirement obligation and the cost recovery assessments for property and equipment were based on estimates of proved reserves, production and discount rates, oil and natural gas prices, future costs and other relevant assumptions. The amount recorded for the unrealized gain or loss on financial instruments was based on estimates of future commodity prices and volatility. The recognition of amounts in relation to stock-based compensation and the fair value of warrants required estimates related to valuation of stock options and warrants. Future taxes required estimates as to the realization of future tax assets and the timing of reversal of tax assets and liabilities. By their nature, those estimates were subject to measurement uncertainty and the effect on the consolidated financial statements from changes in such estimates in future years could have been significant.
On an ongoing basis, management reviewed estimates, including those related to the impairment of long-lived assets, contingencies and income taxes. Changes in facts and circumstances may have resulted in revised estimates and actual results may have differed from those estimates.
| i. | Income Taxes |
Deferred tax assets and liabilities were recognized for the future tax consequences attributable to differences between the financial statement carrying amounts of existing assets and liabilities and their respective tax bases. Deferred tax assets and liabilities are measured using enacted tax rates expected to apply to taxable income in the years in which those temporary differences are expected to be recovered or settled. The effect on deferred tax assets and liabilities of a change in enacted tax rates is recognized in income in the period that includes the enactment date. The Company does not have any unrecognized tax benefits. The Company does not believe there will be any material changes in its unrecognized tax positions over the next twelve months. The Company’s policy is that it recognizes interest and penalties accrued on any unrecognized tax benefits as a component of income tax expense. The Company did not have any accrued interest or penalties associated with any unrecognized tax benefits, nor was any tax-related interest expense recognized during 2013, 2012 or 2011.
60
Table of Contents
NiMin Energy Corp.
Notes to Consolidated Financial Statements
(Expressed in U.S. dollars)
| j. | Cash and Cash Equivalents |
The Company considers all highly liquid investments with original maturities of three months or less at the time of purchase to be cash equivalents and therefore classifies them with cash.
| k. | Commodity Derivative Instruments |
Derivative instruments were recognized as either assets or liabilities in the balance sheet at fair value. The a ccounting for changes in the fair value of derivative instruments depends on their intended use and resulting hedge designation. For derivative instruments designated as hedges, the changes in fair value were recorded in the balance sheet as a component of accumulated other comprehensive income (loss). Changes in the fair value of derivative instruments not designated as hedges were recorded as a gain or loss on derivative contracts in the consolidated statements of operations. The Company did not designate its derivative financial instruments as hedging instruments and, as a result, recognized the change in a derivative’s fair value currently in earnings.
| l. | Fair Value Measurements |
The Company categorizes its assets and liabilities that were measured at fair value, based on the priority of the inputs to the valuation techniques. The three levels of the fair value measurement hierarchy were as follows:
| Level 1: | Unadjusted quoted prices in active markets that were accessible at the measurement date for identical, unrestricted assets or liabilities. | |
| Level 2: | Quoted prices in markets that were not active, or inputs which were observable, either directly or indirectly, for substantially the full term of the asset or liability. | |
| Level 3: | Measured based on prices or valuation models that required inputs that were both significant to the fair value measurement and less observable for objective sources (i.e., supported by little or no market activity). | |
Financial assets and liabilities were classified based on the lowest level of input that was significant to the fair value measurement. The Company’s assessment of the significance of a particular input to the fair value measurement required judgment, which may have affected the valuation of the fair value of assets and liabilities and their placement within the fair value hierarchy levels. The Company considered active markets as those in which transactions for the assets or liabilities occur in sufficient frequency and volume to provide pricing information on an ongoing basis. For assets and liabilities carried at fair value the Company measured fair value under the following levels:
| Financial Instrument |
Level | |
| Cash and cash equivalents | Level 1 | |
| Restricted investments | Level 1 | |
| Long-term debt | Level 2 | |
| Commodity derivative | Level 2 | |
| Warrants and options | Level 3 |
61
Table of Contents
NiMin Energy Corp.
Notes to Consolidated Financial Statements
(Expressed in U.S. dollars)
| m. | Stock-Based Compensation |
The Company measures and recognizes compensation expense for all share-based payment awards, including employee stock options, based on estimated fair values. The value of the portion of the award that was ultimately expected to vest was recognized as an expense on a straight-line basis over the requisite vesting period. The Company estimates the fair value of stock option awards on the date of grant using an option-pricing model. The Company uses the Black-Scholes Merton option-pricing model (“Black-Scholes Model”) as its method of valuation for share-based awards. The Company’s determination of fair value of share-based payment awards on the date of grant using the Black-Scholes Model was affected by the Company’s stock price, as well as assumptions regarding a number of subjective variables. These variables included, but are not limited to, the Company’s expected stock price volatility over the term of the awards, as well as actual and projected exercise and forfeiture activity. The fair value of options granted to consultants, to the extent unvested due to required services not having been fully performed, was determined on subsequent reporting dates.
| n. | Foreign Currency Transactions |
These consolidated financial statements are presented and measured in U.S. dollars, as substantially all of the Company’s operations are located in the United States of America. Transactions and balances using Canadian dollars are expressed in U.S. dollars whereby monetary assets and liabilities are expressed at the period end exchange rate, non-monetary assets and liabilities are expressed at historical exchange rates, and revenue and expenses are expressed at the average exchange rate for the period. Foreign exchange gains and losses are included in the consolidated statements of operations.
| o. | Per Share Amounts |
Basic per share amounts were computed using the weighted average number of Common Shares outstanding during the year. Diluted per share amounts reflected the potential dilution that could have occurred if stock options or warrants to purchase Common Shares were exercised for Common Shares. The treasury stock method of calculating diluted per share amounts was used whereby any proceeds from the exercise of stock options or warrants were assumed to be used to purchase Common Shares of the Company at the average market price during the year.
| 4 | Asset Retirement Obligations |
The Company’s asset retirement obligations are based on net ownership in wells and facilities and management’s estimate of the timing and expected future costs associated with site reclamation, facilities dismantlement and the plugging and abandonment of wells.
62
Table of Contents
NiMin Energy Corp.
Notes to Consolidated Financial Statements
(Expressed in U.S. dollars)
The following table provides a reconciliation of the beginning and ending aggregate carrying amount of the obligation associated with the retirement of property and equipment:
| Year ended December 31, 2013 |
Year ended December 31, 2012 |
Year ended December 31, 2011 |
||||||||||
| Balance, beginning of year |
$ | 203,861 | $ | 1,180,661 | $ | 1,309,789 | ||||||
| Liabilites incurred |
— | — | 313,684 | |||||||||
| Change in estimate |
339,341 | 163,850 | (422,813 | )(i) | ||||||||
| Reduction to liabilities |
(543,202 | ) | (1,180,336 | ) | (105,737 | ) | ||||||
| Accretion expense |
— | 39,686 | 85,738 | |||||||||
|
|
|
|
|
|
|
|||||||
| Balance, end of year |
$ | — | $ | 203,861 | $ | 1,180,661 | ||||||
|
|
|
|
|
|
|
|||||||
| (i) | The Company adjusted the remaining life of its California oil and gas properties in calculating its asset retirement obligation from approximately 9 years to 25 years to better reflect estimated useful lives of the properties. |
There is no remaining balance sheet liability at December 31, 2013, related to the completion of well site restoration in Louisiana. The Company received confirmation that the former well site has been released for unrestricted use from the state of Louisiana on August 30, 2013.
| 5 | Senior Loan |
On June 30, 2010, the Company entered into a senior secured loan (the “Senior Loan”) in the amount of $36 million from a U.S. based institutional private lender (the “Lender”). The Company borrowed $36 million subject to an original issuer discount of 7.5%, a commitment fee of 1%, a placement fee of 1% and a transaction fee of 3%. Debt issuance costs of $4.9
million were incurred and were being amortized to net income under the effective interest method. The Senior Loan had a 12.5% fixed interest rate and a term of five years. Interest was payable quarterly beginning September 30, 2010.
As part of the Winding Up of the Company, on June 28, 2012, the Company prepaid the entire amount of the Senior Loan and as a result, a prepayment penalty of 2% representing $707,705 was applied in addition to the accrued interest of $1,118,853 and principal of $36,000,000. The remaining unamortized debt issuance cost of $3.23 million as of June 28, 2012, related to the Senior Loan, was written off and is included in the period ended June 30, 2012 interest expense.
63
Table of Contents
NiMin Energy Corp.
Notes to Consolidated Financial Statements
(Expressed in U.S. dollars)
| 6 | Share Capital |
| a. | Authorized and Outstanding |
Common Shares
NiMin was authorized to issue an unlimited number of Common Shares. As of December 31, 2013, and December 31, 2012, 69,834,396 Common Shares were issued and outstanding.
Preferred Shares
NiMin was also authorized to issue an unlimited number of Preferred Shares issuable in series. As of December 31, 2013, and December 31, 2012, no Preferred Shares have been issued.
| b. | Issued |
In September 2011, the Company completed a brokered private placement (the “Private Placement”) of 2,758,620 units (“U.S. Units”) of the Company at a purchase price of CDN$1.45 per U.S. Unit for gross proceeds of CDN$3,999,999 or USD $4,010,545, net of CDN $267,224 or USD $267,928 of agents fees. Each U.S. Unit consisted of one Common Share and one-half of one Common Share purchase warrant (“U.S. Warrant”).
| c. | Stock Option Plan |
The Company established a stock option plan as approved by the Shareholders whereby options to purchase Common Shares may be granted to the Company’s directors, officers, employees and consultants. The exercise prices of stock options are denominated in Canadian dollars. The number of Common Shares issuable under the Company’s stock option plan cannot exceed 15% of the issued and outstanding Common Shares of the Company. The exercise price of each option equals the market price of the Company’s stock on the date of grant and the option has a maximum life of ten years. The vesting period is determined by the Board of Directors at the time of grant. Options issued by the Company generally vest one-third on the first, second, and third anniversary of the date of grant. Following the approval of the Winding Up of the Company, all outstanding unvested options became automatically vested and the Company recognized the remaining grant date fair value of approximately $1.7 million in the period ended June 30, 2012.
Pursuant to Section 3.5 of the Company’s stock option plan, the Company completed the sale of all or substantially all of the Company’s assets and, as such, terminated all unexercised options under the plan in July of 2012.
64
Table of Contents
NiMin Energy Corp.
Notes to Consolidated Financial Statements
(Expressed in U.S. dollars)
The following table sets forth a reconciliation of the stock option activity for the period ended December 31, 2013, and December 31, 2012:
| Number of shares |
Weighted Average Exercise Price (CDN$) |
|||||||
| Stock options outstanding at December 31, 2010 |
7,355,000 | 1.25 | ||||||
|
|
|
|
|
|||||
| Options exercised (i) |
(29,999 | ) | 1.25 | |||||
| Options forfeited |
(105,000 | ) | 1.64 | |||||
| Options issued |
2,000,000 | 1.44 | ||||||
|
|
|
|
|
|||||
| Stock options outstanding at December 31, 2011 (i) |
9,220,001 | 1.24 | ||||||
|
|
|
|
|
|||||
| Options exercised |
||||||||
| Options forfeited |
(60,000 | ) | 1.61 | |||||
| Options repurchased |
(600,000 | ) | 1.00 | |||||
| Options cancelled |
(8,560,001 | ) | 1.29 | |||||
|
|
|
|
|
|||||
| Stock options outstanding at December 31, 2012 (i) |
— | — | ||||||
|
|
|
|
|
|||||
| Options exercised |
||||||||
| Options forfeited |
— | — | ||||||
| Options repurchased |
— | — | ||||||
| Options cancelled |
— | — | ||||||
|
|
|
|
|
|||||
| Stock options outstanding at December 31, 2013 |
— | — | ||||||
|
|
|
|
|
|||||
| (i) | The 2.70 million stock options relating to former employees were modified upon transition to a consulting role in 2011 and first quarter of 2012 to allow for continued vesting. The resulting $310,309 and $104,483 was recognized as incremental stock-based compensation expense during the year ended December 31, 2011, and the six months ended June 30, 2012, respectively. As the related options are denominated in Canadian dollars, which is not the functional currency of the Company (which is the U.S. dollar), the vested options were classified as a liability on the balance sheet and recorded at their fair value at the end of each period and the change in fair value is recognized in earnings. |
Total compensation expense was amortized over the vesting period of the options. Compensation expense of $2.29 million has been recognized during the six months ended June 30, 2012.
At December 31, 2013, there were no outstanding stock options to purchase Common Shares.
65
Table of Contents
NiMin Energy Corp.
Notes to Consolidated Financial Statements
(Expressed in U.S. dollars)
All options granted had an estimated fair value determined using the Black-Scholes Model using the following weighted average assumptions (no options granted during 2013):
| Grant Date |
Expected Life |
Weighted Average Risk Free Interest Rate |
Weighted Average Volatility |
Dividend Yield |
Fair Value per Option |
|||||||||||||||
| 2013 | — | — | — | — | — | |||||||||||||||
| 2012 | — | — | — | — | — | |||||||||||||||
| 2011 | 3 years | 1.38 | % | 87.26 | % | — | $ | 0.66 | ||||||||||||
Risk-free interest rate was the Government of Canada marketable bond rate for the day of the grant having a term approximating the expected life of the option.
Expected lives of options was based on the simple average of the average vesting period and the life of the award, or the simplified method, because of the limited historical data. All groups of employees have been determined to have similar historical exercise patterns for valuation purposes. Options granted have a maximum term of five to ten years.
Annualized volatility was a measure of the amount by which the share price fluctuated or was expected to fluctuate. The Company used the average daily price volatility of comparable small cap crude oil and natural gas companies for the retrospective periods corresponding to the respective expected life.
Total compensation expense was amortized over the vesting period of the options. For the six months ended June 30, 2012, we recorded compensation expense in the amount of $2.29 million. Compensation expense of $2.61 million has been recognized during the year ended December 31, 2011, based on the estimated fair value of the options on the grant date in accordance with the fair value method of accounting for stock-based compensation.
As of December 31, 2013, there was no unrecognized compensation cost related to non-vested share-based compensation arrangements granted under the Company’s option plan.
66
Table of Contents
NiMin Energy Corp.
Notes to Consolidated Financial Statements
(Expressed in U.S. dollars)
| Number of Unvested Options |
Weighted- Average Grant- Date Fair Value per Option (CDN$) |
|||||||
| Balance December 31, 2010 |
4,933,333 | 1.25 | ||||||
|
|
|
|
|
|||||
| Vested |
(2,744,990 | ) | 1.22 | |||||
| Granted |
2,000,000 | 0.66 | ||||||
| Forfeited |
(105,000 | ) | 0.95 | |||||
|
|
|
|
|
|||||
| Balance December 31, 2011 |
4,083,343 | 0.99 | ||||||
|
|
|
|
|
|||||
| Vested |
(4,023,343 | ) | 0.99 | |||||
| Granted |
— | — | ||||||
| Forfeited |
(60,000 | ) | 0.99 | |||||
|
|
|
|
|
|||||
| Balance December 31, 2012 |
— | |||||||
|
|
|
|
|
|||||
| Vested |
— | — | ||||||
| Granted |
— | — | ||||||
| Forfeited |
— | — | ||||||
|
|
|
|
|
|||||
| Balance December 31, 2013 |
— | |||||||
|
|
|
|
|
|||||
When stock options were exercised, the Company issues Common Shares from the pool of authorized shares.
| d. | Warrants |
Each warrant was exercisable by the holder thereof to acquire one Common Share at any time before the expiration date, after which time the warrants expire and become null and void.
Each whole warrant issued in connection with the private placement was exercisable for a period of 36 months from September 1, 2011, at an exercise price of $1.60. The warrants were subject to a hold period of four months plus one day from the date of issue.
As a result of the approval of the Winding Up of the Company in June 2012, an aggregate of 2,188,970 unexercised warrants were terminated July 2012.
67
Table of Contents
NiMin Energy Corp.
Notes to Consolidated Financial Statements
(Expressed in U.S. dollars)
The following table sets forth a reconciliation of the warrant activity for the periods ended December 31, 2013, and December 31, 2012:
| Number of Warrants |
Equity Component Amount |
Weighted Average Exercise Price (CDN$) |
||||||||||
| Warrants outstanding at December 31, 2010 |
12,349,341 | — | 1.58 | |||||||||
|
|
|
|
|
|
|
|||||||
| Warrants exercised |
(5,354,800 | ) | — | 1.55 | ||||||||
| Warrants expired |
(6,087,951 | ) | — | 1.55 | ||||||||
| Warrants issued (i) |
1,379,310 | 844,488 | 1.65 | |||||||||
|
|
|
|
|
|
|
|||||||
| Warrants outstanding at December 31, 2011 |
2,285,900 | 844,488 | 1.79 | |||||||||
|
|
|
|
|
|
|
|||||||
| Warrants exercised |
— | — | — | |||||||||
| Warrants expired |
— | — | — | |||||||||
| Warrants cancelled |
(2,188,970 | ) | (844,488 | ) | 1.79 | |||||||
|
|
|
|
|
|
|
|||||||
| Warrants outstanding at December 31, 2012 |
96,930 | — | 1.72 | |||||||||
|
|
|
|
|
|
|
|||||||
| Warrants exercised |
— | — | — | |||||||||
| Warrants expired |
— | — | — | |||||||||
| Warrants cancelled |
— | — | — | |||||||||
|
|
|
|
|
|
|
|||||||
| Warrants outstanding at December 31, 2013 |
96,930 | — | 1.72 | |||||||||
|
|
|
|
|
|
|
|||||||
| (i) | The weighted average exercise price of the warrants is $1.60 and is herein expressed in Canadian dollar equivalent using the closing foreign exchange rate at December 31, 2011. |
During third quarter of 2012, pursuant to the Winding Up of the Company, the Company values the warrants based on the expected cash distribution to shareholders as this represents management’s best estimate on the valuation of the underlying equity instruments as of June 30, 2012, and going forward. As the warrants have an exercise price greater than the expected cash distribution to shareholders, the value of the warrants were determined to approximate zero.
The following table summarizes NiMin’s warrants exercisable at December 31, 2013:
| Expiration Date |
Number of Warrants |
Exercise Price per share (CDN$) |
||||||
| March 10, 2016 |
96,930 | 1.72 | ||||||
|
|
|
|
|
|||||
| 96,930 | 1.72 | |||||||
|
|
|
|
|
|||||
68
Table of Contents
NiMin Energy Corp.
Notes to Consolidated Financial Statements
(Expressed in U.S. dollars)
During second, third and fourth quarters of 2012, pursuant to the Winding Up of the Company, the Company valued the warrants based on the expected cash distribution to Shareholders as this represents management’s best estimate on the valuation of the underlying equity instruments as of December 31, 2012. As the warrants have an exercise price greater than the expected cash distribution to Shareholders, the value of the warrants were determined to approximate zero. The fair value of warrants outstanding in previous years was calculated using the Black-Scholes Model using the following weighted average assumptions:
| Weighted Average Expected Life |
Weighted Average Risk Free Interest Rate |
Weighted Average Volatility |
Dividend Yield |
Fair Value per Warrant |
||||||||||||||||
| 2013 | — | — | — | — | — | |||||||||||||||
| 2012 | — | — | — | — | — | |||||||||||||||
| 2011 | 3.70 | 0.55 | % | 87.31 | % | — | $ | 0.52 | ||||||||||||
At December 31, 2011, the fair value of the warrant liability was $235,134, with a gain of $1.06 million recognized in current period earnings during the year ended December 31, 2011.
Risk-free interest rate was the U.S. Treasury rate for the day of the grant having a term approximating the expected life of the warrant.
Expected life of warrants was the period of time over which the warrants were expected to remain outstanding and was based on the contractual terms. Warrants had a maximum term of two to ten years.
Annualized volatility was a measure of the amount by which the share price fluctuated or was expected to fluctuate. The Company used the average daily price volatility of comparable small cap crude oil and natural gas companies for the retrospective periods corresponding to the respective expected life.
| e. | Per Share Amounts |
Basic earnings (loss) per share are computed by dividing net loss available to common Shareholders by the weighted average number of Common Shares outstanding. Diluted earnings (loss) per Common Share are calculated using the treasury stock method to determine the dilutive effect of the stock options. The treasury stock method assumes that the proceeds received from the exercise of “in the money” stock options and warrants are used to repurchase Common Shares at the average market price during the period. The weighted average number of shares assumed to be outstanding was as follows:
| Six months ended June 30, |
Year ended December31, |
|||||||
| 2012 | 2011 | |||||||
| Net income (loss) |
$ | 28,858,180 | $ | (3,229,648 | ) | |||
| Basic and diluted shares outstanding (i) |
69,834,396 | 67,009,441 | ||||||
| Income (loss) per basic and diluted share |
$ | 0.41 | $ | (0.05 | ) | |||
| (i) | For the six months ended June 30, 2012, 10.8 million stock options and warrants were excluded from the diluted loss per share calculation. For the year ended December 31, 2011, 7,422,558 stock options and warrants were excluded from the diluted loss per share calculation. Potential Common Shares from the exercise of stock options and warrants were excluded from the diluted loss per share calculation because their effect was anti-dilutive as a result of the options and warrants being out of the money for the six months ended June 30, 2012, and the Company’s net loss for the year 2011. |
69
Table of Contents
NiMin Energy Corp.
Notes to Consolidated Financial Statements
(Expressed in U.S. dollars)
| 7 | Income Taxes |
The components of the net deferred income tax asset (liability) were as follows:
| December 31, 2011 |
||||
| Temporary differences related to: |
||||
| Crude oil and natural gas property and equipment |
$ | (16,181,217 | ) | |
| Asset retirement obligations |
130,803 | |||
| Stock based compensation |
4,137,663 | |||
| Share issue costs and other |
431,629 | |||
| Research and development credts |
635,130 | |||
| Non-capital losses |
38,200,692 | |||
| Valuation allowance |
(27,354,700 | ) | ||
|
|
|
|||
| Deferred income tax asset |
$ | — | ||
|
|
|
|||
At December 31, 2013, and December 31, 2012, the deferred income tax asset is $0 due to the liquidation basis of accounting.
The provision for income taxes reflects an effective tax rate that differs from the results that would be obtained by applying the applicable statutory income tax rate in Canada, the Company’s country of domicile, which was explained as follows:
| Six months ended June 30, 2012 |
December 31, 2011 |
|||||||
| Combined Federal and Provincial/State corporate tax rate |
28.00 | % | 28.00 | % | ||||
| Gain/(Loss) before income taxes |
$ | 31,336,443 | $ | (3,229,648 | ) | |||
| Expected tax |
8,774,204 | (904,301 | ) | |||||
| Add (deduct) income tax effect of: |
||||||||
| Adjustments to prior year tax calculations |
— | 2,227,598 | ||||||
| Change in tax jurisdiction |
— | (221,656 | ) | |||||
| Difference in US & Canadian tax rates & Other |
2,703,076 | (316,281 | ) | |||||
| Permanent Differences |
(190,934 | ) | 932,728 | |||||
| Change in fair value of warrants |
— | (660,682 | ) | |||||
| Change in research and development credits |
— | — | ||||||
| Change in valuation allowance |
(8,808,083 | ) | (1,057,406 | ) | ||||
|
|
|
|
|
|||||
| Current income tax expense |
$ | 2,478,263 | $ | — | ||||
|
|
|
|
|
|||||
70
Table of Contents
NiMin Energy Corp.
Notes to Consolidated Financial Statements
(Expressed in U.S. dollars)
During the third quarter of 2012, there were tax benefits which help reduce the tax liability.
In October 2012, the Company paid $1.80 million, for Federal U.S. and California purposes, relating to taxable gains resulting from the sale of its oil and gas properties in the current period. The Federal U.S. taxable income for regular income tax purposes was fully reduced by net operating loss carryforwards of $63,362,738. The Company’s deferred tax assets were previously subject to full valuation allowance.
On May 6, 2013, the Company received a refund for U.S. income taxes of $327,174 resulting from an overpayment of income taxes in 2012. The Company generated additional net operating losses during the year ended December 31, 2013, but deferred tax assets have been recorded at their net realizable value of $0 under the liquidation basis of accounting.
| 8 | Financial Instruments |
| a. | Fair Value |
The Company’s financial instruments consist of cash and cash equivalents, trade accounts receivable, restricted investments, warrants, short-term debt, and accounts payable and accrued liabilities. For all periods presented, the fair value of the commodity derivative was obtained from the counterparty and therefore was considered level 2. Due to the pending liquidation, the Company valued the warrants based on the expected cash distribution to Shareholders as this represents management’s best estimate on the valuation of the underlying equity instruments as of December 31, 2013. As the warrants have an exercise price greater than the expected cash distribution to Shareholders, the value of the warrants were determined to approximate zero.
| b. | Credit Risk |
Credit risk was the risk of financial loss to the Company if a counterparty to a financial instrument fails to meet its contractual obligations, and arises principally from the Company’s receivables from joint venture partners and from crude oil and natural gas marketers. The majority of the Company’s receivables were within the oil and gas industry, primarily from its industry partners. The receivables were not collateralized. To date, the Company had experienced minimal bad debts, and had no allowance for doubtful accounts. The majority of the Company’s cash and cash equivalents were held by two financial institutions, one in the U.S. and the other in Canada. As of December 31, 2011, the accounts receivable balances were primarily all from the sale of oil and gas and post-close adjustments from the sale of its oil and gas properties. All receivables were current and therefore, no provision was determined to be required.
| c. | Derivatives |
Commodity price risk was the risk that the future cash flows will fluctuate as a result of changes in commodity prices. Commodity prices for crude oil and natural gas are impacted by world economic events that dictate the levels of supply and demand.
In January of 2010, the Company entered into a derivative financial contract for 7,500 Bbls of WTI crude oil production per month at a fixed rate of $85.10 per barrel until December 2012.
In December 2010, the Company entered into a derivative financial contract for 125 Bbls of oil per day for 2011 and 250 Bbls of oil per day for 2012 at a fixed rate of $90.40 per barrel.
71
Table of Contents
NiMin Energy Corp.
Notes to Consolidated Financial Statements
(Expressed in U.S. dollars)
In November 2011, the Company entered into a derivative financial contract for 100 Bbls of oil per day for 2012 at a fixed price of $96.75 per barrel.
We do not designate our derivative financial instruments as hedging instruments for accounting purposes and, as a result, we recognize the current change in a derivative’s fair value in earnings. On December 31, 2011, we recognized $976,929 as a derivative liability on crude oil derivative contracts.
During the second quarter of 2012, the Company terminated and settled all derivative contracts as of May 17, 2012, and at December 31, 2013, carried no liability.
| 9 | Related Party Transactions |
The Company used the services of Simon, Peragine, Smith and Redfearn LLP to assist in general legal matters related to contracts and lease agreements of its properties. For the period ended December 31, 2013, and December 31, 2012, the Company recorded legal expenses of $85,772 and $138,836, respectively. Mr. Redfearn is currently a member of the Company’s Board of Directors, and is a partner of the law firm
Further to its mandate of disposing of all non-cash assets, the Company sold its ownership in the beneficial interests of the Liquidating Trust, all CMD patents and rights to existing overriding royalties on non producing properties to Pacific Oil and Gas LLC for aggregate consideration of $1,000. Pacific Oil and Gas LLC is a private company, owned by Clancy Cottman and Bill Gumma, both board members of the Company.
| 10 | Quarterly Financial Information (Unaudited) |
The Company’s quarterly financial information for fiscal 2013 and 2012 is as follows:
| Year Ended December 31, 2013 |
First Quarter |
Second Quarter |
Third Quarter |
Fourth Quarter |
||||||||||||
| Beginning Net Assets in Liquidation |
$ | 7,836,918 | $ | 6,684,428 | $ | 6,132,020 | $ | 5,765,523 | ||||||||
| Increase (decrease) to nets assets: |
||||||||||||||||
| Adjustments to assets |
(28,689 | ) | — | — | — | |||||||||||
| Adjustments to Liquidation accruals |
(1,113,261 | ) | (531,743 | ) | (377,790 | ) | (825,125 | ) | ||||||||
| Foreign exchange |
(10,540 | ) | (20,665 | ) | 11,293 | (37,211 | ) | |||||||||
|
|
|
|
|
|
|
|
|
|||||||||
| Net increase (decrease) to net assets: |
(1,152,490 | ) | (552,408 | ) | (366,497 | ) | (862,336 | ) | ||||||||
|
|
|
|
|
|
|
|
|
|||||||||
| Ending Net Assets in Liquidation |
$ | 6,684,428 | $ | 6,132,020 | $ | 5,765,523 | $ | 4,903,187 | ||||||||
|
|
|
|
|
|
|
|
|
|||||||||
72
Table of Contents
NiMin Energy Corp.
Notes to Consolidated Financial Statements
(Expressed in U.S. dollars)
| Year Ended December 31, 2012 |
Third Quarter |
Fourth Quarter |
||||||
| Beginning Net Assets in Liquidation |
$ | 77,914,536 | $ | 78,743,570 | ||||
| Increase (decrease) to nets assets: |
||||||||
| Cash distribution |
— | (70,532,740 | ) | |||||
| Investment income |
51,292 | 4,921 | ||||||
| Tax adjustment |
1,019,447 | — | ||||||
| Adjustments to assets |
(21,729 | ) | (34,198 | ) | ||||
| Adjustments to Liquidation accruals |
(134,721 | ) | (394,147 | ) | ||||
| Costs incurred |
(85,255 | ) | — | |||||
| Foreign exchange |
— | 49,512 | ||||||
|
|
|
|
|
|||||
| Net increase (decrease) to net assets: |
829,034 | (70,906,652 | ) | |||||
|
|
|
|
|
|||||
| Ending Net Assets in Liquidation |
$ | 78,743,570 | $ | 7,836,918 | ||||
|
|
|
|
|
|||||
| Year Ended December 31, 2012 |
First Quarter |
Second Quarter |
||||||
| Operating revenue |
$ | 6,148,627 | $ | 4,836,963 | ||||
| Operating income (loss) |
327,441 | (8,688,007 | ) | |||||
| Other income (expense) |
(1,867,893 | ) | 41,564,902 | |||||
| Net income (loss) |
(1,540,452 | ) | 30,398,632 | |||||
| Basic net income (loss) per share |
(0.02 | ) | 0.44 | |||||
| Diluted net income (loss) per share |
$ | (0.02 | ) | $ | 0.44 | |||
73