Attached files
| file | filename |
|---|---|
| EX-32.C - EX-32.C - Tim Hortons Inc. | d697167dex32c.htm |
| EX-99 - EX-99 - Tim Hortons Inc. | d697167dex99.htm |
| EX-32.D - EX-32.D - Tim Hortons Inc. | d697167dex32d.htm |
| EX-31.D - EX-31.D - Tim Hortons Inc. | d697167dex31d.htm |
| EX-31.C - EX-31.C - Tim Hortons Inc. | d697167dex31c.htm |
Table of Contents
UNITED STATES
SECURITIES AND EXCHANGE COMMISSION
WASHINGTON, D.C. 20549
FORM 10-K/A
Amendment No. 1
(Mark One)
| x | ANNUAL REPORT PURSUANT TO SECTION 13 or 15(d) OF THE SECURITIES EXCHANGE ACT OF 1934 |
For the Fiscal Year Ended December 29, 2013
| ¨ | TRANSITIONAL REPORT PURSUANT TO SECTION 13 OR 15(d) OF THE SECURITIES EXCHANGE ACT OF 1934 |
For the transition period from to
Commission File Number: 001-32843
TIM HORTONS INC.
(Exact name of Registrant as specified in its charter)
| Canada | 98-0641955 | |
| (State or other jurisdiction of incorporation or organization) |
(I.R.S. Employer Identification Number) | |
| 874 Sinclair Road, Oakville, ON, Canada | L6K 2Y1 | |
| (Address of principal executive offices) | (Zip Code) | |
Registrant’s telephone number, including area code 905-845-6511
Securities registered pursuant to Section 12(b) of the Act:
| Title of each class |
Name of each exchange on which registered | |
| Common Shares, without par value | New York Stock Exchange | |
| Associated Share Purchase Rights | Toronto Stock Exchange |
Securities registered pursuant to Section 12(g) of the Act: None
Indicate by check mark if the Registrant is a well-known seasoned issuer, as defined in Rule 405 of the Securities Act. YES x NO ¨.
Indicate by check mark if the Registrant is not required to file reports pursuant to Section 13 or Section 15(d) of the Act. YES ¨ NO x.
Indicate by check mark whether the Registrant (1) has filed all reports required to be filed by Section 13 or 15(d) of the Securities Exchange Act of 1934 during the preceding 12 months (or for such shorter period that the Registrant was required to file such reports) and (2) has been subject to such filing requirements for the past 90 days. YES x NO ¨.
Indicate by check mark whether the Registrant has submitted electronically and posted on its corporate Web site, if any, every Interactive Data File required to be submitted and posted pursuant to Rule 405 of Regulation S-T during the preceding 12 months (or for such shorter period that the Registrant was required to submit and post such files). YES x NO ¨.
Indicate by check mark if disclosure of delinquent filers pursuant to Item 405 of Regulation S-K is not contained herein, and will not be contained, to the best of Registrant’s knowledge, in definitive proxy or information statements incorporated by reference in Part III of this Form 10-K or any amendment to this Form 10-K. x
Indicate by check mark whether the Registrant is a large accelerated filer, an accelerated filer, a non-accelerated filer, or a smaller reporting company. See the definitions of “large accelerated filer,” “accelerated filer” and “smaller reporting company” in Rule 12b-2 of the Exchange Act.
| Large accelerated filer | x | Accelerated filer | ¨ | |||
| Non-accelerated filer | ¨ | Smaller reporting company | ¨ | |||
| (Do not check if a smaller reporting company) | ||||||
Indicate by check mark whether the Registrant is a shell company (as defined in Rule 12b-2 of the Exchange Act). YES ¨ NO x.
The aggregate market value of the common shares held by non-affiliates of the Registrant computed by reference to the price at which such shares were last sold, as of June 28, 2013, was Cdn.$8,587,689,502 (US$8,172,497,059).
Number of common shares outstanding as of February 21, 2014: 138,165,308
DOCUMENTS INCORPORATED BY REFERENCE:
Exhibit index on pages 64-69.
Table of Contents
EXPLANATORY NOTE
Tim Hortons Inc., a corporation incorporated under the Canada Business Corporations Act (the “Company”), qualifies as a foreign private issuer in the U.S. for purposes of the Securities Exchange Act of 1934, as amended (the “Exchange Act”). Although as a foreign private issuer the Company is no longer required to do so, the Company currently continues to file annual reports on Form 10-K, quarterly reports on Form 10-Q, and current reports on Form 8-K with the Securities and Exchange Commission (“SEC”) instead of filing the reports available to foreign private issuers. The Company prepares and files a management proxy circular and related material under Canadian requirements. As the Company’s management proxy circular is not filed pursuant to Regulation 14A, the Company may not incorporate by reference information required by Part III of its Form 10-K from its management proxy circular.
The Company filed its Annual Report on Form 10-K for the fiscal year ended December 29, 2013 (“2013 Form 10-K”) on February 25, 2014. In reliance upon and as permitted by Instruction G(3) to Form 10-K, the Company is filing this Amendment No. 1 on Form 10-K/A in order to include in the 2013 Form 10-K the Part III information not previously included in the 2013 Form 10-K.
No attempt has been made in this Amendment No. 1 on Form 10-K/A to modify or update the other disclosures presented in the 2013 Form 10-K. This Amendment No. 1 on Form 10-K/A does not reflect events occurring after the filing of the 2013 Form 10-K. Accordingly, this Amendment No. 1 on Form 10-K/A should be read in conjunction with the 2013 Form 10-K and the Company’s other filings with the SEC.
In this Amendment No. 1 on Form 10-K/A, we also refer to Tim Hortons Inc. as “Tim Hortons,” “we,” “us,” “our,” “our corporation,” or “the corporation.” References to “GAAP” mean generally accepted accounting principles in the United States.
All references to our websites contained herein do not constitute incorporation by reference of information contained on such websites and such information should not be considered part of this document.
2
Table of Contents
TIM HORTONS INC.
2013 FORM 10-K/A ANNUAL REPORT
| Page | ||||
| PART III | ||||
| Item 10. Directors, Executive Officers and Corporate Governance |
4 | |||
| 11 | ||||
| 56 | ||||
| Item 13. Certain Relationships and Related Transactions, and Director Independence |
58 | |||
| 61 | ||||
| PART IV | ||||
| 64 | ||||
| 63 | ||||
3
Table of Contents
PART III
| Item 10. | Directors, Executive Officers and Corporate Governance |
Directors of Registrant
|
Long Grove, Illinois, United States
Age: 57 |
M. Shan Atkins Independent | Director since March 2007
Ms. Atkins has been a Managing Director of Chetrum Capital LLC, a private investment firm, since 2001. From 1996 to 2001, Ms. Atkins held various positions with Sears Roebuck & Co., a major retailer, being promoted to Executive Vice President in 1999. Prior to joining Sears, Ms. Atkins spent 14 years with Bain & Company, Inc., an international management consulting firm, as a leader in Bain’s consumer and retail practice. Ms. Atkins began her career as a public accountant at what is now PricewaterhouseCoopers LLP, a major accounting firm, and has designations as a C.A. (Ontario) and C.P.A. (Illinois). Ms. Atkins has served as a member of Queen’s School of Business International Advisory Board since the Spring of 2009. Ms. Atkins holds a Bachelor of Commerce degree from Queen’s University in Kingston, Ontario, as well as a Master of Business Administration from Harvard University.
Key skills and experience
General retail experience | Senior leadership experience | Public company board experience | Human resource and compensation expertise | Financial expertise |

| Board and Committees | Meeting attendance | 2013 voting results | ||||||||||
| Board |
5 of 5 | 100% | 99.17% FOR | |||||||||
| Human Resource and Compensation Committee |
5 of 5 | 100% | ||||||||||
| Nominating and Corporate Governance Committee |
4 of 4 | 100% | ||||||||||
| Securities held | ||||||||||||
| DSUs | Common shares | Total value | Meets share ownership guidelines | |||||||||
| 11,466 | 1,000 | $763,543 ($611,111 in prior year) |
Yes, 7X annual retainer (minimum 4X or $440,000) | |||||||||
| Other public company boards | Other public company boards in last five years | |||||||||||
| The Pep Boys-Manny, Moe & Jack (NYSE) SpartanNash Company (NASDAQ) |
Shoppers Drug Mart Corporation (2005-2012) (TSX) | |||||||||||
|
Calgary, Alberta Canada
Age: 54 |
Sherri A. Brillon Independent | Audit Committee Financial Expert | Director since August 2013
Ms. Brillon is Executive Vice-President and Chief Financial Officer of Encana Corporation, a leading North American energy producer. In this role, Ms. Brillon directs the financial operations of the company and manages the availability of financial resources to enable the company to execute its strategy. Since joining one of Encana’s predecessor companies in 1985, her achievements have included key leadership roles in helping the company achieve some of its most significant milestones, including structuring the $22.5 billion merger that created Encana in 2002 and restructuring the organization into a core natural gas company in 2009. She has played a pivotal role in evaluating Encana’s investment opportunities and resource allocation and has been instrumental in assisting with corporate and operations planning, strategic planning and supply management. Ms. Brillon’s professional accomplishments include recognition as one of Canada’s Most Powerful Women: Top 100 Hall of Fame. She has also been recognized by the Women of Influence organization.
Key skills and experience
Senior leadership experience | Financial expertise | Risk assessment and mitigation expertise | New business development/M&A expertise | Governance/legal expertise |

| Board and Committees | Meeting attendance | 2013 voting results | ||||||||||
| Board |
1 of 1 | 100% | n/a(1) | |||||||||
| Audit Committee(1) |
n/a | n/a | ||||||||||
| Securities held | ||||||||||||
| DSUs | Common shares | Total value | Meets share ownership guidelines | |||||||||
| 919 | — | $56,289 | Under the guidelines, Ms. Brillon has until August 2018 to meet the ownership threshold (minimum 4X or $440,000) | |||||||||
| Other public company boards | Other public company boards in last five years | |||||||||||
| None | None | |||||||||||
| (1) | Ms. Brillon was appointed to the Board on August 8, 2013 and was appointed to the Audit Committee on November 6, 2013. |
4
Table of Contents
|
Toronto, Ontario, Canada
Age: 60 |
Marc Caira Not independent | President and CEO since July 2, 2013 | Director since May 2013
Mr. Caira was appointed President & CEO of Tim Hortons effective July 2, 2013, and as a director of the Board effective May 9, 2013. Mr. Caira is responsible for the strategic direction and overall performance of Tim Hortons and its operations.
Before his appointment as President and CEO, Mr. Caira was Global CEO of Nestlé Professional. He was also a member of the Executive Board of Nestlé SA, the world’s largest food and beverage company and a recognized leader in nutrition, health and wellness. Prior to being named Global CEO of Nestlé Professional in 2006, Mr. Caira had served, among other roles, as the President & CEO of Parmalat North America, as Chief Operating Officer of Parmalat Canada, and as President, Food Services and Nescafe Beverages for Nestlé Canada.
Key skills and experience
Senior leadership experience | Brand marketing expertise | Restaurant industry and operations expertise International expertise | Manufacturing expertise | Financial expertise | Human resource and compensation expertise | New business development/M&A expertise | General retail experience |

| Board and Committees | Meeting attendance | 2013 voting results | ||||||||
| Board |
3 of 3 | 100% | 99.14% FOR(1) | |||||||
| Executive Committee (not included for director attendance purposes) |
n/a | n/a | ||||||||
| Securities held | ||||||||||
| DSUs | Common shares | Total value | Meets share ownership guidelines | |||||||
| Mr. Caira receives compensation as President and CEO, not for his services as a director. See “Executive Compensation” beginning on page 14 of this circular for details | Mr. Caira has until July 2018 to meet the CEO share ownership threshold (minimum 5X his base salary or $4,550,000) | |||||||||
| Other public company boards | Other public company boards in last five years | |||||||||
| None | None | |||||||||
| (1) | Our proxy circular for our 2013 annual shareholders meeting provided for nine nominees to the Board; however, one nominee, Mr. Ron Osborne, passed away suddenly and unexpectedly on April 9, 2013. In accordance with our By-laws, the Board subsequently nominated Mr. Caira as a substitute nominee to the Board in place of Mr. Osborne. |
|
Columbus, Ohio, United States
Age: 66 |
Michael J. Endres Independent | Audit Committee Financial Expert | Director since April 2006
Mr. Endres is a Managing Principal of Stonehenge Financial Holdings, Inc. (Stonehenge), a private equity firm that he co-founded in 1999. Prior to co-founding Stonehenge, Mr. Endres was Vice Chairman of Banc One Capital Holdings Corporation and Chairman of Banc One Capital Partners. Mr. Endres currently serves as a member of the board of directors of Worthington Industries, Inc. and Huntington Bancshares, Inc. (Huntington)(1). Mr. Endres also served on the Board of Trustees of OhioHealth Corporation, a large non-profit health system with multiple hospitals and related healthcare facilities and services, located in Ohio, until June 2013. He holds a Bachelor of Science degree from Miami University in Oxford, Ohio.
Key skills and experience
Financial expertise | New business development/M&A expertise | Senior leadership experience | Public company board experience | Risk assessment and mitigation expertise |

| Board and Committees | Meeting attendance | 2013 voting results | ||||||||
| Board |
5 of 5 | 100% | 99.20% FOR | |||||||
| Audit Committee (Chair) |
4 of 4 | 100% | ||||||||
| Executive Committee (not included for director attendance purposes) |
n/a | n/a | ||||||||
| Securities held DSUs |
Common shares | Total value | Meets share ownership guidelines | |||||||
| 20,124 | 52,884 | $4,471,740 ($3,703,373 in prior year) |
Yes, 41X annual retainer (minimum 4X or $440,000) | |||||||
| Other public company boards | Other public company boards in last five years | |||||||||
| Worthington Industries, Inc. (NYSE) Huntington Bancshares, Inc. (NASDAQ) |
None | |||||||||
| (1) | Huntington, either directly, or indirectly through affiliates or subsidiaries, provides certain banking services to us in the U.S. The Board concluded that Mr. Endres’ independence is not affected by his service as a Huntington director because he is not involved in day-to-day activities of Huntington and does not have any direct responsibility with respect to arrangements between Huntington and us. Mr. Endres has agreed to recuse himself from participating in meetings of Huntington’s board of directors and our Board if it is reasonably likely that participating in the meeting would, or is reasonably likely to, present a conflict of interest. |
5
Table of Contents
|
London, United Kingdom
Age: 59 |
Moya M. Greene Independent | Director since February 2008
Ms. Greene has been Chief Executive Officer of the Royal Mail, the U.K. government postal service and FTSE 100 company listed on the London Stock Exchange, since July 2010, and prior thereto, was the President, Chief Executive Officer and a member of the Board of Directors of Canada Post Corporation, the Canadian postal authority, since May 2005. She was also Vice Chair of Purolator and served on its Nominating and Corporate Governance Committee and Compensation Committee. From 2003 to 2004, Ms. Greene was Senior Vice President, Operational Effectiveness, of Bombardier Inc., a leading manufacturer of rail transportation equipment and aircraft. From 2000 to 2003, she was Senior Vice President, Chief Administrative Officer, Retail Products, at Canadian Imperial Bank of Commerce, a leading North American financial institution, and from 1996 to 2000, Managing Director, Infrastructure Finance and Public Private Partnership for TD Securities Inc., a leading Canadian financial services firm. Ms. Greene also has an extensive public service background, having served most recently as Assistant Deputy Minister for Transport Canada, the Canadian federal transportation authority, from 1991 to 1996 and, from 1989 to 1991, as Director, General Policy, for Human Resources and Social Development, Canada. She is a graduate of Osgoode Hall Law School and was recognized in 2003 and in 2012 by the National Post as one of Canada’s Top 100 influential women and in 2004 by the Ivey School of Business/Women Executive Network as one of the Top 40 female corporate executives in Canada.
Key skills and experience
Senior leadership experience | Corporate Social Responsibility | Human resource and compensation | Government/regulatory expertise | International expertise | Financial expertise | Distribution, warehouse and logistics expertise | IT/technical expertise |

| Board and Committees | Meeting attendance | 2013 voting results | ||||||||||
| Board |
5 of 5 | 100% | 99.09% FOR | |||||||||
| Audit Committee |
4 of 4 | 100% | ||||||||||
| Human Resource and Compensation Committee |
5 of 5 | 100% | ||||||||||
| Securities held | ||||||||||||
| DSUs | Common shares | Total value | Meets share ownership guidelines | |||||||||
| 14,781 | — | $905,336 ($679,532 in prior year) |
Yes, 8X annual retainer (minimum 4X or $440,000) | |||||||||
| Other public company boards | Other public company boards in last five years | |||||||||||
| None | None | |||||||||||
6
Table of Contents
|
Jordan, Ontario, Canada
Age: 70 |
Paul D. House Not independent | Non-executive Chairman | Director since November 2005
Mr. House has served as our Chairman since March 1, 2008, and as our President and CEO from May 24, 2011 until July 2, 2013. Mr. House joined Tim Hortons as Vice President of Marketing in 1985 and occupied various senior management positions leading to his appointment in 1993 as Chief Operating Officer. He became President and Chief Operating Officer in 1995 and Chief Executive Officer in November 2005. In 2007, he was appointed Chairman of the Board. Mr. House served on the Board of Directors of Wendy’s International, Inc. from 1998 through February 1, 2007. He is a member of the Board of Directors of the Tim Horton Children’s Foundation and serves on the Board of Trustees of Brock University, as well as on the Advisory Board of the Brock University Business School. Mr. House joined Dairy Queen Canada in 1972 and held various management positions with that company including Vice President of Canadian Operations. Mr. House holds a Bachelor of Arts in Economics from McMaster University.
Key skills and experience
Franchised organization experience | Brand marketing expertise | Senior leadership experience | Real estate experience | General retail experience | Distribution, warehouse and logistics expertise | New business development/M&A expertise | Public company board experience | Restaurant industry and operations expertise |

| Board and Committees | Meeting attendance | 2013 voting results | ||||||||||
| Board |
5 of 5 | 100% | 96.66% FOR | |||||||||
| Executive Committee (not included for director attendance purposes) |
n/a | n/a | ||||||||||
| Securities held | ||||||||||||
| DSUs | Common shares | Total value | Meets share ownership guidelines | |||||||||
| 625 | 114,835 | $7,071,925 ($9,335,700 in prior year) |
Yes, 64X annual retainer (minimum 4X or $440,000) | |||||||||
| Other public company boards | Other public company boards in last five years | |||||||||||
| None | None | |||||||||||
|
Toronto, Ontario, Canada
Age: 76 |
The Hon. Frank Iacobucci Independent | Lead Director since February 2007 | Director since February 2006
The Hon. Frank Iacobucci has been Counsel to Torys LLP, a major Canadian law firm, since July 2005. Mr. Iacobucci was the Chairman of Torstar Corporation, a newspaper and book publishing company, from July 2005 until May 2009. From September 2004 to June 2005, Mr. Iacobucci served as Interim President of the University of Toronto while the search for a new university president was being conducted. From 1991 to 2004, Mr. Iacobucci served as a Justice of the Supreme Court of Canada. Mr. Iacobucci is a Board Member of Costi Immigration Services, and is a member of the Advisory Committee of General Motors of Canada. From 2005 to 2012, Mr. Iacobucci served as Chair of the Higher Education Quality Council of Ontario. Mr. Iacobucci is a member of the Law Society of Upper Canada and holds academic degrees from Cambridge University and the University of British Columbia, and has been the recipient of numerous awards and honours from Canada, the United States, and Italy. In 2007, Mr. Iacobucci was made a Companion of the Order of Canada.
Key skills and experience
Governance/legal expertise | Public company board experience | Government/regulatory expertise | Senior leadership experience | Human resource and compensation expertise | Corporate Social Responsibility | Financial expertise |

| Board and Committees | Meeting attendance | 2013 voting results | ||||||||||
| Board |
5 of 5 | 100% | 98.81% FOR | |||||||||
| Human Resource and Compensation Committee |
5 of 5 | 100% | ||||||||||
| Nominating and Corporate Governance Committee (Chair) |
4 of 4 | 100% | ||||||||||
| Executive Committee (not included for director attendance purposes) |
n/a | n/a | ||||||||||
| Securities held | ||||||||||||
| DSUs | Common shares | Total value | Meets share ownership guidelines | |||||||||
| 29,266 | 6,663 | $2,200,651 ($1,857,069 in prior year) |
Yes, 20X annual retainer (minimum 4X or $440,000) | |||||||||
| Other public company boards | Other public company boards in last five years | |||||||||||
| None | Torstar Corporation (2003-2009) (TSX) | |||||||||||
7
Table of Contents
|
Toronto, Ontario, Canada
Age: 58 |
John A. Lederer Independent | Director since February 2007
Mr. Lederer currently serves as President and Chief Executive Officer, and as a director, of US Foods, a position he has held since September 2010(1). He served as Chairman of the Board and Chief Executive Officer of Duane Reade, a privately-held chain of retail pharmacies located primarily in the New York City area, from April 2008 to August 2010. Mr. Lederer served as President of Loblaw Companies Limited (Loblaw), Canada’s largest food distributor, from 2001 through September 2006 and also served as a director of Loblaw for much of this period, capping a 30-year career with Loblaw and its subsidiary companies during which he held a number of senior leadership positions. In these roles, he was responsible for the operation, performance, innovation and growth of national and regional banners, businesses and divisions. Mr. Lederer is a former director of the Food Marketing Institute. He holds a Bachelor of Arts degree from York University. Mr. Lederer has served as a member of the Board of Directors of the Tim Horton Children’s Foundation since May 2008.
Key skills and experience
Senior leadership experience | General retail experience | Franchised organization experience | Real estate experience | Brand marketing expertise |

| Board and Committees | Meeting attendance | 2013 voting results | ||||||||||
| Board |
5 of 5 | 100% | 99.00% FOR | |||||||||
| Human Resource and Compensation Committee |
4 of 5(2) | 80% | ||||||||||
| Nominating and Corporate Governance Committee |
3 of 4(2) | 75% | ||||||||||
| Securities held DSUs |
Common shares | Total value | Meets share ownership guidelines | |||||||||
| 22,642 |
15,120 | $2,312,923 ($1,859,169 in prior year) |
Yes, 21X annual retainer (minimum 4X or $440,000) | |||||||||
| Other public company boards | Other public company boards in last five years | |||||||||||
| None |
None | |||||||||||
| (1) | US Foods is a food distribution enterprise which also supplies quick service restaurants in the U.S. Tim Hortons has no transactional or other business relationship with US Foods. The Board considered whether Mr. Lederer’s position would have an impact on his independence, from the perspective of a general competitive conflict, and concluded that his independence would not be affected by his relationship with US Foods. Mr. Lederer has agreed to recuse himself from participating in meetings of the US Foods board of directors and our Board if such participation would, or is reasonably likely to, present a conflict of interest. |
| (2) | Mr. Lederer missed two Committee meetings in 2013 for medical reasons. |
|
Caledon, Ontario, Canada
Age: 69 |
David H. Lees Independent | Director since February 2006
Dr. Lees is the President and Chief Executive Officer of Cardinal Health in Canada, a major medical product manufacturer, distributor, and service provider, and the parent company of Source Medical Corporation and Cardinal Health’s other Canadian operations. From 1999 to 2006, Dr. Lees served as President and Chief Executive Officer of Source Medical. Dr. Lees was President, Chief Executive Officer and a director of Canada Bread Company, Limited/Corporate Foods Limited, a TSX-listed manufacturer and marketer of baked goods and other food products, from 1993 until 1999. From 1991 to 1995, Dr. Lees served as a director of Maple Leaf Foods Inc. Dr. Lees holds a Doctorate of Philosophy in Food Science from the University of Massachusetts, a Master of Science in Agriculture from Macdonald College, McGill University, and a Bachelor of Science (Agriculture) from Macdonald College.
Key skills and experience
Senior leadership experience | Manufacturing expertise | Distribution, warehouse and logistics expertise Public company board experience | Financial expertise |

| Board and Committees | Meeting attendance | 2013 voting results | ||||||||||
| Board |
5 of 5 | 100% | 99.21% FOR | |||||||||
| Audit Committee |
4 of 4 | 100% | ||||||||||
| Nominating and Corporate Governance Committee |
4 of 4 | 100% | ||||||||||
| Securities held DSUs |
Common shares | Total value | Meets share ownership guidelines | |||||||||
| 22,533 |
6,680 | $1,789,296 ($1,405,798 in prior year) |
Yes, 16X annual retainer (minimum 4X or $440,000) | |||||||||
| Other public company boards | Other public company boards in last five years | |||||||||||
| None |
None | |||||||||||
8
Table of Contents
|
Toronto, Ontario Canada
Age: 58 |
Thomas V. Milroy Independent | Audit Committee Financial Expert | Director since August 2013
Mr. Milroy is Chief Executive Officer of BMO Capital Markets, and is responsible for all of BMO Financial Group’s businesses involving corporate, institutional and government clients in North America and globally(1). Prior to his current role, to which he was appointed in 2008, Mr. Milroy had senior roles in investment and corporate banking, and was responsible for the integration of Bank of Montreal’s corporate banking with the investment banking capabilities of Nesbitt Burns. He was subsequently also responsible for the integration of the corporate banking business of Harris Bank and Nesbitt Burns in the U.S. In 2001, Mr. Milroy was appointed Vice-Chair and Global Head of Investment and Corporate Banking, and in 2006 he was named Co-President of BMO Capital Markets. Previously, Mr. Milroy worked in the Mergers and Acquisition group of a U.S. investment banking firm in New York and Toronto. Prior to that, he practiced securities law as a partner in a Toronto-based law firm.
Key skills and experience
Senior leadership experience | Financial expertise | Governance/legal expertise | Public company board experience | New business development/M&A expertise |

| Board and Committees(2) | Meeting attendance | 2013 voting results | ||||||||||
| Board |
1 of 1 | 100% | n/a(2) | |||||||||
| Audit Committee |
n/a | n/a | ||||||||||
| Securities held DSUs |
Common shares | Total value | Meets share ownership guidelines | |||||||||
| 919 |
— | $56,289 | Under the guidelines, Mr. Milroy has until August 2018 to meet the ownership threshold (minimum 4X or $440,000) | |||||||||
| Other public company boards | Other public company boards in last five years | |||||||||||
| None |
None | |||||||||||
| (1) | BMO Capital Markets is an affiliate of Bank of Montreal (BMO). Mr. Milroy is also Chair of BMO Nesbitt Burns Inc. The Board concluded that Mr. Milroy’s independence is not affected by his service with the BMO Financial Group. From time to time, Tim Hortons and its subsidiaries do business with BMO and its subsidiaries. For example, BMO Financial Group provides ordinary course banking and foreign exchange services to us at times, and Tim Hortons entered into a private share repurchase transaction to acquire our common shares from BMO (occurring prior to Mr. Milroy’s appointment to the Board), all of which were made in the ordinary course of business and were conducted on terms no less favourable than we could have obtained from an unrelated third party. Mr. Milroy, however, is not involved in BMO Financial Group’s business with Tim Hortons, and the determination of his compensation at BMO Financial Group is not affected by the existence or absence of any business relationship between us. Further, we have implemented various safeguards to address any potential independence concerns that might arise from entering into transactions with the BMO Financial Group. For example, the receipt of investment banking and other professional services from the BMO Financial Group is now prohibited, and the entering into of any non-ordinary course transactions with the BMO Financial Group is subject to the prior approval of our legal department. |
With respect to the share ownership position of BMO Asset Management, an affiliate of BMO Capital Markets, the Board was satisfied that confidentiality safeguards were in place between the investment banking and asset management departments of the BMO Financial Group, so that Mr. Milroy would have no control over any transactions involving Tim Hortons stock. Mr. Milroy has agreed to recuse himself from participating in meetings of the BMO Nesbitt Burns Inc. board of directors and our Board if participating in a meeting would, or is reasonably likely to, present a conflict of interest.
| (2) | Mr. Milroy was appointed to the Board on August 8, 2013 and was appointed to the Audit Committee on November 6, 2013. |
9
Table of Contents
|
Burlingame, California, United States
Age: 41 |
Christopher R. O’Neill Independent | Director since March 2014
Mr. O’Neill is the Managing Director of Google Canada, a role he has held since 2010(1). In this capacity, Mr. O’Neill oversees Google’s operations in Canada and is a member of Google’s Americas Management Group. From 2005 to 2010, Mr. O’Neill held a variety of executive-level roles at Google. Prior to joining Google, Mr. O’Neill was a product marketing director at HSBC, a large global financial organization, and a strategy consultant at Oliver Wyman, a leading global management consulting firm. Mr. O’Neill sits on the Board of the Canadian Marketing Association and is a Charter Member of the C100, a non-profit, member-driven organization dedicated to supporting Canadian technology entrepreneurship and investment. He is also a former Board Member of Shop.org, the National Retail Federation’s digital division. Mr. O’Neill holds a Bachelor of Arts (Economics) from Huron College, University of Western Ontario, and a Master of Business Administration from the Tuck School of Business at Dartmouth College.
Key skills and experience
IT/technical expertise | Brand marketing expertise | New business development/M&A expertise | Senior leadership experience | International expertise |

| Board and Committees | Meeting attendance | 2013 voting results | ||||||||||
| Board(2) |
n/a | n/a | n/a(2) | |||||||||
| Securities held DSUs |
Common shares | Total value | Meets share ownership guidelines | |||||||||
| — |
— | — | Under the guidelines, Mr. O’Neill has until March 2019 to meet the ownership threshold (minimum 4X or $440,000) | |||||||||
| Other public company boards | Other public company boards in last five years | |||||||||||
| None |
None | |||||||||||
| (1) | The Board concluded that Mr. O’Neill’s independence is not affected by his service with Google Canada. From time to time, Tim Hortons and its subsidiaries do business with Google Canada and its affiliates (Google). For example, Tim Hortons, through its media agencies, purchases digital advertising from Google in the ordinary course of business, for insignificant amounts representing less than 0.1% of Google Inc.’s annual revenues. However, the determination of Mr. O’Neill’s compensation at Google is not affected by the existence or absence of any business relationship between us. Further, we have implemented various safeguards to address any potential independence concerns that might arise from entering into transactions with Google (for example, any non-ordinary course transactions with Google will be subject to prior approval). Mr. O’Neill has also agreed to recuse himself from participating in meetings of our Board if participating in a meeting would, or is reasonably likely to, present a conflict of interest. |
| (2) | Mr. O’Neill was appointed to the Board on March 11, 2014. |
|
Jupiter, Florida, United States
Age: 64 |
Wayne C. Sales Independent | Director since April 2006
Mr. Sales was Chairman of the Board of Directors of SUPERVALU INC. (SUPERVALU), a grocery retailer and distributor, from June 2010 until March 2013, and has served as a director of SUPERVALU since 2006(1). From July 2012 until February 2013, he served as President and Chief Executive Officer of SUPERVALU. Previously, he served as President and Chief Executive Officer, and then as Vice-Chairman, of Canadian Tire Corporation Limited, a TSX-listed retail, financial services, and petroleum company. He served as Vice-Chairman of Canadian Tire until June 2007 following his tenure as President and Chief Executive Officer, a position that he held from 2000 to 2006. Prior to 2000, Mr. Sales held positions as Executive Vice President and Senior Vice President, Marketing at Canadian Tire Retail, a subsidiary of Canadian Tire. Mr. Sales is a graduate of Harvard Business School’s Advanced Management Program.
Key skills and experience
General retail experience | Senior leadership experience | Franchised organization experience | Brand marketing expertise | Human resource and compensation expertise | New business development/M&A expertise |

| Board and Committees | Meeting attendance | 2013 voting results | ||||||||||
| Board |
5 of 5 | 100% | 99.06% FOR | |||||||||
| Human Resource and Compensation Committee (Chair) |
5 of 5 | 100% | ||||||||||
| Nominating and Corporate Governance Committee |
4 of 4 | 100% | ||||||||||
| Securities held DSUs |
Common shares | Total value | Meets share ownership guidelines | |||||||||
| 22,809 |
12,067 | $2,136,155 ($1,694,498 in prior year) |
Yes, 19X annual retainer (minimum 4X or $440,000) | |||||||||
| Other public company boards | Other public company boards in last five years | |||||||||||
| SUPERVALU INC. (NYSE) |
Discovery Air Inc. (2008-2012) (TSX) Georgia Gulf Corporation (2007-2012) (NYSE) | |||||||||||
| (1) | Tim Hortons has no transactional or other business relationship with SUPERVALU. The Board considered whether Mr. Sales’ position(s) with SUPERVALU would have an impact on his independence, from the perspective of a general competitive conflict, and concluded that Mr. Sales’ independence would not be affected by his relationship with SUPERVALU. Mr. Sales has agreed to recuse himself from participating in meetings of the SUPERVALU board of directors and our Board if participating in a meeting would, or is reasonably likely to, present a conflict of interest. |
10
Table of Contents
Section 16(a) Beneficial Ownership Reporting Compliance
Section 16(a) of the Exchange Act does not apply because we are a foreign private issuer under U.S. securities laws. Our officers and directors are required to file reports of equity ownership and changes of ownership with the Canadian Securities Administrators and do not file such reports under the Exchange Act.
Code of Ethics (Standards of Business Practices)
The Company has adopted a Code of Ethics, which we have designated as our Standards of Business Practices, that applies to all of our officers and employees, including our principal executive officer, principal financial officer, principal accounting officer or controller, or persons performing similar functions. The Standards of Business Practices is available on the Company’s investor website at www.timhortons-invest.com.
Audit Committee
The current members of the Audit Committee are Mr. Endres (Chair), Mses. Brillon and Greene, and Messrs. Lees and Milroy, each of whom is independent under our independence requirements (as described below under Item 13 – “Director Independence”), which incorporate the listing standards of the New York Stock Exchange (“NYSE”) and the rules of the Canadian Securities Administrators. The Board of Directors has determined that all current Audit Committee members are financially literate and that Messrs. Endres and Milroy, and Ms. Brillon, are “audit committee financial experts,” as such term is defined by applicable U.S. securities laws. The Audit Committee met four times during 2013. Executive sessions comprised only of the independent directors who were members of the Audit Committee were held at each of those meetings.
| Item 11. | Executive Compensation |
As a foreign private issuer in the United States, we are deemed to comply with this Item if we provide information required by Items 6.B and 6.E.2 of Form 20-F, with more detailed information provided if otherwise made publicly available or required to be disclosed in Canada. We have provided information required by Items 6.B and 6.E.2 of Form 20-F in our management proxy circular related to the Meeting (the “proxy circular”) and have filed it through the Canadian System for Electronic Document Analysis and Retrieval (“SEDAR”), the Canadian equivalent of the SEC’s Next-Generation EDGAR system, at www.sedar.com. In addition, our proxy circular has been furnished to the SEC on Form 8-K. As a foreign private issuer in the U.S., we are not required to disclose executive compensation according to the requirements of Regulation S-K that apply to U.S. domestic issuers, and we are otherwise not required to adhere to the U.S. requirements relative to certain other proxy disclosures and requirements. Our executive compensation disclosure complies with Canadian requirements, which are, in most respects, substantially similar to the U.S. rules. We generally attempt to comply with the spirit of the U.S. proxy rules when possible and to the extent that they do not conflict, in whole or in part, with required Canadian corporate or securities requirements or disclosure.
All dollar amounts included in this Item 11 are in Canadian dollars, unless otherwise expressly stated to be in U.S. dollars.
11
Table of Contents
Human Resource and Compensation Committee
The Human Resource and Compensation Committee is responsible for establishing our executive compensation policies and practices and administering compensation programs for our executive officers and any other officers that report directly to the CEO. It determines all elements of executive compensation, other than for the President and CEO, including any change of control or severance arrangements. The Board determines all aspects of the CEO’s compensation, including respective plans, programs and arrangements, based on its review and the Committee’s recommendation, in executive session, as required by the Committee charter.
The Committee met five times in 2013. It held an executive session at each meeting, consisting only of the Committee’s independent directors and without management present.
| Members | Wayne C. Sales (Chair) M. Shan Atkins Moya M. Greene
|
The Hon. Frank Iacobucci John A. Lederer | ||||
| Independence | 100%
Each member meets our independence requirements and also satisfies the requirements of “non-employee directors” under Rule 16b-3 of the Exchange Act and of “outside directors” under Section 162(m) of the Internal Revenue Code
| |||||
| Collective qualifications of Human Resource and Compensation Committee members | • • • • |
human resources or compensation experience CEO experience member of a compensation committee of another public company governance, legal and oversight expertise
| ||||
| Key responsibilities on an annual and ongoing basis | Annual financial and business goals | |||||
| • | together with the Board, reviews and approves the annual financial and business goals and objectives established by the CEO for executive officers, which are utilized for making executive compensation determinations | |||||
| • | evaluates the performance of executive officers against these goals and objectives | |||||
| • | establishes performance objectives, as well as the weightings and payout curves under the short-term incentive plan and long-term equity incentive plan | |||||
| • | determines the type of award and approves grants under the equity compensation plans, subject to the Board’s approval of grants for the President and CEO | |||||
| Compensation governance and best practices | ||||||
| • | monitors governance and best practice initiatives and trends in executive compensation | |||||
| • | oversees all matters relating to shareholder advisory votes (‘say on pay’) | |||||
| • | reports to the Board on director compensation at least once a year | |||||
| • | reviewed and approved the CD&A in this circular | |||||
| Succession planning | ||||||
| • | oversees the process for CEO succession planning, including any work to assist the Board in identifying and evaluating potential successors to the CEO | |||||
| • | reviews the succession plans for each executive officer position | |||||
| • | oversees development plans for the executive team members and their successors | |||||
| • | initiates an external search for executive officer roles, as appropriate | |||||
| Compliance review | ||||||
| • | monitors compliance with our share ownership guidelines for directors and executives every year
| |||||
12
Table of Contents
Pre-approval policy
The Human Resource and Compensation Committee pre-approves services and fees to be provided by an independent compensation consultant prior to any formal engagement, similar to the Audit Committee’s pre-approval policy for services and fees relating to the independent auditor. Prior to the beginning of the year, the independent consultant develops a project plan that sets out the services to be performed over the coming year and the estimated fees. The Committee approves the specific terms of the independent consultant’s engagement, and the project plan and related fees of the independent consultant, annually.
Report presented by the Human Resource and Compensation Committee
Wayne C. Sales (Chair)
M. Shan Atkins
Moya M. Greene
The Hon. Frank Iacobucci
John A. Lederer
13
Table of Contents
| Executive Compensation — Compensation Discussion and Analysis
This Compensation Discussion and Analysis (CD&A) explains executive compensation at Tim Hortons and has been prepared by management, and reviewed and approved by the Human Resource and Compensation Committee. |
In this CD&A, executive means an executive officer of Tim Hortons and Committee means the Human Resource and Compensation Committee unless we indicate otherwise. |
This CD&A includes information on executive pay for our Chief Executive Officer, former Chief Executive Officer, Chief Financial Officer and our three next most highly-compensated officers (our named executives) for 2013:
| • | Marc Caira, President and Chief Executive Officer (President and CEO) (as of July 2, 2013) |
| • | Paul D. House, Executive Chairman, President and CEO (until July 1, 2013) |
| • | Cynthia J. Devine, Chief Financial Officer (CFO) |
| • | David F. Clanachan, Chief Operating Officer (COO) |
| • | William A. Moir, Chief Brand and Marketing Officer (CMO) |
| • | Roland M. Walton, President, Tim Hortons Canada |
|
Marc Caira President and CEO (as of July 2, 2013) |
Paul D. House Executive Chairman, President and CEO (until July 1, 2013) |
Cynthia J. Devine Chief Financial Officer |
David F. Clanachan Chief Operating Officer |
William A. Moir Chief Brand and Marketing Officer |
Roland M. Walton President, Tim Hortons Canada | |||||


Mr. House stepped down as President and CEO on July 1, 2013 after serving on an interim basis since May 2011.
Mr. House has served in senior executive positions with us for more than 25 years and continues as Chairman of the Board.
14
Table of Contents
| A. | Philosophy and Approach |
Tim Hortons is one of the largest publicly-traded restaurant chains in North America based on market capitalization, and the largest in Canada. We strive to deliver strong results and generate value for our shareholders.
Our compensation philosophy is based on two fundamental objectives:
| 1. | align the interests of our executives with those of our shareholders (pay for performance link) |
| 2. | attract and retain key talent required for us to deliver on our strategic plan |
Aligning the Interests of Executives and Shareholders
Pay for Performance
We believe in aligning executive pay with performance. That is why our compensation programs are designed to tie a substantial majority of total executive compensation to business performance over both the short- and long-term.
In 2013, over 70% of the compensation awarded to our named executives was contingent on performance and not guaranteed. The CEO has the highest proportion of pay-at-risk, with a heavier weighting on long-term equity compensation than the other named executives. Because a significant portion of compensation is at-risk, we evaluate our compensation programs annually to confirm they do not encourage excessive risk-taking.
Say on Pay
The Board believes that shareholders should have an opportunity to formally express their views on the compensation of the named executives. Accordingly, in 2013, we held our first ‘say on pay’ advisory vote, giving shareholders an opportunity to participate every year in a non-binding advisory vote on our approach to executive compensation.
Share Ownership
We require our executives (and other senior officers) to own Tim Hortons equity to further align their interests with those of our shareholders. The Committee reviews our share ownership guidelines periodically to verify that they are in line with the market practice of Canadian retail companies and certain peer companies in Canada and the U.S.
In February 2013, we increased the share ownership requirement for the President and CEO to five times base salary (from four times). In February 2014, we increased the requirement for the Executive Vice President level to two times base salary (from one time), and officers will now have five years instead of four years from their hire or promotion date to accumulate sufficient equity to meet the guidelines. We include common shares and vested, unexercised options in the calculation. We believe that these changes better align our share ownership guidelines with the market, strengthen alignment between the interests of our executives with those of our shareholders, and foster a longer-term focus.
The table below shows the ownership requirements by officer level.
| Officer Level |
Share Ownership Guideline |
|||
| President and CEO |
5 x base salary | |||
| Other Named Executives |
3 x base salary | |||
| Executive Vice Presidents |
2 x base salary | |||
| Other Senior Executives |
1 x base salary | |||
| Vice Presidents |
$80,000 | |||
The Committee reviews compliance with the guidelines once a year, and an executive who does not comply may face disciplinary action. The guidelines do not apply to officers who are within five years of a planned retirement. Executives are not required to maintain their ownership levels after retirement.
15
Table of Contents
The table below shows the equity ownership of each named executive as at December 31, 2013. The dollar values are based on a share price of $56.75, the average price of our common shares on the TSX in 2013. As of the end of 2013, all of the named executives (except for Mr. Caira) have met the requirement. Mr. Caira became President and CEO on July 2, 2013 and has five years to meet the guidelines. Mr. House meets our share ownership guidelines for directors (see page 7 for details).
| Name |
Guideline | Value of Common Shares Held ($) |
Value of Vested Unexercised Options ($) |
Total Value ($) |
Ownership (as a multiple of base salary) |
|||||||||||||||
| Marc Caira |
5x | 0 | 0 | 0 | 0 | |||||||||||||||
| Cynthia J. Devine |
3x | 5,189,810 | 1,126,194 | 6,316,004 | 14.0 | |||||||||||||||
| David F. Clanachan |
3x | 3,279,529 | 674,741 | 3,954,270 | 8.8 | |||||||||||||||
| William A. Moir |
3x | 6,376,550 | 1,897,456 | 8,274,006 | 20.1 | |||||||||||||||
| Roland M. Walton |
3x | 4,164,784 | 2,000,996 | 6,165,780 | 15.0 | |||||||||||||||
Attracting and Retaining Talent
Our strong brand, combined with our ability to offer a total compensation package that is fair and competitive within the markets in which we compete for talent, are key elements in our ability to attract and retain key talent.
Benchmarking
The Committee uses benchmarking data as a guideline every year to confirm that our executive compensation is consistent with our compensation philosophy, and that our compensation market position and compensation mix are competitive in the marketplace in which we compete for talent.
The comparator group used as a basis to establish 2013 compensation was developed from a compensation review conducted in 2010 by Meridian Compensation Partners Inc. (formerly Hewitt Associates), the Committee’s previous independent consultant. That comparator group consisted of companies that were similar to us in size, operating scope, geographical reach and various financial considerations. Due to a lack of Canadian food and beverage companies that are similar in size of revenues and number of employees, companies from a general industry group (including retail organizations that are subsidiaries of U.S. or global companies) were added to the comparator group. Both management and the Committee reviewed the comparator group for relevance.
The table below lists the Canadian comparator group that the Committee used as its primary market reference when making compensation decisions for our named executives for the past three years:
| 2013 Canadian Compensation Comparator Group
| ||||
| Boston Pizza International Canada Bread Company Ltd. Canadian National Railway Company Canadian Tire Corporation Canfor Corporation Cara Operations Ltd. Cineplex Entertainment LP Finning International Inc. General Mills Canada Ltd. Home Depot Canada Inc.
|
Hudson’s Bay Company Loblaw Companies Limited Lowe’s Companies Canada, ULC Maple Leaf Foods Inc. McDonald’s Restaurants of Canada Ltd. Molson Coors (Canada) Ltd. PepsiCo Foods Canada Priszm Brands Income Fund Quebecor Inc. Reitmans (Canada) Limited |
Rogers Communications Corp. Rogers Cable and Wireless Inc. RONA Inc. Sears Canada Inc. Shoppers Drug Mart Corp. Starbucks Coffee Canada TELUS Corporation Wal-Mart Canada Corp. Winners Merchants International LP | ||
The Committee also reviewed U.S. companies, primarily for operational roles, in light of our expanding U.S. presence and growing need to recruit senior executive talent in North America. The results of the Canadian comparator group and the U.S. comparator group listed below were averaged together to create a blended North American group, which was used by the Committee as a secondary point of reference.
16
Table of Contents
| 2013 U.S. Compensation Comparator Group | ||||
| Abercrombie & Fitch Co. Ann Taylor, Inc. AutoZone, Inc. The Bon-Ton Stores, Inc. Brinker International, Inc. Burger King Corp. Campbell Soup Company Chipotle Mexican Grill, Inc. Chiquita Brands International, Inc. Darden Restaurants, Inc. Del Monte Foods Company |
Denny’s Corporation Dole Food Company, Inc. Dunkin’ Brands, Inc. Eddie Bauer LLC General Mills, Inc. H.J. Heinz Company The Hershey Company Hormel Foods Company Kellogg Company Krispy Kreme Doughnuts, Inc. McCormick & Company, Inc. |
McDonald’s Corporation Molson Coors Brewing Company Nestle USA OfficeMax Incorporated Panera Bread Papa John’s International Ross Stores, Inc. Sara Lee Corporation Starbucks Coffee Company Williams-Sonoma, Inc. Yum Brands, Inc. | ||
Note that the companies listed under the 2013 Canadian and the 2013 U.S. Compensation Comparator Groups were as at the time of the compensation study.
The Committee reviews the comparator group every few years and data on other peer companies from time to time as part of its analysis. Mercer (Canada) Limited (Mercer), the Committee’s current independent compensation consultant, assisted with the last review in 2012. The Committee reviewed the findings in 2012, but did not use the data as any proposed changes to executive compensation were deferred until 2013, after our corporate reorganization was complete and our new CEO was in place.
New in 2014
Beginning in 2014, we will benchmark our executive compensation against two new comparator groups developed from Mercer’s 2012 review to assess our market position and compensation mix and to measure our relative performance under the new performance share unit plan (see page 33 for details).
17
Table of Contents
| B. | Compensation Governance and Oversight |
The Committee is directly responsible for determining the compensation of our executives and making recommendations to the Board regarding CEO compensation.
Management works closely with the Committee to refine our approach to executive compensation to meet our business needs, minimize risk, align with best practices to the extent they are appropriate for our business, and serve the interests of our shareholders.
The Committee’s main duties include:
| • | overseeing and administering compensation programs for our executives |
| • | determining all compensation elements for the executives, except the President and CEO (the Board makes all final compensation decisions relating to the CEO after considering the Committee’s recommendations) |
| • | making recommendations to the Board about the short-term incentive plan, long-term equity-based plans, and other benefits, plans, policies and executive compensation practices |
| • | determining appropriate comparator groups for benchmarking compensation levels |
| • | assessing performance against established goals and objectives for the short- and long-term incentive plans |
Qualified and Experienced Committee Members
All of the members of the Committee are independent directors. They all have direct and relevant experience in executive compensation and the necessary skills and expertise to make decisions about compensation policies and practices.
Specific Skills and Experience
| Wayne C. Sales (Chair) | • director of SUPERVALU • CEO experience with major corporations in Canada (Canadian Tire Corporation) and the U.S. (SUPERVALU) • previous experience as a board chairman (SUPERVALU) and board vice-chairman (Canadian Tire Corporation)
| |
| M. Shan Atkins | • chair of the compensation committee of The Pep Boys—Manny, Moe and Jack • former member of the compensation and governance committee of Northwest Community Healthcare, and the compensation committee of Shoppers Drug Mart Corporation • holds C.A. and C.P.A. designations, has financial expertise, and senior executive and management consulting experience
| |
| Moya M. Greene | • served on the compensation committee of Purolator Inc. • CEO experience (Royal Mail (UK) and Canada Post) • human resources experience (Human Resources and Social Development, Canada)
| |
| The Hon. Frank Iacobucci | • previous experience as a board chairman (Torstar Corporation) and former chair of the salary and organization committee of Torstar Corporation • advisor to public companies and other organizations on ethics and other business matters • former Justice of the Supreme Court of Canada, esteemed lawyer and jurist and recipient of numerous awards in Canada and globally
| |
| John A. Lederer | • CEO experience (US Foods and Duane Reade) • former President of Loblaw Companies Limited • extensive senior executive experience
| |
Formal Review
The Committee reviews our executive compensation programs annually, and conducts a formal comprehensive review every two to three years.
In 2012, with the assistance of Mercer, the Committee undertook a comprehensive review of our short- and long-term incentive plans, including benchmarking and peer analysis, performance metrics and weightings and other plan features in the context of our business needs, long-term performance goals and industry practice. As part of this review, the Committee conducted a custom survey to look at the various kinds of short- and long-term incentive plans in the market.
The Committee’s final recommendations regarding changes to these plans were reviewed and approved by the Board in February 2014 (see page 33 for program changes that will be implemented in 2014 based on this review).
18
Table of Contents
Independent Advice
The Committee can seek independent advice, which is paid for by the company. Mercer has served as the Committee’s independent compensation consultant since August 2011. Mercer has provided general executive compensation advice and other advisory services, including:
| • | market data, benchmarking and analysis |
| • | independent evaluation of proposals, data and analysis prepared by senior management |
| • | advice on executive compensation principles, trends and best practices |
Mercer receives instructions from the Committee chair and consults with senior management and our human resources department, as appropriate. While Mercer provides information and advice, the Committee is ultimately responsible for its own decisions and recommendations to the Board.
The Committee assesses Mercer’s independence every year and, in 2013, determined that Mercer was fully independent from Tim Hortons and management after reviewing, among other things:
| • | other services Mercer provided to us during the year |
| • | the fees we paid to Mercer, as a percentage of its total revenues |
| • | Mercer’s policies and procedures to prevent conflicts of interest |
| • | confirmation that there is no business or personal relationship between Mercer’s representatives and Committee members or our executives |
Mercer also conducts its own internal independence assessment every year and confirmed its independence in 2013 to the Committee chair.
Pre-Approving Services
The Committee has a policy for pre-approving services to be provided by Mercer and the corresponding fees, with the objective of confirming that these services would not impair Mercer’s independence.
From time to time, Mercer also provides services to us that are not related to the executive compensation advice provided to the Committee, and the nature of these services and the fees are reviewed as part of the annual independence assessment. Marsh Canada Limited (Marsh), an affiliate of Mercer, provides insurance brokerage services to us. Total fees for those other services represent an insignificant portion of Mercer’s total revenues.
The table below shows the total fees billed by Mercer and its affiliates for services provided to us in 2013 and 2012.
| Fees |
2013 | 2012 | ||||||
| Mercer—Executive compensation-related fees |
$ | 236,762 | $ | 190,775 | ||||
| Mercer—All other fees |
$ | 213,111 | $ | 196,140 | ||||
| Marsh (an affiliate of Mercer)—Insurance broker fees |
$ | 240,738 | $ | 239,032 | ||||
|
|
|
|
|
|||||
| Total |
$ | 690,611 | $ | 625,947 | ||||
|
|
|
|
|
|||||
19
Table of Contents
Managing Compensation Risk
Every year, or as circumstances require, the Committee considers whether our executive compensation programs create or incentivize inappropriate risk-taking by management. Our performance-based incentives represent a large portion of our executive compensation programs, so it is important that these incentives do not result in our executives taking actions that may conflict with our long-term interests.
In February 2014, the Committee concluded that our compensation structure, design and process are founded on strong principles that reduce the potential for inappropriate risk-taking, that our compensation programs are designed and administered with the appropriate balance of risk and reward in relation to our overall business strategies, and that our programs do not encourage executives to take excessive risks. The Committee has also instituted several policies and practices to mitigate compensation risk and limit the possibility of excessive risk-taking by management. The Committee considered the following key elements of our compensation programs when making these determinations.
Diligent Process
We have a formal annual budget review process that incorporates compensation planning. The Committee works with the Board and management and is focused on establishing annual performance objectives that support our business planning and achievement of strategic objectives, while also avoiding the risks of short-term decision-making.
Benchmarking enables us to verify that executive compensation is consistent with our compensation philosophy and is appropriate, based on our industry. We also monitor internal pay equity to confirm a proper balance of risk and reward between officer levels. Trends in executive compensation are considered periodically as well to evaluate our programs versus our peers.
As part of our risk management program, we stress test our compensation programs as appropriate, and test program design changes against historical results to assess the impact of those changes. In 2013, we tested different performance scenarios as part of the re-design of the short-term incentive plan to verify alignment with our intended results.
Careful Plan Design
Each incentive plan is carefully structured based on our business planning, market research and analysis, and independent advice from Mercer so that the plan design and corresponding targets and objectives are relevant and appropriate. We use qualitative and quantitative performance factors to set performance thresholds and determine payouts under the short- and long-term incentive plans. Furthermore, the vesting period associated with some of our long-term incentives means that a gain in the short-term would not be immediately realizable. We also cap payouts to limit the impact of extraordinary performance or large transactions. Additionally, executives do not receive accelerated vesting of their outstanding equity compensation awards when they retire.
Share Ownership Policies
Our share ownership guidelines require executives and other senior officers to hold a pre-established amount of Tim Hortons equity during the course of their employment. The share ownership guidelines were recently increased for the President and CEO and the Executive Vice President level to strengthen the alignment between the interests of our executives with those of our shareholders, and to foster a longer-term focus.
Trading and Anti-Hedging Policies
We have an insider and window trading policy that applies to our directors, executives, employees, members of our franchisee advisory board and other restaurant owners as may be applicable from time to time, to prohibit improper trading of our securities. Under this policy, insiders are restricted from trading (or advising anyone else to trade) Tim Hortons securities outside of pre-set window periods. Further, all insiders are required to pre-clear their intention to trade with a member of our securities practice group.
We have a separate policy governing automatic trading plans, as set out under Rule 10b5-1 under the Exchange Act and applicable provisions of Canadian securities laws, which establishes safeguards and required processes for the use of automatic trading plans by our directors, executives, employees and/or restaurant owners. We also strictly prohibit our directors, executives and employees from engaging in hedging or monetizing transactions involving Tim Hortons securities, including securities granted or vested to employees under our equity compensation programs.
20
Table of Contents
Clawbacks
Since 2009, we have had a policy that allows us to recoup or “clawback” performance-based compensation if our consolidated financial statements need to be restated for any reason other than a change in accounting policy with retroactive effect. In such a case, our Board will review all performance-based compensation awarded to or earned by our senior executives (and certain other employees) for the fiscal periods materially affected by the restatement. If the Board determines that performance-based compensation was paid based on financial results that were subsequently corrected as part of a restatement, then it will seek recoupment from those who earned such compensation, regardless of intentional wrongdoing, if deemed appropriate.
Granting and Settling Equity Compensation
We have a policy that, among other things, sets out specific parameters for all grants and settlements of equity compensation awards, and hedging activities undertaken by us at the time we grant or settle the award. The policy is designed to mitigate the risk of the exercise price, settlement value or grant date value of any equity award (as well as any hedging transactions undertaken in connection with the awards) being subject to manipulation by a director, executive or other insider. The policy is intended to avoid determining equity award variables on a date when we are arguably in possession of material, undisclosed information that is not reflected in the market price of our common shares.
Use of Discretion
The Committee can use its discretion to make adjustments to minimize the positive or negative impact of extraordinary events or circumstances on corporate performance so that actual awards made to executives reflect our underlying operating performance. If warranted, the Committee also has the discretion not to award a payout. The Committee’s ability to review the amount of performance awards and the underlying factors driving the amount prior to us making the actual payment further mitigates our compensation risk.
21
Table of Contents
| C. | Decision-Making Process |
Process for Setting Executive Pay
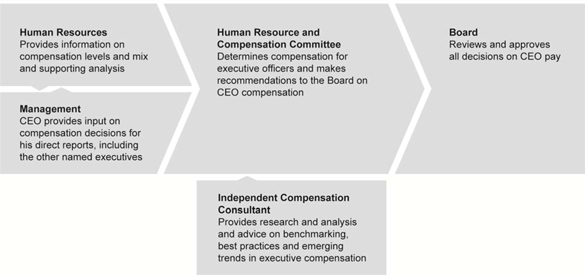
Management
The CEO typically provides insight and input to the Committee on all significant compensation decisions or recommendations that affect the named executives, other executives and Tim Hortons overall. The CEO’s input is critical in reviewing compensation for the other named executives because of his direct day-to-day involvement with them, putting him in the best position to assess their individual performance. He also shares his views on succession planning for the CEO role and positions that report directly to the CEO.
The Executive Vice-President, Human Resources and other members of senior management also analyze and provide input on compensation levels and mix, compensation policies, incentive plans and administration, tally sheets and other tools for setting compensation.
Human Resource and Compensation Committee
The Committee is responsible for benchmarking and determining executive compensation, including making recommendations to the Board with respect to CEO compensation and on material compensation matters.
| The Committee sets target compensation for the other named executives for the coming year and determines the compensation elements. It establishes performance objectives and payout curves for the short- and long-term incentive plans, reviews executive performance against annual financial and other business goals and objectives, and makes compensation recommendations to the Board for review and approval.
The Committee employs a number of tools when making compensation decisions:
• It looks at internal equity to confirm that the differences between the CEO and other named executives as a group for base salary, short-term incentive targets and long-term incentive awards are appropriate
• A tally sheet for each named executive sets out each element of target compensation for the coming year, and targeted and actual compensation received for the previous five years |
Key Elements and Tools Used in Decision Process
• Prior year performance of each named executive • Corporate performance and objectives for the previous year • Analysis from the tally sheets, internal equity review and salary increases for other employees • Goals and objectives for the coming year • Macroeconomic and operating conditions | |||
| • It also conducts an internal pay equity analysis of CEO compensation against the next highest paid officers at certain quick service restaurant peers for benchmarking purposes | ||||
22
Table of Contents
In addition to setting named executive compensation, the Committee makes decisions about other aspects of executive pay, including policy decisions, grants of incentive awards, recommendations to the Board on material changes to compensation programs or plans, and executive hires, among other things.
See the Committee’s report on page 12 for more information.
Board
The Board assesses CEO performance against his objectives and corporate performance, and reviews and approves all decisions relating to the CEO’s compensation. The Board also approves all material policy decisions on compensation plans, including short- and long-term incentive plans and executive benefits.
23
Table of Contents
| D. | Components |
Base salary, a short-term cash incentive and long-term equity-based incentives make up total direct compensation for our executives. Together with the retirement benefits we offer, they form the most significant elements of our executive compensation program and are designed to satisfy the overall objectives of the program.
The table below describes the different components and the pay-at-risk profile for 2013 compensation. We implemented some changes to the components in 2013, as described below, based on the Committee’s compensation review and our business planning. More significant changes are planned for 2014, as described beginning on page 33.
| Component | Purpose | Key Features | ||
| Base salary | • Stable source of annual income |
• Generally set at the 25th percentile in 2013, consistent with our philosophy of heavily weighting compensation towards performance-based compensation | ||
| Short-term incentive (annual cash bonus) |
• Incentive award for achieving annual performance objective(s) |
• One-year performance period • Moderate pay-at-risk profile | ||
| Long-Term Incentives | ||||
| Performance-conditioned restricted stock units (P+RSUs) | • Incentive to create value over the long-term • Attract, motivate and retain key employees |
• Award level adjusted based on company performance (one-year performance period prior to grant) • Cliff vest (30 months after grant) • Moderate/high pay-at-risk profile | ||
| Stock options with tandem stock appreciation rights (Options/SARs) |
• Reward for increases in our share price over the longer term and directly aligns with shareholder interests • Attract and motivate key employees • Meaningful retention incentive |
• Seven-year term or performance period • One-third vests each year beginning on the first anniversary of the grant • High pay-at-risk profile | ||
Pay Mix
In 2013, we have generally targeted total compensation for each named executive at the 75th percentile of our 2013 compensation comparator group based on the Committee’s analysis and our strong relative performance and growth over the past several years. A substantial portion is at-risk pay, which is variable and based on performance. The amount the named executive actually receives (if any) can be significantly different from the grant value of the award.
The graphs below show the 2013 target pay mix for the CEO and other named executives:
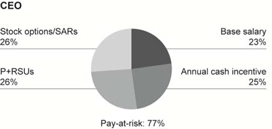
|
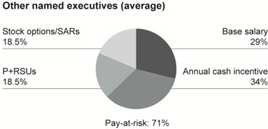
|
New in 2014
The Committee revised our target pay positioning in early 2014 to reflect two new comparator groups and better align with market practice (see page 33 for details).
24
Table of Contents
Plan Design and Performance Measures
| Short-Term Incentive
Our short-term incentive award is an annual cash bonus, and represents a substantial portion of executive compensation because of our pay for performance philosophy and the fact that our business tends to work on shorter performance cycles. The award is at-risk pay because the bonus is only paid if we achieve pre-determined performance objectives. The actual award may be above or below target, depending on the extent of achievement of the performance objective.
The Committee took a stepped approach to revising the plan in early 2013 that consisted of making incremental changes for 2013 and establishing a set of principles to guide plan changes for 2014. The Committee deemed this appropriate in light of our new organizational structure, our goal of reinforcing functional accountability among the named executives, and the CEO search that was underway at the time. |
Guiding Principles
• Plan changes will support our new organizational structure and reinforce functional and individual accountability • Business unit measures will form part of the performance metrics • Plan design will be flexible to allow top-line financial metrics and more corporate and business unit level operational or strategic objectives to be included in 2014 |
The first phase was implemented in 2013 and involved adjusting the weighting of EBIT, the performance objective we have used for many years, to support our new organizational structure and focus on business unit objectives.
Measuring Performance
The Committee retained EBIT as the only performance objective for 2013 because, at that time, the Committee considered that:
| • | EBIT is an important indicator of the financial health and performance of our business and each executive officer has the ability to make a meaningful contribution to EBIT |
| • | In 2013, EBIT was the corporate performance metric in the incentive plans for our other employees, so our collective interests were aligned to achieve the same goal. It is also a key performance measure used by other quick service restaurant companies, which allows us to compare relative performance using a similar measure |
Company performance for our named executives in 2013 was assessed on a weighted average of corporate and business unit results, to reinforce accountability for the health and growth of our Canadian and U.S. businesses. The table below shows the weightings for each named executive role.
| Named Executive |
EBIT Weightings | |||
| CEO, CFO, COO, CMO | Tim Hortons Inc. – 70% Canada – 15% U.S. – 15% |
|||
| President, Tim Hortons Canada | Tim Hortons Inc. – 70% Canada – 30% |
|||
The Committee also established target, threshold and maximum performance objectives on a payout curve. Payouts range from 50% to 150% of the target award depending on our financial performance. No award is paid if we do not achieve threshold performance.
New in 2014
The short-term incentive plan will have new performance metrics and weightings that better align with our business priorities and support our long-term strategy (see page 34 for details).
25
Table of Contents
Long-Term Incentives
Our 2013 long-term incentive awards are equity-based compensation designed to reward executives for appreciation in our share price over longer periods of time. These awards make up the largest part of the CEO’s total compensation, and represent a significant portion of total compensation for our other named executives.
Equity-based compensation is an effective way for us to achieve several goals:
| • | better align the level of compensation realized by executives with our financial and share performance |
| • | help executives build their share ownership and increasingly align the interests of our executives and shareholders |
| • | focus on executing longer-term strategic plans, which form part of our annual financial and non-financial goals and objectives |
| • | reward executives for performance that creates shareholder value |
We used two kinds of equity-based compensation awards in 2013, each representing 50% of the total dollar value of the target award:
| • | P+RSUs – the grant value is based on performance achieved over the prior year. Once granted, P+RSUs are forward-looking because they cliff vest in 30 months and are therefore effective in retaining management and motivating their performance through share price appreciation |
| • | Options/SARs – these align with shareholder interests because the value of options/SARs is directly related to our share price (they have no value if our share price does not increase) |
The Committee believes the equal mix and types of equity awarded enhance the link between pay and performance, better align the interests of executives and shareholders, and strengthen our ability to retain executive talent. This mix is also consistent with market practice among TSX 60 companies. The Committee does not take into account previous grants of P+RSUs and options/SARs when granting new awards.
| 2013 Long-Term Incentive | ||||
| Performance Conditioned Restricted Stock Units (P+RSUs) |
Options/SARs | |||
| Award |
Standard, time-vested restricted share units
Grant value is adjusted based on the prior year’s EBIT performance
The Committee sets the performance objectives for new P+RSU grants in February of the year prior to the grant, based on the same factors it considers when establishing the objectives for the short-term incentive plan |
Options represent the right to purchase a specific number of shares at a pre-determined price (exercise price) during a prescribed amount of time. The options are granted in tandem with SARs which have all the underlying terms of the options, but settle in cash as opposed to shares | ||
|
| ||||
| Vesting |
Vest after 30 months | One-third vest each year beginning on the first anniversary of the grant date Expire after seven years | ||
|
| ||||
| Dividends |
Earn dividend equivalents after grant only | Do not earn dividends | ||
|
| ||||
| Payout |
Paid out in shares immediately after vesting | The option holder can choose to receive either common shares (by exercising the option) or cash (by exercising the SAR) | ||
New in 2014
We are implementing a performance share unit (PSU) plan in 2014 to replace P+RSUs in order to focus on longer-term performance and better align with best practices and shareholder interests (see page 35 for details).
26
Table of Contents
Retirement Benefits
Our retirement plans are designed to reward executives for continued service and provide a competitive level of retirement savings. We have a defined contribution pension plan that covers all full-time employees and a personal supplemental executive retirement savings plan that covers the named executives and certain other members of senior management.
Defined Contribution Pension Plan
All of our Canadian employees, including executives, are required to participate in our Canadian defined contribution pension plan.
Participants contribute 2% of their base salary, while we contribute an amount equal to 5% of their base salary. Participants can make voluntary additional contributions, which we will match up to an additional 1% of base salary. All contributions under the plan are subject to legislated maximum limits (a combined total of $24,270 per individual for both employer and employee contributions in 2013). Pension benefits vest immediately. Employees who are no longer employed by us may withdraw the benefit amounts prior to retirement in accordance with Canadian laws and regulations governing the plan.
Personal Supplemental Executive Retirement Savings Plan (Savings Plan)
The Savings Plan is open to executives under 69 years old who are eligible to receive additional compensation under the plan.
At the end of each year, we contribute 12% of each participant’s earnings (base salary and annual cash bonus paid during the year) to the Savings Plan, less contributions we make to the defined contribution pension plan. We invest the additional compensation in permitted investments, in either a non-registered account, a tax-free savings account (TFSA) or a registered retirement savings plan (RRSP), according to the terms of the plan and each participant’s instructions. Our contribution rate is competitive with the market for these kinds of programs.
Contributions vest once a participant has completed three years of service, or earlier if they become disabled, die, are terminated after age 65 or if there is a change in control, or in certain other circumstances as otherwise determined by the Committee. Contributions accrue in notional accounts for the participants until they vest.
Executive Benefits and Perquisites
We offer limited executive benefits and perquisites as part of our total compensation package.
Perquisites include executive medical benefits, life and accidental death and dismemberment insurance premiums, a company car or car allowance, and personal use of the corporate airplane in limited circumstances. We have a strict policy that generally limits the personal use of our corporate airplane by executives and directors. There was no personal use of the corporate airplane in 2013. The value of these benefits, except for medical benefits, is included as taxable income to the executive.
The amounts reported for perquisites represent the total incremental cost of providing the benefit and not the value of the benefit to the recipient. See the Summary Compensation Table on page 37 for more information about the perquisites.
27
Table of Contents
| E. | Performance and Executive Compensation Decisions |
Base Salary
In February 2013, the Committee decided to maintain base salaries for the named executives at the same level as 2012.
| Named Executive |
2013 Base Salary ($) | |||
| Marc Caira |
910,000 | (1) | ||
| Paul D. House |
772,500 | (2) | ||
| Cynthia J. Devine |
450,000 | |||
| David F. Clanachan |
450,000 | |||
| William A. Moir |
412,000 | |||
| Roland M. Walton |
412,000 | |||
| (1) | Pro-rated based on his start date of July 2, 2013. |
| (2) | For the period January 1 to July 1, 2013. |
2013 Corporate Performance
In 2013, EBIT was the only measure for assessing performance under our short-term incentive plan and for determining long-term incentive awards. Our 2013 adjusted EBIT was 6.5% higher than 2012 after certain adjustments were made. The table below shows our 2013 adjusted EBIT performance. Adjusted EBIT is a non-GAAP measure (see Appendix A to this Item 11 for more information about our use of this non-GAAP measure, including a reconciliation to EBIT, its most directly comparable GAAP measure).
Short-Term Incentive
| 2013 Performance | ||||||||||||||||||||||||
| Adjusted EBIT (in millions) |
Below threshold (< 90%) |
Threshold / Minimum (90%) |
Target (100%) |
Maximum (110%) |
Actual | Performance Level |
||||||||||||||||||
| Tim Hortons Inc. |
< $ | 586.4 | $ | 586.4 | $ | 651.5 | $ | 716.7 | $ | 645.3 | 99.03 | % | ||||||||||||
| Short-term incentive |
No payout | 50% of target | 100% of target | 150% of target | ||||||||||||||||||||
The 2013 short-term incentive payout was also based on Canadian and U.S. business unit adjusted EBIT. Our Canadian and U.S. adjusted EBIT targets are considered confidential information, the disclosure of which would result in competitive harm to the company. We achieved 99.2% of our Canadian adjusted EBIT target. We did not hit our threshold for U.S. adjusted EBIT performance, resulting in a 0% payout factor for U.S. performance.
Use of Discretion
The Committee can use its discretion to make adjustments to actual EBIT results for comparing performance against the established performance objectives under the short-term incentive plan. For 2013, the Committee approved adjustments to EBIT to take into account the costs related to the corporate reorganization ($11.8 million) and the Cold Stone Creamery de-branding ($19.0 million). For compensation purposes, the Committee believes that adjusted EBIT represents a more accurate assessment of overall operating performance and basis for aligning executive compensation.
Based on 2013 short-term incentive plan weightings, the following is the annual bonus payment for each named executive:
| Named Executive |
Target Award ($) | Payout Factor | Actual Payout ($) | |||||||||
| Marc Caira(1) |
|
1,000,000 (500,000 for 2013 |
) |
81.1 | % | 405,500 | ||||||
| Paul D. House(2) |
1,000,000 | 81.1 | % | 811,000 | ||||||||
| Cynthia J. Devine |
500,000 | 81.1 | % | 405,500 | ||||||||
| David F. Clanachan |
500,000 | 81.1 | % | 405,500 | ||||||||
| William A. Moir |
500,000 | 81.1 | % | 405,500 | ||||||||
| Roland M. Walton |
500,000 | 95.5 | % | 477,500 | ||||||||
| (1) | Pro-rated based on his start date of July 2, 2013. |
| (2) | Mr. House was eligible to receive the short- and long-term incentive awards that were approved by the Board in February 2013 for the period he was CEO (January 1 to July 1, 2013) and for the six-month transition period ending December 31, 2013. |
28
Table of Contents
Long-Term Incentive
The table below shows the P+RSU awards granted to the named executives in May 2013, as well as the PSU awards that will be granted in May 2014. As a result of the transition in 2014 from a P+RSU plan to a PSU plan based on company performance over the next three years (see page 35 for details), an award of at least 95% of the 2014 PSUs granted will be guaranteed upon vesting.
Mr. Caira was granted a Restricted Share Unit (RSU) award of $1,000,000 in August 2013.
| P+RSU Target Award ($) |
P+RSU Payout Factor |
P+RSUs Awarded in May 2013(1)($) |
PSUs to be Awarded in May 2014 (Target)(2)($) |
|||||||||||||
| Marc Caira |
n/a | n/a | n/a | 1,000,000 | ||||||||||||
| Paul D. House |
1,000,000 | 93.1 | % | 931,000 | n/a | |||||||||||
| Cynthia J. Devine |
300,000 | 93.1 | % | 279,300 | 300,000 | |||||||||||
| David F. Clanachan |
300,000 | 93.1 | % | 279,300 | 300,000 | |||||||||||
| William A. Moir |
250,000 | 93.1 | % | 232,750 | 250,000 | |||||||||||
| Roland M. Walton |
250,000 | 93.1 | % | 232,750 | 250,000 | |||||||||||
| (1) | The P+RSU awards in May 2013 were impacted by 2012 adjusted EBIT performance. |
| (2) | The ultimate value realized will be based on our performance against the established metrics and fluctuations in share price through the performance period, but the number of units vesting will not be below 95% of units granted due to the transition from P+RSUs. |
Options/SARs
The table below shows the option/SAR awards granted to the named executives in May 2013, as well as the option/SAR awards that will be granted in May 2014.
In May 2013, Mr. House received an award of RSUs in lieu of options/SARs. Mr. Caira received a grant of $1,500,000 of options/SARs in August 2013, which included the 2013 annual award and a $500,000 welcome (sign-on) grant.
| Option/SAR Grants |
Awarded in 2013 ($) | To be Awarded in May 2014 ($) |
||||||
| Marc Caira |
1,500,000 | 1,000,000 | ||||||
| Paul D. House |
1,000,000 (RSUs | ) | n/a | |||||
| Cynthia J. Devine |
300,000 | 300,000 | ||||||
| David F. Clanachan |
300,000 | 300,000 | ||||||
| William A. Moir |
250,000 | 250,000 | ||||||
| Roland M. Walton |
250,000 | 250,000 | ||||||
The number of options/SARs received is determined by dividing the dollar value of the award by the value of options, based on the closing price of our common shares on the TSX on the trading day immediately preceding the grant date, calculated using the Black-Scholes valuation method. See the notes to the Summary Compensation Table on page 37 for more information.
29
Table of Contents
| F. | Share Performance and Pay for Performance Alignment |
The change in value of our shares is an important indicator of our performance in both absolute terms and relative to our competitors.
The graph below compares our total shareholder return (TSR) on the TSX and NYSE for the past five years, assuming an initial investment of $100 and reinvestment of dividends, compared to the total return of the S&P/TSX Composite Index, S&P/TSX Consumer Discretionary Index and the S&P 500. Tim Hortons has been part of the S&P/TSX Composite Index and the S&P/TSX Consumer Discretionary Index since September 29, 2006.
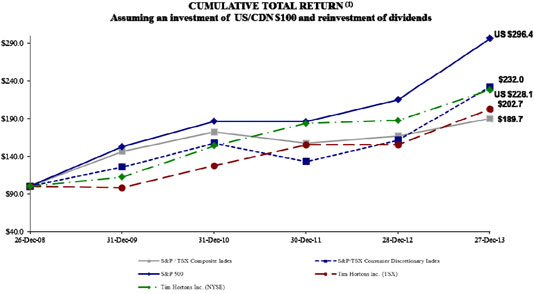
| 26-Dec-08 | 31-Dec-09 | 31-Dec-10 | 30-Dec-11 | 28-Dec-12 | 27-Dec-13 | |||||||||||||||||||
| S&P/TSX Composite Index (Cdn.$)(2) |
$ | 100.0 | $ | 146.3 | $ | 172.0 | $ | 157.1 | $ | 166.8 | $ | 189.7 | ||||||||||||
| S&P/TSX Consumer Discretionary Index (Cdn.$)(2) |
$ | 100.0 | $ | 125.4 | $ | 157.4 | $ | 133.1 | $ | 161.4 | $ | 232.0 | ||||||||||||
| S&P 500 (U.S.$) |
$ | 100.0 | $ | 152.6 | $ | 186.1 | $ | 185.9 | $ | 214.8 | $ | 296.4 | ||||||||||||
| Tim Hortons Inc. (TSX) |
$ | 100.0 | $ | 98.1 | $ | 127.3 | $ | 155.1 | $ | 155.0 | $ | 202.7 | ||||||||||||
| Tim Hortons Inc. (NYSE) |
$ | 100.0 | $ | 112.3 | $ | 153.8 | $ | 183.4 | $ | 187.4 | $ | 228.1 | ||||||||||||
| (1) | Cumulative Total Return |
The majority of our operations, income, revenues, expenses and cash flows are in Canadian dollars, and we report our financial results in Canadian dollars. Investors, analysts and others may translate our Canadian dollar earnings into U.S. dollars. Fluctuations in the foreign exchange rates between the two currencies can affect our share price. See Risk Factors in Part 1A of our Form 10-K for the fiscal year ended December 29, 2013, filed with the SEC on February 25, 2014, as amended by our Form 10-K/A to be filed on or about March 21, 2014.
| (2) | The table below shows the fluctuations in the Canadian dollar share price relative to the U.S. dollar share price over this period. These fluctuations have impacted TSR and are not directly attributable to changes in our underlying business or financial condition. |
| 2008 | 2009 | 2010 | 2011 | 2012 | 2013 | |||||||||||||||||||
| F/X change, Cdn$ compared to US$ |
-23 | % | +13 | % | +5 | % | -2 | % | +2 | % | -7 | % | ||||||||||||
Important Note
You should not consider the information in this section as “filed” for purposes of Section 18 of the Exchange Act, or incorporated by reference in any filing we make under the Securities Act or the Exchange Act before or after the date of this circular.
30
Table of Contents
Aligning Executive Pay with TSR Performance
As outlined in the graph above, our cumulative TSR on the TSX has increased 102.7% over the last five fiscal years. During this period, aggregate named executive compensation as reflected in the Summary Compensation Table has been in the range of $10.3 million to $12.0 million. Although this range has been impacted by changes to our named executives over this period, actual payouts under the performance-based compensation plans were aligned with changes in TSR in all years except 2013.
This alignment is demonstrated in the graph below that compares the trend between our annual TSR and the impact of company performance on payouts under our performance-based compensation plans (i.e., short-term incentive plan and P+RSU plan). In 2010 and 2011, our financial performance was strong, which was reflected in the company’s TSR and through our performance-based awards being above target during these years. In 2012, our pay for performance philosophy was again demonstrated as we fell short of meeting our performance objectives which resulted in performance-based awards being below target and a drop in TSR in that year. In 2013, our TSR increased, however we fell short on our key performance objective of adjusted EBIT and therefore performance-based awards were below target for our named executives.
The Committee believes the impact that company performance has on compensation is effective in supporting the total investment return to shareholders.
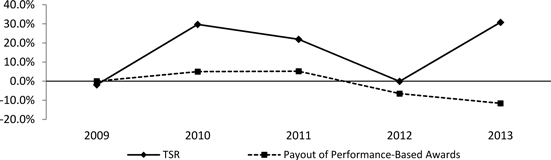
| 2009 | 2010 | 2011 | 2012 | 2013 | ||||||||||||||||
| Total Shareholder Return (TSR) (1) |
-1.9 | % | +29.8 | % | +21.8 | % | -0.1 | % | +30.8 | % | ||||||||||
| Payout of Performance-Based Awards (2) |
0.0 | % | +5.0 | % | +5.2 | % | -6.5 | % | -10.5 | % | ||||||||||
| (1) | Total Shareholder Return (TSR) |
The annual percentage return on Tim Hortons shares traded on the TSX from December 31, 2008 to December 31, 2013, including the reinvestment of dividends.
| (2) | Payout of Performance-Based Awards |
The impact that our performance had each year on target payouts under the short-term incentive and P+RSU plans. For example, in 2010, our short-term and P+RSU plans paid out at 5% above target level. For 2013, we have included actual payouts under our short-term incentive plan, and PSUs at target level as we transition from P+RSUs to PSUs.
The majority of our performance-based compensation during this period was based on our operating income, or EBIT performance. As such, we have also provided below a comparison of aggregate named executive compensation to our EBIT performance.
Aligning Executive Pay with Operating Income (EBIT) Performance
The table below compares total annual compensation paid to our named executives from 2009 to 2013 to actual EBIT as reported in our Form 10-K.
| (in millions) |
2009 | 2010 | 2011 | 2012 | 2013 | |||||||||||||||
| Reported EBIT(1) |
$ | 525.6 | $ | 872.2 | $ | 569.5 | $ | 594.5 | $ | 621.1 | ||||||||||
| Total compensation awarded to the named executives(2) |
$ | 10.6 | $ | 10.8 | $ | 12.0 | $ | 10.3 | $ | 11.5 | ||||||||||
| Named executive compensation as a % of EBIT |
2.0 | % | 1.2 | % | 2.1 | % | 1.7 | % | 1.9 | % | ||||||||||
| (1) | Reported EBIT is our operating income or EBIT as reported in our Form 10-K for the fiscal year ended December 29, 2013, under Item 6. Selected Financial Data. |
31
Table of Contents
Our 2010 EBIT and named executive compensation as a percentage of EBIT reflect the gain on the sale of our 50% joint venture interest in Maidstone Bakeries, and other significant events that occurred in 2010. Eliminating the impact of these events on 2010 EBIT, named executive compensation as a percentage of EBIT would have been 2.0%.
| (2) | Total compensation awarded to the named executives applies to the named executives for each applicable year and includes base salary, short-term (annual cash) incentive, and the grant value of equity awards and other compensation (excluding severance), as reported in the Summary Compensation Table for the applicable years. |
Although our named executives have changed over this period, compensation has remained relatively stable while reported EBIT has steadily increased. The increase in EBIT in fiscal 2010 reflects the impact of the gain on the sale of our 50% joint venture interest in Maidstone Bakeries, which was not included when determining compensation for the named executives. Reported EBIT increased 4.5% in 2013 and 18.2% over the past five years, while compensation as a percentage of EBIT has remained relatively flat at approximately 2%.
We believe that these results, coupled with the analysis discussed above with respect to TSR, support our conclusion that EBIT as a performance objective was effective in delivering compensation to our named executives over time in a manner consistent with our pay for performance philosophy and in a manner that represents alignment with long-term shareholder value.
32
Table of Contents
| G. | 2014 Program Changes and Compensation Decisions |
The Committee implemented a number of changes to executive compensation for 2014 to support the implementation of our new organizational structure and better align our compensation programs with our business priorities and long-term strategic plan. The changes made were based on additional research and analysis following the 2012 compensation review, and input from our new President and CEO.
The changes, which focus on the following main areas, have been reviewed and approved by the Committee and the Board.
| Comparator Groups
Beginning in 2014, we will benchmark executive compensation against two new comparator groups developed from the 2012 review to assess our market position and compensation mix, and to measure our relative performance under the new PSU plan.
The new comparator groups were established as a means of confirming that our compensation is competitive relative to the North American quick-service retail food industry and Canadian general industry companies similar to us (i.e., size and scope) that we compete with for executive talent, guests and capital.
Companies were selected based on four key selection criteria (described in the box to the right) and were reviewed by management and the Committee to confirm appropriateness. |
Comparator Companies – Key Selection Criteria
• North American focus and Canadian context – companies that we compete with for executive talent and serve to confirm that our overall program design and compensation levels are appropriate
• Similar economics – companies that generally share the same business size and scope
• Robust group of companies – allows matching of functional expertise based on comparable size and scope
• Large, stable base of organizations – provides consistency from year to year and permits benchmarking of appropriate compensation and internal equity for specific roles |
2014 Compensation Comparator Groups
| Canadian comparator group of general industry companies | ||||
|
29 publicly-traded, general industry companies of comparable size, based on systemwide revenues(1) (excluding resource and financial services organizations) | ||||
| Air Canada Atco Ltd. CGI (Group) Inc. CN Rail Canadian Pacific Railway Canadian Tire Corp. Cascades Inc. Catamaran Corp. Celestica Domtar Corp. |
Finning International Fortis Inc. Maple Leaf Foods Inc. METRO Inc. Molson Coors Cda Inc. Potash Corp. Quebecor Inc. Resolute Forest Products RONA Inc. SNC-Lavalin Corp. |
Saputo Inc. Saskatchewan Wheat Pool Sears Canada Shaw Communications Shoppers Drug Mart Superior Plus Income Fund TELUS Corp. Transat AT Inc. WestJet Airlines Ltd. | ||
| North American comparator group of quick service restaurants | ||||
|
19 publicly-traded companies comparable in size, based on systemwide revenues(1) | ||||
| Bob Evans Farms Brinker Intl Inc. Burger King Worldwide Inc. CBRL Group Inc. Cheesecake Factory Inc. Chipotle Mexican Grill Inc. Darden Restaurants |
Dinequity Inc. Domino’s Pizza Inc. Dunkin’ Brands Group Inc. Jack in the Box Inc. McDonald’s Corp. Panera Bread Co. Papa Johns International Inc. |
Ruby Tuesday Inc. Starbucks Corp. Texas Roadhouse Inc. Wendy’s Co. Yum Brands Inc. | ||
| (1) | Companies are listed as at the time of the compensation study. |
Compensation Philosophy and Target Pay Positioning
We have reviewed our compensation philosophy and determined that our two fundamental objectives of (i) aligning management interests with shareholders and (ii) attracting and retaining key talent, remain appropriate to support our long-term strategy.
With respect to establishing base salary and total direct compensation for our executive officers, beginning in 2014, the median (50th percentile) of our comparator groups will provide guidance to the Committee in establishing the appropriate target compensation for each role, with actual pay positioning based on company performance and the executive’s responsibilities, experience, contributions and other considerations. This will align our pay positioning more closely with market practice and support our compensation philosophy objective of attracting and retaining key talent. The impact of this on executive compensation for 2014 is outlined under 2014 Compensation Decisions.
33
Table of Contents
| Short-Term Incentive Plan
We are introducing several changes to the short-term incentive plan in 2014 to link compensation to a greater degree with the way we manage our business and to provide a direct alignment with business priorities.
For 2014, performance objectives under the plan are based on corporate performance, business unit performance and achievement by the executive officer of individual strategic objectives set annually by the CEO. |
Benefits of the New Plan Design
• Measures core objectives that align company, restaurant owner and shareholder interests • Drives the executive group to focus on delivering sustainable top and bottom line performance • Reinforces accountability at functional (corporate centre/business unit) and individual levels • Promotes collaboration and support among corporate and business unit roles • Strengthens our ability to focus on strategic priorities at the individual and team level • Aligns with market practice |
Core Metrics
Corporate and business unit performance will be based on the following core metrics:
| Net Income Attributable to Tim Hortons Inc. |
• measures overall profitability, an important indicator of company performance • focuses the full executive group who have direct accountability for bottom line financial results • directly links to shareholder interests | |
| Business Unit Operating Income (Canada, U.S.) | • provides line of sight to bottom line financial results • reflects the financial health and performance of our business units • key performance measure used by other quick service restaurant companies | |
| Same-Store Sales Growth | • important measure underlying operational growth and health, driving overall company performance • important measure for restaurant owners and restaurant performance | |
The table below outlines the new metrics and weightings for each named executive role. Individual strategic objectives in 2014 will focus on key priorities for the year and directly align to our strategic plan.
| Executive Officer |
Net Income Attributable to Tim Hortons Inc. |
Business Unit Operating Income(1) |
Same-Store Sales Growth(2) |
Strategic (Individual) Objectives | ||||
| CEO CFO CMO |
60% | 0% | 30% | 10% | ||||
| COO |
20% | 40% | 30% | 10% | ||||
| President, Tim Hortons Canada |
20% | 40% | 30% | 10% |
| (1) | Specific to the business unit and in local currency to avoid the impact of foreign exchange risk. For the COO, business unit operating income is split 80% Canada and 20% U.S. to increase the focus on our U.S. business and for the President, Tim Hortons Canada, business unit operating income is for Canada only. |
| (2) | For all roles except the President, Tim Hortons Canada, same-store sales growth is split 80% Canada and 20% U.S. to increase the focus on our U.S. business, and promote collaboration and support among corporate and business unit goals. For the President, Tim Hortons Canada, same-store sales growth is for Canada only. |
For Net Income attributable to Tim Hortons Inc., we have established a performance range of 90% to 105% of target and a payout range from 50% to 175%, with performance below 90% resulting in a 0% payout factor for that metric. For all other metrics, the Committee will continue to establish target, threshold and maximum performance levels every year based on business expectations and market conditions. Threshold performance will pay at 50% of target and maximum performance at 175% of target. The Committee also did stress testing and back testing to confirm that the plan re-design is structured appropriately to address different performance scenarios.
34
Table of Contents
Long-Term Incentive Plan
New PSU Plan
We are implementing a performance share unit (PSU) plan in 2014 to drive longer-term performance and enhanced alignment with market best practices and shareholder interests. Our PSU plan will replace our P+RSU plan in May 2014 and will represent 50% of the long-term incentive award granted to executive officers. Options/SARs will continue to make up the remaining 50%.
The PSU plan will be based on two key performance metrics:
Return on Assets (ROA) (75% weighting)
Return on assets is a meaningful metric that allows for a direct focus on the management of our assets. ROA is defined as Net Operating Profit after Tax divided by Average Total Assets (total assets excludes the effect of foreign exchange by using a budgeted exchange rate).
Relative TSR (25% weighting)
Our TSR (share price appreciation plus reinvested dividends) compared to the TSR of our two new compensation comparator groups:
| • | North American group (quick service restaurants) (60% weighting) |
| • | Canadian group (general industry companies) (40% weighting) |
The following outlines the payout at specified performance factors:
| Payout(1) |
ROA Performance |
Relative TSR Performance | ||||
| 175 | % | Maximum (and above) | 75th percentile and above | |||
| 100 | % | Target | 50th percentile | |||
| 50 | % | Threshold (minimum) | 25th percentile | |||
| 0 | % | Below threshold | Below 25th percentile | |||
| (1) | Performance results in between the specified performance levels will result in payouts based on a straight line scale. |
We believe using both an internal return metric and relative TSR balances the focus on overall company performance, market conditions and shareholder return. It also clearly differentiates the long-term incentive plan from the short-term incentive plan.
The vesting and actual award of shares under the PSU plan will occur at the end of the three-year performance period based on performance against pre-established annual ROA targets and our relative TSR over a three-year period. Regardless of actual ROA and TSR performance on a consolidated basis, a minimum of 50% of the PSUs will vest in order to support an element of retention within our long-term incentive plan. For the 2014 grant only, we will guarantee that a minimum of 95% of PSUs will vest due to the transition from the former P+RSU plan, for which the performance objective was pre-determined in February 2013.
2014 Compensation Decisions
Based on the market data results from the 2012 compensation review and the changes to target compensation positioning (to 50th percentile of new comparator groups versus 75th percentile of former comparator groups), no significant changes were made to total direct compensation for each named executive as the results of the review indicated that the 50th percentile of the new comparator groups was generally in line with the 75th percentile of the former comparator groups. However, it was determined that a shift from short-term incentive compensation to base salary over a two-year period was necessary to properly align the compensation pay mix with our new target compensation positioning. The median of our comparator groups will also provide guidance to the Committee in establishing the appropriate compensation mix of total direct compensation. In February 2015, we will review compensation for each named executive and may make any necessary adjustments as required to better align with our new target compensation positioning.
35
Table of Contents
The following table outlines 2014 target compensation for each named executive, including the shift from the short-term incentive plan to base salary. Where applicable, the base salary adjustments include increases which are aligned with our annual base salary increase for employees generally.
| Base Salary | Short-Term Incentive Plan | Long-Term Incentive Plan | Total Direct Compensation | |||||||||||||||||||||||||||||||||||||||||||||
| Named Executive |
2013 | 2014 | % Chg | 2013 | 2014 | % Chg | 2013 | 2014 | % Chg | 2013 | 2014 | % Chg | ||||||||||||||||||||||||||||||||||||
| Marc Caira |
$ | 910,000 | $ | 910,000 | 0 | % | $ | 1,000,000 | $ | 1,000,000 | 0 | % | $ | 2,000,000 | $ | 2,000,000 | 0 | % | $ | 3,910,000 | $ | 3,910,000 | 0 | % | ||||||||||||||||||||||||
| Cynthia J. Devine |
$ | 450,000 | $ | 485,000 | 7.8 | % | $ | 500,000 | $ | 475,000 | -5 | % | $ | 600,000 | $ | 600,000 | 0 | % | $ | 1,550,000 | $ | 1,560,000 | 0.6 | % | ||||||||||||||||||||||||
| David F. Clanachan |
$ | 450,000 | $ | 485,000 | 7.8 | % | $ | 500,000 | $ | 475,000 | -5 | % | $ | 600,000 | $ | 600,000 | 0 | % | $ | 1,550,000 | $ | 1,560,000 | 0.6 | % | ||||||||||||||||||||||||
| William A. Moir(1) |
$ | 412,000 | $ | 412,000 | 0 | % | $ | 500,000 | $ | 500,000 | 0 | % | $ | 500,000 | $ | 500,000 | 0 | % | $ | 1,412,000 | $ | 1,412,000 | 0 | % | ||||||||||||||||||||||||
| Roland M. Walton |
$ | 412,000 | $ | 445,000 | 8.0 | % | $ | 500,000 | $ | 475,000 | -5 | % | $ | 500,000 | $ | 500,000 | 0 | % | $ | 1,412,000 | $ | 1,420,000 | 0.6 | % | ||||||||||||||||||||||||
| (1) | There is no change to Mr. Moir’s compensation. Please see page 47 for details regarding his employment agreement. |
36
Table of Contents
2013 Compensation Details
Summary Compensation Table
The table below outlines the compensation we paid or awarded to each named executive for the past three fiscal years.
| Name and Principal Position |
Year | Salary(1) ($) |
Share- Based Awards(2) ($) |
Option Based Awards(3) ($) |
Non-Equity Incentive Plan Compensation ($) |
Pension Value(5) ($) |
All
Other Compensation(6) ($) |
Total Compensation ($) |
||||||||||||||||||||||||||||
| Annual Incentive Plans(4) ($) |
Long- Term Incentive Plans |
|||||||||||||||||||||||||||||||||||
| Marc Caira President and CEO |
2013 | 451,494 | 1,000,000 | 1,500,000 | 405,500 | 0 | 17,336 | 59,730 | 3,434,060 | |||||||||||||||||||||||||||
| Paul D. House Executive Chairman, President and CEO |
2013 | 775,215 | 1,000,000 | 0 | 811,000 | 0 | 17,336 | 364,311 | 2,967,862 | |||||||||||||||||||||||||||
| 2012 | 769,027 | 1,931,000 | 0 | 938,000 | 0 | 17,014 | 266,032 | 3,921,073 | ||||||||||||||||||||||||||||
| 2011 | 583,069 | 2,900,000 | 0 | 645,107 | 0 | 16,407 | 153,595 | 4,298,178 | ||||||||||||||||||||||||||||
| Cynthia J. Devine Chief Financial Officer |
2013 | 449,992 | 0 | 300,000 | 405,500 | 0 | 17,336 | 133,209 | 1,306,037 | |||||||||||||||||||||||||||
| 2012 | 425,055 | 279,300 | 300,000 | 469,000 | 0 | 17,014 | 132,508 | 1,622,877 | ||||||||||||||||||||||||||||
| 2011 | 397,393 | 315,000 | 300,000 | 526,500 | 0 | 16,407 | 126,724 | 1,682,024 | ||||||||||||||||||||||||||||
| David F. Clanachan Chief Operating Officer |
2013 | 449,992 | 0 | 300,000 | 405,500 | 0 | 17,336 | 143,685 | 1,316,513 | |||||||||||||||||||||||||||
| 2012 | 425,055 | 329,300 | 300,000 | 469,000 | 0 | 17,014 | 150,748 | 1,691,117 | ||||||||||||||||||||||||||||
| 2011 | 397,393 | 262,500 | 250,000 | 526,500 | 0 | 16,407 | 137,303 | 1,590,103 | ||||||||||||||||||||||||||||
| William A. Moir Chief Brand and Marketing Officer |
2013 | 411,993 | 0 | 250,000 | 405,500 | 0 | 17,336 | 126,487 | 1,211,316 | |||||||||||||||||||||||||||
| 2012 | 410,147 | 232,750 | 250,000 | 469,000 | 0 | 17,014 | 154,462 | 1,533,373 | ||||||||||||||||||||||||||||
| 2011 | 397,393 | 262,500 | 250,000 | 526,500 | 0 | 16,407 | 123,401 | 1,576,201 | ||||||||||||||||||||||||||||
| Roland M. Walton President, Tim Hortons Canada |
2013 | 411,993 | 0 | 250,000 | 477,500 | 0 | 17,336 | 124,015 | 1,280,844 | |||||||||||||||||||||||||||
| 2012 | 410,147 | 232,750 | 250,000 | 469,000 | 0 | 17,014 | 132,311 | 1,511,222 | ||||||||||||||||||||||||||||
| 2011 | 397,393 | 262,500 | 250,000 | 526,500 | 0 | 16,407 | 128,548 | 1,581,348 | ||||||||||||||||||||||||||||
| (1) | Salary for Mr. Caira is pro-rated based on his start date of July 2, 2013. Salary for Mr. House includes $389,215 for compensation as President and CEO for the period from January 1 to July 1, 2013, $236,000 as compensation for transitional services, and a Chairman retainer of $150,000 for the period commencing July 2, 2013 to December 31, 2013. |
| (2) | Share-Based Awards are the grant value of P+RSUs and RSUs based on the closing price of our common shares on the TSX on the trading day immediately preceding the grant date. In August 2013, Mr. Caira received an RSU award of $1,000,000 pursuant to his offer of employment. Historically, P+RSUs were reported in respect of the company’s performance for the fiscal year, but were actually awarded to the named executive in the following year and in respect of that year of service. For example, P+RSUs awarded in May 2013 were reported in the 2012 fiscal year as they were based on 2012 company performance but were awarded in respect of the employee’s service in 2013. In 2014, we are transitioning from a P+RSU award to a PSU award, and as such awards will no longer be based upon the company’s performance in the prior fiscal year; rather, PSUs awarded in May 2014 will be reported in the 2014 fiscal year and will be awarded in respect of that year of service. |
| (3) | Option-Based Awards are the grant value of options/SARs. Mr. Caira received an option/SAR award in August 2013 pursuant to his offer of employment. |
Amounts are the grant date fair value of options/SARs. For compensation purposes, we used the Black-Scholes valuation methodology to determine the number of options/SARs to grant based on the following variables:
| August 2013 (Off-cycle) |
May 2013 | August 2012 (Off-cycle) |
May 2012 | August 2011 (Off-cycle) |
May 2011 | |||||||||||||||||||
| Maturity date (term) |
7 years | 7 years | 7 years | 7 years | 7 years | 7 years | ||||||||||||||||||
| Risk-free interest rate |
2.17 | % | 1.66 | % | 1.57 | % | 1.65 | % | 2.50 | % | 2.82 | % | ||||||||||||
| Expected dividends |
1.90 | % | 2.00 | % | 1.70 | % | 1.70 | % | $ | 0.68 | $ | 0.68 | ||||||||||||
| Share price volatility |
20.6 | % | 21.3 | % | 21.5 | % | 21.6 | % | 23.25 | % | 25.67 | % | ||||||||||||
| Black-Scholes value |
$ | 11.92 | $ | 10.37 | $ | 9.85 | $ | 10.88 | $ | 10.06 | $ | 11.23 | ||||||||||||
| Exercise price |
$ | 61.31 | $ | 56.12 | $ | 50.24 | $ | 54.95 | $ | 45.84 | $ | 45.76 | ||||||||||||
To determine the number of options/SARs, we reduce the intended compensation value (the numerator) by a factor that reflects the impact of vesting and other plan design features that are considered in the calculation of the Black-Scholes value (the denominator). The Committee chose the Black-Scholes methodology because it is a long-standing and common valuation methodology used by public companies and, therefore, facilitates comparisons for benchmarking purposes.
| (4) | Annual Incentive Plans represent the annual cash incentive awarded to each named executive. The amount awarded to Mr. Caira for 2013 was prorated for the time he served as President and CEO. Mr. House was entitled to a short-term incentive award for all of 2013. |
| (5) | Pension Value represents employer contributions to the defined contribution pension plan. No above-market or preferential earnings on non-qualified deferred contribution pension plans were paid or credited in 2013, 2012 or 2011. |
| (6) | All Other Compensation includes the items listed in the table below. All of these items are treated as taxable benefits to the named executive, except for the executive medical benefit. |
37
Table of Contents
| Year | Company Car ($) |
Life Insurance Coverage ($) |
Executive Medical ($) |
Contributions to Savings Plan ($) |
Service Awards ($) |
Dividend Equivalents on RSUs/ P+RSUs ($) |
Other ($) | Total ($) | ||||||||||||||||||||||||||||
| Marc Caira |
2013 | 11,934 | 857 | 1,595 | 36,844 | 0 | 8,501 | 0 | 59,730 | |||||||||||||||||||||||||||
| Paul D. House |
2013 | 13,914 | 1,199 | 1,595 | 0 | 0 | 97,113 | 250,490 | 364,311 | |||||||||||||||||||||||||||
| 2012 | 18,582 | 1,697 | 1,595 | 0 | 0 | 60,131 | 184,027 | 266,032 | ||||||||||||||||||||||||||||
| 2011 | 20,405 | 1,215 | 0 | 0 | 0 | 5,669 | 126,306 | 153,595 | ||||||||||||||||||||||||||||
| Cynthia J. Devine |
2013 | 20,903 | 2,244 | 1,595 | 92,943 | 0 | 15,524 | 0 | 133,209 | |||||||||||||||||||||||||||
| 2012 | 19,409 | 2,618 | 0 | 97,172 | 0 | 13,309 | 0 | 132,508 | ||||||||||||||||||||||||||||
| 2011 | 20,356 | 2,657 | 1,595 | 94,280 | 0 | 7,836 | 0 | 126,724 | ||||||||||||||||||||||||||||
| David F. Clanachan |
2013 | 18,758 | 2,244 | 2,048 | 92,943 | 0 | 14,638 | 13,053 | 143,685 | |||||||||||||||||||||||||||
| 2012 | 22,139 | 2,618 | 0 | 97,172 | 2,931 | 12,143 | 13,745 | 150,748 | ||||||||||||||||||||||||||||
| 2011 | 19,376 | 2,657 | 0 | 94,280 | 0 | 7,249 | 13,741 | 137,303 | ||||||||||||||||||||||||||||
| William A. Moir |
2013 | 18,314 | 2,244 | 1,595 | 88,384 | 3,018 | 12,932 | 0 | 126,487 | |||||||||||||||||||||||||||
| 2012 | 18,122 | 2,618 | 1,928 | 95,383 | 0 | 11,720 | 24,691 | 154,462 | ||||||||||||||||||||||||||||
| 2011 | 17,458 | 2,657 | 1,928 | 94,280 | 0 | 7,078 | 0 | 123,401 | ||||||||||||||||||||||||||||
| Roland M. Walton |
2013 | 18,856 | 2,244 | 1,595 | 88,384 | 0 | 12,937 | 0 | 124,015 | |||||||||||||||||||||||||||
| 2012 | 18,289 | 2,618 | 2,380 | 95,383 | 1,916 | 11,725 | 0 | 132,311 | ||||||||||||||||||||||||||||
| 2011 | 22,434 | 2,657 | 1,928 | 94,280 | 0 | 7,249 | 0 | 128,548 | ||||||||||||||||||||||||||||
The values for the company car were determined based on total incremental costs of the lease payments, gas costs, insurance, and maintenance costs for the vehicle. Executive medical costs are the actual costs of executive medical assessments paid for by us. Dividend Equivalents on RSUs/P+RSUs represent the value on the dividend payment date of dividend equivalents on unvested RSUs/P+RSUs. Amounts in the Other column for 2013 include:
| • | Mr. House: a cash payment of $187,928 in lieu of a company contribution to the Savings Plan; transportation costs of $23,846 (including taxes; this amount reflects allocated costs of the employee who provided executive and other transportation services for us and the variable costs associated with the company vehicle); company retirement gifts valued at $29,116 (including taxes); and $9,600 as car allowance. |
| • | Mr. Clanachan: $13,053 (including taxes) for tax preparation as Mr. Clanachan is required to work in the U.S. and must file U.S. tax returns. |
Additional Notes to the Summary Compensation Table
Accounting treatment of P+RSUs
P+RSUs are expensed over a shorter period if the participant is eligible for retirement. We determine the accounting expense by spreading the compensation award value in the Summary Compensation Table equally over the number of months in the period starting from the date the performance target is set for a particular award (March) through either the grant date (May of the following year) for participants who are eligible for retirement (a total of 15 months), or the end of the 30-month vesting period for those who are not eligible for retirement (a total of 45 months).
We do not have accelerated vesting of awards on retirement; however, the accounting rules require P+RSUs be fully expensed on the grant date for retirement-eligible participants because they have satisfied all performance conditions and are subject only to time vesting restrictions.
Accounting treatment of options/SARs
The grant date fair value determined for compensation purposes will differ from the accounting fair value disclosed in our financial statements. This is mainly because the option/SAR grants use a shorter maturity date or term for accounting purposes, and this also affects variables such as the risk-free interest rate and share price volatility for accounting purposes.
We determine the compensation expense associated with options/SARs based on different Black-Scholes values for retirement-eligible and non-retirement-eligible participants due to the much shorter term for retirement-eligible participants and the resulting impact on the Black-Scholes value.
The table below shows the Black-Scholes values used to calculate the grant date accounting value for grants of options with tandem SARs, and the accounting values of the total option/SAR awards granted to the named executives:
Black-Scholes Grant Date Accounting Values
| Named executives who are eligible for retirement |
Named executives who are not eligible for retirement |
Off-cycle grants | ||||||||
| 2013 | $ | 5.84 | $ | 7.20 | $7.43 – August grant for Mr. Caira | |||||
| 2012 | $ | 7.60 | $ | 9.37 | $8.21 – additional August grant for Mr. Clanachan | |||||
| 2011 | $ | 7.62 | $ | 8.87 | $6.21 – additional August grant for Mr. Moir | |||||
| Total Accounting Values of the Option/SAR Awards Granted to the Named Executives | ||||||||||
| 2013 | $ | 133,859 | $ | 1,450,095 | ||||||
| 2012 | $ | 166,037 | $ | 694,686 | ||||||
| 2011 | $ | 803,910 | $ | 600,774 | ||||||
38
Table of Contents
Incentive Plan Awards
Outstanding Share-Based Awards and Option-Based Awards
The table below lists all option-based or share-based awards made to the named executives that are outstanding as of December 29, 2013.
| Option-Based Awards | Share-Based Awards(6) | |||||||||||||||||||||||||
| Named Executive |
Grant Date | Number of Securities Underlying Unexercised Options(1) (#) |
Option Exercise Price(2) ($) |
Option Expiration Date |
Value of Unexercised In-The-Money Options(3) ($) |
Number of Shares or Units of Shares That Have Not Vested(4) (#) |
Market or Payout Value of Share- Based Awards That Have Not Vested(5) ($) |
|||||||||||||||||||
| Marc Caira |
Aug 13, 2013 | 119,647 | $ | 61.31 | May 15, 2020 | $ | 117,254 | 16,453 | $ | 1,024,850 | ||||||||||||||||
| Total | 119,647 | $ | 117,254 | 16,453 | $ | 1,024,850 | ||||||||||||||||||||
| Paul D. House |
May 15, 2013 | n/a | n/a | n/a | n/a | 34,873 | $ | 2,172,224 | ||||||||||||||||||
| May 15, 2012 | n/a | n/a | n/a | n/a | 32,215 | $ | 2,006,655 | |||||||||||||||||||
| Feb 28, 2012 | n/a | n/a | n/a | n/a | 31,017 | $ | 1,932,079 | |||||||||||||||||||
| May 18, 2010 | 19,532 | $ | 35.23 | May 15, 2017 | $ | 528,536 | — | — | ||||||||||||||||||
| May 15, 2008 | 25,176 | $ | 33.02 | May 15, 2015 | $ | 736,902 | — | — | ||||||||||||||||||
| Total | 44,708 | $ | 1,265,437 | 98,105 | $ | 6,110,958 | ||||||||||||||||||||
| Cynthia J. Devine |
May 15, 2013 | 27,506 | $ | 56.12 | May 15, 2020 | $ | 169,712 | 5,043 | $ | 314,151 | ||||||||||||||||
| May 15, 2012 | 26,216 | $ | 54.95 | May 15, 2019 | $ | 192,425 | 5,910 | $ | 368,187 | |||||||||||||||||
| May 17, 2011 | 25,399 | $ | 45.76 | May 15, 2018 | $ | 419,845 | — | — | ||||||||||||||||||
| May 18, 2010 | 23,052 | $ | 35.23 | May 15, 2017 | $ | 623,787 | — | — | ||||||||||||||||||
| May 15, 2009 | 15,362 | $ | 28.87 | May 15, 2016 | $ | 513,398 | — | — | ||||||||||||||||||
| Total | 117,535 | $ | 1,919,168 | 10,954 | $ | 682,337 | ||||||||||||||||||||
| David F. Clanachan |
May 15, 2013 | 27,506 | $ | 56.12 | May 15, 2020 | $ | 169,712 | 5,043 | $ | 314,151 | ||||||||||||||||
| Aug 14, 2012 | 4,827 | $ | 50.24 | May 15, 2019 | $ | 58,165 | 1,022 | $ | 63,668 | |||||||||||||||||
| May 15, 2012 | 21,847 | $ | 54.95 | May 15, 2019 | $ | 160,357 | 4,926 | $ | 306,844 | |||||||||||||||||
| May 17, 2011 | 21,166 | $ | 45.76 | May 15, 2018 | $ | 349,874 | — | — | ||||||||||||||||||
| May 18, 2010 | 23,052 | $ | 35.23 | May 15, 2017 | $ | 623,787 | — | — | ||||||||||||||||||
| Total | 98,398 | $ | 1,361,895 | 10,991 | $ | 684,663 | ||||||||||||||||||||
| William A. Moir |
May 15, 2013 | 22,921 | $ | 56.12 | May 15, 2020 | $ | 141,423 | 4,203 | $ | 261,813 | ||||||||||||||||
| May 15, 2012 | 21,847 | $ | 54.95 | May 15, 2019 | $ | 160,357 | 4,926 | $ | 306,844 | |||||||||||||||||
| Aug 16, 2011 | 4,107 | $ | 45.84 | May 15, 2018 | $ | 67,560 | — | — | ||||||||||||||||||
| May 17, 2011 | 17,487 | $ | 45.76 | May 15, 2018 | $ | 289,060 | — | — | ||||||||||||||||||
| May 18, 2010 | 23,052 | $ | 35.23 | May 15, 2017 | $ | 623,787 | — | — | ||||||||||||||||||
| May 15, 2009 | 30,762 | $ | 28.87 | May 15, 2016 | $ | 1,028,066 | — | — | ||||||||||||||||||
| May 15, 2008 | 15,703 | $ | 33.02 | May 15, 2015 | $ | 459,627 | — | — | ||||||||||||||||||
| Total | 135,879 | $ | 2,769,880 | 9,129 | $ | 568,657 | ||||||||||||||||||||
| Roland M. Walton |
May 15, 2013 | 22,921 | $ | 56.12 | May 15, 2020 | $ | 141,423 | 4,203 | $ | 261,813 | ||||||||||||||||
| May 15, 2012 | 21,847 | $ | 54.95 | May 15, 2019 | $ | 160,357 | 4,926 | $ | 306,844 | |||||||||||||||||
| May 17, 2011 | 21,166 | $ | 45.76 | May 15, 2018 | $ | 349,874 | — | — | ||||||||||||||||||
| May 18, 2010 | 23,052 | $ | 35.23 | May 15, 2017 | $ | 623,787 | — | — | ||||||||||||||||||
| May 15, 2009 | 30,762 | $ | 28.87 | May 15, 2016 | $ | 1,028,066 | — | — | ||||||||||||||||||
| May 15, 2008 | 20,189 | $ | 33.02 | May 15, 2015 | $ | 590,932 | — | — | ||||||||||||||||||
| Total | 139,937 | $ | 2,894,439 | 9,129 | $ | 568,657 | ||||||||||||||||||||
| (1) | Number of Securities Underlying Unexercised Options is the number of outstanding options/SARs granted to the named executives since 2008. |
| (2) | Option Exercise Price is the exercise price of granted options/SARs which, starting in October 2009, was the closing price of our common shares as reported on the TSX for the trading day immediately preceding the grant date. For grants made earlier, the exercise price was the mean of the high and low stock price of our common shares on the TSX on the grant date. |
| (3) | Value of Unexercised In-The-Money Options is the difference between the exercise price and $62.29, the closing price of our common shares on the TSX on December 27, 2013, the last trading day of the fiscal year. |
| (4) | Number of Shares or Units of Shares That Have Not Vested is the number of P+RSUs and/or RSUs granted to the named executives that had not vested as of December 27, 2013, plus unvested dividend equivalent rights (DERs) earned on P+RSUs and/or RSUs after the grant date of the award. The named executives automatically accumulate additional RSUs after grant each time we pay a dividend on our common shares. The additional RSUs vest at the same time as the underlying RSUs. See note 6 to the Summary Compensation Table for the value of these DERs. DERs do not begin accruing until after the performance condition is satisfied and the P+RSUs are granted (as RSUs). P+RSUs were based on the financial results of the prior completed fiscal year and were not granted in May 2009 because we did not meet our 2008 EBIT performance target. |
| (5) | Market or Payout Value of Share-Based Awards That Have Not Vested is based on $62.29, the closing price of our common shares on the TSX on December 27, 2013. |
| (6) | The named executives do not currently have any vested share-based awards that have not been paid out or distributed. |
39
Table of Contents
Incentive Plan Awards—Value Vested or Earned During the Year
The table below lists the value of all option-based and share-based awards that have vested, and all non-equity incentive plan compensation earned, for each named executive during the fiscal year ended December 29, 2013.
| Name |
Option- Based Awards – Value Vested During the Year(1) ($) |
Share- Based Awards – Value Vested During the Year(2) ($) |
Non-Equity Incentive Plan Compensation – Value Earned During the Year(3) ($) |
|||||||||
| Marc Caira |
0 | 0 | 405,500 | |||||||||
| Paul D. House |
136,015 | 886,675 | 811,000 | |||||||||
| Cynthia J. Devine |
258,460 | 448,551 | 405,500 | |||||||||
| David F. Clanachan |
251,600 | 373,804 | 405,500 | |||||||||
| William A. Moir |
243,500 | 373,418 | 405,500 | |||||||||
| Roland M. Walton |
242,139 | 373,804 | 477,500 | |||||||||
| (1) | Option-Based Awards – Value Vested During the Year is the total value of options/SARs that vested in 2013 based on $56.12, the closing price of our common shares on the TSX on May 14, 2013, the business day immediately preceding the vesting date. The vested options represent one-third of the options/SARs granted on August 14, 2012 (Mr. Clanachan only), May 15, 2012, August 16, 2011 (Mr. Moir only), May 17, 2011 and May 18, 2010. None of the options/SARs granted in 2013 had vested as of December 27, 2013. In the 12 months prior to the record date, Mr. House exercised an aggregate of 77,000 SARs and Mr. Moir exercised an aggregate of 4,486 SARs. No other named executive exercised SARs in the prior 12 months. No options have been exercised for common shares to date. |
| (2) | Share-Based Awards – Value Vested During the Year is the total value of RSUs that vested in 2013 as follows: |
| • | P+RSUs awarded in May 2011 and August 2011 (Mr. Moir only) and vested 100% in November 2013 at a settlement price of $62.51 |
| • | RSUs awarded to Mr. House in February 2012 and vested one-third in March 2013 at a settlement price of $49.83 |
| • | RSUs awarded to Mr. House in May 2012 and vested one-third in May 2013 at a settlement price of $56.12. |
| (3) | Non-Equity Incentive Plan Compensation – Value Earned During the Year is the total value of the annual cash incentive for 2013 at a payout of 81.1% for each named executive except Mr. Walton, who received a payout of 95.5%. These amounts are also reported in the Summary Compensation Table. |
Retirement and Other Benefits
The table below shows the accumulated values at the beginning and end of the fiscal year ended December 29, 2013 for each named executive participating in the defined contribution pension plan and the Savings Plan (see page 27 for more information about the plans).
| Defined Contribution Pension Plan | Personal Supplemental Executive Retirement Savings Plan (Savings Plan) |
|||||||||||||||||||||||
| Name |
Accumulated Value at Start of Year ($) |
Compensatory
(1) ($) |
Accumulated Value at Year End(2) ($) |
Accumulated Value at Start of Year ($) |
Compensatory
(1) ($) |
Accumulated Value at Year End(2) ($) |
||||||||||||||||||
| Marc Caira(3) |
0 | 17,336 | 25,426 | 0 | 0 | 0 | ||||||||||||||||||
| Paul D. House(4) |
668,392 | 17,336 | 741,181 | 0 | 0 | 0 | ||||||||||||||||||
| Cynthia J. Devine |
228,191 | 17,336 | 282,433 | 140,912 | 49,043 | 211,791 | ||||||||||||||||||
| David F. Clanachan |
383,816 | 17,336 | 476,013 | 196,369 | 49,043 | 291,987 | ||||||||||||||||||
| William A. Moir |
465,676 | 17,336 | 590,305 | 189,792 | 48,140 | 284,803 | ||||||||||||||||||
| Roland M. Walton |
376,632 | 17,336 | 394,646 | 198,667 | 48,140 | 279,993 | ||||||||||||||||||
| (1) | Compensatory represents the contributions we made to each named executive’s account under the defined contribution pension plan and Savings Plan in 2013. Contributions to the Savings Plan are made after deducting all required withholding taxes. These gross contributions are included in the Summary Compensation Table for the year the compensation was earned. |
| (2) | Accumulated Value at Year End is the actual accumulated value of corporate and/or employee contributions and investment gains or losses as of December 29, 2013. |
| (3) | Mr. Caira did not receive a contribution to the Savings Plan in 2013. |
| (4) | Mr. House does not participate in the Savings Plan and instead received a cash equivalent payment of $152,682 ($77,058 after deducting all required withholding taxes) in February 2013 in lieu of a contribution to the Savings Plan. |
40
Table of Contents
Equity Compensation Plan Information
Securities Authorized for Issuance Under Equity Compensation Plans
The following table sets forth the securities authorized for issue under our long-term incentive plan at the end of 2013.
| Plan Category |
Number of securities to be issued upon exercise of outstanding options, warrants and rights(1) (a) |
Weighted-average exercise price of outstanding options, warrants and rights(2) (b) |
Number of securities remaining available for future issuance under equity compensation plans (excluding securities reflected in column (a)) (c) |
|||||||||
| Equity compensation plans approved by securityholders |
1,502,663 | $ | 47.11 | 1,397,337 | ||||||||
| Equity compensation plans not approved by securityholders |
n/a | n/a | n/a | |||||||||
| (1) | The total number of securities of 1,502,663 in column (a) includes: |
| • | 306,932 RSUs, including RSUs issued as a result of the vesting of P+RSUs (consisting of 31,017 RSUs under the 2006 Plan and 275,915 RSUs under the 2012 Plan, as defined below), subject to vesting requirements, and dividend equivalent rights associated with the RSUs. |
| • | 1,195,731 options/SARs (consisting of 602,315 options/ SARs under the 2006 Plan and 593,416 options/SARs under the 2012 Plan). Only 573,860 of the 1,195,731 options/SARs outstanding at December 29, 2013 were exercisable as of that date due to vesting requirements. Historically, SARs have been settled in cash and the associated options cancelled, while RSUs have been settled by way of a purchase on the open market by an agent of Tim Hortons on behalf of the eligible employee or a disbursement of shares from The TDL RSU Employee Benefit Plan Trust. |
| (2) | The average exercise price in column (b) is based only on options/SARs because RSUs (including P+RSUs) have time-based vesting and do not require a recipient to pay an exercise price on vesting and settlement. Under our equity grant and settlement policy, the exercise price of options/SARs is equal to the market price for these securities as of the grant date (set as the closing price of our common shares on the TSX on the business day immediately preceding the grant date). Although there is no purchase price for RSUs, the number of RSUs awarded is determined based on the grant date market value similar to options/SARs, as determined under our equity grant and settlement policy. |
Before making annual equity compensation awards, the Committee considers the impact of the new awards on dilution, overhang, and the burn rate of annual grants against the number of total common shares outstanding. These are included in the table below, and are low by industry standards.
| December 29, 2013 | ||||
| Dilution: total number of equity awards outstanding divided by the total number of common shares outstanding |
1.06 | % | ||
| Overhang: total number of equity awards available to grant plus equity awards outstanding, divided by the total number of common shares outstanding |
2.05 | % | ||
| Burn rate: number of equity awards issued in 2013, divided by the total number of common shares outstanding |
0.37 | % | ||
We have two equity compensation plans:
| • | 2012 Stock Incentive Plan (2012 Plan) – an omnibus plan that gives us flexibility to choose from different equity-based compensation awards. The plan was approved by shareholders on May 10, 2012, and terminates on May 10, 2022 (the tenth anniversary from the date it was approved). See Appendix B to this Item 11 for a description of the terms and conditions of the 2012 Plan. |
| • | 2006 Stock Incentive Plan (2006 Plan) – an omnibus plan with terms similar to the 2012 Plan. We stopped making awards under the 2006 Plan as of May 10, 2012, although the 2006 Plan governs all outstanding awards issued under that plan until all such awards are settled. |
41
Table of Contents
| Total common shares that can be issued under both the 2012 Plan and the 2006 Plan | 2,900,000 (2.1% of our issued and outstanding common shares as at record date) Maximum that can be issued from treasury: 50% of the common shares issued under the 2012 Plan | |
| Outstanding equity awards at record date | Under the 2012 Plan
867,956 equity awards, representing the potential issuance of 867,956 common shares (less than 1% of our issued and outstanding common shares)
Under the 2006 Plan
587,826 equity awards, representing the potential issuance of 587,826 common shares (less than 1% of our issued and outstanding common shares)
Under both the 2006 Plan and the 2012 Plan
1,455,782 equity awards, representing the potential issuance of 1,455,782 common shares (approximately 1% of our issued and outstanding common shares) | |
Termination and Change in Control
We have change in control agreements with each named executive (other than Mr. House, following his retirement as President and CEO) that provide benefits that are similar to those offered by comparable companies.
The Committee believes that appropriate change in control benefits encourage the ongoing commitment of named executives to make decisions in the best interests of shareholders and free from conflicting concerns during a change in control, which is generally a time of uncertainty and often results in loss of employment. These benefits are also intended to provide stability and continuity of management during and after the change in control transaction.
Change in Control Agreements
Our change in control agreements include the following key elements:
| • | a “double trigger” – there must be both a change in control and termination of employment by the company (other than for cause or death) or by the executive for good reason before any benefits are paid |
| • | severance for named executives – two times base salary and short-term incentive awards |
| • | employment protection – change in control benefits remain in place for no more than two years following a change in control |
| • | non-competition covenants – for the term of the named executive’s employment with us |
| • | confidentiality obligations – both during and after termination of employment |
| • | must pre-clear any trades in our securities with us – for one year after termination of employment, to confirm compliance with our insider trading policies and applicable law |
Our incentive plans also have change in control provisions. Any payments made under the incentive plans are deducted from the amount payable under the change in control agreements, so there is no duplication of payments.
Mr. Moir has an employment agreement with us that includes clauses related to payments on termination of employment (see page 47 for details). There are no other individual agreements with our named executives that guarantee continued employment or that establish payments on termination of employment.
How We Define Change in Control
The change in control agreements and the Savings Plan have different definitions of when a change in control is triggered.
Change in Control Agreements
Under our change in control agreements, change in control means any of the following:
| • | anyone other than the company, one of our subsidiaries, an employee benefit plan established for the benefit of our employees or the employees of our subsidiaries, or a trust or person connected with that plan acquires 30% or more of our outstanding voting shares |
| • | we sell all or substantially all of our assets to anyone other than one of our subsidiaries |
| • | we are dissolved, liquidated or wound up |
| • | there is a change in the composition of the Board following a contested election of directors, and the directors before the event no longer constitute 70% of the directors after the event |
| • | there is a merger, consolidation or reorganization with or into Tim Hortons Inc. or in which our securities are issued, unless it is a non-control transaction, where: |
| - | our shareholders before the transaction hold at least 70% of the voting power of the surviving corporation in substantially the same proportion as their ownership of voting power before the transaction, |
| - | the members of the board immediately before the transaction constitute at least two–thirds of the board of the surviving corporation, and |
| - | no person has beneficial ownership of more than 30% of the voting power of the surviving corporation except Tim Hortons Inc., one of our subsidiaries, an employee benefit plan or trust established for their benefit, or any person who immediately before the transaction had beneficial ownership of at least 30% of the voting power of our company |
The definition of change in control in Mr. Clanachan’s agreement is different from this definition, only as required to comply with Section 409A of the Internal Revenue Code.
42
Table of Contents
Savings Plan
Under our Savings Plan, change in control means any of the following:
| • | an unaffiliated entity directly or indirectly acquires a majority of the voting shares of Tim Hortons Inc. or our subsidiary, The TDL Group Corp. (TDL) |
| • | we or TDL merge or amalgamate into an unaffiliated entity, when a majority of our voting shares or TDL are acquired, directly or indirectly, by an unaffiliated entity |
| • | an unaffiliated entity acquires all or substantially all of our assets or the assets of TDL |
| • | an affiliate that employs any participant who is and continues to be employed by a person other than Tim Hortons Inc. or TDL, ceases to be our affiliate for any reason |
The following events are not considered a change in control:
| • | we, TDL or an affiliate amalgamate with or dissolve into Tim Hortons Inc., TDL or an affiliate |
| • | an affiliate acquires all or substantially all of our, TDL’s or an affiliate’s assets or voting shares |
Termination Following a Change in Control (Without Cause or For Good Reason)
Under the change in control agreements, we consider an executive to be terminated without cause, or to be terminating his or her own employment for good reason, if we (or a successor corporation) do any of the following after a change in control:
| • | change the named executive’s status, title, position or responsibilities and, in his or her reasonable judgment, the change is not a promotion |
| • | assign the named executive duties and responsibilities that, in his or her reasonable judgment, are not consistent with his or her status, title, position or responsibilities |
| • | reduce the named executive’s base salary |
| • | remove the named executive from, or do not re-appoint or re-elect him or her to, a position he or she held before the change in control (except in connection with a termination for disability, cause, as a result of his or her death, or by the named executive other than for good reason) |
| • | require the named executive to be based more than 50 kilometres from the business office from which he or she worked immediately before the change in control (except for reasonably required business travel that is not materially greater than the travel requirements before the change in control) |
| • | fail to provide compensation and benefits (including benefit levels and/or reward opportunities) substantially similar to those the named executive was receiving before the change in control, or take any action that would directly or indirectly materially reduce any benefit or deprive him or her of any material benefit provided before the change in control |
| • | materially breach the change in control agreement |
Under the change in control agreements, a named executive’s right to terminate his or her own employment for good reason is not affected by his or her incapacity due to physical or mental illness.
Termination for Cause Following a Change in Control
Under the change in control agreements, we can terminate an executive for cause when he or she:
| • | willfully and continually fails to substantially perform his or her duties (other than because of incapacity due to physical or mental illness) for at least 14 days after prior notice |
| • | willfully engages in conduct that is demonstrably and materially injurious to us |
| • | otherwise materially breaches his or her employment agreement with us, including by voluntarily terminating employment with us |
A named executive’s action or failure to act is willful if he or she acts (or fails to act) without good faith and without a reasonable belief that the action or failure to act was in our best interest.
43
Table of Contents
Termination and Change in Control Benefits
The following table summarizes the provisions under various termination and change in control scenarios.
|
Short-Term |
Long-Term Incentives |
|||||||||
| Severance | RSUs and P+RSUs | Options/SARs | Retirement Benefits | |||||||
| Death or disability | None | Pro-rated payment for portion of the year worked | Vest immediately | Vest immediately
Must be exercised within four years or the end of the term (whichever is sooner)
|
Vested and accrued benefits | |||||
| Retirement(1) | None | Pro-rated payment for portion of the year worked | Continue to vest according to their vesting schedule | Continue to vest according to their vesting schedule
Must be exercised within four years or the end of the term (whichever is sooner)
|
Vested and accrued benefits | |||||
| Resignation | None | Forfeited | Unvested units are forfeited | Unvested are forfeited
Vested must be exercised within 90 days
|
Vested benefits only | |||||
| Termination for cause | None | Forfeited | Unvested units are forfeited | Unvested are forfeited
Vested must be exercised within 90 days
|
Vested benefits only | |||||
| Termination without cause | In accordance with applicable law | Forfeited | Unvested units are forfeited | Unvested are forfeited
Vested must be exercised within 90 days
|
Vested benefits only | |||||
| Termination following a change in control (without cause, leaves for good reason – defined beginning on page 42) |
The greater of: 2x current year’s base salary plus target short-term incentive
or
2x average of current year and two prior years base salary and target short-term incentive
|
Paid as if the named executive is still employed with us when the bonus is paid out | Vest immediately | Vest immediately | Vested benefits and present value of employer contributions for the two years following the change in control(2) | |||||
| Change in Control | Not applicable | Upon the occurrence of a change in control, the greater of: (i) prior year’s actual short-term incentive, (ii) the short-term incentive that would be payable in the year of the change in control assuming that the target level of performance was obtained, and (iii) the short-term incentive that would be payable in the year of the change in control based on the company’s actual performance for that year through the date of the change in control(3)
|
Not applicable | Not applicable | Not applicable | |||||
44
Table of Contents
| (1) | For “Short-Term Incentive Plan” and “Long-Term Incentives” above, retirement is defined as age 60 and 10 years of service. For Mr. Caira, retirement is defined as age 60 and 3 years of service pursuant to his offer of employment. |
| (2) | In addition, life insurance, other medical and health insurance, and monthly car allowance will continue for two years. |
| (3) | Any payments made under the short-tern incentive plan as a result of a change in control will reduce the amount payable under the named executive’s change in control agreement as short-term incentive compensation for the year in which termination occurs. |
Payments Following a Termination of Employment
The following table sets out the amounts the named executives would have received if their employment was terminated on December 29, 2013 under various scenarios. References to Termination for “Cause” or “Without Cause” in the table below are actions that may be taken by us. References to Termination for “Good Reason” in the table below are actions that may be taken by the named executives.
With the exception of Mr. Moir, whose entitlements are set forth in his employment agreement, under applicable law, we may be required to pay severance to executives upon a termination by us without cause, in addition to the amounts set forth in the table below. These amounts would be negotiated on a case-by-case basis and would vary depending on the executive’s tenure, date of separation from service with us and other factors. As such, we have not attempted to quantify those amounts.
| Cash Severance (Change In Control)(1) |
Short-Term Incentive Plan Payout(2) |
Equity (P+RSU/ Options/ SARs)(3) |
Savings Plan (Current Year Contribution)(4) |
Savings Plan and Defined Contribution Pension Plan (Accumulated Balances)(5) |
Other Benefits(6) |
Total | ||||||||||||||||||||||
| Marc Caira |
||||||||||||||||||||||||||||
| Death or Disability |
— | $ | 405,500 | $ | 1,142,104 | $ | 36,844 | $ | 31,263 | — | $ | 1,615,711 | ||||||||||||||||
| Retirement/Resignation |
— | — | — | — | $ | 31,263 | — | $ | 31,263 | |||||||||||||||||||
| Termination For Cause |
— | — | — | — | $ | 31,263 | — | $ | 31,263 | |||||||||||||||||||
| Termination Without Cause |
— | — | — | — | $ | 31,263 | — | $ | 31,263 | |||||||||||||||||||
| Termination Following a Change in Control (Without Cause or for Good Reason)(8) |
$ | 3,820,000 | $ | 1,000,000 | $ | 1,142,104 | $ | 36,844 | $ | 31,263 | $ | 510,874 | $ | 6,541,085 | ||||||||||||||
| Cynthia J. Devine |
||||||||||||||||||||||||||||
| Death or Disability |
— | $ | 405,500 | $ | 1,120,281 | $ | 92,943 | $ | 494,224 | — | $ | 2,112,949 | ||||||||||||||||
| Retirement/Resignation |
— | — | — | $ | 92,943 | $ | 494,224 | — | $ | 587,168 | ||||||||||||||||||
| Termination For Cause |
— | — | — | $ | 92,943 | $ | 494,224 | — | $ | 587,168 | ||||||||||||||||||
| Termination Without Cause |
— | — | — | $ | 92,943 | $ | 494,224 | — | $ | 587,168 | ||||||||||||||||||
| Termination Following a Change in Control (Without Cause or for Good Reason)(8) |
$ | 1,900,000 | $ | 500,000 | $ | 1,120,281 | $ | 92,943 | $ | 494,224 | $ | 283,066 | $ | 4,390,514 | ||||||||||||||
| David F. Clanachan |
||||||||||||||||||||||||||||
| Death or Disability |
— | $ | 405,500 | $ | 1,116,678 | $ | 92,943 | $ | 768,000 | — | $ | 2,383,122 | ||||||||||||||||
| Retirement/Resignation |
— | — | — | $ | 92,943 | $ | 768,000 | — | $ | 860,944 | ||||||||||||||||||
| Termination For Cause |
— | — | — | $ | 92,943 | $ | 768,000 | — | $ | 860,944 | ||||||||||||||||||
| Termination Without Cause |
— | — | — | $ | 92,943 | $ | 768,000 | — | $ | 860,944 | ||||||||||||||||||
| Termination Following a Change in Control (Without Cause or for Good Reason)(8) |
$ | 1,900,000 | $ | 500,000 | $ | 1,116,678 | $ | 92,943 | $ | 768,000 | $ | 283,066 | $ | 4,660,687 | ||||||||||||||
| William A. Moir |
||||||||||||||||||||||||||||
| Death or Disability |
— | $ | 405,500 | $ | 935,860 | $ | 88,384 | $ | 875,108 | — | $ | 2,304,852 | ||||||||||||||||
| Retirement/Resignation(7) |
— | $ | 405,500 | $ | 935,860 | $ | 88,384 | $ | 875,108 | $ | 700,512 | $ | 3,005,364 | |||||||||||||||
| Termination For Cause |
— | — | — | $ | 88,384 | $ | 875,108 | — | $ | 963,492 | ||||||||||||||||||
| Termination Without Cause(7) |
— | $ | 405,500 | $ | 935,860 | $ | 88,384 | $ | 875,108 | $ | 1,200,512 | $ | 3,505,364 | |||||||||||||||
| Termination Following a Change in Control (Without Cause or for Good Reason)(8) |
$ | 1,824,000 | $ | 500,000 | $ | 935,860 | $ | 88,384 | $ | 875,108 | $ | 273,882 | $ | 4,497,234 | ||||||||||||||
| Roland M. Walton |
||||||||||||||||||||||||||||
| Death or Disability |
— | $ | 477,500 | $ | 933,606 | $ | 88,384 | $ | 674,639 | — | $ | 2,174,129 | ||||||||||||||||
| Retirement/Resignation |
— | — | — | $ | 88,384 | $ | 674,639 | — | $ | 763,023 | ||||||||||||||||||
| Termination For Cause |
— | — | — | $ | 88,384 | $ | 674,639 | — | $ | 763,023 | ||||||||||||||||||
| Termination Without Cause |
— | — | — | $ | 88,384 | $ | 674,639 | — | $ | 763,023 | ||||||||||||||||||
| Termination Following a Change in Control (Without Cause or for Good Reason)(8) |
$ | 1,824,000 | $ | 500,000 | $ | 933,606 | $ | 88,384 | $ | 674,639 | $ | 273,882 | $ | 4,294,511 | ||||||||||||||
45
Table of Contents
| (1) | Cash Severance related to a termination following a change in control for each named executive consists of a lump sum equal to the greater of: |
| • | two times the current year’s base salary plus target short-term incentive, and |
| • | two times the average of current year plus two prior years’ base salary and target short-term incentive. |
Lump sums are to be paid out within 10 days of the termination date. The only exception is to the extent that Mr. Clanachan is subject to the taxation laws of the United States and is a “specified employee” within the meaning of Section 409A of the Internal Revenue Code and the Treasury Regulations promulgated thereunder, he will not receive any of the lump sum until the first business day of the seventh month following his termination date.
| (2) | Any short-term incentive plan payout under a “Termination Without Cause” or termination for “Good Reason” following a change in control is deducted from the amount payable under the change in control agreements so there is no duplication of payment. The plan establishes a minimum incentive payment for the year the change in control occurs. Reported amounts in scenarios other than change in control reflect amounts set forth in the Summary Compensation Table. |
| (3) | The value of unvested P+RSUs is based on $62.29, the closing price of our common shares on the TSX on December 27, 2013. The value of unexercised, unvested, in the money options/SARs is based on the difference (or spread) between the exercise prices and $62.29, multiplied by the number of unvested options/SARs. |
| (4) | Represents gross contribution under the Savings Plan for 2013 made after December 31st of that year. Our actual contribution was after deducting all applicable withholding taxes unless the contribution was directed to an RRSP. |
| (5) | Represents accumulated amounts in the Savings Plan and defined contribution pension plan as of December 31, 2013, that the named executives are entitled to receive in the event of termination for any reason, including following a change in control. The change in control does not result in additional payments to these accumulated balances. |
| (6) | Other Benefits related to a termination following a change in control for each named executive consist of: |
| • | a lump sum payment equal to the present value of the employer contributions the named executive would have accrued under the Savings Plan and defined contribution pension plan for the two years following the change in control. Various assumptions were used to determine these values, including future base salaries remaining at 2014 levels, achievement of cash incentives at “target” for 2014 and 2015 fiscal years, employer contributions to the defined contribution pension plan remaining at 2014 levels, and the use of the long-term bond rate to determine present value, |
| • | continuation of life insurance and other medical and health insurance for the two years following termination, and |
| • | payment of a monthly car allowance for the two years following termination based on a pre-determined amount for the car, gas, maintenance and insurance for the grade level of the executive officer, as established by us from time to time. |
In addition, pursuant to Mr. Moir’s employment agreement, he is entitled to payments that he would have received if he continued his employment until August 31, 2014. See page 47 for more information.
| (7) | Executives who are approved as eligible for retirement can receive short-term incentive awards (only if the Committee approves) and receive their unvested P+RSUs and options/SARs, which will continue to vest over the scheduled vesting period, on voluntary retirement. We have therefore included these amounts in the above table under the description Retirement/Resignation and Termination Without Cause. Mr. Caira, Ms. Devine, Mr. Clanachan and Mr. Walton are not currently eligible for retirement, so no amounts are shown under the short-term incentive plan and equity for termination under those circumstances. |
| (8) | Under the change in control agreements, a named executive’s right to terminate his or her employment for “Good Reason” is not affected by his or her incapacity due to physical or mental illness. |
Termination without “Good Reason” by a named executive may include retirement or resignation. Named executives who are eligible for retirement, however, may be able to receive short- and long-term incentive awards, if the Committee approves.
46
Table of Contents
Retention Agreements
On August 8, 2012, we entered into retention agreements with certain senior officers, including the four named executives in the table below, to provide stability while the Board carried out its search for a new President and CEO and the transitional period after the new CEO’s appointment.
These executives will qualify for a retention award equal to their base salary as of August 7, 2012 if they remain continuously employed by us nine months after a new President and CEO is hired. Mr. Moir must continue as CMO through the payment date of the retention award to qualify for the award.
The Board appointed Mr. Caira as President and CEO effective July 2, 2013. Executives who qualify on April 2, 2014 will receive a lump sum cash award as outlined in the table below.
If we terminate an executive for any reason before April 2, 2014, he or she will not receive the award.
| Retention award | ||||
| Cynthia J. Devine |
$ | 450,000 | ||
| David F. Clanachan |
$ | 450,000 | ||
| William A. Moir |
$ | 412,000 | ||
| Roland M. Walton |
$ | 412,000 | ||
Employment Agreements
We have an employment agreement with Mr. Moir that covers the period from August 8, 2012 to August 31, 2014.
Mr. Moir will serve as CMO until his successor is appointed. If the new CMO is appointed before August 31, 2014, Mr. Moir will continue to serve as executive team leader for our sustainability and responsibility program and President of the Tim Horton Children’s Foundation. He will also support the CMO transition as determined by the CEO. During the employment period, he will receive the same level of compensation he received in 2012 unless the Committee approves an increase. His participation in the short- and long-term incentive plans will be the same as it was before August 8, 2012, unless the Committee makes a change at its discretion that applies to all named executives. At the end of the employment period, Mr. Moir will be retired for all purposes under our compensation, benefit and pension plans, programs and policies, unless by separate agreement we choose to continue his employment.
If we terminate Mr. Moir’s employment before the end of the employment period (except for cause, or if he becomes disabled or dies), he will receive all payments, grants and benefits owed for the rest of the employment period, including the cash equivalent of equity grants and other benefits, as full and final payment. If he terminates his employment before the end of the employment period (other than if he dies), he will receive all payments and benefits owed for the rest of the employment period. However, he will not receive any long-term incentive grants that had not yet been granted, and he will be considered retired for purposes of unvested equity under the stock incentive plans. If he is terminated after a change in control while he is serving as CMO, the terms of his change in control agreement will apply. If he is terminated after a change in control during the employment period, and he is no longer serving as CMO, we will treat his termination as though there had not been a change in control.
Other Agreements
We also have employment and post-employment covenants agreements with Mr. Caira and Mr. Moir that include non-competition, non-solicitation, confidentiality, non-disparagement and other covenants to protect Tim Hortons both during and after the employment period.
47
Table of Contents
Director Compensation —
Compensation Discussion and Analysis
Philosophy and Approach
Our director compensation rewards directors for the time and effort required for serving on our Board.
We place a significant emphasis on aligning the interests of our directors and our shareholders because we strongly believe that a director’s level of share ownership is an indication of his or her level of commitment to the success of Tim Hortons. The Board approves all director compensation.
Share Ownership Guidelines
Our governance guidelines require outside directors to build their equity ownership above a minimum threshold. In February 2014, with a view to further aligning the interests of our Board with those of our shareholders, the Board increased the minimum threshold from three to four times a director’s annual retainer (increased in 2014 from $90,000 to $110,000, for a total of $440,000). This minimum threshold must be reached within five years of being appointed or elected to the Board. A director must also receive $60,000 of the annual retainer in deferred share units (DSUs) until he or she meets the ownership requirements. Once directors meet the ownership threshold, they can elect to receive their annual retainer in cash or DSUs, or a combination of both.
The Committee periodically reviews our share ownership guidelines, and reviews compliance with the guidelines annually. As of the record date, all outside directors exceeded the required level of ownership, other than Ms. Brillon and Mr. Milroy, who were appointed to the Board in August 2013 and have until August 2018 to meet the share ownership guidelines, and Mr. O’Neill, who was appointed to the Board in March 2014 and has until March 2019 to meet the share ownership guidelines.
Decision-making Process
We benchmark our director compensation against companies that are of a similar size and revenue base. The Committee reviews our director compensation every year.
The last review was conducted in early 2013 and decisions were deferred to 2014, consistent with the timing of changes to our executive compensation program. In February 2014, the Board approved certain amendments to our director compensation to align compensation levels more closely with the median of our Canadian comparator group. These changes, which are described below, became effective in 2014.
Components
Our director compensation has the following components:
| • | annual director retainer |
| • | committee and chair retainers |
| • | meeting fees |
Our annual director retainer in 2013 was $90,000 (increased to $110,000 in 2014), and directors must receive $60,000 of the annual retainer in DSUs until they have met the share ownership guidelines. They can then elect to receive all of their annual retainer in cash or DSUs, or a combination of both.
Directors can also elect to receive their Committee and chair retainers and meeting fees in cash or DSUs, or a combination of both.
If the Chairman is not independent, then the chair of the Nominating and Corporate Governance Committee serves as Lead Director and he or she receives an annual retainer of $108,000, rather than the $8,000 annual retainer for serving as the Nominating and Corporate Governance Committee chair only, to compensate him or her for the increased workload and required contributions of that role.
48
Table of Contents
A director who is also an officer of Tim Hortons does not receive any director compensation. The table below shows our 2013 and 2014 director fee schedule.
| 2013 | 2014 | |||||||
| Annual retainers |
||||||||
| Lead Director |
$ | 108,000 | $ | 108,000 | ||||
| Committee chairs |
||||||||
| Audit Committee |
$ | 15,000 | $ | 20,000 | ||||
| Human Resource and Compensation Committee |
$ | 12,000 | $ | 15,000 | ||||
| Nominating and Corporate Governance Committee |
$ | 8,000 | (1) | $ | 8,000 | (1) | ||
| Board member: |
||||||||
| Equity retainer |
$ | 60,000 | $ | 60,000 | ||||
| Cash retainer |
$ | 30,000 | $ | 50,000 | ||||
| Committee members |
$ | 3,000 | $ | 3,000/$5,000 | (3) | |||
| Meeting fees |
||||||||
| Board and Committee meetings |
||||||||
| In person |
$ | 1,500 | (2) | $ | 1,500 | (2) | ||
| Teleconference |
$ | 750 | $ | 750 | ||||
| (1) | Does not currently apply because the Board has a Lead Director. |
| (2) | A director is also entitled to receive a fee of $1,500 if he or she spends more than five hours of a business day (including travel time) on Board or Committee business, outside of the regular meetings. |
| (3) | Audit Committee members receive an annual retainer of $5,000. All other Committee members receive an annual retainer of $3,000. |
About DSUs
DSUs are notional units that track the value of our common shares. They earn dividend equivalent rights, equal to the cash dividends paid on our common shares.
DSUs are granted and vest immediately; however, they are only paid out in cash when a director retires or leaves Board service.
49
Table of Contents
2013 Compensation Details
Director Compensation Table
The table below shows the compensation paid to our outside directors for the fiscal year ended December 29, 2013.
Mr. House served as Executive Chairman, President and CEO until July 1, 2013. During that time, he was only compensated in his role as President and CEO and did not receive any additional compensation for serving as a director.
Following Mr. House’s retirement as President and CEO, he continued to serve as non-Executive Chairman of the Board. For these services during that period, he received $150,000. Mr. Caira was appointed to the Board on May 7, 2013, and President and CEO as of July 2, 2013, and he did not, and will not for so long as he is an officer of the company, receive any compensation for serving as a director.
| Director |
Fees Earned(1) ($) |
Share-Based Awards(2) ($) |
All Other Compensation(3) ($) |
Total ($) |
||||||||||||
| M. Shan Atkins |
90,000 | 30,000 | 11,344 | 131,344 | ||||||||||||
| Sherri A. Brillon |
0 | 24,000 | 101 | 24,101 | ||||||||||||
| Michael J. Endres |
0 | 121,500 | 19,329 | 140,829 | ||||||||||||
| Moya M. Greene |
28,500 | 90,000 | 14,157 | 132,657 | ||||||||||||
| Paul D. House |
150,000 | 0 | 0 | 150,000 | ||||||||||||
| The Hon. Frank Iacobucci |
225,000 | 0 | 30,100 | 255,100 | ||||||||||||
| John A. Lederer |
0 | 117,000 | 21,999 | 138,999 | ||||||||||||
| David H. Lees |
0 | 118,500 | 21,852 | 140,352 | ||||||||||||
| Thomas V. Milroy |
0 | 24,000 | 101 | 24,101 | ||||||||||||
| Ronald W. Osborne(4) |
14,250 | 15,000 | 2,749 | 31,999 | ||||||||||||
| Wayne C. Sales |
0 | 129,000 | 22,036 | 151,036 | ||||||||||||
|
|
|
|||||||||||||||
| Total: | 1,320,518 | |||||||||||||||
|
|
|
|||||||||||||||
| (1) | Fees Earned is cash compensation paid to directors, in accordance with their elections. |
| (2) | Share-Based Awards are the fees received in DSUs, in accordance with each director’s election. |
| (3) | All Other Compensation is the amount received as dividend equivalents as at the date dividends were paid on our shares and, therefore, accumulated on outstanding DSUs. Quarterly dividends of $0.26 per common share were paid in March, June, September and December 2013. |
| (4) | Mr. Osborne passed away on April 9, 2013. As a result, we paid his beneficiary $579,172.14 during 2013, representing the accumulated value of vested DSUs. |
The table below shows the value of all DSUs that vested in 2013, using the grant date values. These values include the amounts under Share-Based Awards and All Other Compensation in the table above. The amounts are based on individual director elections and, therefore, vary by director.
| Director |
Total Value of DSUs Vested in 2013 ($) |
|||
| M. Shan Atkins |
41,344 | |||
| Sherri A. Brillon |
24,101 | |||
| Michael J. Endres |
140,829 | |||
| Moya M. Greene |
104,157 | |||
| The Hon. Frank Iacobucci |
30,100 | |||
| Paul D. House(1) |
0 | |||
| John A. Lederer |
138,999 | |||
| David H. Lees |
140,352 | |||
| Thomas V. Milroy |
24,101 | |||
| Ronald W. Osborne |
17,749 | |||
| Wayne C. Sales |
151,036 | |||
| (1) | Mr. House had not been eligible to receive director compensation, including DSUs, until 2014, because he served as President and CEO until July 2, 2013, and provided transition services until December 31, 2013. |
50
Table of Contents
Appendix A — Reconciliation of Non-GAAP Measures
Adjusted EBIT for compensation purposes (adjusted EBIT) is a non-GAAP measure that we used for determining incentive awards in 2013. Adjusted EBIT’s most directly comparable GAAP measure is operating income (EBIT).
A non-GAAP measure excludes the impact of discrete or non-operating transactions on our financial results. We believe this makes it a better reflection of our operating performance, a more effective way to compare performance to prior periods, and a more appropriate measure of corporate performance for executive compensation purposes. It is not intended to replace the presentation of our financial results in accordance with GAAP, and may be different from similar measures reported by other companies.
In 2013 adjusted EBIT excluded:
| • | operating income from variable interest entities (VIEs) – operating income derived from certain non-owned restaurants and from a portion of income related to our advertising funds that we are required to consolidate. At the beginning of 2010, we adopted a new accounting standard that required us to begin consolidating operating income from VIEs we are considered to be primary beneficiary of. We believe, however, that it should not be included in determining corporate performance for compensation purposes |
| • | corporate reorganization expenses |
| • | Cold Stone Creamery de-branding costs |
Reconciliation of Non-GAAP Measures
The table below shows how we calculate adjusted EBIT from EBIT attributable to Tim Hortons Inc. for the 2013 fiscal year.
| (in millions) | ||||
| EBIT |
$ | 621.1 | ||
| Less: EBIT attributable to VIEs |
(6.6 | ) | ||
| EBIT attributable to Tim Hortons Inc. |
614.5 | |||
| Add: Corporate reorganization expenses |
11.8 | |||
| Add: Cold Stone Creamery de-branding costs |
19.0 | |||
| Adjusted EBIT |
645.3 | |||
51
Table of Contents
Appendix B — Stock Incentive Plans
About the 2012 Stock Incentive Plan
| Awards Granted or Planned to be Granted
| ||
| 2012 Plan | • The 2012 Plan provides for equity compensation awards in the form of stock options, restricted stock, stock appreciation rights, DERs, performance shares, performance units, share awards, and stock units (collectively, Awards) to eligible employees and non-employee directors of Tim Hortons
• The 2012 Plan shall terminate and no Award may be granted or made after the tenth anniversary of the date the 2012 Plan was approved by shareholders (i.e., May 10, 2022), provided that incentive stock options may not be granted after February 23, 2022
| |
| Stock options | • Can be non-qualified stock options or incentive stock options as defined under Section 424 of the Internal Revenue Code. No more than 1,000,000 common shares can be allocated to incentive stock options
• The holder receives common shares when the options are exercised based on the price of our common shares at the time of exercise
• When exercised, the holder surrenders the related number of stock appreciation rights for cancellation
• The Human Resource and Compensation Committee (Committee) determines the term of an option (not to exceed 10 years)
| |
| Restricted stock | • Will contain such restrictions, terms and conditions as the Committee shall determine
• Unless the Committee determines otherwise, the holder will have the right to vote the shares and to receive all dividends and other distributions on the shares prior to vesting
| |
| Stock appreciation rights (SARs) | • SARs can be granted alone or in tandem with options; if granted in tandem with options:
• can only be exercised when the related option is exercisable
• the holder receives (in the discretion of the Committee) cash, common shares or a combination of both when SARs are exercised
• the amount the holder receives is: the number of SARs exercised x (the fair market value of common shares on the date the SARs were exercised, less the option price). For SARs unrelated to options, the amount is: the number of SARs exercised x (the fair market value of common shares on the date the SARs were exercised, less the fair market value of the common shares on the date the SARs were granted)
• when exercised, the holder surrenders the related number of stock options for cancellation
• terminate when the related option is exercised, expires or is forfeited
• The Committee determines the exercisibility, vesting and duration of a SAR unrelated to an option, provided the maximum term cannot exceed 10 years
| |
| Stock units | • Holders have the right to receive a payment when the stock unit vests, or a later date specified by the Committee
• The amount is equal to the fair market value of our common shares as of the grant date, vesting date or other date determined by the Committee when the award was granted
| |
| Dividend equivalent rights (DERs) | • Granted with an award or as a separate award
• Holder receives single payments or installments equivalent to cash dividends paid on our common shares
• Payments are in cash, common shares or a combination of both
• DERs can be paid concurrently, or deferred until the restrictions on them lapse, or until the vesting, exercise, payment, settlement or the lapse of other restrictions on the award to which they relate
| |
| Performance shares | • Common shares issued to holders, which shares become vested on the terms, conditions and satisfaction of performance objectives as the Committee may determine
• Unless the Committee determines otherwise, the holder will have the right to vote the shares and to receive all dividends and other distributions on the performance shares prior to vesting
| |
| Performance units | • Value is in common shares or a specified dollar amount
• Each performance unit represents the right to receive:
• for share-denominated performance units: a percentage of the fair market value of our common shares on the day the performance unit was granted, the day it vested or any other day specified by the Committee. The percentage actually paid out depends on our performance against the performance objective, and can be more than 100%
| |
52
Table of Contents
| Awards Granted or Planned to be Granted
| ||
| • for dollar-denominated performance units: a percentage of the specified dollar amount, depending on our performance against the performance objective, and can be more than 100%
• At the time it grants performance units, the Committee can cap the amount that can be paid out
• Payment can be in common shares, cash, or a combination of both. It can include restricted stock if the Committee so specifies at the time they are granted
| ||
| Share awards | • Common shares awarded to eligible employees or non-employee directors as additional compensation for services rendered or in place of cash or other compensation
| |
| Issuing common shares | • We can issue any combination of the following kinds of common shares:
• authorized for issue but not yet issued
• acquired by or on behalf of a trust we (or one of our subsidiaries) establish and hold for future delivery
• acquired by delivery of cash to a broker to acquire shares on behalf of eligible participants
• When we issue common shares in settlement of an equity award, the number of common shares available for issue under the 2012 Plan awards will be reduced by the same number of shares issued in settlement
| |
| Issue limits | • Non-employee directors – we can grant up to 0.25% of our issued and outstanding common shares (at the time the award is granted) to non-employee directors as a group, or $100,000 to each individual non-employee director in a calendar year
• Insiders – we can grant a total of up to 10% of our issued and outstanding common shares under all security-based compensation arrangements to all insiders as a group, and no more than 10% in any one-year period
• U.S. residents – in any calendar year, we can grant up to 250,000 common shares as options, stock appreciation rights or performance awards that are meant to qualify as performance-based compensation within the meaning of Section 162(m)(4)(C) of the Internal Revenue Code, or US$4,000,000 in cash and shares at their fair market value at the time the award is granted
• There is a maximum of 2,900,000 common shares that can be issued under both our 2012 Plan and our 2006 Plan
| |
| Issuing awards on exercise | • We expect to deliver common shares acquired through the facilities of the TSX to participants when they exercise their awards. We have not issued common shares from treasury to settle equity awards since 2009
• If we change our practice and choose to issue common shares from treasury when a participant exercises or settles the outstanding equity awards granted under the 2012 Plan, no more than 1,450,000 common shares can be issued from treasury to settle the awards. This represented approximately 1% of our issued and outstanding common shares as at the record date
• In Canada, the cash payments received from exercising a SAR are taxable income to the employee. Canadian tax legislation provides that either the Canadian employer or the Canadian employee may claim a deduction for cash payments from exercising the SAR feature, but not both. Since 2011, we have made an election to forgo our corporate tax deduction in Canada to allow Canadian employees affected by the legislation to receive favourable tax treatment in those years
| |
| Value of awards | • Fair market value of common shares on any relevant date means the closing price of our common shares on the TSX or, if the Committee chooses, the NYSE, on the trading day just before the relevant date
| |
| Termination of awards | • If the award expires, is cancelled, is settled in cash, or is otherwise terminated without being exercised or payment being made, the common shares subject to that award will be available for other awards
| |
| Plan administration | • The Committee administers the 2012 Plan
• Each Committee member is a non-employee director (within the meaning of SEC Rule 16b-3). The Committee has the authority to determine who will receive awards, when the awards will be granted, and how eligible employees who are on a leave of absence will be treated
• It can also use its discretion, subject to applicable law, to delegate administrative or ministerial duties, non-material decisions under the 2012 Plan and any decisions not relating to our executive officers to one or more persons
| |
53
Table of Contents
| Awards Granted or Planned to be Granted
| ||
| Making changes to the 2012 Plan |
• Except as described below, the Committee can amend, suspend, discontinue or terminate the 2012 Plan and any outstanding awards, in whole or in part, at any time without giving notice to shareholders or receiving their approval, provided that all material amendments to the 2012 Plan receive shareholder approval
• The following changes require approval by our Board and our shareholders:
• increasing the maximum number of common shares that can be issued
• making a change or adjustment (other than for a stock dividend, recapitalization or other transaction where an adjustment is permitted or required under the terms of the plan) that reduces or would have the effect of reducing the exercise price of an option or SAR granted under the plan, whether through amendment, cancellation or replacement grants, or other means
• increasing the limits on awards that can be made to non-employee directors and insiders
• extending the term of an outstanding option or SAR beyond its expiration date, except as specified for awards that expire outside of an established trading window
• making a change that would permit options granted under the plan to be transferred or assigned other than to settle an estate
• changing the plan’s amendment provisions that is not either for “housekeeping” purposes or to maintain compliance with applicable laws or regulations
• In addition, we may not change an outstanding award under the plan in a way that will materially adversely impair the rights of the holder without his or her consent, unless we are making the change so we can continue to comply with applicable laws or regulations.
• Examples of changes the Committee can make without shareholder approval:
• changes that relate to a stock dividend, recapitalization or other transaction where an adjustment is allowed or required
• adjustments to outstanding awards and the shares available for future awards because of an increase or reduction in the number of shares
• changes that relate to a change in capitalization that leads to a change in shares or an exchange of shares for a different number or kind of shares or other securities of Tim Hortons or another corporation if there is a spin-off, dividend or other distribution of shares because of a recapitalization, merger, consolidation, stock split, repurchase of shares, change in corporate structure or otherwise. If the holder is entitled to new, additional or different shares of our securities or of any other corporation, these shares will have the same conditions, restrictions and performance criteria that applied to the common shares allocated to the award before the change was made
• changing a vesting provision of any award
• changing the termination provisions of any award, but not extending it beyond its original expiration date
• adding a cashless exercise feature payable in securities, whether or not it provides for a full deduction of the number of underlying securities from the plan reserve, and making a change to an existing cashless exercise provision
• adding a form of financial assistance, and making a change to an existing financial assistance provision
• changing the process for exercising awards
• changes to continue to comply with applicable laws, regulations, requirements, rules or policies of any governmental authority or stock exchange
• “housekeeping” changes, including changes that eliminate ambiguity or that correct or supplement any provision
| |
| Termination of employment | • The 2012 Plan contains provisions concerning the treatment of Awards upon termination of employment, which apply unless otherwise set forth in an applicable Award agreement, or unless otherwise determined by the Committee, with the consent of the holder
• If a holder dies or becomes disabled:
• the holder’s options and SARs will become immediately exercisable and may be exercised for a period of four years following death or disability (but in no event beyond the maximum term of the option or SAR)
• the holder’s performance awards will remain outstanding, and the holder or the holder’s estate will be entitled to a pro rata portion of the payment otherwise payable in respect of the performance awards on the date the performance awards would have been paid if the holder had remained employed
• the holder’s restricted stock and stock units that are not intended to be performance awards will become immediately vested
| |
54
Table of Contents
| Awards Granted or Planned to be Granted
| ||
|
• If a holder’s employment is terminated by reason of retirement:
• the holder’s options and SARs will remain outstanding for a period of four years (but in no event beyond the maximum term of the option or SAR) and unvested options and SARs will continue to vest in accordance with their applicable vesting schedule
• the holder’s performance awards will remain outstanding, and the holder will be entitled to a pro rata portion of the payment otherwise payable in respect of the Award on the date the performance awards would have been paid if the holder had remained employed
• the holder’s restricted stock that are not intended to be performance awards will become immediately vested
• the holder’s unvested stock units that are not intended to be performance awards will continue to vest in accordance with their applicable vesting schedules
• If a grantee’s employment is terminated without cause in connection with a sale or other disposition of a subsidiary:
• the holder’s options and SARs will remain outstanding for one year (but in no event beyond the maximum term of the option or SAR) and unvested options and SARs will become immediately vested on the termination date
• the holder’s performance awards will remain outstanding, and the holder will be entitled to a pro rata portion of the payment otherwise payable in respect of the Award on the date the performance awards would have been paid if the holder had remained employed
• the holder’s restricted stock and stock units that are not intended to be performance awards will become immediately vested
• If a grantee’s employment terminates for any other reason:
• all of the holder’s Awards will be forfeited immediately unless otherwise determined by the Committee with the holder’s consent, except any vested options or SARs the holder holds will remain exercisable for a period of 90 days following termination of employment or, in the event such holder dies during such 90 day period, remain exercisable for a period of one year following the termination date but, in no event, beyond the maximum term of the option or SAR
| ||
| Change in control | • Except as otherwise provided in an Award agreement or another agreement between the holder and the company (or a subsidiary thereof), in the event that, within 24 months following the occurrence of a “change in control”, a holder’s employment is terminated without cause or for good reason:
• all options/SARs outstanding on the termination date, whether or not exercisable, will become immediately exercisable
• the restrictions applicable to outstanding restricted stock will lapse
• stock units will become fully vested
• all restrictions on outstanding performance shares and restricted stock that are intended to be performance awards will lapse
• outstanding performance units and stock units that are intended to be performance units, will become vested, in each case as if all performance objectives had been satisfied at the highest level by us and the holder
• the holder will be entitled to receive a cash payment within 60 days after the change in control in respect of the performance units and stock units that are intended to be performance awards, that become vested as a result of a change in control
| |
| Transferability | • Awards are generally non-transferable and, in the case of options and SARs, may be exercised, during a grantee’s lifetime, only by the grantee
• In the case of options, if the holder becomes incapacitated or if the option agreement so provides, the holder’s legal representative or estate may exercise the option or SAR
| |
About the 2006 Stock Incentive Plan
The 2006 Plan is an omnibus plan that was designed to allow us to compensate employees in a variety of ways through a broad range of equity-based awards. The terms of the 2006 Plan are substantially similar to the 2012 Plan. Since May 12, 2010: (i) no further awards were made under the 2006 Plan (although the terms of the 2006 Plan will continue to govern awards granted prior to that time), and (ii) an aggregate maximum of 2,900,000 common shares are authorized under both the 2006 Plan and the 2012 Plan.
55
Table of Contents
| Item 12. | Security Ownership of Certain Beneficial Owners and Management and Related Stockholder Matters |
Equity Compensation Plan Information
See Item 11 – “Executive Compensation—Equity Compensation Plan Information” for information regarding our equity compensation plans.
Voting Securities and Their Principal Holders
The table below lists the shareholders who beneficially own, or control or direct, directly or indirectly, 5% or more of our issued and outstanding shares. This information is based solely on our review of public filings as of the record date.
| Share class |
Name and address of beneficial holder |
Amount and nature of beneficial ownership/control/direction |
Percent of class | |||
| Common Shares |
FMR LLC and a joint filer(1) 82 Devonshire Street Boston, MA 02109 |
7,487,603(1) | 5.48%(2) |
| (1) | Based solely on the Schedule 13G/A filed with the SEC on February 14, 2014 by FMR LLC (FMR). Fidelity Management & Research Company (Fidelity), 245 Summer Street, Boston, Massachusetts 02210, a wholly-owned subsidiary of FMR and an investment adviser registered under Section 203 of the Investment Advisers Act of 1940, is the beneficial owner of 7,437,332 common shares as a result of acting as investment adviser to various investment companies (the funds). |
Edward C. Johnson 3rd and FMR, through its control of Fidelity, and the funds each has sole power to dispose of the 7,437,332 common shares owned by the funds. Mr. Johnson is Chairman of FMR. He and members of his family are the predominant owners, directly or through trusts, of 49% of the voting power of FMR and, as a result of a shareholders’ voting agreement, may be deemed, under the Investment Company Act of 1940, to form a controlling group with respect to FMR.
Neither FMR nor Mr. Johnson has the sole power to vote or direct the voting of the shares owned directly by the funds, which power resides with the funds’ Boards of Trustees. Fidelity carries out the voting of the shares under written guidelines established by the funds’ Boards of Trustees.
Strategic Advisers, Inc., 245 Summer Street, Boston, MA 02210, a wholly owned subsidiary of FMR and an investment adviser registered under Section 203 of the Investment Advisers Act of 1940, provides investment advisory services to individuals. As such, FMR’s beneficial ownership includes 1,171 common shares beneficially owned through Strategic Advisers, Inc.
Pyramis Global Advisors, LLC (Pyramis), 900 Salem Street, Smithfield, Rhode Island, 02917, an indirect wholly owned subsidiary of FMR and an investment adviser registered under Section 203 of the Investment Advisers Act of 1940, is the beneficial owner of 41,500 common shares as a result of its serving as investment adviser to institutional accounts, non-U.S. mutual funds, or investment companies registered under Section 8 of the Investment Company Act of 1940 owning such shares. Mr. Johnson and FMR, through its control of Pyramis, each has sole power to dispose of over 41,500 common shares and sole power to vote or to direct the voting of 41,500 common shares owned by the institutional accounts or funds advised by Pyramis.
Pyramis Global Advisors Trust Company (Pyramis Global Advisors Trust), 900 Salem Street, Smithfield, Rhode Island, 02917, an indirect wholly owned subsidiary of FMR and a bank as defined in Section 3(a)(6) of the Exchange Act, is the beneficial owner of 7,600 common shares as a result of its serving as investment manager of institutional accounts owning these shares. Mr. Johnson and FMR, through its control of Pyramis Global Advisors Trust, each has sole power to dispose of 7,600 common shares and to vote or direct the voting of 0 common shares owned by the institutional accounts managed by Pyramis Global Advisors Trust.
| (2) | Based on 136,700,308 common shares outstanding as of the record date (including the 291,180 common shares held by The TDL RSU Employee Benefit Plan Trust). |
Security Ownership of Management
The table below sets out information on the common shares beneficially owned by each of our directors, by our named executives, by each nominee for director, and by our directors and executive officers as a group. Individually and collectively, they own less than 1% of our outstanding common shares. Unless we note otherwise, each of the following people and their family members has sole voting and investment power with respect to the common shares beneficially owned by him or her.
56
Table of Contents
For the purpose of this table, the term executive officer has the same meaning as under Rule 405 promulgated under the U.S. Securities Act of 1933, as amended, and National Instrument 51-102 — Continuous Disclosure Obligations (NI 51-102). The information about beneficial ownership is based on data provided by each director, nominee or executive officer, and is included in insider reports that are publicly available on the System for Electronic Disclosure by Insiders.
| Share class |
Name of beneficial holder |
Common shares currently held(1) |
Common shares that can be acquired within 60 days(2) |
Total beneficial ownership |
Percent of class |
|||||||||||||
| Common shares |
Paul D. House | 114,835 | — | 114,835 | * | |||||||||||||
| M. Shan Atkins |
1,000 | — | 1,000 | * | ||||||||||||||
| Sherri A. Brillon |
— | — | — | * | ||||||||||||||
| Marc Caira |
— | — | — | * | ||||||||||||||
| Michael J. Endres |
52,884 | (3) | — | 52,884 | * | |||||||||||||
| Moya M. Greene |
— | — | — | * | ||||||||||||||
| The Hon. Frank Iacobucci |
6,663 | — | 6,663 | * | ||||||||||||||
| John A. Lederer |
15,120 | — | 15,120 | * | ||||||||||||||
| David H. Lees |
6,680 | — | 6,680 | * | ||||||||||||||
| Thomas V. Milroy |
— | — | — | * | ||||||||||||||
| Christopher R. O’Neill |
— | — | — | * | ||||||||||||||
| Wayne C. Sales |
12,067 | — | 12,067 | * | ||||||||||||||
| Cynthia J. Devine |
92,374 | — | 92,374 | * | ||||||||||||||
| David F. Clanachan |
57,789 | — | 57,789 | * | ||||||||||||||
| William A. Moir |
113,891 | — | 113,891 | * | ||||||||||||||
| Roland M. Walton |
73,389 | — | 73,389 | * | ||||||||||||||
| All directors and executive officers as a group (19 persons) |
556,113 | — | 556,113 | * | ||||||||||||||
| * | Represents beneficial ownership of less than 1% of our outstanding common shares. |
| (1) | Includes common shares owned directly or indirectly. See Director Ownership of Deferred Share Units, below for the number of deferred share units (DSUs) owned by each director as of the record date, which are not included in the table above. |
| (2) | See Incentive Plan Awards on page 4 and notes 2 and 3 to the summary compensation table on page 37 of this circular for more information about the outstanding restricted share units and stock options with tandem SARs held by the named executives. |
| (3) | Includes 49,000 common shares held in two trusts where Mr. Endres has voting and investment power. |
Ownership of Deferred Stock Units by Directors
The table below shows the DSUs held by our directors as of the record date. These DSUs are not included in the number of common shares beneficially owned by directors in the above table.
DSUs vest immediately and are paid out in cash when a director retires from the Board. Directors can count DSUs toward meeting our share ownership guidelines (see page 48 for more information).
| Director |
DSUs (#) | |||
| Paul D. House(1) |
625 | |||
| M. Shan Atkins |
11,466 | |||
| Sherri A. Brillon(2) |
919 | |||
| Marc Caira(3) |
0 | |||
| Michael J. Endres |
20,124 | |||
| Moya M. Greene |
14,781 | |||
| The Hon. Frank Iacobucci |
29,266 | |||
| John A. Lederer |
22,642 | |||
| David H. Lees |
22,533 | |||
| Thomas V. Milroy(2) |
919 | |||
| Christopher R. O’Neill(4) |
0 | |||
| Wayne C. Sales |
22,809 | |||
| (1) | Mr. House had not been eligible to receive director compensation, including DSUs, until 2014, because he served as President and Chief Executive Officer (CEO) until July 2, 2013, and provided transition services until December 31, 2013. |
| (2) | Ms. Brillon and Mr. Milroy were appointed to the Board on August 8, 2013. |
| (3) | Mr. Caira, as current President and CEO, is not eligible to receive director compensation, including DSUs. |
| (4) | Mr. O’Neill was appointed to the Board on March 11, 2014. |
57
Table of Contents
| Item 13. | Certain Relationships and Related Transactions, and Director Independence |
Related Party Transactions
Review and approval process
The Board has delegated responsibility to the Audit Committee for reviewing related party transactions.
The Committee has adopted a written policy for any transaction above $75,000 in any fiscal year, between us or any direct or indirect subsidiary and any of the following:
| • | any director or officer thereof or nominee for director thereof; |
| • | any immediate family member of a director or officer thereof or nominee for director or officer thereof; |
| • | any entity (A) in which any of the foregoing individuals has a direct or “indirect” legal or beneficial ownership interest (other than an interest that arises solely as a result of such individual’s ownership of less than 5% of the outstanding shares of a publicly-traded entity), or (B) which employs any of the foregoing individuals; or |
| • | any registered or beneficial holders of greater than 5% of the total number of outstanding shares of Tim Hortons, a director or officer or nominated director of Tim Hortons or one of our subsidiaries. |
The Committee will review and consider each related party transaction based on its consideration of all relevant facts and circumstances, to determine whether such transactions are in our best interests. If the Committee becomes aware of a related party transaction that has not been approved under the related party transaction policy, it will, once aware of the transaction, consider all relevant facts and circumstances and may ratify or cause the revision or termination of the transaction.
No member of the Committee that has a direct or indirect interest in a related party transaction will participate in the deliberations or vote for an approval or ratification of that transaction. In such a case, the affirmative vote of a majority of the disinterested members of the Committee is necessary to approve the transaction.
Certain transactions involving officers and directors in 2013
In 2013, none of our directors or executive officers, or nominated directors, or any of their associates or affiliates, had a direct or indirect material interest in a matter relating to us. Set forth below are continuing transactions reviewed by the Committee under our related party transaction policy.
A trust for the benefit of Mr. House is the sole shareholder of a company that purchased a shopping center property in Tottenham, Ontario, Canada from an unrelated third party in 1998. As part of the transaction, the company now leases a Tim Hortons restaurant to one of our subsidiaries. There is one year remaining on the lease, with the option to renew for two five-year terms. We paid $63,000 in rent to the company in fiscal 2013, and will pay that amount in 2014. We believe the terms of this lease are no less favourable than we could have obtained from an unrelated third party.
Mr. Milroy is Chief Executive Officer of BMO Capital Markets, an affiliate of BMO, and is responsible for all of BMO Financial Group’s businesses involving corporate, institutional and government clients in North America and globally. From time to time, we do business with BMO and its subsidiaries – as an example, BMO provides ordinary course banking (e.g. banker’s acceptances) and foreign exchange services to us. Bank of Montreal is also part of a lending syndicate (along with Royal Bank of Canada, The Toronto-Dominion Bank and The Bank of Nova Scotia) in connection with our Supplemental Senior Revolving Credit Facility Credit Agreement, dated as of October 4, 2013. All transactions between Tim Hortons and BMO were made in the ordinary course of business and were conducted on terms no less favourable than we could have obtained from an unrelated third party. Further, Mr. Milroy is not involved in BMO’s business with Tim Hortons, and the determination of his compensation at BMO is not affected by the existence or absence of any business relationship between us. We have also implemented various safeguards to address potential independence concerns which might arise from entering into transactions with the BMO Financial Group. Finally, Mr. Milroy has agreed to recuse himself from participating in meetings of the BMO Nesbitt Burns Inc. board of directors and our Board if participating in a meeting would or would reasonably likely present a conflict of interest.
Mr. O’Neill, appointed to our Board in March 2014, is Managing Director of Google Canada. From time to time, Tim Hortons and its subsidiaries do business with Google. For example, Tim Hortons, through its media agencies, purchases digital advertising from Google in the ordinary course of business, for insignificant amounts representing less than 0.1% of Google Inc.’s annual revenues. However, the determination of Mr. O’Neill’s compensation at Google is not affected by the existence or absence of any business relationship between us. Further, we have implemented various safeguards to address any potential independence concerns that might arise from entering into transactions with Google (for example, any non-ordinary course transactions with Google will be subject to prior approval). Mr. O’Neill has also agreed to recuse himself from participating in meetings of our Board if participating in a meeting would, or is reasonably likely to, present a conflict of interest.
58
Table of Contents
Director Independence
Avoiding Conflicts of Interest
Every year, each director must confirm in writing any actual or potential conflicts of interest to the Nominating and Corporate Governance Committee. If any such situation arises, then the Committee evaluates the matter and reports its assessment to the Board.
The Board consults with legal counsel, if necessary, to determine whether there is a conflict of interest between us and a director. A director must recuse himself or herself from any discussion or decision on any matter in which the director may have an actual or potential conflict of interest.
Independence
A substantial majority of our Board must be independent to comply with our governance guidelines, which require compliance with the independence requirements of the NYSE, the rules of the CSA and the listing standards of the TSX. All of our Committees must consist of only independent directors. The Board broadly defines a director as independent if he or she has no direct or indirect material relationship or business conflict with Tim Hortons, and otherwise meets the definition of “independence” under all applicable securities and stock exchange rules.
Members of the Audit Committee must also satisfy the increased independence standards for serving on audit committees established by the SEC and the rules of the CSA. Each member of the Human Resource and Compensation Committee must also be a non-employee director, as defined in Rule 16b-3 under the Exchange Act, and an outside director, as described under Section 162(m) of the Internal Revenue Code.
The Nominating and Corporate Governance Committee and the Board generally conduct director independence reviews every February, as well as whenever new Board or Committee appointments are proposed, such as last May when Mr. Caira was appointed to the Board; when Ms. Brillon and Mr. Milroy were each appointed to the Board (in August) and to the Audit Committee (in November); and when Mr. O’Neill was appointed to the Board in March 2014. The Board has confirmed that a substantial majority of the nominated directors (10 of 12) are independent, according to our independence criteria. All relevant facts and circumstances were considered, from the standpoint of the director and from that of any person or organization with which the director has an affiliation or association. The relevant independence considerations made by the Board and Committee are included under each director’s respective biography, beginning on page 4. Mr. Caira is not considered independent because of his position as our President and CEO. Mr. House, our non-executive Chairman, is not considered independent because he served as our President and CEO within the last three years. To foster and support the Board’s ability to function independently of management, in light of the Chairman not being considered independent, the Hon. Frank Iacobucci serves as our Lead Director. The Lead Director typically presides over executive sessions of the Board, consisting only of the independent directors and without management present. Executive sessions were held at each Board and Committee meeting this past year.
Serving on other Boards
Before a director accepts another directorship, he or she must consider whether that new position will compromise his/her ability to serve on our Board. Directors can serve on up to four other public company boards in addition to ours, without receiving prior approval from the Nominating and Corporate Governance Committee. He or she must, however, consult with the chair of the Nominating and Corporate Governance Committee to confirm that the position does not pose a conflict of interest or otherwise affect his/her independence. Members of our Audit Committee can serve on a maximum of two other audit committees, in addition to ours, without the Board’s approval. The Chairman and the CEO cannot accept a position as a director of another public company without the consent of our Board.
The Board does not have a specific policy prohibiting board interlocks (i.e. serving on multiple boards). However, the Nominating and Corporate Governance Committee and the Board consider interlocking or overlapping services when considering a potential director candidate, including potential conflicts of interest and/or any impact on director independence.
59
Table of Contents
Tim Horton Children’s Foundation
Since the Tim Horton Children’s Foundation (the Foundation) and Tim Hortons are very closely linked in terms of community presence and association, such that the various programs and activities of the Foundation have the potential to directly affect our brand and reputation, in May 2008, the Nominating and Corporate Governance Committee and the Board determined that it would be in Tim Hortons best interest for an independent member of the Board to also serve on the Foundation’s board of directors. The Nominating and Corporate Governance Committee and the Board determined that such simultaneous service would not create a conflict of interest or impair the independence of our Board members under our applicable independence requirements, and the Board adopted a Policy Regarding Independence Considerations of Service on the Board of the Tim Horton Children’s Foundation. After the adoption of this policy, Mr. Lederer was appointed to, and continues to serve on, the Foundation’s board of directors.
Executive Sessions
Pursuant to the Company’s Governance Guidelines, unless waived by all independent directors, the independent directors schedule and hold regular executive sessions (without management present) at every Board and committee meeting. The Lead Director, The Hon. Frank Iacobucci, presides at executive sessions of the independent directors, except where the principal matters to be considered are within the scope of authority of one of the other committee chairs.
Communications with the Board of Directors
Shareholders and other interested parties may contact the Board or one or more directors by sending a written communication addressed to the Board or to any one or more directors in care of Secretary, Tim Hortons Inc., 874 Sinclair Road, Oakville, Ontario, Canada, L6K 2Y1, in an envelope clearly marked “Shareholder and/or Other Interested Party Communication—Direct to Board of Directors” or by indicating instead the name of the specific director. The Secretary’s office will forward all such correspondence unopened to either The Hon. Frank Iacobucci, the Lead Director, or to another independent director as the Board may specify from time to time, or to the director specifically named on the outside of the envelope, if applicable. Additionally, the Board (or a Committee) periodically reviews our disclosure policy to address corporate communications with shareholders, employees, regulatory authorities and the media.
60
Table of Contents
| Item 14. | Principal Accounting Fees and Services |
Audit and Other Service Fees
The table below sets out the total fees billed or expected to be billed for professional services provided by PwC in 2013 and 2012 and any related out-of-pocket expenses.
| (in thousands) |
2013 | 2012 | ||||||
| Audit fees |
||||||||
| Includes services rendered for the audit of our annual consolidated financial statements included in our annual reports on Form 10-K for fiscal years 2013 and 2012, respectively; services rendered for the review of the consolidated financial statements included in our quarterly reports on Form 10-Q in fiscal years 2013 and 2012, respectively; services rendered with respect to our 2013 offering memorandum related to an offering, on a private placement basis, of Senior Unsecured Notes, Series 2, due December 1, 2023; and other audit services normally provided by PwC in connection with statutory and regulatory filings or engagements. | $ | 1,876 | $ | 1,630 | ||||
|
|
|
|
|
|||||
| Audit-related fees |
||||||||
| Includes assurance and related services reasonably related to the performance of the audit or review of our financial statements not reported as “audit fees”. Audit-related fees also include fees for accounting research, as well as audit and accounting services provided to our advertising funds that collect and administer funds contributed for use in advertising and promotional programs for our corporation and restaurant owners. In addition, these amounts include fees for the audit or review of the financial statements of certain of our subsidiaries and our pension funds, consultations with management as to the accounting or disclosure treatment of certain transactions and/or events, and the actual or potential impact of final or proposed accounting rules and standards. | 397 | 398 | ||||||
|
|
|
|
|
|||||
| Tax fees |
||||||||
| For 2013 and 2012, these fees were for services related primarily to tax planning in connection with subsidiary reorganizations, transaction-specific tax implications and submissions to government authorities. | 299 | 126 | ||||||
|
|
|
|
|
|||||
| All other fees |
||||||||
| Includes use of PwC software by our employees for accounting research and financial reporting disclosure. |
27 | 28 | ||||||
|
|
|
|
|
|||||
| Total |
$ | 2,599 | $ | 2,182 | ||||
|
|
|
|
|
|||||
Pre-approval policy
The Audit Committee pre-approves the audit, audit-related and non-audit services and fees to be provided by the independent auditor prior to any formal engagement, as well as the terms and fees for the annual audit, review or attestation, and must also approve any change to the terms, conditions and fees resulting from a change to the scope of the audit or other matters. The Committee must separately pre-approve any other services. Services that are prohibited and may not be performed by the independent auditor are set out in the policy, and compliance is monitored by management, our independent auditor and the Audit Committee.
The Audit Committee cannot delegate to management any responsibilities for pre-approving services to be performed by the independent auditor. No services were provided by our independent auditor in 2013 that were approved by the Audit Committee under SEC Regulation S-X Rule 2-01(c)(7)(i)(C) or National Instrument 52-110—Audit Committees, Section 2.4, which addresses certain de minimis services that may be approved by the Audit Committee after they have been performed.
Report presented by the Audit Committee
Michael J. Endres (Chair)
Sherri A. Brillon
Moya M. Greene
David H. Lees
Thomas V. Milroy
61
Table of Contents
PART IV
| Item 15. | Exhibits, Financial Statement Schedules |
(b) Exhibits filed with this report are listed in the Index to Exhibits beginning on page 64.
62
Table of Contents
Pursuant to the requirements of Section 13 or 15(d) of the Securities Exchange Act of 1934, the Registrant has duly caused this report to be signed on its behalf by the undersigned, thereunto duly authorized.
| TIM HORTONS INC. | ||||
| By: | /s/ MARC CAIRA | 3/21/14 | ||
| Marc Caira | ||||
| President and Chief Executive Officer | ||||
Pursuant to the requirements of the Securities Exchange Act of 1934, this report has been signed below by the following persons on behalf of the Registrant and in the capacities and on the dates indicated.
| /s/ MARC CAIRA | 3/21/14 | /s/ CYNTHIA J. DEVINE | 3/21/14 | |||||
| Marc Caira President and Chief Executive Officer |
Cynthia J. Devine Chief Financial Officer and Principal Accounting Officer |
|||||||
| /s/ M. SHAN ATKINS* | 3/21/14 | /s/ SHERRI A. BRILLON* | 3/21/14 | |||||
| M. Shan Atkins, Director | Sherri A. Brillon, Director | |||||||
| /s/ MICHAEL J. ENDRES* | 3/21/14 | /s/ MOYA M. GREENE* | 3/21/14 | |||||
| Michael J. Endres, Director | Moya M. Greene, Director | |||||||
| /s/ PAUL D. HOUSE* | 3/21/14 | /s/ FRANK IACOBUCCI* | 3/21/14 | |||||
| Paul D. House, Chairman of the Board | Frank Iacobucci, Lead Director | |||||||
| /s/ JOHN A. LEDERER* | 3/21/14 | /s/ DAVID H. LEES* | 3/21/14 | |||||
| John A. Lederer, Director | David H. Lees, Director | |||||||
| /s/ THOMAS V. MILROY* | 3/21/14 | /s/ CHRISTOPHER R. O’NEILL* | 3/21/14 | |||||
| Thomas V. Milroy, Director | Christopher R. O’Neill, Director | |||||||
| /s/ WAYNE C. SALES* | 3/21/14 |
|
| |||||
| Wayne C. Sales, Director | ||||||||
|
|
|
*By: | /s/ MARC CAIRA | 3/21/14 | ||||
| Marc Caira Attorney-in-Fact |
||||||||
63
Table of Contents
TIM HORTONS INC. AND SUBSIDIARIES
INDEX TO EXHIBITS
| Exhibit |
Description |
Where found | ||
| 2(a) | Agreement and Plan of Merger, dated August 6, 2009, by and among the Registrant, THI Mergeco Inc., and Tim Hortons Inc. | Incorporated herein by reference to Annex A of the definitive proxy statement of Tim Hortons Inc. filed with the Commission on August 17, 2009 (File No. 001-32843). | ||
| 3(a) | Articles of Incorporation of the Registrant, as amended | Incorporated herein by reference to Exhibit 3.1 to the Current Report on Form 8-K of Tim Hortons Inc. filed with the Commission on September 28, 2009 (File No. 000-53793). | ||
| 3(b) | By-Law No. 1 of the Registrant | Incorporated herein by reference to Annex C of the definitive proxy statement of Tim Hortons Inc. filed with the Commission on August 17, 2009 (File No. 001-32843). | ||
| 4(a) | Shareholder Rights Plan Agreement, dated August 6, 2009, between the Registrant and Computershare Trust Company of Canada, as Rights Agent | Incorporated herein by reference to Annex D of the definitive proxy statement of Tim Hortons Inc. filed with the Commission on August 17, 2009 (File No. 001-32843). | ||
| 4(b) | Trust Indenture, dated June 1, 2010, by and between the Registrant and BNY Trust Company of Canada, as trustee | Incorporated herein by reference to Exhibit 4.1 to the Current Report on Form 8-K of the Registrant filed with the Commission on June 1, 2010 (File No. 001-32843). | ||
| 4(c) | First Supplemental Trust Indenture, dated June 1, 2010, by and between the Registrant and BNY Trust Company of Canada, as trustee | Incorporated herein by reference to Exhibit 4.2 to the Current Report on Form 8-K of the Registrant filed with the Commission on June 1, 2010 (File No. 001-32843). | ||
| 4(d) | First (Reopening) Supplemental Trust Indenture, dated December 1, 2010, by and between the Registrant and BNY Trust Company of Canada, as trustee | Incorporated herein by reference to Exhibit 4.1 to the Current Report on Form 8-K of the Registrant filed with the Commission on December 1, 2010 (File No. 001-32843). | ||
| 4(e) | Supplement to Guarantee, dated December 1, 2010, from The TDL Group Corp. | Incorporated herein by reference to Exhibit 4.2 to the Current Report on Form 8-K of the Registrant filed with the Commission on December 1, 2010 (File No. 001-32843). | ||
| 4(f) | Second Supplemental Trust Indenture, dated November 29, 2013, by and between the Corporation and BNY Trust Company of Canada, as trustee | Incorporated herein by reference to Exhibit 4.1 of the Current Report on Form 8-K of Tim Hortons Inc. filed with the Commission on December 5, 2013 (File No. 001-32843). | ||
| 4(g) | Supplement to Guarantee, dated November 29, 2013, from The TDL Group Corp. in favor of BNY Trust Company of Canada, as trustee | Incorporated herein by reference to Exhibit 4.2 of the Current Report on Form 8-K of Tim Hortons Inc. filed with the Commission on December 5, 2013 (File No. 001-32843). | ||
| 10(a) | Senior Revolving Credit Facility Agreement, dated as of December 13, 2010, among the Registrant and The TDL Group Corp., as borrowers, and certain lenders and agents named therein | Incorporated herein by reference to Exhibit 10.1 to the Current Report on Form 8-K of the Registrant filed with the Commission on December 16, 2010 (File No. 001-32843). | ||
64
Table of Contents
| Exhibit |
Description |
Where found | ||
| 10(b) | Amendment to Senior Revolving Credit Facility Agreement, dated as of January 26, 2012, among the Registrant and The TDL Group Corp., as borrowers, and certain lenders and agents named herein | Incorporated herein by reference to Exhibit 10.1 to the Current Report on Form 8-K of the Registrant filed with the Commission on February 1, 2012 (File No. 001-32843). | ||
| 10(c) | Senior Revolving Facility Credit Agreement, dated as of October 4, 2013, between the Corporation, and certain lenders and agents named therein | Incorporated herein by reference to Exhibit 10.1 to the Current Report on Form 8-K of the Registrant filed with the Commission on October 9, 2013 (File No. 001-32843). | ||
| *10(d) | Form of Indemnification Agreement for directors, officers and others, as applicable | Incorporated herein by reference to Exhibit 10.2 to the Current Report on Form 8-K of the Registrant filed with the Commission on September 28, 2009 (File No. 000-53793). | ||
| *10(e) | Form of Employment Agreement, as amended, by and among The TDL Group Corp., the Registrant and Paul D. House | Incorporated herein by reference to Exhibit 10.3 to the Current Report on Form 8-K of the Registrant filed with the Commission on September 28, 2009 (File No. 000-53793). | ||
| *10(f) | Form of First Amendment to Employment Agreement by and among The TDL Group Corp., the Registrant and each of Paul D. House and Donald B. Schroeder | Incorporated herein by reference to Exhibit 10(z) to Amendment No. 1 to the Annual Report on Form 10-K for the fiscal year ended January 3, 2010 filed with the Commission on April 1, 2010 (File No. 001-32843). | ||
| *10(g) | Second Amendment to Employment Agreement, dated March 22, 2012, by and between The TDL Group Corp., the Registrant and Paul D. House | Incorporated herein by reference to Exhibit 10.1 to the Current Report on Form 8-K of the Registrant filed with the Commission on March 23, 2012 (File No. 001-32843). | ||
| *10(h) | Severance Agreement and Final Release, effective as of May 31, 2011, by and between Tim Hortons Inc. and Donald B. Schroeder | Incorporated herein by reference to Exhibit 10.1 to the Current Report on Form 8-K of the Registrant filed with the Commission on June 6, 2011 (File No. 001-32843). | ||
| *10(i) | Form of Employment Agreement by and among The TDL Group Corp., the Registrant and each of Cynthia J. Devine, William A. Moir and Roland M. Walton, respectively | Incorporated herein by reference to Exhibit 10.5 to the Current Report on Form 8-K of the Registrant filed with the Commission on September 28, 2009 (File No. 000-53793). | ||
| *10(j) | Form of First Amendment to Employment Agreement by and among The TDL Group Corp., the Registrant and each of Cynthia J. Devine, William A. Moir, Roland M. Walton and David F. Clanachan, dated effective February 24, 2010 | Incorporated herein by reference to Exhibit 10(g) to the Annual Report on Form 10-K of the Registrant filed with the Commission on March 4, 2010 (File No. 001-32843). | ||
| *10(k) | Form of Employment Agreement by and among The TDL Group Corp., the Registrant and David F. Clanachan | Incorporated herein by reference to Exhibit 10.6 to the Current Report on Form 8-K of the Registrant filed with the Commission on September 28, 2009 (File No. 000-53793). | ||
| *10(l) | Form of Retention Agreement by and between the Company and David F. Clanachan, Cynthia J. Devine, William A. Moir, Roland M. Walton and certain other members of senior management | Incorporated herein by reference to Exhibit 10.1 to the Current Report on Form 8-K of the Registrant filed with the Commission on August 9, 2012 (File No. 001-32843). | ||
| *10(m) | Letter Agreement dated as of August 8, 2012 by and between the Company and William A. Moir | Incorporated herein by reference to Exhibit 10.2 to the Current Report on Form 8-K of the Registrant filed with the Commission on August 9, 2012 (File No. 001-32843). | ||
65
Table of Contents
| Exhibit |
Description |
Where found | ||
| *10(n) | Employment (and Post-Employment) Covenants Agreement dated as of August 8, 2012 by and between the Company and William A. Moir | Incorporated herein by reference to Exhibit 10.3 to the Current Report on Form 8-K of the Registrant filed with the Commission on August 9, 2012 (File No. 001-32843). | ||
| *10(o) | 2006 Stock Incentive Plan, as amended effective February 24, 2010 | Incorporated herein by reference to Exhibit 10(h) to the Annual Report on Form 10-K of the Registrant filed with the Commission on March 4, 2010 (File No. 001-32843). | ||
| *10(p) | 2012 Stock Incentive Plan | Incorporated herein by reference to Exhibit 10.1 to the Current Report on Form 8-K of the Registrant filed with the Commission on May 10, 2012 (File No. 001-32843). | ||
| *10(q) | Executive Annual Performance Plan, as amended effective November 6, 2013 | Incorporated herein by reference to Exhibit 10(q) to the Annual Report on Form 10-K of the Registrant filed with the Commission on February 25, 2014 (File No. 001-32843). | ||
| *10(r) | Amended and Restated Supplemental Executive Retirement Plan, adopted to be effective January 1,2009 and most recently amended on May 8, 2013 | Incorporated herein by reference to Exhibit 10(d) to the Quarterly Report on Form 10-Q of the Registrant filed with the Commission on August 8, 2013 (File No. 001-32843). | ||
| *10(s) | Amended and Restated Non-Employee Director Deferred Stock Unit Plan effective September 28, 2009, as further amended and restated effective February 21, 2013 | Incorporated herein by reference to Exhibit 10(r) to the Annual Report on Form 10-K of the Registrant filed with the Commission on February 21, 2013 (File No. 001-32843). | ||
| *10(t) | Equity Plan Assignment and Assumption Agreement, dated September 25, 2009, by and between Tim Hortons Inc., and the Registrant | Incorporated herein by reference to Exhibit 10.11 to the Current Report on Form 8-K of the Registrant filed with the Commission on September 28, 2009 (File No. 000-53793). | ||
| *10(u) | Assignment, Assumption and Amendment of Tim Hortons Inc. U.S. Non-Employee Directors’ Deferred Compensation Plan, dated September 25, 2009, by and between Tim Hortons Inc. and Tim Hortons USA Inc. | Incorporated herein by reference to Exhibit 10.12 to the Current Report on Form 8-K of the Registrant filed with the Commission on September 28, 2009 (File No. 000-53793). | ||
| *10(v) | Form of Amended and Restated Deferred Stock Unit Award Agreement (Canadian) | Incorporated herein by reference to Exhibit 10.13 to the Current Report on Form 8-K of the Registrant filed with the Commission on September 28, 2009 (File No. 000-53793). | ||
| *10(w) | Form of Amended and Restated Deferred Stock Unit Award Agreement (U.S.) | Incorporated herein by reference to Exhibit 10.14 to the Current Report on Form 8-K of the Registrant filed with the Commission on September 28, 2009 (File No. 000-53793). | ||
| 10(x) | Form of Tax Sharing Agreement between Tim Hortons Inc. and Wendy’s International, Inc. dated March 29, 2006 | Incorporated herein by reference to Exhibit 10.3 to Form S-1/A filed with the Commission on February 27, 2006 (File No. 333-130035). | ||
| 10(y) | Amendment No. 1 to Tax Sharing Agreement between Tim Hortons Inc. and Wendy’s International, Inc., dated November 7, 2007 | Incorporated herein by reference to Exhibit 10(b) to Form 10-Q for the quarter ended September 30, 2007 filed with the Commission on November 8, 2007 (File No. 001-32843). | ||
| *10(z) | Form of Restricted Stock Unit Award Agreement (2010 Award) | Incorporated herein by reference to Exhibit 10(a) to Form 10-Q for the quarter ended July 4, 2010 of the Registrant filed with the Commission on August 12, 2010 (File No. 001-32843). | ||
66
Table of Contents
| Exhibit |
Description |
Where found | ||
| *10(aa) | Form of Nonqualified Stock Option Award Agreement (2010 Award) | Incorporated herein by reference to Exhibit 10(b) to Form 10-Q for the quarter ended July 4, 2010 of the Registrant filed with the Commission on August 12, 2010 (File No. 001-32843). | ||
| *10(bb) | Form of Restricted Stock Unit Award Agreement (2010 Performance Award-Named Executive Officers) | Incorporated herein by reference to Exhibit 10(aa) to Amendment No. 1 to the Annual Report on Form 10-K for the fiscal year ended January 3, 2010 filed with the Commission on April 1, 2010 (File No. 001-32843). | ||
| *10(cc) | Form of Restricted Stock Unit Award Agreement (2011 Award) | Incorporated herein by reference to Exhibit 10(a) to the Quarterly Report on Form 10-Q of the Registrant filed with the Commission on August 11, 2011 (File No. 001-32843). | ||
| *10(dd) | Form of Nonqualified Stock Option Award Agreement (2011 Award) | Incorporated herein by reference to Exhibit 10(b) to the Quarterly Report on Form 10-Q of the Registrant filed with the Commission on August 11, 2011 (File No. 001-32843). | ||
| *10(ee) | Form of Restricted Stock Unit Award Agreement (2012 Award) | Incorporated herein by reference to Exhibit 10(b) to the Quarterly Report on Form 10-Q of the Registrant filed with the Commission on August 9, 2012 (File No. 001-32843). | ||
| *10(ff) | Form of Nonqualified Stock Option Award Agreement (2012 Award) | Incorporated herein by reference to Exhibit 10(c) to the Quarterly Report on Form 10-Q of the Registrant filed with the Commission on August 9, 2012 (File No. 001-32843). | ||
| 10(gg) | Acknowledgment, dated as of October 29, 2010, by and among CillRyan’s Bakery Limited, Prophy and Fosters Star Limited | Incorporated herein by reference to Exhibit 10(y) to the Annual Report on Form 10-K for fiscal year ended January 2, 2011 filed with the Commission on February 25, 2011 (File No. 001-32843). | ||
| *10(hh) | Employment Offer Letter by and between Tim Hortons Inc. and Marc Caira | Incorporated herein by reference to Exhibit 10.1 to the Current Report on Form 8-K of the Registrant filed with the Commission on May 14, 2013 (File No. 001-32843). | ||
| *10(ii) | Employment and Post-Employment Covenants Agreement by and between Tim Hortons Inc. and Marc Caira | Incorporated herein by reference to Exhibit 10.2 to the Current Report on Form 8-K of the Registrant filed with the Commission on May 14, 2013 (File No. 001-32843). | ||
| *10(jj) | Change in Control Agreement by and between Tim Hortons Inc. and Marc Caira | Incorporated herein by reference to Exhibit 10.3 to the Current Report on Form 8-K of the Registrant filed with the Commission on May 14, 2013 (File No. 001-32843). | ||
| *10(kk) | Nonqualified Stock Option Award Agreement, dated August 13, 2013, between Tim Hortons Inc. and Marc Caira | Incorporated herein by reference to Exhibit 10(a) to the Quarterly Report on Form 10-Q of the Registrant filed with the Commission on November 7, 2013 (File No. 001-32843). | ||
| *10(ll) | Restricted Stock Unit Award Agreement, dated August 13, 2013, between Tim Hortons Inc. and Marc Caira | Incorporated herein by reference to Exhibit 10(b) to the Quarterly Report on Form 10-Q of the Registrant filed with the Commission on November 7, 2013 (File No. 001-32843). | ||
67
Table of Contents
| Exhibit |
Description |
Where found | ||
| *10(mm) | Form of Restricted Stock Unit Award Agreement (2013 Award) | Incorporated herein by reference to Exhibit 10(b) to the Quarterly Report on Form 10-Q of the Registrant filed with the Commission on May 8, 2013 (File No. 001-32843). | ||
| *10(nn) | Form of Nonqualified Stock Option Award Agreement (2013 Award) | Incorporated herein by reference to Exhibit 10(c) to the Quarterly Report on Form 10-Q of the Registrant filed with the Commission on May 8, 2013 (File No. 001-32843). | ||
| 21 | Subsidiaries of the Registrant | Filed as Exhibit 21 to the Annual Report on Form 10-K for the fiscal year ended December 29, 2013 of the Registrant filed with the Commission on February 25, 2014 (File No. 001-32843). | ||
| 23 | Consent of PricewaterhouseCoopers LLP | Filed as Exhibit 23 to the Annual Report on Form 10-K for the fiscal year ended December 29, 2013 of the Registrant filed with the Commission on February 25, 2014 (File No. 001-32843). | ||
| 31(a) | Rule 13a-14(a)/15d-14(a) Certification of Chief Executive Officer | Filed as Exhibit 31(a) to the Annual Report on Form 10-K for the fiscal year ended December 29, 2013 of the Registrant filed with the Commission on February 25, 2014 (File No. 001-32843). | ||
| 31(b) | Rule 13a-14(a)/15d-14(a) Certification of Chief Financial Officer | Filed as Exhibit 31(b) to the Annual Report on Form 10-K for the fiscal year ended December 29, 2013 of the Registrant filed with the Commission on February 25, 2014 (File No. 001-32843). | ||
| 31(c) | Rule 13a-14(a)/15d-14(a) Certification of Chief Executive Officer, relating to this Amendment No. 1 on Form 10-K/A | Filed herewith. | ||
| 31(d) | Rule 13a-14(a)/15d-14(a) Certification of Chief Financial Officer, relating to this Amendment No. 1 on Form 10-K/A | Filed herewith. | ||
| 32(a) | Section 1350 Certification of Chief Executive Officer | Filed as Exhibit 32(a) to the Annual Report on Form 10-K for the fiscal year ended December 29, 2013 of the Registrant filed with the Commission on February 25, 2014 (File No. 001-32843). | ||
| 32(b) | Section 1350 Certification of Chief Financial Officer | Filed as Exhibit 32(b) to the Annual Report on Form 10-K for the fiscal year ended December 29, 2013 of the Registrant filed with the Commission on February 25, 2014 (File No. 001-32843). | ||
| 32(c) | Section 1350 Certification of Chief Executive Officer, relating to this Amendment No. 1 on Form 10-K/A | Filed herewith. | ||
| 32(d) | Section 1350 Certification of Chief Financial Officer, relating to this Amendment No. 1 on Form 10-K/A | Filed herewith. | ||
| 99 | Safe Harbor under the Private Securities Litigation Reform Act 1995 and Canadian securities laws | Filed herewith. | ||
| 101.INS | XBRL Instance Document. | Filed as Exhibit 101.INS to the Annual Report on Form 10-K for the fiscal year ended December 29, 2013 of the Registrant filed with the Commission on February 25, 2014 (File No. 001-32843). | ||
68
Table of Contents
| Exhibit |
Description |
Where found | ||
| 101.SCH | XBRL Taxonomy Extension Schema Document. | Filed as Exhibit 101.SCH to the Annual Report on Form 10-K for the fiscal year ended December 29, 2013 of the Registrant filed with the Commission on February 25, 2014 (File No. 001-32843). | ||
| 101.CAL | XBRL Taxonomy Extension Calculation Linkbase Document. | Filed as Exhibit 101.CAL to the Annual Report on Form 10-K for the fiscal year ended December 29, 2013 of the Registrant filed with the Commission on February 25, 2014 (File No. 001-32843). | ||
| 101.DEF | XBRL Taxonomy Extension Definition Linkbase Document. | Filed as Exhibit 101.DEF to the Annual Report on Form 10-K for the fiscal year ended December 29, 2013 of the Registrant filed with the Commission on February 25, 2014 (File No. 001-32843). | ||
| 101.LAB | XBRL Taxonomy Extension Label Linkbase Document. | Filed as Exhibit 101.LAB to the Annual Report on Form 10-K for the fiscal year ended December 29, 2013 of the Registrant filed with the Commission on February 25, 2014 (File No. 001-32843). | ||
| 101.PRE | XBRL Taxonomy Extension Presentation Linkbase Document. | Filed as Exhibit 101.PRE to the Annual Report on Form 10-K for the fiscal year ended December 29, 2013 of the Registrant filed with the Commission on February 25, 2014 (File No. 001-32843). | ||
| * | Denotes management contract or compensatory arrangement. |
Attached as Exhibit 101 to this report are documents formatted in XBRL (Extensible Business Reporting Language). The financial information contained in the XBRL-related documents is “unaudited” and/or “unreviewed.”
69