Attached files
| file | filename |
|---|---|
| 8-K - FORM 8-K - VECTOR GROUP LTD | v372008_8k.htm |

Summary Historical Financial Data 0 ($ Millions) Vector Adjusted Revenues Reconciliation Source: Company filings. Note: Separate components may not foot due to rounding. (1) Represents revenues of Douglas Elliman Realty, LLC for the year ended December 31, 2011, the year ended December 31, 2012 and for the period from January 1, 2013 to December 13, 2013. On December 13, 2013, the Company increased its ownership of Douglas Elliman Realty, LLC from 50% to 70.59%. Consequently, after December 13, 2013, the Company consolidates the operations and financial position of Douglas Elliman Realty, LLC in its financial statements. The Company had previously accounted for its interest in Douglas Elliman Realty, LLC under the equity method and revenues from Douglas Elliman Realty, LLC was not included in the Company's revenues prior to December 13, 2013. (2) Amounts represent one - time purchase accounting adjustments to fair value for deferred revenues recorded in connection with the increase of the Company's ownership of Douglas Elliman Realty, LLC on December 13, 2013. FYE Dec. 31, 2011 2012 2013 Revenues $1,133.4 $1,084.5 $1,056.2 Reclassification of Revenues as a Result of Consolidation of Douglas Elliman (1) 346.3 378.2 416.5 Purchase Accounting Adjustments (2) - - 1.4 Total Adjustments $346.3 $378.2 $417.8 Pro-Forma Adjusted Revenues $1,479.7 $1,462.7 $1,474.0
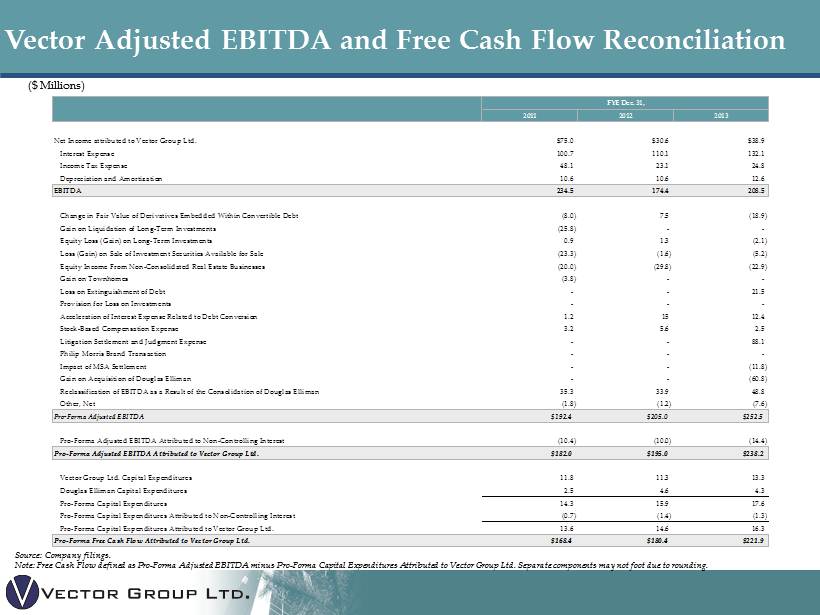
Summary Historical Financial Data 1 ($ Millions) Vector Adjusted EBITDA and Free Cash Flow Reconciliation Source: Company filings. Note: Free Cash Flow defined as Pro - Forma Adjusted EBITDA minus Pro - Forma Capital Expenditures Attributed to Vector Group Ltd . Separate components may not foot due to rounding. FYE Dec. 31, 2011 2012 2013 Net Income attributed to Vector Group Ltd. $75.0 $30.6 $38.9 Interest Expense 100.7 110.1 132.1 Income Tax Expense 48.1 23.1 24.8 Depreciation and Amortization 10.6 10.6 12.6 EBITDA 234.5 174.4 208.5 Change in Fair Value of Derivatives Embedded Within Convertible Debt (8.0) 7.5 (18.9) Gain on Liquidation of Long-Term Investments (25.8) - - Equity Loss (Gain) on Long-Term Investments 0.9 1.3 (2.1) Loss (Gain) on Sale of Investment Securities Available for Sale (23.3) (1.6) (5.2) Equity Income From Non-Consolidated Real Estate Businesses (20.0) (29.8) (22.9) Gain on Townhomes (3.8) - - Loss on Extinguishment of Debt - - 21.5 Provision for Loss on Investments - - - Acceleration of Interest Expense Related to Debt Conversion 1.2 15 12.4 Stock-Based Compensation Expense 3.2 5.6 2.5 Litigation Settlement and Judgment Expense - - 88.1 Philip Morris Brand Transaction - - - Impact of MSA Settlement - - (11.8) Gain on Acquisition of Douglas Elliman - - (60.8) Reclassification of EBITDA as a Result of the Consolidation of Douglas Elliman 35.3 33.9 48.8 Other, Net (1.8) (1.2) (7.6) Pro-Forma Adjusted EBITDA $192.4 $205.0 $252.5 Pro-Forma Adjusted EBITDA Attributed to Non-Controlling Interest (10.4) (10.0) (14.4) Pro-Forma Adjusted EBITDA Attributed to Vector Group Ltd. $182.0 $195.0 $238.2 Vector Group Ltd. Capital Expenditures 11.8 11.3 13.3 Douglas Elliman Capital Expenditures 2.5 4.6 4.3 Pro-Forma Capital Expenditures 14.3 15.9 17.6 Pro-Forma Capital Expenditures Attributed to Non-Controlling Interest (0.7) (1.4) (1.3) Pro-Forma Capital Expenditures Attributed to Vector Group Ltd. 13.6 14.6 16.3 Pro-Forma Free Cash Flow Attributed to Vector Group Ltd. $168.4 $180.4 $221.9
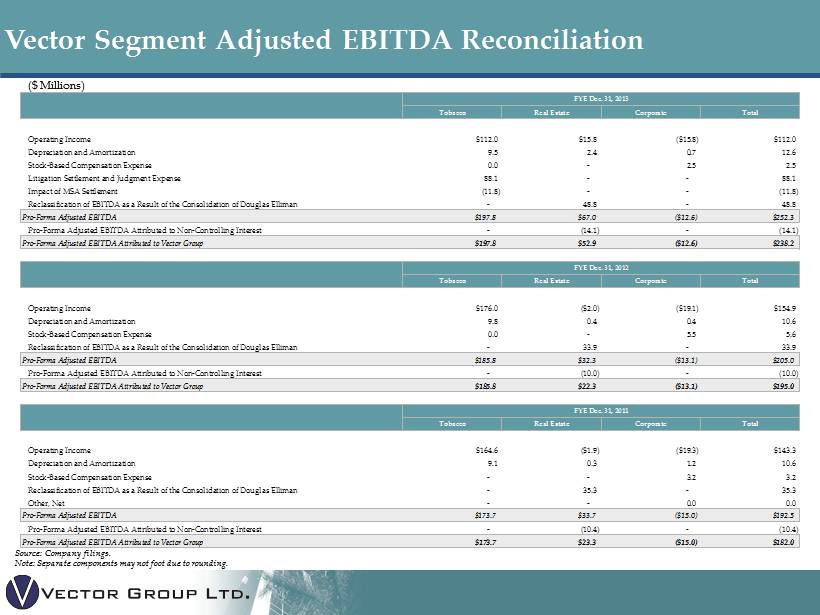
Summary Historical Financial Data 2 ($ Millions) Vector Segment Adjusted EBITDA Reconciliation Source: Company filings . Note: Separate components may not foot due to rounding. FYE Dec. 31, 2013 Tobacco Real Estate Corporate Total Operating Income $112.0 $15.8 ($15.8) $112.0 Depreciation and Amortization 9.5 2.4 0.7 12.6 Stock-Based Compensation Expense 0.0 - 2.5 2.5 Litigation Settlement and Judgment Expense 88.1 - - 88.1 Impact of MSA Settlement (11.8) - - (11.8) Reclassification of EBITDA as a Result of the Consolidation of Douglas Elliman - 48.8 - 48.8 Pro-Forma Adjusted EBITDA $197.8 $67.0 ($12.6) $252.3 Pro-Forma Adjusted EBITDA Attributed to Non-Controlling Interest - (14.1) - (14.1) Pro-Forma Adjusted EBITDA Attributed to Vector Group $197.8 $52.9 ($12.6) $238.2 FYE Dec. 31, 2012 Tobacco Real Estate Corporate Total Operating Income $176.0 ($2.0) ($19.1) $154.9 Depreciation and Amortization 9.8 0.4 0.4 10.6 Stock-Based Compensation Expense 0.0 - 5.5 5.6 Reclassification of EBITDA as a Result of the Consolidation of Douglas Elliman - 33.9 - 33.9 Pro-Forma Adjusted EBITDA $185.8 $32.3 ($13.1) $205.0 Pro-Forma Adjusted EBITDA Attributed to Non-Controlling Interest - (10.0) - (10.0) Pro-Forma Adjusted EBITDA Attributed to Vector Group $185.8 $22.3 ($13.1) $195.0 FYE Dec. 31, 2011 Tobacco Real Estate Corporate Total Operating Income $164.6 ($1.9) ($19.3) $143.3 Depreciation and Amortization 9.1 0.3 1.2 10.6 Stock-Based Compensation Expense - - 3.2 3.2 Reclassification of EBITDA as a Result of the Consolidation of Douglas Elliman - 35.3 - 35.3 Other, Net - - 0.0 0.0 Pro-Forma Adjusted EBITDA $173.7 $33.7 ($15.0) $192.5 Pro-Forma Adjusted EBITDA Attributed to Non-Controlling Interest - (10.4) - (10.4) Pro-Forma Adjusted EBITDA Attributed to Vector Group $173.7 $23.3 ($15.0) $182.0