Attached files
| file | filename |
|---|---|
| 8-K - 8-K - Voya Financial, Inc. | d693823d8k.htm |
| EX-99.1 - EX-99.1 - Voya Financial, Inc. | d693823dex991.htm |
 March 2014
ING U.S. Follow-On Equity Offering
ING U.S.
America’s Retirement Company™
Exhibit 99.2
RETIREMENT •
INVESTMENTS •
INSURANCE
Making a secure financial future possible – one person, one family, one institution at a
time |
 2
Note Regarding Forward-Looking Statements and Use
of Non-GAAP Financial Measures
This document contains forward-looking statements. Forward-looking
statements include statements relating to future developments in our
business or expectations for our future financial performance and any
statement not involving a historical fact. Forward-looking statements use words such as
“anticipate,”
“believe,”
“estimate,”
“expect,”
“intend,”
“plan,”
and other words and terms of similar
meaning in connection with a discussion of future operating or financial
performance. Actual results, performance
or
events
may
differ
materially
from
those
projected
in
any
forward-looking
statement
due to, among other things, (i) general economic conditions, particularly economic
conditions in our core markets, (ii) performance of financial markets,
including emerging markets, (iii) the frequency and severity of insured loss
events, (iv) mortality and morbidity levels, (v) persistency and lapse
levels, (vi) interest rates, (vii) currency exchange rates, (viii) general
competitive factors, (ix) changes in laws and regulations and (x) changes in
the policies of governments and/or regulatory authorities. Factors that may
cause actual results to differ from those in any forward-looking
statement
also
include
those
described
under
“Risk
Factors,”
“Management’s
Discussion
and
Analysis
of
Results
of
Operations
and
Financial
Condition—Trends
and
Uncertainties”
and
“Business—Closed Blocks—CBVA”
in ING U.S., Inc.’s registration statement on Form S-1 filed with
the SEC. ING U.S., Inc. assumes no obligation to update any forward-looking
information contained in this document.
Unless otherwise noted, the financial information included herein was determined in
accordance with U.S. GAAP. All dollar figures are presented in millions
unless otherwise noted. All references to “ROE”;
“ROC”
or
“Operating
ROE”
and
“Operating
ROC”
refer
to
Ongoing
Business
(which
excludes
Closed Blocks and Corporate), unless otherwise noted. “ROE”;
“ROC”; “Ongoing Business Operating ROE”; “Ongoing
Business Operating ROC”; “Ongoing Business Adjusted Operating
Earnings
Before
Interest
and
Income
Taxes”
and
“Financial
Leverage”
are
non-GAAP
financial
measures. The reconciliation of such measures to the most comparable GAAP measure
in accordance
with
Regulation
G
is
included
under
“Business
–
Operating
Return
on
Capital
Goal”
in
ING U.S., Inc.’s registration statement on Form S-1 filed with the SEC or
the Appendix hereto. 2
Retirement •
Investments •
Insurance |
 Offering Summary
3
Company
ING U.S., Inc. (“ING U.S.”)
Exchange / Ticker
NYSE / VOYA
Selling Shareholder
ING Groep N.V.
Shares Offered
[33 –
36 million]
Primary / Secondary
100% Secondary
Underwriters’
Option
[15% Greenshoe (Secondary)]
Joint Global
Coordinators
Morgan
Stanley,
Goldman,
Sachs
&
Co.,
Citigroup,
Bank
of
America
Merrill
Lynch
Expected Pricing
Week of March 17
3
Retirement •
Investments •
Insurance |
 Office
of the CEO Rod Martin
Chief Executive Officer
Alain Karaoglan
Chief Operating Officer
Ewout Steenbergen
Chief Financial Officer
More than 35 years of experience
in financial services. Former
chairman of AIG’s International
Life and Retirement Services
Previously held leadership
positions at AIG and American
General
More than 25 years of experience
in the financial services industry,
most recently with AIG as head of
divestitures
Previously held leadership
positions at AIG, Bank of America,
Deutsche Bank, and DLJ
More than 22 years of experience
in the financial services industry,
most recently as CFO and CRO
of ING Asia Pacific
Previously held leadership
positions at ING in Western
Europe, Central Europe, and
Asia/Pacific; and at Ten Pas
actuarial consultants (now part of
Mercer)
4
4
Retirement •
Investments •
Insurance |
 ING
U.S. TODAY Focus on Execution, Driving Return on Equity Improvement
5
(1)
Pension & Investments, for the twelve months ended 9/30/13
(2)
See Appendix for explanatory note regarding Ongoing Business Adjusted Operating
Earnings Before Interest and Income Taxes Retirement •
Investments •
Insurance
#
1
Leading
franchise in
attractive
markets
publicly traded
Defined Contribution
recordkeeper with a
full array of retirement
capabilities
(1)
Strong track
record of
execution
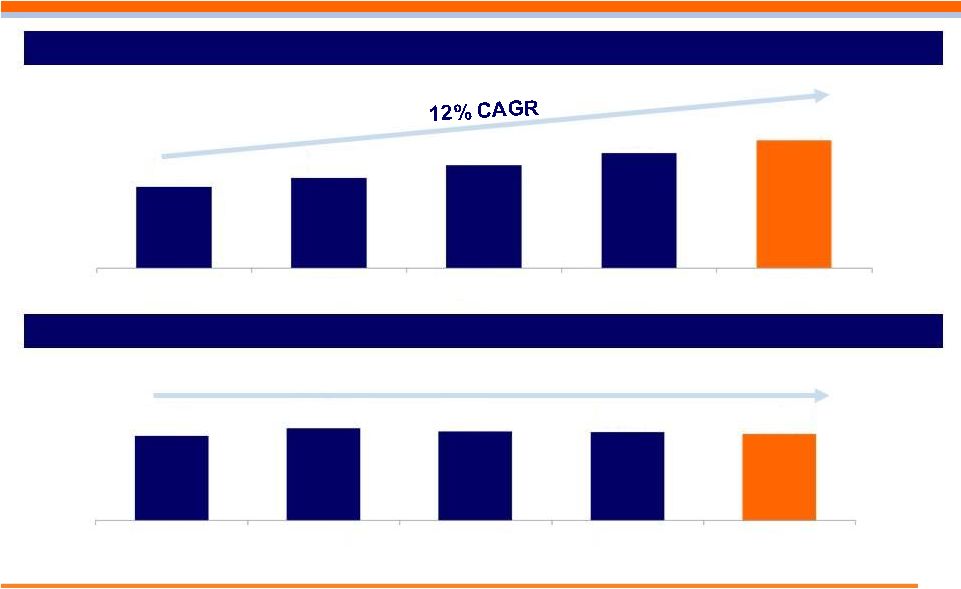
12%
CAGR
in Ongoing Business
adjusted operating
earnings
(2)
2009-2013
Substantial
scope for
continuing
Return on
Equity (ROE)
improvement
400-500
bps
targeted increase in
Ongoing Business
operating ROE to
12-13% from 2012
to 2016 |
 Customers
(3)
13M
Market cap
(1)
$9.3Bn
AUM / AUA
(2)
$511Bn
Points of Distribution
(4)
220,000
Retirement
Solutions
Investment
Management
Insurance
Solutions
26%
14%
60%
Diverse
Earnings
–
Three
Ongoing Businesses
(1)
As of market close, 3/14/14
(2)
As of 12/31/13; includes Closed Blocks
(3)
As of 12/31/13
(4)
Approximate as of 12/31/13; defined as independent producers
(5)
Approximate as of 12/31/13
(6)
Ongoing Business reflects Retirement, Annuities, Investment Management, Individual
Life, and Employee Benefits segments; adjustments include DAC/VOBA and other intangibles unlocking, the gain
74% of earnings from Retirement Solutions
and
Investment
Management
Employees
(5)
7,000
ING U.S. at a Glance
FY’13 Ongoing Business Adjusted Operating
Earnings Before Interest and Income Taxes: $1,212 million
(6)
6
Retirement •
Investments •
Insurance
(6)
associated
with
a
Lehman
Brothers
bankruptcy
settlement
(“Lehman
Recovery”),
and
losses
recognized
as
a
result
of
marking
low
income
housing
tax
credit
partnerships
(“LIHTC”)
to
the
sales
price
associated with their disposition |
 Three
Key Sources of Value Potential
CBVA Value
Tax Assets
Provide
Potential
Upside
Ongoing
Business
7
Retirement •
Investments •
Insurance |
 Continued Solid Execution since IPO, Supported by Favorable Markets
Markets
Forward Interest Rate Curve
Equity Market Levels (S&P 500)
At IPO (5/1/13)
Current (3/14/14)
Initial
Public
Offering:
Priced
our
IPO
on
May
1,
2013
Secondary Offering:
ING Group’s secondary offering
on October 23, 2013 reduced its ownership stake to
approximately 57%
Stock Performance:
Stock price increase of 80%
(from May 1, 2013 to December 31, 2013)
Completion
of
Recapitalization
Plan:
Primary
equity offering: $600 million in May 2013 and three
debt offerings: $1 billion in February 2013, $750
million in May 2013, and $400 million in July 2013,
which bolstered our balance sheet; reset negative
unassigned funds account at all subsidiaries to zero
Introduction of New Brand:
Introduction of Voya
Financial with full operational rebranding occurring in
2014
ROE
Improvement:
Adjusted
ROE
improved
by
200bps from 8.3% to 10.3% from 2012-2013
(1)(2)
Year in Review: 2013 Achievements
1,583
1,841
1
2
3
5
7
10
20
30
Current
(3/14/14)
At IPO
(5/1/13)
Retirement •
Investments •
Insurance
(1)
Excludes Closed Blocks and Corporate; excludes the impacts of DAC/VOBA and other intangible unlocking,
as well as the impact of 2012 portfolio restructuring and the gain associated with the Lehman
Recovery and losses recognized as a result of marking LIHTC partnerships to the sales price associated
with their disposition. See Appendix for explanatory note regarding adjusted operating earnings
(2)
We calculate Ongoing Business Adjusted Operating Return on Capital by dividing adjusted operating
earnings before interest and after income taxes (assuming a 35% effective tax rate) by average
capital allocated to the Ongoing Business. In order to translate anticipated Ongoing Business Operating
Return on Capital into Ongoing Business Operating Return on Equity, we divided projected
operating earnings after income taxes of our Ongoing Business by the projected average capital of our
Ongoing Business, after adjusting for projected interest expense and projected financial leverage of
the Ongoing Business. Operating Return on Equity assumes a 25% financial leverage-to-capital
ratio, a weighted average pre-tax interest rate of 5.5% on financial leverage for all periods prior to the third
quarter of 2013, when the Company completed its recapitalization initiatives, and the actual weighted
average pre-tax interest rate for all periods starting with the third quarter of 2013; see “Business—
Operating Return on Equity” and “Business—Operating Return on Capital Goal” in the
S-1 Registration Statement filed with the SEC for additional assumptions
8 |
 9
Premier Franchise with Leading Positions in Attractive Markets
America’s Retirement Company
TM
Solid Foundation Based on a Re-Capitalized and De-Risked Balance Sheet
9
Retirement •
Investments •
Insurance
Experienced Management Team Executing a 400-500bps ROE Improvement Plan by 2016 |
 Leveraging Three Strong Platforms
(1)
Pension & Investments, for the twelve months ended 9/30/13
(2)
Pensions & Investments Magazine, Defined Contribution Record Keepers Directory
published 3/4/13 with majority of company rankings based on data as of 9/30/12; based on number of DC plan sponsors
(3)
Investment News as of 12/31/12
(4)
ING U.S. Investment Management calculation as of 12/31/13
(5)
Pensions & Investments as of 12/31/12 (401(k), 403(b), 457, DB)
(6)
LIMRA as of 12/31/13
(7)
MyHealthGuide Newsletter News for the Self-Funded Community rankings as of
6/03/13 and does not include most managed healthcare providers 10
Retirement •
Investments •
Insurance
#1 publicly traded Defined
Contribution recordkeeper
with a full array of
retirement capabilities
(1)
#2 provider of defined
contribution plans
(2)
Top 10 independent
broker dealer
(3)
93% of fixed income
assets and 84% of equity
assets outperformed
benchmark returns on a 5-
year basis as of the end of
2013
(4)
Top 20 manager of
institutional assets
(5)
#13 provider of term life
insurance
(6)
#6 provider of stop loss
insurance
(7)
Retirement
Solutions
Investment
Management
Insurance
Solutions |
 ING
U.S. Today: A Different Kind of Company Past: Top Line Focus
Today: Value Creation Focus
Market share
Growth
Acquisitions
Sales
Capital management
Profitable growth
Segment synergies
Operational efficiency
A
Cultural
Transformation
11
Retirement •
Investments •
Insurance
Our Metrics
Risk-adjusted returns
Distributable earnings
Sales at or above
target IRRs |
 Solid foundation
Significant progress
repositioning the company
2
3
America’s
Retirement
Company™
The ING U.S. Investment Proposition
1
Premier franchise
Leveraging three platforms
Driving ROE improvement
On track to achieve 2016
targets
12
Focus on Execution, Driving ROE Improvement
Retirement •
Investments •
Insurance |
 13
America’s Retirement Company
Premier Franchise with Leading Positions in Attractive Markets
Experienced Management Team Executing a 400-500bps ROE Improvement Plan by
2016 Solid Foundation Based on a Re-Capitalized and De-Risked Balance
Sheet 13
Retirement •
Investments •
Insurance
TM |
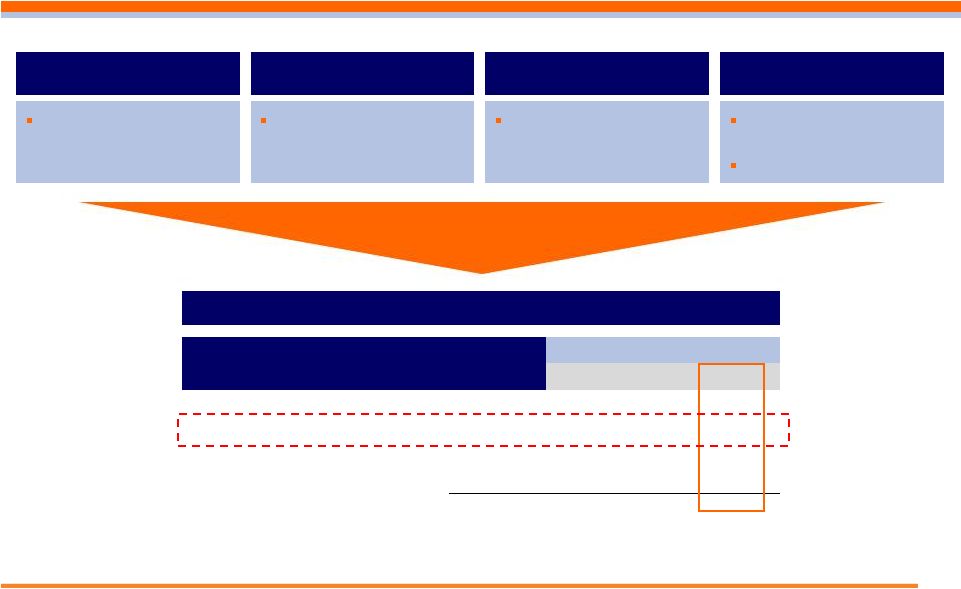
 Comprehensive Plan with Clear Goals
Ongoing Business Adjusted Operating
ROC Goal
Ongoing Business Adjusted Operating
ROE Goal
(1)
(1)
(1)
(1)
14
Retirement •
Investments •
Insurance
8.3%
12-13%
2012 Ongoing Business
Adjusted
Operating ROE
2016 Target Ongoing
Business Adjusted
Operating ROE
7.2%
10-11%
2012 Ongoing Business
Adjusted
Operating ROC
2016 Target Ongoing
Business Adjusted
Operating ROC
(1)
Ongoing Business includes Retirement, Annuities, Investment Management, Individual Life, and Employee
Benefits segments and excludes Closed Blocks and Corporate; Ongoing Business adjusted operating
earnings is calculated by using the operating earnings (loss) before income taxes for the Ongoing Business, excluding the impacts of DAC/VOBA and other intangible unlocking, as well as the
impact of 2012 portfolio restructuring and the gain associated with the Lehman Recovery and losses
recognized as a result of marking LIHTC partnerships to the sales price associated with their
disposition. We calculate Ongoing Business Adjusted Operating Return on Capital by dividing
adjusted operating earnings before interest and after income taxes (assuming a 35% effective tax rate) by
average capital allocated to the Ongoing Business. In order to translate anticipated Ongoing Business
Operating Return on Capital into Ongoing Business Operating Return on Equity, we divided projected
operating earnings after income taxes of our Ongoing Business by the projected average capital of our
Ongoing Business, after adjusting for projected interest expense and projected financial leverage of
the Ongoing Business. Operating Return on Equity assumes a 25% financial leverage-to-capital
ratio a weighted average pre-tax interest rate of 5.5% on financial leverage for all periods prior to the third
quarter of 2013, when the Company completed its recapitalization initiatives, and the actual weighted
average pre-tax interest rate for all periods starting with the third quarter of 2013 see “Business—
Operating Return on Equity” and “Business—Operating Return on Capital Goal” in the
S-1 Registration Statement filed with the SEC for additional assumptions
400–500bps
300–400bps |
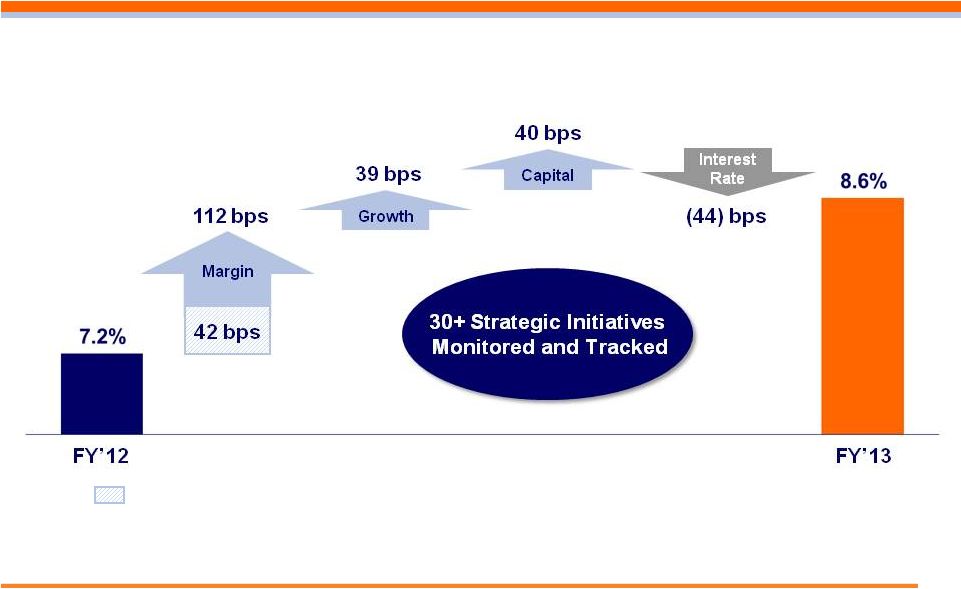 Notable items that might not recur contributed to the improvement in the Margin
category Ongoing Business Adjusted Operating ROC
(1)
(1)
Ongoing Business includes Retirement, Annuities, Investment Management, Individual
Life, and Employee Benefits segments and excludes Closed Blocks and Corporate. We calculate Ongoing Business
Adjusted Operating Return on Capital by dividing adjusted operating earnings before
interest and after income taxes (assuming a 35% effective tax rate) by average capital allocated to the Ongoing Business
15
Evidence Our Plan is Working
Retirement •
Investments •
Insurance |
 (1)
Excludes Closed Blocks and Corporate; excludes the impacts of DAC/VOBA and other
intangible unlocking, as well as the impact of 2012 portfolio restructuring and the gain associated with the Lehman Recovery
and losses recognized as a result of marking LIHTC partnerships to the sales price
associated with their disposition. Investment Management target based on pre-tax operating margin range. Improvement figures
represent management’s best estimates
(2)
Without
the
annually
renewable
reinsurance
transaction
in
our
Employee
Benefits
segment,
which
lowers
the
required
capital
for
the
segment,
the
2016
operating
ROC
target
is
in
the
range
of
11%
to
13%
(3)
Cumulative estimated distributable capital from insurance companies in excess of
target statutory capital levels for Ongoing Business, net of new business strain and holding company expenses, that we estimate
would result from achievement of target ranges
(4)
Includes results from investment capital and excludes gain from Lehman
recovery (4)
16
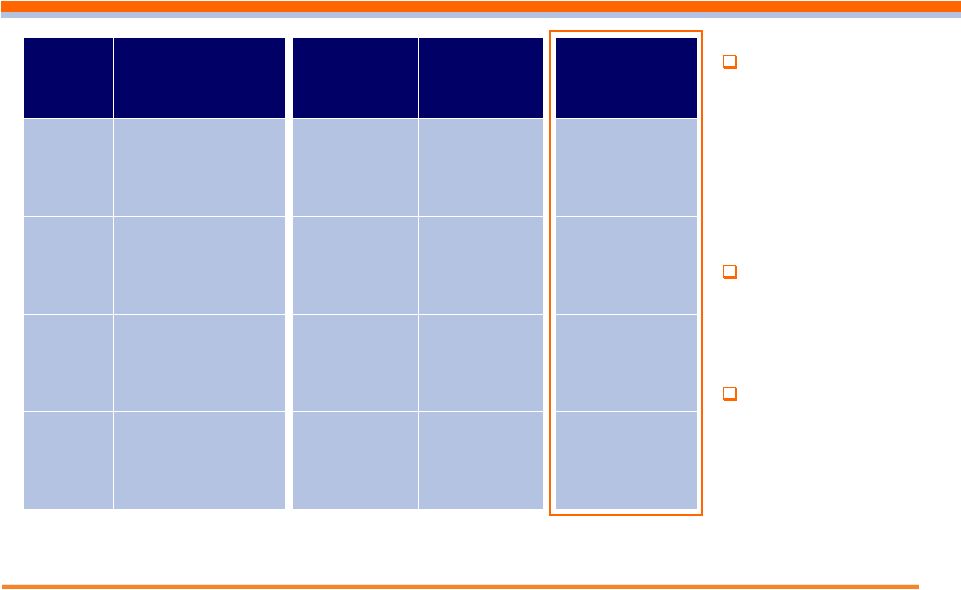
Each Business Has Its Own ROC / ROE Target and Each
Contributed to ROE / ROC Improvement in 2013
Retirement •
Investments •
Insurance
2012
2013
2016 Target
Range
ROC by Segment:
Retirement
7.2%
8.9%
10.0
–
11.0%
Annuities
5.9%
7.3%
7.0
–
9.0%
Investment Management P/T Op. Margin
24.6%
27.7%
30.0
–
34.0%
Individual Life
4.3%
4.9%
6.0
–
8.0%
Employee Benefits
(2)
16.9%
18.8%
18.0
–
22.0%
Ongoing Business Adjusted Operating ROC
7.2%
8.6%
10.0
–
11.0%
Ongoing Business Adjusted Operating ROE
8.3%
10.3%
12.0
–
13.0%
Excess Capital Generation
(3)
More
$1.7Bn
Ongoing Business
Adjusted Operating ROE / ROCs
(1)
than |
 Retirement
AUM Net
Flows
$1,445
$3,001
$3,466
$2,459
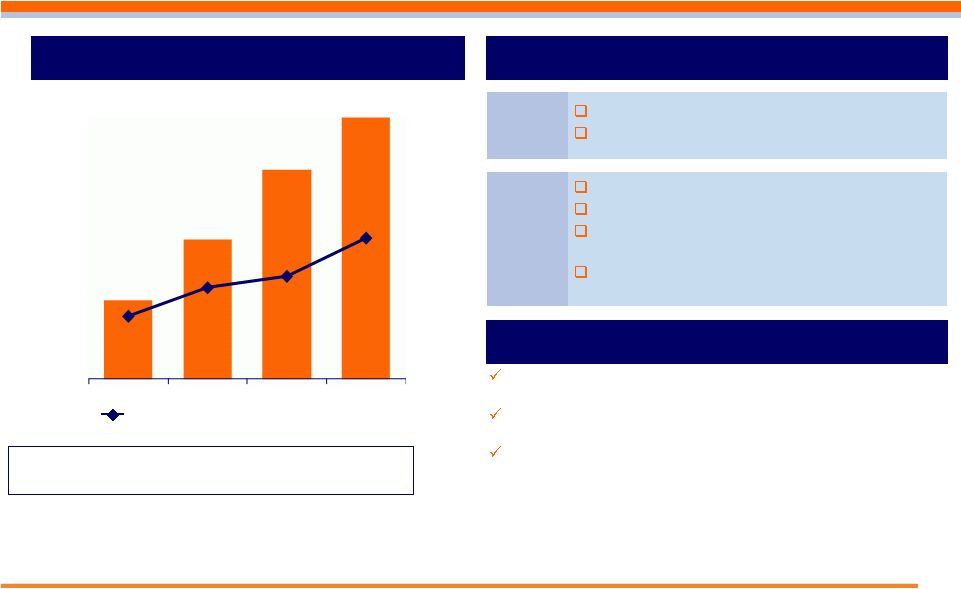
Retirement Solutions –
Leading Franchise Driving
Long-Term Growth and Returns
(1)
See Appendix for explanatory note regarding Ongoing Business Adjusted Operating
Earnings Before Interest and Income Taxes 17
($ millions)
Key Drivers of ROC Improvement
Margin
Adjusting crediting rates in response to changes
in the external rate environment
Increasing returns on Full Service business
Managing costs actively
Running off the Multi-Year Guarantee business
Examples of Execution
Retirement
Annuities
$309
$398
$474
$537
$125
$122
$200
$197
$434
$520
$674
$734
2010
2011
2012
2013
Retirement
Annuities
Ongoing Business Adjusted Operating Earnings
Before Interest and Income Taxes
Growing Individual Markets business
Ongoing sales momentum in Institutional Markets
Growing Mutual Fund Custodial sales
Growth
Executing reinsurance transactions
Running off less profitable business
Capital
Retirement •
Investments •
Insurance
$599 million in Mutual Fund Custodial net flows in 2013, up
from $461 million (+30%) in 2012
Allstate strategic partnership
Significant multi-employer engagement win in 3Q’13
(1) |
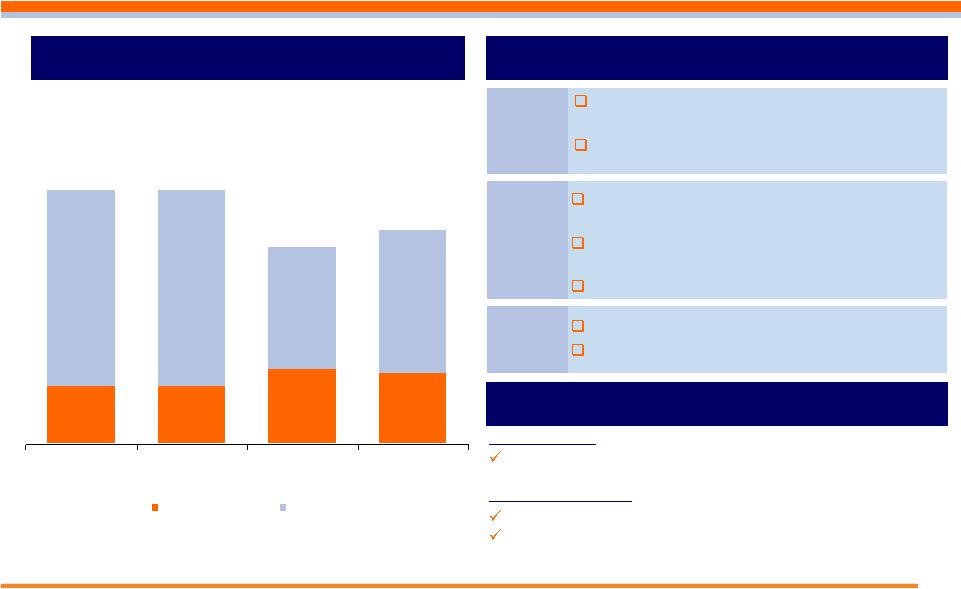
 AUM
Net Flows
(2)
$(1,455)
$5,702
$9,846
$8,756
Key Drivers of Improvement
Investment Management –
Scalable Platform
Leveraging Strong Investment Performance
18
Ongoing Business Adjusted Operating Earnings
Before
Interest
and
Income
Taxes
&
Margin
(1)
Examples of Execution
93% of fixed income assets outperformed benchmark
returns on a 5-year basis as of 2013
84% of equity assets outperformed benchmark returns on a
5-year basis as of 2013
Third-party business AUM grew $19 billion in 2013 with
nominal increase in expenses
Improving sales force productivity
Reducing retail outflows
Margin
Increasing third-party business
Growing in higher-fee asset classes
Increasing capture of Defined Contribution
Investment Only (DCIO) mandates
Replacing underperforming non-ING U.S. mutual
fund sub-advisors
Growth
Margin Excluding Investment Capital Return
Retirement •
Investments •
Insurance
($ millions)
$50
$88
$132
$165
11%
16%
18%
25%
2010
2011
2012
2013
(1)
See Appendix for explanatory note regarding Ongoing Business Adjusted Operating Earnings Before
Interest and Income Taxes
(2)
Commercial net flows, excludes general account net flows, includes separate account and mutual fund net
flows reflected in other ING U.S. segments |
 $84
$83
$109
$102
$286
$286
$178
$210
$370
$369
$287
$312
2010
2011
2012
2013
Employee Benefits
Individual Life
Insurance Solutions –
Repositioned Toward Capital
Efficient Products
(1)
See Appendix for explanatory note regarding Ongoing Business Adjusted Operating
Earnings Before Interest and Income Taxes 19
Ongoing Business Adjusted Operating Earnings
Before
Interest
and
Income
Taxes
(1)
Key Drivers of ROC Improvement
Examples of Execution
Individual Life
Continuing to manage expenses relative to
sales volume
Managing non-guaranteed elements of in-force
contracts
Margin
Increasing persistency and sales in the Group
business
Growing Stop Loss while retaining pricing
discipline
Expanding the Voluntary business
Growth
Shifting sales focus to indexed products
Executing capital efficient structures
Capital
Retirement •
Investments •
Insurance
($ millions)
Voluntary sales increased 11% in 2013
Loss ratios for both Stop Loss and Group Life remain within
expected ranges
Employee Benefits
Administrative expenses approximately 13% lower in 2013
vs. 2012 |
 20
America’s Retirement Company
TM
Premier Franchise with Leading Positions in Attractive Markets
Experienced Management Team Executing a 400-500bps ROE Improvement Plan by
2016 Solid Foundation Based on a Re-Capitalized and De-Risked Balance
Sheet 20
Retirement •
Investments •
Insurance |
 Ongoing Business
12% –13% ROE target by
2016
More than $1.7 billion in
excess capital expected to be
available, including for return
to shareholders
Potential CBVA value
Tax assets provide potential
upside
Financial Transformation Driving Value Creation
21
Significant
Improvement in
Profitability
Balance Sheet
Re-structuring
and De-risking
Valuable
Ongoing
Franchise and
Other Assets
Significantly reduced leverage
Improved capital position
De-risked investment portfolio
Termed out debt maturity
profile
24 months of holding company
liquidity
12% Ongoing Business
Adjusted Operating Earnings
Before Interest and Income
Taxes
(1)
CAGR (2009-2013)
11% increase in Ongoing
Business Adjusted Operating
Earnings Before Interest and
Income Taxes
(1)
from 2012 to
2013
Growth in capital efficient
business lines
(1)
See Appendix for explanatory note regarding Ongoing Business Adjusted Operating
Earnings Before Interest and Income Taxes Retirement •
Investments •
Insurance |
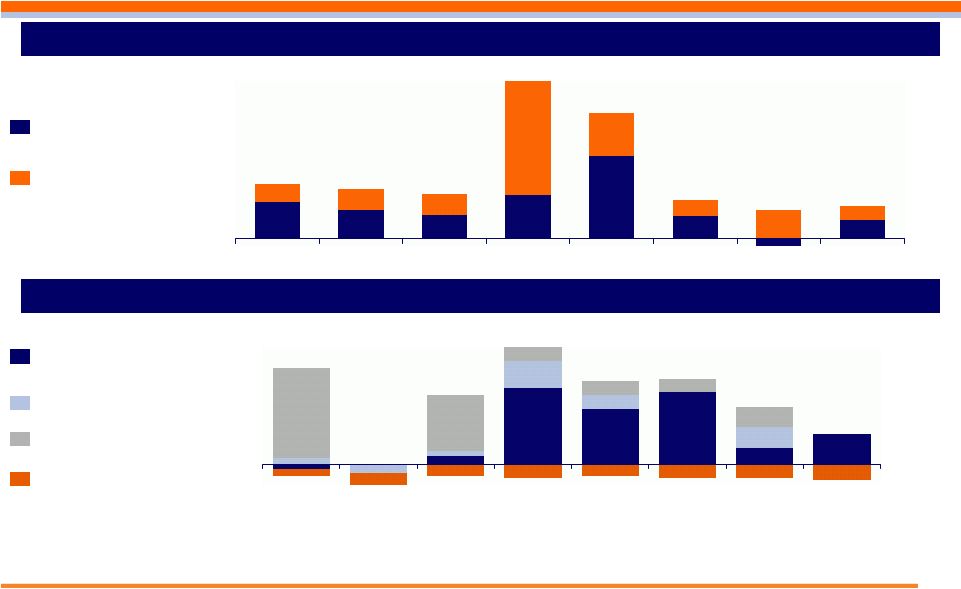
 Solid
Improvement in Operating Earnings While Keeping Administrative Expenses
Flat (1)
See Appendix for explanatory note regarding Ongoing Business Adjusted Operating
Earnings Before Interest and Income Taxes 1% CAGR
22
Retirement •
Investments •
Insurance
($ millions)
($ millions)
Ongoing
Business
Adjusted
Operating
Earnings
Before
Interest
and
Income
Taxes
(1)
Ongoing Business Administrative Expenses
$767
$854
$976
$1,093
$1,212
$1,643
$1,669
$1,692
$1,749
$1,597
2009
2010
2011
2012
2009
2010
2011
2012
2013
2013 |
  4Q’13 & 1Q’14 Operating Earnings Observations and
Seasonality
23
Retirement •
Investments •
Insurance
($
millions,
pre-tax
and
pre-DAC)
Lehman Recovery and LIHTC
$ 9.0
CB - ISP Prepayment Expense
(14.0)
Excess Pre-Payment Fee Income
7.0
Excess Alternative Investment Income
24.0
Excess Group Life Underwriting Income
8.0
DAC Unlocking
22.0
4Q'13 Non-Recurring and Variable Items
1Q’14 Observed Variances and
Anticipated Seasonality
Through the end of February, we had ~$2
million of prepayment fee income
compared to an average quarterly
prepayment fee income expectation of $15
million
Payroll taxes and other annual expenses
are concentrated in the first quarter,
typically adding ~$10 to $15 million to the
period’s operating expenses
Expect to achieve 2016 Ongoing Business Operating ROE goal of 12-13%
On track in 2014 to improving ROE towards that goal |
 Continued Positive Net Flows
Stable Value Net Flows
Net Flows excl. Stable
Value
(1)
Excludes recordkeeping
(2)
Excludes General Account
(3)
Excludes VA
(4)
Total Closed Block Variable Annuity net outflows were $1,018 million in
2Q’13 Investment Management
Sourced
Affiliate Sourced
(3)
Sub-advisor
Replacements
Retirement
Net
Flows
(1)
Investment
Management
Third-Party
Net
Flows
(2)
$0.6
$0.6
$0.5
$1.8
$1.4
$0.4
Investment
Management VA
Outflows
(4)
$0.2
$0.4
24
Retirement •
Investments •
Insurance
($ billions)
($ billions)
$0.4
$0.4
$0.3
$0.5
$0.9
$0.2
($0.1)
$0.2
$0.2
$0.2
$0.2
$1.3
$0.5
$0.2
$0.3
$0.2
1Q'12
2Q'12
3Q'12
4Q'12
1Q'13
2Q'13
3Q'13
4Q'13
($0.2)
$0.3
$3.3
$2.4
$3.1
$0.7
$1.3
$0.3
($0.4)
$0.2
$1.2
$0.6
$0.9
$3.9
$2.4
$0.6
$0.6
$0.5
$0.9
($0.3)
($0.5)
($0.5)
($0.6)
($0.5)
($0.6)
($0.6)
($0.7)
$3.7
($0.8)
$2.5
$4.5
$3.2
$3.1
$1.8
$0.6
1Q'12
2Q'12
3Q'12
4Q'12
1Q'13
2Q'13
3Q'13
4Q'13 |
 Active
Hedge Program in Closed Block Variable Annuity
(1)
Available resources include planned $150M movement from ING USA to SLDI in
2Q’14 (2)
Net flows represent products in deferred phase only. Net flows, in total, inclusive
of products in both deferred and payout phases, would be annualized 9.2% for the quarter
(3)
These sensitivities illustrate the estimated impact of the indicated shocks
beginning on the first market trading day following December 31, 2013, and give effect to dynamic rebalancing over the course of the shock event. This reflects the hedging we
had in place at the close of business on December 31, 2013 in light of our
determination of risk tolerance and available collateral at that time, which may change from time to time. The impact includes an equity effect on CARVM and change in cash
flow testing reserve, and excludes smoothing effect on risk based capital
(RBC). The estimates of equity market shocks reflect a shock to all equity markets, domestic and global, of the same magnitude. The primary focus of the hedge program is to
protect regulatory agency capital from equity market movements. Equity market and
interest rate changes and movements in other market variables that are not explicitly hedged may cause GAAP earnings volatility
(4)
Actual
results
will
differ
due
to
issues
such
as
basis
risk,
variance
in
market
volatility
versus
what
is
assumed,
combined
effects
of
interest
rates
and
equities,
rebalancing
of
hedges
in
the
future,
or
the
effects
of
time
and
other
variations
from
assumptions. Additionally, estimated sensitivities vary over time as the market and
closed book of business evolve or if assumptions or methodologies that affect sensitivities are refined
Preliminary
Impact
to
Regulatory
Capital
and
Earnings
(3)(4)
($ million)
$1.5
($0.5)
$1.0
$0.2
$1.2
$0.2
$1.0
$1.0
($1.4)
$0.4
($0.8)
($0.1)
($1.0)
($0.2)
($0.6)
($0.7)
1Q'12
2Q'12
3Q'12
4Q'12
1Q'13
2Q'13
3Q'13
4Q'13
Change in Statutory Reserves Relative to Hedge
($ billion)
Equity impacts (increase) decrease in stat reserve liability
Equity impacts increase (decrease) in hedge assets
Net Impact (increase / (decrease))
Equity Market (S&P 500)
Interest Rates
-25%
-15%
-5%
5%
15%
25%
-1%
1%
Regulatory Capital
-
-
50
200
250
300
50
(50)
U.S. GAAP Earnings Before Income Taxes
850
350
100
(150)
(450)
(650)
(300)
150
Available resources
of $4.3 billion
(1)
Guaranteed LB
Statutory reserves of
$2.4 billion
Living Benefit NAR
of $2.2 billion
Net Flows of ($1.1)
billion, annualized
10.2% of beginning
of period assets
(2)
4Q’13 Results
Net Impact ($ billion)
$0.1
($0.1)
$0.2
$0.1
$0.2
$0.0
$0.4
$0.3
25
Retirement •
Investments •
Insurance |
 26
We switched to a
Present Value (PV)
methodology because
analysts and investors
are more familiar with
that approach and
peers also use this
approach
Year end 2012 time
zero equivalents
consistent with PV
approach
PV of Cash flows
projected over 50
years, discounted at
swap rates
Scenario
Assumptions
Time Zero
Equivalent
as of Year End
2012
(1)
PV of Cash Flows
as of Year End
2012
(2)
PV of Cash Flows
as of Year End
2013
(2)
Scenario 1
Equity return down 25%
in first year, then 0%
thereafter; Long term
interest rates constant;
Lapses down 10%
$(1.4)
$(1.4)
$(0.9)
Scenario 2
5% Equity returns;
Interest rates follow
forward swap curve;
current dynamic
assumptions
1.3)
1.3)
1.9)
Scenario 3
9% Equity returns;
Interest rates follow
forward swap curve;
current dynamic
assumptions
2.4)
2.2)
2.5)
Scenario 4
9% Equity returns;
Interest rates graded to
historical average;
current dynamic
assumptions
3.0)
2.9)
2.9)
($ billions)
Closed Block Variable Annuity Cash Flow
Scenarios Improved Over Past Year
Retirement •
Investments •
Insurance
Note: Capital Hedge Overlay impacts are estimated due to limited ability to estimate reserves / capital
in future; Rho hedge positions as of December 31, 2013 run-off over the projection; Cash Flows are projected over 50 years reflecting obligation of
guaranteed benefits. They are independent of any accounting regime, and are pre-tax. Discount rates
for GMIB claims approximated by interest rate assumption at time of annuitization in each scenario. Historical average swap rates grade in to 3.4% / 5.4%.
Actual results will vary from cash flows due to issues such as but not limited to, market volatility
over time, which would not be reflected in a single deterministic path; basis risk; potential changes in assumptions or methodology that affect reserves or hedge
targets; and additional impacts from rebalancing of hedges or effects of time.
(1) Illustrative amount of assets that could be removed or required at time zero to
ensure resources stay positive each year throughout the 50-year projection.
(2) PV of cash flows equal available resources less PV of benefit payments, PV of
fees net of expenses, and PV of Hedge Gains/Losses Available resources include planned $150M movement from ING USA to SLDI in 2Q’14
|
 Nominal
NPV @ Valuation
DTA Value
Operating Loss Carry Forwards
(2)
$1,005
SLDI Related Deferred Losses
1,107
Life Subgroup Deferred Losses
575
Non-Life Subgroup Deferred Losses
(4)
264
Total
$2,951
$10,000
$438
618
353
85
$1,494
DTA That Could Be Realized
27
($ millions)
Significant NPV of Projected Tax Savings
Op. Loss Carry Forwards
Life Subgroup
Deferred Losses
Non-Life Subgroup
Deferred Losses
Losses incurred on VA
hedge program
Tax-based goodwill
amortization
Non-Life deferred losses
Non-Life federal net
operating loss carry
forwards
(1)
At
time
of
§382
event
–
likely
to
occur
with
the
offering
(2)
Factors in §382 tax exempt rate of 3.50% as of 12/31/13 and NOL expiration
schedule (3)
Of this amount, $385 million is not offset by a TVA
(4)
Factors in §382 tax exempt rate of 3.50% as of 12/31/13
SLDI Related
Deferred Losses
Losses incurred on VA
hedge program resident
in SLDI
(1)
$9,000
$418
618
353
76
$1,465
(3)
Retirement •
Investments •
Insurance
35% Federal Tax Rate
10% Discount Rate |
 28
America’s Retirement Company
TM
Premier Franchise with Leading Positions in Attractive Markets
Solid Foundation Based on a Re-Capitalized and De-Risked Balance Sheet
28
Retirement •
Investments •
Insurance
Experienced Management Team Executing a 400-500bps ROE Improvement Plan by 2016
|
 |
 Appendix
30
Retirement •
Investments •
Insurance |
 Profile of the Variable Annuity Closed Block
Account Value by
Benefit Type
($ millions)
$44.7 billion
as of December 31, 2013
(1)
Excludes $959 million of Payout, Policy Loan and Life Insurance business which is
included in consolidated account values (2)
Net amount at risk, net of external reinsurance. NAR for GMAB/GMWB and Guaranteed
Minimum Death Benefit (GMDB) is equal to the guaranteed values in excess of the
account value. NAR for GMIB and GMWBL is equal to the excess of the present value of
minimum guaranteed annuity payments over the account value. The NAR of DB and
LB are not additive
VA policies sold primarily between 2001 and 2010 offered living and / or death
benefit guarantees Majority of customer accounts were invested (at
customer’s discretion) in equities Equity market downturn depressed
account values Account
Value
(1)
Net Amount
at Risk
(2)
Benefit Type
Accumulation Benefit / Withdrawal Benefit
(GMAB/GMWB)
$943
$20
12%
Guaranteed Minimum Income Benefit
(GMIB)
15,909
1,682
62%
Guaranteed Min. Withdrawal Benefit for Life
(GMWBL)
16,537
452
24%
Death Benefit Only
11,351
-
-
Total
$44,740
$2,154
44%
% Contracts
In the Money
LB
LB
In addition, each policy has a Death Benefit, which can only be
obtained upon death of the policyholder. The DB NAR, which
assumes the simultaneous death of all policyholders, is $5,074 and
40% of the contracts are in the money.
31
Retirement •
Investments •
Insurance
GMAB/GMWB
2%
GMIB
36%
GMWBL
37%
Death
Benefit
Only
25% |
 Year End 2012
Year End 2013
Change
Available Resources
7.5
4.3
(3.2)
32
Resources Needed
Year End
2012
Year End 2013
Change
Scenario 1
$8.9
$5.2
$(3.7)
Scenario 2
6.2
2.4
(3.8)
Scenario 3
5.3
1.8
(3.5)
Scenario 4
4.6
1.4
(3.2)
Available
Resources
have
been
reduced
as
fewer
assets
are
needed
due
to
improved
market
conditions
Resources Needed = PV Benefit Payments, less PV Fees Net of Expenses, less PV Hedge
Gain/Loss YE’12 PV
of
Cash
Flows
YE’13 PV
of
Cash
Flows
Scenario 1
$(1.4)
$(0.9)
Scenario 2
1.3)
1.9)
Scenario 3
2.2)
2.5)
Scenario 4
2.9)
2.9)
Resources Needed Have Declined Over the Past Year
Reflecting Lower Expected Benefit Payments
Retirement •
Investments •
Insurance
($ billions)
Note: Capital Hedge Overlay impacts are estimated due to limited ability to estimate reserves / capital
in future; Rho hedge positions as of December 31, 2013 run-off over the projection; Cash Flows are
projected over 50 years reflecting obligation of guaranteed benefits. They are independent of any
accounting regime, and are pre-tax. Discount rates for GMIB claims approximated by interest rate assumption
at time of annuitization in each scenario. Actual results will vary from cash flows due to issues such
as but not limited to, market volatility over time, which would not be reflected in a single deterministic path;
basis risk; potential changes in assumptions or methodology that affect reserves or hedge targets; and
additional impacts from rebalancing of hedges or effects of time.
Available resources include planned $150M movement from ING USA to SLDI in 2Q’14.
|
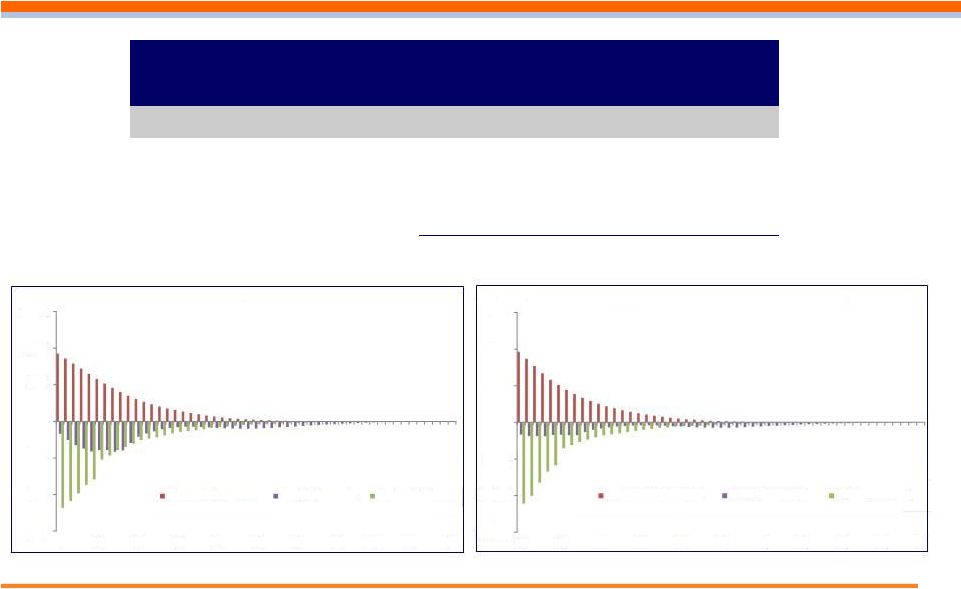 33
Scenario 3 –
Year End 2012
Scenario 3 –
Year End 2013
PV of Cash Flows: Scenario 3
($ billions)
Year End
2012
Year End
2013
(1)
Available Resources
$7.5)
$4.3)
PV of Fees Net of Expenses
7.4)
6.3)
PV of Benefit Payments
(4.6)
(2.1)
PV of Hedge Gain/Loss
(8.1)
(6.0)
PV of Cash Flows
2.2)
2.5)
(1)
Available resources include planned $150M movement from ING USA to SLDI in
2Q’14 CBVA Benefit Payments and Hedge Losses
Declined More than Fees Versus 2012
Retirement •
Investments •
Insurance
(1,500)
(1,000)
(500)
-
500
1,000
1,500
0
5
10
15
20
25
30
35
40
45
50
Fees net of expenses
Benefit Payments
Hedge Gain/Loss
($ million)
(1,500)
(1,000)
(500)
-
500
1,000
1,500
0
5
10
15
20
25
30
35
40
45
50
Fees net of expenses
Benefit Payments
Hedge Gain/Loss
($ million) |
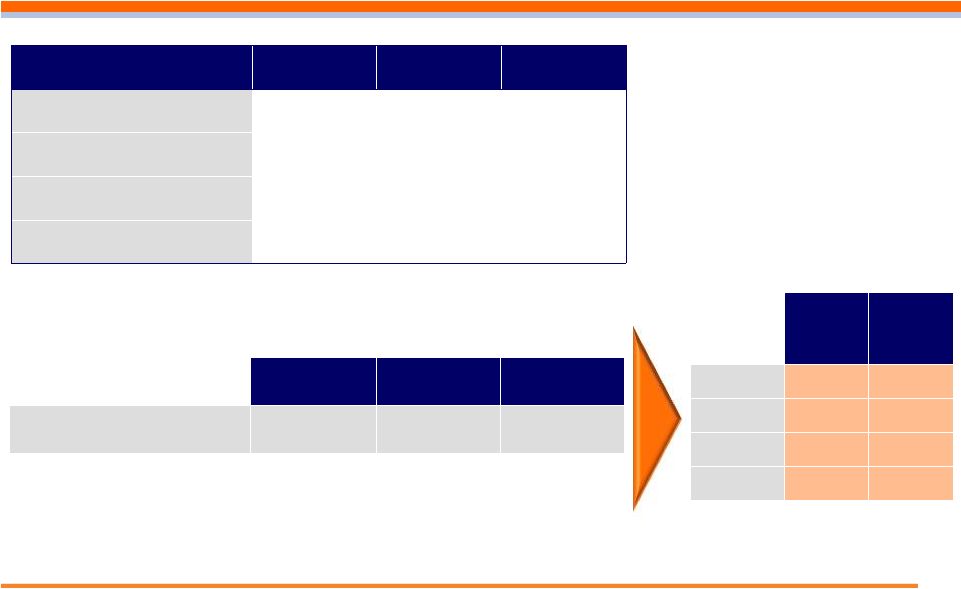
 Capital and Returns by Segment
Capital as of
December 31,
2013
Capital as % of
Consolidated
Capital
By Segment:
Retirement
4,007
27%
8.9%
Annuities
1,713
12%
7.3%
Investment Management
302
2%
35.4%
Individual Life
2,848
19%
4.9%
Employee Benefits
346
2%
18.8%
Ongoing Business
9,216
62%
8.6%
CBVA
3,119
21%
-
Corporate & Other Closed Blocks
2,603
17%
N/M
Consolidated
14,938
100%
5.5%
34
Retirement •
Investments •
Insurance
($ millions)
Adjusted
Operating Return
on Capital for the
Year Ended
December 31,
2013 |
 Year ended
Year ended
($ in millions)
December 31, 2013
December 31, 2012
December 31, 2011
Ongoing Business adjusted operating earnings before income taxes
1,211.8
$
1,093.2
$
975.8
$
DAC/VOBA and other intangibles unlocking
133.2
(77.0)
303.8
Lehman bankruptcy/LIHTC loss, net of
DAC 83.6
-
-
Impact of investment portfolio restructuring
-
(25.3)
-
Operating earnings before income taxes for Ongoing Business
1,428.6
990.9
1,279.6
Corporate
(210.6)
(182.3)
(230.2)
Closed Blocks Institutional Spread Products
and Other 50.6
109.7
70.2
Total operating
earnings before income taxes 1,268.6
918.3
1,119.6
Income taxes (based on an assumed tax rate of 35%)
(444.0)
(321.4)
(391.9)
Operating earnings, after-tax
824.6
596.9
727.7
Closed Block Variable Annuity,
after-tax (786.0)
(450.0)
(366.9)
Net investment gains (losses) and related
charges and adjustments, after-tax 137.9
296.0
46.7
Other,
after-tax 424.0
30.1
(495.6)
Net income (loss) available to ING U.S., Inc.'s
common shareholders 600.5
473.0
(88.1)
Net income (loss) attributable to
noncontrolling interest 190.1
138.2
190.9
Net income (loss)
790.6
$
611.2
$
102.8
$
ING U.S.
Reconciliation of Ongoing Business Adjusted Operating Earnings to Net Income (Loss)
35
Reconciliation of Adjusted Operating Earnings to Net
Income
Retirement •
Investments •
Insurance |
 Ongoing Business Operating Earnings Before Interest and Income Taxes
Retirement
Annuities
Retirement Solutions
Investment Management
Individual Life
Employee Benefits
Insurance Solutions
Total Ongoing Business
Adjustments
1
Retirement
Annuities
Retirement Solutions
Investment Management
Individual Life
Employee Benefits
Insurance Solutions
Total Adjustments
Retirement
Annuities
Retirement Solutions
Investment Management
Individual Life
Employee Benefits
Insurance Solutions
Total Ongoing Business Adjusted Operating Earnings Before Interest and Income
Taxes Adjustments
Total Ongoing Business Operating Earnings Before Interest and Income Taxes
2009
358.3
48.7
407.0
44.4
301.1
37.2
338.3
789.7
67.2
6.0
73.2
0.0
(50.4)
0.0
(50.4)
22.8
291.1
42.7
333.8
44.4
351.5
37.2
388.7
766.9
22.8
789.7
2010
469.6
115.0
584.6
50.1
313.5
82.0
395.5
1,030.2
160.4
(10.2)
150.2
0.0
27.6
(2.0)
25.6
175.8
309.2
125.2
434.4
50.1
285.9
84.0
369.9
854.4
175.8
1,030.2
2011
441.9
387.6
829.5
87.5
279.3
83.3
362.6
1,279.6
44.2
266.0
310.2
0.0
(6.4)
0.0
(6.4)
303.8
397.7
121.6
519.3
87.5
285.7
83.3
369.0
975.8
303.8
1,279.6
1,093.2
2012
448.6
102.2
550.8
134.5
196.2
109.4
305.6
990.9
(25.5)
(97.4)
(122.9)
2.2
18.2
0.1
18.3
(102.4)
474.0
199.6
673.6
132.3
178.0
109.3
287.3
(102.4)
990.9
2013
595.8
293.8
889.6
178.1
254.8
106.1
360.9
1,428.6
$58.5
96.8
155.3
13.2
44.5
3.8
48.3
216.8
537.3
197.0
734.3
164.9
210.3
102.3
312.6
1,211.8
216.8
1,428.6
36
Retirement •
Investments •
Insurance
($ millions)
Explanatory Note: In connection with a portfolio restructuring in 2012, certain
alternative investments were sold. For comparability in measuring our progress toward our future operating ROC goal, Ongoing Business
Adjusted
Operating
Earnings
Before
Interest
and
Income
Taxes
for
2012
includes,
in
addition
to
adjustments
for
DAC
/
VOBA
and
other
intangibles
unlocking
and
for
the
net
loss
included
in
the
operating
earnings
from
the
sale
of
these
alternative
investments,
an
adjustment
for
the
investment
income
associated
with
the
assets
disposed
of
during
the
portfolio
restructuring.
Because
the
assets
disposed
of
in
our
2012
portfolio
restructuring
generated
income
for
prior
periods,
Ongoing
Business
Adjusted
Operating
Earnings
Before
Interest
and
Income
Taxes
for
2012
is
not
directly
comparable
to
Ongoing
Business
Adjusted
Operating
Earnings Before Interest and Income Taxes for prior periods in that it
excludes investment income associated with the assets disposed of during the portfolio restructuring. Ongoing Business reflects Retirement,
Annuities, Investment Management, Individual Life, and Employee Benefits segments;
adjustments include DAC/VOBA and other intangibles unlocking, the gain associated with a Lehman Brothers bankruptcy
settlement (“Lehman Recovery”), and losses recognized as a result of
marking low income housing tax credit partnerships (“LIHTC”) to the sales price associated with their disposition
Reconciliation of Ongoing Business Adjusted Operating
Earnings Before Interest and Income Taxes
Reconciliation of Ongoing Business Adjusted Operating Earnings Before Interest and Income Taxes
Ongoing Business Adjusted Operating Earnings Before Interest and Income Taxes |
 37
Reconciliation of Adjusted Operating Return on Capital
and Return on Equity
Retirement •
Investments •
Insurance
(in millions USD, unless otherwise indicated)
Retirement
Annuities
Individual Life
Employee Benefits
Beginning Capital
(1)(2)
3,822
1,810
303
2,760
362
9,057
5,066
(150)
13,973
Ending Capital
(2)
4,007
1,713
302
2,848
346
9,216
3,119
2,603
14,938
Average Capital
(3)
3,915
1,762
303
2,804
354
9,137
4,092
1,226
14,456
Adjusted operating earnings before interest and after
income taxes
349.2
128.0
107.2
136.7
66.5
787.6
-
10.6
798.2
Adjusted Operating Return on Capital
8.9%
7.3%
35.4%
4.9%
18.8%
8.6%
-
N/M
5.5%
Adjusted Operating Return on Equity
(4)
10.3%
(in millions USD, unless otherwise indicated)
Retirement
Annuities
Individual Life
Employee Benefits
Beginning Capital
(2)
4,333
2,471
275
2,545
413
10,037
3,452
311
13,800
Ending Capital
(2)
4,284
1,949
303
2,858
429
9,823
3,262
888
13,973
Average Capital
(3)
4,308
2,210
289
2,702
421
9,930
3,357
599
13,886
Adjusted operating earnings before interest and after
income taxes
308.1
129.7
86.0
115.7
71.0
710.5
-
39.6
750.1
Adjusted Operating Return on Capital
7.2%
5.9%
29.8%
4.3%
16.9%
7.2%
-
6.6%
5.4%
Adjusted Operating Return on Equity
(4)
8.3%
(in millions USD, unless otherwise indicated)
Retirement
Annuities
Individual Life
Employee Benefits
Beginning Capital
(2)
4,087
2,288
336
2,172
408
9,291
3,010
1,076
13,377
Ending Capital
(2)
4,333
2,471
275
2,545
413
10,037
3,452
311
13,800
Average Capital
(3)
4,210
2,380
306
2,359
410
9,665
3,231
693
13,589
Adjusted operating earnings before interest and after
income taxes
258.5
79.1
56.9
185.7
54.1
634.3
-
61.5
695.8
Operating Return on Capital
6.1%
3.3%
18.6%
7.9%
13.2%
6.6%
-
8.9%
5.1%
Ongoing Business Operating Return on Equity
(4)
7.6%
(3)
(2)
(4)
(1)
Year Ended December 31, 2012
Retirement Solutions
Investment
Management
Insurance Solutions
Ongoing Business
Closed Block
Variable Annuity
Corporate and Other
Closed Blocks
Consolidated
Year Ended December 31, 2013
Retirement Solutions
Investment
Management
Insurance Solutions
Ongoing Business
Closed Block
Variable Annuity
Corporate and Other
Closed Blocks
Consolidated
Year Ended December 31, 2011
Retirement Solutions
Investment
Management
Insurance Solutions
Ongoing Business
Closed Block
Variable Annuity
Corporate and Other
Closed Blocks
Consolidated
Capital is allocated to each of our segments in proportion to each segment’s target statutory
capital, plus an allocation of the differences between statutory capital and total ING U.S., Inc.
shareholders' equity on a GAAP basis (excluding AOCI), based on each segment’s portion of these
differences. Statutory surplus in excess of target statutory capital and certain corporate assets
and liabilities, such as certain deferred tax assets and liabilities for unfunded pension plans, are
allocated to the Corporate segment. Capital excludes "operating leverage". See "Average Capital and
Financial Leverage" in the Statistical Supplement.
Calculated as Beginning Capital plus Ending Capital, divided by 2.
Assumes debt-to-capital ratio of 25% for all time periods presented, a weighted average
pre-tax interest rate of 5.5% for all periods prior to the third quarter of 2013, when the company completed
recapitalization, and the actual weighted average pre-tax interest rate for all periods starting
with the third quarter of 2013. The 1/1/13 beginning capital is different than the 12/31/12 ending capital at the segment level due to
certain reallocations of capital, primarily due to recapitalization activity (completed and anticipated).
|
 38
Retirement •
Investments •
Insurance
Making a secure financial future possible – one person, one family, one institution at a time |