Attached files
| file | filename |
|---|---|
| 8-K - 8-K - Kraft Foods Group, Inc. | d695467d8k.htm |
 Kraft Foods
Group CAGE Conference
March 17, 2014
Exhibit 99.1 |
 Chris
Jakubik Head of Investor Relations |
| 3
Kraft Foods Group, Inc.
Forward-Looking Statements
This
presentation
contains
a
number
of
forward-looking
statements.
The
words
“plan,”
“drive,”
“make,”
“develop,”
“progress,”
“change,”
“deliver,”
“extend,”
“invest,”
“become,”
“improve,”
“grow,”
“target”
and
similar
expressions
are
intended
to
identify
the
forward-looking
statements.
Examples
of
forward-looking
statements
include,
but
are
not
limited
to,
statements
regarding
Kraft’s
growth,
progress,
investments,
plans
relating
to
efficiency,
business
process
and
simplification,
productivity,
overheads,
innovation,
marketing
and
advertising,
share
of
voice,
cost
management
and
cost
savings
plans,
long-term
targets
and
outlook
for
the
North
American
Food
and
Beverage
market,
priorities
for
free
cash
flow
and
dividends.
These
forward-looking
statements
are
not
guarantees
of
future
performance
and
are
subject
to
a
number
of
risks
and
uncertainties,
many
of
which
are
beyond
Kraft’s
control.
Important
factors
that
could
cause
actual
results
to
differ
materially
from
those
indicated
in
the forward-
looking
statements
include,
but
are
not
limited
to,
increased
competition;
Kraft’s
ability
to
maintain,
extend
and
expand
its
reputation
and
brand
image;
Kraft’s
ability
to
differentiate
its
products
from
other
brands;
increasing
consolidation
of
retail
customers;
changes
in
relationships
with
significant
customers
and
suppliers;
Kraft’s
ability
to
predict,
identify
and
interpret
changes
in
consumer
preferences
and
demand;
Kraft’s
ability
to
drive
revenue
growth
in
its
key
product
categories,
increase
its
market
share,
or
add
products;
volatility
in
commodity,
energy
and
other
input
costs;
changes
in
Kraft’s
management
team
or
other
key
personnel;
Kraft’s
geographic
focus
in
North
America;
changes
in
regulations;
legal
claims
or
other
regulatory
enforcement
actions;
product
recalls
or
product
liability
claims;
unanticipated
business
disruptions;
Kraft’s
ability
to
complete
or
realize
the
benefits
from
potential
acquisitions,
alliances,
divestitures
or
joint
ventures;
Kraft’s
indebtedness
and
ability
to
pay
such
indebtedness;
disruptions
in
information
technology
networks
and
systems;
Kraft’s
inability
to
protect
intellectual
property
rights;
weak
economic
conditions;
tax
law
changes;
volatility
of
market-based
impacts
to
post-employment
benefit
plans;
pricing
actions;
and
other
factors.
For
additional
information
on
these
and
other
factors
that
could
affect
Kraft’s
forward-looking
statements,
see
Kraft’s
risk
factors,
as
they
may
be
amended
from
time
to
time,
set
forth
in
its
filings
with
the
Securities
and
Exchange
Commission,
including
its
most
recently
filed
Annual
Report
on
Form
10-K
and
subsequent
reports
on
Form
10-Q
and
Form
8-K.
Kraft
disclaims
and
does
not
undertake
any
obligation
to
update
or
revise
any
forward-looking
statement
in
this
presentation,
except
as
required
by
applicable
law
or
regulation. |
| 4
Kraft Foods Group, Inc.
Kraft Foods Group
•
Our Plan and Our Progress
•
Driving Profitable Growth in Our Industry
•
Q&A |
 5
We
Have
the
Best
Sandbox
in
Our
Industry |
 6
Kraft Foods Group, Inc.
Superior
Dividend
Payout
Profitable
Top-Line
Growth
Consistent
Bottom-Line
Growth
Make
Kraft
North
American
Food
&
Beverage
Company
Best
Investment
in
the
Industry |
 7
Kraft Foods Group, Inc.
Our Plan
Make Our
People Our
Competitive
Edge
Execute with
Excellence
Turbocharge
Our Iconic
Brands
Redefine
Efficiency |
 8
Kraft Foods Group, Inc.
Remaking Kraft
•
Recruit the best
•
Develop the best
•
Reward the best |
 9
Kraft Foods Group, Inc.
Right Tools
•
Lean
Six
Sigma
gaining
traction
•
Integrated
Business
Planning
implementation
on
track
•
Top-rated
sales
capabilities |
 10
Kraft Foods Group, Inc.
Rejuvenating Our Brands, One-by-One
•
Good-better-best
price/value
ladders
in
two-thirds
of
franchises
•
Realizing
solid
returns
on
investments
made
•
Improving
our
share
of
voice |
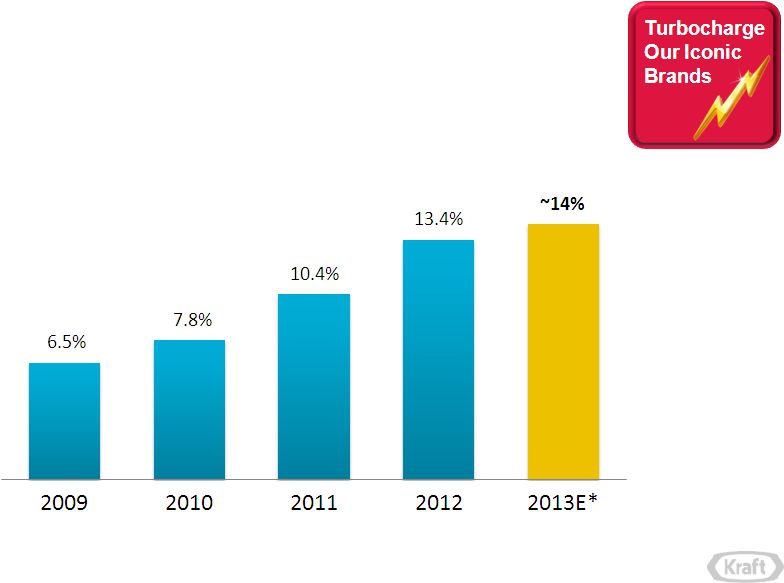 11
Kraft Foods Group, Inc.
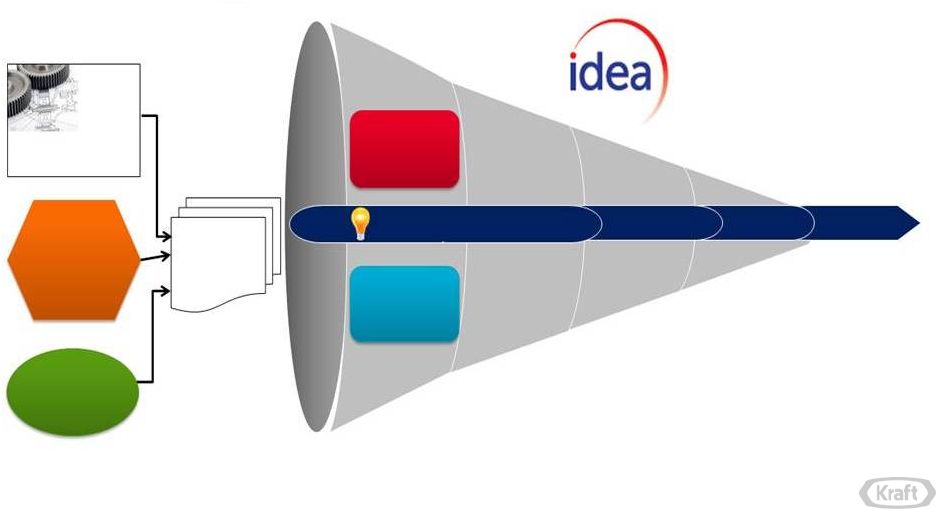
Innovation Where it Needs to be
%
Net
Revenue
from
New
Product
Innovation
Over
Prior
3
Years
Source:
U.S.
Nielsen
Consumption
-
3-Outlet
(2009-2011)
and
All
Outlet-xAOC
(2012-2013),
*2013
Estimate |
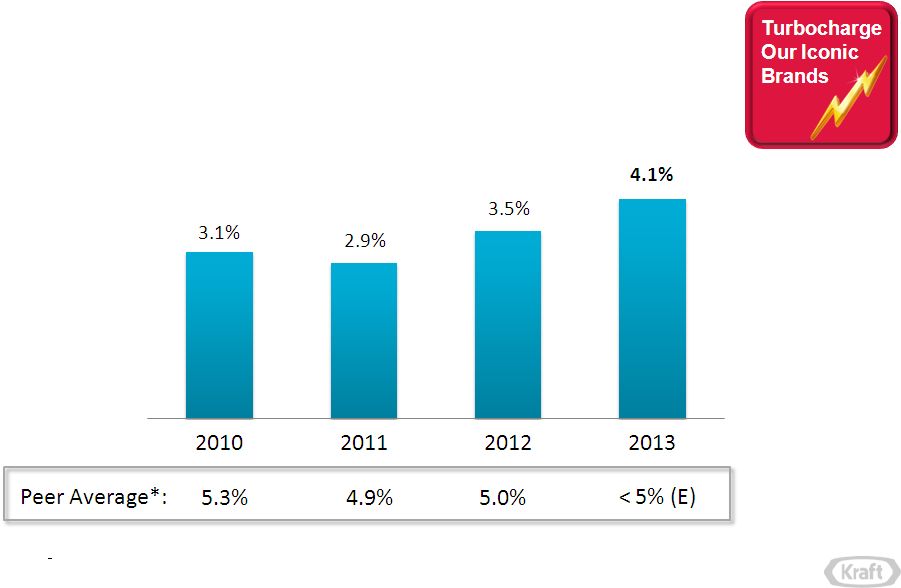 12
Kraft Foods Group, Inc.
Increasing Our Share of Voice
*
Fiscal
year
average
of
Campbell
Soup,
Coca-Cola,
ConAgra,
Dr
Pepper
Snapple,
General
Mills,
Heinz,
Hershey,
Hillshire,
Hormel,
Kellogg,
McCormick,
Mondelez,
Nestle,
PepsiCo,
Smithfield,
J.M.
Smucker,
Unilever;
Source:
Company
SEC
filings
Advertising
as
a
%
of
Net
Revenue |
 13
Kraft Foods Group, Inc.
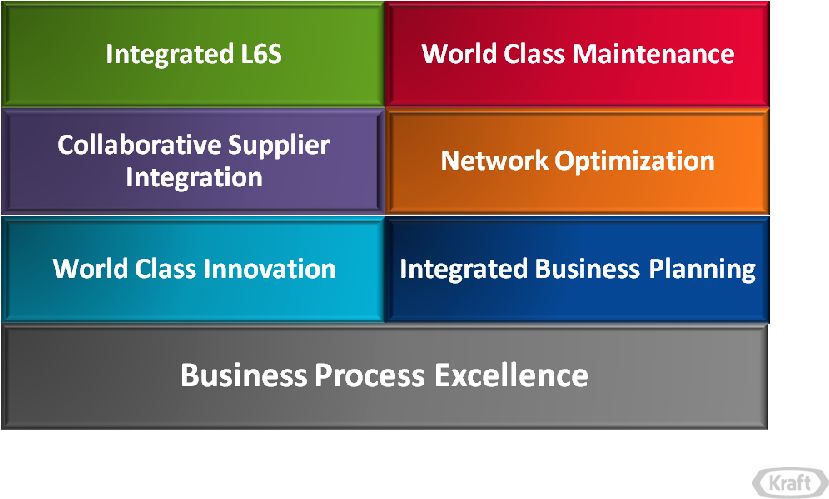
Established Our Building Blocks
Integrated L6S
World Class Maintenance
Collaborative Supplier
Integration
Network Optimization
Integrated Business Planning
World Class Innovation
Business Process Excellence |
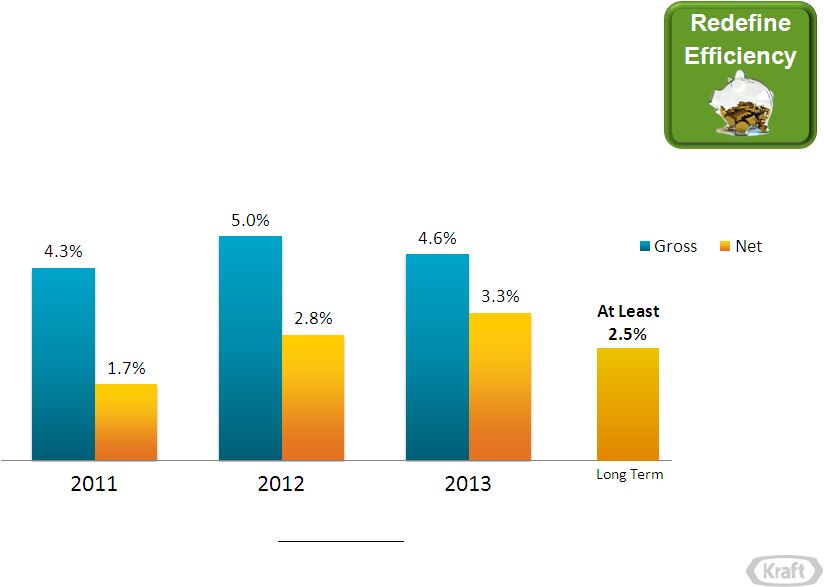 14
Kraft Foods Group, Inc.
Becoming a Low Cost Producer
•
Delivering industry-leading productivity
Gross and Net Productivity
*
as a % of COGS
*
Net
Productivity
Gross
productivity
less
inflation,
business
investments
and
changes
in
HQ
overhead
supporting
COGS |
 15
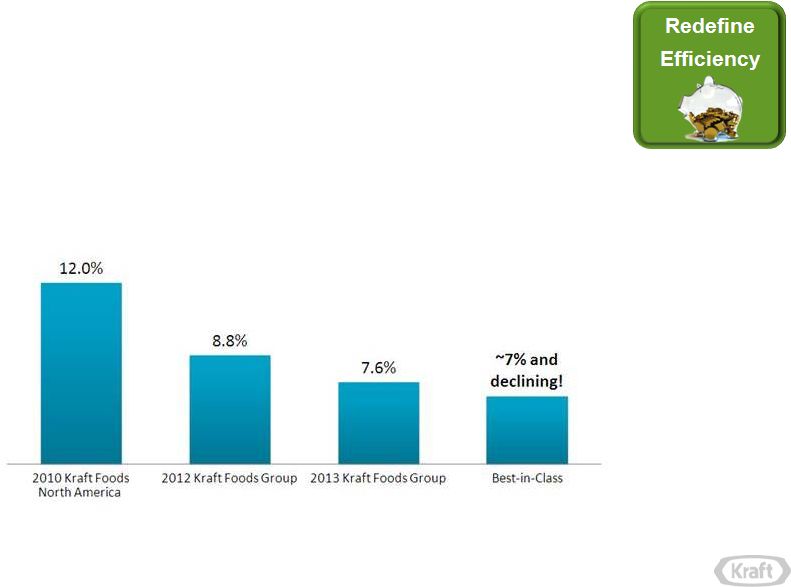
Kraft Foods Group, Inc.
Becoming a Low Cost Producer
•
Redefining
lowest-cost
overheads
while
investing
in
people
and
net
job
creation
Overhead Costs as a % of Net Revenue |
 16
Kraft Foods Group, Inc.
On Plan with Our Plan
Make
Our
People
Our
Competitive
Edge
Execute with
Excellence
Turbocharge
Our
Iconic
Brands
Redefine
Efficiency |
 Teri
List-Stoll Chief Financial Officer |
| 18
Kraft Foods Group, Inc.
Our Market is Changing…
Fast
•
Kraft
products
are
in
98%
of
North
American
households
•
We
have
an
obligation
to
our
consumers
and
customers
to
innovate
and
contemporize
our
portfolio
•
We’re
facing
an
unprecedented
confluence
of
factors |
 19
Kraft Foods Group, Inc.
C’s of Change
Photo
Source:
ABC
Modern
Family
-
TV
Guide
Magazine |
 20
Kraft Foods Group, Inc.
Several Megatrends are Changing the Game
Low
Income
Middle
Income
High
Income
26.5%
54.9%
18.6%
2009
28.9%
52.7%
18.4%
2012
Source:
Kraft
Foods
Group,
Nielsen
Homescan
Panel,
2009
&2013
(L52
weeksending
Q4,
2013);
Low
Income
(<$30K)
Middle
Income
($30K
-
$100K)
High
Income
($100K+)
30.0%
51.1%
18.9%
2013
Modern
Families
Hispanic
consumers
represent
17%
of
U.S.
population
today
Millennials
represent
26%
of
U.S.
population
today
Keep
it
Real
Cultural
shift
toward
quality
of
life
and
“real
food”
“Less
processed”
credentials
becoming
primary
purchase
drivers |
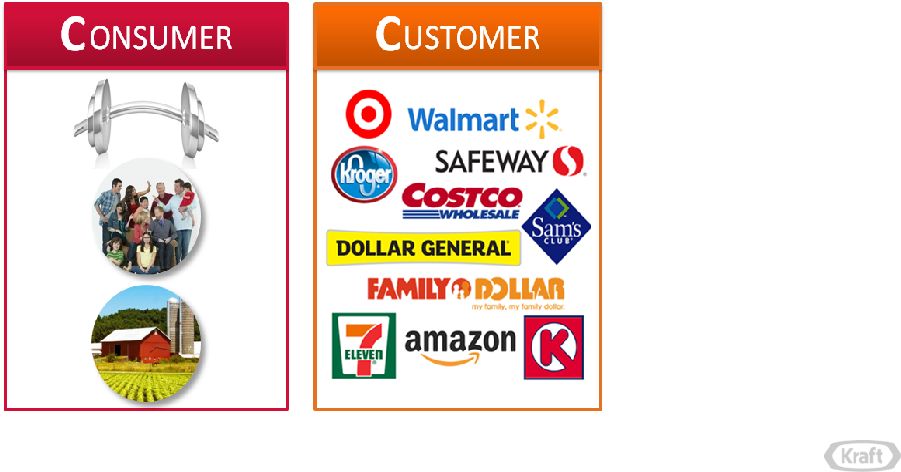 21
Kraft Foods Group, Inc.
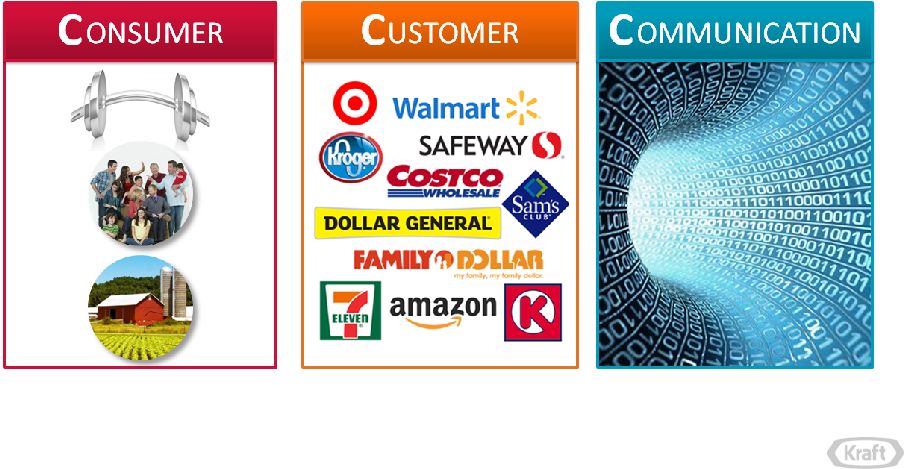
C’s of Change |
 22
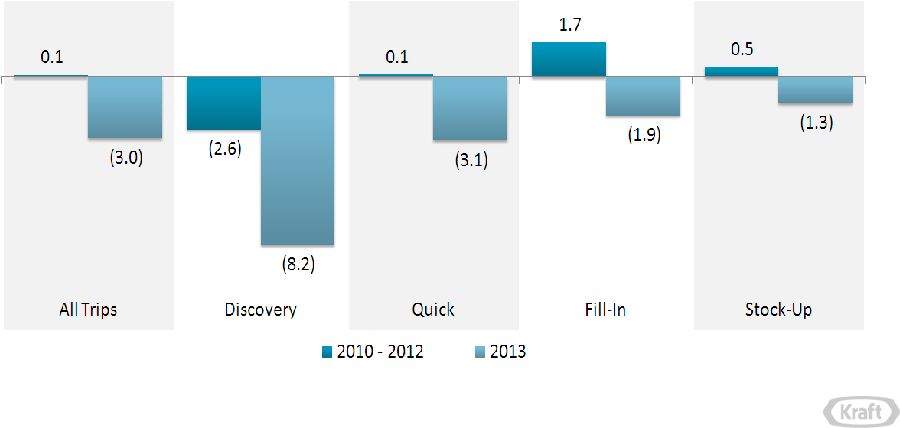
Kraft Foods Group, Inc.
Shopping Behavior More Planned, Purposed
Shopper Trips by Type
% Change vs Prior Year
Source: Nielsen Household Panel (US), Total F&B |
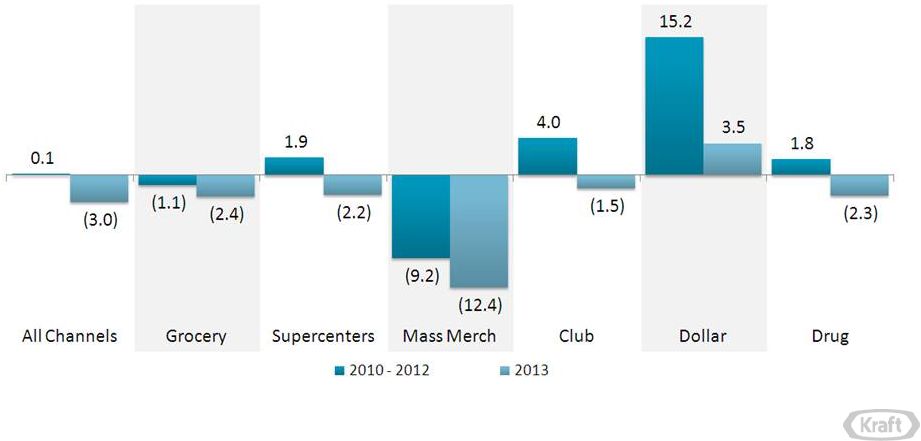 Source:
Nielsen Household Panel (US), Total F&B Consumers Shopping Less, Migrating
Channels Total Shopper Trips
% Change vs Prior Year
23
Kraft Foods Group, Inc. |
 24
Kraft Foods Group, Inc.
C’s of Change |
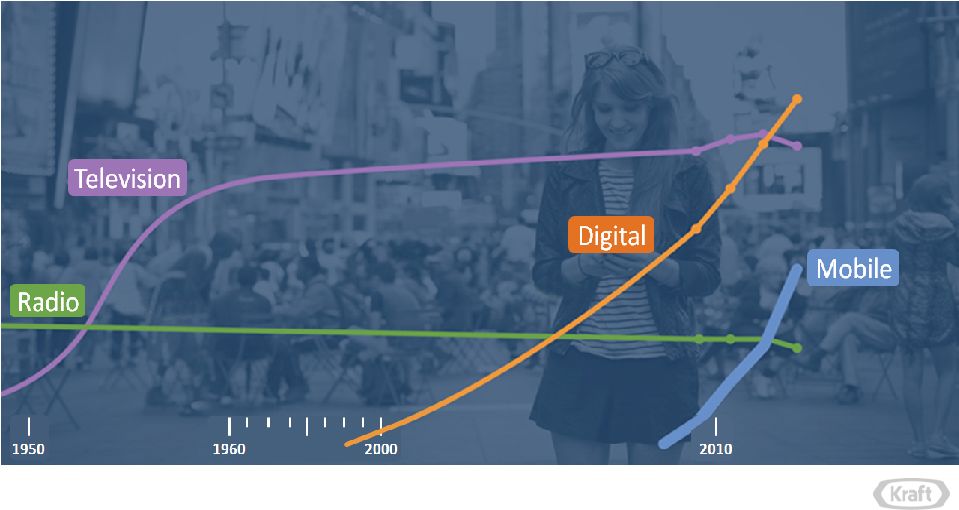 25
Kraft Foods Group, Inc.
Digital Surpasses TV in 2013
Source:
eMarketer,
US
,
July
2013 |
 26
Kraft Foods Group, Inc.
Opportunity Resides in Some Key Areas
•
Hispanics
•
Millennials
•
Economically-strapped consumers
•
Tech savvy consumers
•
Nutrition & Well-Being
•
Alternative channels |
 27
Kraft Foods Group, Inc.
Capture Profitable Growth by Evolving Our Playbook
Kraft Playbook 1.0
Great marketing
Best-in-industry innovation
Good-Better-Best price/value ladders
Lowest delivered cost
Reinvest 50¢
of every $ of cost savings
back into brands and people
Kraft Playbook 2.0
Reinvent marketing
Extend innovation to renovation
Brand ubiquity across retail channels
Total cost management
Reinvest 50¢
of every $ of cost savings
back into brands and people |
 28
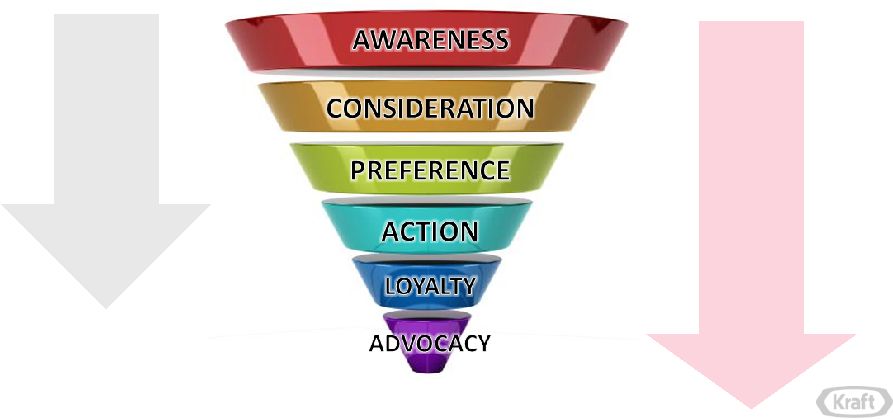
Kraft Foods Group, Inc.
Search, Buzz, Blog
Online User Reviews
Social Networks
Online Purchase
Friending
Links, Likes, Create Buzz
TV, Radio, Outdoor
Direct Mail
Product Test
In-store Purchase
Reward Points
Reinventing Marketing at Kraft
TRADITIONAL
BROADCAST MARKETING
TODAY’S
CONSUMER NETWORK |
 29
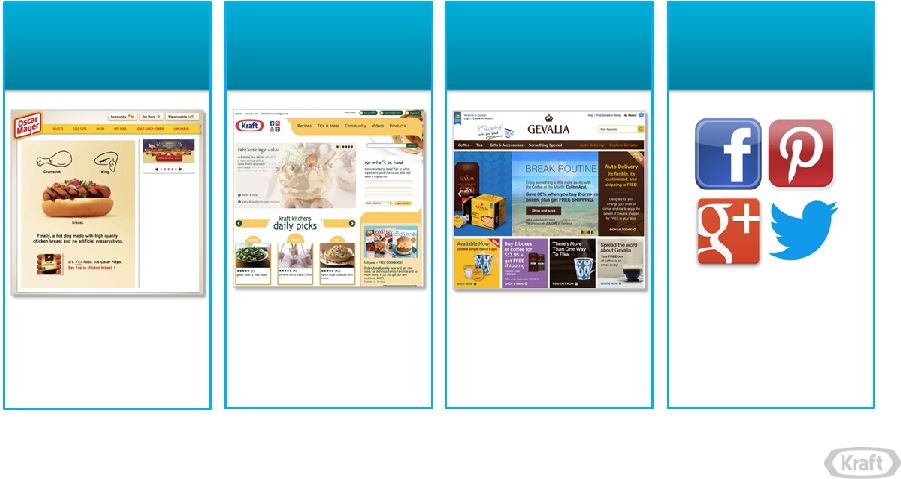
Kraft Foods Group, Inc.
Kraft as Publisher and Purveyor
Over 100 brand and
promotional web sites
kraftrecipes.com
comidakraft.com
web / mobile sites
2 online stores
Over 30 social
destinations
Brand
Destinations
Consumer
Relationship
Marketing
E-Commerce
Social |
 30
Kraft Foods Group, Inc.
Extending Innovation to Renovation
Innovation
Renovation
Execute
Assess
Develop
Ideate
Emerging
Technology
MegaTrends
MegaTrends
/Consumer
/Consumer
Insights
Insights
Brand
Brand
Destination
Destination
Product/
Package
Platforms |
 31
Kraft Foods Group, Inc.
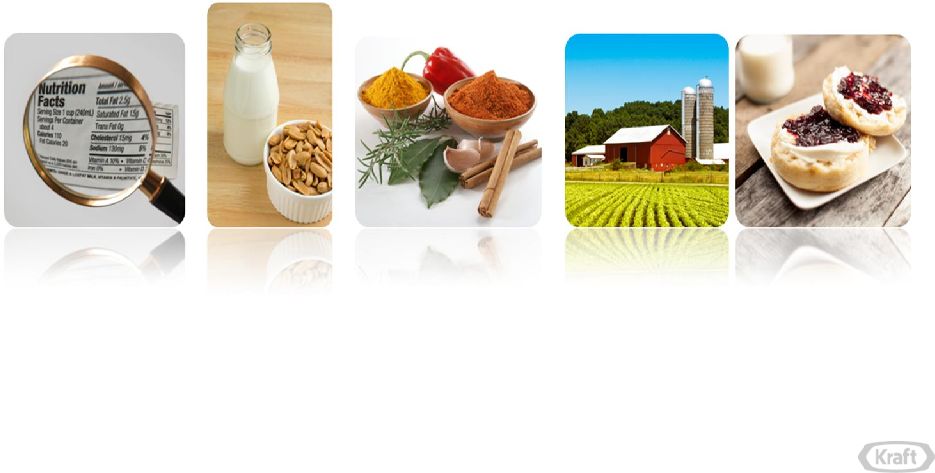
Innovation, Renovation Through a Broader Lens
Simpler
Ingredient Lines
Farm to Consumer
Reduced Calories &
Nutrients to Limit
Beneficial
Substances,
Food Groups and
Nutrients to
Encourage |
 32
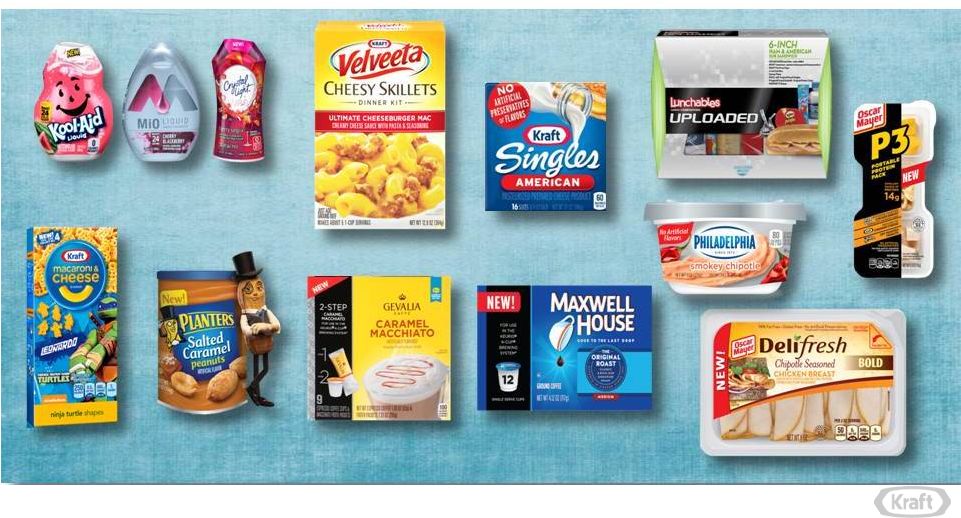
Kraft Foods Group, Inc.
2014 Big Bets |
 33
Kraft Foods Group, Inc.
Establishing Brand Ubiquity Across Channels
•
Establishing Kraft’s fair share across
channels is ~$1 billion net revenue
opportunity over next 3 years
•
Changing process and mindset is key
–
Ensure channels are part of
conversation when decisions made
–
Shift focus from gross margin to
operating income dollars
–
Manufacturing capable of multiple
pack sizes at effective cost
Kraft
Non Traditional
Channels
Total F&B
2010-2013 % Growth Contribution
Note: Non-traditional Channels include Value, Drug, Club, Convenience,
and Differentiated Grocery Stores (e.g., Trader Joe’s, Whole Foods, and
Aldi) Source: The Cambridge Group Analysis using Nielsen Homescan and
Scantrack 2013 and 2012; Progressive Grocer; Mintel; Kantar Retail; First Research
68%
32%
41%
59%
Grocery
+
Mass |
 34
Kraft Foods Group, Inc.
Capture Profitable Growth by Evolving Our Playbook
Kraft Playbook 1.0
Great marketing
Best-in-industry innovation
Good-Better-Best price/value ladders
Lowest delivered cost
Reinvest 50¢
of every $ of cost savings
back into brands and people
Kraft Playbook 2.0
Redefine great marketing
Extend innovation to renovation
Brand ubiquity across retail channels
Total cost management
Reinvest 50¢
of every $ of cost savings
back into brands and people |
 35
Kraft Foods Group, Inc.
Defining Total Cost Management at Kraft |
 36
Kraft Foods Group, Inc.
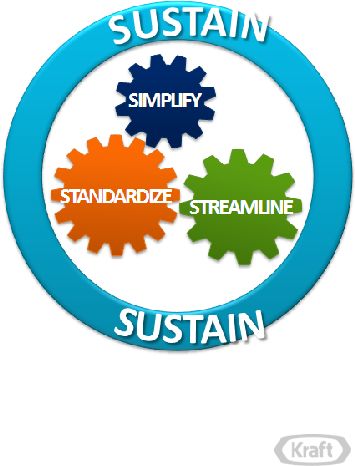
Driving “Mandated Best Practices”
•
SIMPLIFY
end-to-end processes with a
maniacal passion
•
STANDARDIZE
with rigor and discipline
based on “mandated best practices”
•
STREAMLINE
our capabilities to ensure
realization of benefits
•
SUSTAIN
through robust change
management
and disciplined governance |
 37
Kraft Foods Group, Inc.
*
*
*
* |
 38
Kraft Foods Group, Inc.
Capture Profitable Growth by Evolving Our Playbook
Kraft Playbook 1.0
Great marketing
Best-in-industry innovation
Good-Better-Best price/value ladders
Lowest delivered cost
Reinvest 50¢
of every $ of cost
savings back into brands and people
Kraft Playbook 2.0
Redefine great marketing
Extend innovation to renovation
Brand ubiquity across retail channels
Total cost management
Reinvest 50¢
of every $ of cost
savings back into brands and people |
 39
Kraft Foods Group, Inc.
A Sustainable Long-term Growth Algorithm
Metric
Long-Term Target
1
Market defined as the North American Food & Beverage market.
2
Operating Income, EPS and Free Cash Flow long-term targets exclude market-based
impacts to post-employment benefit plans. 3
Free Cash Flow defined as cash flow from operations less capital expenditures.
Organic Net Revenue
Operating Income
Dividends
Profitable growth at or above market growth
1
Consistent mid-single-digit growth
2
Consistent mid-single-digit growth
EPS
Consistent mid-to-high, single-digit growth
2
Free Cash Flow
At least 90% of net income
2,3
ROIC
Consistent year-to-year improvement |
 40
Kraft Foods Group, Inc.
Priorities for Free Cash Flow
Fund a highly competitive dividend
Fund a highly competitive dividend
Reinvest in the
business
Acquisitions that quickly
achieve EPS accretion and
an IRR > risk-adjusted
hurdle rate
Share
repurchase |
 41
Kraft Foods Group, Inc.
Make Kraft North American
Food & Beverage Company
Best Investment in the Industry
Profitable
Top-Line
Growth
Consistent
Bottom-Line
Growth
Superior
Dividend
Payout |
 |