Attached files
| file | filename |
|---|---|
| 8-K - 8-K - CMS ENERGY CORP | d693392d8k.htm |
Exhibit 99.1
Investor Meetings
March 17-21, 2014
Cross Winds® Energy Park Consumers Smart Energy Program
Jackson Gas Plant
This presentation is made as of the date hereof and contains “forward-looking statements” as defined in Rule 3b-6 of the Securities Exchange Act of 1934, Rule 175 of the Securities Act of 1933, and relevant legal decisions. The forward-looking statements are subject to risks and uncertainties. All forward-looking statements should be considered in the context of the risk and other factors detailed from time to time in CMS Energy’s and Consumers Energy’s Securities and Exchange Commission filings. Forward-looking statements should be read in conjunction with “FORWARD-LOOKING STATEMENTS AND
INFORMATION” and “RISK FACTORS” sections of CMS Energy’s and Consumers Energy’s Form 10-K for the year ended December 31, 2013. CMS Energy’s and Consumers Energy’s “FORWARD-LOOKING STATEMENTS AND INFORMATION” and “RISK FACTORS” sections are incorporated herein by reference and discuss important factors that could cause CMS Energy’s and Consumers Energy’s results to differ materially from those anticipated in such statements. CMS Energy and Consumers Energy undertake no obligation to update any of the information presented herein to reflect facts, events or circumstances after the date hereof.
The presentation also includes non-GAAP measures when describing CMS Energy’s results of operations and financial performance. A reconciliation of each of these measures to the most directly comparable GAAP measure is included in the appendix and posted on our website at www.cmsenergy.com.
CMS Energy provides historical financial results on both a reported (Generally Accepted Accounting Principles) and adjusted (non-GAAP) basis and provides forward-looking guidance on an adjusted basis. Management views adjusted earnings as a key measure of the company’s present operating financial performance, unaffected by discontinued operations, asset sales, impairments, regulatory items from prior years, or other items. These items have the potential to impact, favorably or unfavorably, the company’s reported earnings in future periods. Because the company is not able to estimate the impact of these matters, the company is not providing a reconciliation to the comparable future period reported earnings.
| 1 |
|
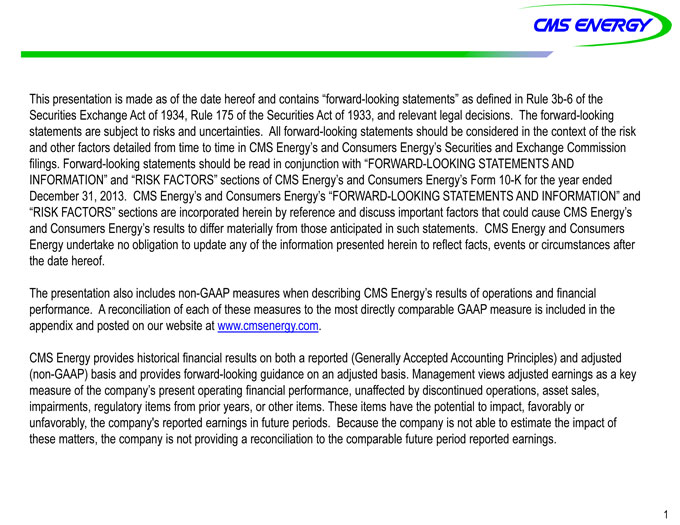
Territory Overview
• Fourth largest combination
utility in the United States
| • |
|
1.8 million electric and 1.7 |
million gas customers
• 8,600 MW of owned and
purchased generation
Lake Winds ® Capacity
Energy Park
Cross Winds®
Energy Park • 312 TBtu of gas storage
Capacity
• Premium regulatory
Environment
one of largest investors and employers in Michigan.
| 2 |
|
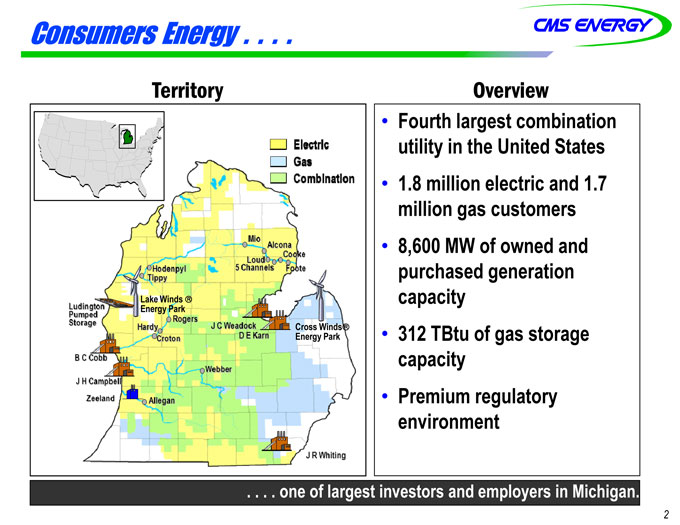
Mindset
10-Year Actual $1.66
Dividend 7% CAGR
EPS $1.78 5%—7%
Peers 4% $1.74
$1.55
| $1.36 |
|
$1.45 |
| $1.26 |
|
6% |
| $1.21 |
|
a $1.08 |
6% 5%—7%
| $1.08 |
|
14% $1.02 |
$0.96 96¢
$0.90 27% 84¢
$0.81 Int’l Sale $0.84 32% 66¢
39% 50¢
80%
36¢
20¢
2003 2004 2005 2006 2007 2008 2009 2010 2011 2012 2013 2014 Future
Dividend Payout 0% 25% 30% 40% 49% 58% 62% 62% 60%-70%
Adjusted EPS (non-GAAP) excluding MTM in 2004-2006 a $1.25 excluding discontinued Exeter operations and accounting changes related to convertible debt and restricted stock
. . . . drives consistent “real” EPS growth.
3
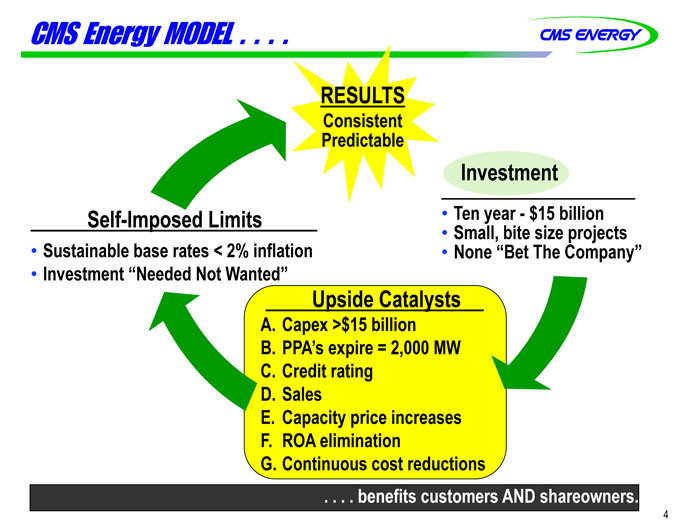
CMS Energy MODEL . . . .
RESULTS
Consistent Predictable
Investment
Self-Imposed Limits Ten year—$15 billion Sustainable base rates < 2% inflation Small, bite size projects
None “Bet The Company”
Investment “Needed Not Wanted”
Upside Catalysts
A. Capex >$15 billion B. PPA’s expire = 2,000 MW C. Credit rating D. Sales E. Capacity price increases F. ROA elimination G. Continuous cost reductions
. . . . benefits customers AND shareowners.
4
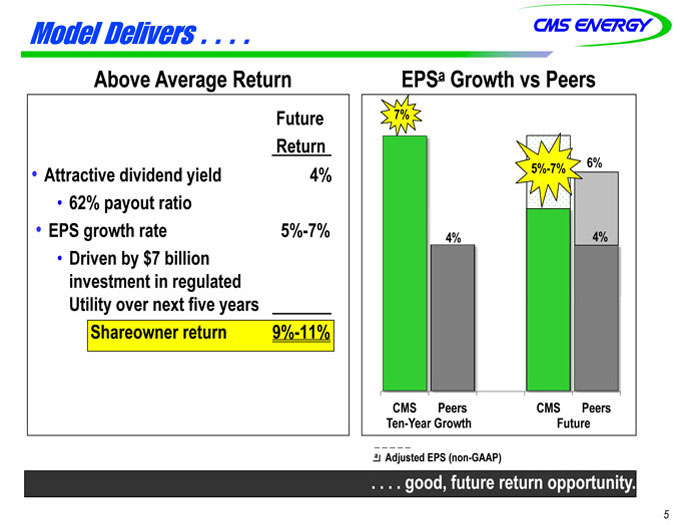
Model Delivers......
Above Average Return EPSa Growth vs Peers
Future 7%
Return
Attractive dividend yield 4% 5% 5%-7% 6%
62% payout ratio
EPS growth rate 5%-7% 4% 4%
Driven by $7 billion
investment in regulated
Utility over next five years
Shareowner return 9%-11%
CMS Peers CMS Peers
Ten-Year Growth Future
Adjusted EPS (non-GAAP)
......good, future return opportunity.
| 5 |
|
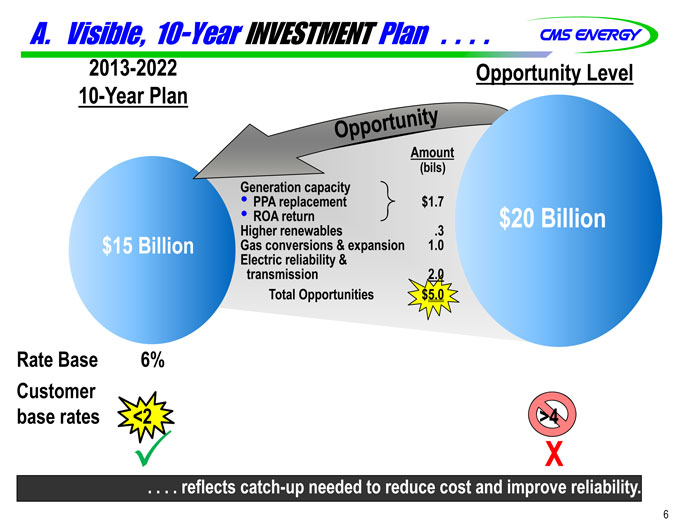
A. Visible, 10-Year INVESTMENT Plan . . . .
2013-2022 Opportunity Level
10-Year Plan
Amount
(bils)
Generation capacity
• PPA replacement $1.7
• ROA return
Higher renewables .3
Gas conversions & expansion 1.0
Electric reliability &
transmission 2.0
Total Opportunities $5.0
Rate Base 6%
Customer
base rates <2 >4
| X |
|
. . . . reflects catch-up needed to reduce cost and improve reliability.
| 6 |
|
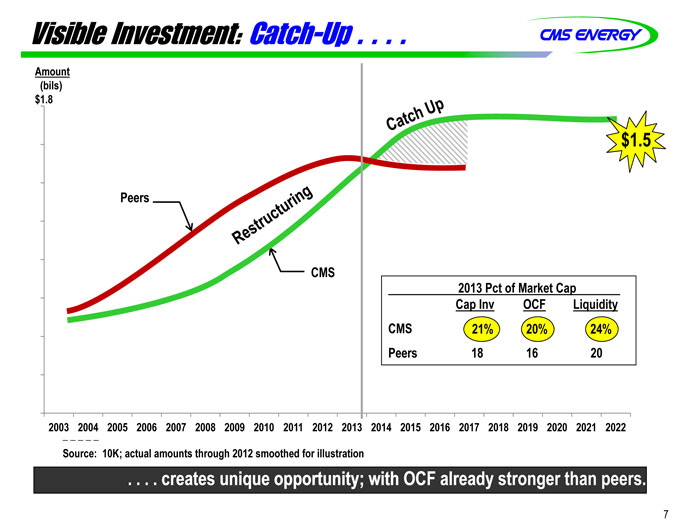
Visible Investment: Catch-Up
Amount
(bils)
$1.8
$1.5
Peers
CMS
2013 Pct of Market Cap
Cap Inv OCF Liquidity
CMS 21% 20% 24%
Peers 18 16 20
2003 2004 2005 2006 2007 2008 2009 2010 2011 2012 2013 2014 2015 2016 2017 2018 2019 2020 2021 2022
Source: 10K; actual amounts through 2012 smoothed for illustration
. . . . . . creates unique opportunity; with OCF already stronger than peers.
7
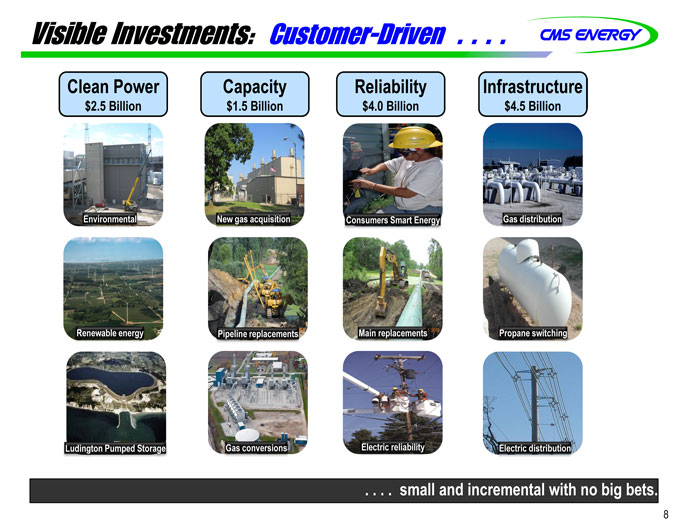
Visible Investments: Customer-Driven. . . . . . . .
Clean Power Capacity Reliability Infrastructure
$2.5 Billion $1.5 Billion $4.0 Billion $4.5 Billion
Environmental New gas acquisition Consumers Smart Energy Gas distribution
Renewable energy Pipeline replacements Main replacements Propane switching
Ludington Pumped Storage Gas conversions Electric reliability Electric distribution
. . . . . small and incremental with no big bets.
8
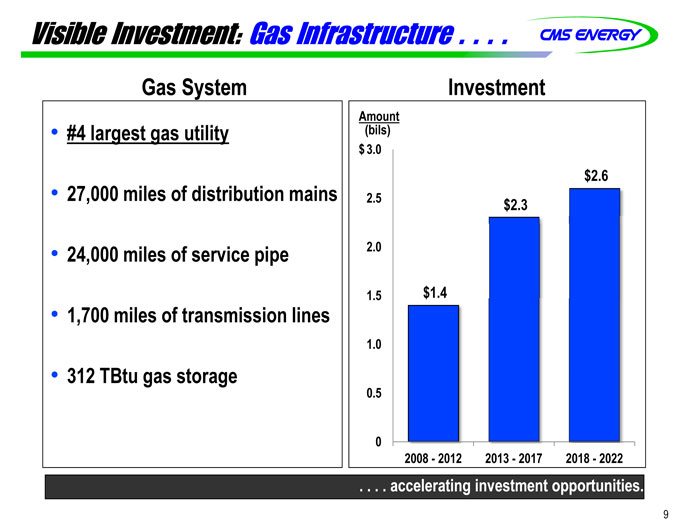
Visible Investment: Gas Infrastructure . . . . . .
Gas System Investment
Amount
• #4 largest gas utility(bils)
$ 3.0
$2.6
• 27,000 miles of distribution mains 2.5 $2.3
• 24,000 miles of service pipe 2.0
1.5 $1.4
• 1,700 miles of transmission lines
1.0
• 312 TBtu gas storage
0.5
0
2008 - 2012 2013 - 2017 2018 - 2022
accelerating investment opportunities.
9
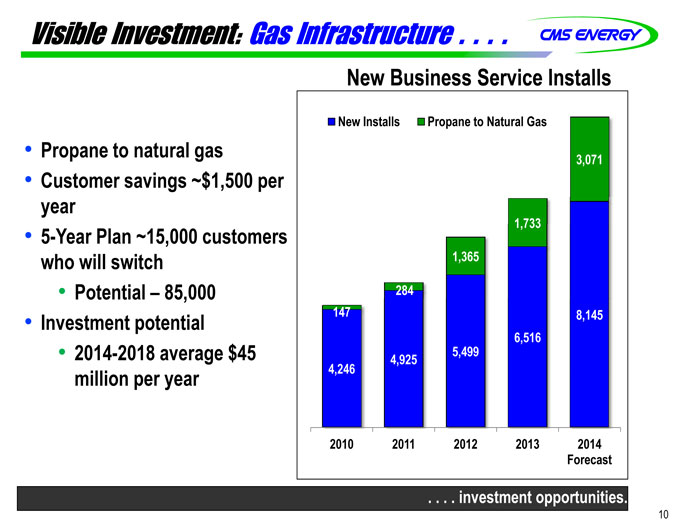
Visible Investment: Gas Infrastructure
New Business Service Installs
New Installs Propane to Natural Gas
• Propane to natural gas 3,071
• Customer savings ~$1,500 per
year
• 5-Year Plan ~15,000 customers 1,733
who will switch 1,365
• Potential – 85,000 284
• Investment potential 147 8,145
6,516
• 2014-2018 average $45 4,925 5,499
million per year 4,246
2010 2011 2012 2013 2014
Forecast
investment opportunities.
10
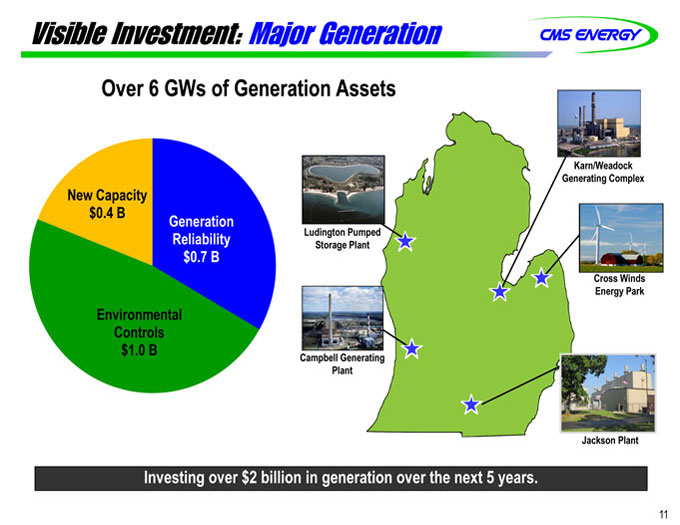
Visible Investment: Major Generation
Over 6 GWs of Generation Assets
Karn/Weadock
Generating Complex
New Capacity
$0.4 B Generation
Reliability Ludington Pumped
Storage Plant
$0.7 B
Cross Winds
Energy Park
Environmental
Controls
$1.0 B Campbell Generating
Plant
Jackson Plant
Investing over $2 billion in generation over the next 5 years.
11
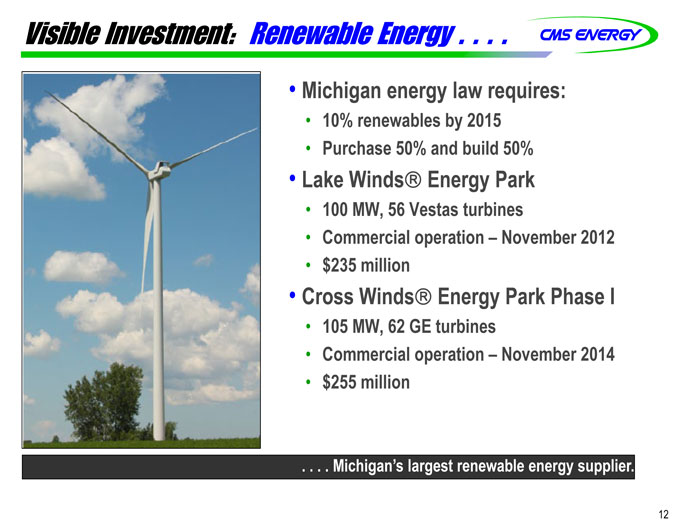
Visible Investment: Renewable Energy . . . .
• Michigan energy law requires:
• 10% renewables by 2015
• Purchase 50% and build 50%
• Lake Winds®Energy Park
• 100 MW, 56 Vestas turbines
• Commercial operation – November 2012
• $235 million
• Cross Winds®Energy Park Phase I
• 105 MW, 62 GE turbines
• Commercial operation – November 2014
• $255 million
. . . . Michigan’s largest renewable energy supplier.
12
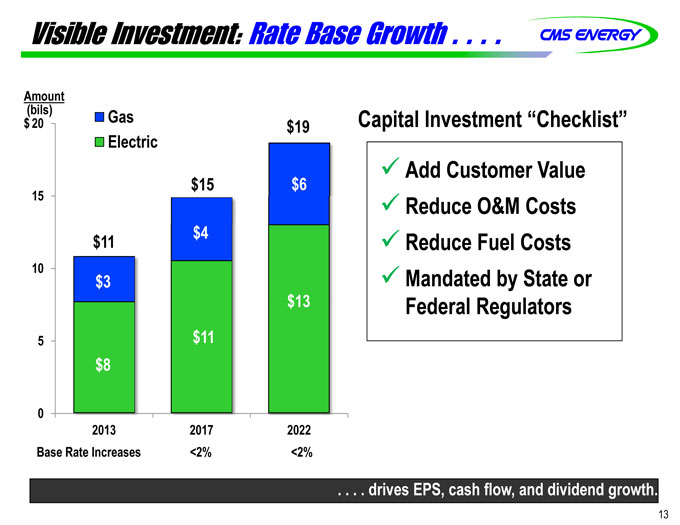
Visible Investment: Rate Base Growth
Amount
(bils) Gas Capital Investment “Checklist”
$ 20 $19
Electric
? Add Customer Value
$15 $6
15 ? Reduce O&M Costs
$11 $4 ? Reduce Fuel Costs
10 $3 ? Mandated by State or
$13 Federal Regulators
5 $11
$8
0
2013 2017 2022
Base Rate Increases <2% <2%
drivesrives EPS, cash flow, and dividend growth.
13
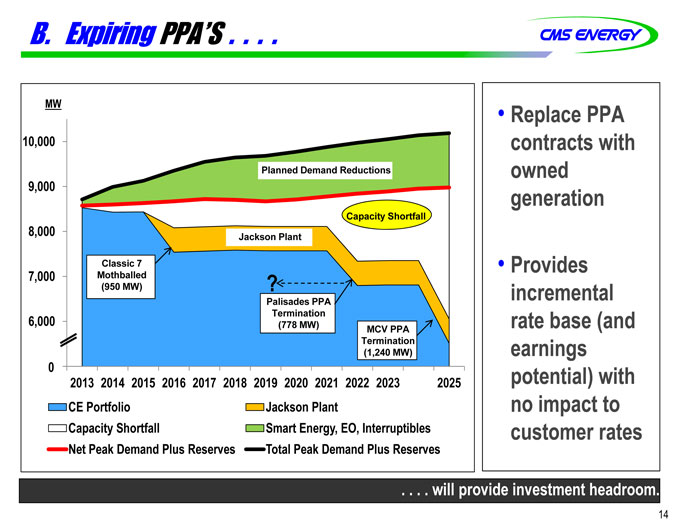
B. Expiring PPA’S
MW • Replace PPA
10,000 contracts with
Planned Demand Reductions owned
9,000 generation
Capacity Shortfall
8,000 Jackson Plant
Classic 7 • Provides
7,000 Mothballed
(950 MW) ? incremental
Palisades PPA
Termination
6,000(778 MW) rate base (and
MCV PPA
Termination
(1,240 MW) earnings
0 2013 2014 2015 2016 2017 2018 2019 2020 2021 2022 2023 2025 potential) with
CE Portfolio Jackson Plant no impact to
Capacity Shortfall Smart Energy, EO, Interruptibles customer rates
Net Peak Demand Plus Reserves Total Peak Demand Plus Reserves
will provide investment headroom.
14
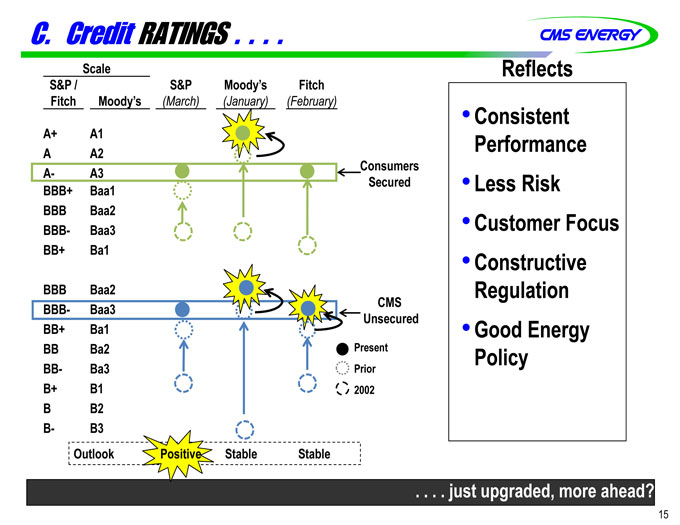
C. Credit RATINGS
Scale Reflects
S&P / S&P Moody’s Fitch
Fitch Moody’s(March)(January)(February) • Consistent
A+ A1 Performance
A A2
A- A3 Consumers
BBB+ Baa1 Secured • Less Risk
BBB Baa2 • Customer Focus
BBB- Baa3
BB+ Ba1 • Constructive
BBB Baa2 Regulation
BBB- Baa3 CMS
Unsecured
BB+ Ba1 • Good Energy
BB Ba2 Present Policy
BB- Ba3 Prior
B+ B1 2002
B B2
B- B3
Outlook Positive Stable Stable
just upgraded, more ahead?
15
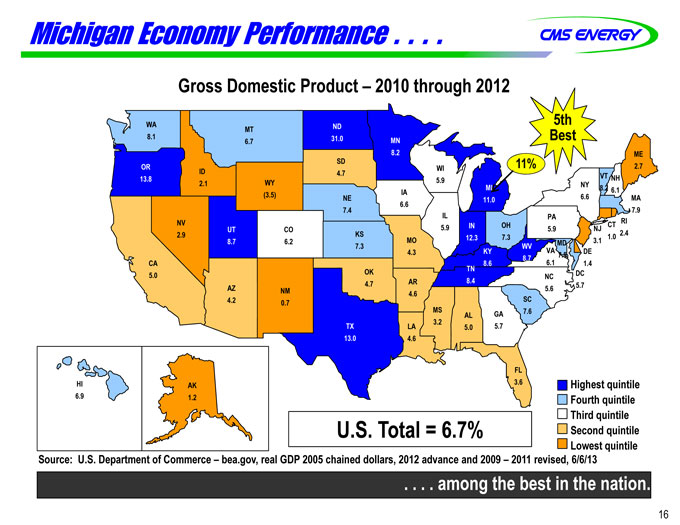
Michigan Economy Performance
Gross Domestic Product – 2010 through 2012
WA 5th
MT
8.1 6.7 Best
ME
SD WI 11% 2.7
ID 4.7 5.9 VT NH
2.1 WY NY
IA 8.2 6.1
(3.5) NE 6.6 MA
6.6
7.4 7.9
IL PA
NV UT CO 5.9 IN OH 5.9 NJ CT RI
2.9 KS 12.3 7.3 1.0 2.4
6.2 7.3 MO WV MD 3.1
4.3 KY VA 7.5 DE
CA 6.1 1.4
OK TN
5.0 NC DC
AZ 4.7 AR 8.4 5.6 5.7
NM 4.6
4.2 0.7 SC
MS AL GA 7.6
3.2
TX LA 5.0 5.7
13.0 4.6
FL
HI AK 3.6 Highest quintile
6.9 1.2 Fourth quintile
Third quintile
U.S. Total = 6.7% Second quintile
Lowest quintile
Source: U.S. Department of Commerce – bea.gov, real GDP 2005 chained dollars, 2012 advance and 2009 – 2011 revised, 6/6/13
among the best in the nation.
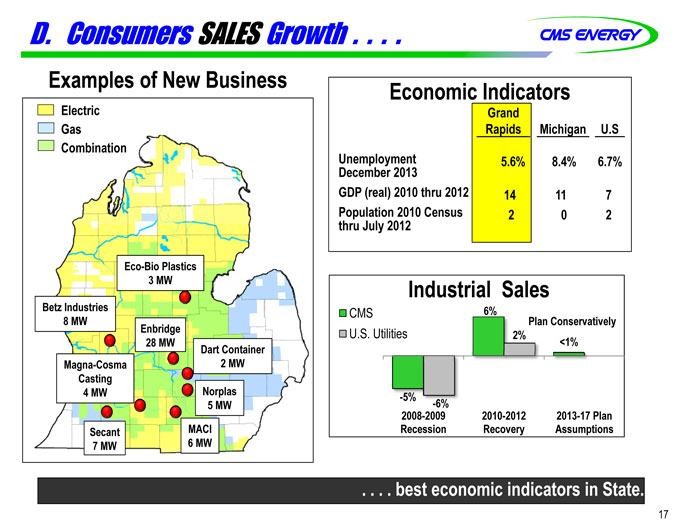
D. Consumers SALES Growth
Examples of New Business Economic Indicators
Electric Grand
Gas Rapids Michigan U.S
Combination
Unemployment 5.6% 8.4% 6.7%
December 2013
GDP (real) 2010 thru 2012 14 11 7
Population 2010 Census 2 0 2
thru July 2012
Eco-Bio Plastics
3 MW Industrial Sales
Betz Industries CMS 6%
8 MW Plan Conservatively
Enbridge U.S. Utilities 2%
28 MW <1%
Dart Container
Magna-Cosma 2 MW
Casting
4 MW Norplas -5%
5 MW -6%
2008-2009 2010-2012 2013-17 Plan
Secant MACI Recession Recovery Assumptions
7 MW 6 MW
best economic indicators in State.
17
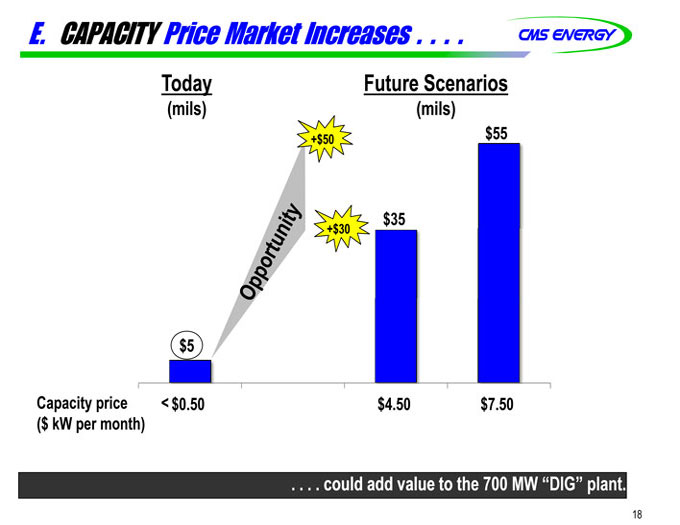
E. CAPACITY Price Market Increases
Today Future Scenarios
(mils)(mils)
+$50 $55
+$30 $35
$5
Capacity price < $0.50 $4.50 $7.50
($ kW per month)
could add value to the 700 MW “DIG” plant.
18
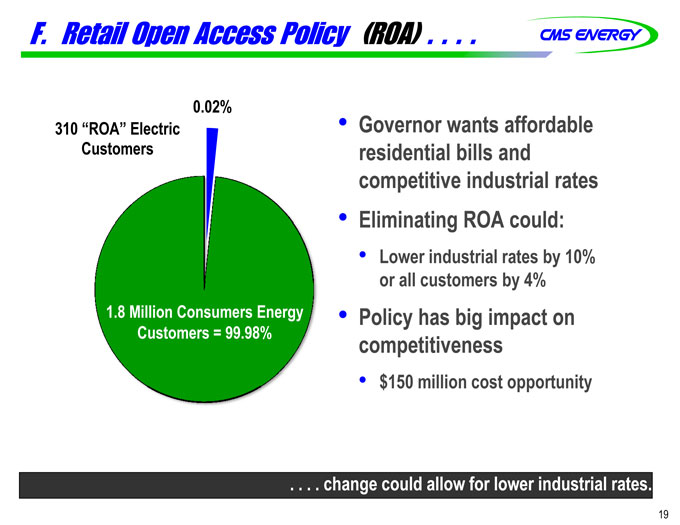
F. Retail Open Access Policy(ROA)
0.02%
310 “ROA” Electric • Governor wants affordable
Customers residential bills and
competitive industrial rates
• Eliminating ROA could:
• Lower industrial rates by 10%
or all customers by 4%
1.8 Million Consumers Energy • Policy has big impact on
Customers = 99.98% competitiveness
• $150 million cost opportunity
change could allow for lower industrial rates.
19
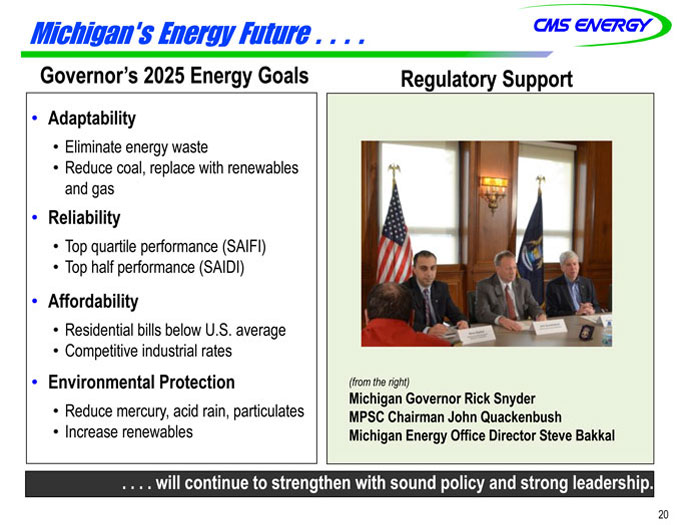
Michigan’s Energy Future
Governor’s 2025 Energy Goals Regulatory Support
• Adaptability
• Eliminate energy waste
• Reduce coal, replace with renewables
and gas
• Reliability
• Top quartile performance (SAIFI)
• Top half performance (SAIDI)
• Affordability
• Residential bills below U.S. average
• Competitive industrial rates
• Environmental Protection(from the right)
Michigan Governor Rick Snyder
• Reduce mercury, acid rain, particulates MPSC Chairman John Quackenbush
• Increase renewables Michigan Energy Office Director Steve Bakkal
will continue to strengthen with sound policy and strong leadership.
20
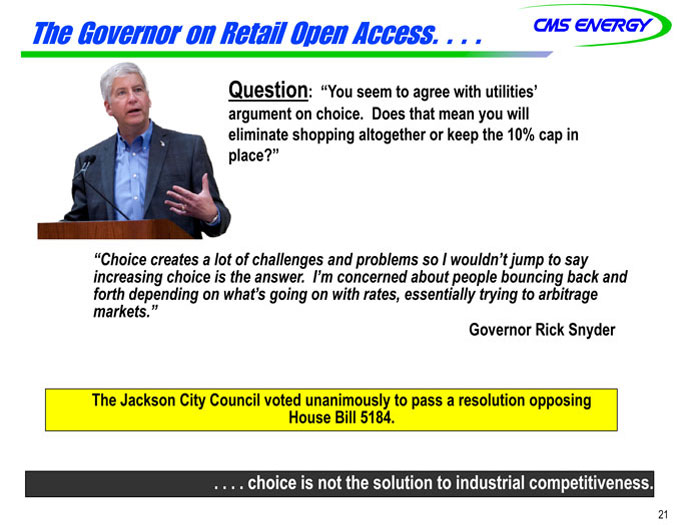
The Governor on Retail Open Access. . . .
Question: “You seem to agree with utilities’ argument on choice. Does that mean you will eliminate shopping altogether or keep the 10% cap in place?”
“Choice creates a lot of challenges and problems so I wouldn’t jump to say increasing choice is the answer. I’m concerned about people bouncing back and forth depending on what’s going on with rates, essentially trying to arbitrage markets.”
Governor Rick Snyder
The Jackson City Council voted unanimously to pass a resolution opposing House Bill 5184.
. . . . choice is not the solution to industrial competitiveness.
21
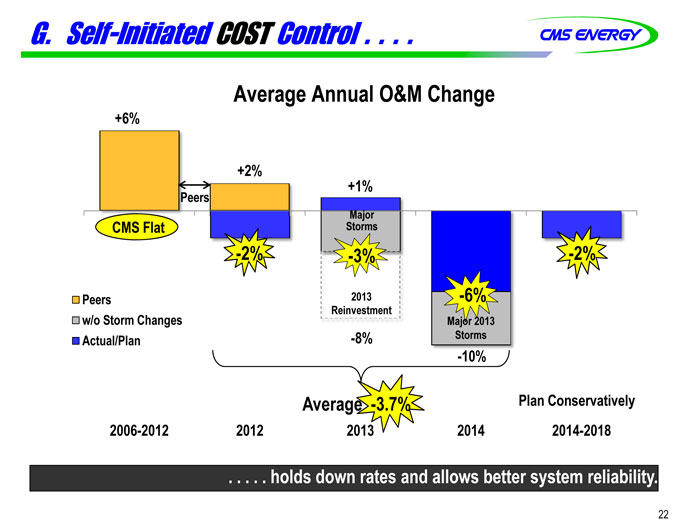
G. Self-Initiated COST Control
Average Annual O&M Change
+6%
+2%
+1%
Peers
Major
CMS Flat Storms
-2%—3% -2%
Peers 2013 -6%
Reinvestment
w/o Storm Changes Major 2013
Actual/Plan -8% Storms
-10%
Average -3.7% Plan Conservatively
2006-2012 2012 2013 2014 2014-2018
holds down rates and allows better system reliability.
22
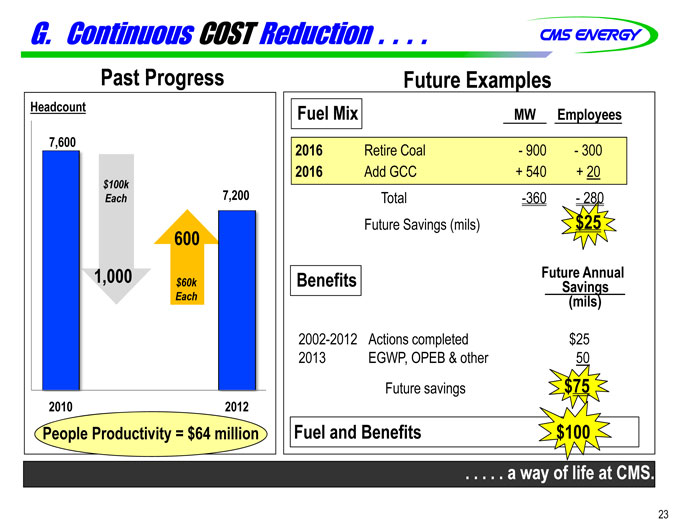
G. Continuous COST Reduction
Past Progress Future Examples
Headcount Fuel Mix MW Employees
7,600 2016 Retire Coal—900—300
2016 Add GCC + 540 + 20
$100k
Each 7,200 Total -360—280
Future Savings (mils) $25
600
1,000 $60k Benefits Future Savings Annual
Each(mils)
2002-2012 Actions completed $25
2013 EGWP, OPEB & other 50
Future savings $75
2010 2012
People Productivity = $64 million Fuel and Benefits $100
a way of life at CMS.
23
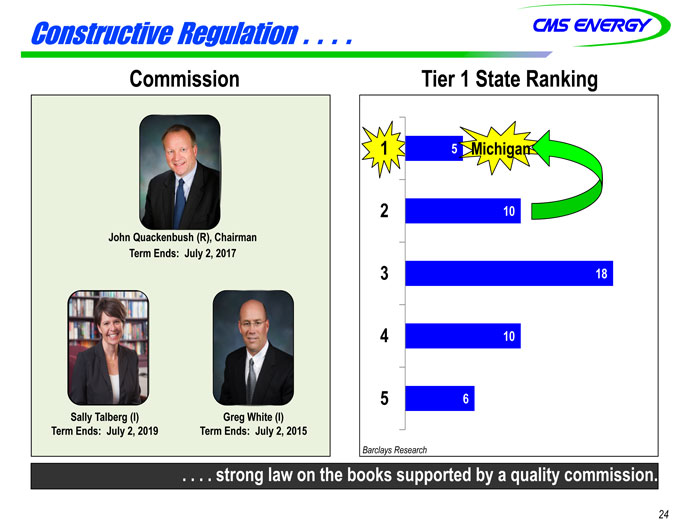
Constructive Regulation
Commission Tier 1 State Ranking
1 Michigan
2
John Quackenbush (R), Chairman
Term Ends: July 2, 2017
3
4
5
Sally Talberg (I) Greg White (I)
Term Ends: July 2, 2019 Term Ends: July 2, 2015
Barclays Research
strong law on the books supported by a quality commission.
24
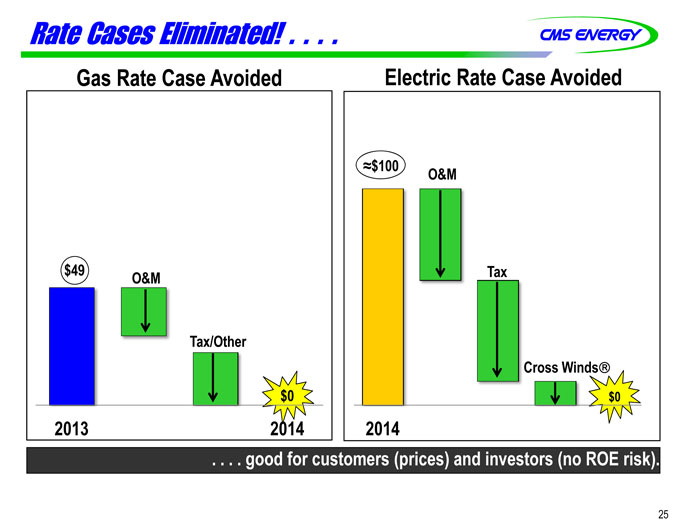
Rate Cases Eliminated!
Gas Rate Case Avoided Electric Rate Case Avoided
$100 O&M
$49 O&M Tax
Tax/Other
Cross Winds®
$0 $0
2013 2014 2014
good for customers (prices) and investors (no ROE risk).
25
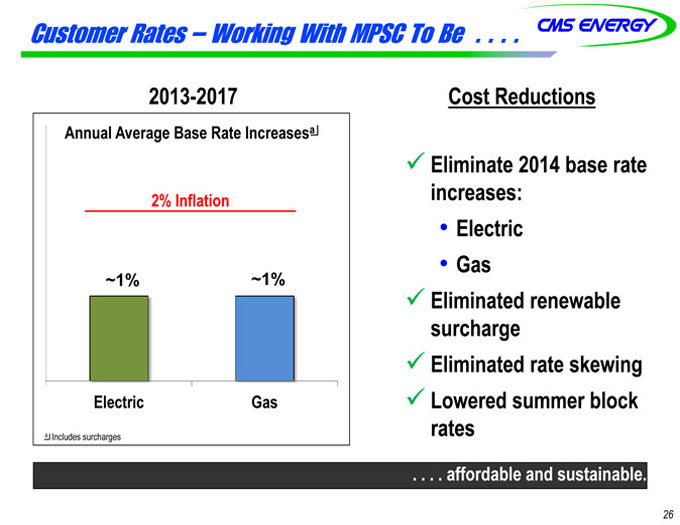
Customer Rates – Working With MPSC To Be
2013-2017 Cost Reductions
Annual Average Base Rate Increasesa
? Eliminate 2014 base rate
2% Inflation increases:
• Electric
• Gas
~1% ~1%
? Eliminated renewable
surcharge
? Eliminated rate skewing
Electric Gas ? Lowered summer block
a Includes surcharges rates
affordable and sustainable.
26
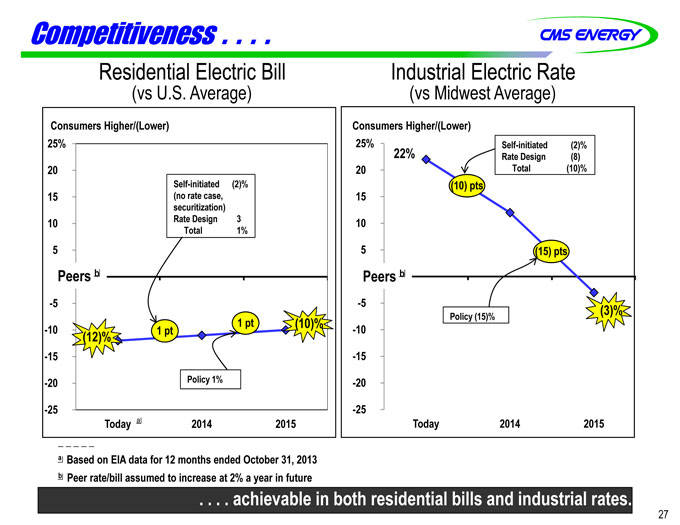
Competitiveness
Residential Electric Bill Industrial Electric Rate
(vss U.S. Average)(vss Midwest Average)
Consumers Higher/(Lower) Consumers Higher/(Lower)
25% 25% Self-initiated(2)%
22% Rate Design(8)
20% 20% Total(10)%
Self-initiated(2)%(10) pts
15%(no rate case, 15%
securitization)
10% Rate Design 3 10%
Total 1%
5% 5%(15) pts
Peers b Peers b
-5% -5%(3)%
| 1 |
|
pt(10)% Policy (15)% |
-10% 1 pt -10%
(12)%
-15% -15%
-20% Policy 1% -20%
-25% -25%
Today a 2014 2015 Today 2014 2015
a Based on EIA data for 12 months ended October 31, 2013
b Peer rate/bill assumed to increase at 2% a year in future
achievable in both residential bills and industrial rates.
| 27 |
|
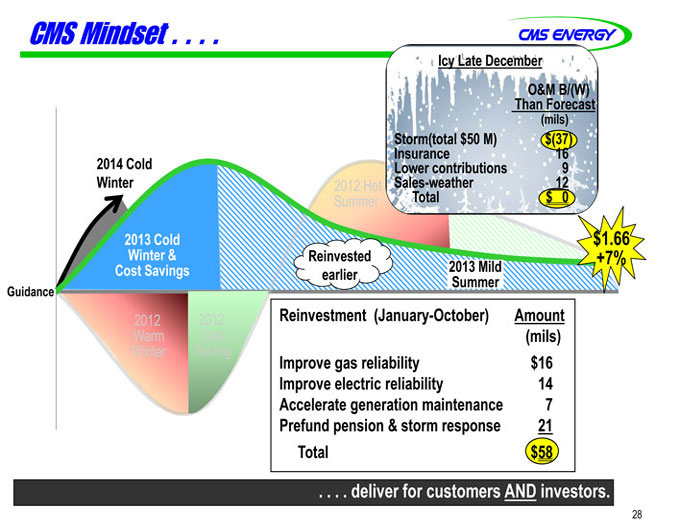
CMS Mindset
Icy Late December
O&M B/(W)
Than Forecast
(mils)
• Storm(total $50 M) $(37)
• Insurance 16
2014 Cold • Lower contributions 9
Winter 2012 Hot • Sales-weather 12
Summer Total $ 0
2013 Cold $1.66
Winter & Reinvested +7%
Cost Savings earlier 2013 Mild
Guidance Summer
2012 2012 Reinvestment (January-October) Amount
Warm Cost(mils)
Winter Saving Improve gas reliability $16
Improve electric reliability 14
Accelerate generation maintenance 7
Prefund pension & storm response 21
Total $58
deliver for customers AND investors.
28
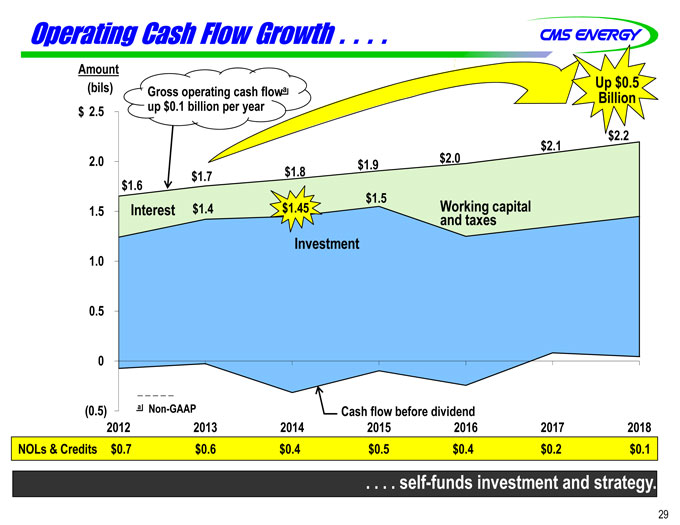
Operating Cash Flow Growth
Amount
(bils) Gross operating cash flowa Up $0.5
Billion
$ 2.5 up $0.1 billion per year
$2.2
$2.1
2.0 $1.9 $2.0
$1.7 $1.8
$1.6
$1.5
1.5 Interest $1.4 $1.45 Working capital
and taxes
Investment
1.0
0.5
0
(0.5) a Non-GAAP Cash flow before dividend
2012 2013 2014 2015 2016 2017 2018
NOLs & Credits $0.7 $0.6 $0.4 $0.5 $0.4 $0.2 $0.1
self-funds investment and strategy.
29
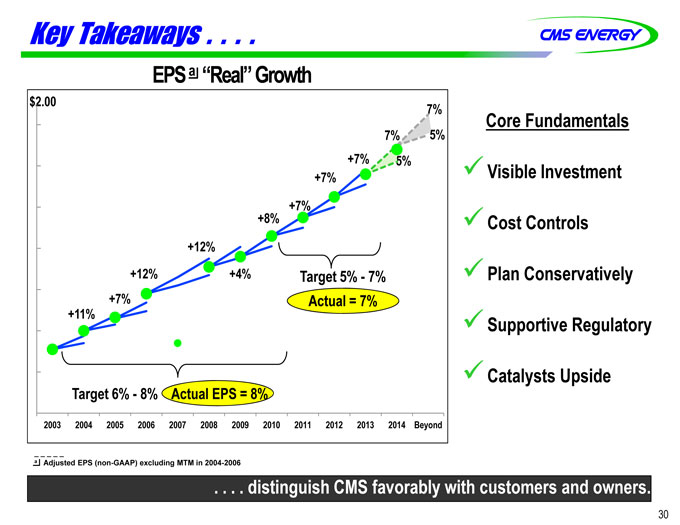
Key Takeaways
EPS a “Real” Growth
$2.00 7%
Core Fundamentals
7% 5%
+7% 5% ? Visible Investment
+7%
+8% +7% ? Cost Controls
+12%
+12% +4% Target 5%—7% ? Plan Conservatively
+7% Actual = 7%
+11% ? Supportive Regulatory
? Catalysts Upside
Target 6%—8% Actual EPS = 8%
2003 2004 2005 2006 2007 2008 2009 2010 2011 2012 2013 2014 Beyond
a Adjusted EPS (non-GAAP) excluding MTM in 2004-2006
distinguishistinguish CMS favorably with customers and owners.
30
Appendix
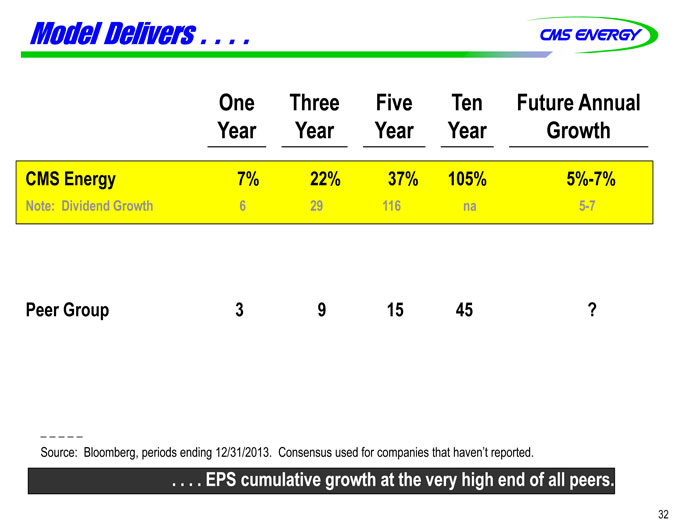
Medel Delives.....
One Three Five Ten Future Annual
Year Year Year Year Growth
CMS Energy 7% 22% 37% 105% 5%-7%
Note: Dividend Growth 6 29 116 na 5-7
Peer Group 3 9 15 45 ?
Source: Bloomberg, periods ending 12/31/2013. Consensus used for companies that haven’t reported.
. . . . EPS cumulative growth at the very high end of all peers.
32
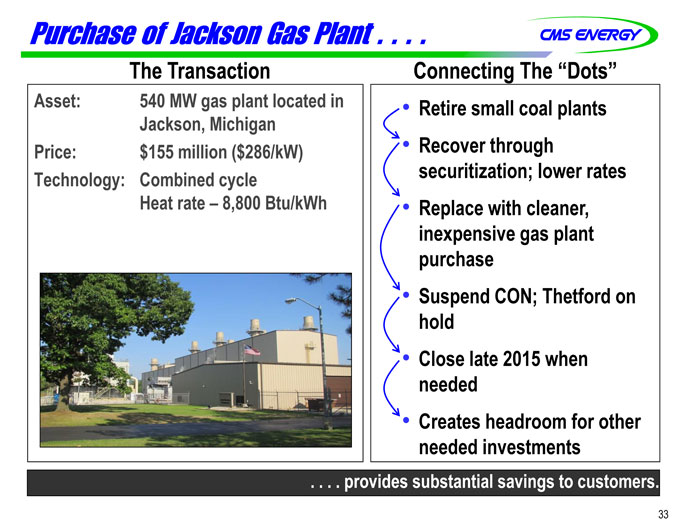
Purchase of Jackson Gas Plant . . . .
The Transaction
Asset: 540 MW gas plant located in Jackson, Michigan Price: $155 million ($286/kW) Technology: Combined cycle Heat rate – 8,800 Btu/kWh
Connecting The “Dots”
• Retire small coal plants
• Recover through securitization; lower rates
• Replace with cleaner, inexpensive gas plant purchase
• Suspend CON; Thetford on hold
• Close late 2015 when needed
• Creates headroom for other needed investments
. . . . providesr substantial savings to customers.
33

Capital Investment . . . .
Amount (bils) $1.8
$7.4 Now $8
+$1 . Bil
A.) Was $7 B.) $6.3 w/Thetford w/o Thetford Estimated 2019 Depreciation $800 Million 2014 Depreciation $600 Million
0
2014 2015 2016 2017 2018 2019 2020 2021 2022 2023
. . . . up $0.4 billion; $545 million savings from Jackson IPP more than offset by addition of $1 billion!
34
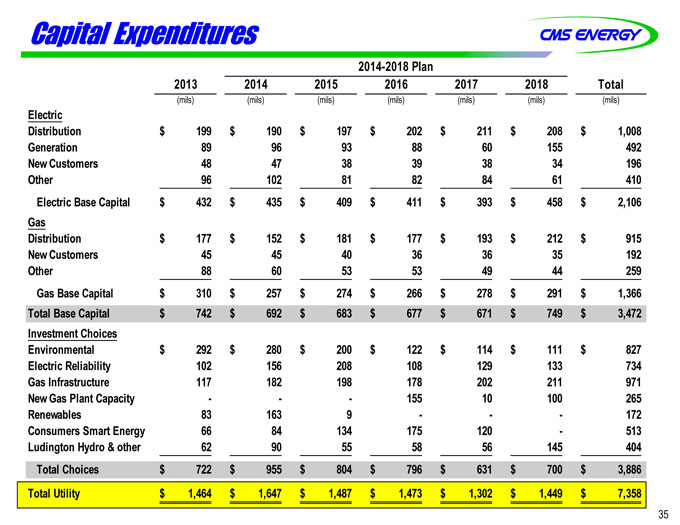
Capital Expenditures
2014-2018 Plan
2013 2014 2015 2016 2017 2018 Total
(mils)(mils)(mils)(mils)(mils)(mils)(mils)
Electric
Distribution $ 199 $ 190 $ 197 $ 202 $ 211 $ 208 $ 1,008
Generation 89 96 93 88 60 155 492
New Customers 48 47 38 39 38 34 196
Other 96 102 81 82 84 61 410
Electric Base Capital $ 432 $ 435 $ 409 $ 411 $ 393 $ 458 $ 2,106
Gas
Distribution $ 177 $ 152 $ 181 $ 177 $ 193 $ 212 $ 915
New Customers 45 45 40 36 36 35 192
Other 88 60 53 53 49 44 259
Gas Base Capital $ 310 $ 257 $ 274 $ 266 $ 278 $ 291 $ 1,366
Total Base Capital $ 742 $ 692 $ 683 $ 677 $ 671 $ 749 $ 3,472
Investment Choices
Environmental $ 292 $ 280 $ 200 $ 122 $ 114 $ 111 $ 827
Electric Reliability 102 156 208 108 129 133 734
Gas Infrastructure 117 182 198 178 202 211 971
New Gas Plant Capacity ——155 10 100 265
Renewables 83 163 9 ——172
Consumers Smart Energy 66 84 134 175 120—513
Ludington Hydro & other 62 90 55 58 56 145 404
Total Choices $ 722 $ 955 $ 804 $ 796 $ 631 $ 700 $ 3,886
Total Utility $ 1,464 $ 1,647 $ 1,487 $ 1,473 $ 1,302 $ 1,449 $ 7,358
35
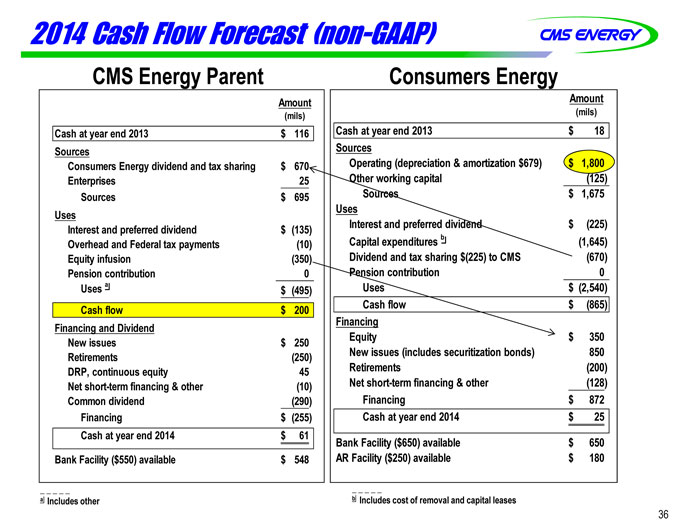
2014 Cash Flow Forecast (non-GAAP)
CMS Energy Parent
Amount
(mils)
Cash at year end 2013 $ 116
Sources
Consumers Energy dividend and tax sharing $ 670
Enterprises 25
Sources $ 695
Uses
Interest and preferred dividend $(135)
Overhead and Federal tax payments(10)
Equity infusion(350)
Pension contribution 0
Uses a $(495)
Cash flow $ 200
Financing and Dividend
New issues $ 250
Retirements(250)
DRP, continuous equity 45
Net short-term financing & other(10)
Common dividend(290)
Financing $(255)
Cash at year end 2014 $ 61
Bank _ Facility ($550) available $ 548
a Includes other
Consumers Energy
Amount
(mils)
Cash at year end 2013 $ 18
Sources
Operating (depreciation & amortization $679) $ 1,800
Other working capital(125)
Sources $ 1,675
Uses
Interest and preferred dividend $(225)
Capital expenditures b(1,645)
Dividend and tax sharing $(225) to CMS(670)
Pension contribution 0
Uses $(2,540)
Cash flow $(865)
Financing
Equity $ 350
New issues (includes securitization bonds) 850
Retirements(200)
Net short-term financing & other(128)
Financing $ 872
Cash at year end 2014 $ 25
Bank Facility ($650) available $ 650
AR Facility ($250) available $ 180
b Includes cost of removal and capital leases
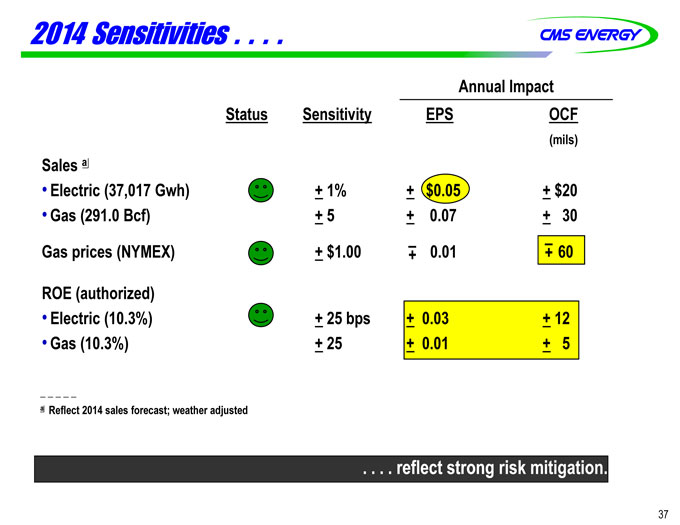
2014 Sensitivities . . . .
Annual Impact
Status Sensitivity EPS OCF
(mils)
Sales a
• Electric (37,017 Gwh) + 1% + $0.05 + $20
Gas (291.0 Bcf) + 5 + 0.07 + 30
Gas prices (NYMEX) + $1.00 –+ 0.01 –+ 60
ROE (authorized)
• Electric (10.3%) + 25 bps + 0.03 + 12
Gas (10.3%) + 25 + 0.01 + 5
a Reflect 2014 sales forecast; weather adjusted
. . . . reflect strong risk mitigation.
37
GAAP Reconciliation
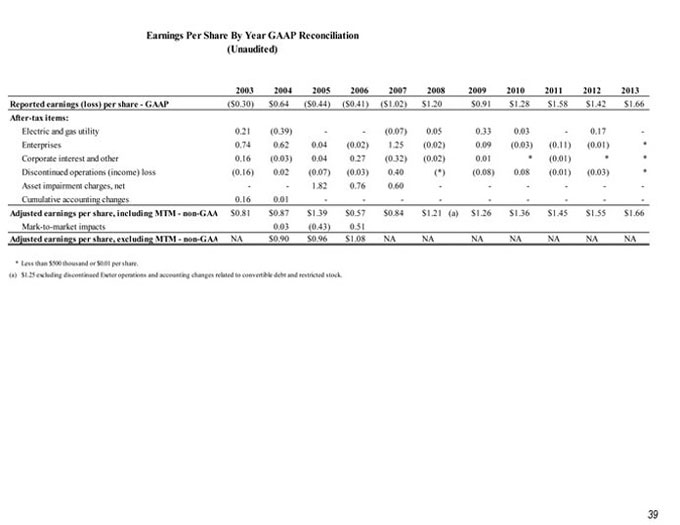
Earnings Per Share By Year GAAP Reconciliation (Unaudited)
2003 2004 2005 2006 2007 2008 2009 2010 2011 2012 2013
Reported earnings (loss) per share—GAAP($0.30) $0.64($0.44)($0.41)($1.02) $1.20 $0.91 $1.28 $1.58 $1.42 $ 1.66
After-tax items:
Electric and gas utility 0.21(0.39) —(0.07) 0.05 0.33 0.03—0.17 -
Enterprises 0.74 0.62 0.04(0.02) 1.25(0.02) 0.09(0.03)(0.11)(0.01)*
Corporate interest and other 0.16(0.03) 0.04 0.27(0.32)(0.02) 0.01*(0.01)**
Discontinued operations (income) loss(0.16) 0.02(0.07)(0.03) 0.40(*)(0.08) 0.08(0.01)(0.03)*
Asset impairment charges, net — 1.82 0.76 0.60 — — —
Cumulative accounting changes 0.16 0.01 — — — — -
Adjusted earnings per share, including MTM—non-GAA $0.81 $0.87 $1.39 $0.57 $0.84 $1.21 (a) $1.26 $1.36 $1.45 $1.55 $ 1.66
Mark-to-market impacts 0.03(0.43) 0.51
Adjusted earnings per share, excluding MTM—non-GAA NA $0.90 $0.96 $1.08 NA NA NA NA NA NA NA
| * |
|
Less than $500 thousand or $0.01 per share. |
(a) $1.25 excluding discontinued Exeter operations and accounting changes related to convertible debt and restricted stock.
39
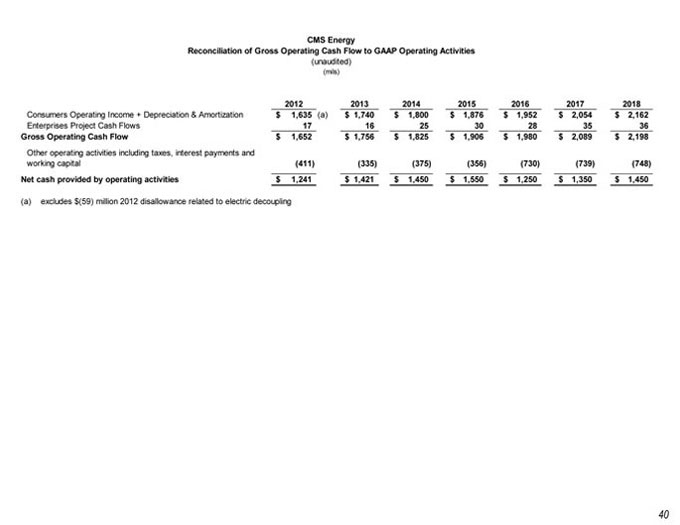
CMS Energy
Reconciliation of Gross Operating Cash Flow to GAAP Operating Activities
(unaudited)
(mils)
2012 2013 2014 2015 2016 2017 2018
Consumers Operating Income + Depreciation & Amortization $ 1,635(a) $ 1,740 $ 1,800 $ 1,876 $ 1,952 $ 2,054 $ 2,162
Enterprises Project Cash Flows 17 16 25 30 28 35 36
Gross Operating Cash Flow $ 1,652 $ 1,756 $ 1,825 $ 1,906 $ 1,980 $ 2,089 $ 2,198
Other operating activities including taxes, interest payments and
working capital(411)(335)(375)(356)(730)(739)(748)
Net cash provided by operating activities $ 1,241 $ 1,421 $ 1,450 $ 1,550 $ 1,250 $ 1,350 $ 1,450
| (a) |
|
excludes $(59) million 2012 disallowance related to electric decoupling |
40
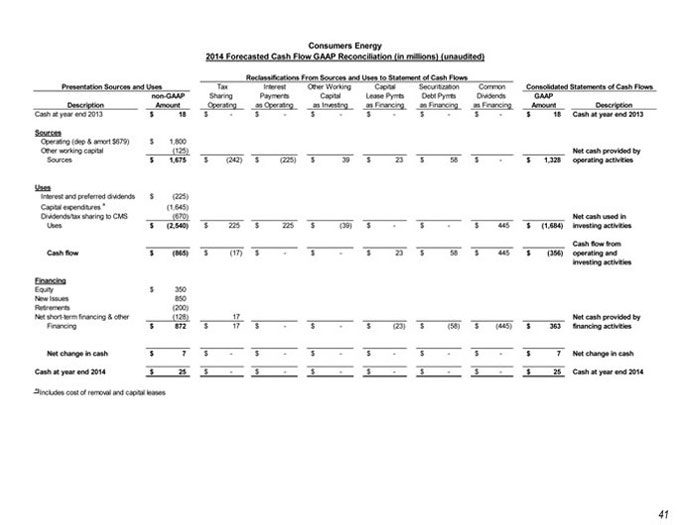
Consumers Energy
2014 Forecasted Cash Flow GAAP Reconciliation (in millions) (unaudited)
Reclassifications From Sources and Uses to Statement of Cash Flows
Presentation Sources and Uses Tax Interest Other Working Capital Securitization Common Consolidated Statements of Cash Flows
non-GAAP Sharing Payments Capital Lease Pymts Debt Pymts Dividends GAAP
Description Amount Operating as Operating as Investing as Financing as Financing as Financing Amount Description
Cash at year end 2013 $ 18 $—$—$—$—$—$—$ 18 Cash at year end 2013
Sources
Operating (dep & amort $679) $ 1,800
Other working capital(125) Net cash provided by
Sources $ 1,675 $ (242) $(225) $ 39 $ 23 $ 58 $—$ 1,328 operating activities
Uses
Interest and preferred dividends $(225)
Capital expenditures a(1,645)
Dividends/tax sharing to CMS(670) Net cash used in
Uses $(2,540) $ 225 $ 225 $(39) $—$—$ 445 $ (1,684) investing activities
Cash flow from
Cash flow $(865) $(17) $—$—$ 23 $ 58 $ 445 $ (356) operating and
investing activities
Financing
Equity $ 350
New Issues 850
Retirements(200)
Net short-term financing & other(128) 17 Net cash provided by
Financing $ 872 $ 17 $—$—$(23) $(58) $(445) $ 363 financing activities
Net change in cash $ 7 $—$—$—$—$—$—$ 7 Net change in cash
Cash at year end 2014 $ 25 $—$—$—$—$—$—$ 25 Cash at year end 2014
a Includes cost of removal and capital leases
41
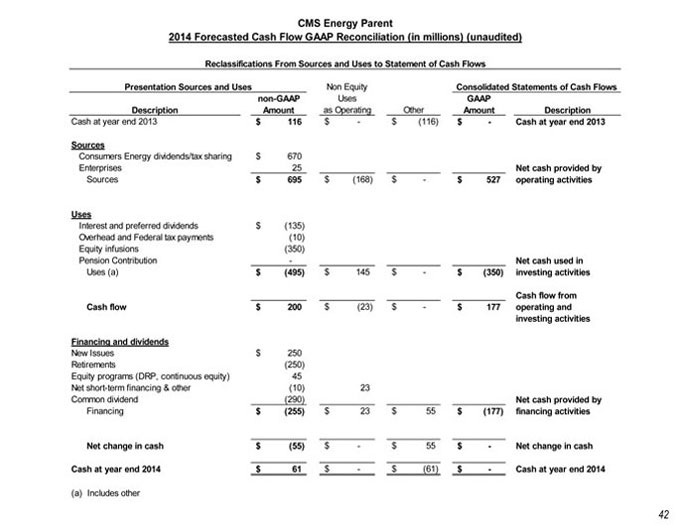
CMS Energy Parent
2014 Forecasted Cash Flow GAAP Reconciliation (in millions) (unaudited)
Reclassifications From Sources and Uses to Statement of Cash Flows
Presentation Sources and Uses Non Equity Consolidated Statements of Cash Flows
non-GAAP Uses GAAP
Description Amount as Operating Other Amount Description
Cash at year end 2013 $ 116 $—$ (116) $—Cash at year end 2013
Sources
Consumers Energy dividends/tax sharing $ 670
Enterprises 25 Net cash provided by
Sources $ 695 $(168) $—$ 527 operating activities
Uses
Interest and preferred dividends $ (135)
Overhead and Federal tax payments(10)
Equity infusions(350)
Pension Contribution—Net cash used in
Uses (a) $ (495) $ 145 $—$(350) investing activities
Cash flow from
Cash flow $ 200 $(23) $—$ 177 operating and
investing activities
Financing and dividends
New Issues $ 250
Retirements(250)
Equity programs (DRP, continuous equity) 45
Net short-term financing & other(10) 23
Common dividend(290) Net cash provided by
Financing $ (255) $ 23 $ 55 $(177) financing activities
Net change in cash $ (55) $—$ 55 $—Net change in cash
Cash at year end 2014 $ 61 $—$ (61) $—Cash at year end 2014
| (a) |
|
Includes other |
42
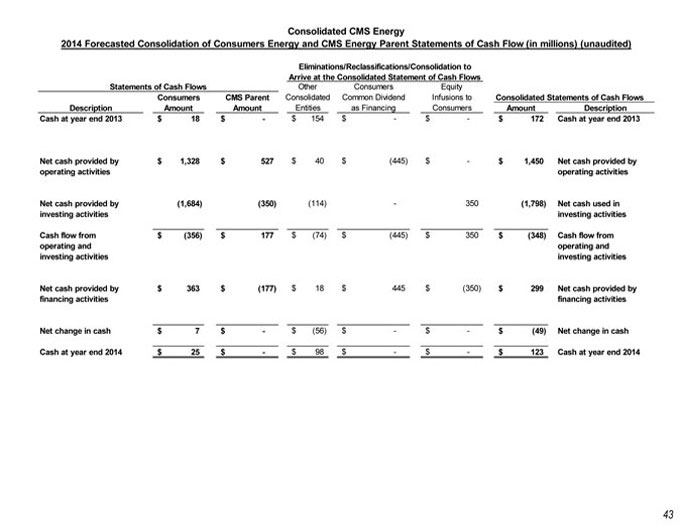
Consolidated CMS Energy
2014 Forecasted Consolidation of Consumers Energy and CMS Energy Parent Statements of Cash Flow (in millions) (unaudited)
Eliminations/Reclassifications/Consolidation to
Arrive at the Consolidated Statement of Cash Flows
Statements of Cash Flows Other Consumers Equity
Consumers CMS Parent Consolidated Common Dividend Infusions to Consolidated Statements of Cash Flows
Description Amount Amount Entities as Financing Consumers Amount Description
Cash at year end 2013 $ 18 $—$ 154 $—$—$ 172 Cash at year end 2013
Net cash provided by $ 1,328 $ 527 $ 40 $(445) $—$ 1,450 Net cash provided by
operating activities operating activities
Net cash provided by(1,684)(350)(114)—350(1,798) Net cash used in
investing activities investing activities
Cash flow from $(356) $ 177 $(74) $(445) $ 350 $(348) Cash flow from
operating and operating and
investing activities investing activities
Net cash provided by $ 363 $(177) $ 18 $ 445 $(350) $ 299 Net cash provided by
financing activities financing activities
Net change in cash $ 7 $—$(56) $—$—$(49) Net change in cash
Cash at year end 2014 $ 25 $—$ 98 $—$—$ 123 Cash at year end 2014
43