Attached files
| file | filename |
|---|---|
| 8-K - 8-K - ARO Liquidation, Inc. | aro-201403013x8xk.htm |
| EX-99.1 - EXHIBIT 99.1 - ARO Liquidation, Inc. | q413-exhibit991.htm |

1 Fourth Quarter 2013 Financial Results

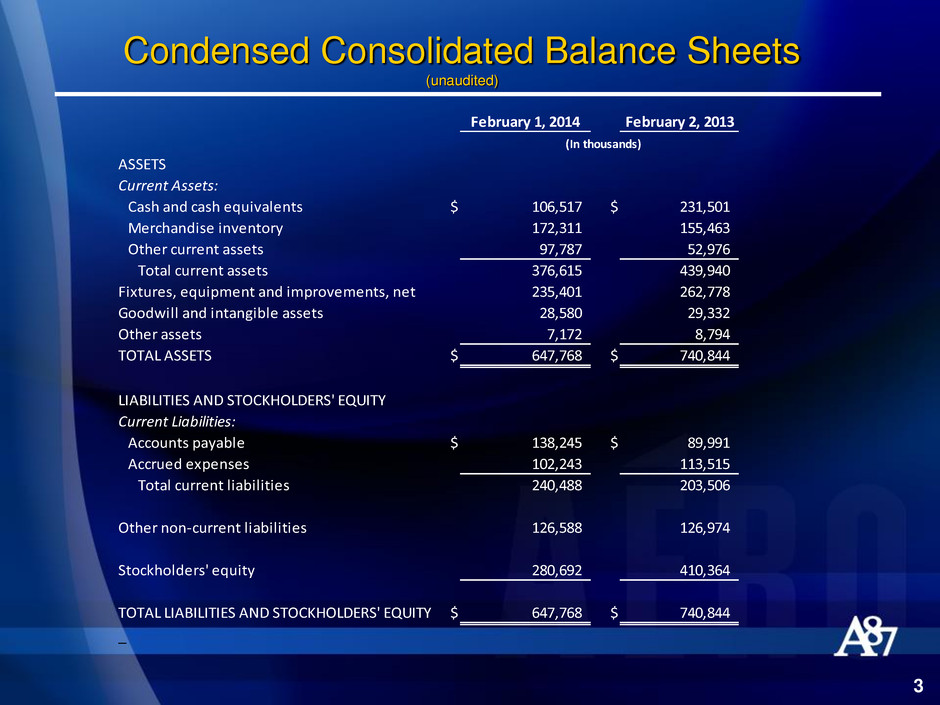
Condensed Consolidated Balance Sheets (unaudited) 3 February 1, 2014 February 2, 2013 ASSETS Current Assets: Cash and cash equivalents $ 106,517 $ 231,501 Merchandise inventory 172,311 155,463 Other current assets 97,787 52,976 Total current assets 376,615 439,940 Fixtures, equipment and improvements, net 235,401 262,778 Goodwill and intangible assets 28,580 29,332 Other assets 7,172 8,794 TOTAL ASSETS $ 647,768 $ 740,844 LIABILITIES AND STOCKHOLDERS' EQUITY Current Liabilities: Accounts payable $ 138,245 $ 89,991 Accrued expenses 102,243 113,515 Total current liabilities 240,488 203,506 Other non-current liabilities 126,588 126,974 Stockholders' equity 280,692 410,364 TOTAL LIABILITIES AND STOCKHOLDERS' EQUITY $ 647,768 $ 740,844 _ (In thousands)
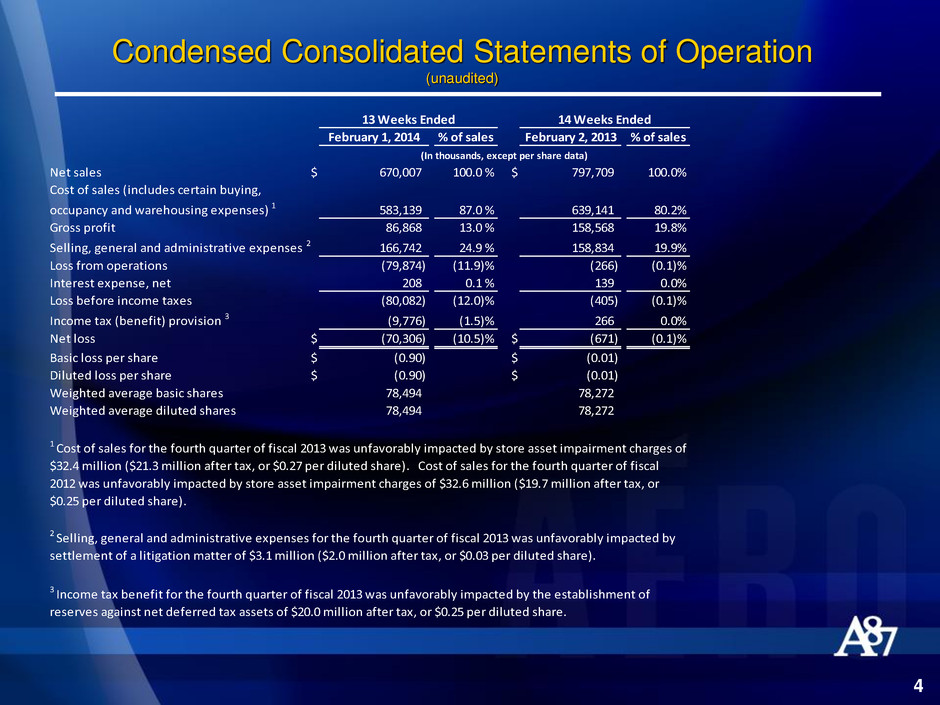
Condensed Consolidated Statements of Operation (unaudited) 4 February 1, 2014 % of sales February 2, 2013 % of sales Net sales $ 670,007 100.0 % $ 797,709 100.0% Cost of sales (includes certain buying, occupancy and warehousing expenses) 1 583,139 87.0 % 639,141 80.2% Gross profit 86,868 13.0 % 158,568 19.8% Selling, general and administrative expenses 2 166,742 24.9 % 158,834 19.9% Loss from operations (79,874) (11.9)% (266) (0.1)% Interest expense, net 208 0.1 % 139 0.0% Loss before income taxes (80,082) (12.0)% (405) (0.1)% Income tax (benefit) provision 3 (9,776) (1.5)% 266 0.0% Net loss $ (70,306) (10.5)% $ (671) (0.1)% Basic loss per share $ (0.90) $ (0.01) Diluted loss per share $ (0.90) $ (0.01) Weighted average basic shares 78,494 78,272 Weighted average diluted shares 78,494 78,272 2 Selling, general and administrative expenses for the fourth quarter of fiscal 2013 was unfavorably impacted by settlement of a litigation matter of $3.1 million ($2.0 million after tax, or $0.03 per diluted share). 3 Income tax benefit for the fourth quarter of fiscal 2013 was unfavorably impacted by the establishment of reserves against net deferred tax assets of $20.0 million after tax, or $0.25 per diluted share. (In thousands, except per share data) 13 Weeks Ended 14 Weeks Ended 1 Cost of sales for the fourth quarter of fiscal 2013 was unfavorably impacted by store asset impairment charges of $32.4 million ($21.3 million after tax, or $0.27 per diluted share). Cost of sales for the fourth quarter of fiscal 2012 was unfavorably impacted by store asset impairment charges of $32.6 million ($19.7 million after tax, or $0.25 per diluted share).
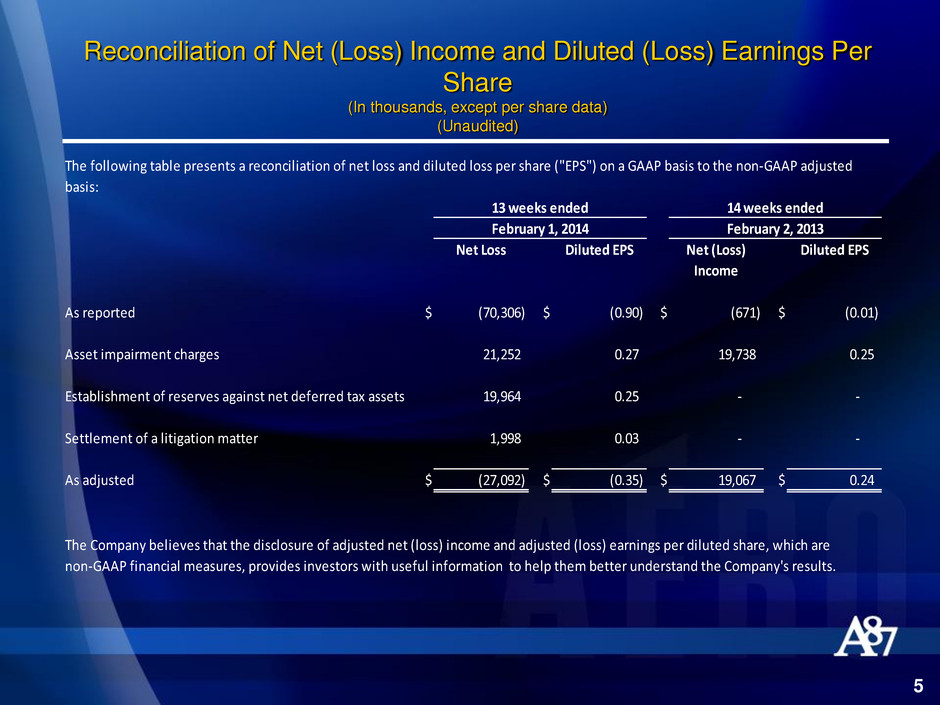
Reconciliation of Net (Loss) Income and Diluted (Loss) Earnings Per Share (In thousands, except per share data) (Unaudited) 5 basis: Net Loss Diluted EPS Net (Loss) Income Diluted EPS As reported $ (70,306) $ (0.90) $ (671) $ (0.01) Asset impairment charges 21,252 0.27 19,738 0.25 Establishment of reserves against net deferred tax assets 19,964 0.25 - - Settlement of a litigation matter 1,998 0.03 - - As adjusted $ (27,092) $ (0.35) $ 19,067 $ 0.24 non-GAAP financial measures, provides investors with useful information to help them better understand the Company's results. The Company believes that the disclosure of adjusted net (loss) income and adjusted (loss) earnings per diluted share, which are The following table presents a reconciliation of net loss and diluted loss per share ("EPS") on a GAAP basis to the non-GAAP adjusted 13 weeks ended February 1, 2014 14 weeks ended February 2, 2013
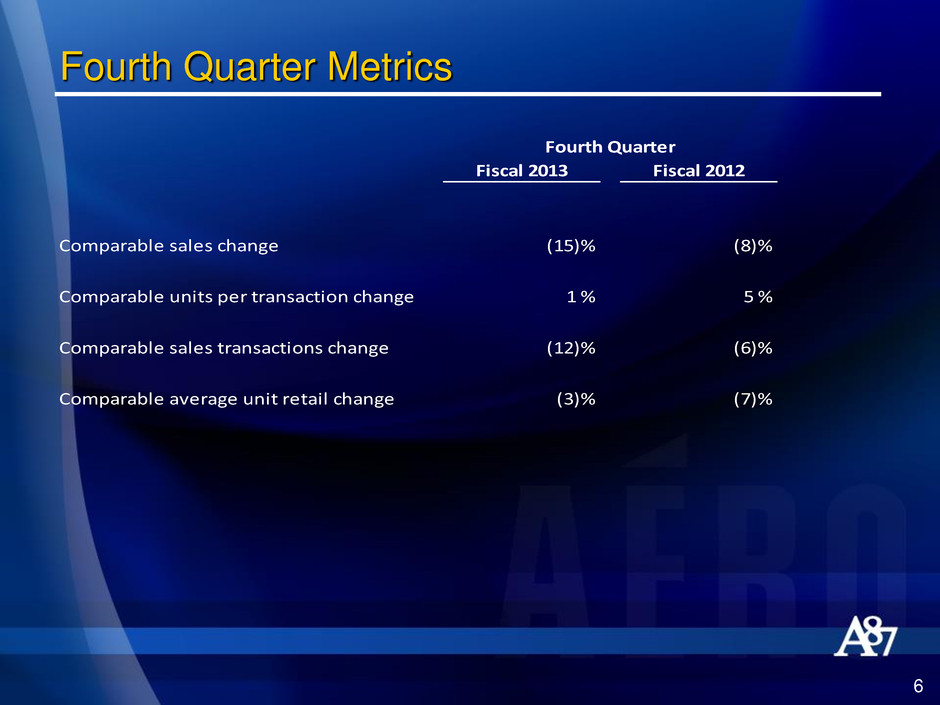
6 Fourth Quarter Metrics Fiscal 2013 Fiscal 2012 Comparable sales change (15)% (8)% Compa able units per transaction change 1 % 5 % Comparable sales transactions change (12)% (6)% Comparable average unit retail change (3)% (7)% Fourth Quarter
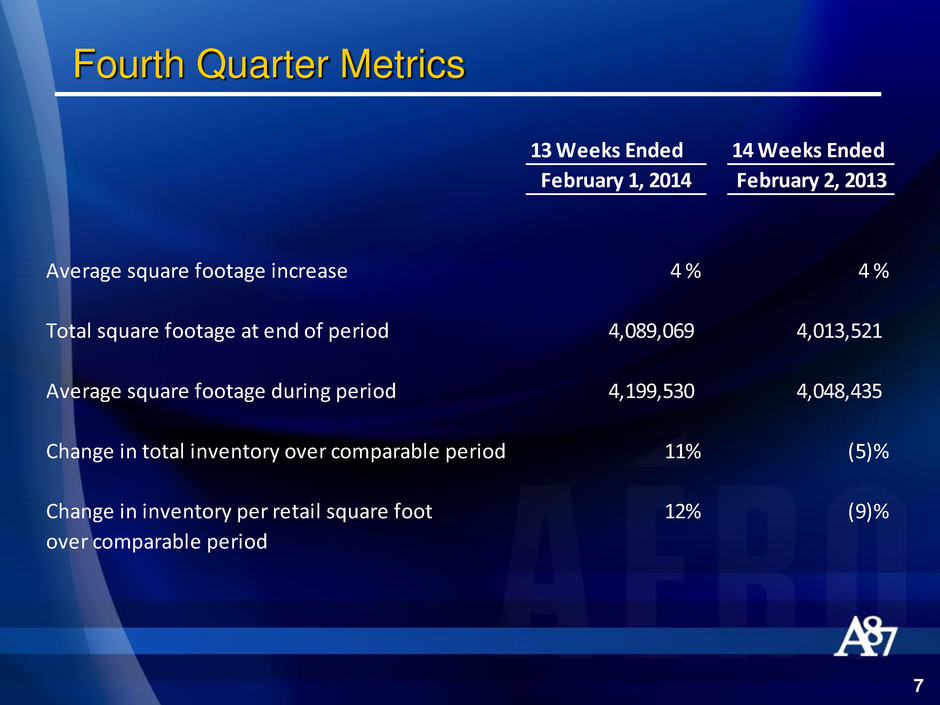
Fourth Quarter Metrics 7 13 Weeks Ended 14 Weeks Ended February 1, 2014 February 2, 2013 Average square footage increase 4 % 4 % Total square footage at end of period 4,089,069 4,013,521 Average square footage during period 4,199,530 4,048,435 Change in total inventory over comparable period 11% (5)% Change in inventory per retail square foot 12% (9)% over comparable period

8 Fourth Quarter 2013 Store Count Q3 Additions Closures Q4 Aéropostale U.S. 897 5 (31) 871 Aéropostale Canada 79 - (1) 78 Total Aéropostale 976 5 (32) 949 P.S. from Aéropostale 148 3 - 151 Total stores 1,124 8 (32) 1,100
