Attached files
| file | filename |
|---|---|
| 8-K - 8-K - KINDRED HEALTHCARE, INC | d692079d8k.htm |
 Lender
Presentation March 12, 2014
Exhibit 99.1 |
 2
Forward-Looking Statements
2
This presentation includes forward-looking statements within the meaning of Section 27A of
the Securities Act of 1933, as amended, and Section 21E of the Securities Exchange Act of 1934, as amended. All
statements regarding the Company’s expected future financial position, results of
operations, cash flows, financing plans, business strategy, budgets, capital expenditures, competitive positions, growth opportunities, plans and
objectives of management and statements containing the words such as “anticipate,”
“approximate,” “believe,” “plan,” “estimate,” “expect,” “project,” “could,” “should,” “will,” “intend,” “may” and other similar
expressions, are forward-looking statements. Statements in this presentation
concerning the Company’s business outlook or future economic performance, anticipated profitability, revenues, expenses or other financial items, and product or
services line growth, together with other statements that are not historical facts, are
forward-looking statements that are estimates reflecting the best judgment of the Company based upon currently available information.
Such forward-looking statements are inherently uncertain, and stockholders and other
potential investors must recognize that actual results may differ materially from the Company’s expectations as a result of a
variety of factors, including, without limitation, those discussed below. Such
forward-looking statements are based upon management’s current expectations and include known and unknown risks, uncertainties and other factors,
many of which the Company is unable to predict or control, that may cause the Company’s
actual results or performance to differ materially from any future results or performance expressed or implied by such forward-looking
statements. These statements involve risks, uncertainties and other factors discussed below and
detailed from time to time in the Company’s filings with the Securities and Exchange Commission.
In addition to the factors set forth above, other factors that may affect the Company’s
plans, results or stock price include, without limitation, (a) the impact of healthcare reform, which will initiate significant changes
to the United States healthcare system, including potential material changes to the delivery of
healthcare services and the reimbursement paid for such services by the government or other third party payors, including reforms
resulting from the Patient Protection and Affordable Care Act and the Healthcare Education and
Reconciliation Act (collectively, the “ACA”) or future deficit reduction measures adopted at the federal or state level. Healthcare
reform is affecting each of the Company’s businesses in some manner. Potential future
efforts in the U.S. Congress to repeal, amend, modify or retract funding for various aspects of the ACA create additional uncertainty about the
ultimate impact of the ACA on the Company and the healthcare industry. Due to the substantial
regulatory changes that will need to be implemented by the Centers for Medicare and Medicaid Services (“CMS”) and others, and
the numerous processes required to implement these reforms, the Company cannot predict which
healthcare initiatives will be implemented at the federal or state level, the timing of any such reforms, or the effect such reforms or
any other future legislation or regulation will have on the Company’s business, financial
position, results of operations and liquidity, (b) the impact of the final rules issued by CMS on August 1, 2012 which, among other things, will
reduce Medicare reimbursement to the Company’s transitional care (“TC”)
hospitals in 2013 and beyond by imposing a budget neutrality adjustment and modifying the short-stay outlier rules, (c) the impact of the final rules
issued by CMS on July 29, 2011 which significantly reduced Medicare reimbursement to the
Company’s nursing centers and changed payments for the provision of group therapy services effective October 1, 2011, (d) the impact of
the Budget Control Act of 2011 (as amended by the American Taxpayer Relief Act of 2012 (the
“Taxpayer Relief Act”)) which instituted an automatic 2% reduction on each claim submitted to Medicare beginning April 1, 2013, (e)
the Company’s ability to adjust to the new patient criteria for long-term acute care
(“LTAC”) hospitals under the Pathway for SGR Reform Act of 2013, which will reduce the population of patients eligible for the Company’s
hospital services and change the basis upon which the Company is paid, (f) the impact of the
Taxpayer Relief Act which, among other things, reduces Medicare payments by an additional 25% for subsequent procedures when
multiple therapy services are provided on the same day. At this time, the Company believes that
the rules related to multiple therapy services will reduce the Company’s Medicare revenues by $25 million to $30 million on an
annual basis, (g) changes in the reimbursement rates or the methods or timing of payment from
third party payors, including commercial payors and the Medicare and Medicaid programs, changes arising from and related to the
Medicare prospective payment system for LTAC hospitals, including potential changes in the
Medicare payment rules, the Medicare Prescription Drug, Improvement, and Modernization Act of 2003, and changes in Medicare and
Medicaid reimbursement for the Company’s TC hospitals, nursing centers, inpatient
rehabilitation hospitals and home health and hospice operations, and the expiration of the Medicare Part B therapy cap exception process, (h)
the effects of additional legislative changes and government regulations, interpretation of
regulations and changes in the nature and enforcement of regulations governing the healthcare industry, (i) the ability of the Company’s
hospitals and nursing centers to adjust to medical necessity reviews, (j) the costs of
defending and insuring against alleged professional liability and other claims (including those related to pending whistleblower and wage and
hour class action lawsuits against the Company) and the
Company’s ability to predict the estimated costs and reserves related to such claims, including the impact of differences in actuarial assumptions and estimates compared
to eventual outcomes, (k) the impact of the Company’s significant level of indebtedness on
the Company’s funding costs, operating flexibility and ability to fund ongoing operations, development capital expenditures or other
strategic acquisitions with additional borrowings, (l) the Company’s ability to
successfully redeploy its capital and proceeds of asset sales in pursuit of its business strategy and pursue its development activities, including through
acquisitions, and successfully integrate new operations, including the realization of
anticipated revenues, economies of scale, cost savings and productivity gains associated with such operations, as and when planned, including
the potential impact of unanticipated issues, expenses and liabilities associated with those
activities, (m) the Company’s ability to pay a dividend as, when and if declared by the Board of Directors, in compliance with applicable
laws and the Company’s debt and other contractual arrangements, (n) the failure of the
Company’s facilities to meet applicable licensure and certification requirements, (o) the further consolidation and cost containment efforts
of managed care organizations and other third party payors, (p) the Company’s ability to
meet its rental and debt service obligations, (q) the Company’s ability to operate pursuant to the terms of its debt obligations, and comply
with its covenants thereunder, and the Company’s ability to operate pursuant to its master
lease agreements with Ventas, Inc. (NYSE:VTR), (r) the condition of the financial markets, including volatility and weakness in the equity,
capital and credit markets, which could limit the availability and terms of debt and equity
financing sources to fund the requirements of the Company’s businesses, or which could negatively impact the Company’s investment
portfolio, (s) the Company’s ability to control costs, particularly labor and employee
benefit costs, (t) the Company’s ability to successfully reduce (by divestiture of operations or otherwise) its exposure to professional liability and
other claims, (u) the Company’s obligations under various laws to self-report
suspected violations of law by the Company to various government agencies, including any associated obligation to refund overpayments to
government payors, fines and other sanctions, (v) national and regional economic, financial,
business and political conditions, including their effect on the availability and cost of labor, credit, materials and other services, (w)
increased operating costs due to shortages in qualified nurses, therapists and other healthcare
personnel, (x) the Company’s ability to attract and retain key executives and other healthcare personnel, (y) the Company’s ability to
successfully dispose of unprofitable facilities, (z) events or circumstances which could result
in the impairment of an asset or other charges, such as the impact of the Medicare reimbursement regulations that resulted in the
Company recording significant impairment charges in the last three fiscal years, (aa) changes
in generally accepted accounting principles (“GAAP”) or practices, and changes in tax accounting or tax laws (or authoritative
interpretations relating to any of these matters), and (bb) the Company’s ability to
maintain an effective system of internal control over financial reporting. Many of these factors are beyond the Company’s control. The Company cautions investors
that any forward-looking statements made by the Company are not guarantees of future performance. The Company
disclaims any obligation to update any such factors or to announce publicly the results of any
revisions to any of the forward-looking statements to reflect future events or developments. The Company has provided information in
this presentation to compute certain non-GAAP measurements for specified periods before
certain charges or on a core basis. A reconciliation of the non-GAAP measurements to the GAAP measurements are included in the
appendix to this presentation and on our website at
www.kindredhealthcare.com under the heading “investors.”
|
 3
Special Notice to Public-Siders
THE BORROWER HAS REPRESENTED AND WARRANTED TO THE ARRANGER THAT:
THE INFORMATION IN THIS DOCUMENT DOES NOT CONSTITUTE OR CONTAIN ANY MATERIAL NON-PUBLIC
INFORMATION WITH RESPECT TO THE BORROWER OR ANY PARTY RELATED THERETO (COLLECTIVELY,
“PARTIES”) OR THEIR RESPECTIVE SECURITIES FOR PURPOSES OF UNITED STATES
FEDERAL AND STATE SECURITIES LAWS. However, the information contained in this document
is subject to, and must be kept confidential in accordance with, the Notice to and
Undertaking by Recipients accompanying this document. |
 4
Kindred Healthcare’s Management Team
•
Paul J. Diaz, Chief Executive Officer
•
Stephen D. Farber, Executive Vice President and Chief Financial Officer
|
 Transaction
Overview 5
*
*
*
*
*
*
*
*
*
* |
 Transaction
Summary •
Kindred Healthcare (“Kindred”
or the “Company”) is the largest diversified
provider of post-acute care services in the United States
•
The
Company
is
looking
to
take
advantage
of
favorable
conditions
in
the
leveraged finance markets to refinance its existing debt. The financing will
consist of:
•
New $750 million ABL R/C Facility due 2019
•
New $1,000 million Term Loan B Facility due 2021
•
Other unsecured indebtedness
•
The refinancing will improve the maturity profile, reduce interest expense
and provide operational flexibility of the Company
•
Pro
forma
for
the
transaction,
senior
secured
and
total
leverage
will
be
3.18x
and
4.58x,
respectively,
based
on
12/31/13
Adjusted
EBITDA
of
$361
million
6
(1)
See Appendix for non-GAAP reconciliation.
1 |
 Sources &
Uses and Pro Forma Capitalization ($M)
12/31/13
12/31/13
Pro forma
Cash
$36
$36
Existing ABL
256
-
New ABL
-
153
Existing Term Loan B
(1)
777
-
New Term Loan B
-
1,000
Total Secured Debt
$1,033
$1,153
8.250% Senior Notes
550
-
Other Unsecured Debt
-
500
Other Debt
5
5
Total Debt
$1,588
$1,658
FY 2013 Adjusted EBITDA
(2)
$361
$361
FY 2013 LTM Rent Expense
$318
$318
FY 2013 Adjusted EBITDAR
(2)
$679
$679
Secured Debt / EBITDA
2.86x
3.19x
Net Secured Debt / EBITDA
2.76x
3.09x
Total Debt / EBITDA
4.40x
4.59x
Net Debt / EBITDA
4.30x
4.49x
Adjusted Debt
(3)
/ EBITDAR
5.15x
5.25x
Net Adjusted Debt
(3)
/ EBITDAR
5.10x
5.20x
Sources & Uses
Pro Forma Capitalization
7
(1)
Net of $6M OID.
(2)
See Appendix for Non-GAAP reconciliation.
(3)
Calculated with 6.0x cap rate.
Sources ($M)
New ABL R/C
$153
New Term Loan B
1,000
Other Unsecured Debt
500
Total
$1,653
Uses ($M)
Refi existing ABL R/C
$256
Refi existing Term Loan B
783
Refi Unsecured Debt
590
Fees and expenses
24
Total
$1,653
(1)
We continue evaluate options available with respect to refinancing the senior
unsecured indebtedness, including through the incurrence of additional
senior secured indebtedness and/or new unsecured indebtedness
1 |
 Borrower
Kindred Healthcare, Inc. (“KND” or the “Borrower”)
Facility
$1,000.0 million Senior Secured Term Loan B
Tenor
7 years
Guarantors
Substantially all existing and future wholly-owned domestic subsidiaries
Security
First priority claim on the equipment, inventory, fixtures, IP, real property (excluding leaseholds),
Capital stock (100% of domestic and 66% of foreign stock) and investment property
Second priority claim on the ABL collateral (eligible accounts receivable, cash, securities accounts,
deposit accounts, books and records related to and proceeds of the foregoing)
Pricing
L+300 bps / 1.00% LIBOR floor / 99.50 - 99.75 OID
Call protection
101 soft call for 6 months; prepayable at par thereafter
Incremental
$100.0mm (shared with ABL R/C) + unlimited amount up to 3.50x secured leverage net of up to $100.0mm
of cash Amortization
1% per annum, payable in quarterly installments, with remainder at maturity
Financial covenants
Maximum total adjusted leverage ratio: 5.75x
Minimum consolidated fixed charge coverage ratio: 1.25x
Maximum capex: $300.0 million per annum
Summary Terms:
Term Loan B
8 |
 Kindred Healthcare,
Inc. (“KND” or the “Borrower”) Borrower
Facility
$750.0 million ABL Revolving Credit Facility (“ABL R/C”)
Tenor
5 years
Guarantors
Substantially all existing and future wholly-owned domestic subsidiaries
Security
First priority claim on eligible accounts receivable, cash, securities accounts, deposit accounts,
books and records related to and proceeds of the foregoing
Drawn pricing
L+200 - 250 bps, depending on availability
Undrawn pricing
37.5 bps
Incremental
$100.0mm (shared with Term Loan B) + unlimited amount up to 3.50x secured leverage net of up to
$100.0mm of cash Financial covenants
Minimum consolidated fixed charge coverage ratio: 1.25x
Maximum capex: $300.0 million per annum
Upfront costs
25.0 bps
Summary Terms:
ABL Revolving Credit Facility
9 |
 Date
Event
March 12th
Lender call
March 25th
March 26th
Commitments due from Term Loan B Lenders
Commitments due from ABL R/C Lenders
April 9th
Closing and funding
Key syndication event
Timetable
March 2014
April 2014
S
M
T
W
T
F
S
S
M
T
W
T
F
S
1
1
2
3
4
5
2
3
4
5
6
7
8
6
7
8
9
10
11
12
9
10
11
12
13
14
15
13
14
15
16
17
18
19
16
17
18
19
20
21
22
20
21
22
23
24
25
26
23
24
25
26
27
28
29
27
28
29
30
30
31
10 |
 Company
Overview 11
*
*
*
*
*
*
*
*
*
* |
 Kindred
Healthcare’s Diversified Business and Revenue Mix
(1) Revenues for the twelve months ended December 31, 2013 (before intercompany
eliminations). (2) As of December 31, 2013.
(3) For the twelve months ended December 31, 2013.
$5.1
billion
total
revenues
(1)
2,280
locations,
310
facilities
in
47
states
(2)
500,000
patients
and
residents
(3)
63,000
dedicated
employees
(2)
40%
($2.0 billion)
Medicare
Medicaid
Revenue
Mix
(1)
Business
Mix
(1)
21%
($1.1 billion)
Business-to-
Business
Commercial
Insurance/
Private
11%
($0.6 billion)
28%
($1.4 billion)
25%
($1.3 billion)
21%
($1.1 billion)
49%
($2.5 billion)
Hospitals
(LTAC/IRF)
RehabCare
Nursing and
Rehabilitation
Centers
5%
($0.2 billion)
Care
Management
12 |
 Leading
Diversified Post-Acute Provider With Focus on Developing
Integrated Care Market Capabilities
Transitional Care Hospitals (101)
Inpatient Rehabilitation Hospitals (5)
Hospital-Based Acute Rehab Units (104)
Nursing and Rehabilitation Centers (100)
RehabCare Total Sites of Service (1,789)
Home Health, Hospice and Private Duty
in 16 Integrated Care Markets (159)
Regional Support Centers
As of December 31, 2013
Integrated Care Market (12)
Targeted Integrated Care Market (10)
13 |
 Kindred’s
Value Proposition and our •
Be a leader in helping to coordinate and deliver high quality care at the
lowest
cost
(particularly
for
those
patients
who
are
the
highest
users
of
healthcare
services)
–
By providing superior clinical outcomes in the most appropriate setting, with
an approach which is patient-centered, disciplined and transparent
•
Lower healthcare costs by reducing rehospitalizations and lengths-of-stay
in acute care hospitals and throughout an episode of care
–
By transitioning patients home at the highest possible level of function
and wellness
•
Participate in the development of new care delivery and payment models
–
To better coordinate care and manage patients with chronic conditions,
including the dual-eligibles, with our partners through our integrated care
management teams and protocols
14
“Continue
The
Care”
Campaign |
 …
and More Quickly…
(Reducing Average
Length-of-Stay)
2
Sending More Patients
Home…
1
Kindred Healthcare
Delivering on Quality, Value and Innovation in Patient Care Delivery
Outperforming
National Quality Benchmarks
500,000
Patients and Residents were
cared for in settings across the
continuum
Kindred Hospitals, Nursing Centers, and Home Health and Hospice
continue to improve on quality indicators and beat industry benchmarks
…
Reducing
Rehospitalization
2
•
56%
of
our
Nursing
Center
patients go home
after
32
days
•
70%
of
our
Hospital
patients
go home or to a Lower Level
of
Care
after
27
days
Reduced the total average length
of stay
•
by
10.3%
in
our
Hospitals
•
by
11%
in
our
Nursing
Centers
Kindred Hospitals reduced
rehospitalization rates by
14%
Kindred Nursing Centers have
reduced rehospitalization rates by
15%
(1)
2013 results
(2)
Same-store comparison 2013 to 2009
15 |
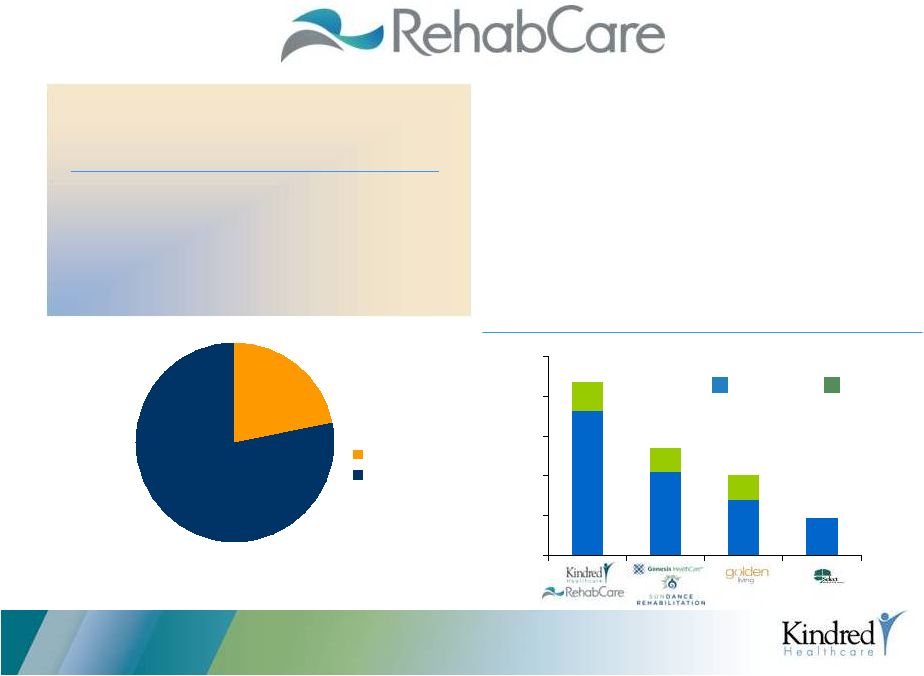
 117
106
100
44
27
19
16
0
20
40
60
80
100
120
140
Hospital Division
$2.5 billion Revenues
(1)
$545 million Operating Income
(2)
Transitional Care Hospitals (certified as LTAC hospitals)
•
101 Transitional Care Hospitals
(3)
•
7,315 licensed beds
(3)
Inpatient Rehabilitation Hospitals (IRFs)
•
5 IRFs
(3)
•
215 licensed beds
(3)
(1)
Revenues for the twelve months ended December 31, 2013 (divisional revenues before
intercompany eliminations).
(2)
Operating income for the twelve months ended December 31, 2013.
(3)
As of December 31, 2013.
(4)
Before certain disclosed items.
#2 Operator of Long-Term Acute
Care Hospitals and Inpatient
Rehabilitation Facilities
•
Consistently outperforms national benchmarks on key
quality indicators
•
Sale of 16 facilities to Vibra Healthcare, LLC
—Divestiture of 14 Transitional Care Hospitals, 1 inpatient
rehabilitation hospital and 1 skilled nursing facility
—$180 million of net sales proceeds
•
In Q4 2013, cost per patient day outpaced revenue compared
to Q4 2012, which resulted in an operating income margin
decline
to
21.9%
from
22.9%
(4)
•
Q4 2013 operating income declined to $135 million versus
$148
million
last
year
(4)
6%
33%
Medicare
Medicaid
Insurance/Other
Revenue
Mix
(1)
61%
16 |
 •
2,185 sites of service served through
20,300
therapists
(3)
•
Including 104 hospital-based acute
rehabilitation
units
(3)
#1 Contract Rehab Manager
Third Party
Affiliated
•
Provides a compelling value proposition to our Hospital
(HRS) and Skilled Nursing (SRS) partners through
advanced tech systems, clinical programs and highly
trained therapist team
•
Q4
2013
operating
margin
at
10.2%
(4)
,
showing
stability
while implementing significant recent Medicare rule
changes
•
In October 2013, acquired TherEX which provides
on-site, hospital-based rehabilitation services in 11 states
$1.3
billion
Revenues
(1)
$142
million
Operating
Income
(2)
Business
Mix
(1)
HRS
SRS
22%
$0.3 billion
78%
$1.0 billion
(1)
Revenues for the twelve months ended December 31, 2013 (divisional revenues
before intercompany eliminations).
(2)
Operating income for the twelve months ended December 31, 2013.
(3)
As of December 31, 2013.
(4)
Before certain disclosed items
1,903
1,042
700
471
282
300
0
500
1,000
1,500
2,000
2,500
2,185
1,350
1,000
471
17
308 |
 Revenue
Mix
(1)
Nursing Center Division
48 Transitional Care Centers (Sub-Acute facilities licensed
as
SNFs)
(3)
13 Nursing and Rehabilitation Centers
(with
Transitional
Care
Units)
(3)
12
Hospital-Based
Sub-Acute
Units
(3)
39
Skilled
Nursing
Centers
(Traditional
SNFs)
(3)
•
Challenging operating environment
under RUGs IV rules and ongoing
Medicaid rate pressures
•
Divestiture or non-renewal of 123
nursing centers proceeding toward
completion
•
New Transitional Care Centers
(“TCCs”) and hospital based sub-acute
core growth continuing
•
Division overhead restructuring near
completion, allowing for a smaller, but
more profitable business
•
HCP transaction to acquire real estate
will eliminate $9 million of annual rent
for the Nursing Center Division
37%
34%
29%
Medicaid
Medicare
Private/Other
$1.1
billion
Revenues
(1)
$140
million
Operating
Income
(2)
(1)
Revenues for the twelve months ended December 31, 2013 (divisional revenues
before intercompany eliminations).
(2)
Operating income for the twelve months ended December 31, 2013.
(3)
As of December 31, 2013.
18 |
 •
Acquired Senior Home Care which operated 47
home health locations throughout Florida and
Louisiana with $143 million in revenue
•
Building management team, including sales,
clinical operations and IT capabilities to support
accelerated expansion
•
While implementation of Homecare Homebase
IT system contributed to performance issues in
2013, all branches (including Senior Home Care)
will be fully operational and standardized by Q1
2014
•
Q4 2013 revenues of $66 million
19
Including our key affiliates:
•Senior Home Care
•IntegraCare
•Professional Healthcare at
Home •Signature Health
Services •Acclaim Hospice
and Palliative Care •
209 sites of service in 13 states
•
67 in Kindred’s Integrated Care Markets
•
4,940
caregivers serving over 17,000
patients on a daily basis
Care Management Division/Kindred At Home
$354
million
Pro
Forma
Annualized
Revenues
(1
)
Care Management Division and
(1)
Includes historical results of Senior Home Care acquisition, plus Kindred at Home revenues for
the twelve months ended December 31, 2013 (divisional revenues before intercompany
eliminations). Commercial
Insurance/
Other
($68 million)
Private Duty
Hospice
Home Health
Revenue Mix
(1)
Business Mix
(1)
80%
15%
5%
Medicaid
($13 million)
Medicare
($273 million)
4%
77%
19% |
 Kindred’s
Five-Year Strategic Plan Creating Value for Patients, Payors, Teammates and
Shareholders Fee-For-Service World
Succeed Today
in a
Value-Based Payment World
Prepare for a Future
Succeed In
The Core
Reposition
Portfolio
Aggressively Grow
Kindred at Home,
RehabCare, and
Assisted Living
Business
Develop Care
Management
Capabilities
Advance
Integrated Care
Market Strategy
Improve Capital
Structure and Enhance
Shareholder Returns
1
2
3
4
5
6
–
In Integrated
Care Markets
–
Redeploy
Capital to
Higher
Margin
Businesses
–
To Operationalize
Continue
The
Care
–
Support new Risk-
Based Payment
Arrangements
–
People Services
–
Quality and
Clinical
Outcomes
–
Organic Growth
–
Manage Cost
and Capital
–
Partner with
Hospitals, Payors
and ACOs
–
Continue to Delever
–
Acquire Facility Real
Estate
–
Grow Dividend
20 |
 Executing on
Kindred’s 5-Year Strategic Plan •
People Initiatives (Led by new Chief People Officer)
–
Increase Teammate Engagement and Satisfaction
–
Leadership Development, especially leaders who can operate across silos
–
Reduce Turnover / Improve Retention
–
Advance Culture of Patient Safety
–
Lead move to Shared Services Model
•
Quality and Organizational Excellence, especially at a time of constrained resources and
system-wide change
–
Develop Quality Indicators and Clinical Programs that support Continue-the-Care and
patient transitions and improve clinical outcomes
–
Re-energize Performance Improvement Programs
•
Growth (Sales and Marketing / Managed Care)
•
Cost Effectiveness, including overhead re-sizing and transformation (e.g. Project
Apollo) •
Capital Management, with specific focus on cash to fund development and/or shareholder return
strategy
Despite $100 million of reimbursement cuts in 2013, and significant
organizational change, the Company is executing well on its People,
Clinical and Financial Goals
Succeed in the Core
1
21 |
 2010 A
2013 A
2014 E
Change in Business Mix, Increased Facility Ownership and Reduction
in Lease Obligations Significantly Improves Future Growth and
Profitability
Repositioning
Strategy
2
Executing on Kindred’s 5-Year Strategic Plan
(1) Revenue before intercompany eliminations; (2) Leases capitalized using 6x rent;
Equity represents market cap as of 12/31 and Funded Debt as of 12/31 of each year.
Business
Mix
Owned vs
Leased
Facilities
(1)
Nursing
47%
Hospital
42%
Rehab
10%
Care
Mgmt
1%
Nursing
21%
Hospital
49%
Rehab
25%
Care
Mgmt
5%
Nursing
21%
Hospital
48%
Rehab
24%
Care
Mgmt
7%
NCD
63%
NCD Owned
9%
HD
Owned
5%
HD
23%
NCD
36%
NCD
Owned
13%
HD
Owned
9%
HD
42%
NCD
35%
NCD
Owned
15%
HD
Owned
9%
HD
41%
Equity
23%
Funded
Debt
11%
Capitalized
Leases
66%
Equity
23%
Funded
Debt
35%
Capitalized
Leases
42%
Equity
25%
Funded
Debt
32%
Capitalized
Leases
43%
22
Capital
Structure
(2) |
 TherEX
Acquisition completed in October 2013 to Expand RehabCare’s Hospital (IRF) Business
and Home Care Acquisitions Advance Care Management Capabilities
Aggressively Grow Kindred
at Home and RehabCare
3
Executing on Kindred’s 5-Year Strategic Plan
•
209 sites of service in 13
states
•
67
in Kindred’s Integrated
Care
Markets
(1)
•4,940 caregivers serving over
17,000 patients on a daily
basis
Care Management
Division/Kindred At
Home $354 million Pro
Forma Annualized
Revenues
(1)
23
•
Acquired Senior Home Care
–
Operated 47 home health locations throughout Florida and Louisiana,
with $143 million in revenues
–
$95 million purchase price
–
$0.07 to $0.09 EPS accretion anticipated in 2014
•
While implementation of Homecare Homebase IT
system contributed to performance issues in 2013,
all branches (including Senior Home Care) will be
fully operational and standardized by Q1 2014
•
Building management team, clinical operations, and
functional support to enable platform for continued
growth
(1)
Revenues
based
upon
historical
Sr.
Home
Care
results
plus
actual
Kindred
at
Home
operations
for
the
twelve
months
ended
December
31,
2013
(divisional
revenues
before
intercompany
eliminations). |
 24
Kindred’s Patient-Centered Care Management Model
4 |
 Boston
Cleveland
Indianapolis
Las Vegas
Houston
“New”
Dallas/Fort
Worth
Single Market
Leadership
Incentive Alignment
Post-Acute
Physician
Leadership
Standardized
Quality Measures
Centralized
Placement and
Admissions
Dedicated Care
Managers
I-T Interoperability /
Info Sharing
Integrated Care Market Strategy
Market Implementation Update
Advance Integrated Care
Market Strategy and
Implement Care
Management
Capabilities
5
Executing on Kindred’s 5-Year Strategic Plan
25 |
 •
Purchased
Tampa
Hospital
and
Bridgewater
TCC
Real
Estate
for
$35
million
•
Purchased certain facilities leased from HCP REIT
•
In
February
2014,
completed
the
acquisition
of
9
skilled
nursing
facilities
for
a
total
of
$83
million
•
Facilities have been removed from master lease expiring January 31, 2017, thereby eliminating
annual rent escalator
•
Transaction expected to be accretive to earnings $0.04 and cash flow $4.3 million in
2014 •
Ownership provides additional flexibility with regard to strategic decisions:
Expansion/Relocation/Repurposing
Disposition of facilities deemed non-strategic and/or underperforming
•
Proposed refinancing will reduce annual interest costs, extend maturities, and improve
covenant flexibility
•
Announced quarterly dividend of $0.12 per share, reflecting the Company’s confidence in its
ability to generate meaningful and sustainable Free Cash Flow
Improve Capital
Structure and
Enhanced Returns
6
Real Estate Purchases, Improved Senior Financing
Arrangements and Dividend Initiation
Executing on Kindred’s 5-Year Strategic Plan
26 |
 Legislative and Financial Review
27
*
*
*
*
*
*
*
*
* |
 LTAC
Legislation Enacted Providing Long Term Strategic Opportunity and Visibility
•
Key Provisions, Timeline and
Preliminary View of Impact
•
Strategic Considerations and
Opportunities
6%
33%
Medicare Fee For Service
Medicaid
Insurance/Medicare
Advantage/Other
61%
The Bipartisan Budget Act of 2013, signed by the President
on December 26, brings long-sought patient and facility
criteria to long-term care hospitals
Hospital
Division
Revenue
Mix
(1)
(1)
Revenues for the twelve months ended December 31, 2013 (divisional revenues before
intercompany eliminations). 28 |
 Overview of Key Payment Provisions
in LTAC Criteria Legislation
•
Definition of Patients Eligible for LTAC Rate
–
Patients
will
continue
to
be
eligible
for
payment
under
the
current
LTAC
PPS
if
they
meet
either
one
of
two criteria: patients with 3 or more days in an acute care hospital Intensive Care
Unit (ICU); or patients receiving
“prolonged
mechanical
ventilation”
(greater
than
96
hours)
in
the
LTAC
•
Definition of Patients Eligible for “Site Neutral”
Rate
–
Other
medically
complex
patients
may
still
be
admitted
to
LTACs
and
receive
a
“site
neutral”
rate
that
is
either
at
LTAC
cost
or
at
a
per
diem
rate
“comparable”
to
payments
made
to
acute
care
hospitals
under
the IPPS payment system
•
Effective Date and Phase-In
–
Effective date: Two-year Phase-in of criteria begins after October 1, 2015, linked to
each LTAC’s cost- reporting period
–
About 70% of Kindred LTACs have cost-reporting periods that begin July of each year;
phase-in of new criteria would not begin for most Kindred LTACs until Summer
2016 –
During
phase-in,
cases
receiving
“site
neutral”
rate
get
paid
50%
based
on
current
LTAC
rate
and
50%
based on the “site neutral”
rate
The
new
criteria
would
not
become
fully
effective
until
Summer
2018
for
most
Kindred
LTACS.
29 |
 Other
Key Provisions •
25 Day Length of Stay Requirement
–
Will not
apply to cases receiving the “site neutral”
rate
–
Will not
apply to Medicare Advantage Cases
–
Taken together, these provisions create a platform for effective
care management, managed care
products and better align payment with clinical outcomes
•
25% Rule Relief (effective immediately)
–
25% Rule does not apply to free-standing LTACs* for four years
–
25% Rule compliance level frozen at 50% for HIH LTACs for four years (75% for rural / MSA
dominant LTACs)
•
Moratorium
–
Effective January 1, 2015 through 2017
•
Compliance Threshold
–
Beginning in 2020, at least 50% of patients must be paid at LTAC
rate to maintain Medicare
Certification as an LTAC
* certified prior to October 1, 2004
30 |
 31
2014
2015
2016
2017
2018
Oct. 1
July 1
Oct. 1
July 1
Oct. 1
July 1
Oct. 1
July 1
Oct. 1
July 1
1. Patient Criteria
2. Site Neutral IPPS
Equivalent Rate:
•
50/50 Blend
•
Full Site Neutral
Rate
3. 25-Day Length of Stay
Rule Relief
4. 25% Rule Relief
5. Moratorium
6. “50%”
Compliance
Test
2020
LTAC Legislation Phase-in and Timeline for the
Majority of Kindred’s Hospitals
Jan 1, 2014
Jan 1, 2015
Summer 2016
Summer 2016
Summer 2016
Summer
2018 |
 Strategic Considerations
•
Affirms role of LTACs in healthcare continuum for severely ill, medically
complex patients at LTAC rate and many other medically complex patients
at site neutral rate.
•
Creates strategic platform for “managed care”
and “episodic”
LTAC services
–
Elimination of 25-day length of stay requirement for MA patients
–
Direct admits to LTACs at site neutral IPPS comparable rates
–
Continued development of co-located Sub-Acute Units to create patient
care continuum for recovering critically chronically ill patients in need of
inpatient and rehabilitation services
•
Opportunity to develop clinical programs and services that better align cost
and care (including risk-based arrangements) over the implementation
period to appeal to ACOs, managed care organizations and others
LTAC legislation provides significant clarity and will allow Kindred to
organically grow patient volumes and leverage existing capacity.
32 |
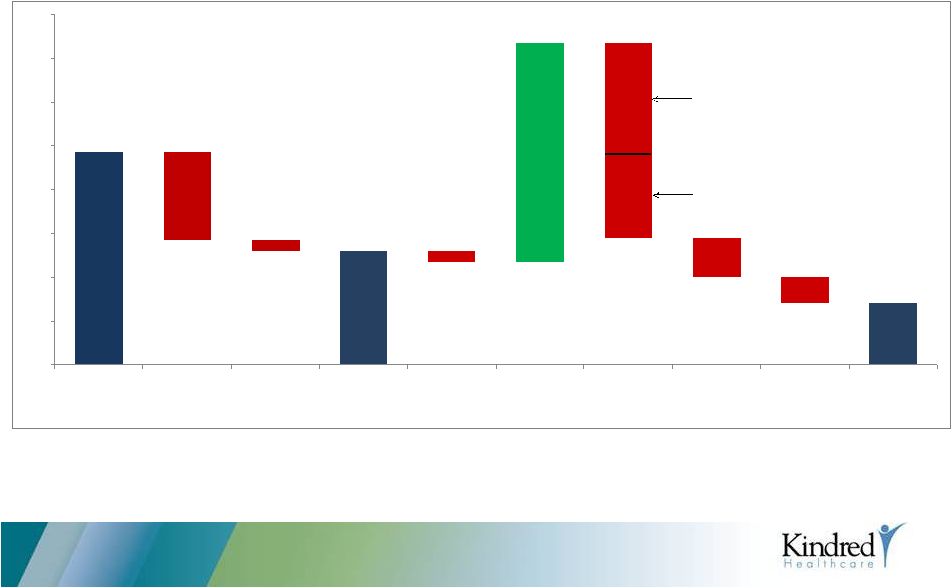 Cash
Sources/Uses 2013 $243
$130
$130
$117
$117
$144
$100
($29)
$71
($101)
($12)
($13)
$251
($96)
($44)
($128)
$0
$50
$100
$150
$200
$250
$300
$350
$400
Adj cash from
operations
Routine
CAPEX
Development
(De Novo
Facilities)
Free cash flow
Dividends
Proceeds from
asset sales
Acquisitions
One-time
payments
Cornerstone/ Net pay down
other
of debt
Home Health,
Rehab and other
Real Estate
33 |
 Net Free Cash
Flows 2014 Mid-Point of Guidance (As of February 20, 2014)
(a)
The guidance for cash flows excludes the effect of (1) payments for litigation, (2) any other
reimbursement changes and (3) any further acquisition or divestitures (except as
otherwise noted). (b)
Includes approximately $36 million of working capital cash release for VTR 59.
$260
($22)
$135
$109
$109
($103)
($26)
$0
$50
$100
$150
$200
$250
$300
Cash Flow from
Operations
(a)(b)
Routine
Capital Spending
Development
Capital Spending
Free Cash Flow
Dividends
Net Cash (a)
34 |
 Attractive
Investment Considerations Kindred Substantially Repositioned Going Into 2015
35
•
Repositioned to faster growth, higher
margin and less capital intensive businesses
•
Through repositioning, $1 billion of
revenues shifted from Nursing Centers
to
Hospital, Rehab and Home Health Care
since 2011.
1)
As of 12/31/13
2)
Pro Forma 2014 rents of $338M at 6x
Improving Business
Mix
(Revenues)
Enhanced Future
Earnings, Margin and
Free Cash Flow
Profile
(as of February 20, 2014)
($ in millions)
•
$125 million -
$145 million of free cash
flows
•
$80 million of ABL Revolver net paid down
since June 2013
•
$700 million reduction in lease adjusted
obligations
Improved Capital
Structure
($ in millions)
•
Enterprise EBITDAR Multiple: 6.4x
•
Dividend Yield: 2.4%
•
Free
Cash
Flow
Yield
4
:
12.6%
•
TAD / EBITDAR: 4.9x
3)
Market
value
calculated
as
of
close
of
business
on
12/31/13
($19.74).
4) Free Cash Flow Yield represents free cash flow mid-point divided by Market
Value of Equity. 2010
2014E
Hospital Services
42%
48%
Rehab Services
10%
24%
Nursing Center
47%
21%
Care Management /
Home Health Care
1%
7%
Total
100%
100%
EBITDAR
Cash Flows from
Operations
CAPEX
Free Cash Flow
Outstanding Share Count
Dividend
$120 -
$130
$725 -
$742
$26
$125 -
$145
$245 -
$275
54 million
Funded debt
1
$1,588
Lease obligations
2
$2,028
Total adjusted debt (TAD)
$3,616
Market value of equity
3
$1,069
Enterprise Value
$4,685 |
 Investment
Rationale •
Each year, nearly 9 million people –
24,000 a day –
are discharged from short-
term acute care hospitals and require some form of post-acute care
•
As the largest diversified post-acute provider, Kindred is uniquely positioned to
grow and succeed in what will be an increasingly integrated healthcare delivery
system
•
Kindred has a track record of providing quality, cost-effective care, operational
excellence and consistent levels of free cash flows
•
Our experienced management team, robust technology platform, and
demonstrated ability to adapt to change, together with our development and
repositioning strategy, offer the potential for creating significant value for
shareholders over time
36 |
 37
*
*
*
*
* |
 Appendix
38
*
*
*
*
*
*
*
*
*
* |
 2014 Earnings
Guidance ($ millions, except statistics)
As of February 20, 2014
Low
High
Operating income
725
$
742
$
Rent
338
338
Depreciation and amortization
165
165
Interest, net
106
106
Income from continuing operations before income taxes
116
133
Provision for income taxes
45
52
Income from continuing operations
71
81
Earnings attributable to noncontrolling interests
(13)
(13)
Income from continuing operations attributable to the Company
58
68
Allocation to participating unvested restricted stockholders
(2)
(2)
Available to common stockholders
56
$
66
$
Earnings per diluted share
1.05
$
1.25
$
Shares used in computing earnings per diluted share
53.2
53.2
The earnings guidance excludes the effect of reimbursement changes, severance and retirement
costs, litigation costs, transaction-related costs, any further acquisitions or
divestitures (except as otherwise noted), any impairment charges, and any repurchases
of common stock. 39 |
 Explanation of
Non-GAAP Measures 40
The enclosed presentation includes financial measures referred to as operating income, or
earnings before interest, income taxes, depreciation, amortization and rent. The
Company’s management uses operating income as a meaningful measure of operational performance in addition to other measures. The
Company uses operating income to assess the relative performance of its operating divisions as
well as the employees that operate these businesses. In addition, the Company believes
this measurement is important because securities analysts and investors use this measurement to compare the Company’s
performance to other companies in the healthcare industry. The Company believes that income
(loss) from continuing operations is the most comparable GAAP measure. Readers of the
Company’s financial information should consider income (loss) from continuing operations as an important measure of the
Company’s financial performance because it provides the most complete measure of its
performance. Operating income should be considered in addition to, not as a substitute
for, or superior to, financial measures based upon GAAP as an indicator of operating performance. A reconciliation of operating income to
income (loss) from continuing operations is provided in the enclosed Appendix.
In addition to the results provided in accordance with GAAP, the Company provides information
in the enclosed presentation compute certain non-GAAP measurements before certain
charges or on a core basis. The charges that were excluded from core operating results are denoted in the tables in the enclosed
Appendix. The use of these non-GAAP measurements are not intended to replace the
presentation of the Company's financial results in accordance with GAAP. The Company
believes that the presentation of core operating results provides additional information to investors to facilitate the comparison between
periods by excluding certain charges that the Company believes are not representative of its
ongoing operations due to the materiality and nature of the charges. The Company's core
operating results also represent a key performance measure for the purpose of evaluating performance internally. . The Compan
believes that income (loss) from continuing operations is the most comparable GAAP measure.
Readers of the Company’s financial information should consider income (loss) from
continuing operations as an important measure of the Company’s financial performance because it provides the most complete measure of
its performance.
The Company also includes the financial measure of free cash flows excluding certain
items. The Company recognizes that free cash flows excluding certain items is a
non-GAAP measurement and is not intended to replace the presentation of the Company’s cash flows in accordance with GAAP. The Company
believes that this non-GAAP measurement provides important information to investors
related to the amount of discretionary cash flows that are available for other
investing and financing activities. In addition, management uses free cash flows excluding certain items in making decisions related to acquisitions,
development capital expenditures, dividends, long-term debt repayments and other uses. The
Company believes net cash flows provided by operating activities is the most comparable
GAAP measure. Readers of the Company’s financial information should consider net cash flows provided by operating
activities as an important measure of the Company’s financial performance because it
provides the most complete measure of its performance. Free cash flows excluding certain
items should be considered in addition to, not as a substitute for, or superior to, financial measures based upon GAAP as an indicator of
operating performance. A reconciliation of net cash flows provided by operating activities to
free cash flows excluding certain items is included in the enclosed Appendix.
|
 Reconciliation
of
Non-GAAP
Measures
(in
thousands)
41
2012 Quarters
2013 Quarters
First
Second
Third
Fourth
Year
First
Second
Third
Fourth
Year
Revenues:
Hospital division
679,813
$
645,714
$
633,972
$
645,426
$
2,604,925
$
674,363
$
621,454
$
606,488
$
619,344
$
2,521,649
$
Nursing center division
274,358
269,986
273,265
274,807
1,092,416
275,141
269,501
270,210
274,908
1,089,760
Rehabilitation division:
Skilled nursing rehabilitation services:
253,370
253,013
252,134
244,485
1,003,002
257,557
248,321
243,974
241,938
991,790
Hospital rehabilitation services
74,369
73,402
71,899
73,910
293,580
74,523
69,777
68,296
74,017
286,613
327,739
326,415
324,033
318,395
1,296,582
332,080
318,098
312,270
315,955
1,278,403
Care management division
28,432
28,872
35,943
50,093
143,340
51,621
53,039
53,801
66,466
224,927
1,310,342
1,270,987
1,267,213
1,288,721
5,137,263
1,333,205
1,262,092
1,242,769
1,276,673
5,114,739
Eliminations:
Skilled nursing rehabilitation services:
(27,888)
(27,551)
(27,037)
(26,123)
(108,599)
(29,303)
(29,257)
(28,698)
(28,728)
(115,986)
Hospital rehabilitation services
(24,686)
(24,225)
(23,666)
(24,200)
(96,777)
(24,362)
(23,855)
(23,080)
(22,696)
(93,993)
Nursing centers
(636)
(875)
(861)
(1,006)
(3,378)
(1,213)
(1,001)
(1,161)
(875)
(4,250)
(53,210)
(52,651)
(51,564)
(51,329)
(208,754)
(54,878)
(54,113)
(52,939)
(52,299)
(214,229)
1,257,132
$
1,218,336
$
1,215,649
$
1,237,392
$
4,928,509
$
1,278,327
$
1,207,979
$
1,189,830
$
1,224,374
$
4,900,510
$
Income (loss) from continuing operations:
Operating income (loss):
Hospital division
151,784
$
132,358
$
131,041
$
147,041
$
562,224
$
150,043
$
132,170
$
113,014
$
127,929
$
(a)
523,156
$
Nursing center division
34,067
36,215
38,960
32,016
141,258
29,844
36,678
32,146
36,694
135,362
Rehabilitation division:
Skilled nursing rehabilitation services:
10,679
19,351
16,929
21,001
67,960
12,046
20,297
(8,565)
12,918
(b)
36,696
Hospital rehabilitation services
16,116
17,860
16,977
18,792
69,745
18,132
19,573
18,215
18,005
(c)
73,925
26,795
37,211
33,906
39,793
137,705
30,178
39,870
9,650
30,923
110,621
Care management division
2,341
2,789
3,645
4,933
13,708
2,786
3,961
1,085
2,131
(d)
9,963
Corporate:
Overhead
(42,728)
(44,723)
(45,883)
(45,729)
(179,063)
(45,582)
(43,199)
(39,151)
(48,563)
(e)
(176,495)
Insurance subsidiary
(482)
(600)
(545)
(500)
(2,127)
(509)
(384)
(482)
(539)
(1,914)
(43,210)
(45,323)
(46,428)
(46,229)
(181,190)
(46,091)
(43,583)
(39,633)
(49,102)
(178,409)
Impairment charges
(356)
(108)
(376)
(108,113)
(108,953)
(187)
(438)
(441)
(76,127)
(77,193)
Transaction costs
(485)
(597)
(482)
(667)
(2,231)
(944)
(108)
(613)
(447)
(2,112)
Operating income
170,936
162,545
160,266
68,774
562,521
165,629
168,550
115,208
72,001
521,388
Rent
(76,092)
(77,379)
(78,485)
(78,222)
(310,178)
(78,134)
(78,970)
(78,410)
(82,563)
(318,077)
Depreciation and amortization
(39,098)
(40,318)
(40,973)
(42,296)
(162,685)
(42,322)
(39,303)
(37,267)
(38,437)
(157,329)
Interest, net
(26,288)
(26,455)
(26,452)
(27,683)
(106,878)
(28,084)
(27,609)
(24,399)
(23,906)
(103,998)
Income (loss) from continuing operations
before income taxes
29,458
18,393
14,356
(79,427)
(17,220)
17,089
22,668
(24,868)
(72,905)
(58,016)
Provision (benefit) for income taxes
12,083
7,820
6,022
3,782
29,707
6,391
9,103
(7,530)
(21,168)
(13,204)
17,375
$
10,573
$
8,334
$
(83,209)
$
(46,927)
$
10,698
$
13,565
$
(17,338)
$
(51,737)
$
(44,812)
$
(a)
Includes costs of $0.5 million in connection with the closing of
a TC hospital and a litigation charge of $7.0 million.
(b)
Includes $0.1 million of severance and retirement costs.
(c)
Includes $1.1 million of severance and retirement costs.
(d)
Includes $0.1 million of severance and retirement costs.
(e)
Includes $2.4 million of severance and retirement costs. |
 42
Three months ended December 31, 2013
Charges
Severance
Facility
Before
and retirement
closing
Impairment
Transaction
As
charges
costs
costs
Litigation
charges
costs
Total
reported
Income (loss) from continuing operations:
Operating income (loss):
Hospital division
135,428
$
-
$
(499)
$
(7,000)
$
-
$
-
$
(7,499)
$
127,929
$
Nursing center division
36,694
-
-
-
-
-
-
36,694
Rehabilitation division:
Skilled nursing rehabilitation services
13,057
(139)
-
-
-
-
(139)
12,918
Hospital rehabilitation services
19,093
(1,088)
-
-
-
-
(1,088)
18,005
32,150
(1,227)
-
-
-
-
(1,227)
30,923
Care management division
2,206
(75)
-
-
-
-
(75)
2,131
Corporate:
Overhead
(46,202)
(2,361)
-
-
-
-
(2,361)
(48,563)
Insurance subsidiary
(539)
-
-
-
-
-
-
(539)
(46,741)
(2,361)
-
-
-
-
(2,361)
(49,102)
Impairment charges
(45)
-
-
-
(76,082)
-
(76,082)
(76,127)
Transaction costs
-
-
-
-
-
(447)
(447)
(447)
Operating income
159,692
(3,663)
(499)
(7,000)
(76,082)
(447)
(87,691)
72,001
Rent
(82,563)
-
-
-
-
-
-
(82,563)
Depreciation and amortization
(38,437)
-
-
-
-
-
-
(38,437)
Interest, net
(23,906)
-
-
-
-
-
-
(23,906)
Income (loss) from continuing operations
before income taxes
14,786
(3,663)
(499)
(7,000)
(76,082)
(447)
(87,691)
(72,905)
Provision (benefit) for income taxes
4,064
(1,443)
(202)
(5,455)
(17,803)
(329)
(25,232)
(21,168)
10,722
$
(2,220)
$
(297)
$
(1,545)
$
(58,279)
$
(118)
$
(62,459)
$
(51,737)
$
Three months ended December 31, 2012
Charges
Lease
Before
Severance
Impairment
Transaction
cancellation
As
charges
and other
charges
costs
charges
Total
reported
Income (loss) from continuing operations:
Operating income (loss):
Hospital division
147,730
$
(689)
$
-
$
-
$
-
$
(689)
$
147,041
$
Nursing center division
33,917
(1,901)
-
-
-
(1,901)
32,016
Rehabilitation division:
Skilled nursing rehabilitation services
21,318
(317)
-
-
-
(317)
21,001
Hospital rehabilitation services
18,889
(97)
-
-
-
(97)
18,792
40,207
(414)
-
-
-
(414)
39,793
Care management division
5,083
(150)
-
-
-
(150)
4,933
Corporate:
Overhead
(44,680)
(1,049)
-
-
-
(1,049)
(45,729)
Insurance subsidiary
(500)
-
-
-
-
-
(500)
(45,180)
(1,049)
-
-
-
(1,049)
(46,229)
Impairment charges
(214)
-
(107,899)
-
-
(107,899)
(108,113)
Transaction costs
-
-
-
(667)
-
(667)
(667)
Operating income
181,543
(4,203)
(107,899)
(667)
-
(112,769)
68,774
Rent
(78,046)
-
-
-
(176)
(176)
(78,222)
Depreciation and amortization
(42,296)
-
-
-
-
-
(42,296)
Interest, net
(27,683)
-
-
-
-
-
(27,683)
Income (loss) from continuing operations
before income taxes
33,518
(4,203)
(107,899)
(667)
(176)
(112,945)
(79,427)
Provision for income taxes
11,955
(1,673)
(6,150)
(273)
(77)
(8,173)
3,782
21,563
$
(2,530)
$
(101,749)
$
(394)
$
(99)
$
(104,772)
$
(83,209)
$
Reconciliation
of
Non-GAAP
Measures
(Cont.)
($ in thousands) |
 Reconciliation
of
Non-GAAP
Measures
(Cont.)
($ in thousands)
Year ended December 31, 2013
Charges
Severance
Facility
Senior debt
Before
One-time
and retirement
closing
Impairment
Transaction
modification
As
charges
bonus
costs
costs
Litigation
charges
costs
charges
Total
reported
Income (loss) from continuing operations:
Operating income (loss):
Hospital division
544,879
$
(7,997)
$
-
$
(6,026)
$
(7,700)
$
-
$
-
$
-
$
(21,723)
$
523,156
$
Nursing center division
140,132
(4,706)
-
(64)
-
-
-
-
(4,770)
135,362
Rehabilitation division:
Skilled nursing rehabilitation service
65,037
(5,052)
(139)
-
(23,150)
-
-
-
(28,341)
36,696
Hospital rehabilitation services
76,556
(1,255)
(1,376)
-
-
-
-
-
(2,631)
73,925
141,593
(6,307)
(1,515)
-
(23,150)
-
-
-
(30,972)
110,621
Care management division
11,924
(833)
(676)
(452)
-
-
-
-
(1,961)
9,963
Corporate:
Overhead
(172,355)
(315)
(3,366)
-
-
-
-
(459)
(4,140)
(176,495)
Insurance subsidiary
(1,914)
-
-
-
-
-
-
-
-
(1,914)
(174,269)
(315)
(3,366)
-
-
-
-
(459)
(4,140)
(178,409)
Impairment charges
(1,111)
-
-
-
-
(76,082)
-
-
(76,082)
(77,193)
Transaction costs
-
-
-
-
-
-
(2,112)
-
(2,112)
(2,112)
Operating income
663,148
(20,158)
(5,557)
(6,542)
(30,850)
(76,082)
(2,112)
(459)
(141,760)
521,388
Rent
(318,077)
-
-
-
-
-
-
-
-
(318,077)
Depreciation and amortization
(157,329)
-
-
-
-
-
-
-
-
(157,329)
Interest, net
(102,537)
-
-
-
-
-
-
(1,461)
(1,461)
(103,998)
Income (loss) from continuing operations
before income taxes
85,205
(20,158)
(5,557)
(6,542)
(30,850)
(76,082)
(2,112)
(1,920)
(143,221)
(58,016)
Provision (benefit) for income taxes
30,870
(7,932)
(2,186)
(2,312)
(12,139)
(17,803)
(947)
(755)
(44,074)
(13,204)
54,335
$
(12,226)
$
(3,371)
$
(4,230)
$
(18,711)
$
(58,279)
$
(1,165)
$
(1,165)
$
(99,147)
$
(44,812)
$
Year ended December 31, 2012
Charges
Lease
Before
Severance
Impairment
Transaction
cancellation
As
charges
and other
Litigation
charges
costs
charges
Total
reported
Income (loss) from continuing operations:
Operating income (loss):
Hospital division
571,448
$
(4,224)
$
(5,000)
$
-
$
-
$
-
$
(9,224)
$
562,224
$
Nursing center division
144,069
(2,811)
-
-
-
-
(2,811)
141,258
Rehabilitation division:
Skilled nursing rehabilitation service
68,313
(353)
-
-
-
-
(353)
67,960
Hospital rehabilitation services
69,853
(108)
-
-
-
-
(108)
69,745
138,166
(461)
-
-
-
-
(461)
137,705
Care management division
13,858
(150)
-
-
-
-
(150)
13,708
Corporate:
Overhead
(177,979)
(1,084)
-
-
-
-
(1,084)
(179,063)
Insurance subsidiary
(2,127)
-
-
-
-
-
-
(2,127)
(180,106)
(1,084)
-
-
-
-
(1,084)
(181,190)
Impairment charges
(1,054)
-
-
(107,899)
-
-
(107,899)
(108,953)
Transaction costs
-
-
-
-
(2,231)
-
(2,231)
(2,231)
Operating income
686,381
(8,730)
(5,000)
(107,899)
(2,231)
-
(123,860)
562,521
Rent
(308,487)
-
-
(1,691)
(1,691)
(310,178)
Depreciation and amortization
(162,685)
-
-
-
-
-
-
(162,685)
Interest, net
(106,878)
-
-
-
-
-
-
(106,878)
Income (loss) from continuing operations
before income taxes
108,331
(8,730)
(5,000)
(107,899)
(2,231)
(1,691)
(125,551)
(17,220)
Provision for income taxes
42,502
(3,427)
(1,962)
(6,150)
(592)
(664)
(12,795)
29,707
65,829
$
(5,303)
$
(3,038)
$
(101,749)
$
(1,639)
$
(1,027)
$
(112,756)
$
(46,927)
$
43 |
 Reconciliation
of Non-GAAP Measures (Cont.) 44
($ in thousands) |
 Reconciliation
of Non-GAAP Measures (Cont.) ($ in thousands)
Three months ended
Year ended
December 31,
December 31,
2013
2012
2013
2012
Reconciliation of net cash flows provided by operating
activities to free cash flows:
Net cash flows provided by operating activities
$10,195
$71,475
$199,412
$262,562
Less:
Routine capital expenditures
(37,956)
(38,371)
(100,908)
(115,175)
Development capital expenditures
(1,115)
(12,147)
(11,824)
(50,322)
(39,071)
(50,518)
(112,732)
(165,497)
Free cash flows including certain items
(28,876)
20,957
86,680
97,065
Adjustments to remove certain payments (including payments
made for discontinued operations) included in net cash flows
provided by operating activities:
One-time employee bonus
-
-
26,345
-
Ventas lease termination fee
20,000
-
20,000
-
Transaction costs
1,877
932
10,427
3,404
Severance and retention
617
1,715
5,406
3,719
Lease cancellation
-
176
-
1,691
Financing costs capitalized as deferred financing
-
2,940
6,189
2,940
Benefit of reduced income tax payments resulting from
certain payments
(9,018)
(922)
(24,667)
(3,244)
13,476
4,841
43,700
8,510
Free cash flows excluding certain items
($15,400)
$25,798
$130,380
$105,575
45 |
 Reconciliation
of Non-GAAP Measures (Cont.) 46
Year ended
December 31,
2013
Reconciliation of operating income to Adjusted EBITDA:
Operating income before disclosed charges
$521,388
Disclosed charges (as detailed above)
141,760
Core operating income
663,148
Other covenant adjustments:
Other non-cash impairment charges
1,111
Non-cash compensation expense
11,183
Insurance subsidiary loss
1,914
Investment income
4,051
Cost savings run rate adjustment
1,000
Noncontrolling interests
(3,657)
15,602
Adjusted EBITDAR
678,750
Less Rent
318,077
Adjusted EBITDA
$360,673
The Company recognizes that Adjusted EBITDA
and Adjusted EBITDAR are non- GAAP measurements. The Company believes that these
non-GAAP measurements provide important information to lenders related to the
defined measurements used for purposes of compliance with the Company's debt covenant
calculations. The following reconcilation presents Adjusted EBITDAR and Adjusted
EBITDA consistent with the definitions of both the ABL Credit Agreement and the Term
Loan Agreement. |