Attached files
| file | filename |
|---|---|
| 8-K - FORM 8-K - LOCAL Corp | d691028d8k.htm |
 |
 2
2
Forward looking statements
Adjusted EBITDA, as defined above, is not a measurement under GAAP.
Adjusted EBITDA is reconciled to net loss and loss per share,
which we believe are the most comparable GAAP measures, at the end of this
presentation. Management believes that Adjusted EBITDA provides useful
information to investors about the company’s performance because it
eliminates the effects of period-to-period changes in income from interest
on the company’s cash and marketable securities, expense from the
company’s financing transactions and the costs associated with income
tax expense, capital investments, stock-based compensation expense,
warrant revaluation charges, and non-recurring charges which are not
directly attributable to the underlying performance of the company’s
business operations. Management uses Adjusted EBITDA in evaluating
the overall performance of the company’s business operations.
A limitation of non-GAAP Adjusted EBITDA is that it excludes items
that often have a material effect on the company’s net income and earnings
per common share calculated in accordance with GAAP. Therefore,
management compensates for this limitation by using Adjusted EBITDA in
conjunction with GAAP net loss and loss per share measures. The
company believes that Adjusted EBITDA provides investors with an
additional tool for evaluating the company’s core performance, which
management uses in its own evaluation of overall performance, and as a
base-line for assessing the future earnings potential of the company.
While the GAAP results are more complete, the company prefers to allow
investors to have this supplemental metric since, with reconciliation to
GAAP (as noted above), it may provide greater insight into the company’s
financial results. The non-GAAP measures should be viewed as a
supplement to, and not as a substitute for, or superior to, GAAP net
income or earnings per share.
Certain matters being discussed by Local Corporation’s management today
include forward looking statements which are made pursuant to the Safe
Harbor provisions of section 21-E of the Securities Exchange Act of 1934.
Investors are cautioned that statements which are not strictly historical
statements, including statements concerning future expected financial
performance, management objectives and plans for future operations, our
relationships with strategic or other partners, the release of new products or
services or enhancements to existing products or services, our expectations
regarding potential acquisitions and the future performance of past
acquisitions including our ability to realize expected synergies, trends in the
market for our current or planned products or services, and market
acceptance of our products or services, constitute forward looking statements.
The forward looking statements include, but are not limited to, any statements
containing the words “expect”, “anticipate”, “estimates”,
“believes”, “should”, “could”, “may”,
“possibly”, and similar expressions and the negatives thereof. These forward looking
statements involve a number of risks and uncertainties that could cause actual results to
differ materially from the forward looking statements. Those risks and uncertainties are
detailed in the company’s filings from time to time with the Securities and Exchange
Commission. The information contained in the forward looking statements is provided as of the
date of such oral statements and the company disclaims any obligation to
update such statements.
Adjusted EBITDA is defined as net income (loss) excluding: provision for
income taxes; interest and other income (expense), net; depreciation;
amortization; stock-based compensation charges; gain or loss on derivatives’
revaluation; net income (loss) from discontinued operations; LEC receivables
reserve; finance-related charges; accrued lease liability/asset; severance
charges; and an expense related to a settlement accrual.
|
 3
3
Our mission
Making it easy for consumers
to find and connect with the products and
businesses they want and need.
3 |
 4
4
Current Financial Momentum
Who we are
Note: See reconciliation of Adjusted EBITDA to GAAP net income at presentation
end. 1999/2004
LOCM (NASDAQ)
31% from 2006 to 2013
27 million consumers/month
Local.com –
Top US Site
~ 1,600 sites
12 issued + applications pending
Deloitte Fast 500™
4 years in a row
Irvine, CA
~90
Founded/IPO
Ticker
Revenue CAGR
Reach
Flagship Site
Network
Patents
Recognition
Headquarters
Employees |
 5
5
Structured for growth
Note: See reconciliation of Adjusted EBITDA to GAAP net
income at presentation end.
Core Search
Local Shopping
& Discovery
Intellectual Property
Reasons to invest:
Growing base of consumers and partners
•
27 million consumers/month
•
1,600 network sites
Positioned to be leader in mobile
•
Mobile traffic up 24% Y/Y
•
Expanding mobile search landscape
Multiple avenues to value
•
Display/pay-per-click/pay-per-call ads
•
Leverage Krillion data technology
•
IP monetization
Improving financial performance
•
4 consecutive quarters of revenue and
Adjusted EBIDTA growth
•
Positive cash flow from operating
activities in 2013
5 |
 6
6
Enhancing the value of online search
TODAY
KRILLION
Rich Content
Basic Content
•
What
•
Where
•
Product Information
•
Proximity
•
Price History
•
Price Alerts
•
In-stock Availability |
 7
7
What we do
Reaching consumers across desktop and mobile |
 8
8
Owned and Operated sites
Earns
income
from
clicks
on
search
ads
and
page
views
on
display
ads
Ad types:
•
•
•
…plus our additional suite of vertical sites
= Revenue source
Display
Video
Business Search |
 9
9
Network of managed sites
Business Directory
Shopping Directory
Earns
income
from
clicks
on
search
ads
and
page
views
of
display
ads
Ad types:
•
•
•
= Revenue source
Mobile Business
Directory
Business Search
Product Search
Display |
 10
10
Extended Network monetization
Earns income from clicks and impressions on search, pay-per-call and
various display ads Ad types:
•
•
•
•
•
= Revenue source
Display
Business Search
Product Search
Pay-Per-Call
Video |
 11
11
Our partners |
 12
12
Large market opportunity
Total Online Advertising Spend in US Billions
In online advertising spend
expected over the next 5 years
Source: Borrell Associates, Inc. 2014
12 |
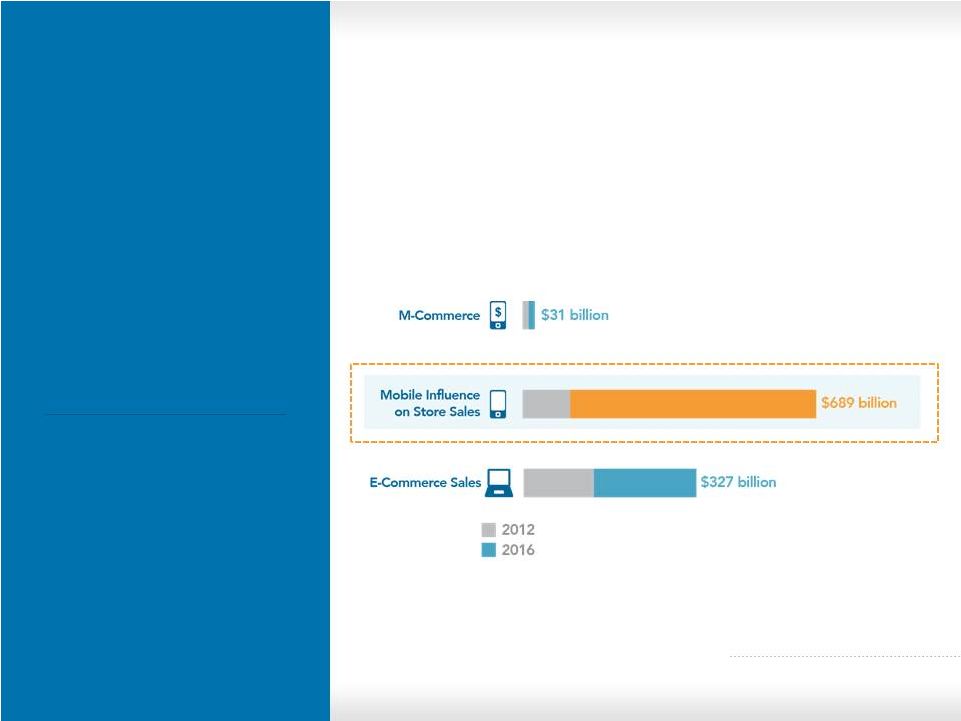 13
Source: Deloitte 2012
Mobile-influenced in-store
sales greater than online
Over the next
three years:
Mobile-influenced store sales are projected
to reach
$689 billion.
5x
greater
Addressable
market is
than everything
sold online today.
Source: Forrester Research –
Web-influenced retail sales forecast
13 |
 14
14
Our customer value proposition
answers
3 key questions:
Krillion drives local
shopping
•
Is it carried near me?
•
Is it available in-store?
•
How much does it cost?
Krillion’s dynamic platform provides retailers & brands multiple
channels to engage consumers wherever they research online.
Retailers
Manufacturers
Web & Mobile
Publishers & Search
Engines
Developers
Innovative solutions for:
14 |
 15
15
Top priorities:
Location of Retail Stores in the Krillion Database
Broaden coverage with retailers & manufacturers
Enable and expand monetization
Secure additional distribution with publishers
Krillion –
the leading local
shopping authority
3 Million
Localized Products
Over
120,000
National and Regional
Retailer Stores
90%
Coverage
of the Top 100 U.S. Retailers |
 16
16
Monetize IP portfolio
The patent descriptions herein do not constitute the legal opinion or advice of the
patent owner or their counsel. The reader is encouraged to seek the advice
of their own counsel regarding the scope of any
domestic or foreign patents.
Positive claim
construction
ruling
Cascading Menu patent
Trial scheduled for May 2014
Preserving rights
and reviewing
options to
maximize value
Pay-Per-Call patent portfolio
16 |
 17
17
Strong financial
fundamentals
Investing for growth
Notable
Accomplishments:
•
•
•
•
Note: See Appendix for reconciliation of Adjusted EBITDA to GAAP
net income
17
Positive cash flow from operating
activities in 2013
Four consecutive quarters of
Revenue and Adjusted
EBITDA growth
Reduced GAAP net loss year-over-
year by more than 50%
Largest year-over-year network
revenue growth, up 141% in 2012 |
 18
18
Record network
revenue growth
$ in Millions
Q2-12
Q3-12
Q4-12
Q1-13
Q2-13
Q3-13
Q4-13
Network Revenue
$5.0
$5.0
$7.6
$8.3
$11.6
$14.5
$16.1
In the last seven quarters,
Network revenue has
Grown
4x
18 |
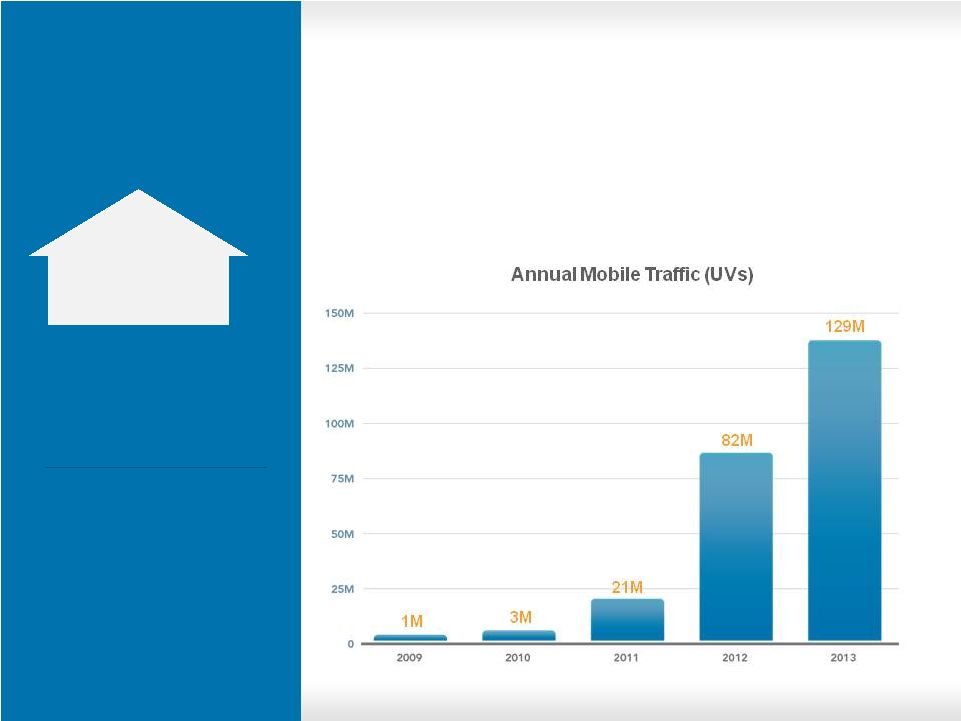 19
19
Plus exponential growth
in mobile
Serving more consumers
209%
CAGR Mobile Traffic
over the past five years
Mobile traffic represents
39%
of total
overall traffic |
 20
20
2014 financial targets by
business segment
Managed Sites
(Directory)
2014 Revenue*
% of 2014
Revenue
$50,000,000
48%
3,000,000
3%
Margin %
35%
75%
Owned & Operated
52,000,000
50%
15%
53,000,000
50%
37%
$105,000,000
100%
26%
Extended Ad Network
(Display/Search Ads/Pay-Per-Call)
*Estimate |
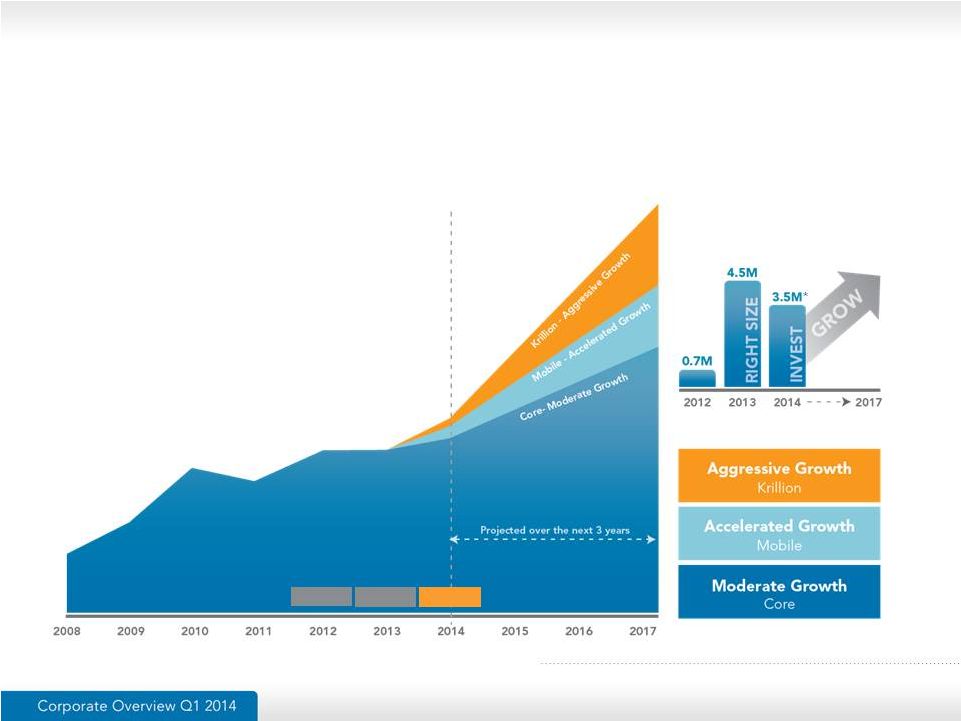 Improving financials
Stabilize
Execute
GROW
Investing for Growth
(Adjusted EBITDA)
Note: See reconciliation of Adjusted EBITDA to GAAP net income at presentation
end. *Estimate
Evolving model remains strong
Multiple growth drivers
21 |
 22
22
4Q13 Balance Sheet & Cap. Table
Key Balance Sheet Items
(In Thousands)
12/31/2013
Cash
$5,069
Accounts Receivable
17,298
Total Assets
51,579
Total Debt
12,684
Total Liabilities
31,294
Stockholders Equity
20,285
Capitalization
(In Thousands)
12/31/2013
Common Stock
23,038
Convertible Debentures
2,488
Options (Weighted avg. strike 4.17)
3,375
Warrants
(Weighted avg. strike 2.01)
766
RSUs
248
Fully Diluted
29,915
Additional
Data:
I.
$12 million credit facility with $9 million outstanding and $3 million available under the
line of credit. Interest rate approximately 5% II.
Total authorized shares 65,000,000 common and 10,000,000 preferred
III.
In April 2013, the company closed $5 million in convertible notes. Interest rate of 7%.
Conversion price of $2.01. Included 746,000 of warrants with $2.01 exercise price. |
 23
23
Leadership team
Ken Cragun
CFO
25+ years experience
CFO, Modtech
SVP, MIVA
CFO, ImproveNet
CPA, Big 4 Exp.
Michael Sawtell
President & COO
25+ years experience
Pres. / CEO, DigitalPost Interactive
Pres. / COO , Interchange Corp.
(now Local Corporation)
COO, Informative Research
Operations Director, Northrop Grumman
Operations, General Dynamics
Fred Thiel
Chairman of the Board
25+ years experience
Board Member/Senior Advisor to public
and private technology companies, PE and
VC firms
Managing Partner, Triton Pacific
Capital Partners
Founder & Managing Partner,
TechStarter Ventures
CEO, GameSpy Industries
Scott Reinke
General Counsel
15 years experience
EVP and Gen. Counsel, Emerging Media
Group, Inc. (TRAFFIQ, Inc.)
EVP and Gen. Counsel, Market Maker
Interactive, Inc.
Associate Gen. Counsel and VP, MIVA |
 24
24
Structured for growth
Note: See reconciliation of Adjusted EBITDA to GAAP net
income at presentation end.
Reasons to invest:
Growing base of consumers and partners
•
27 million consumers/month
•
1,600 network sites
Positioned to be leader in mobile
•
Mobile traffic up 24% Y/Y
•
Expanding mobile search landscape
Multiple avenues to value
•
Display/pay-per-click/pay-per-call ads
•
Leverage Krillion data technology
•
IP monetization
Improving financial performance
•
4 consecutive quarters of revenue and
Adjusted EBIDTA growth
•
Positive cash flow from operating
activities in 2013
24
Core Search
Local Shopping
& Discovery
Intellectual Property |
 Thank You
Thank you
Fred Thiel
Fred@local.com
949.784.0800
Local
Corporation
|
7555
Irvine
Center
Drive
|
Irvine
CA
92618
|
949.784.0800
www.localcorporation.com |
 Thank You
Appendix |
 27
27
Market Cap/Sales Valuation
Company
Symbol
Price
Market Cap (MM)
2014E Sales (MM)
2014E Market Cap/Sales
Blucora, Inc.
BCOR
$ 20.04
$ 843.3
$ 223.0
3.8
ReachLocal, Inc.
RLOC
$ 10.69
$ 294.3
$ 590.0
0.5
Angie’s List, Inc.
ANGI
$ 13.84
$ 808.7
$ 325.0
2.5
Marchex, Inc.
MCHX
$ 12.27
$ 443.4
$ 177.0
2.5
Autobytel, Inc.
ABTL
$ 14.90
$ 132.7
$ 86.0
1.5
Yelp, Inc.
YELP
$ 97.77
$ 6,730.0
$ 355.0
19.0
Travelzoo Inc.
TZOO
$ 24.09
$ 361.1
$ 163.0
2.2
XOXO Group Inc.
XOXO
$ 12.45
$ 307.9
$ 145.0
2.1
Demand Media
DMD
$ 4.76
$ 429.9
$ 96.0
4.5
Web.com Group
WWWW
$ 37.04
$ 1,840.0
$ 590.0
3.1
Average
4.2
Local Corp
LOCM
$ 1.59
$ 36.5
$ 105.0
0.3 |
 28
28
Reconciliation: Adjusted EBITDA
to GAAP Net Income
Description
FY-09
FY-10
FY-11
FY-12
FY-13
FY-14*
Adjusted EBITDA
$3,041
$13,775
$3,247
$777
$4,533
$3,500
Less interest and other income (expense), net
(27)
(275)
(413)
(425)
(2,321)
(1,700)
Less provision for income taxes
(158)
(102)
(178)
(111)
(139)
(200)
Less amortization of intangibles
(2,524)
(5,734)
(4,864)
(3,611)
(912)
(900)
Less depreciation
(734)
(1,418)
(3,182)
(3,658)
(3,896)
(4,000)
Less stock-based compensation
(2,364)
(2,911)
(3,442)
(2,533)
(1,619)
(800)
Less LEC receivable reserve
-
(1,407)
(1,721)
Less net loss from discontinued operations
-
(6,899)
(14,250)
(3,729)
Plus gain on sale of Rovion
-
1,458
Plus revaluation of warrants
-
887
2,633
202
1,100
Less Geo-Tag settlement
(2,981)
(550)
Less non-recurring charges
(520)
(1,461)
(684)
(1,108)
(1,200)
GAAP Net income (loss)
$(6,267)
$4,222
$(14,559)
$(24,242)
$(10,362)
$(5,300)
Note: Since we cannot predict the valuation of the warrant liability and the
conversion option liability, we cannot reasonably project our GAAP net
income (loss). We, therefore, cannot provide GAAP guidance, but we do report
GAAP results. An explanation of the Company’s use of Non-GAAP measures is
set forth on Slide 30 *Estimate |
 29
29
Use of non-GAAP measures
This document includes the non-GAAP financial measure of “Adjusted EBITDA” which we
define as net income (loss) excluding: provision for income taxes; interest and other income
(expense), net; depreciation; amortization; stock based compensation charges; gain or loss on
derivatives’ revaluation, net income (loss) from discontinued operations; gain on sale of Rovion; impairment charges;
LEC receivables reserve; finance related charges; accrued lease liability/asset; and severance
charges. Adjusted EBITDA, as defined above, is not a measurement under GAAP. Adjusted EBITDA is
reconciled to net income (loss) which we believe is the most comparable GAAP measure. A
reconciliation of net income (loss) to Adjusted EBITDA is set forth within this presentation.
Management believes that Adjusted EBITDA provides useful information to investors about the
company’s performance because it eliminates the effects of period-to-period
changes in income from interest on the company’s cash and marketable securities, expense
from the company’s financing transactions and the costs associated with income tax expense,
capital investments, stock-based compensation expense, LEC receivables reserve, warrant
revaluation charges; finance related charges; accrued lease liability; and severance
charges which are not directly attributable to the underlying performance of the company’s business operations.
Management uses Adjusted EBITDA in evaluating the overall performance of the company’s business
operations.
A limitation of non-GAAP Adjusted EBITDA is that it excludes items that often have a material
effect on the company’s net income and earnings per common share calculated in accordance
with GAAP. Therefore, management compensates for this limitation by using Adjusted EBITDA in
conjunction with net income (loss) and net income (loss) per share measures. The company believes that
Adjusted EBITDA provides investors with an additional tool for evaluating the company’s core
performance, which management uses in its own evaluation of overall performance, and as a
base-line for assessing the future earnings potential of the company. While the GAAP results
are more complete, the company prefers to allow investors to have this supplemental metric since, with reconciliation
to GAAP; it may provide greater insight into the company’s financial results. The non-GAAP
measures should be viewed as a supplement to, and not as a substitute for, or superior to, GAAP
net income (loss) or earnings (loss) per share. |