Attached files
| file | filename |
|---|---|
| 8-K - 8-K - Atlas Financial Holdings, Inc. | form8-kreq42013earnings.htm |
| EX-99.1 - Q4 2013 EARNINGS PRESS RELEASE - Atlas Financial Holdings, Inc. | exhibitq42013earningsrelea.htm |

1 Fourth Quarter and Year End 2013 Conference Call March 11, 2014

Statements in this presentation, including the information set forth as to the future financial or operating performance of Atlas Financial Holdings, Inc., American Country Insurance Company, American Service Insurance Company and/or Gateway Insurance Company (collectively, “Atlas”), that are not current or historical factual statements may constitute “forward looking” information within the meaning of securities laws. Such forward looking statements involve known and unknown risks, uncertainties and other factors which may cause the actual results, performance or achievements of Atlas, or industry results, to be materially different from any future results, performance or achievements expressed or implied by such forward looking statements. When used in this presentation, such statements may include, among other terms, such words as “may,” “will,” “expect,” “believe,” “plan,” “anticipate,” “intend,” “estimate” and other similar terminology. These statements reflect current expectations, estimates and projections regarding future events and operating performance and speak only as to the date of this presentation. Readers should not place undue importance on forward looking statements and should not rely upon this information as of any other date. These forward looking statements involve a number of risks and uncertainties. Some of the factors facing Atlas that could cause actual results to differ materially from those expressed in or underlying such forward looking statements include: (i) market fluctuations, changes in interest rates or the need to generate liquidity; (ii) access to capital; (iii) recognition of future tax benefits on realized and unrealized investment losses; (iv) managing expansion effectively; (v) conditions affecting the industries in which we operate; (vi) competition from industry participants; (vii) attracting and retaining independent agents and brokers; (viii) comprehensive industry regulation; (ix) our holding company structure; (x) our ratings with A.M. Best; (xi) new claim and coverage issues; (xii) claims payments and related expenses; (xiii) reinsurance arrangements; (xiv) credit risk; (xv) our ability to retain key personnel; (xvi) our ability to replace or remove management or Directors; (xvii) future sales of common shares; (xviii) public company challenges; and (xix) failure to effectively execute our business plan. The foregoing list of factors is not exhaustive. See also “Risk Factors” listed in the Company’s most recent registration statement filed with the SEC. Many of these issues can affect Atlas’ actual results and could cause the actual results to differ materially from those expressed or implied in any forward looking statements made by, or on behalf of, Atlas. Readers are cautioned that forward looking statements are not guarantees of future performance, and should not place undue reliance on them. In formulating the forward looking statements contained in this presentation, it has been assumed that business and economic conditions affecting Atlas will continue substantially in the ordinary course. These assumptions, although considered reasonable at the time of preparation, may prove to be incorrect. When discussing our business operations, we may use certain terms of art which are not defined under U.S. GAAP. In the event of any unintentional difference between presentation materials and our GAAP results, investors should rely on the financial information in our public filings. Safe Harbor / Atlas Snapshot 2 NASDAQ: AFH (at 12/31/2013) Corporate Headquarters Elk Grove Village, IL (Chicago suburb) Subsidiaries / Brands American Country American Service Gateway (including Alano) Core Target Markets Taxi / Limo / Paratransit Cash and Investments $139.9M Total Assets $219.3M Total Shareholders’ Equity $63.7M Common Shares Outstanding 9,424,734 Book Value Per CommonShare $6.54

3 2013 Fourth Quarter Underwriting Highlights Core Growth • Q4 gross premium written increased by 106.2% in to $22.1 million versus Q4 2012 – Included an increase of 124% in core commercial auto business Continued Improvement in Underwriting Results • Combined ratio improved by 8 percentage points year-over-year to 94.4% – Sixth straight quarter of CR under 100% • Quarterly underwriting results improved by $1,449,000 Strength in Agent Network / Pricing • Continued return of business from independent agent network • Pricing trends remain favorable

Geographic Expansion • Distributing products in 40 states plus Washington D.C. • Licensed to write P&C insurance in 49 states and the District of Columbia • Currently distributing in all states that meet established criteria (volume, competition and profit) 4

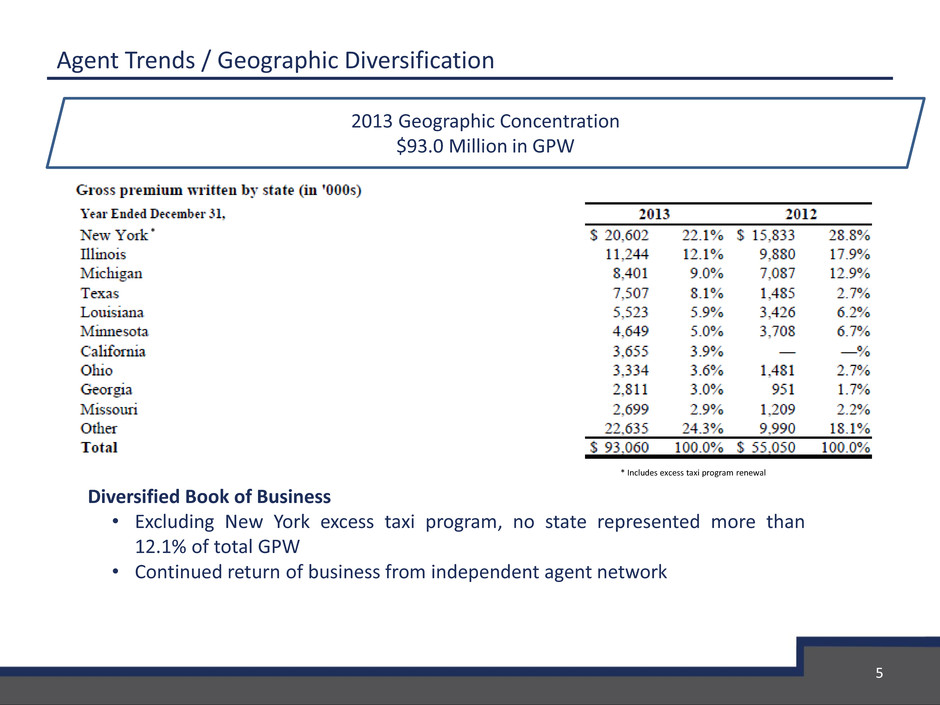
Agent Trends / Geographic Diversification 5 * Includes excess taxi program renewal 2013 Geographic Concentration $93.0 Million in GPW * Diversified Book of Business • Excluding New York excess taxi program, no state represented more than 12.1% of total GPW • Continued return of business from independent agent network

Considerable Financial Improvement Since 2010 Realignment – Focus on Core 6 Combined Operating Ratio (“COR”) 114.1% 119.7% 169.7% 107.3% 111.5% 97.6% 97.5% 98.1% 95.0% 93.9% 91.4% 75.0% 100.0% 125.0% 150.0% 175.0% Q2'11 Q3'11 Q4'11 Q1'12 Q2'12 Q3'12 Q4'12 Q1'13 Q2'13 Q3'13 Q4'13 Approximately 49% of Q4 ‘11 COR related to wind- down of ACIC pension and non-core legacy reserve strengthening

-$7.0 -$6.0 -$5.0 -$4.0 -$3.0 -$2.0 -$1.0 $0.0 $1.0 $2.0 $3.0 Q1 '11 Q2 '11 Q3 '11 Q4 '11 Q1 '12 Q2 '12 Q3 '12 Q4 '12 Q1 '13 Q2 '13 Q3 '13 Q4 '13 M ill io n s Focus on Core Underwriting Leads to Steady Profit Trend 7 Underwriting Profit Related to wind-down of ACIC pension plan and non- core legacy reserve strengthening noted on prior slide Annualized Commercial NWP: Stat Surplus 0.36x 0.44x 0.55x 0.88x 0.92x 1.13x 1.22x 1.39x 1.51x

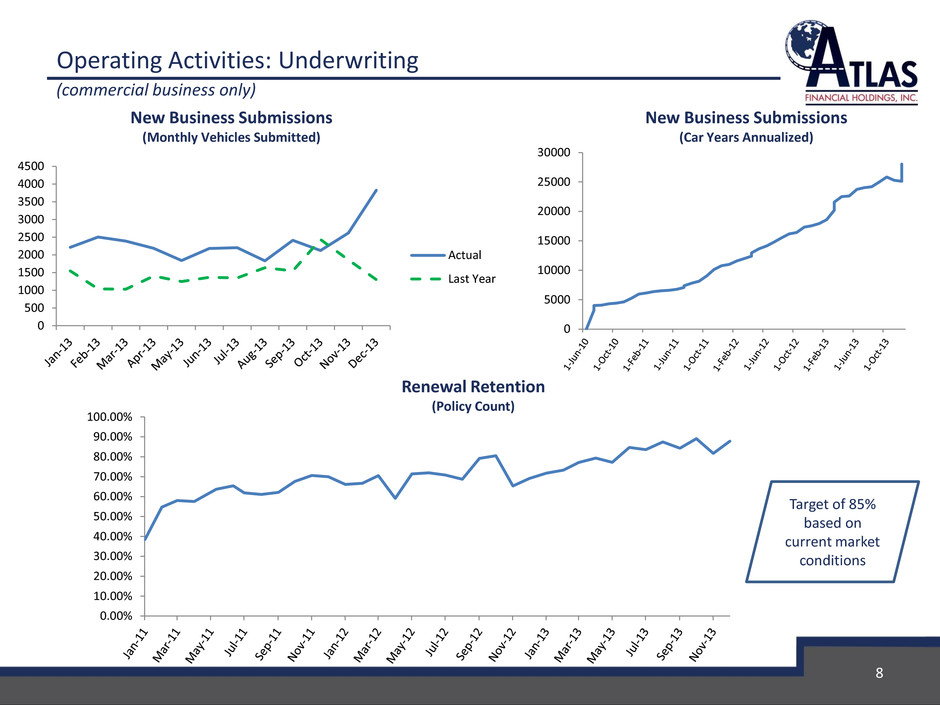
0.00% 10.00% 20.00% 30.00% 40.00% 50.00% 60.00% 70.00% 80.00% 90.00% 100.00% Operating Activities: Underwriting (commercial business only) Renewal Retention (Policy Count) New Business Submissions (Monthly Vehicles Submitted) New Business Submissions (Car Years Annualized) Target of 85% based on current market conditions 8 0 5000 10000 15000 20000 25000 30000 0 500 1000 1500 2000 2500 3000 3500 4000 4500 Actual Last Year

0 50 100 150 200 250 300 New Agents Existing Agents Bound/Application Ratio Application Count by Agent Category Operating Activities: Underwriting (commercial business only) Current target of 60%. Continuing incremental volume from new and existing agents 9 Note: Stacked Line 0% 10% 20% 30% 40% 50% 60% 70% 80%

Small Accounts Medium Accounts Large Accounts Average Fourth Quarter 2013 2.6% 2.4% 1.4% 2.1% Third Quarter 2013 3.8% 3.7% 2.6% 3.4% Second Quarter 2013 4.6% 4.7% 3.8% 4.3% First Quarter 2013 5.2% 5.3% 4.9% 5.2% Fourth Quarter 2012 5.5% 5.1% 4.4% 5.0% Fourth Quarter 2011 3.1% 3.5% 1.6% 2.7% High (2001,Q4) 20.8% 31.7% 33% 28.5% Low (2007,Q3) -10% (2008, Q1) -15% -15.9% -13.3% 10 Steady Rate Increases In Commercial Auto Majority of Atlas’ Target Market are Individual Entrepreneurs and Small Fleet Operators Source: The Council of Insurance Agents & Brokers

11 Market Cycle Source: The Council of Insurance Agents & Brokers. Chart prepared by Barclays Research.

Financial Highlights

2013 Q4 and YE Financial Results Fourth Quarter • Gross premium written increased by 106.2% to $22.1 million • Underwriting results improved by $1.4 million • Net income was up 75% to $2.2 million • Diluted earnings per common share were $0.22, compared to $0.15 13 Quarter 12/31/2013 12/31/2012 Loss Ratio 63.3% 67.7% Acquisition Cost Ratio 14.7% 15.9% Other Underwriting Expenses 13.4% 13.8% Combined Ratio 91.4% 97.4% Year • Gross premium written increased by 69.0% to $93.0 million • Underwriting results improved by $4.9 million • Net income was up 95.2% to $6.2 million • Diluted earnings per common share were $0.74, compared to $0.38 Year 12/31/2013 12/31/2012 Loss Ratio 63.9% 68.6% Acquisition Cost Ratio 14.5% 16.7% Other Underwriting Expenses 16.0% 17.1% Combined Ratio 94.4% 102.4%

14 Detailed Impact of Changes to Book Value per Common Share 2013 Book Value Impacted by: $0.44 increase in net income attributable to common shareholders 0.22 Increase related to decrease in DTA valuation allowance (0.02) reduction related to dividends on outstanding preferred shares 0.19 increase relating to preferred share redemption, which was completed on August 1, 2013 (0.37) reduction related to U.S. IPO (0.35) reduction related to change in unrealized gains and losses (0.12) reduction due to warrant exercises and share-based compensation ($0.01) Total Change From December 31, 2012 Book Value per Common Share Book Value per Common Share (in '000s, except for shares and per share data) December 31, 2013 December 31, 2012 Shareholders' equity $63,698 $59,864 Preferred stock in equity 2,000 18,000 Accumulated dividends on preferred stock 90 1,620 Common equity $61,608 $40,244 Shares outstanding 9,424,734 6,144,392 Book value per common share outstanding $6.54 $6.55

($ in thousands) December 31, 2013 December 31, 2012 Cash and Investments $139,888 $120,824 Total Assets $219,278 $163,067 Claim Reserves (Gross of Reinsurance) (1) (2) $101,385 $70,067 Total Shareholders’ Equity $63,698 $59,864 15 (1) Atlas’ purchase of American Country and American Service included $10 million limit of adverse development protection (90% quota share after $1 million) based on reserves as of September 30, 2010, which has not been utilized. (2) Gateway Acquisition included $2 million of adverse development protection • Attractive investment leverage • Long Term Debt-free balance sheet • Acquisitions with adverse development protection Strong Balance Sheet

Investment Portfolio Conservative Investment Approach • Emphasize preservation of capital, market liquidity to support payment of liabilities and diversification of risk • Investment duration re-positioned to match core commercial auto reserve liabilities Substantial Investment Portfolio • As of Dec. 31, 2013, total investments equaled $130.1 million, of which $128.6 million are fixed income • Predominantly corporate and government bonds • Average duration of 4.7 years • Average S&P rating of AA 16 Government 39% Corporate 35% Commerical Mortgage 17% Other Asset Backed 9% Equities 0% Investment Portfolio (12/31/2013) (1) (1) American Country Insurance Company, American Service Insurance Company, Inc. and Gateway Insurance Company Credit ratings of fixed income securities portfolio (in '000s) As of: December 31, 2013 December 31, 2012 Amount % of Total Amount % of Total AAA/Aaa $ 76,616 61 % $ 58,765 60 % AA/Aa 12,733 10 % 7,569 8 % A/A 23,624 18 % 19,894 20 % BBB/Baa 14,995 11 % 11,617 12 % Total Securities $ 127,968 100 % $ 97,845 100 %

For Additional Information At the Company: Scott Wollney Chief Executive Officer swollney@atlas-fin.com 847-700-8600 Investor Relations: The Equity Group Inc. Adam Prior Senior Vice President APrior@equityny.com 212-836-9606 Terry Downs Associate TDowns@equityny.com 212-836-9615 Nasdaq: AFH Presentation date: March 11, 2014
